Embed Size (px)
Citation preview

12FLUORESCENT DETECTION PRINCIPLESAND STRATEGIES
Raman Parkesh, Emma B. Veale, and Thorfinnur GunnlaugssonSchool of Chemistry, Trinity College Dublin, Center for Synthesis and Chemical Biology, University of Dublin, Dublin, Ireland
12.1 INTRODUCTION
The term sensing refers to the detection of a particularentity (e.g., matter, energy) by a specialized device (i.e.,sensor). Sensors are used in everyday life, and have beenapplied to various areas such as medicine (e.g., bloodcontent monitors, drugs) and industry (e.g., automobiles,electronics, waste management). Hence, the developmentof sensors is of great importance, and many endeavors havebeen made to further research in this area.
In supramolecular chemistry, sensing is achieved bydesigning synthetic molecular devices (i.e., sensors) havingthe ability to detect matter or energy, yielding a measurablesignal in response [1, 2]. This chapter focuses on thebackground and strategies for the development of suchmolecular systems that can report on the presence of sucha single analyte or a mixture of species in solution bymodulation in its fluorescence properties. Such systemsare referred to as fluorescent sensors, chemosensors , orfluorescent probes .
The chapter begins with a short introduction on the basicconcepts of luminescent sensing with an insight into theconstruction and the design of, in particular, fluorescence-based recognition systems. This is followed by a discussionon the basic principles of photochemistry, an understandingof which will enable the reader to master the successfulconstruction of fluorescent sensors while also maximizingthe information obtainable from such sensors [3]. Theremainder of this chapter is then devoted to the discussionon selected examples of fluorescence sensors/probes andthe various photophysical principles these are based on.
Chemosensors: Principles, Strategies, and Applications, First Edition. Edited by Binghe Wang and Eric V. Anslyn. 2011 John Wiley & Sons, Inc. Published 2011 by John Wiley & Sons, Inc.
12.2 BASIC PRINCIPLES OF FLUORESCENCESENSING: AN INTRODUCTION
The design of ligands for the selective complexation ofsuitable guests such as metal cations and anions has been animportant goal of supramolecular chemistry [4]. This is notso surprising, as in both chemical and biological systemsions and molecules occur in abundance and monitoringtheir concentration, in vitro or in vivo, is critical, as theyare usually involved in important biological and chemicalprocesses. For example, cations such as Na+, K+, Ca2+,and Zn(II) and anions such as carboxylates, halides,and phosphates are involved in a variety of biologicalprocesses such as nerve impulses, muscle contraction,cell activity regulation including apoptosis, and so on.They are also important for critical care analyses andas markers for diseases. However, such analysis is notlimited to small ions, as the monitoring of small andmedium-sized molecules, or even larger biomolecules,has become of vital importance, particularly in medicaldiagnoses as well as in monitoring drug levels [5]. Hence,detecting the concentration level changes of moleculessuch as oxygen, carbon monoxide, or glucose is of greatimportance [6]. Furthermore, developing accurate methodsfor monitoring environmental samples has also become animportant area of research, as changing lifestyles have led toincreased environmental pollution in addition to dischargeof such ions and other pollutants from industry [7, 8].Consequently, the need for developing fluorescent sensorsfor either a single measurement or continuous monitoringis of great current interest within a wide range of industries.
229

230 FLUORESCENT DETECTION PRINCIPLES AND STRATEGIES
Historically, the monitoring of concentration levels ofsuch ions and molecules from complexed media (such asblood, biological tissue, or environmental samples, etc.) hasbeen achieved by using batch processes that involve samplecollection and retrospective analysis in laboratories usingconventional analytical techniques. The main drawbacksof these methods are inaccuracy of the results and, moreimportantly, substantial time delays. The use of discreetand targeting sensors, in particular chemosensors, that canselectively target various analyses in such samples canovercome these drawbacks. For instance, optical signalingmethods offer sensitivity, selectivity, real-time response,and local observation. In particular, synthetic sensors thatutilize abiotic or synthetic receptors for analyte recognitionhave received increased attention as superior alternativesto biosensors, which incorporate biological receptors suchas antibodies, aptamers, or large biopolymers. In contrast,such biosensors often have a limited stability, whichlimits their practicability. However, in order to synthesizemolecules to bind a specific guest selectively is oftensynthetically challenging and time consuming. Even withthese limitations, the use of fluorescent chemosensors ispromising, which occupies a prominent position in activeresearch and has in the past two decades become acentral subject within the field of supramolecular chemistry[5]. The next section deals with the basic principles ofthe design of such supramolecular sensors that utilizefluorescence detection.
12.2.1 Basic Principles of Fluorescent Sensing
A sensor must be able to give a measurable signal inresponse to an analyte recognition. The mechanism bywhich a sensor interacts with its analyte yields a measurableform of energy and is known as signal transduction .Fluorescence is believed to be one of the optimal signaltransduction mechanisms in potential sensing applications,as it provides an enormously sensitive technique, mainlybecause the emission wavelength is always longer than
the excitation wavelength and only low concentrations ofanalyte (>10−6 M) are required for signaling purposes.
12.2.1.1 The Necessary Building Blocks of a Fluores-cent Sensor The main reason for the use of luminescencefor sensing application is the fact that luminescence is ahighly versatile spectroscopic method that can be employedin real time, using low concentrations of the sensors, andthe emission can be detected using inexpensive instruments.A fluorescent sensor can be defined as a molecular machinecapable of signaling the presence of an analyte such as ionsand molecules [9, 10]. Hence, two main components arenecessary for the design of fluorescent sensors: a signal-ing moiety (the fluorophore) and a recognition moiety (thereceptor), Fig. 12.1. The signaling moiety acts as a signaltransducer, converting the information (recognition event)into an optical response. In Fig. 12.1, the recognition moietyis responsible for binding to the analyte in a selective andefficient manner. This depends on the ligand topology, char-acteristics of the target cation or anion (ionic radius, charge,coordination number, hardness, etc.), or structure of organicmolecules (e.g., drug candidates). However, it is of utmostimportance to take into account the nature of the solvent,such as pH, ionic strength, and polarity, which can have asignificant effect on the ability of the receptor to recognizeand complex/bind the analyte. In principle, this same designprinciple can be further extended to the detection/sensingof more than one analyte, or for the sensing of combina-tions of several types of analytes such as cations, anions,or neutral molecules within a given sample. However, thistype of sensing is dealt with in other chapters of this book.
In the case of fluorescent sensing, then, an active com-munication pathway has to be open between the signalingand recognition moieties, where the recognition of an ana-lyte at the receptor side gives rise to a modulation in thephotophysical properties of the fluorophore. Furthermore,the fluorescent sensor should, overall, possess thermal andphotochemical stability and the recognition process shouldbe reversible to allow for continuous monitoring of theanalyte. Consequently, most sensors are based on simple
(a)
SensorAnalyte
Change in photophysicalproperties of the sensor
Signalingmoiety
Recognitionmoiety
(b)
Sensor
Figure 12.1 (a) Schematic representation of a sensor, which, upon analyte recognition, givesrise to changes in the photophysical properties of the sensors. (b) All sensors usually contain asignaling moiety and a recognition moiety.

BASIC PRINCIPLES OF PHOTOCHEMISTRY 231
Fluorophore Spacer
Receptor
Fluorophore
Receptor
(a) (b)
Figure 12.2 (a) A spaced model for fluorescence sensing. (b) An integrated model.
structures, where these two parts, which are referred to asthe fluorophore and the receptor , are connected via a chem-ical bond or a covalent spacer or integrated together: forexample, the fluorophore may contain both units within itsstructure, as depicted schematically in Fig. 12.2a and 12.2b,respectively. This can be achieved by choosing the twocomponents in such a manner that their various photophys-ical properties match, making the aforementioned commu-nication pathway operational. Examples of such syntheticdesigns are presented later in this chapter. Alternatively, thesensor can also be based on the formation of a self-assemblybetween the sensor and the analyte (Section 12.1). A spe-cific example of such a design is the use of displacementassays, which are discussed briefly in Section 12.3, and inmore detail in Chapter 14.
Independent of the structural design principle employed,an understanding of the basic photophysical properties ofthe chosen sensor is also necessary, as it is the extentof changes in such properties that will be monitoredfor the determination of potential analyte recognition.These aspects are relevant to the field of photochemistry[11, 12] and will be discussed in more detail in thenext section, whereas examples of the use of thesephotophysical processes in fluorescent sensing are discussedin Section 12.4.
12.3 BASIC PRINCIPLES OF PHOTOCHEMISTRY
12.3.1 Introduction
In the discussion above, we have referred to the modulationof luminescence emission as the key principle to achievingfluorescence sensing. In general, luminescence is the emis-sion (of light) from an electronically excited state of anysubstrate (e.g., an ion or a molecule) and consists of twomain categories: fluorescence, which is the emission aris-ing from a singlet excited state (S) (molecules possessingthis features are referred to as fluorophores); and phospho-rescence (phosphors), which describes emission occurringfrom a triplet excited state (T). These states are formedby initially promoting an electron from a ground state, ora ground state orbital (which can be viewed as occurringfrom the highest occupied molecular orbital, HOMO), to ahigher energy orbital (a promotion of an electron to a lowestunoccupied molecular orbital, LUMO) by employing light
irradiation (Fig. 12.3). The HOMO and the LUMO describethe n , π and π* orbitals which the electrons are in and towhich they can be transferred.
The terminologies singlet and triplet excited statedescribe the nature of the excited state orbital with respectto that of the ground state orbital. While a singlet excitedstate describes the promotion of the electron to an orbitalwhere the spin is preserved by light excitation, a tripletexcited state describes the electron in an excited stateorbital that has “flipped” its spin state, which is, in mostcases, an energetically unfavorable process. However, suchintersystem crossing (ISC) can be greatly accelerated byincluding a heavy atom, such as a halide (Br or I) oranother functional group, as part of the structure of thefluorophore. The formation of a singlet excited state is oftenreferred to as a spin-allowed transition , while the formationof the triplet state, which normally does not occur by directexcitation of an electron, is said to be a spin-forbiddentransition .
From these excited states, the electron can return to theground state by emitting its excited state energy, referredto as the deactivation of the excited state, which leadsto the aforementioned fluorescence or phosphorescence.However, the excited state can also be deactivated by waysother than luminescence. This is referred to as quenchingof the excited state (see below), which can occur throughthermal deactivation, for instance, by collision with solventmolecules, or by other external influences such as electronor energy transfer from other molecules. The use of electrontransfer is particularly attractive for fluorescence sensingand this will be discussed in detail in the following sections.The energy needed to produce an excited state dependsdirectly on the energy gap between the ground state andthe excited state, and this energy gap differs between
LUMO
HOMO
E
LUMO
HOMO
Ehn
Figure 12.3 Molecular orbital diagram, showing the promotionof an electron from the HOMO to the LUMO upon excitation withlight energy.

232 FLUORESCENT DETECTION PRINCIPLES AND STRATEGIES
molecules. Hence, depending on the size of this energygap, the fluorescence can occur at high energy, and henceat short wavelengths (often referred to as short or blueemission , occurring below 430 nm), within the visibleregion (430–800 nm, being referred to as long emission),and within the near-infrared regions (800–1600 nm, NIRemitters). Alternatively, the formation of such an excitedstate can also occur by indirect excitation, or sensitization,by a sensitizing antenna or a chromophore that can passon its excited state energy to the receiving substrate. Theuse of energy transfer mechanisms in fluorescence sensingapplications will be discussed in detail in later sections.
12.3.2 Exploring Photochemical Processes Throughthe Use of a Jablonski Diagram
In 1935, Jablonski interpreted the various fates of an excitedspecies at the electronic level by portraying a diagram thatdemonstrated all possible means by which the energy of theexcited state can disperse, known today as the Jablonskidiagram , Fig. 12.4a. This diagram demonstrates that amolecule absorbs light from the lowest vibrational level inits ground state (S0) to a range of vibrational levels in thesinglet first excited state (S1). This process is fast, usuallytaking place within 10−15 s, which means that it is tooshort for allowing the nuclei to be displaced (known as theFranck–Condon principle). The formation of other higherenergy states (Sn, n> 1) can also occur, but is not common.The excitation process can be viewed by recording theabsorption spectrum (or the excitation spectrum) of thesensor, recoded by using a UV–vis spectrometer. A typicalabsorption spectrum for an anthracence-based sensor isshown in Fig. 12.4b, and consists of several peaks that canbe assigned to different transitions, where excitations fromS0 to different vibrational levels of the S1 excited stateare observed. The anthracence emission spectrum is alsoshown in Fig. 12.4b, which demonstrates that the emission
occurs at longer wavelengths (see below). It is also worthpointing out the symmetrical nature of these two spectra,that is, the emission spectrum is the mirror image of theabsorption spectrum. This indicates that the same transitionis involved in both.
While anthracene gives rise to a structured absorptionspectrum, most chromophores give rise to absorption bandsthat are structurally broad, like that seen in Fig. 12.5a forthe naphthalimide chromophore [13].
From the Jablonski diagram in Fig. 12.4a, it is also clearthat the fluorescent emission occurs at longer wavelengthsthan absorption. This is the consequence of the lossof vibrational energy in the excited state by internalconversion. The difference between the wavelengths ofmaximum emission and maximum absorption in Fig. 12.5is known as the Stokes shift . For fluorescent sensing, largeStokes shift (less overlap between the absorption and theemission spectra) usually results in clearer emission spectraand hence better quality data for analysis. Hence, to date,a significant amount of work has been devoted to thedevelopment of novel chromophores that possess such largeStokes shifts, and many of these have been employed in thedesign of fluorescent sensors, a few examples of which arediscussed below [10, 14].
12.3.3 Luminescence Lifetimes
During the time the molecule spends in the excited states,energy is dissipated from the higher vibrational levels,and the lowest vibrational level of S1 is attained. Thisprocess is fast, usually occurring within 10−12 s. Emissionoccurs only if the molecule emits light as it reverts fromthis level to various vibrational levels in the ground state,Fig. 12.4a. This deactivation process to the ground stateusually occurs within a few nanoseconds in the case offluorescence, but emission lifetimes (τ ) of microsecondsand milliseconds are commonly observed for emission
300
Abs
orpt
ion E
mission
350 400 450 500Wavelength (nm)
(a) (b)Sn
S2
T1
T2
S1
S0
IC
IC
P
FA
ISC
Electronic ground state
Ene
rgy
Excited vibrational states(Excited rotational states not shown)
A = Photon absorption
P = PhosphorescenceS = Singlet stateT = Triplet state
ISC = Intersystem crossingIC = Internal conversion
F = Fluorescence (emission)
Figure 12.4 (a) Jablonski diagram summarizing the various states and photophysical processesobserved in the singlet and the triplet states. (b) Absorption and emission spectrum of anthracene,occurring at longer wavelength and demonstrating the structured bands and the small Stokes shiftusually observed for such highly symmetrical, all-hydrocarbon-based flourphores.

BASIC PRINCIPLES OF PHOTOCHEMISTRY 233
0
0.1
0.2
0.3
0.4
200 300 400 500
Wavelength (nm)
Abs
orba
nce
0
100
200
300
400
500
600
700
800
900
375 475 575 675 775
Wavelength (nm)
Em
issi
on in
tens
ity (
a.u)
(a) (b)
Figure 12.5 (a) Absorption spectrum recorded of a naphthalimide fluorophore in water, showingthe presence of the internal charge transfer (ICT) transition at long wavelength (Section 12.4).(b) The corresponding fluorescence emission spectrum recorded upon excitation at the λmax (381nm) of the ICT band in (a). In contrast to Fig. 12.4 a significantly large Stokes Shift is observed.
arising from triplet excited states (see below). Measuringthe excited state lifetimes involves observing the decayfrom the excited state to the ground state as a functionof time. For single excited states, spectrometers possessingsingle phonon counting (SPC) are usually employed, asthese can measure lifetimes of a few nanoseconds. Longerlifetimes, such as those occurring within the microsecondtime frame, can usually be measured using commerciallyavailable (bench-top) spectrometers that operate in thesteady state or in the time-resolved mode. Both of theselifetime regimes can, however, be measured using SPC.
The use of lifetime measurements has become animportant sensing technique, as it gives information abouthow the lifetime of a sensor is affected by changes inits local environment. For instance, sensors for measuringgases, such as O2, are often based on the use of lifetimemeasurements. Such sensors do not contain particularreceptors for these gases, but the gas itself can interactwith some of the photophysical processes of the sensors,often referred to as collision quenching . For instance,in the case of O2 sensing, the lifetime of the excitedstate is modulated by the presence of the gas, and henceits concentration/pressure, and this has been successfullyemployed for sensors based on transition-metal complexes.The emission arising from the metal complex, referred toas metal-to-ligand charge transfer (MLCT) is affected byO2, which normally quenches the emission arising from theMLCT transition [15]. These MLCT sensors, such as thosebased on Ru(III) (such as [Ru(ph2phen)3]2+), often emitwithin the sub-microsecond time frame. It is also worthpointing out that some longer lived emitters are known tobe able to emit their excited state energies up to severalseconds, but these are rare, and for sensing purposes theseexcited state lifetimes are usually too long to be of anypractical value in luminescent sensing. It is also worthpointing out that, generally, the emission spectrum observedis independent of the wavelength (energy) of excitation.This is known as the Kasha’s rule, and it is due to the fastrelaxations of these Sn excite states to the S1 state.
12.3.4 Quantum Yield of Fluorescence
The efficiency of florescence emission is described as aquantum yield (�F) [11, 12]. In its simplest form, itis the ratio of the number of photons emitted to thatabsorbed by the fluorophore. �F depends on several rateconstants (k ), including that of nonradiative decay (knr).Nonradiative processes, the most important of which isgenerally collision deactivation and often referred to asinternal conversion (Fig. 12.4a) give rise to dissipationof energy from the excited state, which consequentlydiminishes any emission arising from the excited state.As a result, there will be a reduction in the intensity offluorescence (e.g., in �F) and, in many cases, if thesenonradiative processes are highly effective, it will be absentaltogether. Often, the quantum yield is employed to gaininsight into the extent of such quenching by comparisonwith standards that cannot engage in such processes [16].Several examples of the use of such mechanisms will bediscussed further on in this chapter. Hence, it is clear fromthis account that both the lifetimes and quantum yield ofan excited state can be affected by external processes.Moreover, �F can be used to gain insight into other inter-or intramolecular processes that can affect the excited stateof the fluorophore through quenching [17].
The quantum yield of fluorescence can be determinedusing several methods, the comparison to a known standardbeing the most common one employed as stated above.One of these is quinine sulfate (�F = 0.542 in 0.1 NH2SO4), which is often used as the primary referencestandard, but many other standards are known, including9,10-dimethyl- or pheynylanthracence, as well as varioustypes of transition-metal complexes. Here, two comparativemethods that can be employed to determine the �F ofa sensor will be discussed. These are (i) using opticallydilute solutions and (ii) acquiring data at a number ofdifferent concentrations. For method (i), dilute solutionswith a known concentration at the excitation wavelengthare used so that corrections for self-absorption and of

234 FLUORESCENT DETECTION PRINCIPLES AND STRATEGIES
incident and emitted light on the emission intensitiesare not required. In method (ii), a number of solutionsranging from, for instance, a concentration (or OD, opticaldensity) of 0.10–0.02 can be used and linearity acrossthe concentration range can be maintained. For both typesof measurements, optically matched solutions of the testsample and reference have to be used and excited atthe same wavelength. Therefore, solutions of the standardand test samples with identical absorbance at the sameexcitation wavelength can be assumed to absorb the samenumber of photons.
For methods (i) and (ii), �F can be calculated by com-paring the integrated areas underneath the emission band ofthe spectra using Eqs. (12.1) and (12.2), respectively,
�x = �r × Ar/Ax × Fx/Fr × (ηx)2/(ηr )
2 (12.1)
�x = �r × mx/mr × (ηx)2/(ηr)
2 (12.2)
where x, r, A, F , and η refer to the test sample,reference standard, absorbance, integrated area, and thesolvent refractive index, respectively. The integrated areasfor each emission spectra have to be calculated usingvarious computation programs after transferring the spectralinformation into an accessible data format, or by measuringthese using the integrating function often included in thesoftware of the fluorescence spectrophotometer. In method(ii), � can be determined by first plotting the integratedfluorescence area versus absorbance, independently for thestandard and the test samples. This would give a straightline with the gradient m , which is proportional to thequantum yield of the different samples. The quantum yieldis then calculated according to Eq. (12.2). This usuallygives quantum yields with an error of approximately 10%.Quantum yields can also be determined using an integratedsphere method [18].
12.3.5 Fluorescence Quenching
Quenching of the excited state is a phenomenon commonlyemployed in luminescent sensing and, in the case ofcollision quenching, the decrease in the intensity offluorescence can be evaluated by measuring the changesin the lifetime of the excited state as a function of thequencher concentration [11, 12]. This has been extensivelyemployed in sensing where the binding constant can bedetermined using the Stern–Volmer equation (Eq. 12.3).
I0
I= (1 + Ksv[Q]) = (1 + kqτ0[Q]) (12.3)
Here, the quenching rate constant kq is determined from thefluorescence intensity measurements at different concentra-tions of the quencher (the analyte), [Q], where I0 and I inEq. (12.3) are the fluorescence emission in the absence of
the quencher and for a given concentration of the quencher[Q], respectively. Ksv and kq are the Stern–Volmer andquenching rate constants, respectively (Ksv = kqτ0), and τ0
is the lifetime in the absence of quencher [19].The plot of I0/I versus the analyte concentration
should be linear with a slope equal to kqτ0, from whichthe Stern–Volmer constant Ksv can be determined. Thefluorescence lifetime τ0 is the lifetime of the sensor inthe absence of the analyte and kq can be determined byusing this lifetime. In general, the Stern–Volmer plot shouldbe linear, as it represents dynamic quenching. However,deviation of the Stern–Volmer plot from linearity can beexplained if we consider an alternative quenching processto the dynamic quenching.
Quenching of the fluorescence emission can also arisefrom static quenching, which can be due to the interactionbetween the receptor and the sensor in the groundstate, prior to excitation, or dynamic quenching, withformation of a complex between the excited sensor andthe anion receptor. Because of this, both the static anddynamic quenching can be taken into account in amodified Stern–Volmer equation, (Eq. 12.4), where ks isan equilibrium constant for the static quenching.
I0
I= (1 + Ksv[Q])(1 + ks[Q])
= 1 + (ks + kqτ0)[Q] + kskqτ0[Q]2 (12.4)
Using this equation, the kinetics of the fluorescencequenching can be analyzed, and both the dynamic and staticquenching constants kq and ks determined.
The excited state can also be quenched by resonanceenergy transfer or fluorescence resonance electron transfer(FRET) or by electron transfer (ET) from an electron-richspecies which is either conjugated to the sensor or from a“closely” located neighbor, for example, through space orthrough several bond lengths. Both these mechanisms willbe discussed in detail in the next section.
Another process that may result in the deactivationof the singlet excited state is ISC to a triplet state,Fig. 12.4a. However, it is normally difficult to obtainemission spectra in solution from such a triplet state species,and such measurements are usually carried out at lowtemperatures (in frozen matrixes) or by using “shields” suchas cyclodextrines or structurally modified cyclodextrines.However, many transition-metal complexes such as thosepossessing Ru(II) and polypyridyl ligands give rise toMLCT emission which normally occurs from a triplet-state-based MLCT (3MLCT) [15, 16]. However, such systemswill not be discussed here.
The above summary gives some insight into the natureof the ground and the excited states of molecules andhow the environment can have a significant effect onthe photophysical properties of the excited state. In the

EXAMPLES OF FLORESCENCE DETECTION STRATEGIES AND PRINCIPLES 235
following sections, the design of various examples offluorescence sensors will be discussed.
12.4 EXAMPLES OF FLORESCENCEDETECTION STRATEGIES AND PRINCIPLES
Fluorescence is a highly sensitive method of detectionand can be observed at the molecular level. For mostsensing purposes, commercial spectrometers that do notallow such single-molecule detection are employed. Con-sequently, most sensors developed to date employ changesin wavelength of fluorescence emission (λmax or λFl), thequantum yield of fluorescence (�F), and lifetimes (τ ) tomonitor the sensing event and quantify the strength andthe affinity (binding constants) of the host–guest (sensing)interaction. Changes in the fluorescence excitation spectracan also be employed for sensing applications, but theseusually mirror the changes observed in the absorption spec-tra of the sensor, while other changes such as in polarizationcan be employed. The following section deals with thevarious examples of sensors, focusing mostly on the devel-opment of sensors for charged species, and the design prin-ciples employed. We also give selective examples of thesedesign principles and how the photophysical properties ofthe sensors are dictated by these designs, beginning with theuse of integrated fluorophore-receptor systems, Fig. 12.1b.
12.4.1 Sensors Possessing Internal Charge Transfer(ICT) or Twisted-Internal-Charge-Transfer (TICT)Excited States
As discussed above, a communication pathway has tooperate between the receptor and the fluorophore toenable the signaling of the recognition event. In integrated
systems (Fig. 12.2b), such a connection exists providedthe two components are connected through π –π or n –π
conjugation.An example of such a design is 1, based on the use
of the well-known azobenzene chromophore, where thedi-aryl crown ether is connected to the azobenzene unitvia the aniline nitrogen. This system is based on an ICTmechanism where the nitrogen of the crown ether functionsas an electron donor and the nitro group at the opposite endof the chromophore as an electron acceptor [20].
The sensor was designed so that the two methoxy groupsof the crown ether receptor, one of which was part of theazobenzene unit itself, would help in the recognition ofthe Na+ ion which binds within the crown-ether receptor,as demonstrated in Fig. 12.6. Such structural modificationhad previously been demonstrated to lead to enhancedselectivity for Na+ over other competitive ions such asK+ [21] because, upon coordination within the crown etherand binding to the two methoxy groups, the crown-etherreceptor becomes deconjugated from the azobenzene unitand this action prevented or minimized the ability of thenitrogen lone pairs in the receptor to participate in theaforementioned ICT.
Solid state X-ray crystallographic analysis of this recep-tor unit used in 1 indeed showed that such deconjugationdid occur upon binding of these ions [22]. This minimizedthe delocalization of the charge across the chromophore,making the HOMO–LUMO gap larger and thereby shift-ing the absorption spectrum of the chromophore, as shownin Fig. 12.6, to shorter wavelengths as a function of increas-ing Na+ concentration. This shift in the absorption spectrawas also clearly visible to the naked eye with a colorchange from red to yellow. However, 1 did not give rise tostrong fluorescence, as the azobenzene moiety can undergocis–trans isomerization upon irradiation, a process that
O
N
O
N
O OO
N
NO2N
1
0
0.05
0.1
0.15
0.2
0.25
0.3
250 300 350 400 450 500 550 600
Wavelength [nm]
Abs
orpt
ion
O
N
O
N
O OO
N
NO2N
1
Na+
650Na+
Figure 12.6 Sensor 1, based on the use of “push–pull” internal charge transfer (ICT) mechanismand the changes observed in the absorption spectrum of 1 upon binding of Na+ within the crown-ether cavity. These changes were reversed upon addition of competitive coordinating ligand.

236 FLUORESCENT DETECTION PRINCIPLES AND STRATEGIES
deactivates the singlet excited state thermally (the back iso-merization, or the dark reaction, was found to be very fast).Hence, while 1 is based on the integrated design shown inFig. 12.1b and does respond to Na+ in a selective andreversible manner, it is not a fluorescent ICT sensor.
The reversibility of the sensing was proven by adding ina competitive chelating ligand, a cryptand, to a solutionof fully Na+ complexed 1, which has a higher affinityfor Na+ than 1 and hence can extract it from the sensor,which concomitantly reverses the spectral changes seenin Fig. 12.6. The binding affinity for sensor 1 could bedetermined either by using nonlinear regression analysis ofthe overall changes in the absorption spectra or by usinglinear regression analysis. This will be discussed later inthis chapter.
The same receptor, as well as a modified version forthe sensing of K+, was originally developed for use influorescent sensing by Tsien et al. [21]. In their work, theyand others developed fluorescent excitation sensors wherethe crown-ether moieties were directly attached to thefluorophores, and these were found to be capable of detect-ing Na+ concentrations in the range of 20 mM, whereasusing a large crown-ether moiety gave rise to selective K+sensing, for example, sensors 2a and 2b [21, 23], Fig. 12.7.
These sensors were all ICT based, but they can beconsidered as excitation sensors as well, as their excitationspectra was shifted upon binding to either Na+ or K+while only minor shifts were observed in the fluorescenceemission spectra. But these were significant enough toallow the analysis of the binding constant between thesesensors and Na+ or K+. Another way of viewing these
sensors is as radiometric sensors, where the intensity ofthe band assigned to the Na+ or the K+ complexed formsin the excitation spectra (recorded in excitation mode onthe spectrometer, by scanning the absorption wavelengthand setting the emitting wavelength at the λFmax) and thatof the free sensors can be ratioed. These types of sensorshave proved to be satisfactory for use in biological studiesand are commercially available. The use of radiometricluminescent sensing has also recently been shown forlanthanide complexes for the sensing of various amino acidsand di-carboxylates [24].
Sensors 3 and 4 are also based on an integrated design,where a methylacridinium fluorophore was connected toan N -phenyl-azacrown ether [25, 26]. While these sensorscan be viewed as potential ICT-based fluorescent sensors(an ICT occurs from the electron-rich N -phenyl-azacrownether to the electron poor-acridinium moiety) for group Iions, the presence of the phenyl ring of the receptor enablesthe fluorophore to be slightly twisted out of the planein respect to the receptor. Indeed, upon complexation togroup I and II cations, a hypsochromic shift (a blue shift orshift to short wavelength, i.e., higher energy) was observedin the absorption band ascribed to the ICT absorption ofthese sensors. This shift was assigned to the out-of-planetwisting of the N -phenyl-azacrown ether, which gives riseto the formation of a twisted-internal-charge-transfer orTICT excited state. The two molecules (R = H and CH3)were, in their uncomplexed form, nonfluorescent due to thepresence of the nonemitting TICT state which lies belowthe lowest excitation state of the acridinium unit. However,upon cation recognition, the energy of this TICT state was
OO
N
OO
N
MeO
O
O
HO2C CO2H
O
O N
N
OMe
OO
N
OO
N
O
CO2R
RO2C
MeO
O
CO2R
CO2R
OMe
ClO4−
O
O
O
Cl
−O O O
O
N
OO
O
N+ CH3
R
N
NN
2a
2b
5
3 R = H
4 R = CH3−OOC
−OOC
COO−
COO−
Figure 12.7 Sensors 2–5, developed for the sensing of group I and II metal ions. All operatedthrough modulation in their ICT or TICT character.

EXAMPLES OF FLORESCENCE DETECTION STRATEGIES AND PRINCIPLES 237
shifted above the lowest acridinium excited state and theacridinium unit becomes fluorescent.
Compound 5 was also developed by Tsien et al. [27].Chelating receptors containing carboxylic moieties areknown to bind efficiently to divalent hard metal ions suchas Ca2+ and Mg2+, and 5 was developed for application incellular biology for Ca2+ recognition. Most of these kindsof calcium indicators developed to date are suitable forintracellular Ca2+ (50 nM–50 µM); however, they bindtoo tightly for the accurate detection of Ca2+ in bloodor serum where the concentration is around 5 mM [27c].In 5, the fluorophore was linked directly to the bis(2-aminophenoxy)ethane-N,N,N ′,N ′-tetraacetic acid (BAPTA)chelating receptor 5. In the absence of Ca2+, the BAPTAportion of the indicator is electron rich and therefore able todonate electrons to the excited state of the fluorophore (thiswill be discussed in detail in the next section), and this willquench the fluorescence of the sensor. The recognition ofthe cation decouples the iminodiacetate moieties from thebis-alkoxy phenyl backbone, resulting in a large increasein the receptor’s oxidation potential. The consequence ofthis is that the fluorescence emission is turned on , witha significant fluorescence enhancement observed for Ca2+
binding in the emission spectra. The other advantage of thereceptors used in compounds 2 and 5 is that nitrogen ofthe iminodiacetate is part of the receptor that shifts thepKa of the fluorophore to ∼4–5, which is well belowthe physiological pH range, as discussed above. Hence,H+ does not interfere with the sensing provided that themeasurements are carried out within the physiological pHrange.
The naphthalimide fluorophore 6 shown in Fig. 12.8 alsopossesses an ICT excited state, caused by the donatingamine and the withdrawing imide, which gives rise to acharge-separated exited state, or partial δ+ and δ− withinthe fluorophore, located on the 4-amino and the imidemoieties, respectively. This phenomenon is also referredto as a push–pull (ICT) system [28]. In compound 6 (and
related structures), the ICT character often gives rise toa significantly enhanced dipole moment in the excitedstate which is affected by the nature of the solvents. Insuch systems, the solvent can have a significant effect onthe photophysical properties of the fluorophore, where thewavelength, quantum yield, and lifetime can all be solventdependent, as these can stabilize the charge-separated state.Here, polar solvents stabilize the charge-separated state,while the nonpolar ones do not.
The fluorescence emission spectra of 6 was indeed foundto be significantly solvent dependent, or solvochomomic,as shown in Fig. 12.8a, where it can be seen that both thewavelength and quantum yield are significantly affected.From Fig. 12.8b, it is clear that polar solvents shift the λmax
(the longest wavelength of emission) bathochromically (redshifted, to longer wavelength) and that polar protic solventssuch as methanol and water give rise to significantlylower quantum yields of fluorescence than aprotic solvents.This is due to the ability of the former solvents toform hydrogen bonds to the four-amino group of thenaphthalimide moiety which quenches the singlet excitedstate through nonradiative deactivation.
From Fig. 12.8c, it is also clear that the emission isslightly red-shifted upon binding to DNA, which reflects thechanges in the local environment of the sensor, as it bindsto the more hydrophobic environment of the DNA. Whilethis system displayed lower quantum yield in water thanin the competitive solvent, 6 was found to bind strongly toDNA molecules, with which it bound through intercalation,a groove binding mechanism, or both, as determined fromthe changes in the fluorescence emission spectra, Fig. 12.8b.Significant changes were also seen in the absorption spectraof 6 upon carrying out a DNA titration. By analyzing thechanges observed in this spectrum, achieved by fitting thechanges to binding equations, a binding constant Kb (oftenpresented as a log Kb, or, in case of stepwise bindingevents, as log β, as discussed above) was determined.Hence, the above changes both in the absorption and in the
N N
NO
ON
O
O
NN
0
50
100
150
200
250
300
350
400
390 490 590 690 790
Wavelength (nm)
Em
issi
on in
tens
ity (
a.u.
)
CH2Cl2
MeCN
DMF
H2O
MeOH
Hexane
Acetone
(a) (b) (c)
0
100
200
300
400
500
600
700
800
900
440 540 640 740
Wavelength (nm)
6
Flu
ores
cenc
e in
tens
ity (
a.u.
)
Figure 12.8 (a) The DNA-binding molecule 6. (b) The changes in the emission spectrum of 6when recorded in various solvents. (c) The changes in the emission spectra of 6 upon binding toDNA.

238 FLUORESCENT DETECTION PRINCIPLES AND STRATEGIES
fluorescence emission spectrum gave direct quantificationof the binding strength of 6 with DNA, which could then becompared with other known DNA binders in the literature.In the case of the DNA binding, two binding models wereused: one for the changes in the absorption spectra and theother for the changes in the emission spectra [29, 30].
While compound 6 was strongly luminescent uponbinding to DNA, it was emissive enough to allow its use influorescent imaging and as a therapeutic agent wherein theleukemia cell line 6 was shown to be rapidly taken up by thecells, and—by using confocal fluorescent microscopy—toboth stain the nucleus as well as induce apoptosis orprogrammed cell death.
From Fig. 12.8, it is clear that the solvent can have asignificant effect on the excited state properties of a sensorpossessing an ICT excited state. Indeed, this phenomenongives information about both the polarity and the acidityof the solvent used; hence, changes in pH can also bemonitored by observing the changes in the emission (beingshifted to shorter or longer wavelengths, depending on thestructure of the sensor). The changes in the fluorescenceemission can then be treated in the same manner asgenerally employed for potentiometric pH titrations; forexample, the changes in the emission at a given wavelengthcan be plotted against pH, giving rise to a sigmoidal pH
curve, from which the pKa can be determined upon fittingthe changes to a binding equation.
The ICT character of fluorophores has also beenemployed as sensors for anions. Examples are compounds7–9. While all are based on the use of the aforementionednaphthalimide fluorophore, they possess different anionreceptor moieties, being an amide in the case of 7[31], a urea moiety for 8 [32], and an amidourea andthiourea for 9a and 9b [33], Fig. 12.9. The changesobserved for the urea analog of 9 is shown in Fig. 12.10a.Here the absorption spectrum was significantly affectedupon titration with acetate in DMSO (dimethyl sulfoxide)solution. Here, a long-wavelength band was formed witha concomitant reduction in the ICT band centered at430 nm, with the formation of an isosbestic point at465 nm. Excitation at this point, or at ∼370 nm, wherea second isosbestic point was also formed, enabled thepopulation of the singlet excited state of the sensor, whichwill be independent of the concentration of the acetatethroughout the anion titration. The changes observed uponexcitation at 420 nm and the isosbestic point are shownin Fig. 12.10b and 12.10c, respectively. While the latterdoes not show significant changes in the emission spectra,the former shows significant quenching in the fluorescenceemission which coincides with the changes observed in the
N OO
HN O
7
N
O
O NH
NH
O N
O
O
8
N OO
HNNH
NH
X
9a X = S9b X = O
Figure 12.9 Structures 7–9, all of which possess an ICT excited state and were developed asfluorescent sensors for anions, which bind to the respective receptors via hydrogen bonding.
(a)
0.00
0.05
0.10
0.15
0.20
0.25
300 350 400 450 500 550 600 650 700
Wavelength (nm)
Abs
orba
nce
(b)
0
50
100
150
200
250
435 485 535 585 635 685
Wavelength (nm)
Inte
nsity
20
(c)
0
40
60
80
495 545 595 645 695 745 795
Wavelength (nm)
Inte
nsity
Figure 12.10 (a) Changes observed in the absorption spectrum of the amidourea analog of9 (1.5 × 10⁻⁵ M) upon addition of ACO− (0–3 × 10⁻³ M) in DMSO. (b) The correspondingchanges in the emission spectra upon addition of ACO− in DMSO at 25◦C, excited at 360 nm.(c) Upon excitation of the isosbestic point.

EXAMPLES OF FLORESCENCE DETECTION STRATEGIES AND PRINCIPLES 239
absorption spectra. This is to be expected, as the reductionin the absorption spectra at the excitation wavelength willreduce the effectiveness of populating the single excitedstate, giving rise to a reduction in the quantum yield ofthe emission. It is also worth noting that small changesare observed in the λmax for the emission in Fig. 12.10b,which is slightly shifted to longer wavelengths, as the ICTcharacter is enhanced by the presence of the negativelycharged acetate anion.
12.4.2 Sensors Designed on the PhotoinducedElectron Transfer (PET) Principle
One of the most commonly used strategies for developingfluorescent sensors is the one based on photoinducedelectron transfer [34] or PET sensing. Originally developedby de Silva et al., these types of sensors have beendeveloped for a variety of cations, anions, and neutralmolecules [1, 35]. On the basis of the spaced model(fluorophore–spacer–receptor) shown in Fig. 12.2a, theuse of a covalent spacer between the receptor moietyand the fluorophore minimizes any n –π* or π –π*interaction in the ground state between the two components.Consequently, the absorption spectrum of the fluorophore,unlike that seen in some of the ICT examples above, is onlyminimally affected by the recognition event at the receptorside. Instead, such sensors should give rise to significantchanges in the fluorescence emission spectra.
These changes observed in the fluorescence emissionspectra can be analyzed using various methods to determinethe binding constant for the sensing action, such as fittingthe changes to various host:guest stoichiometries usingnonlinear regression analysis. If such sensing is in 1:1stoichiometry, a linear analysis can also be employed; forinstance, the concentration of the analyte can be expressedas log [A], and by plotting the changes in the emission aslog [(Imax − IF)/(IF − Imin)] (where Imax, Imin, and IF referto changes in the fluorescence intensity at the beginning,the end, and during the titration, respectively) as a functionof the log [AcO−], a linear plot should be obtained fromwhich the binding constant log K can be determined.Several other methods exist for determining host–guestbinding interactions and we invite the reader to explorethose [36].
12.4.2.1 Mechanism of PET Sensing PET is usuallymeant to describe the transfer of an electron from theHOMO of a donor (D) in its ground state to a vacancyin the HOMO of the acceptor (A) in its excited state. TheHOMO labeling refers to the ground state nomenclature forconsistency. It must be noted that PET can also occur inthe opposite sense: that is, from the donor in its excitedstate. Furthermore, photoexcited states can be deactivatedby energy transfer. First, an excited state is formed via
light absorption, as discussed above, and then this leadsto a Franck–Condon state which rapidly undergoes nuclearrelaxation to an equilibrium state before an electron transfertakes place. Thermal deactivation of the excited state(such as shown in Fig. 12.4a) through internal or externalmolecular collisions or diffusion is always in competitionwith PET.
The probability of PET is governed by the overall freeenergy of the system (�G). Quenching by electron transferbetween uncharged species leads to the formation of aradical ion pair. This is sometimes referred to as primaryelectron transfer . If the two uncharged species are not partsof the same molecule, that is, the two components are twoindividual units, then after electron transfer has taken placeit is often referred to as a solvent separated ion radicalpair or SSIP (where the distance between the two, D andA, can be up to 7 A). These species are the precursors tothe radical ion pairs but are held together by electrostaticforces within a distance of one to two solvent molecules.The SSIPs are thus part of a solvent cage, from whichthey have to escape to be able to form a stable, free ionicsolvated species. The stability of these species and theirability to escape the solvent cage depend largely on thesolvent’s ability to stabilize the two charges. Polar solventsstabilize the free ions much better than nonpolar solvents,as was discussed above for the ICT sensor. In nonpolarsolvents, the two charges tend to stay together rather thandissociate into the free ions, due to the electrostatic forcesbetween them.
In systems where the two parts (D and A) are heldtogether with a spacer (as displayed in Fig. 12.2a), theabove-described dissociation does not take place. The twoparts are usually connected via a spacer of one or severalcovalent bonds. This spacer usually makes the PET moreefficient because of the close proximity of the two parts.The rate of an intermolecular D and A PET system isusually diffusion-rate-limited and of second order. The rateis thus largely enhanced if the two parts are held togetherat a certain fixed distance. The reason being that, for asystem without any spacer, the electron transfer dependson the two parts (D and A) colliding before the transfertakes place. Such a collision can happen several timesbefore an electron transfer takes place and is dependenton the concentration of the two species and on the solventinvolved. If the concentration is low, the collision ratewill be low and the probability of the electron transferis reduced. Such a system has a relatively low effectivemolarity. In intramolecular systems containing a spacer, theeffective molarity of the species is much higher than canbe measured, and this gives a higher probability of electrontransfer.
As stated earlier, the rate for such a reaction can thus gobeyond the diffusion rate limit. The rate is highly dependenton the length of the spacer and its geometry. The electron

240 FLUORESCENT DETECTION PRINCIPLES AND STRATEGIES
transfer can take place either through space or through theσ -bond framework. If the system includes a spacer suchas norbornyl or a steroid-like structure, then the distancebetween D and A usually exceeds the 7 A distance seen inthe SSIP and there is little or no overlap between the twoparts. The transfer has to be therefore through the σ -bondframework. In a system with only one methylene unit as aspacer (see various PET sensors in Chapter 1), the electrontransfer may involve either mechanism.
12.4.2.2 Frontier Orbital Approach to PET The abovediscussion can also be analyzed in terms of frontier orbitaldiagrams. As discussed in Section 12.3.1, a fluorophore (F)forms an excited state (F*) when an electron is promotedfrom the HOMO to its LUMO. If this species has itsHOMO lying below the HOMO of another ground statespecies (here referred to as R, for receptor), then there isan energetically favorable pathway for an electron transferto take place from R to F*. This leads to quenching of theexcited state and a formation of radical ion species F•−R•+.As mentioned above, the previously excited electron cannotreturn to its previous HOMO by losing its excited stateenergy through fluorescence emission. This is called anoff state, and is shown in Fig. 12.11. The electron thatis left in the former LUMO has to deactivate by somemeans other than emission. The possible electron transferthat takes place after the PET is referred to as the secondaryelectron transfer , that is, an electron transfer following theformation of the radical ionic pair.
The conditions for an electron transfer to take place arethat the energy of the excited state, F*, has to be larger thanthe sum of the magnitudes of the reduction potential of thefluorophore and the oxidation potential of the receptor (R).If the HOMO of R lies below the HOMO of F* on anenergy scale, and the LUMO of R lies below the LUMOof F*, then there is a way for an electron transfer to takeplace from the excited state of F from the LUMO of F* tothe LUMO orbital of R by forming an F•+R•− ionic pair,which is shown in Fig. 12.12.
As mentioned earlier, the excited state can be quenchedby an energy transfer that takes place when both the HOMOand the LUMO of R lie between the HOMO and the LUMOof F on an energy scale. Such a transfer is referred to asan electron exchange mechanism, which does not involvethe formation of any ion radical species and is shown inFig. 12.13. The excited state of F is transformed into a newexcited state R* by transferring the excited state energyfrom F to R by two simultaneous single-electron transfers.This will be discussed in greater detail in the next section.
The driving force for PET is represented by �GET,which is the overall change in the free energy forthe electron transfer. �GET can be estimated using theRehm–Weller equation (Eq. (12.4)) [37]:
�GET = −ES − Ered.fluorophore + Eox.receptor − e2/(εr)
(12.5)
HOMO
HOMO
LUMO
LUMO
HOMO
HOMO
LUMO
LUMO
F* R F•− R•+
Pot
entia
l ene
rgy
Figure 12.11 Photoinduced electron transfer (PET) in a two-component molecular system leadingto an “off state.”
HOMO
HOMO
LUMOLUMO
HOMOHOMO
LUMOLUMO
F* R F•+ R
Pot
entia
l ene
rgy
Figure 12.12 PET in a two-component molecular system leading to an “off state.”

EXAMPLES OF FLORESCENCE DETECTION STRATEGIES AND PRINCIPLES 241
HOMO
HOMO
LUMOLUMO
HOMO
HOMO
LUMOLUMO
F* R F R*
Pot
entia
l ene
rgy
Figure 12.13 Electron exchange mechanism of energy transfer.
Pot
entia
l ene
rgy
HOMO
HOMO
LUMO
LUMO
F* R
hn
Figure 12.14 Effect of the excited state of the fluorophoreafter the oxidation potential of the receptor has been raised. Theformation of an “on state.”
This equation for the system is shown in Fig. 12.13, wherethe fluorophore is acting as an electron acceptor and thereceptor as an electron donor. This equation is derived withthe help of the Born–Haber thermodynamic cycle. ES is thesinglet energy of the excited fluorophore, Ered.fluorophore isthe reduction potential of the fluorophore, and Eox.receptor
is the oxidation potential of the receptor. The e2/(εr) termis the coulombic interaction energy between the fluorophoreand the receptor after an ion radical pair has been formed,which usually has a value of ∼0.1 eV in acetonitrile. Forhighly polar solvents, this term can be neglected.
By increasing the oxidation potential for the receptor, theterm Eox.receptor becomes more positive. This makes the freeenergy in Eq. (12.3) more positive, and thus the electrontransfer from the receptor to the fluorophore is unfavorable.The electron in the excited state F* can now deactivateby emitting the excited state energy, and fluorescence isobserved. This is called the on state, and is shown inFig. 12.14.
From electrochemical data available for organic andinorganic molecules and singlet energies for various
fluorophores, one can construct a system that gives the mostpromising �GET for an “off–on” PET system. PET systemswith a favorable negative �GET value can be transformedinto a slightly positive value under the effect of an externalperturbation such as the effect of a cation on the oxidationpotential of a receptor.
Having examined the theoretical conditions for PETsensing, we will next examine several examples from theliterature where the above mechanism has been employed.
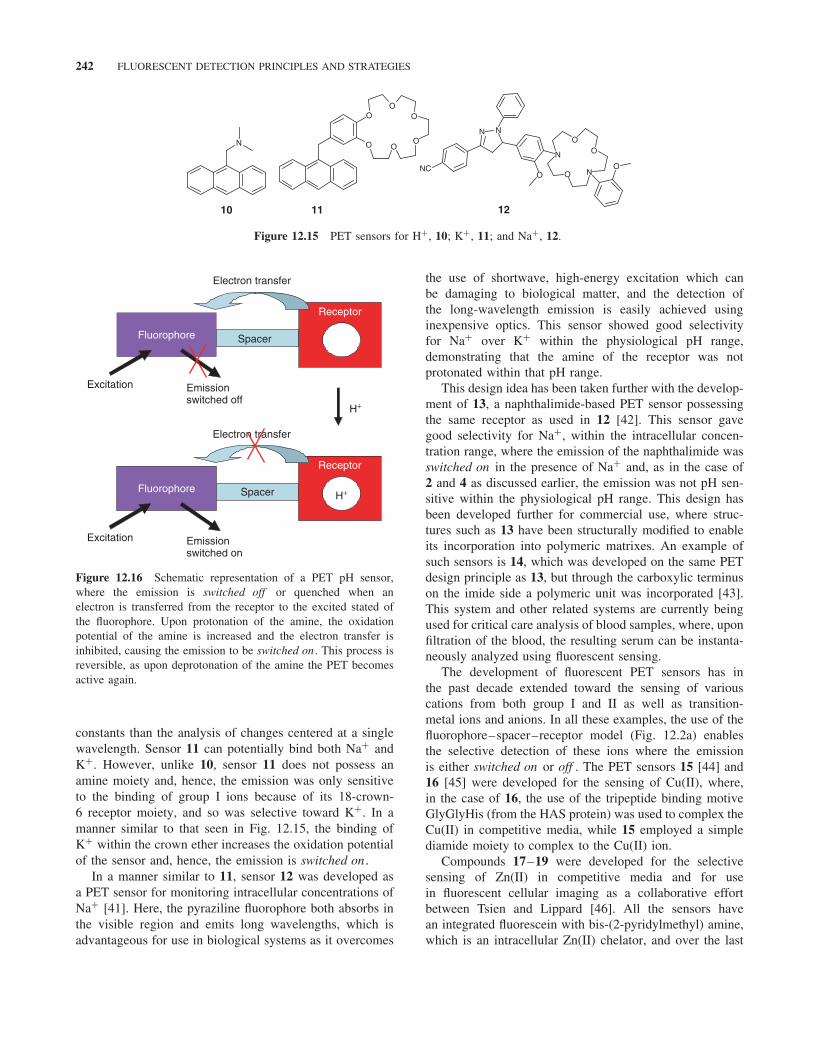
12.4.2.3 Examples of PET Sensors In 1985, de Silvaet al. [38–40] reported the development of PET sensorsbased on the anthracene structure 10 as pH sensor and 11as a sensor for K+, Fig. 12.15. The methylene spacer usedin these structures ensured, as discussed above, that noground-state interaction occurred and thus the absorptionspectra did not change as a function of pH or K+. Incontrast, the emission spectra of these systems were highlypH dependent. In the case of 10, in its unprotonated form(in alkaline solution) the amine was capable of transferringelectrons to the excited state of the anthracene, which ledto fluorescence quenching.
Protonation of the amine moiety lowers the reductionpotential of the amine, and hence PET becomes stronglyinhibited, resulting in switching on of the fluorescenceof the anthracene fluorophore, as shown schematically inFig. 12.16 (and can be reviewed in concert with thatdiscussed in the previous section). In other words, thefluorescence intensity and quantum yield were enhancedupon H+ recognition. The reversibility of the sensing actionwas achieved by simply deprotonating the amine, andhence the PET mechanism became active. Analysis of theemission changes (at a particular wavelength) as a functionof pH gave a sigmoidal curve, which changed over two pHunits and is typical for 1:1 binding and simple equilibrium.From these changes, the pKa for the protonation of theamine could be determined.
Such analysis can also be undertaken by using nonlinearregression analysis programs such as SPECFIT. Such aglobal analysis fits the overall changes seen in the emissionspectra and is a more accurate means of obtaining binding
242 FLUORESCENT DETECTION PRINCIPLES AND STRATEGIES
O
N
N
OO
NN
NC OO
N O
OO
O
O
O
10 11 12
Figure 12.15 PET sensors for H+, 10; K+, 11; and Na+, 12.
Fluorophore Spacer
Receptor
Excitation
Electron transfer
Emissionswitched off
Fluorophore Spacer
Receptor
Excitation
Electron transfer
Emissionswitched on
H+
H+
Figure 12.16 Schematic representation of a PET pH sensor,where the emission is switched off or quenched when anelectron is transferred from the receptor to the excited stated ofthe fluorophore. Upon protonation of the amine, the oxidationpotential of the amine is increased and the electron transfer isinhibited, causing the emission to be switched on . This process isreversible, as upon deprotonation of the amine the PET becomesactive again.
constants than the analysis of changes centered at a singlewavelength. Sensor 11 can potentially bind both Na+ andK+. However, unlike 10, sensor 11 does not possess anamine moiety and, hence, the emission was only sensitiveto the binding of group I ions because of its 18-crown-6 receptor moiety, and so was selective toward K+. In amanner similar to that seen in Fig. 12.15, the binding ofK+ within the crown ether increases the oxidation potentialof the sensor and, hence, the emission is switched on .
In a manner similar to 11, sensor 12 was developed asa PET sensor for monitoring intracellular concentrations ofNa+ [41]. Here, the pyraziline fluorophore both absorbs inthe visible region and emits long wavelengths, which isadvantageous for use in biological systems as it overcomes
the use of shortwave, high-energy excitation which canbe damaging to biological matter, and the detection ofthe long-wavelength emission is easily achieved usinginexpensive optics. This sensor showed good selectivityfor Na+ over K+ within the physiological pH range,demonstrating that the amine of the receptor was notprotonated within that pH range.
This design idea has been taken further with the develop-ment of 13, a naphthalimide-based PET sensor possessingthe same receptor as used in 12 [42]. This sensor gavegood selectivity for Na+, within the intracellular concen-tration range, where the emission of the naphthalimide wasswitched on in the presence of Na+ and, as in the case of2 and 4 as discussed earlier, the emission was not pH sen-sitive within the physiological pH range. This design hasbeen developed further for commercial use, where struc-tures such as 13 have been structurally modified to enableits incorporation into polymeric matrixes. An example ofsuch sensors is 14, which was developed on the same PETdesign principle as 13, but through the carboxylic terminuson the imide side a polymeric unit was incorporated [43].This system and other related systems are currently beingused for critical care analysis of blood samples, where, uponfiltration of the blood, the resulting serum can be instanta-neously analyzed using fluorescent sensing.
The development of fluorescent PET sensors has inthe past decade extended toward the sensing of variouscations from both group I and II as well as transition-metal ions and anions. In all these examples, the use of thefluorophore–spacer–receptor model (Fig. 12.2a) enablesthe selective detection of these ions where the emissionis either switched on or off . The PET sensors 15 [44] and16 [45] were developed for the sensing of Cu(II), where,in the case of 16, the use of the tripeptide binding motiveGlyGlyHis (from the HAS protein) was used to complex theCu(II) in competitive media, while 15 employed a simplediamide moiety to complex to the Cu(II) ion.
Compounds 17–19 were developed for the selectivesensing of Zn(II) in competitive media and for usein fluorescent cellular imaging as a collaborative effortbetween Tsien and Lippard [46]. All the sensors havean integrated fluorescein with bis-(2-pyridylmethyl) amine,which is an intracellular Zn(II) chelator, and over the last

EXAMPLES OF FLORESCENCE DETECTION STRATEGIES AND PRINCIPLES 243
few years a large variety of this design has been developedand studied in detail by Lippard et al. [47]. In the absenceof metal ions, quantum yields of 0.38 and 0.25 in aqueousmedia were determined for 17 and 18, respectively. Thisincreased to 0.87 and 0.92, respectively, upon addition of25µM of Zn(II) ions in PIPES buffer at pH 7.4. From thechanges in the emission spectra, Kd values of 0.5 and 0.7nM were determined for 17 and 18, respectively, at pH7.0. Small hypsochromic shifts were also observed in theabsorption spectrum upon Zn(II) coordination, which wasattributed to the interaction between the phenolic moietyof the fluorophore with Zn(II). No fluorescence responsewas obtained with group I or group II metal ions, whereastransition metals such as Cu(I), Cu(II), Ni(II), Co(II), andMn(II) induced some degree of fluorescence quenching.
Sensor 19 is an extension of the above design, andcomprises two fluorophores (coumarin and fluorescein),both excited by visible light [46]. The luminescent signalingis based upon the esterase-mediated cleavage of the sensor,where one (fluorescein derivative) is sensitive to Zn(II)while the other (coumarin-343) is insensitive. Fluorescenceemission intensity of the fluorescein derivative increasedrelative to coumarin-343 upon Zn(II) addition. The use ofsuch sensors have in the past few years greatly improvedour understanding of the physiological and biochemicalrole of Zn(II), particularly in glucose metabolism, neuronsignaling, and apoptosis.
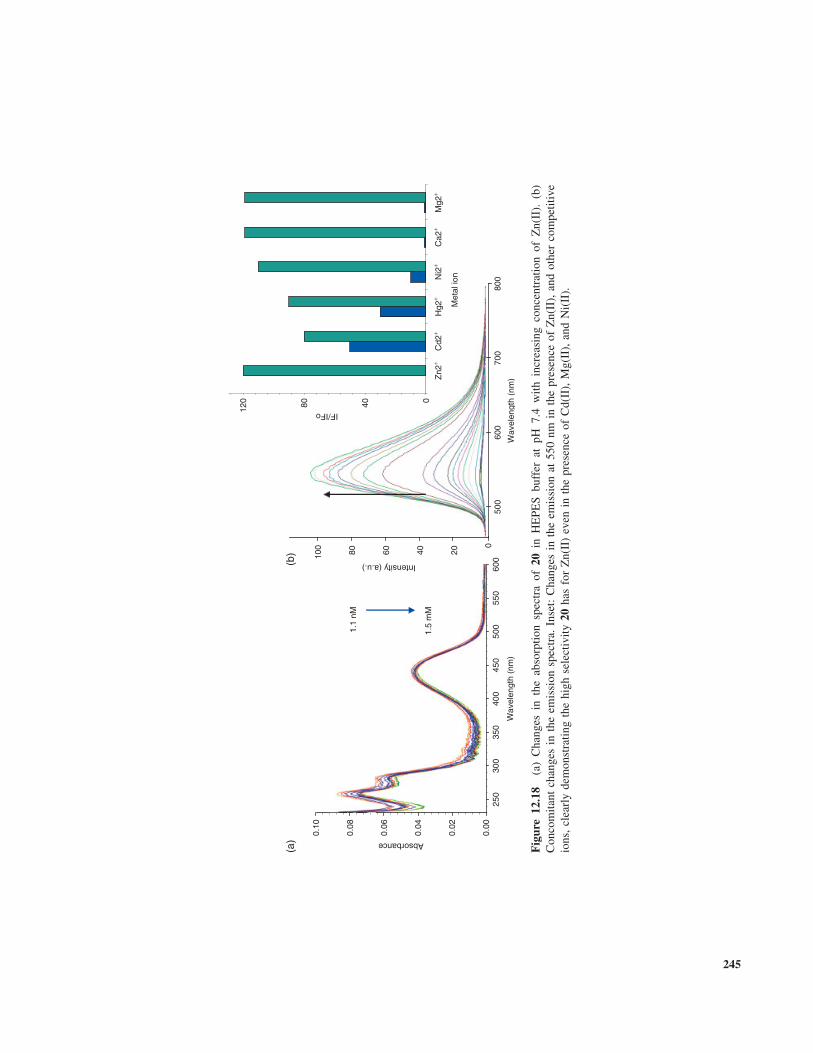
The last example in Fig. 12.17 is the PET sensor20, which was also developed for sensing Zn(II). Thissensor, unlike some of the other Zn(II) sensors developedto date, was pH independent within the physiological pHrange and highly selective for Zn(II) in the presence ofother competitive group I and II and transition-metal ions[48]. An analog of 20 possessing an ethyl spacer wasalso developed. The rationale behind the synthesis of thismodified version was that the ethylene spacer could impartmore thermal and photostability of the fluorophore, thuspreventing the photobleaching of the sensor as reported forthe naphthalimide-based Na+ and K+ sensors 13 and 14above. This is of particular importance if such systems wereto be employed for in vivo sensing. It can be argued thatthe ethylene spacer could reduce the PET quenching rate asit decreases exponentially with distance (1/r6). However,experimental studies have shown that maximum PET ratecan be operative easily up to three-unit carbon spacers.
As in the case of many of the aforementioned examples,the receptor unit in 20 possesses an aniline nitrogen that canbe protonated. However, the emission arising from 20 wasshown to be pH independent within the physiological pHrange. The changes observed in the absorption spectra of20 are shown in Fig. 12.18a upon increasing concentrationof Zn(II), when recorded at pH 7.4 in the presence ofhigh concentration of NaCl (150 mM) which was used tomaintain a constant ionic strength. But the use of such high
ionic strengths is to ensure that electrostatic interactionsdo not give a false-positive response and also to mimiccompetitive media such as blood, as well as to ensurethat various counterions do not interfere with the sensingprocess. Other salts, such as various ammonium salts, arealso commonly used to maintain a constant ionic strength.In the case of 20, then, it is clear that only minor changes areobserved in the absorption spectra, which indicates that noground-state interactions occur between the receptor and thenaphthalimide fluorophore. In contrast to these results, theemission arising from the naphthalimide moiety is greatlyenhanced upon binding of Zn(II) at the receptor site, asis clearly demonstrated in Fig. 12.18b, where the PEThas been suppressed in the same manner as depicted inFig. 12.16 for H+.
The reversibility and the selectivity for the sensingof Zn(II) were also investigated, where sensor 20 wastitrated with a series of competitive ions that might havean affinity for the receptor in 20. These gave rise to onlyminor enhancement in the fluorescence of 20 in comparisonto Zn(II). This selectivity was then further confirmed byadding Zn(II) to the solution of 20 in the presence of theseother ions. This gave rise to a significant enhancementin the emission of 20, demonstrating that the sensor wasselective to Zn(II) even in the presence of these competitiveions. The result is shown as an inset in Fig. 12.18b. Thereversibility for the Zn(II) sensing was confirmed by addinga competitive ligand to a solution of 20 in the presence of aknown concentration of Zn(II). In this case, the well-knownEDTA (ethylenediamine) ligand was used, which has higheraffinity for Zn(II) than 20 and, hence, was able to extractthe ion from the receptor part of 20. This meant that PETwas now again operational and the emission arising from20 was quenched.
While it is essential to demonstrate reversibility in suchsystems, to date most sensors are developed to be usedas “single-shot” sensors. Hence, the reversibility of thesesystems is not of utmost importance. Nevertheless, forcontinuous monitoring of an analyte, where fluctuations canoccur in its local concentration, such reversibility has to bedemonstrated.
The above examples have focused on the sensing ofcations, where changes in the oxidation potential of thereceptors occur upon binding to various cations. Sucha sensing mechanism is not just restricted to cations,and several examples of sensors for anions have beendeveloped that operate on the same PET principle usingthe fluorophore–spacer–receptor principle.
An example of these is the anthracene sensor 21,Fig. 12.19, which was developed for the sensing ofphosphate in aqueous solution [49]. Compound 21 existsas a trication at pH 6, where the nitrogen atom proximal tothe anthracene ring is not protonated, thereby enabling themolecule to acts as an anion sensor.

OH
OO
CO
OH
XX
NN
NN
NN
NN
OO
N
H N
N
NH
O
O
O
O
O
Pol
ymer
OO
OO
O
NH
N
O
O
OO
N
OO
OO
13
14
CH
2HN
NH
OO
H2N
NH
2
15
N
NH
NH
2H
O O4
N HN
H2O
O
N HO
S
ON
16
17 R
= H
18 R
= C
l
OH
OO
CO
2H
Cl
Cl
NN
NN
NN
HN
O
O
O
ON
O19
NO
O
HN
N
CO
2Na
CO
2Na
20
Fig
ure
12.1
7V
eriti
esof
fluor
esce
ntPE
Tse
nsor
sde
velo
ped
for
the
sens
ing
and,
inso
me
case
s,im
agin
gof
Na+ ,
K+ ,
Cu(
II),
and
Zn(
II)
inco
mpe
titiv
em
edia
.
244
Wav
elen
gth
(nm
)
250
300
350
400
450
500
550
600
Absorbance
0.00
0.02
0.04
0.06
0.08
0.10
1.5
mM
1.1
nM
(a)
(b)
500
600
700
800
0
20406080100
Wav
elen
gth
(nm
)
Intensity (a.u.)
IF/IFo
04080120
Zn2
+C
d2+
Hg2
+N
i2+
Ca2
+M
g2+
Met
al io
n
Fig
ure
12.1
8(a
)C
hang
esin
the
abso
rpti
onsp
ectr
aof
20in
HE
PES
buff
erat
pH7.
4w
ithin
crea
sing
conc
entr
atio
nof
Zn(
II).
(b)
Con
com
itant
chan
ges
inth
eem
issi
onsp
ectr
a.In
set:
Cha
nges
inth
eem
issi
onat
550
nmin
the
pres
ence
ofZ
n(II
),an
dot
her
com
petit
ive
ions
,cl
earl
yde
mon
stra
ting
the
high
sele
ctiv
ity
20ha
sfo
rZ
n(II
)ev
enin
the
pres
ence
ofC
d(II
),M
g(II
),an
dN
i(II
).
245

246 FLUORESCENT DETECTION PRINCIPLES AND STRATEGIES
NH
NH
NH3
H3N+
OO
OP
O−
−
+
+
H
Low fluorescence
(b)
NH
NH
NH3
H3N+
OO
OP
O−
−
+
+
H+
High fluorescence
(c)
+
+
+
Low fluorescence
Non fluorescent
NH+
NH3
NH3
NH
(a)
O O−
O−
H
P
O
21
Figure 12.19 Modulation of the electron transfer process upon hydrogen phosphate binding insensor 21.
In this form, PET quenching from the amino moietyto the anthracene occurs and the emission intensity islow, Fig. 12.19a. This trication can bind complementarystructures such as phosphate. The three oxygen atomson the anion interact with the three positive charges onthe ammonium ions, leaving the remaining OH groupin close proximity to the free amine and therefore ina favorable position to undergo proton transfer to theunprotonated amino group, Fig. 12.19b. This proton transfersuppresses the PET process, Fig. 12.19c. Thus, anionbinding is accompanied by an increase in the fluorescenceemission intensity. Binding of 21 to adenosine triphosphate,citrate, and sulfate also leads to fluorescence enhancements,although to a smaller degree than those observed forphosphate.
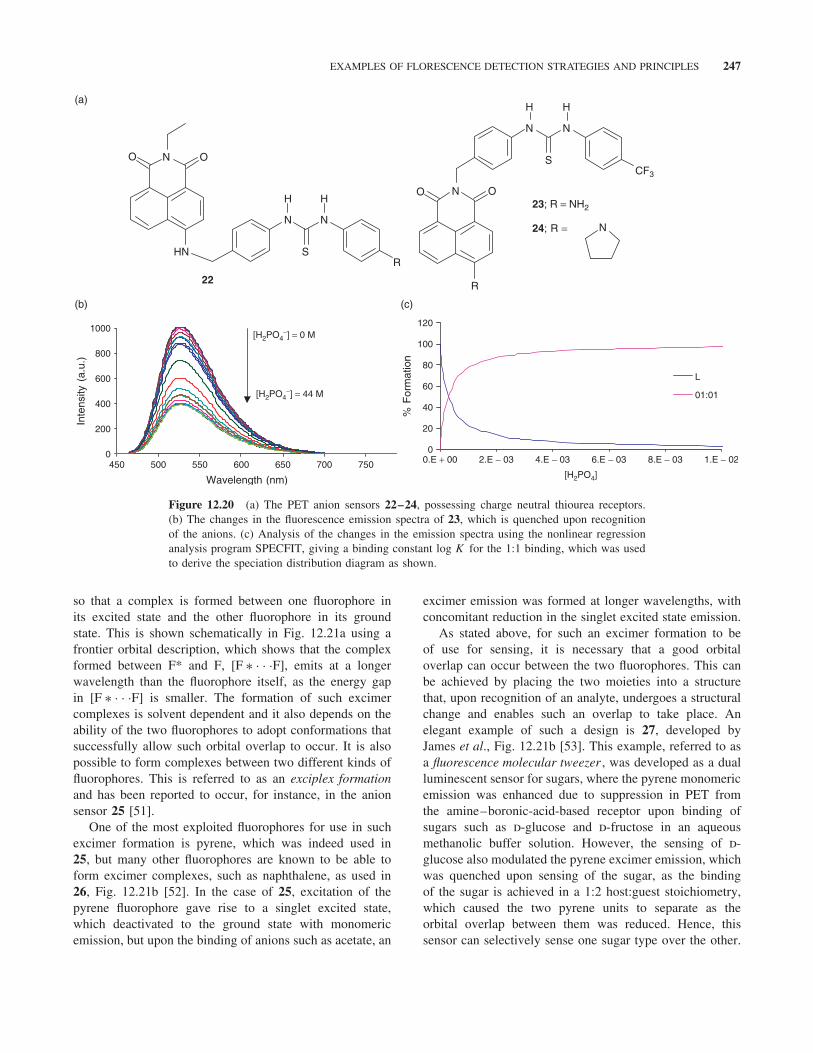
When sensor 21 was developed as an anion sensor, thesensing action was more centered on the ability of thecomplexed hydrogen phosphate anion to participate in aprotonation process, which subsequently affected the PETquenching from the amine to the anthracene fluorophore.In contrast to this design, the incorporation of hydrogen-bonding receptors, such as those shown in Fig. 12.9, gaverise to the anion PET sensors 22–24, Fig. 12.20 [50]. Thesecan be considered as structural isomers, where the thioureaanion receptor is connected either via the 4-amino moietyof the naphthalimide ring (22) or at the imide moiety (23and 24).
All these structures were able to sense anions such asacetate, hydrogen phosphate, and fluoride through hydrogenbonding of the anions at the receptor sites in DMSOsolution. Moreover, fluoride was also able to deprotonatethe four-amino moiety of 22 and 23 at high concentration,giving rise to changes in both the absorption and theemission spectra, resembling that seen in Fig. 12.10. Such
deprotonation was not possible for 24, as it lacks the acidic4-amino proton. However, unlike that seen for the anionsensor 21, the emission was quenched upon recognitionof the anion, as the receptor-bound anion increases thereduction potential of the receptor and as such enhancesthe PET from the receptor to the excited state of thefluorophore, Fig. 12.20a. Here, the diagram shown inFig. 12.16 can be modified by showing that PET is activeprior to the anion recognition, but after the binding ofthe anion the reduction potential is enhanced and thePET process becomes even more active. This leads to theenhancement in the quenching as shown in Fig. 12.20b.Analysis of these changes, by fitting the changes observedin the emission spectra using nonlinear regression analysisprogram SPECFIT, enabled the determination of thebinding constant for the 1:1 binding of the anion to 21.The changes were also analyzed by using other host:gueststoichiometries but the 1:1 binding gave the best fit. Fromthese analyses, the speciation distribution diagram shownin Fig. 12.20c was constructed.
The above examples have demonstrated the use ofPET sensors for cations and anions. Sensing of neutralmolecules, such as various drug candidates and sugars, hasalso been achieved. Examples include the use of boronicacids as a receptor, which can bind to sugars such as glucosewith concomitant enhancement in the fluorescence of thesensor. An example of such sugar sensing will be discussedin the next section.
12.4.2.4 Sensing Using Through Modulation in Excimerand Exciplex Emission A fluorophore possessing a flataromatic surface that can also participate in π –π stackingcan sometimes be used to achieve excimer emission,provided that two such fluorophores can interact together
EXAMPLES OF FLORESCENCE DETECTION STRATEGIES AND PRINCIPLES 247
N
H
S
N
H
RHN
O N O
R
O N O
N N
SCF3
HH
N
22
23; R = NH2
24; R =
(a)
(b)
0
200
400
600
800
1000
450 500 550 600 650 700 750
Wavelength (nm)
Inte
nsity
(a.
u.)
[H2PO4−] = 0 M
[H2PO4−] = 44 M
0
20
40
60
80
100
120
0.E + 00 2.E − 03 4.E − 03 6.E − 03 8.E − 03 1.E − 02
[H2PO4]
% F
orm
atio
n
L
01:01
(c)
Figure 12.20 (a) The PET anion sensors 22–24, possessing charge neutral thiourea receptors.(b) The changes in the fluorescence emission spectra of 23, which is quenched upon recognitionof the anions. (c) Analysis of the changes in the emission spectra using the nonlinear regressionanalysis program SPECFIT, giving a binding constant log K for the 1:1 binding, which was usedto derive the speciation distribution diagram as shown.
so that a complex is formed between one fluorophore inits excited state and the other fluorophore in its groundstate. This is shown schematically in Fig. 12.21a using afrontier orbital description, which shows that the complexformed between F* and F, [F ∗ · · ·F], emits at a longerwavelength than the fluorophore itself, as the energy gapin [F ∗ · · ·F] is smaller. The formation of such excimercomplexes is solvent dependent and it also depends on theability of the two fluorophores to adopt conformations thatsuccessfully allow such orbital overlap to occur. It is alsopossible to form complexes between two different kinds offluorophores. This is referred to as an exciplex formationand has been reported to occur, for instance, in the anionsensor 25 [51].
One of the most exploited fluorophores for use in suchexcimer formation is pyrene, which was indeed used in25, but many other fluorophores are known to be able toform excimer complexes, such as naphthalene, as used in26, Fig. 12.21b [52]. In the case of 25, excitation of thepyrene fluorophore gave rise to a singlet excited state,which deactivated to the ground state with monomericemission, but upon the binding of anions such as acetate, an
excimer emission was formed at longer wavelengths, withconcomitant reduction in the singlet excited state emission.
As stated above, for such an excimer formation to beof use for sensing, it is necessary that a good orbitaloverlap can occur between the two fluorophores. This canbe achieved by placing the two moieties into a structurethat, upon recognition of an analyte, undergoes a structuralchange and enables such an overlap to take place. Anelegant example of such a design is 27, developed byJames et al., Fig. 12.21b [53]. This example, referred to asa fluorescence molecular tweezer , was developed as a dualluminescent sensor for sugars, where the pyrene monomericemission was enhanced due to suppression in PET fromthe amine–boronic-acid-based receptor upon binding ofsugars such as d-glucose and d-fructose in an aqueousmethanolic buffer solution. However, the sensing of d-glucose also modulated the pyrene excimer emission, whichwas quenched upon sensing of the sugar, as the bindingof the sugar is achieved in a 1:2 host:guest stoichiometry,which caused the two pyrene units to separate as theorbital overlap between them was reduced. Hence, thissensor can selectively sense one sugar type over the other.

248 FLUORESCENT DETECTION PRINCIPLES AND STRATEGIES
F* F
[F*···F]Complex
(a) (b)
25
NB
OHHO
N
O
H
NB
HO OH
N
O
H
NH
NHS
N HO
N H NH
ONH
N
NH
O NH
26
27
Figure 12.21 (a) The formation of an excimer achieved upon formation of a complex between anexcited stated fluorophore (F*) and a ground state fluorophore (F) of the same nature. (b) Compound25 developed for the sensing of sugars, which is based on PET as well as on the use of excimerformation.
Donor
Acceptor
Analyte
Donor Acceptor
Analyte
No energy or electroncommunication
Analyte-induced energyor electron
communication
Figure 12.22 Schematic representation of a donor–acceptor pair connected by a spacer that canoperate upon recognition of an analyte. The reverse scenario also exists, where the recognition ofthe analyte prevents the occurrence of such communication by breaking up the donor–acceptorpair.
Moreover, the changes at the two λmax assigned to themonomeric and the excimer emissions, respectively, can beused for radiometric sensing, giving rise to a more accuratedetermination of the sensing event.
12.4.2.5 Fluorescence Sensing Using Energy TransferMechanism The above examples have focused on theuse of changes in the ICT, monomeric (fluorescenceoccurring from S1), and excimer emission upon recognitionof an analyte. Fluorescent sensing can also be achievedby means of modulating energy and electron transferprocesses between (i) an energy-accepting and energy-donating moiety or (ii) an electron-donating and electron-accepting moiety, where these processes are turned on bybringing together such donating–accepting pairs, usually,through conformational changes that are induced withinthe sensors by the recognition of an analyte. The reverse
can also be achieved, where a conformational changetakes place within such sensors that causes such energy orelectron acceptor–donor pairs to become separated (hence,this type of sensing is related to that seen above forsenor 27). This consequently turns off any such energy orelectron processes. This type of sensing mode is shownschematically in Fig. 12.22, where the communicationpathway, being either via electron transfer or energytransfer, is only established upon recognition of the analyte,giving rise to modulation in the photophysical properties ofthe two components.
The above sensing processes are often referred toas fluorescence resonance energy transfer sensing. FRETis highly distance dependent, which means that thetransfer of resonance energy between the donor and theacceptor decreases as the distance (r) between the twolabels increases [11, 12]. Like electron transfer, energy
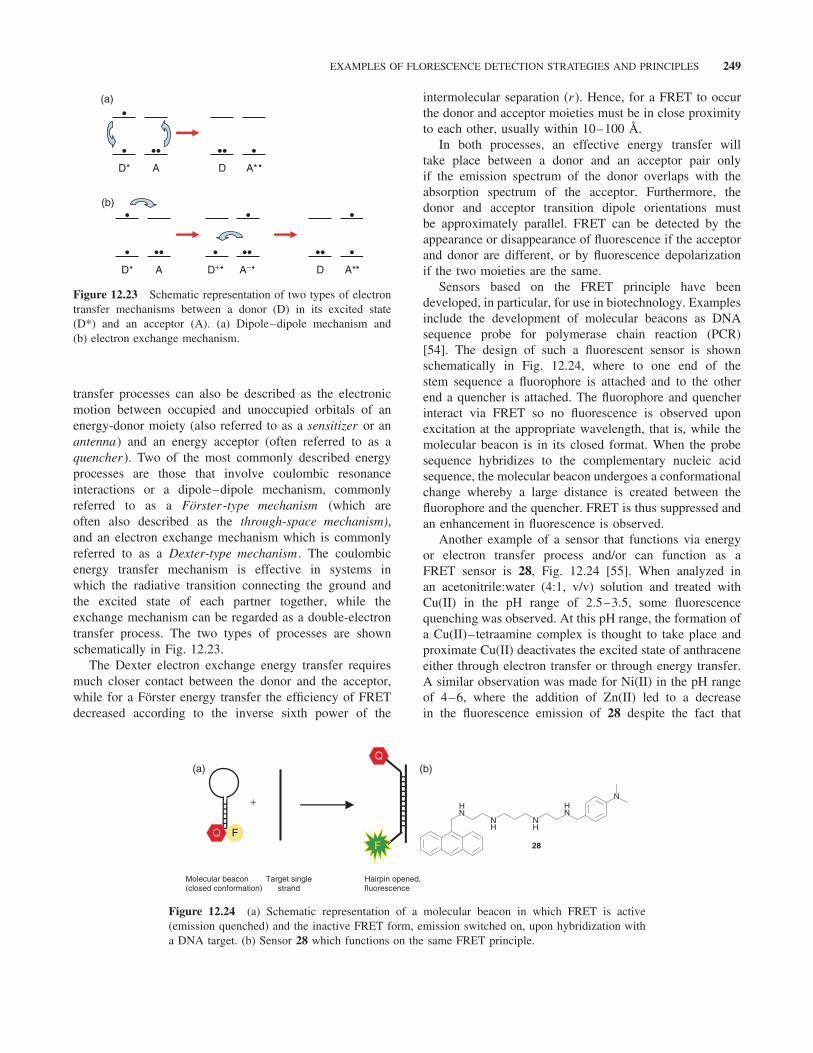
EXAMPLES OF FLORESCENCE DETECTION STRATEGIES AND PRINCIPLES 249
(a)•
•
• • •
•••
• •• • •• •• •
••
D A* •D* A
(b)
D+• A−• D A*•D* A
Figure 12.23 Schematic representation of two types of electrontransfer mechanisms between a donor (D) in its excited state(D*) and an acceptor (A). (a) Dipole–dipole mechanism and(b) electron exchange mechanism.
transfer processes can also be described as the electronicmotion between occupied and unoccupied orbitals of anenergy-donor moiety (also referred to as a sensitizer or anantenna) and an energy acceptor (often referred to as aquencher). Two of the most commonly described energyprocesses are those that involve coulombic resonanceinteractions or a dipole–dipole mechanism, commonlyreferred to as a Forster-type mechanism (which areoften also described as the through-space mechanism),and an electron exchange mechanism which is commonlyreferred to as a Dexter-type mechanism . The coulombicenergy transfer mechanism is effective in systems inwhich the radiative transition connecting the ground andthe excited state of each partner together, while theexchange mechanism can be regarded as a double-electrontransfer process. The two types of processes are shownschematically in Fig. 12.23.
The Dexter electron exchange energy transfer requiresmuch closer contact between the donor and the acceptor,while for a Forster energy transfer the efficiency of FRETdecreased according to the inverse sixth power of the
intermolecular separation (r). Hence, for a FRET to occurthe donor and acceptor moieties must be in close proximityto each other, usually within 10–100 A.
In both processes, an effective energy transfer willtake place between a donor and an acceptor pair onlyif the emission spectrum of the donor overlaps with theabsorption spectrum of the acceptor. Furthermore, thedonor and acceptor transition dipole orientations mustbe approximately parallel. FRET can be detected by theappearance or disappearance of fluorescence if the acceptorand donor are different, or by fluorescence depolarizationif the two moieties are the same.
Sensors based on the FRET principle have beendeveloped, in particular, for use in biotechnology. Examplesinclude the development of molecular beacons as DNAsequence probe for polymerase chain reaction (PCR)[54]. The design of such a fluorescent sensor is shownschematically in Fig. 12.24, where to one end of thestem sequence a fluorophore is attached and to the otherend a quencher is attached. The fluorophore and quencherinteract via FRET so no fluorescence is observed uponexcitation at the appropriate wavelength, that is, while themolecular beacon is in its closed format. When the probesequence hybridizes to the complementary nucleic acidsequence, the molecular beacon undergoes a conformationalchange whereby a large distance is created between thefluorophore and the quencher. FRET is thus suppressed andan enhancement in fluorescence is observed.
Another example of a sensor that functions via energyor electron transfer process and/or can function as aFRET sensor is 28, Fig. 12.24 [55]. When analyzed inan acetonitrile:water (4:1, v/v) solution and treated withCu(II) in the pH range of 2.5–3.5, some fluorescencequenching was observed. At this pH range, the formation ofa Cu(II)–tetraamine complex is thought to take place andproximate Cu(II) deactivates the excited state of anthraceneeither through electron transfer or through energy transfer.A similar observation was made for Ni(II) in the pH rangeof 4–6, where the addition of Zn(II) led to a decreasein the fluorescence emission of 28 despite the fact that
+
Q F
Molecular beacon(closed conformation)
Target singlestrand
Q
F
Hairpin opened,fluorescence
HN
NH
NH
HN
N
(b)(a)
28
Figure 12.24 (a) Schematic representation of a molecular beacon in which FRET is active(emission quenched) and the inactive FRET form, emission switched on, upon hybridization witha DNA target. (b) Sensor 28 which functions on the same FRET principle.
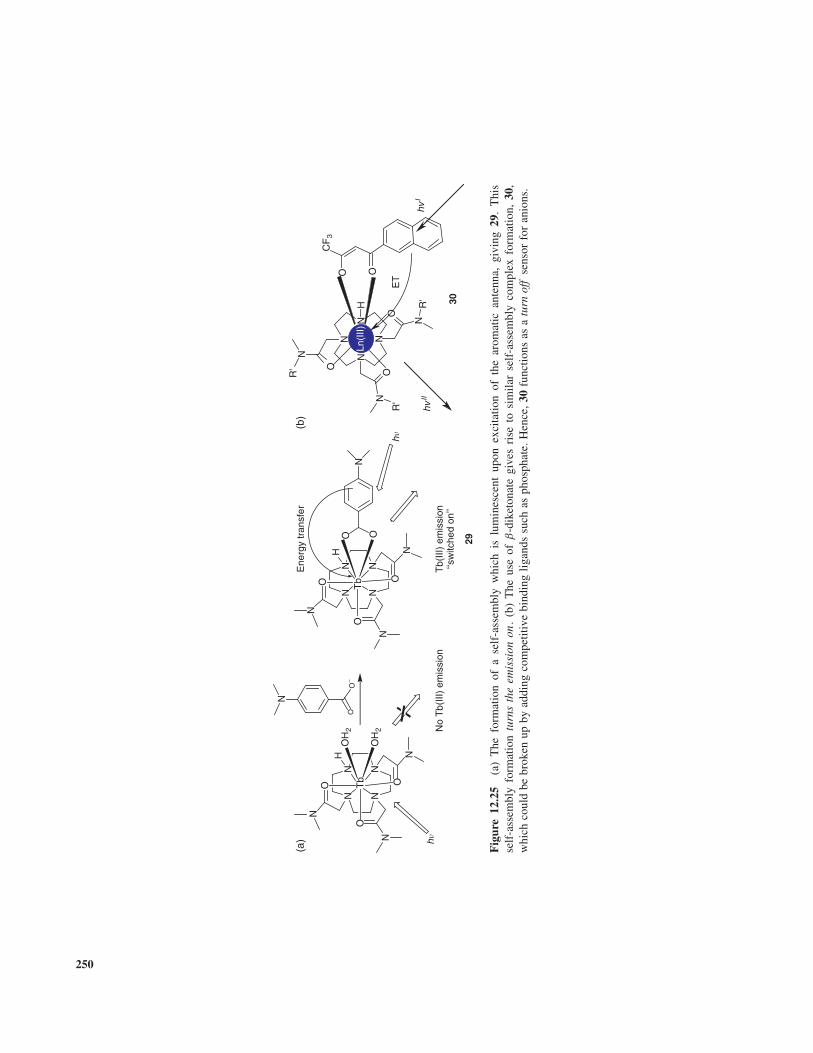
NN N
N
ON
N
NH
O T
b O
OH
2
OH
2
hnN
o T
b(III
) em
issi
on
OO
−
N
(a)
Tb(
III)
emis
sion
‘‘sw
itche
d on
’’
Ene
rgy
tran
sfer
ON
N NN
ON
N
NH
OT
b O
O
hn
N
29
N
N
N
N
H
O
OO
N
N
N
R'
R'
R'
Ln(I
II)OO
CF
3
ET
hvI
hvII
(b)
30
Fig
ure
12.2
5(a
)T
hefo
rmat
ion
ofa
self
-ass
embl
yw
hich
islu
min
esce
ntup
onex
cita
tion
ofth
ear
omat
ican
tenn
a,gi
ving
29.
Thi
sse
lf-a
ssem
bly
form
atio
ntu
rns
the
emis
sion
on.
(b)
The
use
ofβ
-dik
eton
ate
give
sri
seto
sim
ilar
self
-ass
embl
yco
mpl
exfo
rmat
ion,
30,
whi
chco
uld
bebr
oken
upby
addi
ngco
mpe
titiv
ebi
ndin
glig
ands
such
asph
osph
ate.
Hen
ce,
30fu
nctio
nsas
atu
rnof
fse
nsor
for
anio
ns.
250

REFERENCES 251
Zn(II) is known to be a “nonquencher” metal ion.The explanation offered for this phenomenon was thatZn(II) binding induces conformational changes in themolecules, which bring the dimethylaniline (DMA) andanthracene fragments close enough to allow electrontransfer, as depicted in Fig. 12.22. Energy transfer hasalso been employed in sensors based on transition-metalion complexes and lanthanide ion complexes, where theemission arises from the metal center itself, as in thecase of lanthanide complexes such as in the Eu(III) andTb(III), 29 [56] and 30 [57], Fig. 12.25. Here, the complexbecomes luminescent upon excitation of a chromophorethat is directly attached to the metal center. In the absenceof the chromophore, referred to as a sensitising antenna ,no emission arises from the lanthanide ion; however, uponformation of the ternary complexes 29 and 30, the emissionis switched on as demonstrated in Fig. 12.23b. In the caseof 29, salicylic acid was detected selectively over aspirin incompetitive media at pH 7.4, where the antenna of 30 couldbe displaced by anions such as phosphate which quenchedthe Tb(III) emission. The advantage of using the lanthanideions as emitters is that ions such as Tb(III) and Eu(III) emitwith line-like emission bands at long wavelengths in thegreen and red part of the spectrum. This kind of sensing canbe considered as a fluorescence displacement-type assay,which is specifically featured in Chapter 14 and thereforewill not be discussed further here.
12.5 CONCLUSION
This chapter has dealt with some of the main principles offluorescence sensing and the various strategies employedin senor design. The development of various fluorescencesensors based on the use of targeting receptor moietiesconjugated via a spacer or by direct incorporation intovarious types of fluorphores was discussed, and thephotophysical background for the development of suchsensory systems was listed.
REFERENCES
1. de Silva AP, Gunaratne HQN, Gunnlaugsson T, Huxley AJM,McCoy CP, Rademacher JT, Rice TE. Chem Rev 1997;97:1515.
2. (a) Czarnik AW, Desvergne J-P, editors. Chemosensorsfor ion and molecular recognition. Dordrecht, The Nether-lands: Kluwer; 1993. (b) Czarnik AW, editor. Fluorescentchemosensors of ion and molecular recognition. ACS Sym-posium Series. Washington, DC: American Chemical Society;1993. (c) Valeur B. In: Topics in fluorescence spectroscopy,probe design and chemical sensing. Volume 4, Lakowics JR,editor. New York: Plenum Press; 1994. p.21; (d) OzinskasAJ. In: Topics in fluorescence spectroscopy, probe design and
chemical sensing. Volume 4, Lakowics JR, editor. New York:Plenum Press; 1994. p.449; (e) Wolfbeis OS. Fibre opticchemical sensors and biosensors. Volume 1&2, Boca Raton,Florida: CRC Press; 1991.
3. (a) Lakowicz JR. Principles of fluorescence spectroscopy. 2ndedn. Plenum Publishing; 1999; (b) Chanon M, Hawley MD,Fox MA. In: Photoinduced electron transfer part a, conceptualbasis. Fox MA, Chanon M, editors. Netherlands: Elsvier;1988; (c) Wasielewski MR. Chem Rev 1992; 92:435.
4. (a) Anslyn EV. J Org Chem 2007; 72:687; (b) Nguyen BT,Anslyn EV. Coord Chem Rev 2006; 250:3118.
5. See special issue on chemical sensing: J Mater Chem 2005;15:2617–2976.
6. Chemical sensors and biosensors for medical and biologicalapplications. U. S. Spichiger-Keller, Wiley-VCH; 1998.
7. (a) dos Santos CMG Harte AJ, Quinn Quinn SJ, Gunnlaugs-son T. Coord Chem Rev 2008; 252:2512; (b) Leonard JP,Nolan CB, Stomeo F, Gunnlaugsson T. Top Curr Chem 2007;281:1.
8. (a) Gunnlaugsson T, Glynn M, Tocci (nee Hussey) GM,Kruger PE, Pfeffer FM. Coord Chem Rev 2006; 250:3094;(b) Caltagirone C, Gale PA. Chem Soc Rev 2009; 38:520;(c) Gale PA, Garcıa-Garrido SE, Garric J. Chem Soc Rev2008; 37:151.
9. Sessler JL, Gale PA, Cho WS. Anion receptor chemistry.Cambridge, UK: Royal Society of Chemistry; 2006.
10. Callan JF, de Silva AP, Magri DC. Tetrahedron 2005;61:8551.
11. Turro NJ. Modern molecular photochemistry. CA USA:University Science Books; 1991.
12. Gilbert A, Baggott J Essentials of molecular photochemistry.England: Blackwell Science Ltd; 1991.
13. de Silva AP, Rice TE. Chem Commun 1996:163.
14. Loudet A, Burgess K. Chem Rev 2007; 107:4891.
15. Ryan GJ, Quinn S, Gunnlaugsson T. Inorg Chem 2008;47:401.
16. Nonat AM, Quinn S, Gunnlaugsson T. Inorg Chem 2009;48:4646.
17. Metcalfe C, Thomas JA. Chem Soc Rev 2003; 32:215.
18. Porres L, Holland A, Palssson LO, Monkman AP, Kemp C,Beeby A. J Fluoresc 2006; 16:267.
19. Dos Santos CMG, Glynn M, McCabe T, De Melo JSS,Burrows HD, Gunnlaugsson T. Supramol Chem 2008;20:407.
20. Gunnlaugsson T, Leonard JP. J Chem Soc, Perkin Trans 22002:1980.
21. Minta A, Tsien RY. J Biol Chem 1989; 264:32.
22. Gunnlaugsson T, Gunaratne HQN, Nieuwenhuyzen M,Leonard JP. J Chem Soc, Perkin Trans 1 2002:1954.
23. (a) Harootunian AT, Kao JPY, Eckert BK, Tsien RY. J BiolChem 1989; 264:19458; (b) Tsien RY. Annu Rev Neurosci1989; 12:227; (c) Tsien RY. Ann J Physiol 1992; 27:C723.
24. Plush SE, Gunnlaugsson T. Dalton Trans 2008:3801.
25. (a) Jonker SA, Ariese F, Verhoeven JW. Recl Trav ChimPays-Bas 1989; 108:109; (b) Jonker SA, Verhoeven JW,

252 FLUORESCENT DETECTION PRINCIPLES AND STRATEGIES
Reiss CA, Goubitz K, Heijdenrijk D. Recl Trav Chim Pays-Bas 1990; 109:154.
26. Jonker SA, Van Dijk SI, Goubitz K, Reiss CA, Schud-deboom W, Verhoeven JW. J Mol Cryst Liq Cryst 1990;183:273.
27. (a) Minta A, Kao JPY, Tsien RY. J Biol Chem1989; 264:8171; (b) Tsien RY. Nature 1981; 290:527;(c) These are commercially available: Molecular probes,handbook of fluorescent probes and research chemicals, andwww.moleuclarprobes.com
28. Veale EB, Frimannsson DO, Lawler M, Gunnlaugsson T. OrgLett 2009; 11:4040.
29. Carter MT, Rodriguez M, Bard AJ. J Am Chem Soc 1989;111:8901.
30. McGhee JD, von Hippel PH. J Mol Biol 1974; 86:469.
31. Liu B, Tian H. J Mater Chem 2005; 15:2681.
32. Esteban-Gomez D, Fabbrizzi L, Liechelli M. J Org Chem2005; 70:5717.
33. (a) Ali HDP, Kruger PE, Gunnlaugsson T. New J Chem 2008;32:1153; (b) Gunnlaugsson T, Kruger PE, Jensen P, TierneyJ, Ali HDP, Hussey GM. J Org Chem 2005; 70:10875.
34. (a) Kavarnos GJ, Turro JN. Chem Rev 1986; 86:401;(b) Marcus RA. Angew Chem Int Ed Engl 1993; 32:1111;(c) Mataga N. Pure Appl Chem 1993; 65:1605; (d) KavarnosGJ. Top Curr Chem 1990; 156:21.
35. Bissell RA, de Silva AP, Gunaratne HQN, Lynch PLM,Maguire GEM, McCoy CP, Sandanayake KRAS. Top CurrChem 1993; 168:223.
36. Martell AE, Motekaitis RJ. Determination and use of stabilityconstants. 2nd ed. Germany: Wiley-VCH; 1991.
37. (a) Weller A. Pure Appl Chem 1968; 16:115; (b) Rehm D.Isr J Chem 1970; 8:259.
38. Bissell RA, de Silva AP, Gunaratne HQN, Lynch PLM,Maguire GEM, Sandanayake KRAS. Chem Soc Rev 1992;21:187.
39. de Silva AP, Rupasinghe ADD. J Chem Soc, Chem Commun1985:1669.
40. (a) de Silva AP, de Silva SA. J Chem Soc, Chem Commun1986:1709; (b) de Silva AP, Sandanayake SamankumaraKRS. Tetrahedron Lett 1991; 32:421.
41. de Silva AP, Gunaratne HQN, Gunnlaugsson T, Nieuwen-huizen M. Chem Commun 1996:1967.
42. He H, Mortellaro MA, Leiner MJP, Young ST, Fraatz RJ,Tusa JK. Anal Chem 2003; 75:549.
43. He H, Mortellaro MA, Leiner MJP, Fraatz RJ, Tusa JK. J AmChem Soc 2003; 125:1468.
44. (a) Fabbrizzi L, Lichelli M, Pallavicini P, Peroti A, TagliettiA, Sachi D. Angew Chem Int Ed Engl 1994; 33:1975;(b) Fabbrizzi L, Lichelli M, Pallavicini P, Peroti A, TagliettiA, Sachi D. Chem Eur J 1996; 2:167.
45. Zheng Y, Cao X, Orbulescu J, Konka V, Andreopoulos FM,Pham SM, Leblanc RM. Anal Chem 2003; 75:1706.
46. (a) Burdette SC, Federickson CJ, Bu W, Lippard SJ. J AmChem Soc 2003; 125:1778; (b) Woodroofe CC, Lippard SJ.J Am Chem Soc 2003; 125:11458; (c) Burdette SC, WalkupGK, Spingler B, Tsien RY, Lippard SJ. J Am Chem Soc 2001;123:7831.
47. Nolan EM, Lippard SJ. Acc Chem Res 2009; 42:193.
48. (a) Parkesh R, Lee TC, Gunnlaugsson T. Org Biomol Chem2007; 5:310; (b) Gunnlaugsson T, Lee TC, Parkesh R. OrgBiomol Chem 2003; 1:3265.
49. Arman SAV, Czarnik AW. J Am Chem Soc 1990; 112:5376.
50. (a) Veale EB, Tocci GM, Pfeffer FM, Kruger PE, Gunnlaugs-son T. Org Biomol Chem 2009; 7:3447; (b) Veale EB,Gunnlaugsson T. J Org Chem 2008; 73:8073.
51. Nishizawa S, Kaneda H, Uchida T, Teramae N. J Chem Soc,Perkin Trans 2 1998:2325.
52. Xie H, Yi S, Yang X, Wu S. New J Chem 1999; 23:1105.
53. Phillips MD, Fyles TM, Barwell NP, James TJ. ChemCommun 2009:6557.
54. (a) Giesendorf BAJ, Vet JAM, Tyagi S, Trijbels JMF, BlomHJ. Am J Hum Genet 1997; 61:1275; (b) Tyagi S, KramerFR. Nat Biotechnol 1996; 14:303; (c) Tyagi S, Bratu DP,Kramer FR. Nat Biotechnol 1998; 16:49.
55. Fabbrizzi L, Lichelli M, Pallavicini P, Taglietti A. Inorg Chem1996; 35:1733.
56. Gunnlaugsson T, Harte AJ, Leonard JP, Nieuwenhuyzen M.Chem Commun 2002:2134.
57. Leonard JP, dos Santos CMG, Plush SE, McCabe T,Gunnlaugsson T. Chem Commun 2007:129.