Embed Size (px)
Citation preview
3
1
In Vitro Micronucleus Technique to Predict Chemosensitivity
Michael Fenech
SummaryThe study of DNA damage at the chromosome level is an essential part of genetic toxicology
because chromosomal mutation is an important event in carcinogenesis. The micronucleus assayshave emerged as one of the preferred methods for assessing chromosome damage because theyenable both chromosome loss and chromosome breakage to be measured reliably. Becausemicronuclei can only be expressed in cells that complete nuclear division a special method wasdeveloped that identifies such cells by their binucleate appearance when blocked from perform-ing cytokinesis by cytochalasin-B, a microfilament-assembly inhibitor. The cytokinesis-blockmicronucleus (CBMN) assay allows better precision because the data obtained are not con-founded by altered cell division kinetics caused by cytotoxicity of agents tested or suboptimalcell culture conditions. The method is now applied to various cell types for population monitor-ing of genetic damage, screening of chemicals for genotoxic potential, and for specific purposessuch as prediction of the radiosensitivity of tumors and interindividual variation in radiosensi-tivity. In its current basic form the CBMN assay can provide, using simple morphological crite-ria, the following measures of genotoxicity and cytotoxicity: chromosome breakage, chromosomeloss, chromosome rearrangement (nucleoplasmic bridges), cell division inhibition, necrosis, andapoptosis. The cytosine-arabinoside modification of the CBMN assay allows for measurement ofexcision-repairable lesions. The use of molecular probes enables chromosome loss to be distin-guished from chromosome breakage and, importantly, nondisjunction in nonmicronucleated bin-ucleated cells can be measured efficiently. The in vitro CBMN technique therefore providesmultiple and complimentary measures of genotoxicity and cytotoxicity that can be achieved withrelative ease within one system. The basic principles and methods (including detailed scoring cri-teria for all the genotoxicity and cytotoxicity end points) of the CBMN assay are described andareas for future development identified.
From: Methods in Molecular Medicine, vol. 111: Chemosensitivity:Vol. 2: In Vivo Models, Imaging, and Molecular Regulators
Edited by: R. D. Blumenthal © Humana Press Inc., Totowa, NJ
Substantial parts of this chapter were updated from Fenech, M. (2000), The in vitro micronu-cleus technique, Mutation Research 455, 81–95, with permission from Elsevier Science.
Key WordsMicronuclear assay; cytokinesis-block; genome damage; chromosome loss; chromosome
breakage.
1. IntroductionThe observation that chromosome damage can be caused by exposure to
ionizing radiation or carcinogenic chemicals was among the first reliable evi-dence that physical and chemical agents can cause major alterations to thegenetic material of eukaryotic cells (1). Although our understanding of chro-mosome structure is incomplete, evidence suggests that chromosome abnor-malities are a direct consequence and manifestation of damage at the DNAlevel—for example, chromosome breaks may result from unrepaired double-strand breaks in DNA and chromosome rearrangements may result from mis-repair of strand breaks in DNA (2). It is also recognized that chromosome lossand malsegregation of chromosomes (nondisjunction) are important events incancer and aging and that they are probably caused by defects in the spindle,centromere, or as a consequence of undercondensation of chromosome struc-ture before metaphase (3–5).
In the classical cytogenetic techniques, chromosomes are studied directly byobserving and counting aberrations in metaphases (6). This approach providesthe most detailed analysis, but the complexity and laboriousness of enumerat-ing aberrations in metaphase and the confounding effect of artefactual loss ofchromosomes from metaphase preparations has stimulated the development ofa simpler system of measuring chromosome damage.
It was proposed independently by Schmid (7) and Heddle (8) that an alter-native and simpler approach to assess chromosome damage in vivo was to mea-sure micronuclei (MNi), also known as Howell–Jolly bodies to hematologists,in dividing cell populations such as the bone marrow. The micronucleus assayin bone marrow and peripheral blood erythrocytes is now one of the best estab-lished in vivo cytogenetic assays in the field of genetic toxicology, but it is nota technique that is applicable to other cell populations in vivo or in vitro andmethods have since been developed for measuring MNi in a variety of nucle-ated cells in vitro.
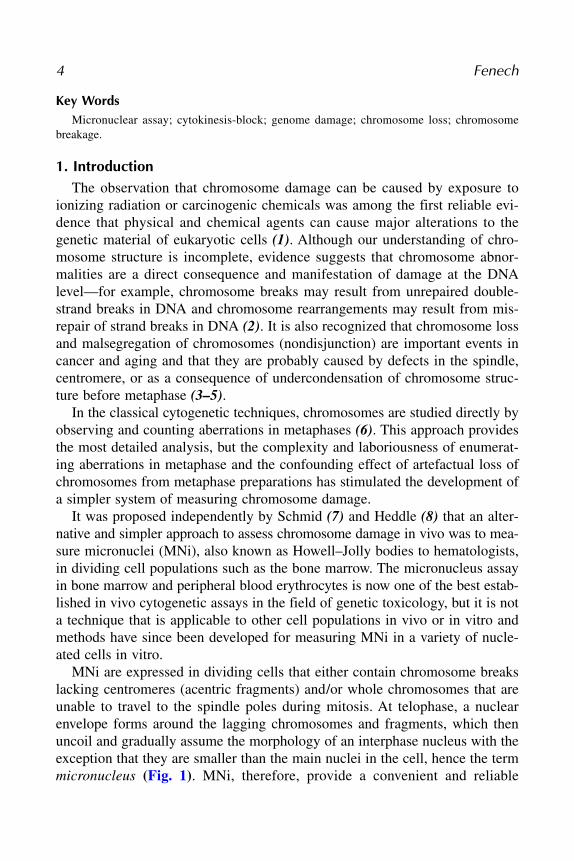
MNi are expressed in dividing cells that either contain chromosome breakslacking centromeres (acentric fragments) and/or whole chromosomes that areunable to travel to the spindle poles during mitosis. At telophase, a nuclearenvelope forms around the lagging chromosomes and fragments, which thenuncoil and gradually assume the morphology of an interphase nucleus with theexception that they are smaller than the main nuclei in the cell, hence the termmicronucleus (Fig. 1). MNi, therefore, provide a convenient and reliable
4 Fenech
index of both chromosome breakage and chromosome loss. Because MNi areexpressed in cells that have completed nuclear division, they are ideally scoredin the binucleated stage of the cell cycle (9,10). Occasionally, nucleoplasmicbridges between nuclei in a binucleated cell are observed. These are probablydicentric chromosomes in which the two centromeres were pulled to oppositepoles of the cell and the DNA in the resulting bridge covered by nuclear mem-brane (Fig. 1). Thus nucleoplasmic bridges in binucleated cells provide an addi-tional and complementary measure of chromosome rearrangement, which canbe scored together with the micronucleus count.
It is evident from the above that MNi can only be expressed in dividingeukaryotic cells. In other words, the assay cannot be used efficiently or quan-titatively in nondividing cell populations or in dividing cell populations inwhich the kinetics of cell division are not well understood or controlled. Con-sequently, there was a need to develop a method that could distinguish betweencells that are not dividing and cells that are undergoing mitosis within a cell
In Vitro Micronucleus Technique 5
Fig. 1. (A) The origin of micronuclei from lagging whole chromosomes and acen-tric chromosome fragments at anaphase. (B) The formation of a nucleoplasmic bridgefrom a dicentric chromosome in which the centromeres are pulled to opposite poles ofthe cell; the formation of a micronucleus from the accompanying acentric chromosomefragment is also illustrated. The critical role of cytochalasin-B in blocking dividingcells at the binucleate stage is also indicated in this diagram. The example shown is fora hypothetical cell with two pairs of chromosomes only.
population. Furthermore, because of the uncertainty of the fate of MNi fol-lowing more than one nuclear division, it is important to identify cells thathave completed one nuclear division only. These requirements are also neces-sary because cells divide at different rates in vivo and in vitro depending on thevarious physiological, genetic, and micronutrient conditions.
Several methods have been proposed based on stathmokinetic, flow cyto-metric, and DNA labeling approaches, but the method that has found mostfavor because of its simplicity and lack of uncertainty regarding its effect onbaseline genetic damage, is the cytokinesis-block micronucleus (CBMN) assay(9–11).
In the CBMN assay, cells that have completed one nuclear division areblocked from performing cytokinesis using cytochalasin-B (Cyt-B) and are con-sequently readily identified by their binucleated appearance (Fig. 1). Cyt-B isan inhibitor of actin polymerization required for the formation of the microfil-ament ring that constricts the cytoplasm between the daughter nuclei duringcytokinesis (12). The use of Cyt-B enables the accumulation of virtually alldividing cells at the binucleate stage in dividing cell populations, regardless oftheir degree of synchrony and the proportion of dividing cells. MNi are thenscored in binucleated cells only, which enables reliable comparisons of chro-mosome damage between cell populations that may differ in their cell divisionkinetics. The method was initially developed for use with cultured human lym-phocytes (9,10) but has now been adapted to various cell types such as solidtumor and bone marrow cells (13,14). Furthermore, new developments havealso occurred that allow (1) MNi originating from whole chromosomes to bedistinguished from MNi originating from chromosome fragments (15–20), (2)the conversion of excision-repaired sites to MNi within one cell division (21),(3) the use of molecular probes to identify nondisjunction events in binucleatedcells (22–24), and (4) the integration of necrotic and apoptotic cells within theCBMN assay (25,26).
It has recently been proposed that the micronucleus assay be used instead ofmetaphase analysis for genotoxicity testing of new chemicals. A recent specialissue of Mutation Research has been dedicated to this topic (27). The currentmethodologies and data for the in vitro micronucleus test were reviewed at theWashington International Workshop on Genotoxicity Test Procedures, whichwas held in 1999 (28).
The standard CBMN assay and its various modifications are described indetail in the next sections. The methods described are mainly applicable to cul-tured human lymphocytes; however, modifications of the assay for applicationto other cell types are included.
6 Fenech
2. Materials2.1. Cytokinesis-Block Micronucleus Assay
1. Cytochalasin-B stock solution in dimethyl sulfoxide (DMSO) (600 µg/mL).2. Ficoll Paque.3. Hank’s balanced salt solution (HBSS).4. RPMI 1640 culture medium + 10–15% heat-inactivated fetal calf serum.5. Phytohemagglutinin (PHA) (Glaxo Wellcome HA15) stock, 2.25 mg/mL (not
required for transformed cell lines or tumor cell cultures).6. Diff Quik (Lab-Aids, Australia).7. Depex (DPX) mounting medium.8. Acridine orange: 40 µg/mL in Sorensen’s phosphate buffer, pH 6.9.
2.2. Kinetochore Detection in Micronuclei1. Serum samples from scleroderma patients of the CREST subtype.2. Rabbit FITC-conjugated secondary antihuman IgG antibody.3. Peroxidase-labeled rabbit antihuman IgG.4. Diaminobenzidine (1 mg/mL in Tris-base buffer stock, 60.5 g/L, pH 7.6), 3 mL of
Tris-base buffer stock, pH 7.6 (60.5 g/L).5. NiCl2 solution: 8% solution in Tris-base buffer stock prepared immediately
before use.6. 40 µL of 0.1 M imidazole and 10 µL of 30% hydrogen peroxide solution.7. Neutral Red (0.1% in distilled water).
3. Methods3.1. Standard Cytokinesis-Block Micronucleus Assay for Isolated Human Lymphocytes
In this technique, MNi are scored only in those cells that have completed onenuclear division following PHA stimulation. These cells are recognized by theirbinucleated appearance after they are blocked from performing cytokinesis byCyt-B, which should be added before the first mitotic wave. Optimal cultureconditions should yield 35–60% or more binucleates as a proportion of viablecells (i.e., all cells excluding necrotic and apoptotic cells) at 72 h after PHAstimulation. All equipment should have biosafety features to protect the oper-ator, and solutions used in this procedure should be filter-sterilized.
3.1.1. Lymphocyte Isolation, Cell Culture, and Cell Harvesting
1. Fresh blood is collected by venipuncture in tubes with heparin as anticoagulantand stored at 22°C for less than 4 h prior to lymphocyte isolation.
2. The blood is then diluted 1�1 with isotonic (0.85%) sterile saline and gentlyinverted to mix.
In Vitro Micronucleus Technique 7
3. The diluted blood is overlaid gently on Ficoll Paque (Pharmacia) density gradientsusing a ratio of approx 1�3 (e.g., 2 mL Ficoll Paque to 6 mL of diluted blood),being very careful not to disturb the interface.
4. The gradient is then spun in a centrifuge at 400g for 25–40 min at 22°C aftercarefully balancing the tubes.
5. The lymphocyte layer at the interface of Ficoll Paque and diluted plasma iscollected with a sterile plugged Pasteur pipet and added to 3–5 times volumeof HBSS at 22°C. The resulting cell suspension is centrifuged at 280–400g for5–10 min depending on the volume.
6. The supernatant is discarded, the cells resuspended in 2–5 times volume HBSSand centrifuged at 180–400g for 5 min depending on the volume.
7. The supernatant is discarded and the cells resuspended in 1 mL RPMI 1640 cul-ture medium.
8. Cell concentration is then measured using a Coulter counter or hemocytometerand the concentration it adjusted by the percentage of viable cells measured usingtrypan blue exclusion assay.
9. The cells are resuspended in RPMI 1640 medium containing 10–15% heat-inactivated fetal calf serum at 0.5–1.0 × 10⁶ cells/mL and cultured in 0.75–1.0 mLvol in round-bottom tissue culture tubes (10-mm width).
10. Lymphocytes are then stimulated to divide by adding PHA to each culture tube at10 µL/mL and incubated at 37°C with loose lids in a humidified atmosphere con-taining 5% CO2. The concentration of PHA used has to be optimized dependingon the purity and source of the reagent to ensure maximum number of binucleatedcells after cytochalasin-B block.
11. Forty-four hours after PHA stimulation, 4.5 µg Cyt-B is added to each milliliterof culture (use gloves and fume hood): a 100-µL aliquot of Cyt-B stock solutionis thawed, 900 µL culture medium added and mixed. 75 µL of the mixture isadded to each 1 mL of culture to give a final concentration of 4.5 µg Cyt-B/mL(other laboratories have successfully used 6.0 µg Cyt-B/mL in their cultures).Culture tubes are then reincubated with loose lids.
12. Twenty-eight hours after adding Cyt-B, cells are harvested by cytocentrifugation(Shandon Elliot). One hundred microliters of the culture medium is removed with-out disturbing the cells and then cells are gently resuspended in their tubes;100–120 µL of cell suspension is transferred to cytocentrifuge cups (ShandonElliot) and centrifuged to produce two spots per slide (see Note 1). (Set the cyto-centrifuge as follows: time, 5 min; speed, 480g). Slides are removed from thecytocentrifuge and allowed to air-dry for 10–12 min only and then fixed for 10 minin absolute methanol.
13. The cells can be stained using a variety of techniques that can clearly identifynuclear and cytoplasmic boundaries. In our experience, the use of Diff Quik, acommercial ready-to-use product, provides rapid and optimal results (see Note 1).
14. After staining, the slides are air-dried and cover slips placed over the cells usingDepex (DPX) mounting medium. This procedure is carried out in the fume hood
8 Fenech
and the slides are left to set in the fume hood and then stored indefinitely untilrequired.
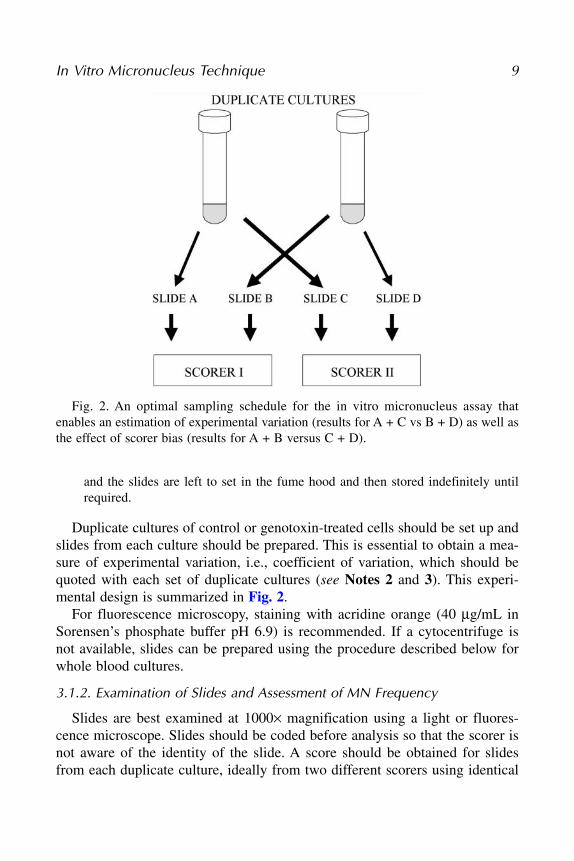
Duplicate cultures of control or genotoxin-treated cells should be set up andslides from each culture should be prepared. This is essential to obtain a mea-sure of experimental variation, i.e., coefficient of variation, which should bequoted with each set of duplicate cultures (see Notes 2 and 3). This experi-mental design is summarized in Fig. 2.
For fluorescence microscopy, staining with acridine orange (40 µg/mL inSorensen’s phosphate buffer pH 6.9) is recommended. If a cytocentrifuge isnot available, slides can be prepared using the procedure described below forwhole blood cultures.
3.1.2. Examination of Slides and Assessment of MN Frequency
Slides are best examined at 1000× magnification using a light or fluores-cence microscope. Slides should be coded before analysis so that the scorer isnot aware of the identity of the slide. A score should be obtained for slidesfrom each duplicate culture, ideally from two different scorers using identical
In Vitro Micronucleus Technique 9
Fig. 2. An optimal sampling schedule for the in vitro micronucleus assay thatenables an estimation of experimental variation (results for A + C vs B + D) as well asthe effect of scorer bias (results for A + B versus C + D).
microscopes (see Notes 4 and 5). The number of cells scored (see Note 6)should be determined depending on the level of change in the micronucleus(MN) index that the experiment is intended to detect and the expected standarddeviation of the estimate. For each slide, the following information should beobtained:
1. The number of micronuclei (MNi) in at least 1000 binucleate (BN) cells should bescored and the frequency of MNi per 1000 BN cells calculated. The criteria forscoring MNi in BN cells are detailed below.
2. The distribution of BN cells with zero, one, or more MNi; the number of MNi ina single binucleated cell normally ranges from 0 to 3 in lymphocytes of healthyindividuals but can be greater than 3 on occasion depending on genotoxin expo-sure and age.
3. The frequency of micronucleated BN cells in at least 1000 BN cells.4. The frequency of nucleoplasmic bridges in 1000 BN cells. Scoring criteria for
nucleoplasmic bridges are described below.5. The proportion of mononucleated, binucleated, trinucleated, and tetranucleated
cells per 500 cells scored. From this information the Nuclear Division Index(explained below) can be derived.
6. The number of dead or dying cells due to apoptosis or necrosis per 500 cells mayalso be scored on the same slide (scoring criteria for these cells are detailedbelow) while scoring the frequency of viable mono-, bi-, and multinucleated cells(see Note 7).
It is important to note that it is best to skip scoring a cell if one is uncertainon how to classify it. The basic elements of a typical score sheet are listed inTable 1.
3.1.3. Criteria for Selecting Binucleated Cells and Scoring Micronuclei,Nucleoplasmic Bridges, and Apoptotic and Necrotic Cells
1. Criteria for selecting binucleated cells. The cytokinesis-blocked cells that maybe scored for MN frequency should have the following characteristics:a. The cells should be binucleated.b. The two nuclei in a binucleated cell should have intact nuclear membranes and
be situated within the same cytoplasmic boundary.c. The two nuclei in a binucleated cell should be approximately equal in size,
staining pattern, and staining intensity.d. The two nuclei within a BN cell may be attached by a fine nucleoplasmic
bridge that is no wider than one-fourth the nuclear diameter.e. The two main nuclei in a BN cell may touch but ideally should not overlap
each other. A cell with two overlapping nuclei can be scored only if the nuclearboundaries of each nucleus are distinguishable.
f. The cytoplasmic boundary or membrane of a binucleated cell should be intactand clearly distinguishable from the cytoplasmic boundary of adjacent cells.
10 Fenech
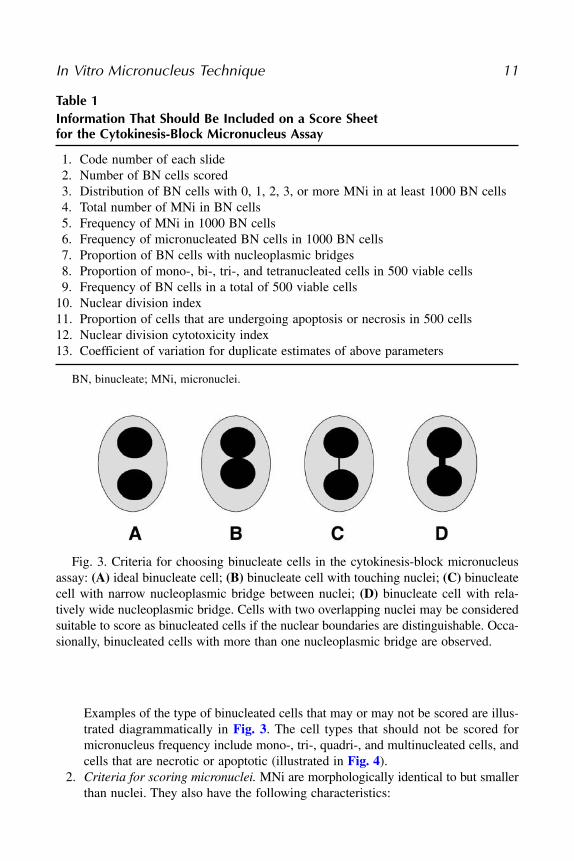
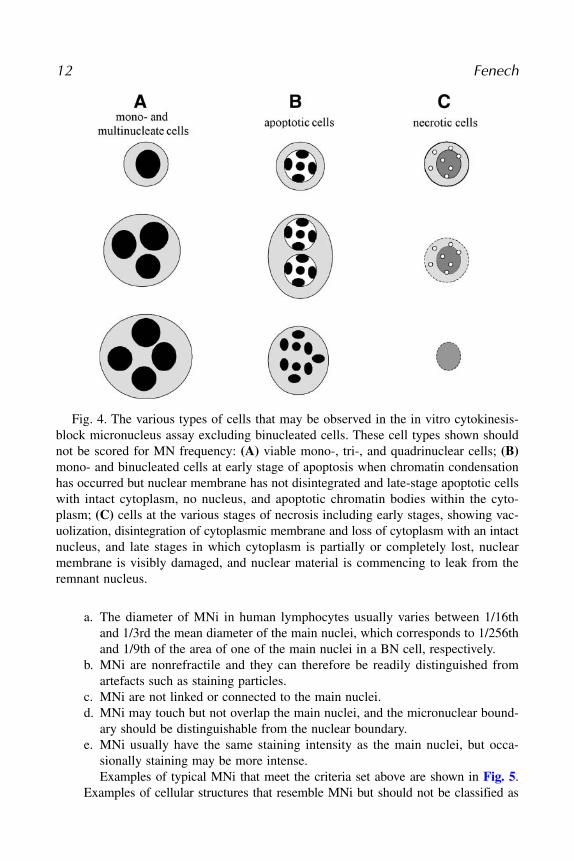
Examples of the type of binucleated cells that may or may not be scored are illus-trated diagrammatically in Fig. 3. The cell types that should not be scored formicronucleus frequency include mono-, tri-, quadri-, and multinucleated cells, andcells that are necrotic or apoptotic (illustrated in Fig. 4).
2. Criteria for scoring micronuclei. MNi are morphologically identical to but smallerthan nuclei. They also have the following characteristics:
In Vitro Micronucleus Technique 11
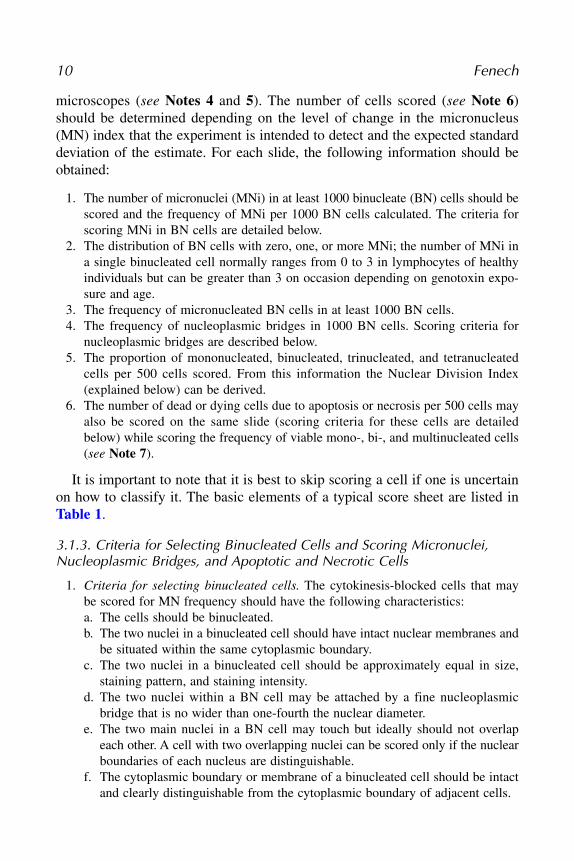
Table 1Information That Should Be Included on a Score Sheet for the Cytokinesis-Block Micronucleus Assay
1. Code number of each slide2. Number of BN cells scored3. Distribution of BN cells with 0, 1, 2, 3, or more MNi in at least 1000 BN cells4. Total number of MNi in BN cells5. Frequency of MNi in 1000 BN cells6. Frequency of micronucleated BN cells in 1000 BN cells7. Proportion of BN cells with nucleoplasmic bridges8. Proportion of mono-, bi-, tri-, and tetranucleated cells in 500 viable cells9. Frequency of BN cells in a total of 500 viable cells
10. Nuclear division index 11. Proportion of cells that are undergoing apoptosis or necrosis in 500 cells12. Nuclear division cytotoxicity index13. Coefficient of variation for duplicate estimates of above parameters
BN, binucleate; MNi, micronuclei.
Fig. 3. Criteria for choosing binucleate cells in the cytokinesis-block micronucleusassay: (A) ideal binucleate cell; (B) binucleate cell with touching nuclei; (C) binucleatecell with narrow nucleoplasmic bridge between nuclei; (D) binucleate cell with rela-tively wide nucleoplasmic bridge. Cells with two overlapping nuclei may be consideredsuitable to score as binucleated cells if the nuclear boundaries are distinguishable. Occa-sionally, binucleated cells with more than one nucleoplasmic bridge are observed.
a. The diameter of MNi in human lymphocytes usually varies between 1/16thand 1/3rd the mean diameter of the main nuclei, which corresponds to 1/256thand 1/9th of the area of one of the main nuclei in a BN cell, respectively.
b. MNi are nonrefractile and they can therefore be readily distinguished fromartefacts such as staining particles.
c. MNi are not linked or connected to the main nuclei.d. MNi may touch but not overlap the main nuclei, and the micronuclear bound-
ary should be distinguishable from the nuclear boundary.e. MNi usually have the same staining intensity as the main nuclei, but occa-
sionally staining may be more intense.Examples of typical MNi that meet the criteria set above are shown in Fig. 5.
Examples of cellular structures that resemble MNi but should not be classified as
12 Fenech
Fig. 4. The various types of cells that may be observed in the in vitro cytokinesis-block micronucleus assay excluding binucleated cells. These cell types shown shouldnot be scored for MN frequency: (A) viable mono-, tri-, and quadrinuclear cells; (B)mono- and binucleated cells at early stage of apoptosis when chromatin condensationhas occurred but nuclear membrane has not disintegrated and late-stage apoptotic cellswith intact cytoplasm, no nucleus, and apoptotic chromatin bodies within the cyto-plasm; (C) cells at the various stages of necrosis including early stages, showing vac-uolization, disintegration of cytoplasmic membrane and loss of cytoplasm with an intactnucleus, and late stages in which cytoplasm is partially or completely lost, nuclearmembrane is visibly damaged, and nuclear material is commencing to leak from theremnant nucleus.
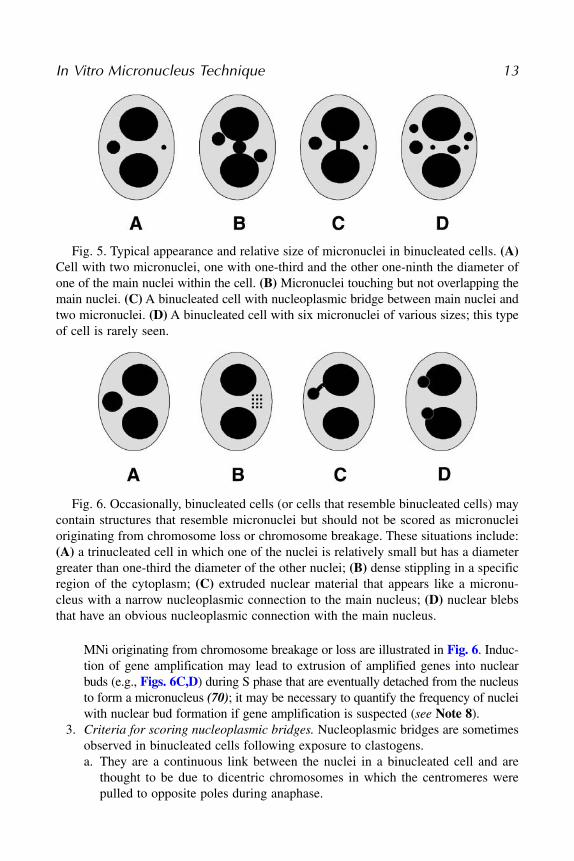
MNi originating from chromosome breakage or loss are illustrated in Fig. 6. Induc-tion of gene amplification may lead to extrusion of amplified genes into nuclearbuds (e.g., Figs. 6C,D) during S phase that are eventually detached from the nucleusto form a micronucleus (70); it may be necessary to quantify the frequency of nucleiwith nuclear bud formation if gene amplification is suspected (see Note 8).
3. Criteria for scoring nucleoplasmic bridges. Nucleoplasmic bridges are sometimesobserved in binucleated cells following exposure to clastogens.a. They are a continuous link between the nuclei in a binucleated cell and are
thought to be due to dicentric chromosomes in which the centromeres werepulled to opposite poles during anaphase.
In Vitro Micronucleus Technique 13
Fig. 5. Typical appearance and relative size of micronuclei in binucleated cells. (A)Cell with two micronuclei, one with one-third and the other one-ninth the diameter ofone of the main nuclei within the cell. (B) Micronuclei touching but not overlapping themain nuclei. (C) A binucleated cell with nucleoplasmic bridge between main nuclei andtwo micronuclei. (D) A binucleated cell with six micronuclei of various sizes; this typeof cell is rarely seen.
Fig. 6. Occasionally, binucleated cells (or cells that resemble binucleated cells) maycontain structures that resemble micronuclei but should not be scored as micronucleioriginating from chromosome loss or chromosome breakage. These situations include:(A) a trinucleated cell in which one of the nuclei is relatively small but has a diametergreater than one-third the diameter of the other nuclei; (B) dense stippling in a specificregion of the cytoplasm; (C) extruded nuclear material that appears like a micronu-cleus with a narrow nucleoplasmic connection to the main nucleus; (D) nuclear blebsthat have an obvious nucleoplasmic connection with the main nucleus.
b. The width of a nucleoplasmic bridge may vary considerably but usually doesnot exceed one-fourth of the diameter of the nuclei within the cell.
c. The nucleoplasmic bridge should have the same staining characteristics of themain nuclei.
d. On very rare occasions, more than one nucleoplasmic bridge may be observedwithin one binucleated cell. A binucleated cell with a nucleoplasmic bridgeoften contains one or more micronuclei. Examples of binucleated cells withnucleoplasmic bridges are illustrated in Figs. 1 and 5 (see Note 9).
4. Criteria for scoring apoptotic and necrotic cells. Figure 7 describes the variouspathways and events that may be expected to occur in cultured lymphocytesexposed to a toxic agent. Cytogenetic genotoxicity assays that require hypotonictreatment for the preparation of interphase cells (for whole-blood micronucleusassay) or metaphase plates for chromosome analysis are not usable for cytotoxi-city assays because hypotonic treatment may destroy necrotic cells and apoptoticcells, making them unavailable for assay. Inclusion of necrosis and apoptosis isimportant for the accurate description of mechanism of action and measurementof cellular sensitivity to a chemical or radiation. Isolated lymphocyte culture assayor culture of cell lines does not require hypotonic treatment of cells for slidepreparation, thus making it is possible to preserve the morphology of both necroticand apoptotic cells. The use of cytochalasin-B should make it easier to score apop-totic cells because it is expected to inhibit the disintegration of apoptotic cellsinto smaller apoptotic bodies. The latter process requires microfilament assem-bly (29) which is readily inhibited by cytochalasin-B (12).
The following guidelines for scoring necrotic and apoptotic cells arerecommended:a. Cells showing chromatin condensation with intact cytoplasmic and nuclear
boundaries or cells exhibiting nuclear fragmentation into smaller nuclear bodieswithin an intact cytoplasm/cytoplasmic membrane are classified as apoptotic.
b. Cells exhibiting a pale cytoplasm with numerous vacuoles and damagedcytoplasmic membrane with a fairly intact nucleus or cells exhibiting lossof cytoplasm and damaged/irregular nuclear membrane with a partially intactnuclear structure are classified as necrotic. These criteria and results for thesemeasures with hydrogen peroxide have been recently reported elsewhere (26).
Figures 4 and 7 illustrate typical examples of necrotic and apoptotic cells.
3.1.4. Calculation of Nuclear Division Index (NDI) and Nuclear Division Cytotoxicity Index (NDCI)
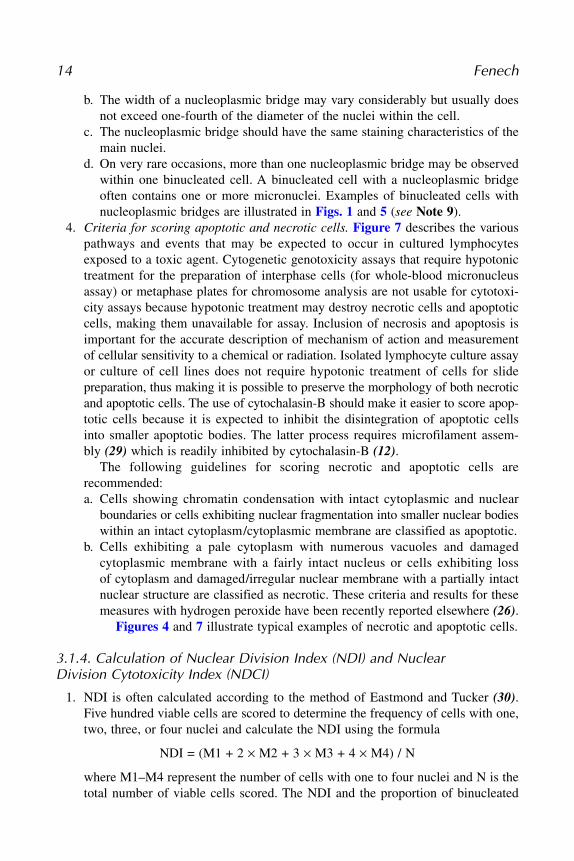
1. NDI is often calculated according to the method of Eastmond and Tucker (30).Five hundred viable cells are scored to determine the frequency of cells with one,two, three, or four nuclei and calculate the NDI using the formula
NDI = (M1 + 2 × M2 + 3 × M3 + 4 × M4) / N
where M1–M4 represent the number of cells with one to four nuclei and N is thetotal number of viable cells scored. The NDI and the proportion of binucleated
14 Fenech
cells are useful parameters for comparing the mitogenic response of lymphocytesand cytostatic effects of agents examined in the assay.
2. A more accurate assessment of nuclear division status is obtained if necrotic andapoptotic cells are included in the total number of cells scored, because at higher
In Vitro Micronucleus Technique 15
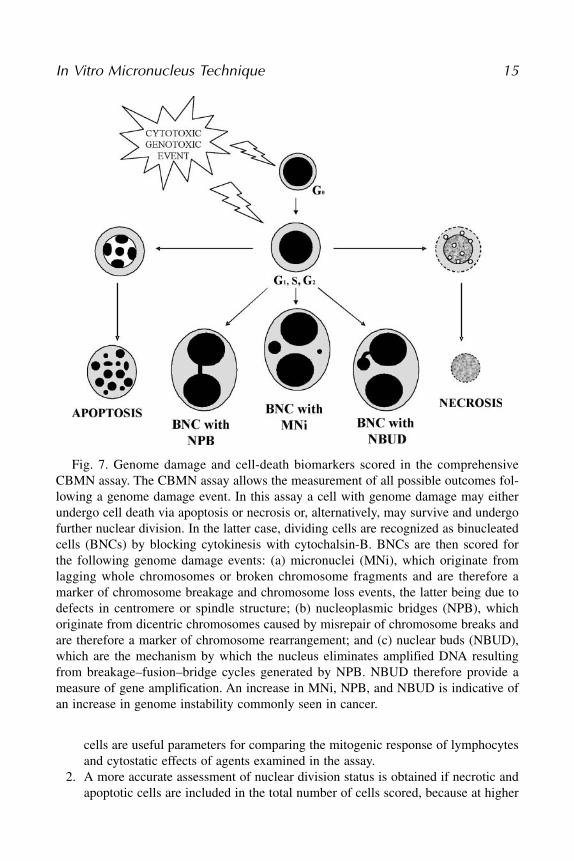
Fig. 7. Genome damage and cell-death biomarkers scored in the comprehensiveCBMN assay. The CBMN assay allows the measurement of all possible outcomes fol-lowing a genome damage event. In this assay a cell with genome damage may eitherundergo cell death via apoptosis or necrosis or, alternatively, may survive and undergofurther nuclear division. In the latter case, dividing cells are recognized as binucleatedcells (BNCs) by blocking cytokinesis with cytochalsin-B. BNCs are then scored forthe following genome damage events: (a) micronuclei (MNi), which originate fromlagging whole chromosomes or broken chromosome fragments and are therefore amarker of chromosome breakage and chromosome loss events, the latter being due todefects in centromere or spindle structure; (b) nucleoplasmic bridges (NPB), whichoriginate from dicentric chromosomes caused by misrepair of chromosome breaks andare therefore a marker of chromosome rearrangement; and (c) nuclear buds (NBUD),which are the mechanism by which the nucleus eliminates amplified DNA resultingfrom breakage–fusion–bridge cycles generated by NPB. NBUD therefore provide ameasure of gene amplification. An increase in MNi, NPB, and NBUD is indicative ofan increase in genome instability commonly seen in cancer.
toxic doses of chemicals tested one can expect a very large proportion of cells tobecome nonviable. It is therefore important to note that both binucleate ratio andthe NDI are overestimated if necrotic and apoptotic cells are not included whenscoring cells.
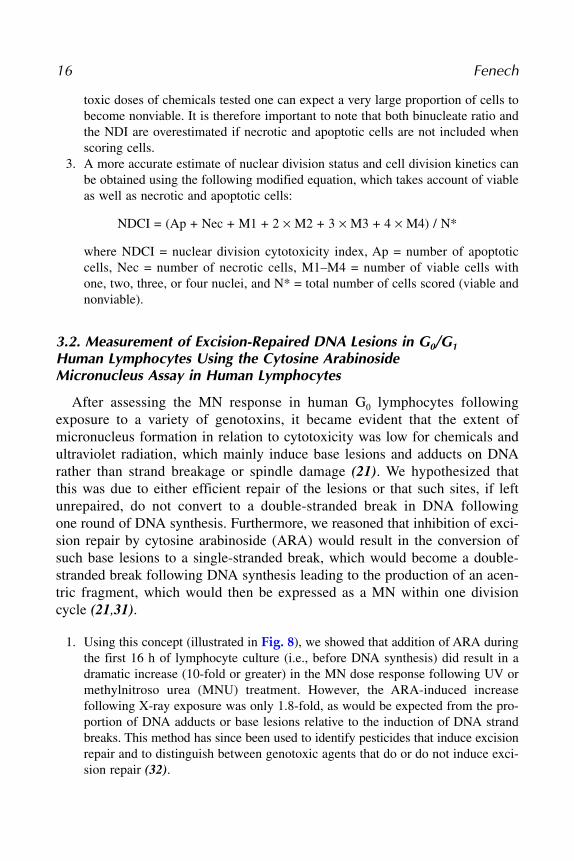
3. A more accurate estimate of nuclear division status and cell division kinetics canbe obtained using the following modified equation, which takes account of viableas well as necrotic and apoptotic cells:
NDCI = (Ap + Nec + M1 + 2 × M2 + 3 × M3 + 4 × M4) / N*
where NDCI = nuclear division cytotoxicity index, Ap = number of apoptoticcells, Nec = number of necrotic cells, M1–M4 = number of viable cells withone, two, three, or four nuclei, and N* = total number of cells scored (viable andnonviable).
3.2. Measurement of Excision-Repaired DNA Lesions in G0/G1Human Lymphocytes Using the Cytosine Arabinoside Micronucleus Assay in Human Lymphocytes
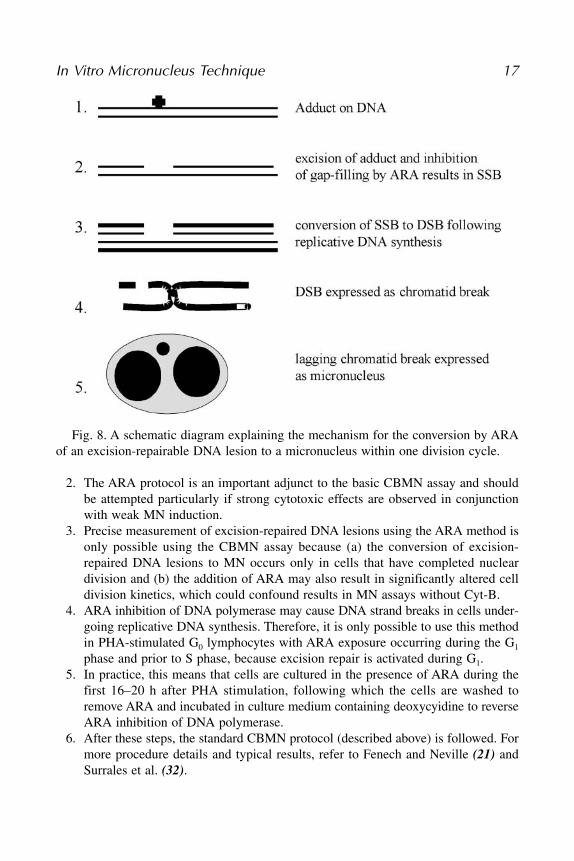
After assessing the MN response in human G0 lymphocytes followingexposure to a variety of genotoxins, it became evident that the extent ofmicronucleus formation in relation to cytotoxicity was low for chemicals andultraviolet radiation, which mainly induce base lesions and adducts on DNArather than strand breakage or spindle damage (21). We hypothesized thatthis was due to either efficient repair of the lesions or that such sites, if leftunrepaired, do not convert to a double-stranded break in DNA followingone round of DNA synthesis. Furthermore, we reasoned that inhibition of exci-sion repair by cytosine arabinoside (ARA) would result in the conversion ofsuch base lesions to a single-stranded break, which would become a double-stranded break following DNA synthesis leading to the production of an acen-tric fragment, which would then be expressed as a MN within one divisioncycle (21,31).
1. Using this concept (illustrated in Fig. 8), we showed that addition of ARA duringthe first 16 h of lymphocyte culture (i.e., before DNA synthesis) did result in adramatic increase (10-fold or greater) in the MN dose response following UV ormethylnitroso urea (MNU) treatment. However, the ARA-induced increasefollowing X-ray exposure was only 1.8-fold, as would be expected from the pro-portion of DNA adducts or base lesions relative to the induction of DNA strandbreaks. This method has since been used to identify pesticides that induce excisionrepair and to distinguish between genotoxic agents that do or do not induce exci-sion repair (32).
16 Fenech
2. The ARA protocol is an important adjunct to the basic CBMN assay and shouldbe attempted particularly if strong cytotoxic effects are observed in conjunctionwith weak MN induction.
3. Precise measurement of excision-repaired DNA lesions using the ARA method isonly possible using the CBMN assay because (a) the conversion of excision-repaired DNA lesions to MN occurs only in cells that have completed nucleardivision and (b) the addition of ARA may also result in significantly altered celldivision kinetics, which could confound results in MN assays without Cyt-B.
4. ARA inhibition of DNA polymerase may cause DNA strand breaks in cells under-going replicative DNA synthesis. Therefore, it is only possible to use this methodin PHA-stimulated G0 lymphocytes with ARA exposure occurring during the G1
phase and prior to S phase, because excision repair is activated during G1.5. In practice, this means that cells are cultured in the presence of ARA during the
first 16–20 h after PHA stimulation, following which the cells are washed toremove ARA and incubated in culture medium containing deoxycyidine to reverseARA inhibition of DNA polymerase.
6. After these steps, the standard CBMN protocol (described above) is followed. Formore procedure details and typical results, refer to Fenech and Neville (21) andSurrales et al. (32).
In Vitro Micronucleus Technique 17
Fig. 8. A schematic diagram explaining the mechanism for the conversion by ARAof an excision-repairable DNA lesion to a micronucleus within one division cycle.
3.3. CBMN Assay in Other Cell Culture Systems
3.3.1. Whole Blood Cultures for Human Lymphocytes
1. The CBMN assay in human lymphocytes can also be performed using whole-blood cultures.
2. Typically, 0.4–0.5 mL of whole blood is added to 4.5 mL of culture medium (e.g.,RPMI 1640) supplemented with fetal calf serum containing L-glutamine, antibi-otics (optional), and PHA.
3. Cyt-B is added at 44 h post-PHA stimulation. The recommended optimal con-centration of Cyt-B for accumulating binucleated cells in whole blood cultures is6 µg/mL (33).
4. The binucleated lymphocytes are harvested 28 h after adding Cyt-B as follows:5. The cells are centrifuged gently (300g) for 5 min and the supernatant culture
medium is removed.6. The cells are hypotonically treated with 7 mL cold (4°C) 0.075 M KCl to lyse red
blood cells and centrifuged immediately (300g) for 8 min.7. The supernatant is removed and replaced with 5 mL fixative consisting of
methanol/acetic acid (3/1) (the fixative should be added while agitating the cellsto prevent clumps forming).
8. The cells are then centrifuged again at 300g for 8 min and washed with two fur-ther changes of fixative.
9. The cells are resuspended gently, and the suspension is dropped onto clean glassslides and allowed to dry.
As an alternative, it is also possible to isolate the binucleated lymphocytesdirectly from the whole-blood culture using Ficoll gradients and then transfercells to slides by cytocentrifugation prior to fixation and staining (unpublishedobservation), which precludes the requirement for hypotonic treatment and enablesoptimal preservation of the cytoplasm.
10. Staining of cells can be done using either 10% Giemsa in potassium phosphatebuffer (pH 7.3) for light microscopy or acridine orange (10 µg/mL in phosphate-buffered saline, pH 6.9) for fluorescence microscopy).
3.3.2 Murine Lymphocyte Cultures
1. Lymphocytes are isolated either from the spleen or peripheral blood and culturedaccording to the procedures described by Fenech et al. (34).
2. Because murine lymphocytes have shorter cell division cycles than human lym-phocytes, it is essential to add Cyt-B no later than 18 h after stimulation by mito-gen and to harvest the cells 20 h later. Depending on the culture conditions, it ispossible to obtain good binucleate ratios even at 72 h post-mitogen stimulation.
3.3.3. Other Primary Cell Cultures, Including Tumor Cell Cultures
The CBMN assay can be readily adapted to other primary cell types toassess DNA damage induced in vitro, in vivo, or ex vivo. The most importantpoints to remember are (a) to ensure that MNi are scored in the first nuclear
18 Fenech
division following the genotoxic insult and (b) to perform preliminary experi-ments to determine the concentration of Cyt-B and incubation time at which themaximum number of dividing cells will be blocked at the binucleate stage (seeNote 10). It is also important to remember that Cyt-B may take up to 6 h beforeit starts to exert its cytokinesis-blocking action (unpublished observation).
1. When using established or primary cell lines from dividing cell populations, it isusual to add Cyt-B shortly after exposure to genotoxin to capture all cells under-going their first nuclear division as binucleated cells—this usually requires anincubation period of about 24–48 h, depending on the cell cycle time, before har-vesting the cells.
2. Attached cells can be trypsinized and then prepared by cytocentrifugation asdescribed for human lymphocytes. Specific methods have been described for usewith nucleated bone marrow cells (14), lung fibroblasts (35), skin keratinocytes(36) and primary tumor cell cultures (13).
3. It is generally more practical to assess in vivo induction of micronuclei by block-ing cytokinesis in dividing cells after the cells have been isolated from the animaland placed in culture medium in the presence of Cyt-B; this approach has provento be successful with a variety of cell types, including fibroblasts, keratinocytes,and nucleated bone marrow cells.
3.4. Micronucleus Assay in Cell Lines or Cultured Tumor Cells with or without Cytokinesis Block
1. There is some debate that Cyt-B, used to accumulate binucleated cells, may inter-fere with the expression of MN (28). Studies with normal cells do not show aninduction of MNi by Cyt-B or a dose–response effect of Cyt-B with MN fre-quency in binucleated cells at doses that are usually used to block cells in cytoki-nesis (10,37–39). A recent study suggests that MN expression induced by spindlepoisons may be less than expected in the cytokinesis-blocked BN cells because ofpole-to-pole distance shortening, which may increase the probability of reinclu-sion of lagging chromosome fragments or whole chromosomes back into anucleus, but this did not diminish the effectiveness of the CBMN assay (40).
2. There has been an increased interest in exploring further the possibility of per-forming the in vitro MN assay without Cyt-B to minimize the possible con-founding effect of Cyt-B while running the potential risk of obtaining a falsenegative result because of inadequate control of cell division kinetics; i.e., inhibi-tion of nuclear division inhibits micronucleus expression.
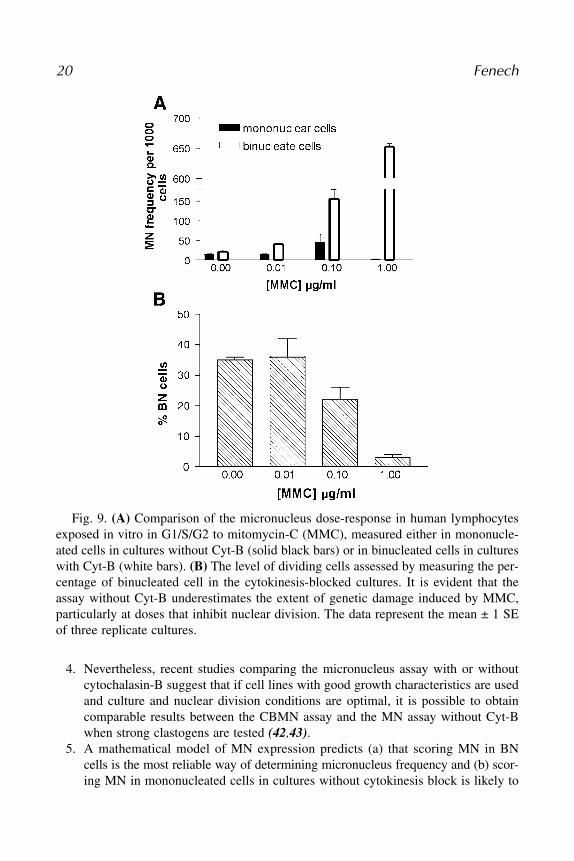
3. While the evidence of obtaining a false positive result with the CBMN assay innormal cells is lacking, there is already adequate evidence that performing theMN assay in a manner that does not account for inhibition of nuclear divisioncan lead to false negative results or an underestimate of MN induction in humanlymphocyte cultures (10,11,41), and an example of this defect of MN assays with-out Cyt-B is shown in Fig. 9.
In Vitro Micronucleus Technique 19
4. Nevertheless, recent studies comparing the micronucleus assay with or withoutcytochalasin-B suggest that if cell lines with good growth characteristics are usedand culture and nuclear division conditions are optimal, it is possible to obtaincomparable results between the CBMN assay and the MN assay without Cyt-Bwhen strong clastogens are tested (42,43).
5. A mathematical model of MN expression predicts (a) that scoring MN in BNcells is the most reliable way of determining micronucleus frequency and (b) scor-ing MN in mononucleated cells in cultures without cytokinesis block is likely to
20 Fenech
Fig. 9. (A) Comparison of the micronucleus dose-response in human lymphocytesexposed in vitro in G1/S/G2 to mitomycin-C (MMC), measured either in mononucle-ated cells in cultures without Cyt-B (solid black bars) or in binucleated cells in cultureswith Cyt-B (white bars). (B) The level of dividing cells assessed by measuring the per-centage of binucleated cell in the cytokinesis-blocked cultures. It is evident that theassay without Cyt-B underestimates the extent of genetic damage induced by MMC,particularly at doses that inhibit nuclear division. The data represent the mean ± 1 SEof three replicate cultures.
generate false negative results when nuclear division is significantly inhibited bythe chemical tested or the culture conditions do not allow an optimal number ofdividing cells (44).
6. Consequently, results for micronucleus frequency obtained by scoring micronucleiin mononucleated cells in cultures without Cyt-B cannot be considered conclusive,and a negative result with this system should be confirmed using the CBMN assay.
3.5. Molecular Techniques for Measuring Chromosome Loss in Micronuclei and Nondisjunction
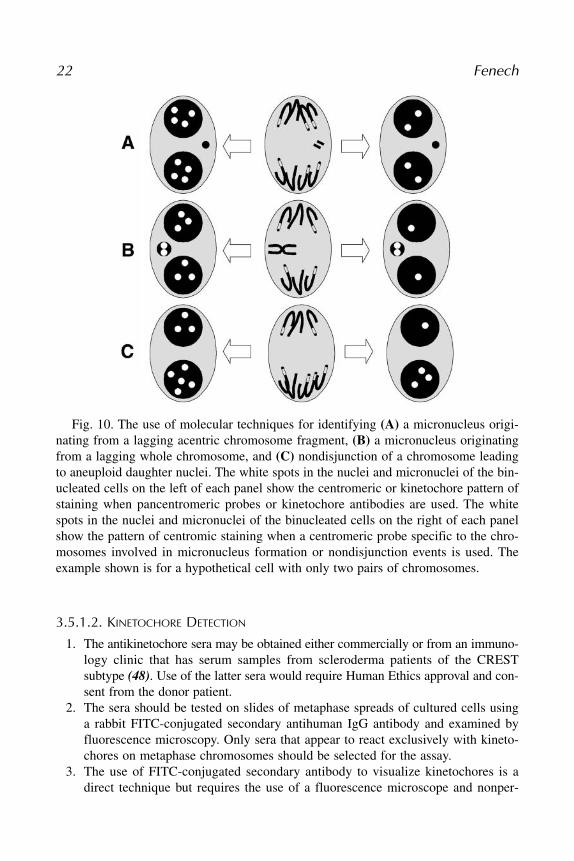
To take full advantage of the ability of the CBMN assay, it is essential to dis-tinguish between MNi originating from whole chromosomes and acentric frag-ments. This is best achieved by using probes that are specific for thecentromeric DNA or antibodies that bind to the kinetochore proteins that areassembled at the centromeric regions of active chromosomes. The use of MNsize as a discriminant is not recommended for human cells or other cell typesin which the size of chromosomes is heterogenous, because a small MN maycontain either a fragment of a large chromosome or a whole small chromo-some. The simplest and least expensive technique to use is the antikinetochoreantibody method (45), but this approach does not distinguish between uniquechromosomes and may not detect chromosome loss occurring due to absence ofkinetochores on inactive centromeres (46). The use of in situ hybridization(ISH) to identify centromeric regions is more expensive and laborious, but itcan provide greater specificity; for example, centromeric probes for uniquechromosomes can be used, which also enables the detection of nondisjunc-tional events (i.e., unequal distribution of homologous chromosomes in daugh-ter nuclei) in binucleated cells (17). In this chapter, only the kinetochoreantibody method will be described. For details on the use of centromere detec-tion by ISH, refer to the papers by Farooqi et al. (17), Hando et al. (18), Eha-jouji et al. (23,47), and Schuler et al. (24). The types of results that can beexpected with the various techniques are illustrated in Fig. 10.
3.5.1. Kinetochore Detection in MNi in the CBMN Assay
3.5.1.1. SLIDE PREPARATION
1. In this technique, BN cells are accumulated as described in the standard CBMNassay, transferred to a slide using a cytocentrifuge, air-dried for 5 min, fixed inmethanol for 10 min, and air-dried again.
2. At this stage, slides may either be processed immediately or stored for a maxi-mum of 3 mo in a sealed desiccated box in a nitrogen atmosphere above liquidnitrogen.
3. For detection of kinetochores, the stored slides are removed from the nitrogenatmosphere and allowed to equilibrate at room temperature within the sealed box.
In Vitro Micronucleus Technique 21
3.5.1.2. KINETOCHORE DETECTION
1. The antikinetochore sera may be obtained either commercially or from an immuno-logy clinic that has serum samples from scleroderma patients of the CRESTsubtype (48). Use of the latter sera would require Human Ethics approval and con-sent from the donor patient.
2. The sera should be tested on slides of metaphase spreads of cultured cells usinga rabbit FITC-conjugated secondary antihuman IgG antibody and examined byfluorescence microscopy. Only sera that appear to react exclusively with kineto-chores on metaphase chromosomes should be selected for the assay.
3. The use of FITC-conjugated secondary antibody to visualize kinetochores is adirect technique but requires the use of a fluorescence microscope and nonper-
22 Fenech
Fig. 10. The use of molecular techniques for identifying (A) a micronucleus origi-nating from a lagging acentric chromosome fragment, (B) a micronucleus originatingfrom a lagging whole chromosome, and (C) nondisjunction of a chromosome leadingto aneuploid daughter nuclei. The white spots in the nuclei and micronuclei of the bin-ucleated cells on the left of each panel show the centromeric or kinetochore pattern ofstaining when pancentromeric probes or kinetochore antibodies are used. The whitespots in the nuclei and micronuclei of the binucleated cells on the right of each panelshow the pattern of centromic staining when a centromeric probe specific to the chro-mosomes involved in micronucleus formation or nondisjunction events is used. Theexample shown is for a hypothetical cell with only two pairs of chromosomes.
manent slide preparations; the fluorescence technique has been described in detailelsewhere (45). An alternative procedure is to use an immunoperoxidase stainingmethod that allows permanent slide preparations to be obtained (49), which ismore practical for routine screening and is described in the next paragraph.
4. In the immunoperoxidase technique, fixed slides are incubated overnight at 20°Cin a humidity chamber with the primary antikinetochore antibody diluted 1/40 inTris-saline buffer, pH 7.6 (6.0 g Tris-base/L saline).
5. Negative control slides are exposed to the diluted serum of a normal healthyindividual.
6. The following day, the slides are washed by dipping for 30 s in the sameTris-saline buffer used to dilute the antibody.
7. Slides are then drained without drying, and incubated for 3 h with peroxidase-labeled rabbit antihuman IgG.
8. Again, slides are then drained without drying in preparation for the peroxidasehistochemical reaction.
9. The histochemical method that gives best contrast is the nickel chloride/imida-zole modification of the standard diaminobenzidine (DAB) reaction, which pro-duces a black precipitate (50,51).
10. The DAB reaction mixture is prepared just before use and applied immediately toslides through a 0.22-µm filter to minimize nonspecific precipitation on the slides.
11. Slides should be stained in batches, including a slide with the negative controlserum.
12. The reaction is allowed to proceed for 1 min at 20°C and then stopped by drain-ing the slides and rinsing in water.
13. The slides are then air-dried, counterstained with the nuclear stain Neutral Red(0.1% in distilled water) for 30 s, washed in water, air-dried, and mounted to givepermanent preparations.
3.5.1.3. SCORING PROCEDURE
1. Scoring of kinetochore status of MNi is restricted to those binucleated cells inwhich a minimium of 20 kinetochores within each nucleus is observed.
2. A minimum of 100 MNi should be classified according to whether they containkinetochores or not, and the number of kinetochores within each MN should benoted.
3. The final value for the proportion of MNi with kinetochores is determined by theformula [Ps – Pc] / [1 – Pc], where Pc is the proportion of MNi that has a positiveperoxidase reaction in slides exposed to normal control serum and Ps is the pro-portion of MNi that have a positive peroxidase reaction in slides exposed toantikinetochore serum.
3.6. Treatment Schedules for in Vitro Chemosensitivity Testing1. Ideally, each chemical should be tested for its genotoxic potential at the various
stages of the cell cycle. Because human peripheral blood lymphocytes are in theG0 phase when collected, they are ideal for assessing damage at this stage.
In Vitro Micronucleus Technique 23
2. However, cells are expected to be more sensitive to genotoxic effects duringS phase, G2 phase, and M phase, and for this purpose it is essential to expose cellcultures when most cells are dividing. Because MN expression requires onenuclear division to be completed, the period between treatment and harvest timehas to allow for this.
3. With human peripheral blood lymphocytes treated in G0, it is necessary to accu-mulate binucleated cells as early as possible and for as long as possible, to ensurethat even cells experiencing mitotic delay are examined. Typically, the standardprotocol of adding Cyt-B at 44 h and harvesting cells at 72 h should suffice forthis purpose. However, it is equally practical to add Cyt-B at 24 h and harvestcells at 96 h, which may maximize the number of late-dividing cells available foranalysis.
4. If treatment of cells in S, G2, and M phases is required, as would be the case withtumor cell cultures, then exposure to the chemical should occur during logarithmicgrowth phase of the culture, followed shortly afterwards with cytochalasin-B toaccumulate dividing cells, and cells are then harvested between 6 and 24 h later,depending on the stage of the cell cycle that is being examined.
5. At the very early harvest times, mainly cells exposed in G2 or late S phase areaccumulated as binucleated cells, while at the later harvest time cells exposed inall stages of the cell cycle are blocked in the binucleate stage. Thus the harvesttime relative to Cyt-B addition would affect the type of cell examined.
6. Typical schedules for use of the CBMN assay for in vitro genotoxicity testing aresummarized in Table 2.
7. The use of a metabolic activation system such as S9 mix should be considered asan option when testing new chemicals, but this could limit the exposure periodbecause of the possible cytotoxicity of S9 to the target cells. A better option maybe the use of metabolically competent cells such as genetically modified MCL-5cells (52).
3.7. Future Developments
It is evident that the in vitro micronucleus assay has evolved into a robustassay for genetic damage with applications in ecotoxicology (53), nutrition(54), radiation sensitivity testing both for cancer risk assessment (55) and opti-mization of radiotherapy (13,56), biomonitoring of human populations (57),and importantly, testing of new pharmaceuticals and agrichemicals (27,28).There is little doubt that there is a need for an automated scoring system forquicker and more reliable data acquisition, which would ideally be based on thescoring of slides also prepared for visual scoring—this should enable consistentresults to be obtained that are not influenced by the interindividual and tempo-ral variability of human scorers. For this goal to be achieved it is essential thatscoring criteria are well developed and that a robust slide preparation protocolbe put in place and that slide preparations be permanent so that they can bereexamined visually if necessary. Currently, image analysis systems have been
24 Fenech

developed for automated scoring of micronuclei in mammalian cells (58–62),but these systems do not take account of other important events such as necro-sis, apoptosis, and cytostasis, which are essential for the correct interpretationof the result obtained (26). In the future we should expect to have an auto-mated system that can score reliably the various end points possible with thecytokinesis-block micronucleus assay outlined in this chapter.
Finally, it is also essential to keep abreast of more recent developments inour understanding of micronucleus formation and events that may alter expres-sion of this end point. Some notable examples are (a) the formation of micronu-clei as a result of gene amplification in which the cell eliminates excessamplified DNA directly from the nucleus, during S phase, into a micronucleus
In Vitro Micronucleus Technique 25
Table 2Typical Protocols Used for Testing Micronucleus Inducion by a Chemical or Radiation
Cell lines in Peripheral blood human lymphocytes log phasea
CBMNCBMN CBMN CBMN assay CBMN/ARA assay
Culture assay G0 assay G1/S G1/S/G2/M assay, G0 G1/S/G2/Mtime (h) exposure exposure exposure exposure exposure
–4 Add test agent Add test agent Add test agent10 Add PHA Add PHA Add PHA (1) Add PHA Add Cyt-B
(2) Add ARA16 (1) wash out
ARA(2) fresh
medium withIL-2 and DC
20 Add test agent24 Harvest cells44 Add Cyt-Bb Add Cyt-Bb Add test agent Add Cyt-Bb Harvest cells48 Add Cyt-B72 Harvest cells Harvest cells Harvest cells Harvest cells96 Harvest cells Harvest cells Harvest cells Harvest cells
The proposed protocols assume that the test agent is retained in the culture medium even afterCyt-B is added. However, it may also be desirable to remove test chemical by replacing culturemedium (1) after a brief exposure period to test chemical or (2) just prior to addition of Cyt-B. Inthe latter case, IL-2 should be added to fresh medium for lymphocyte cultures. ARA = cytosinearabinoside; Cyt-B = cytochalasin-B; DC = deoxycytidine; IL-2 = interleukin-2; PHA = phyto-hemagglutinin. aThis treatment schedule is most appropriate for testing chemosensitivity in tumorcell cultures. bAlternatively, Cyt-B could be added at 24 h.
produced by nuclear budding (63,64); (b) the use of the cytokinesis-blockmicronucleus assay to measure breakage–fusion–bridge cycles that are the oneof the hallmarks of genomic instability in preneoplastic cells and folate defi-cient cells (64,65), (c) the observation that treatment with specific mitotic spin-dle inhibitors may cause mitotic slippage leading to polyploid nuclei andmicronuclei and therefore implicating that it may be useful to score not onlyMNi in binucleated cells but also MNi in mononucleated cells in cytokinesis-blocked cultures (47), and (d) the possible elimination of micronucleatedcells and micronuclei by apoptosis (66,67). Furthermore, scoring criteria inthe cytokinesis-block micronucleus assay are continually being reviewed aspart of the activity of the HUMN project (www.humn.org), and a more compre-hensive and recommended description of scoring criteria with photomicro-graphs has been published recently (68).
All of the above points to the fact that the full potential of the in vitrocytokinesis-block micronucleus assay is readily achievable once all the mor-phological end points of cytotoxicity, cytostasis, and DNA damage are inte-grated into the system.
4. Notes1. In our experience, most of the problems in the CBMN assay arise during slide
preparation and staining. This is because the quality of the score depends on thequality of the slide. Main points to note: (a) avoid cell clumps by gently resus-pending cells prior to harvest and transfer to slides; (b) maintain a moderate celldensity so that it is relatively easy to identify cytoplasmic boundaries; (c) stain onlyone slide initially, to ensure that staining is optimal before staining the whole batch.
2. The use of duplicate cultures is critical for producing robust results also becauseit allows the measurement of the intraexperimental coefficient of variation. Cyto-genetic assays should be subject to the same rigor as analytical assays, which typ-ically reject duplicate results with a CV greater than 10%. Because of the visualscoring, greater latitude in the acceptable CV is understandable. In our experi-ence and the results of international interlaboratory scoring comparison (69), CVsgreater than 40% are not acceptable for baseline data, and with radiation-exposedcultures in which more than 100 MN per 1000 BN cells are induced, CVs lessthan 20% are expected.
3. Scores from inexperienced personnel (e.g., students, new staff) should not berelied on until they are able to achieve acceptable CVs (no greater than 40%) forrepeat scores of standard control slides.
4. Interscorer variability is one of the key sources of variation in the micronucleusassay (69). It is therefore essential that the same scorers are maintained through-out a single study and ideally two scorers are used, each providing a count fromeach of the duplicate cultures and their mean values calculated as indicated inFig. 2. An alternative approach is to calibrate scorers by using a common set of
26 Fenech
standard slides with “low,” “medium,” and “high” MN frequencies. The scores ofeach scorer on the standard slides can then be used to calculate a corrected value.The latter approach is still in development but worth noting as an option, becauseit can take account of differences in the visual capacity of scorers within the samelaboratory and between laboratories.
5. Another important source of variability between scorers and between laborato-ries is the quality of the microscopes and their optics. In our experience, scoringof nucleoplasmic bridges is influenced by the quality of the microscope, becausefine bridges can be missed with low-quality optics. The main issue here is forscorers to avoid switching microscopes during experiments, and for the laboratorymanager to upgrade the optics of the microscopes to a uniform and high levelwhenever possible.
6. One of the most common questions is the number of BN cells to be scored in theCBMN assay. The accepted protocol is to score a minimum of 1000 BN cells pertreatment or time point, although reports vary between 500 and 2000 BN cells. Analternative approach is to keep on scoring BN cells until a fixed number ofmicronuclei are observed (e.g., 45 micronuclei). The latter has the advantage thatmore BN cells are scored when fewer MNi are induced, thus maintaining similarstatistical power across different treatments. The main disadvantage is that morethan 2000 cells may have to be scored in cultures with low MN frequency. In ourexperience, scoring 1000 BN cells from each of the duplicate cultures alwaysyields robust results.
7. With respect to scoring slides, it is best first to score the frequency of mononu-cleated, binucleated, multinucleated, apoptotic, and necrotic cells to determinethe NDI and NDCI indices. Then focus on scoring binucleated cells for the pres-ence of micronuclei, nucleoplasmic bridges, and nuclear buds to determine thegenome damage rate.
8. It should be noted that the use of nuclear buds within the CBMN assay isexpected to increase because of the consistent significant relationship of this bio-marker of gene amplification with nucleoplasmic bridges and micronuclei (64).It is therefore recommended that nuclear buds be scored. In our experience,the expression of this biomarker may be more prevalent following long-term expo-sure (>3 d) to a genotoxic agent, which is consistent with the notion that it maytake three or more nuclear divisions for breakage–fusion–bridge cycles to gener-ate sufficient amplified DNA to be eliminated by nuclear budding.
9. When scoring nucleoplasmic bridges in binucleated cells, it is important to notethat the score may depend on the frequency of binucleated cells with nuclei thattouch or overlap. This is because nucleoplasmic bridges are more likely to be vis-ible in binucleated cells, in which the nuclei are clearly separated from each other.
10. In maximizing the number of cytokinesis-blocked binucleated cells by increasingexposure time to cytochalasin-B, there is the risk of also increasing the proportionof cytokinesis-blocked multinucleated cells that arise from binucleated cells thatattempt another nuclear division while cytokinesis-blocked. Ideally, the proportionof binucleated among cytokinesis-blocked cell should be in excess of 80%. The
In Vitro Micronucleus Technique 27
proportion of binucleated cells among all cells will depend on the proportion ofdividing cells in the culture. The latter depends on the cell line or tumor cells andthe culture conditions.
AcknowledgmentsThe development of the cytokinesis-block micronucleus assay was the result
of research performed at the Medical School of the Flinders University ofSouth Australia in Prof. Alec Morley’s laboratory and CSIRO Health Sciencesand Nutrition with the support of the Anti-Cancer Foundation of the Universi-ties of South Australia. I would also like to acknowledge the important role ofMs. J. Rinaldi, Ms. C. Aitken, Ms. S. Neville, Ms. J. Turner, Ms. F. Bulman,Ms. C. Salisbury, Mr. P. Thomas, Mr. J.Crott, Ms. S. Brown, and Mr. W. Green-rod, who have contributed significantly to the more recent research effort. Prof.Micheline Kirsch-Volders and Prof. Wushou P. Chang are thanked for criticallyreading the manuscript and for their constructive suggestions.
References1. Evans, H. J. (1977) Molecular mechanisms in the induction of chromosome aber-
rations, in Progress in Genetic Toxicology (Scott, D., Bridges, B. A., and Sobels,F. H., eds.), Elsevier North Holland Biomedical, Amsterdam, pp. 57–74.
2. Savage, J. R. K. (1993) Update on target theory as applied to chromosomal aber-rations. Environ. Mol. Mutagen. 22, 198–207.
3. Evans, H. J. (1990) Cytogenetics: overview. Prog. Clin. Biol. Res. 340B, 301–323.4. Dellarco, V. L., Mavournin, K. H., and Tice, R. R. (1985) Aneuploidy and health risk
assessment: current status and future directions. Environ. Mutagen. 7, 405–424.5. Guttenbach, M. and Schmid, M. (1994) Exclusion of specific human chromosomes
into micronuclei by 5-azacytidine treatment of lymphocyte cultures. Exp. Cell Res.211, 127–132.
6. Natarajan, A. T. and Obe, G. (1982) Mutagenicity testing with cultured mammaliancells: cytogenetic assays, in Mutagenicity: New Horizons in Genetic Toxicology(Heddle, J. A., ed.), Academic Press, New York, pp. 171–213.
7. Schmid, W. (1975) The micronucleus test. Mutation Res. 31, 9–15.8. Heddle, J. A. (1973) A rapid in vivo test for chromosome damage. Mutation Res.
18, 187–192.9. Fenech, M. and Morley, A. A. (1985) Solutions to the kinetic problem in the
micronucleus assay. Cytobios 43, 233–246.10. Fenech, M. and Morley, A. A. (1985) Measurement of micronuclei in lympho-
cytes. Mutation Res. 147, 29–36.11. Fenech, M. and Morley, A. A. (1986) Cytokinesis-block micronucleus method in
human lymphocytes: effect of in vivo ageing and low-dose x-irradiation. MutationRes. 161, 193–198.
28 Fenech
12. Carter, S. B. (1967) Effects of cytochalasins on mammalian cells. Nature 213,261–264.
13. Masunaga, S., Ono, K., and Abe, M. (1991) A method for the selective measurementof the radiosensitivity of quiescent cells in solid tumors—combination of immuno-fluorescence staining to BrdU and micronucleus assay. Radiation Res. 125, 243–247.
14. Odagiri, Y., Takemoto, K., and Fenech, M. (1994) Micronucleus induction incytokinesis-blocked mouse bone-marrow cells in vitro following in vivo exposureto X-irradiation and cyclophosphamide. Env. Mol. Mutagen. 24, 61–67.
15. Degrassi, F. and Tanzarella, C. (1988) Immunofluorescent staining of kinetochoresin micronuclei: a new assay for the detection of aneuploidy. Mutation Res. 203,339–345.
16. Thompson, E. J. and Perry, P. (1988) The identification of micronucleated chro-mosomes: a possible assay for aneuploidy. Mutagenesis 3, 415–418.
17. Farooqi, Z., Darroudi, F., and Natarajan, A. T. (1993) Use of fluorescence in situhybridisation for the detection of aneugens in cytokinesis-blocked mouse spleno-cytes. Mutagenesis 8, 329–334.
18. Hando, J. C., Nath, J., and Tucker, J. D. (1994) Sex chromosomes, micronuclei andaging in women. Chromosoma 103, 186–192.
19. Parry, E. M., Henderson, L., and Mackay, J. M. (1995) Guidelines for testing ofchemicals. Procedures for the detection of chemically induced aneuploidy: rec-ommendations of a UK Environmental Mutagen Society working group. Mutage-nesis 10(1), 1–14.
20. Elhajouji, A., Van Hummellen, P., and Kirsch-Volders, M. (1995) Indications fora threshold of chemically induced aneuploidy in vitro in human lymphocytes.Environ. Mol. Mutagen. 26, 292–304.
21. Fenech, M. and Neville, S. (1992) Conversion of excision-repairable DNA lesionsto micronuclei within one cell cycle in human lymphocytes. Environ. Mol. Muta-gen. 19(1), 27–36.
22. Zijno, A., Marcon, F., Leopardi, P., and Crebelli, R. (1994) Simultaneous detectionof X-chromosome loss and non-disjunction in cytokinesis-blocked human lym-phocytes by in situ hybridisation with a centromeric DNA probe; implications forthe human lymphocyte in vitro micronucleus assay using cytochalasin-B. Muta-genesis 9(3), 225–232.
23. Elhajouji, A., Tibaldi, F., and Kirsch-Volders, M. (1997) Indication for thresholdsof chromosome non-disjunction versus chromosome lagging induced by spindleinhibitors in vitro in human lymphocytes. Mutagenesis 12, 33–140.
24. Schuler, M., Rupa, D. S., and Eastmond, D. A. (1997) A critical evaluation of cen-tromeric labelling to distinguish micronuclei induced by chromosomal loss andbreakage in vitro. Mutation Res. 392, 81–5.
25. Kirsch-Volders, M., Elhajouji, A., Cundari, E., and Van Hummelen, P. (1997) Thein vitro micronucleus test: a multi-end-point assay to detect simultaneously mitoticdelay, apoptosis, chromosome breakage, chromosome loss and non-disjunction.Mutation Res. 392, 19–30.
In Vitro Micronucleus Technique 29
26. Fenech, M., Crott, J., Turner, J., and Brown, S. (1999) Necrosis, apoptosis, cytosta-sis and DNA damage in human lymphocytes measured simultaneously within thecytokinesis-block micronucleus assay: description of the method and results forhydrogen peroxide. Mutagenesis 14(6), 605–612.
27. Kirsch-Volders, M. (ed.) (1997) The CB in vitro micronucleus assay in humanlymphocytes. Special Issue. Mutation Res. 392(1, 2).
28. Kirsch-Volders, M., Sofuni, T., Aardema, M., et al. (2000) Report from the in vitromicronucleus assay working group, Washington International Workshop on Geno-toxicity Test Procedures, 25–26 March 1999.
29. Atencia, R., Garciasanz, M., Perezyarza, G., Asumendi, A., Hilario, E., andArechaga, J. (1997) A structural analysis of cytoskeletal components during theexecution phase of apoptosis. Protoplasma 198, 163–169.
30. Eastmond, D. A. and Tucker, J. D. (1989) Identification of aneuploidy-inducingagents using cytokinesis-blocked human lymphocytes and an antikinetochore anti-body. Environ. Mol. Mutagen. 13(1), 34–43.
31. Fenech, M., Rinaldi, J., and Surrales, J. (1994) The origin of micronuclei inducedby cytosine arabinoside and its synergistic interaction with hydroxyurea in humanlymphocytes. Mutagenesis 9(3), 273–277.
32. Surrales, J., Xamena, N., Creus, A., and Morcos, R. (1995) The suitability of themicronucleus assay in human lymphocytes as a new biomarker of excision repair.Mutation Res. 341(1–2), 43–59.
33. Surralles, J., Carbonell, E., Marcos, R., Degrassi, F., Antoccia, A., and Tanzarella,C. (1992) A collaborative study on the improvement of the micronucleus test incultured human lymphocytes. Mutagenesis 7(6), 407–410.
34. Fenech, M. F., Dunaiski, V., Osborne, Y., and Morley, A. A. (1991) The cytokinesis-block micronucleus assay as a biological dosimeter in spleen and peripheral bloodlymphocytes in the mouse following acute whole body irradiation. Mutation Res.263, 119–126.
35. Heddle, J. A., Bouch, A., Khan, M. A., and Gingerich, J. D. (1990) Concurrentdetection of gene mutations and chromosomal aberrations induced in vivo insomatic cells. Mutagenesis 5(2), 179–184.
36. He, S. and Baker, R. S. U. (1989) Initiating carcinogen, triethylenemelamine,induces micronuclei in skin target cells. Environ. Mol. Mutagen. 14(1), 1–5.
37. Wakata, A. and Sasaki, M. S. (1987) Measurement of micronuclei by cytokinesis-block method in cultured Chinese hamster cells: comparison with types and ratesof chromosome aberrations. Mutation Res. 190, 51–57.
38. Prosser, J. S., Moquet, J. E., Lloyd, D. C., and Edwards, A. A. (1988) Radiationinduction of micronuclei in human lymphocytes. Mutation Res. 199, 37–45.
39. Lindholm, C., Norrpa, H., Hayashi, M., and Sorsa, M. (1991) Induction ofmicronuclei and anaphase aberrations by cytochalasin-B in human lymphocytecultures. Mutation Res. 260, 369–375.
40. Minissi, S., Gustavino, B., Degrassi, F., Tanzarella, C., and Rizzoni, M. (1999)Effect of cytochalasin-B on the induction of chromosome missegregation bycolchicine at low concentrations in human lymphocytes. Mutagenesis 14, 43–49.
30 Fenech
41. Fenech, M. (1997) The advantages and disadvantages of the cytokinesis-blockmicronucleus method. Mutation Res. 392, 11–18.
42. Kalweit, S., Utesch, D., von der Hude, W., and Madle, S. (1999) Chemicallyinduced micronucleus formation in V79 cells—comparison of three different testprocedures. Mutation Res. 439(2), 183–190.
43. Matsushima, T., Hayashi, M., Matsuoka, A., et al. (1999) Validation study of the invitro micronucleus test in a Chinese hamster lung cell line (CHL/IU). Mutagene-sis 14(6), 569–580.
44. Fenech, M. (2000) Mathematical model of the in vitro micronucleus assay predictsfalse negative results if micronuclei are not scored specifically in binucleated cells orcells that have completed one nuclear division. Mutagenesis 15(4), 329–336.
45. Vig, B. K. and Swearngin, S. E. (1986) Sequence of centromere separation:kinetochore formation in induced laggards and micronuclei. Mutagenesis 1, 464–465.
46. Earnshaw, W. C. and Migeon, B. R. (1985) Three related centromere proteins areabsent from the inactive centromere of a stable dicentric chromosome. Chromo-soma 92, 290–296.
47. Elhajouji, A., Cunha, M., and Kirsch-Volders, M. (1998) Spindle poisons caninduce polyploidy by mitotic slippage and micronucleate mononucleates in thecytokinesis-block assay. Mutagenesis 13(2), 193–198.
48. Moroi, Y., Hartman, A. L., Nakane, P. K., and Tan, E. M. (1981) Distribution ofkinetochore antigen in mammalian cell nuclei. J. Cell Biol. 90, 254–259.
49. Fenech, M. and Morley, A. A. (1989) Kinetochore detection in micronuclei: analternative method for measuring chromosome loss. Mutagenesis 4(2), 98–104.
50. Straus, W. (1982) Imidazole increases the sensitivity of the cytochemical reactionfor peroxidase with diaminobenzidine at neutral pH. J. Histochem. Cytochem. 30,491–493.
51. Scopsi, I. and Larsson, L. I. (1986) Increased sensitivity in peroxidase immuno-chemistry. A comparative study of a number of peroxidase visualisation methodsemploying a model system. Histochemistry 84, 221–230.
52. White, N. H., de Matteis, F., Davies, A., et al. (1992) Genotoxic potential oftamoxifen and analogues in female Fischer F344/n rats, DBA/2 and C57BL/6 miceand in human MCL-5 cells. Carcinogenesis 13(12), 2197–2203.
53. Gauthier, J. M., Dubeau, H., Rassart, E., Jarman, W. M., and Wells, R. S. (1999)Biomarkers of DNA damage in marine mammals. Mutation Res. 444(2), 427–439.
54. Fenech, M. and Rinaldi, J. (1995) A comparison of lymphocyte micronuclei andplasma micronutrients in vegetarians and non-vegetarians. Carcinogenesis 16(2),223–230
55. Scott, D., Barber, J. P. B., Levine, E. L., Burrill, W., and Roberts, S. A. (1998)Radiation-induced micronucleus induction in lymphocytes identifies a high fre-quency of radiosensitive cases among breast cancer patients: a test for predisposi-tion? Br. J. Cancer 77(4), 614–620.
56. Shibamoto, Y., Streffer, C., Fuhrmann, C., and Budach, V. (1991) Tumor radiosen-sitivity prediction by the cytokinesis-block micronucleus assay. Radiation Res.128, 293–300.
In Vitro Micronucleus Technique 31
57. Fenech, M., Holland, N., Chang, W. P., Zeiger, E., and Bonassi, S. (1999) TheHuman MicroNucleus Project—An international collaborative study on the use ofthe micronucleus technique for measuring DNA damage in humans. Mutation Res.428, 271–283.
58. Tates, A. N., van Welie, M. T., and Ploem, J. S. (1990) The present state ofthe automated micronucleus test for lymphocytes. Int. J. Radiat. Biol. 58, 813–825.
59. Castelain, P., Van Hummelen, P., Deleneer, A., and Kirsch-Volders, M. (1993)Automated detection of cytochalasin-B blocked binucleated lymphocytes for scor-ing micronuclei. Mutagenesis 8(4), 285–293.
60. Bocker, W., Muller, W. U., and Streffer, C. (1995) Image processing algorithms forthe automated micronucleus assay in binucleated human lymphocytes. Cytometry19(4), 283–294.
61. Frieauff, W., Potterlocher, F., Cordier, A., and Suter, W. (1998) Automatic analy-sis of the in vitro micronucleus test on V79 cells. Mutation Res. 413(1), 57–68.
62. Verhaegen, F., Vral, A., Seuntjens, J., Schipper, N. W., de Ridder, L., and Thierens,H. (1994) Scoring of radiation-induced micronuclei in cytokinesis-blocked humanlymphocytes by automated image analysis. Cytometry 17, 119–127.
63. Shimizu, N., Itoh, N., Utiyama, H., and Wahl, G. M. (1998) Selective entrapmentof extrachromosomally amplified DNA by nuclear budding and micronucleationduring S phase. J. Cell Biol. 140, 1307–1320.
64. Fenech, M. and Crott, J. W. (2002) Micronuclei, nucleoplasmic bridges and nuclearbuds induced in folic acid deficient human lymphocytes—evidence for breakage-fusion-bridge cycles in the cytokinesis-block micronucleus assay. Mutation Res.504(1–2), 131–136.
65. Fenech, M. (2002) Chromosomal biomarkers of genomic instability relevant tocancer. Drug Discovery Today 7(22), 1128–1137.
66. Unger, C., Kress, S., Buchmann, A., and Schwarz, M. (1994) Gamma-irradiation-induced micronuclei from mouse hepatoma cells accumulate high levels of thetumor suppressor protein p53. Cancer Res. 54(14), 3651–3655.
67. Sablina, A. A., Ilyinskaya, G. V., Rubtsova, S. N., Agapova, L. S., Chumakov, P. M.,and Kopnin, B. P. (1998) Activation of p53-mediated cell cycle checkpoint inreponse to micronuclei formation. J. Cell Sci. 111, 977–984.
68. Fenech, M., Chang, W. P., Kirsch-Volders, M., Holland, N., Bonassi, S., andZeiger, E. (2003) HUMN project: detailed description of the scoring criteria for thecytokinesis-block micronucleus assay using isolated human lymphocyte cultures.Mutation Res. 534(1–2), 65–75.
69. Fenech, M., Bonassi, S., Turner, J., et al. (2003) Intra- and inter-laboratory varia-tion in the scoring of micronuclei and nucleoplasmic bridges in binucleated humanlymphocytes. Results of an international slide-scoring exercise by the HUMN pro-ject. Mutation Res. 534(1–2), 45–64.
70. Shimizu, N., Itoh, N., Utiyama, H., and Wahl, G. M. (1988) Selective entrapmentof extrachromasomally amplified DNA b, nuclear budding and micronucleationduring S phase. J. Cell Biol. 140(6), 1307–1320.
32 Fenech


![An Integrated Database of Chemosensitivity to 55 ...[CANCER RESEARCH 62, 1139–1147, February 15, 2002] An Integrated Database of Chemosensitivity to 55 Anticancer Drugs and Gene](https://img.dokumen.tips/doc/110x75/5ed99d59801c872007065f4a/an-integrated-database-of-chemosensitivity-to-55-cancer-research-62-1139a1147.jpg)