Embed Size (px)
Citation preview
Chem 1140; Spectroscopy
• UV-VIS
• IR
• NMR
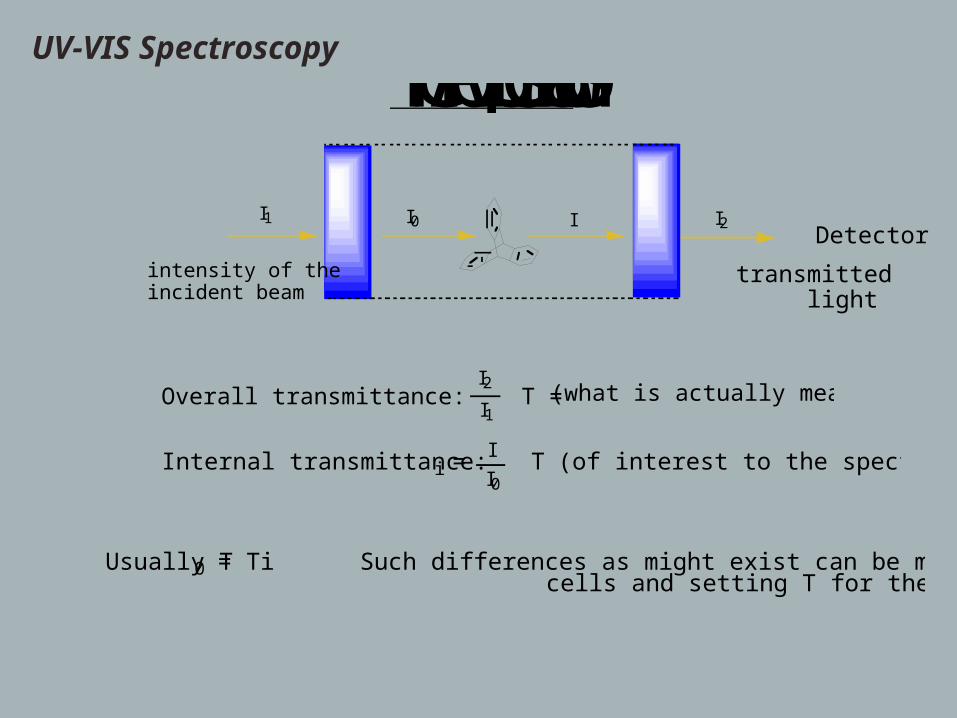
The Absorption LawsI1 I0 I I2
Detector
transmitted light
intensity of the incident beam
I2
I1Overall transmittance: T = (what is actually measured)
I
I0Internal transmittance: T i = (of interest to the spectroscopist)
Usually T0 = Ti Such differences as might exist can be minimized by using matched cells and setting T for the reference at 100%.
UV-VIS Spectroscopy
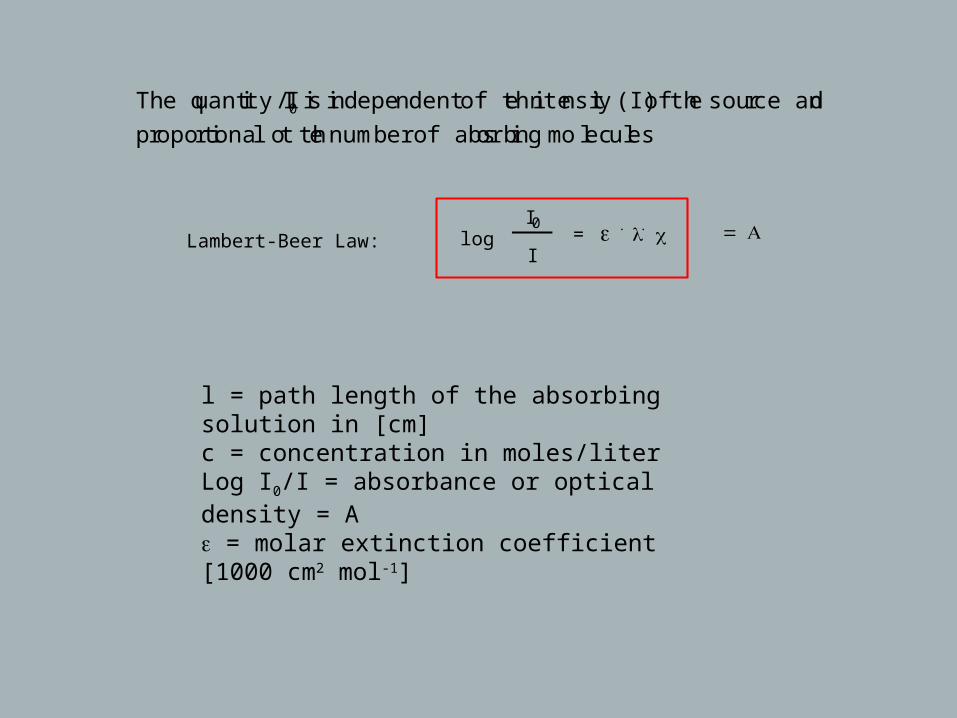
The quantity I/I0 is independent of the intensity (I) of the source and
proportional to the number of absorbing molecules
Lambert-Beer Law: logI0
I= ε . l . c = A
l = path length of the absorbing solution in [cm]c = concentration in moles/literLog I0/I = absorbance or optical density = Aε = molar extinction coefficient [1000 cm2 mol-1]
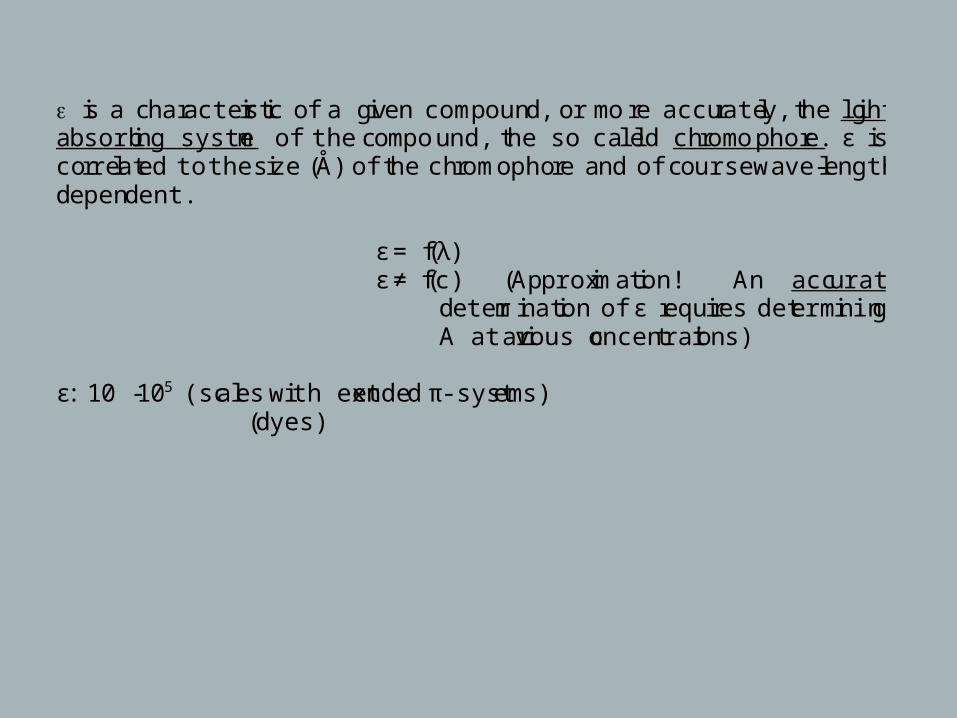
ε i s a characteristic of a g iven compound, or more accurately, the lightabsorbing system of the compound, the so called chromophore. ε i scorrelated to the size (Å) of the chromophore and of course wave-lengthdependent.
ε = f (λ)ε ≠ f (c) (Approximation! An accurate
determination of ε r equires determiningA at various concentrations)
ε: 10 - 105 (scales with extended π-systems)(dyes)
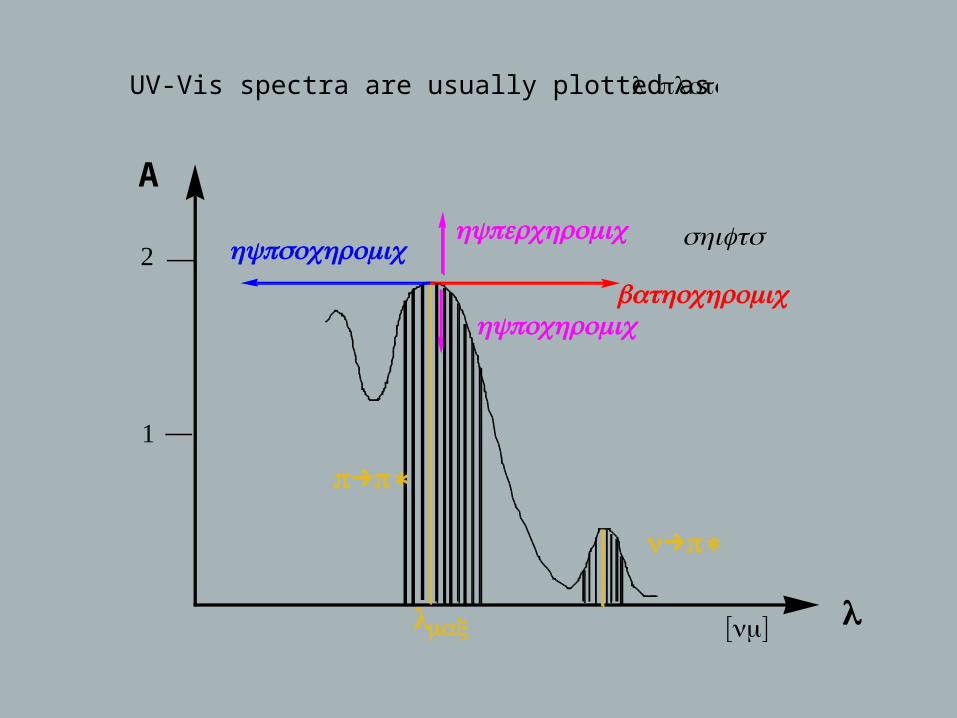
UV-Vis spectra are usually plotted as A vs. λ :plots
A
λ
2
1
bathochromic
hypsochromichyperchromic
hypochromic
[ ]nmλmax
shifts
π→π∗
n→π∗
Though there are discrete levels of electronic excited states in a
molecule, we do not observe absorption lines but broad peaks; the
change in vibrational and rotational energy levels during absorption of
light leads to peaks containing vibrational and rotational fine
structure. Due to additional interaction with solvent molecules, this
fine structure is blurred out, and a smooth curve is observed. (vapour
phase: one can observe vibrational fine structure).
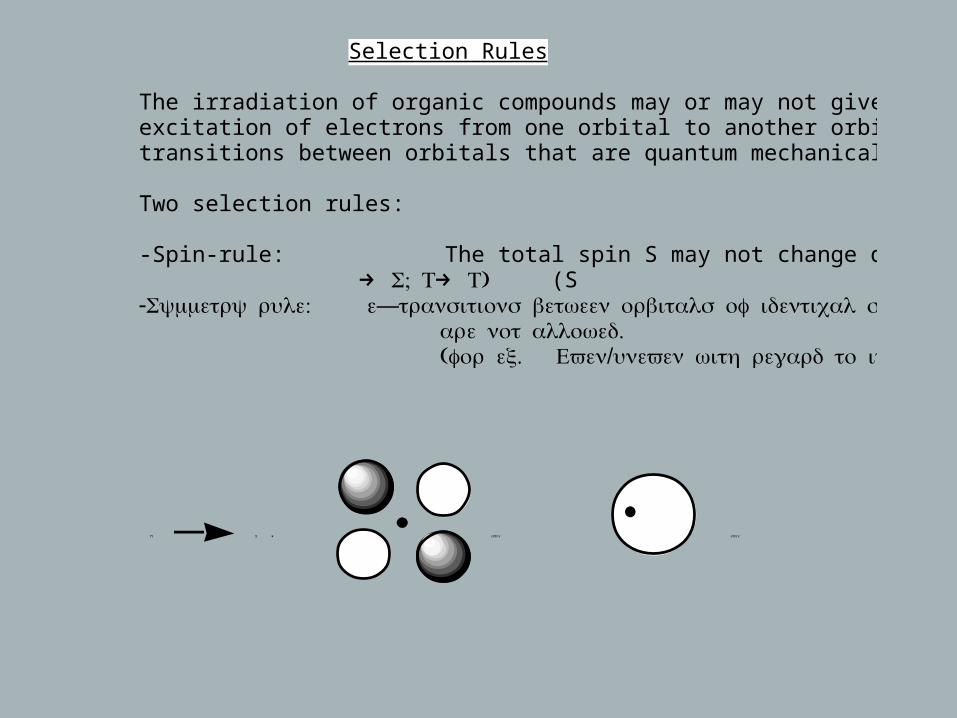
Selection Rules
The irradiation of organic compounds may or may not give rise to excitation of electrons from one orbital to another orbital. There are transitions between orbitals that are quantum mechanically forbidden.
Two selection rules:
-Spin-rule: The total spin S may not change during transition (S → ; S T→ )T- : — Symmetry rule e transitions between orbitals of identical symmetries .are not allowed ( . / ).for ex Even uneven with regard to inversion
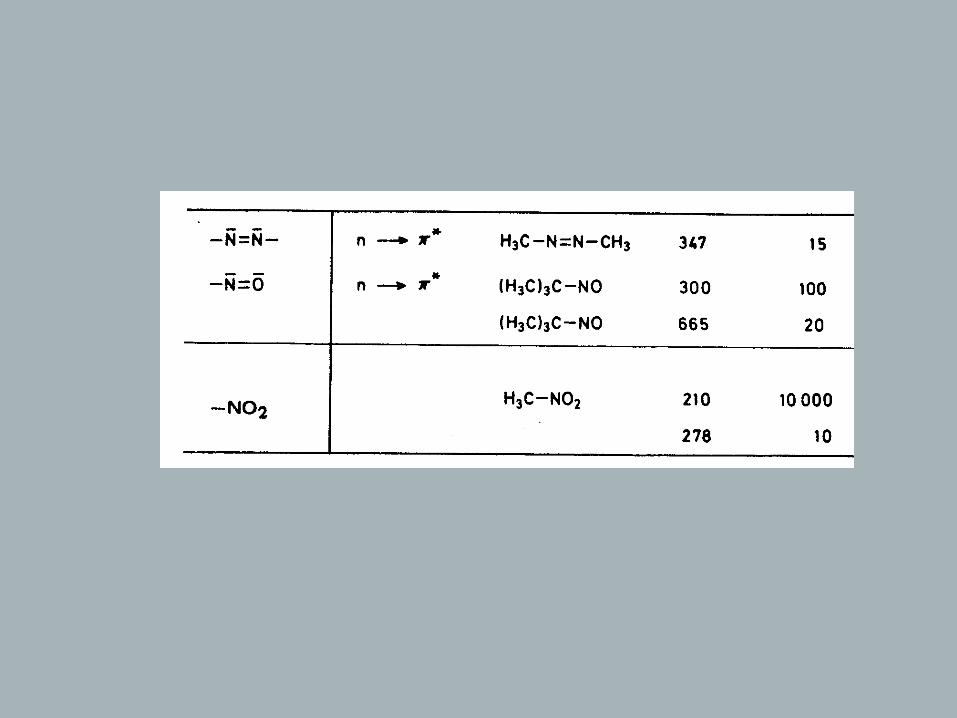
n π * even even
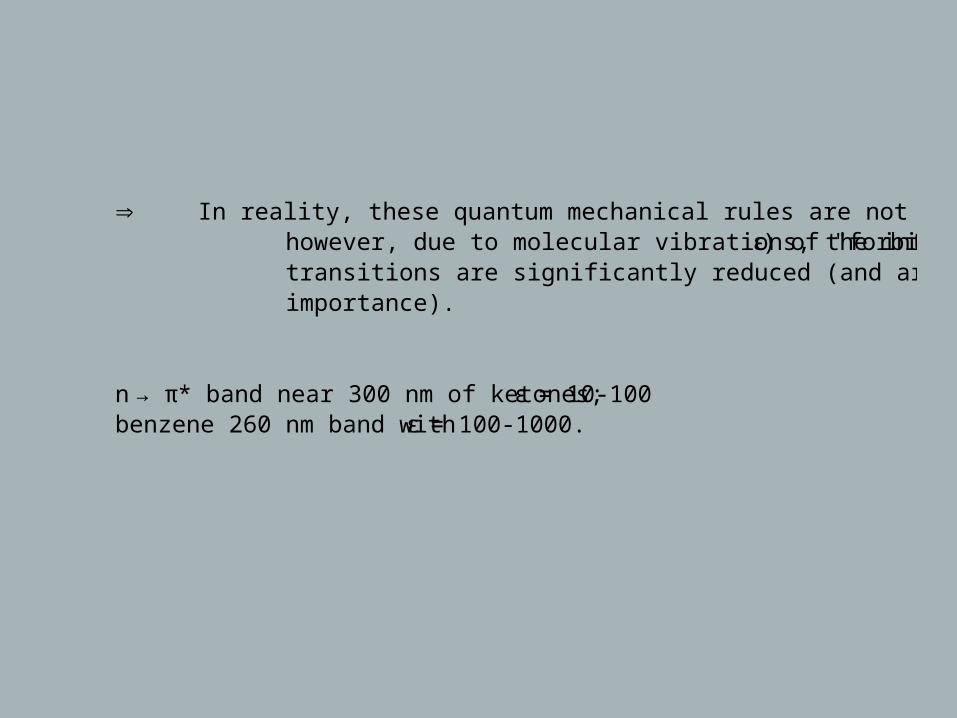
⇒ In reality, these quantum mechanical rules are not rigidly observed, however, due to molecular vibrations, the intensities ( ε) of "forbidden" transitions are significantly reduced (and are usually of diagnostic importance).
n → π* band near 300 nm of ketones; ε = 10-100 benzene 260 nm band with ε = 100-1000.
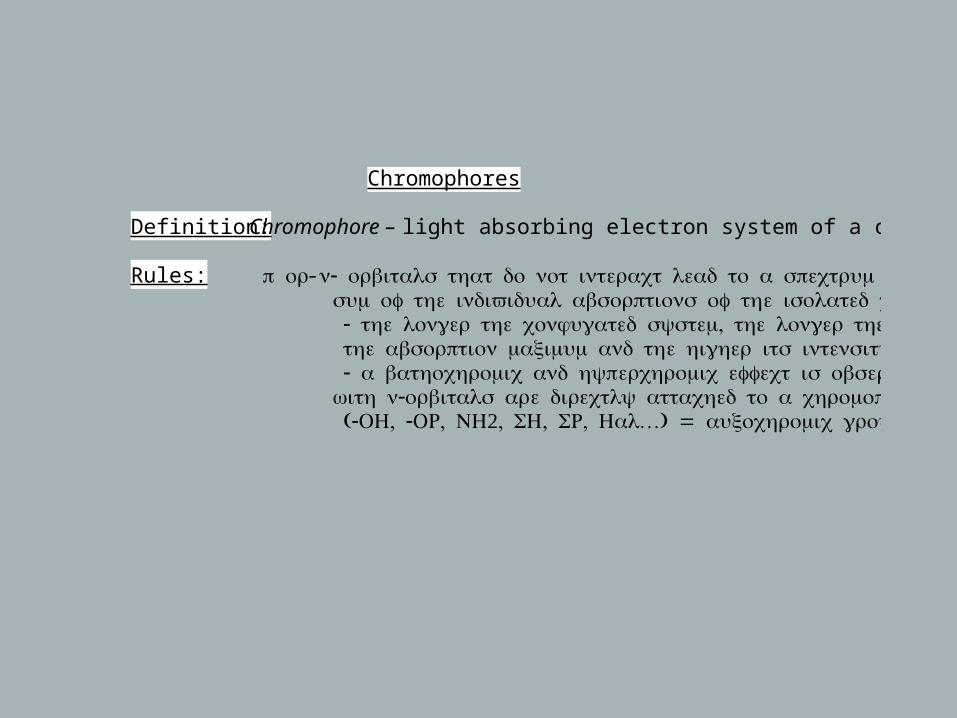
Chromophores
Definition: Chromophore – light absorbing electron system of a compound
Rules: - π - or n orbitals that do not interact lead to a spectrum that is the .sum of the individual absorptions of the isolated chromophores - , the longer the conjugated system the longer the wavelength of .the absorption maximum and the higher its intensity - , a bathochromic and hyperchromic effect is observed when atoms - with n orbitals are directly attached to a chromophore (- , - , 2, , , …) = .OH OR NH SH SR Hal auxochromic groups
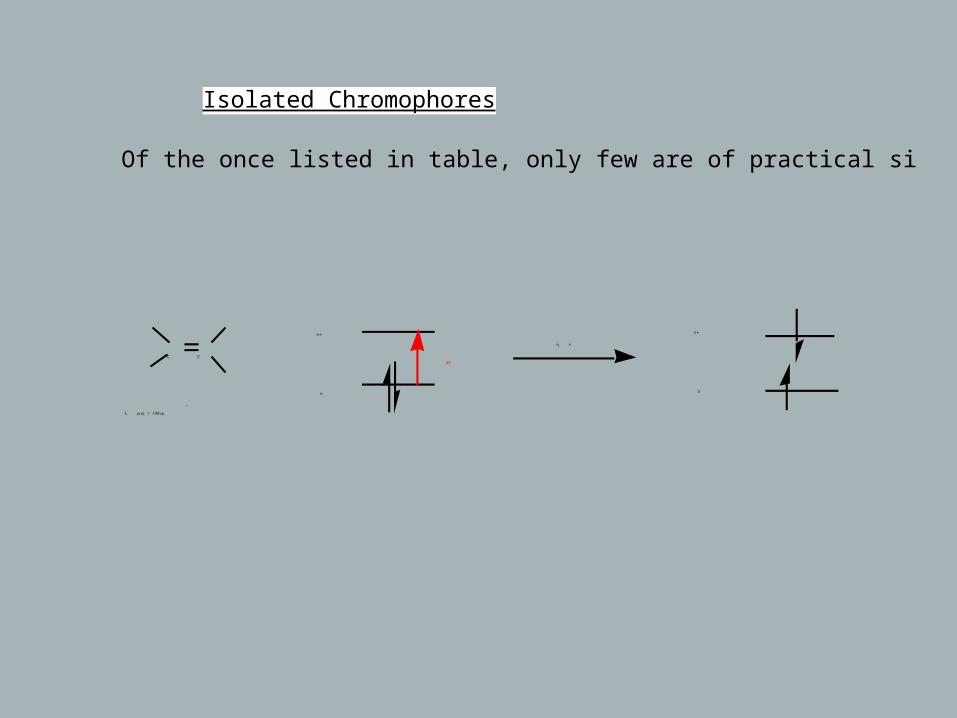
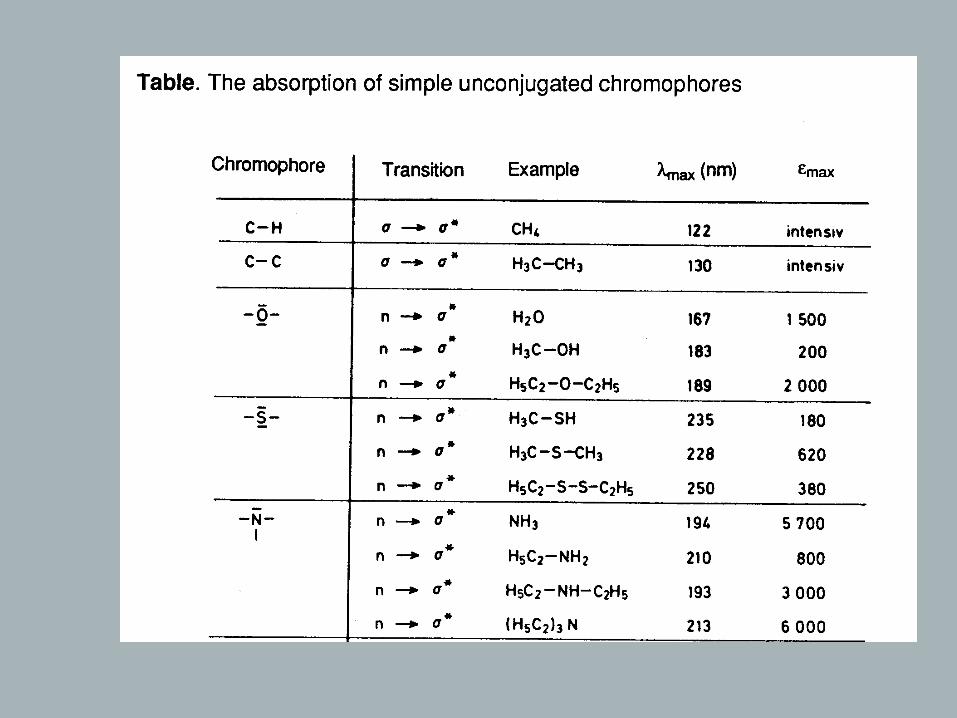
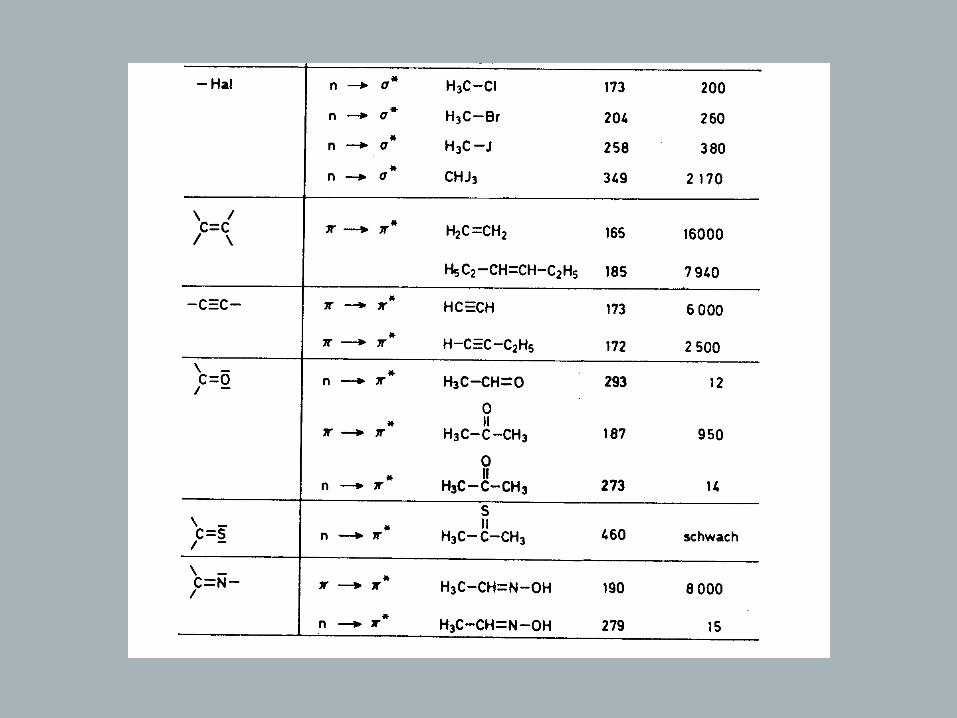
→ Isolated Chromophores
Of the once listed in table, only few are of practical significance (Vacuum-UV)
C C
π
λ = 190max nm
~
π∗
ΔΕ
h υ
π
π∗
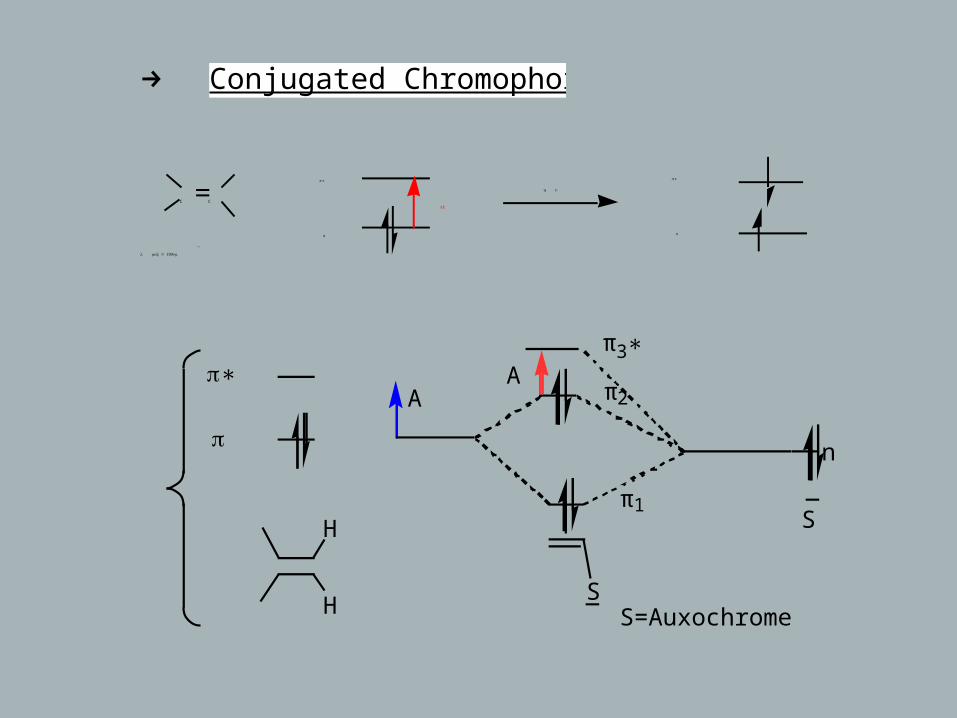
→ Conjugated Chromophores
C C
π
λ = 190max nm
~
π∗
ΔΕ
h υ
π
π∗
π
π∗A
H
HS
n
A
S
S=Auxochrome
π3∗
π2
π1
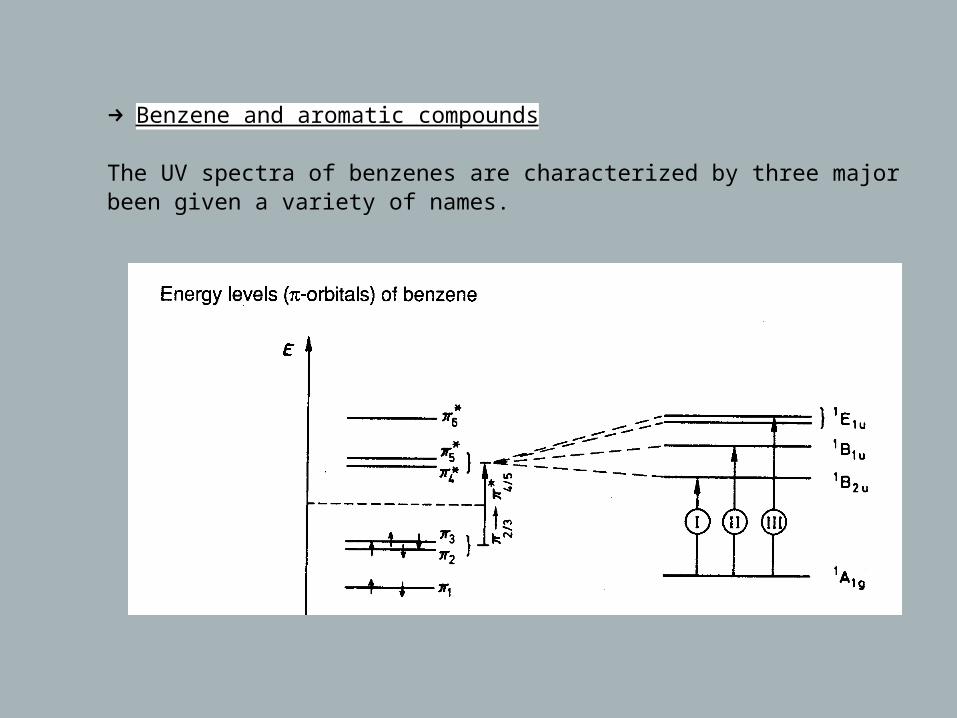
→ Benzene and aromatic compounds
The UV spectra of benzenes are characterized by three major bands which have been given a variety of names.
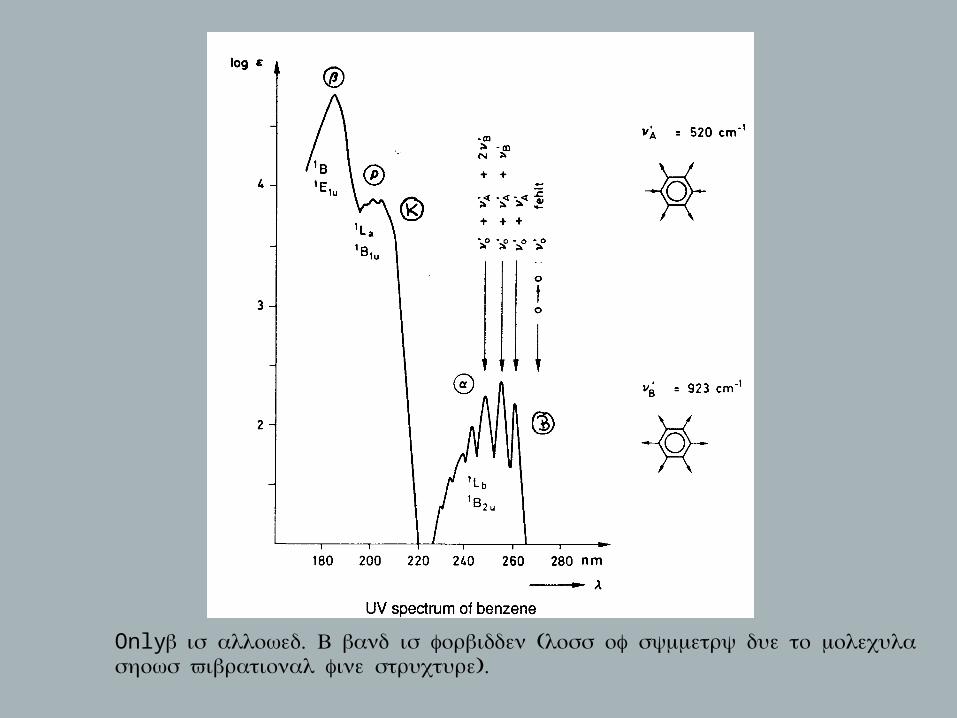
Only β . ( ; is allowed B band is forbidden loss of symmetry due to molecular vibrations ).shows vibrational fine structure
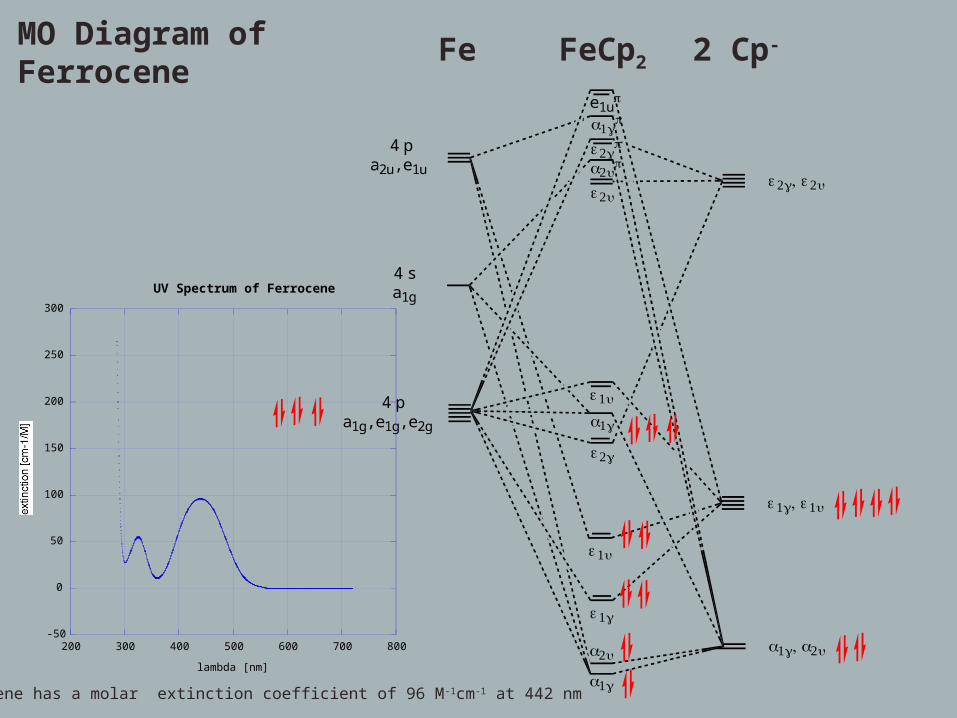
MO Diagram of Ferrocene Fe FeCp2 2 Cp-
4 pa2u, e1u
4 sa1g
4 pa1g, e1g, e2g
e1uπ
a1gπ
e2gπ
a2uπ
e2ue2g, e2u
e1ua1g
e2g
e1g, e1u
e1u
e1g
a1g
a2u a1g, a2u-50
0
50
100
150
200
250
300
200 300 400 500 600 700 800
UV Spectrum of Ferrocene
lambda [nm]
Ferrocene has a molar extinction coefficient of 96 M-1cm-1 at 442 nm
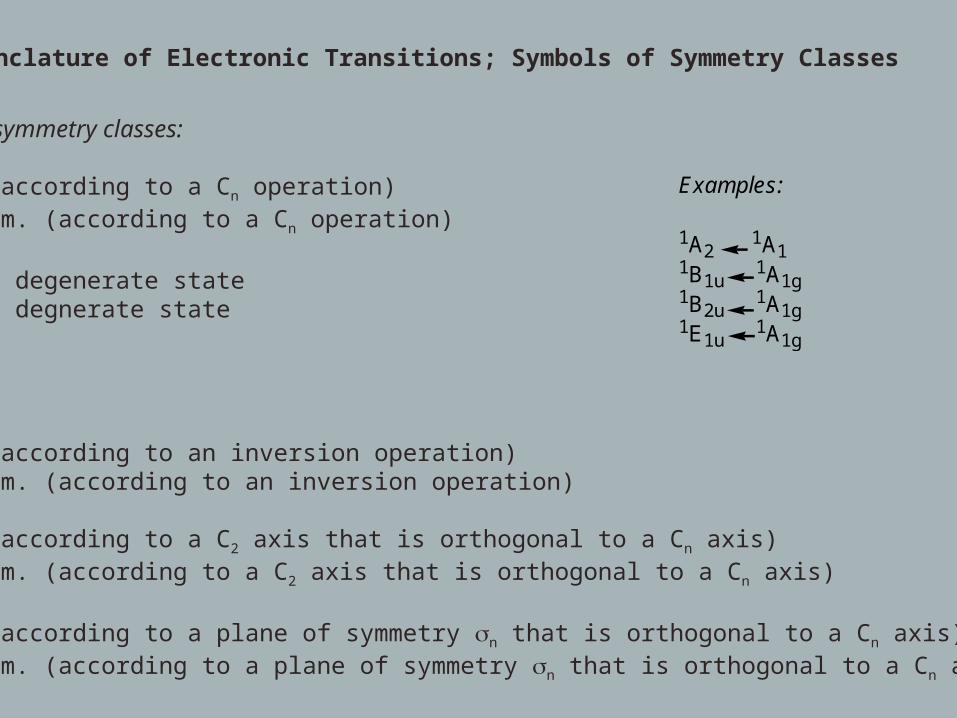
Nomenclature of Electronic Transitions; Symbols of Symmetry Classes
Symbols of symmetry classes:
A: sym. (according to a Cn operation)B: antisym. (according to a Cn operation)
E: 2-fold degenerate stateT: 3-fold degnerate state
Indices:
g: sym. (according to an inversion operation)u: antisym. (according to an inversion operation)
1: sym. (according to a C2 axis that is orthogonal to a Cn axis)2: antisym. (according to a C2 axis that is orthogonal to a Cn axis)
‘: sym. (according to a plane of symmetry n that is orthogonal to a Cn axis)‘: antisym. (according to a plane of symmetry n that is orthogonal to a Cn axis)
Examples:
1A2 1A11B1u 1A1g1B2u 1A1g1E1u 1A1g
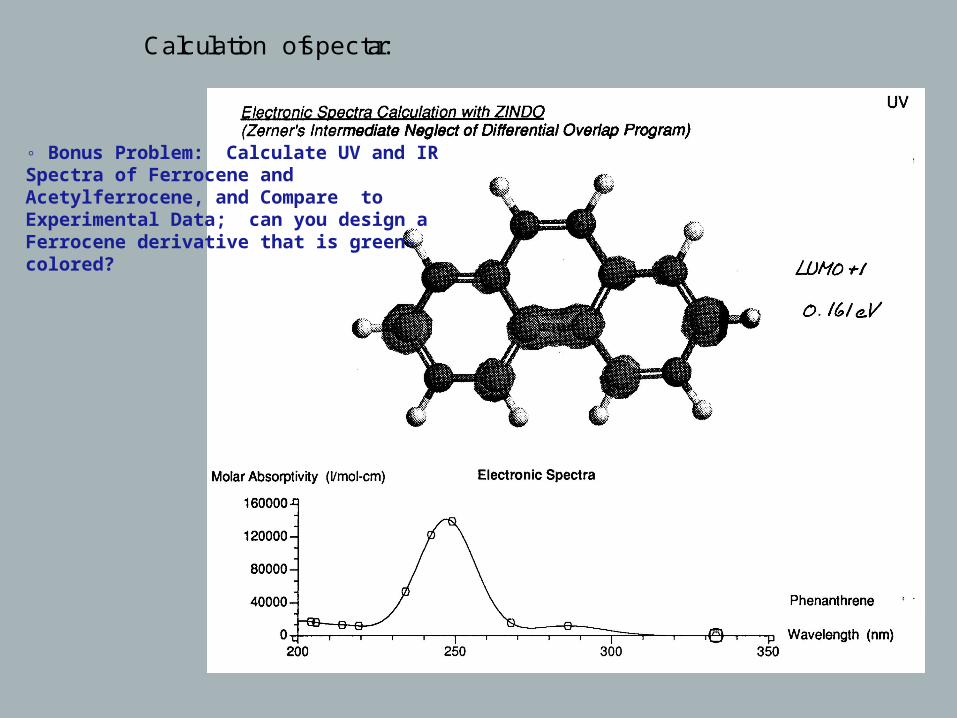
Calculation of spectra:
◦ Bonus Problem: Calculate UV and IR Spectra of Ferrocene and Acetylferrocene, and Compare to Experimental Data; can you design a Ferrocene derivative that is green-colored?
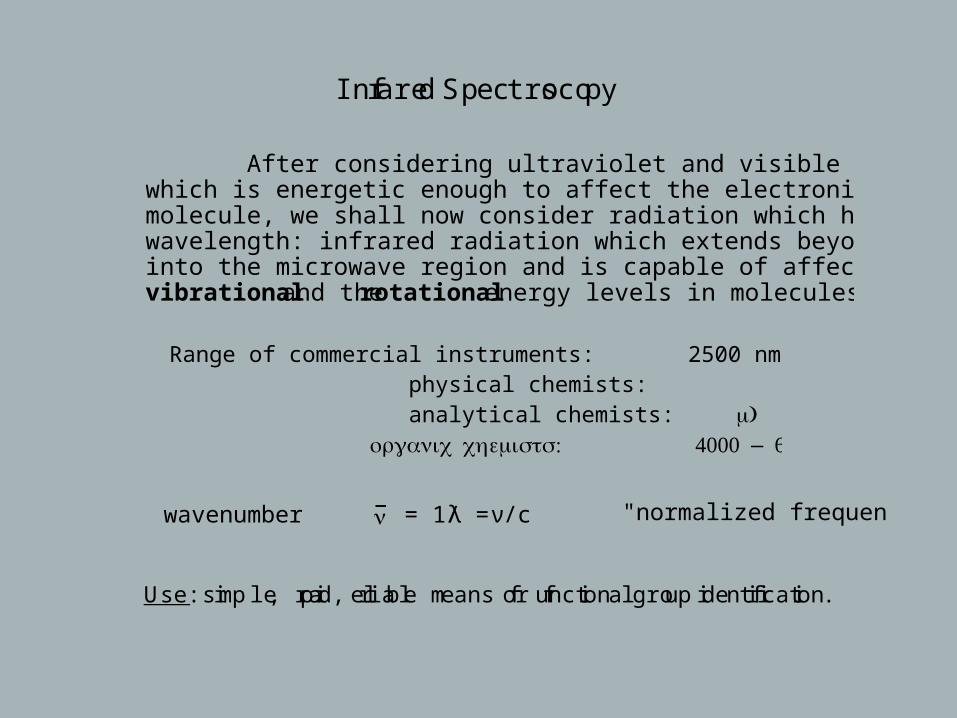
Infrared Spectroscopy
After considering ultraviolet and visible radiation (200-800 nm) which is energetic enough to affect the electronic levels in a molecule, we shall now consider radiation which has a longer wavelength: infrared radiation which extends beyond the visible into the microwave region and is capable of affecting both the vibrational and the rotational energy levels in molecules.
Range of commercial instruments: 2500 nm to 16’000 nm physical chemists: 25000 – 160’000 Å analytical chemists: 2.5 – 16 microns ( μ) : 4000 – 625 -1organic chemists cm
νwavenumber = 1/ λ = ν/c "normalized frequency"
Use: simple, rapid, reliable means for functional group identification.
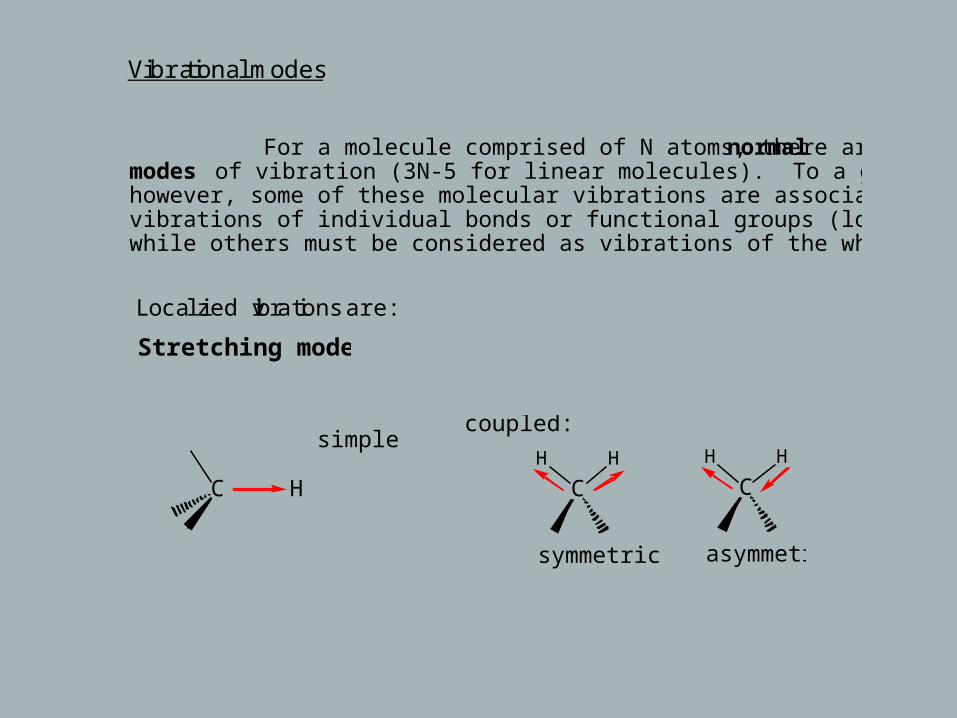
Vibrational modes
For a molecule comprised of N atoms, there are 3N-6 normal modes of vibration (3N-5 for linear molecules). To a good approximation, however, some of these molecular vibrations are associated with the vibrations of individual bonds or functional groups (localized vibrations) while others must be considered as vibrations of the whole molecule.
Localized vibrations are:
Stretching modes:
C H
simplecoupled:
CH H
symmetric asymmetric
C
H H
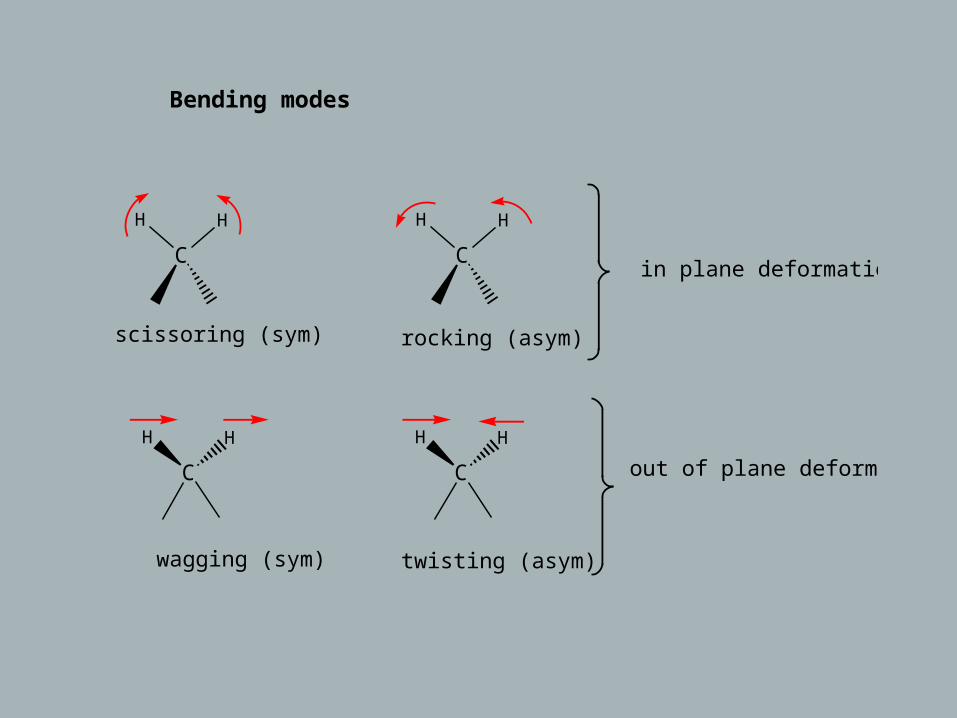
Bending modes:
C
H H
scissoring (sym)
C
H H
rocking (asym)
in plane deformations
C
H H
wagging (sym)
C
H H
twisting (asym)
out of plane deformations
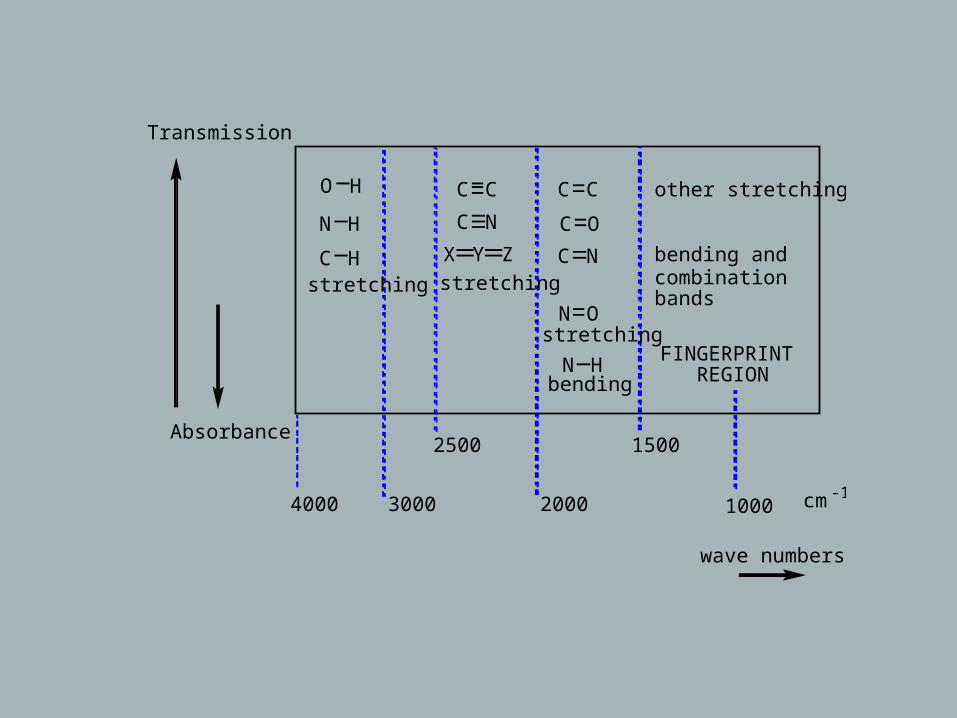
Transmission
O H C C C C other stretching
N H
C Hstretching
C N C O
X Y Z C Nstretching
bending andcombinationbands
FINGERPRINT REGION
N Ostretching
N Hbending
Absorbance
4000 3000
2500
2000
1500
1000 cm-1
wave numbers
Selection rules
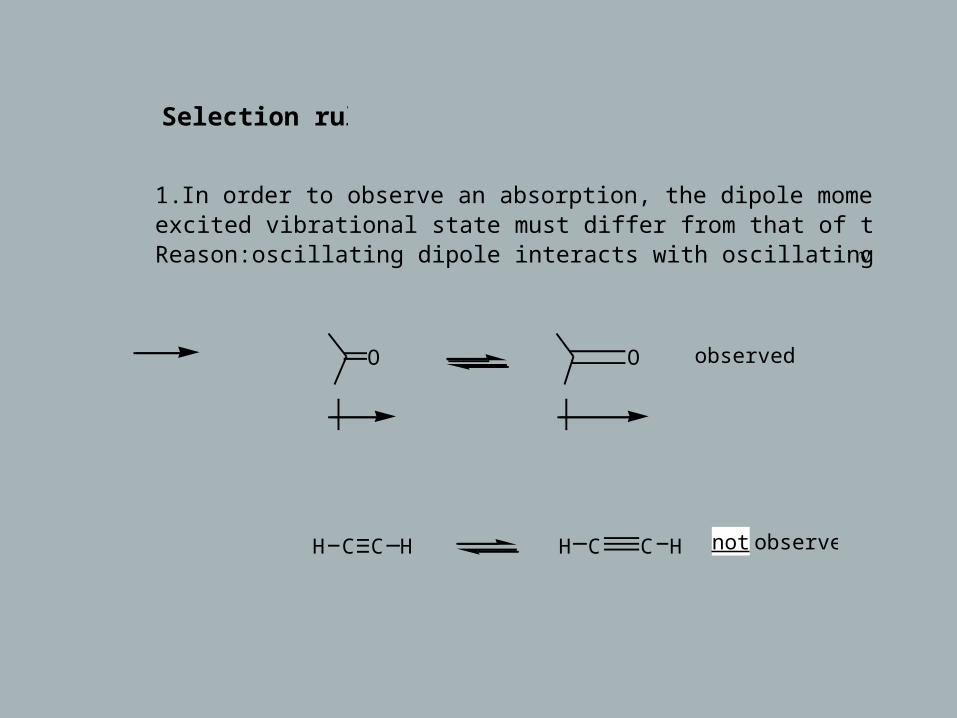
1. In order to observe an absorption, the dipole moment of the excited vibrational state must differ from that of the ground state.Reason:oscillating dipole interacts with oscillating electric vector of h ν
O O observed
H C C H H C C H not observed
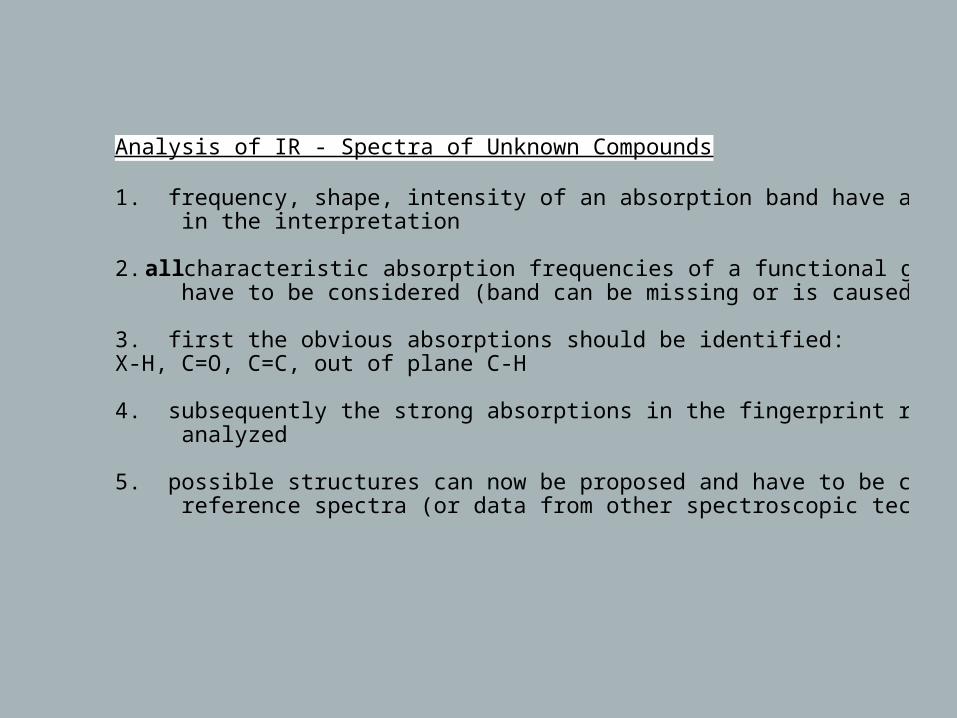
1. frequency, shape, intensity of an absorption band have all to be considered in the interpretation
2. all characteristic absorption frequencies of a functional group have to be considered (band can be missing or is caused by another function)
3. first the obvious absorptions should be identified:X-H, C=O, C=C, out of plane C-H
4. subsequently the strong absorptions in the fingerprint region should be analyzed 5. possible structures can now be proposed and have to be checked with reference spectra (or data from other spectroscopic techniques)
Analysis of IR - Spectra of Unknown Compounds
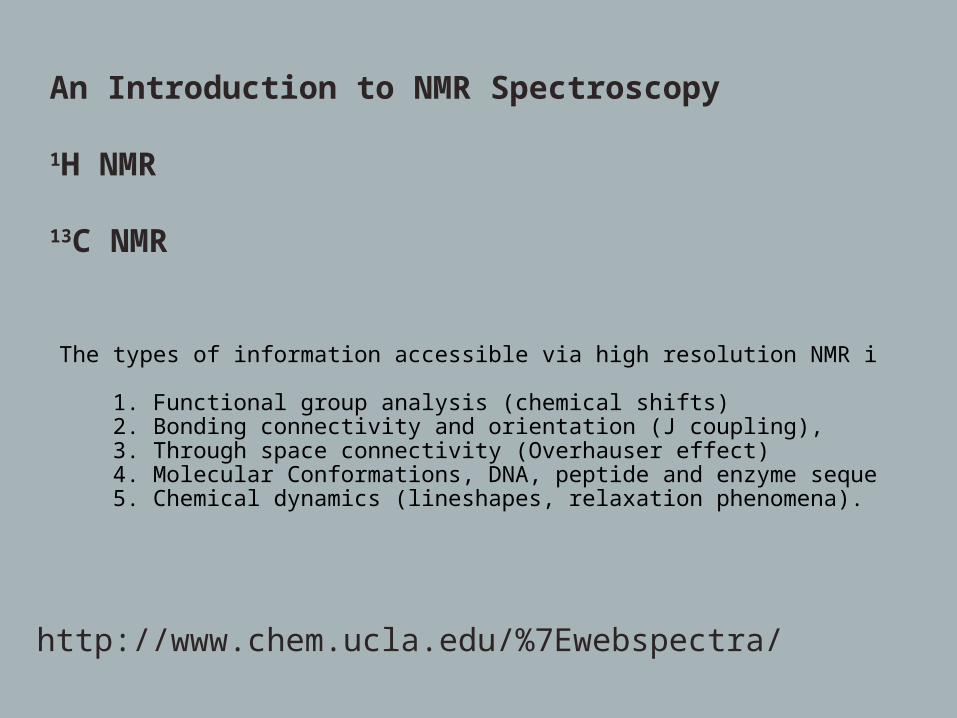
An Introduction to NMR Spectroscopy
1H NMR
13C NMR
The types of information accessible via high resolution NMR include:
1. Functional group analysis (chemical shifts) 2. Bonding connectivity and orientation (J coupling), 3. Through space connectivity (Overhauser effect) 4. Molecular Conformations, DNA, peptide and enzyme sequence and structure. 5. Chemical dynamics (lineshapes, relaxation phenomena).
http://www.chem.ucla.edu/%7Ewebspectra/

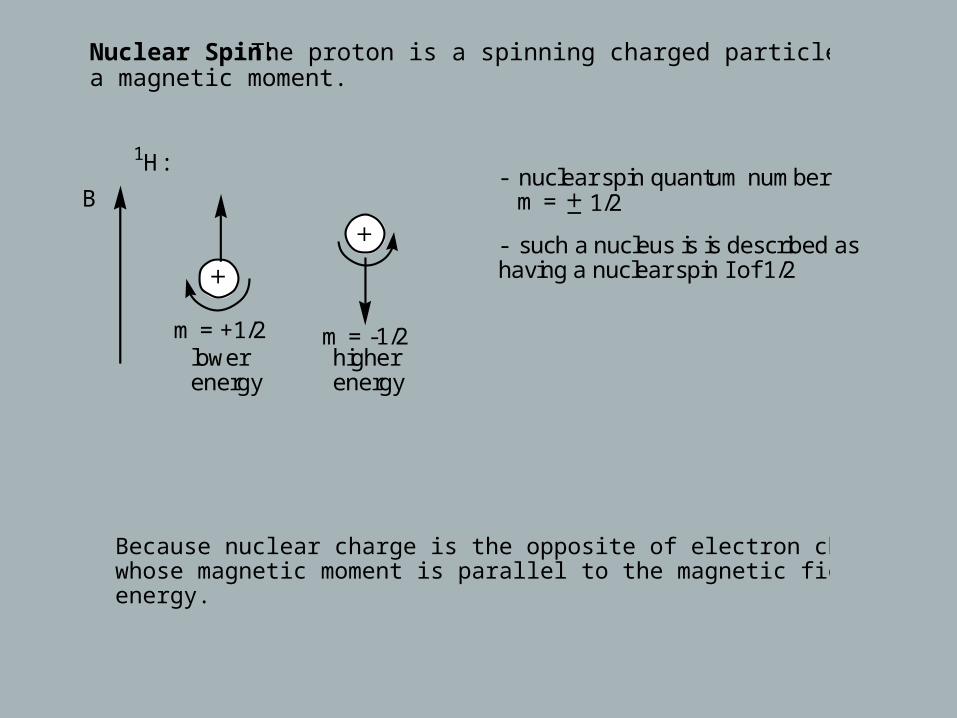
Nuclear Spin: The proton is a spinning charged particle and has also a magnetic moment.
m = +1/2higher energy
lowerenergy
m = -1/2
B
1H:- nuclear spin quantum number m = 1/2
- such a nucleus is is described as having a nuclear spin I of 1/2
Because nuclear charge is the opposite of electron charge, a nucleus whose magnetic moment is parallel to the magnetic field has the lower energy.
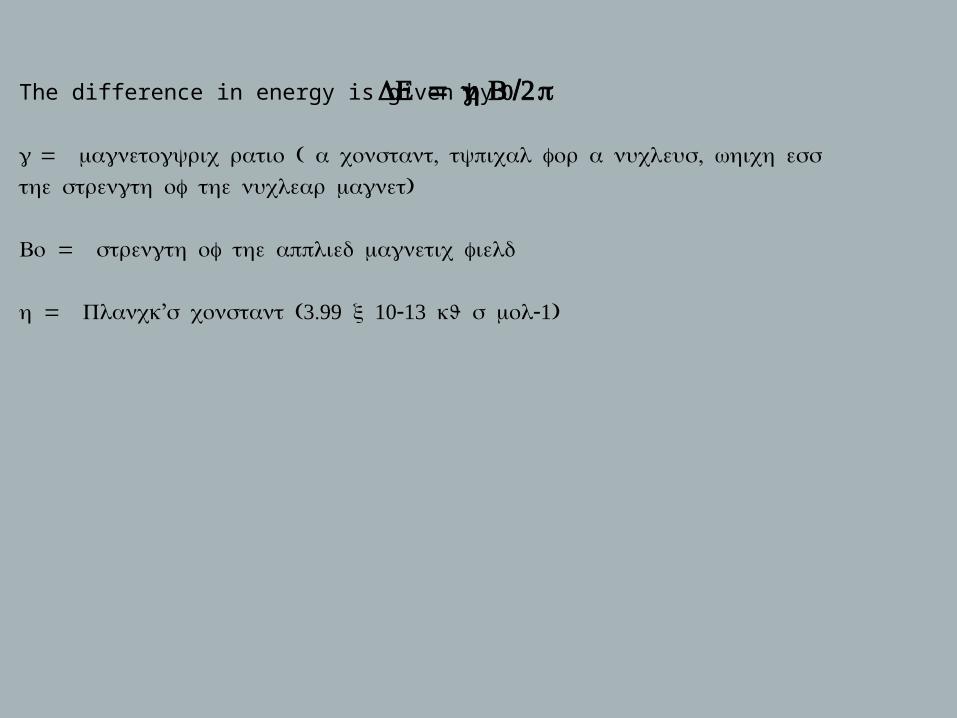
The difference in energy is given by: ΔΕ = hγ B0/2π
γ = ( , , magnetogyric ratio a constant typical for a nucleus which essentially reflects )the strength of the nuclear magnet
= Bo strength of the applied magnetic field
= ’ (3.99 10-13 -1)h Planck s constant x kJ s mol
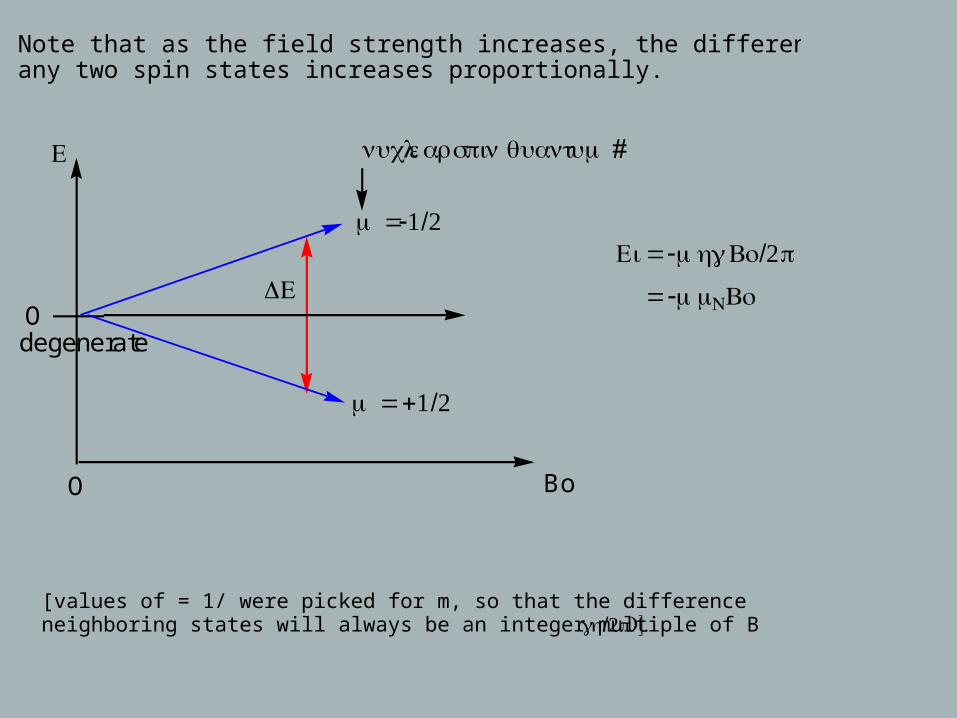
Note that as the field strength increases, the difference in energy between any two spin states increases proportionally.
O Bo
Odegenerate
Ε
ΔΕ
m =-1/2
m = +1/2
nuclear spin quantum #
Ei = -mhγ Bo/2π
= -mμNBo
[values of = 1/ were picked for m, so that the difference in energy between two neighboring states will always be an integer multiple of Bo (γ /2h π)].
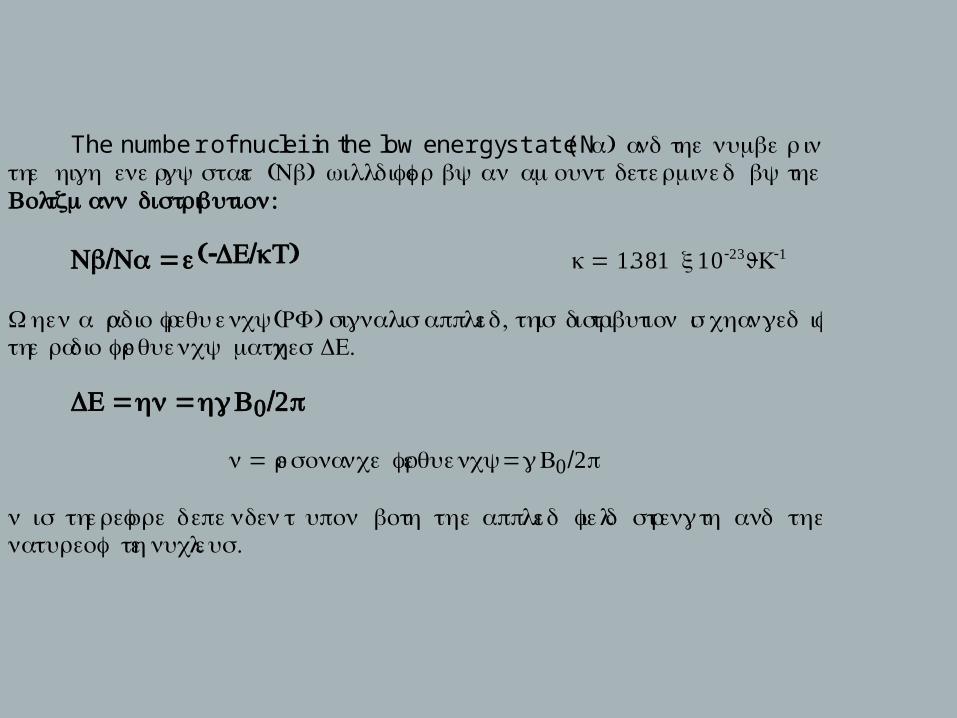
The number of nuclei in the low energy state (Nα) and the number inthe high energy state (Nβ) will differ by an amount determined by theBoltzmann distribution:
Nβ/Nα = e(-ΔΕ/kT) k= 1.381 x10⁻²³J K-1
When a radio frequency (RF) signal is applied, this distribution is changed ifth e radi o frequen cy match es ΔΕ.
ΔΕ = hν = hγ B0/2π
ν = resonan ce freque ncy= γ B0/2π
ν is therefore dependent upon both the applied field strength and thenature of th e nucleu .s
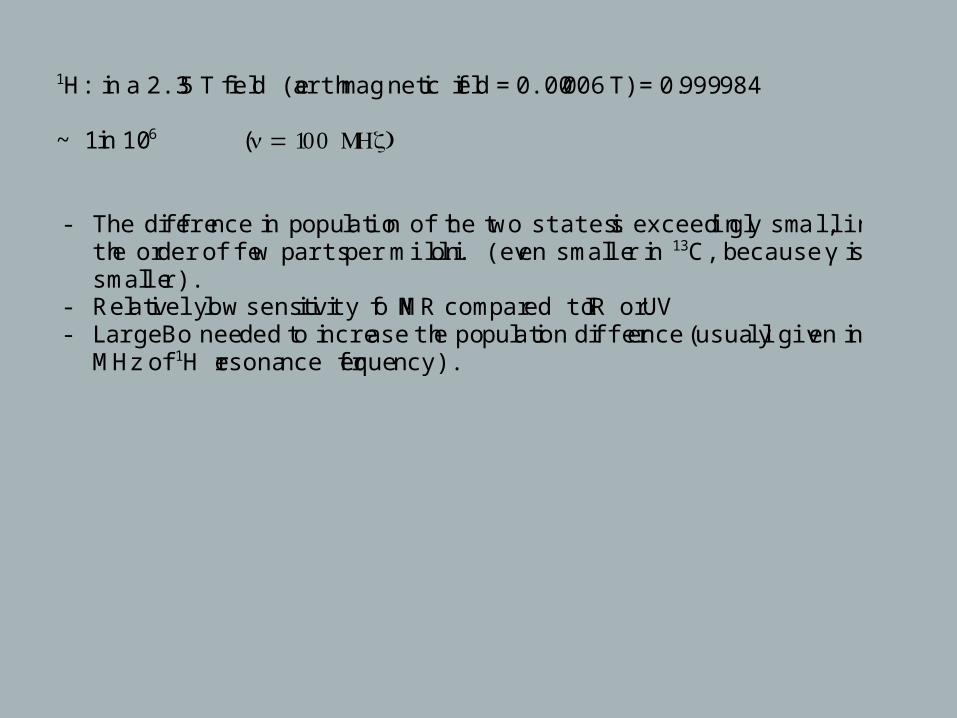
1H: in a 2.35 T field (earth magnetic field = 0.00006 T) = 0.999984
~ 1 in 106 (ν = 100 MHz)
- The difference in population of t he two states i s exceedingly small, inthe order of few parts per million. (even smaller in 13C, because γ issmaller).
- Relatively low sensitivity of NMR compared to IR or UV- Large Bo needed to increase the population difference (usually given in
MHz of 1H resonance frequency).
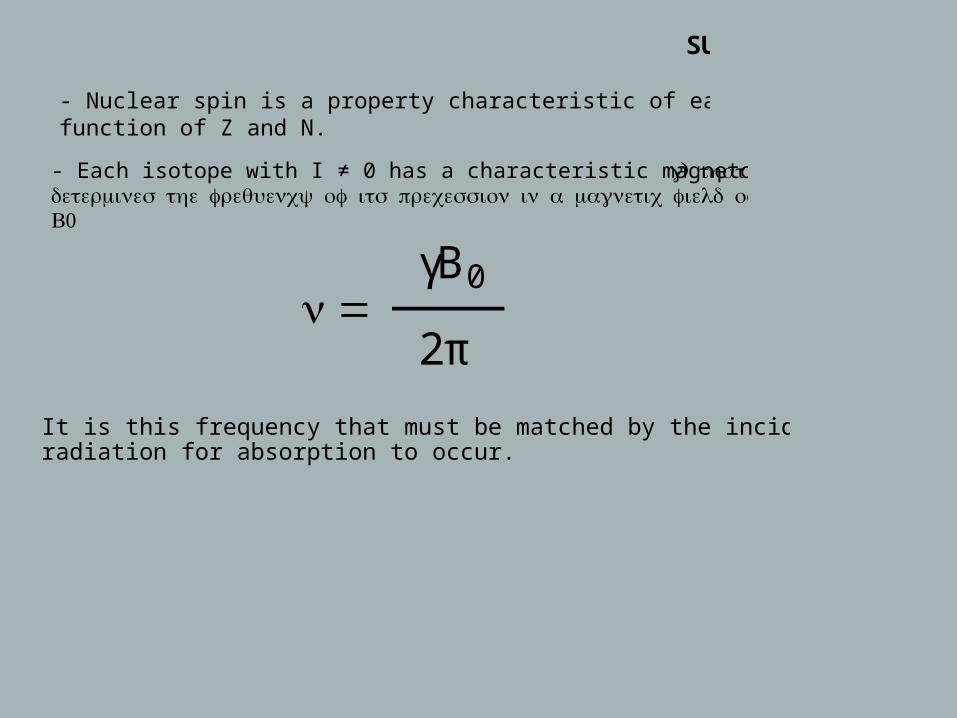
SUMMARY
- Nuclear spin is a property characteristic of each isotope and is a function of Z and N.
- Each isotope with I ≠ 0 has a characteristic magnetogyric ratio (γ) that determines the frequency of its precession in a magnetic field of strength
0B
ν =2π
γB0
It is this frequency that must be matched by the incident electromagnetic radiation for absorption to occur.
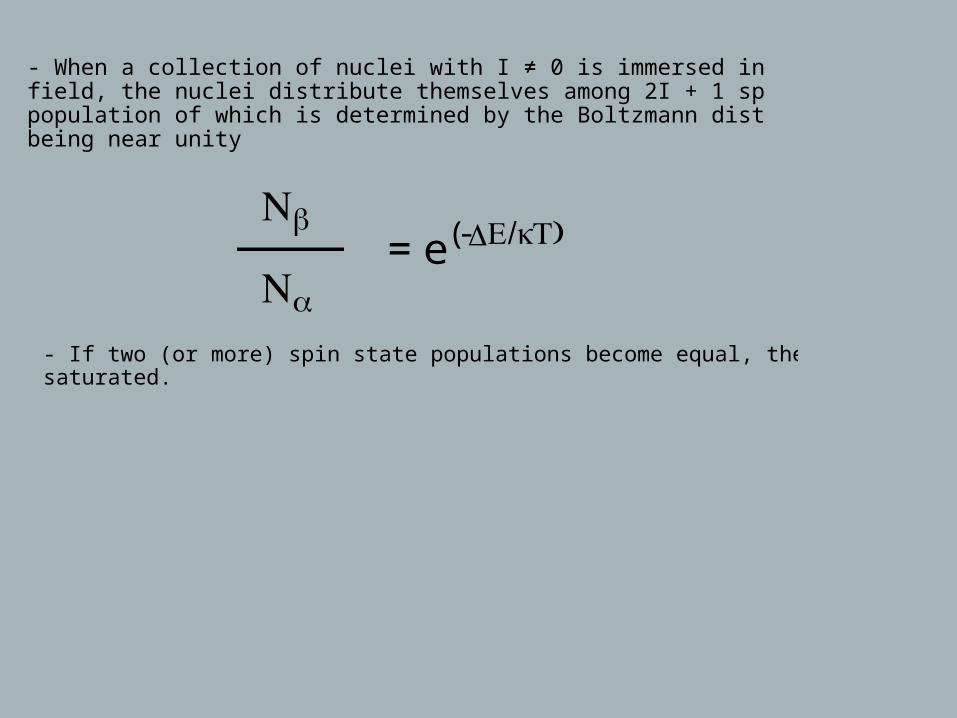
- When a collection of nuclei with I ≠ 0 is immersed in a strong magnetic field, the nuclei distribute themselves among 2I + 1 spin states, the relative population of which is determined by the Boltzmann distribution, usually being near unity
= e(-ΔE/kT)
Nα
Nβ
- If two (or more) spin state populations become equal, the system is said to be saturated.
Obtaining an NMR Spectrum
MagnetSource of RF radiationDetector + amplifierPlotter, sample
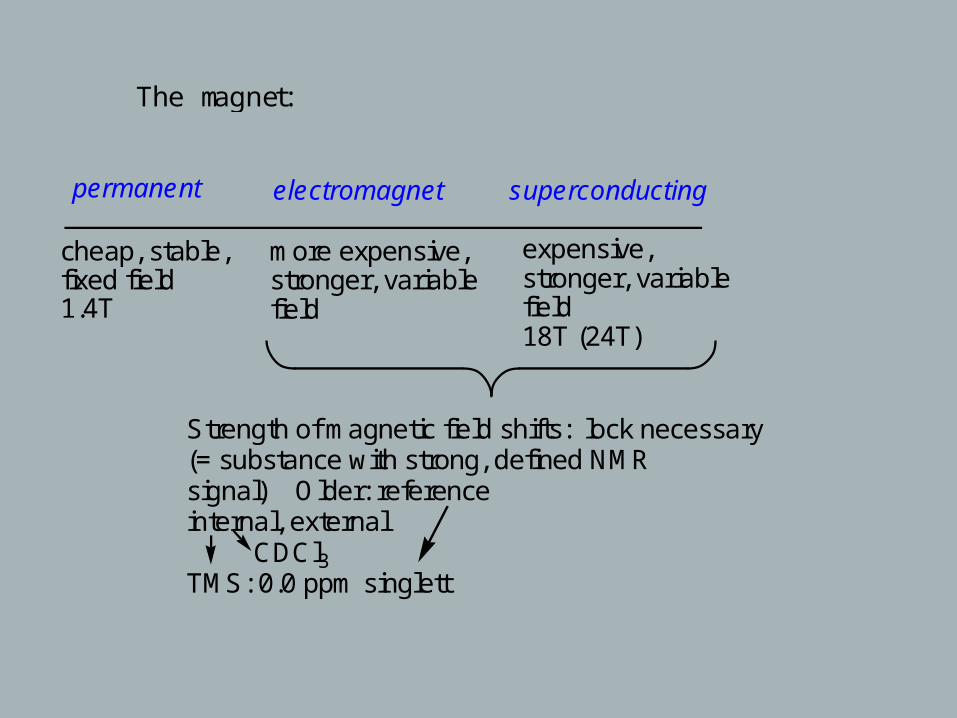
The magnet:
permanent electromagnet superconducting
cheap, stable,fixed field1.4T
more expensive,stronger, variablefield
expensive, stronger, variablefield18T (24T)
Strength of magnetic field shifts: lock necessary (= substance with strong, defined NMRsignal) Older: referenceinternal, external CDCl3TMS: 0.0 ppm singlett
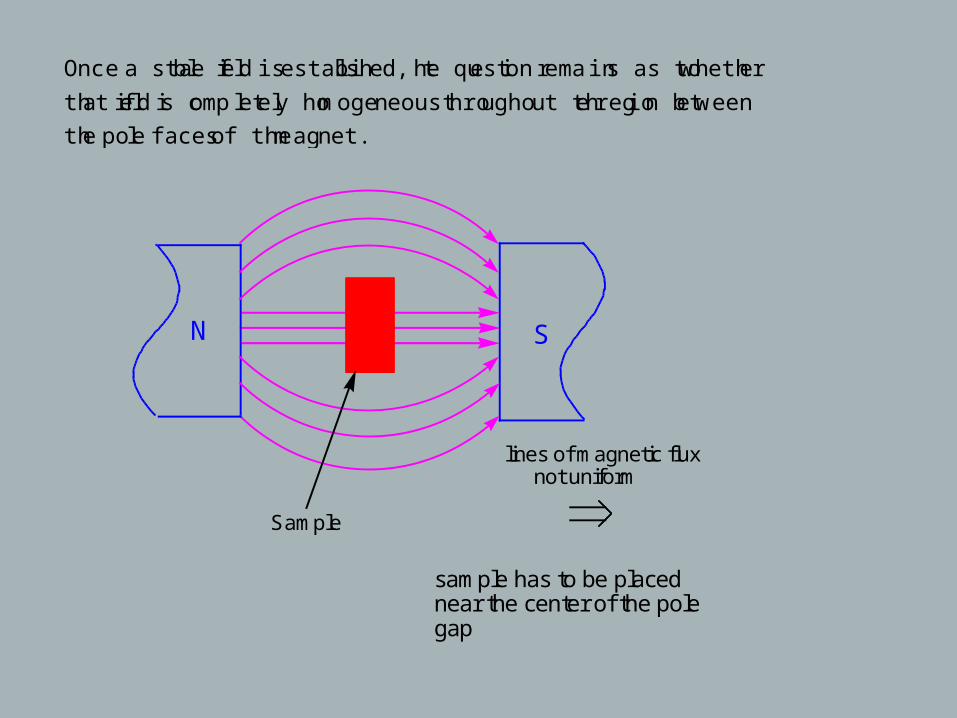
Once a stable field is established, the question remains as to whether
that field is completely homogeneous throughout the region between
the pole faces of the magnet.
Sample
lines of magnetic flux not uniform
sample has to be placed near the center of the pole gap
N S
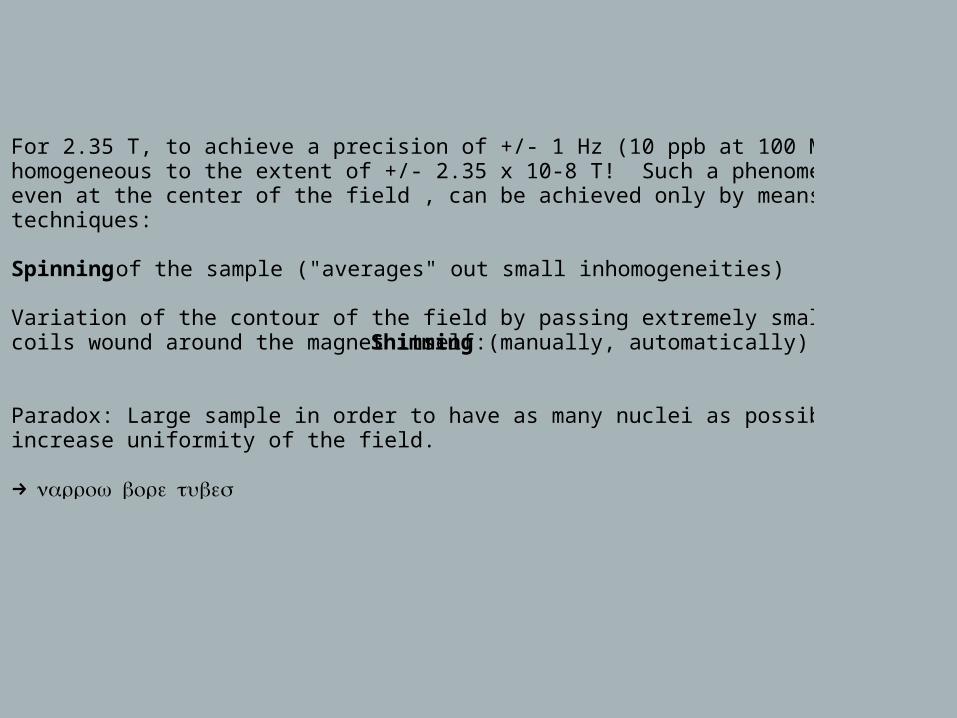
For 2.35 T, to achieve a precision of +/- 1 Hz (10 ppb at 100 MHz) the field must be homogeneous to the extent of +/- 2.35 x 10⁻⁸ T! Such a phenomenal uniformity, even at the center of the field , can be achieved only by means of two additional techniques:
Spinning of the sample ("averages" out small inhomogeneities)
Variation of the contour of the field by passing extremely small currents through shim coils wound around the magnet itself: Shimming (manually, automatically)
Paradox: Large sample in order to have as many nuclei as possible, small sample to increase uniformity of the field.
→ narrow bore tubes
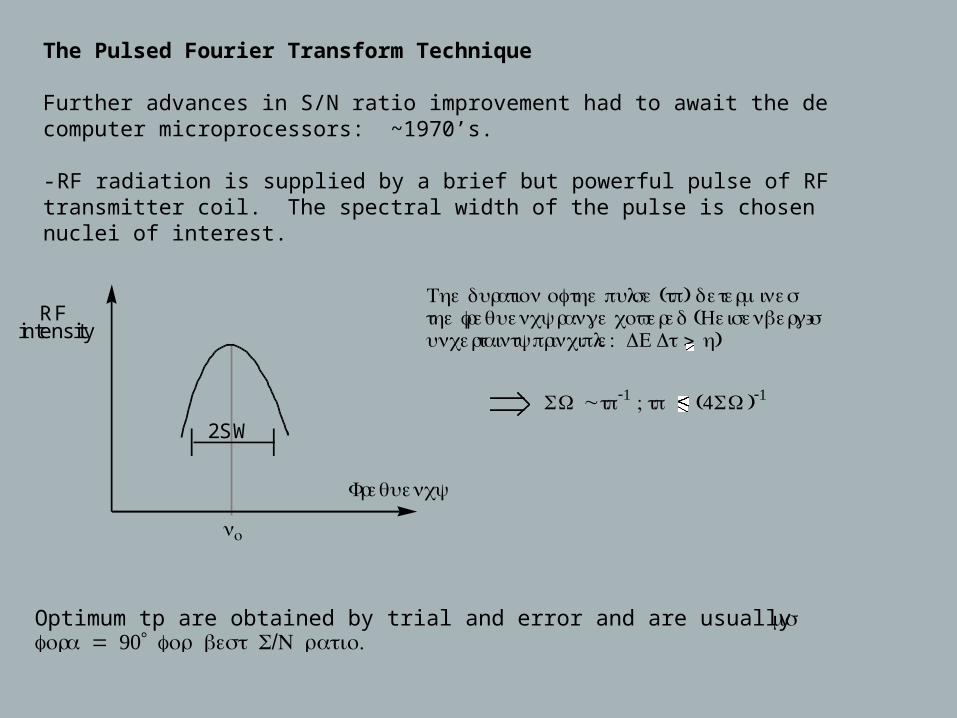
The Pulsed Fourier Transform Technique
Further advances in S/N ratio improvement had to await the development of faster computer microprocessors: ~1970’s.
- RF radiation is supplied by a brief but powerful pulse of RF current through the transmitter coil. The spectral width of the pulse is chosen to cover absorption of all nuclei of interest.
Optimum tp are obtained by trial and error and are usually in the order of 10 μ s forα = 90° / .for best S N ratio
RF
2SW
intensity
νo
The duration of the pulse (tp) determinesthe frequency range covered (Heisenberg's uncertainty principle: ΔΕ Δt h)>
Frequency
SW ~ tp-1 ; tp (4SW)-1
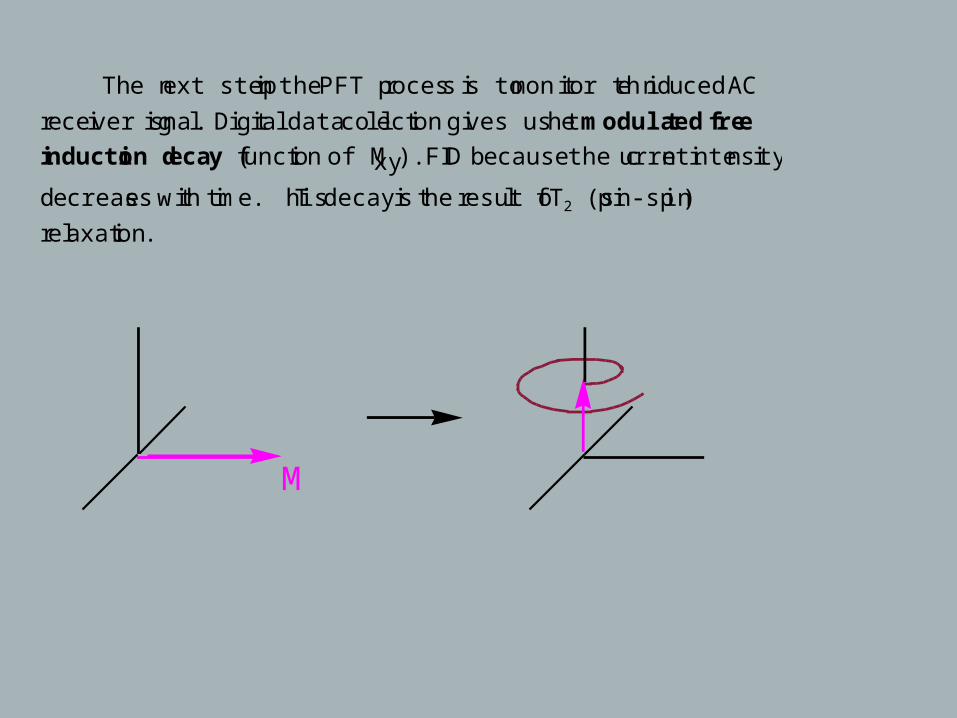
The next step in the PFT process is to monitor the induced AC
receiver signal. Digital data collection gives us the modulated free
induction decay (function of Mxy). FID because the current intensity
decreases with time. This decay is the result of T2 (spin-spin)
relaxation.
M
Time
Voltage
t0
t0
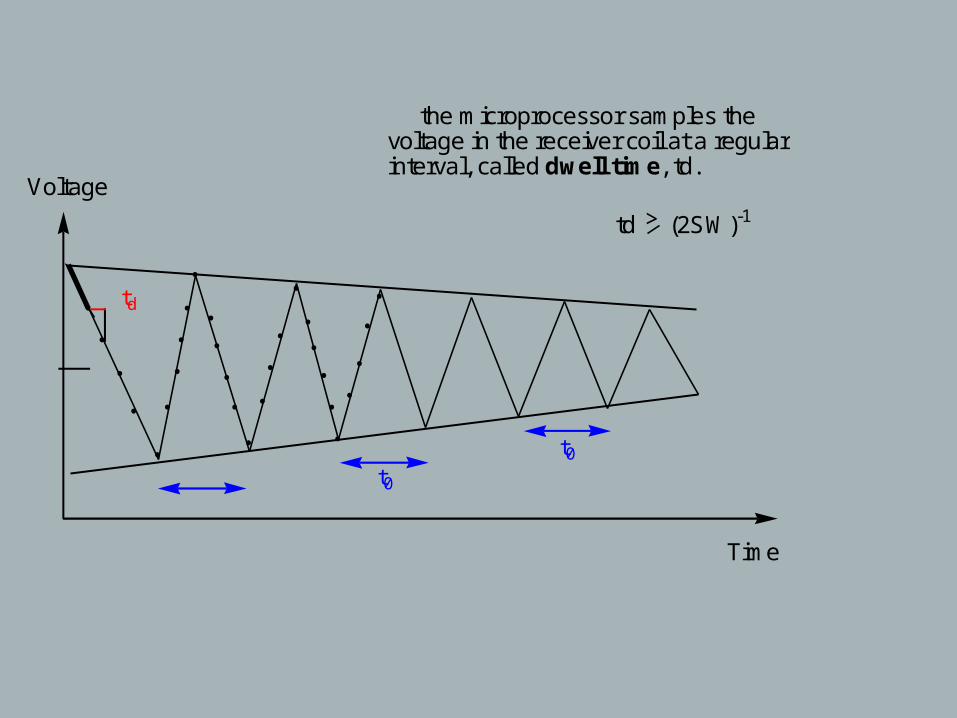
td
the microprocessor samples thevoltage in the receiver coil at a regularinterval, called dwell time, td.
td > (2SW)-1
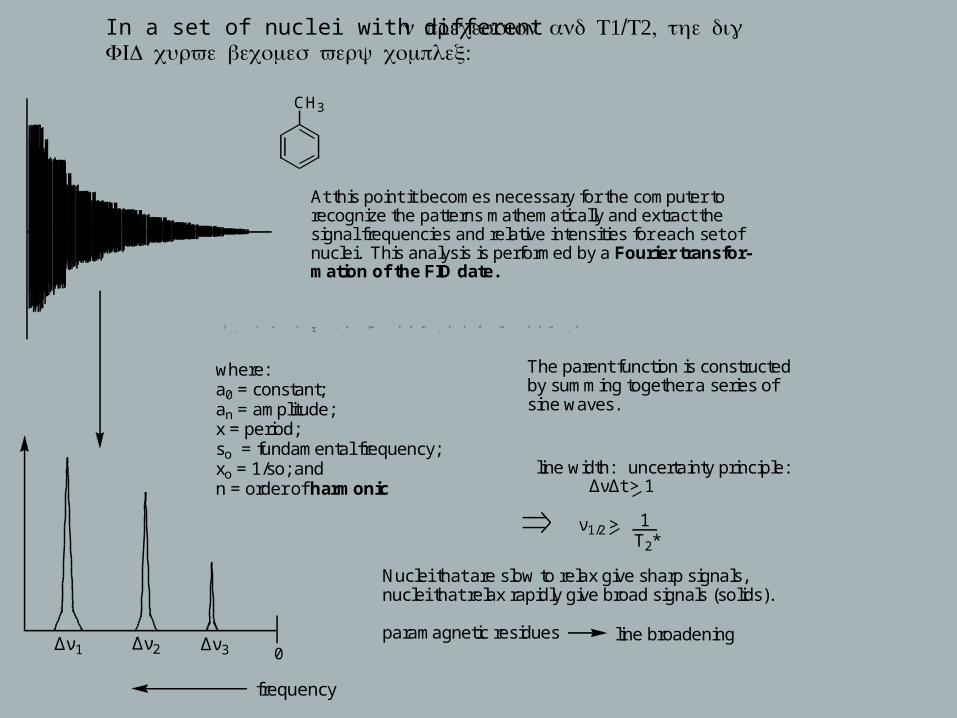
In a set of nuclei with different ν 1/ 2, precession and T T the digital :FID curve becomes very complex
f
( x )
= ao
+ an
cos 2 π nso
x + bn
sin 2 π nso
x{ }
n = 1
∞
∑
CH3
Δν1
frequency
Δν2 Δν3
where:a0 = constant; an = amplitude; x = period; so = fundamental frequency; xo = 1/so; andn = order of harmonic
The parent function is constructedby summing together a series of sine waves.
line width: uncertainty principle: ΔνΔt > 1
ν1/2 > 1T2*
Nuclei that are slow to relax give sharp signals,nuclei that relax rapidly give broad signals (solids).
paramagnetic residues line broadening
At this point it becomes necessary for the computer torecognize the patterns mathematically and extract thesignal frequencies and relative intensities for each set of nuclei. This analysis is performed by a Fourier transfor-mation of the FID date.
0
- Wink, D. J. J. Chem. Ed., 1989, 66, 810. Spin-Lattice Relaxation Times in 1H NMR Spectroscopy.- Glasser, L. J. Chem. Ed., 1987, 64, A228. Fourier Transforms for Chemists.- King, R. W.; Williams, K. R. J. Chem. Ed., 1989, 66, A213, A243. The Fourier Transform in Chemistry.
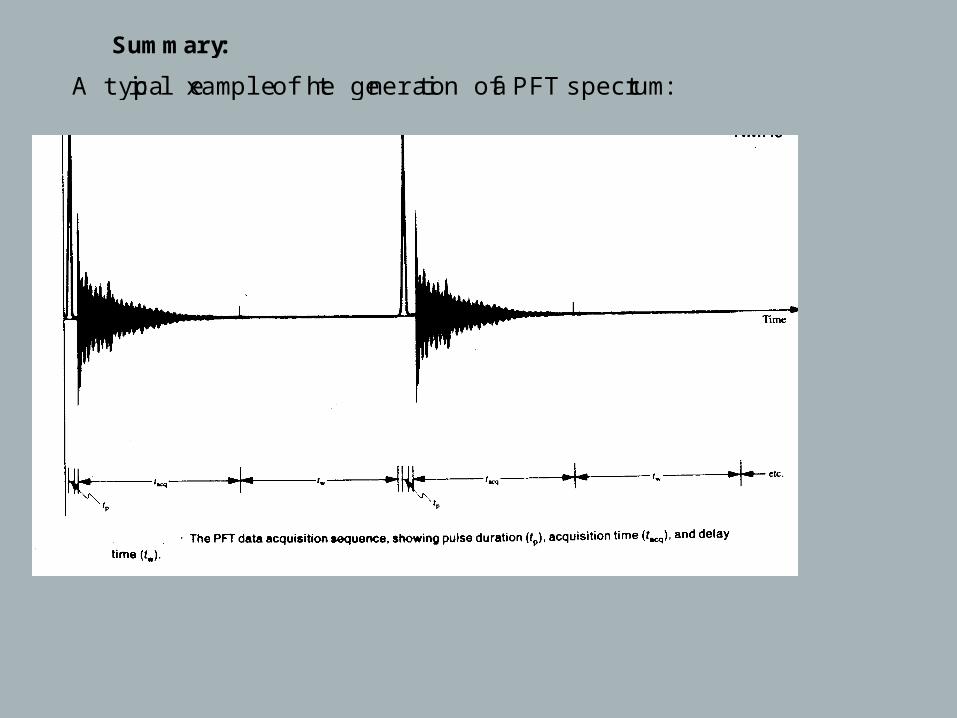
Summary:
A typical example of the generation of a PFT spectrum:
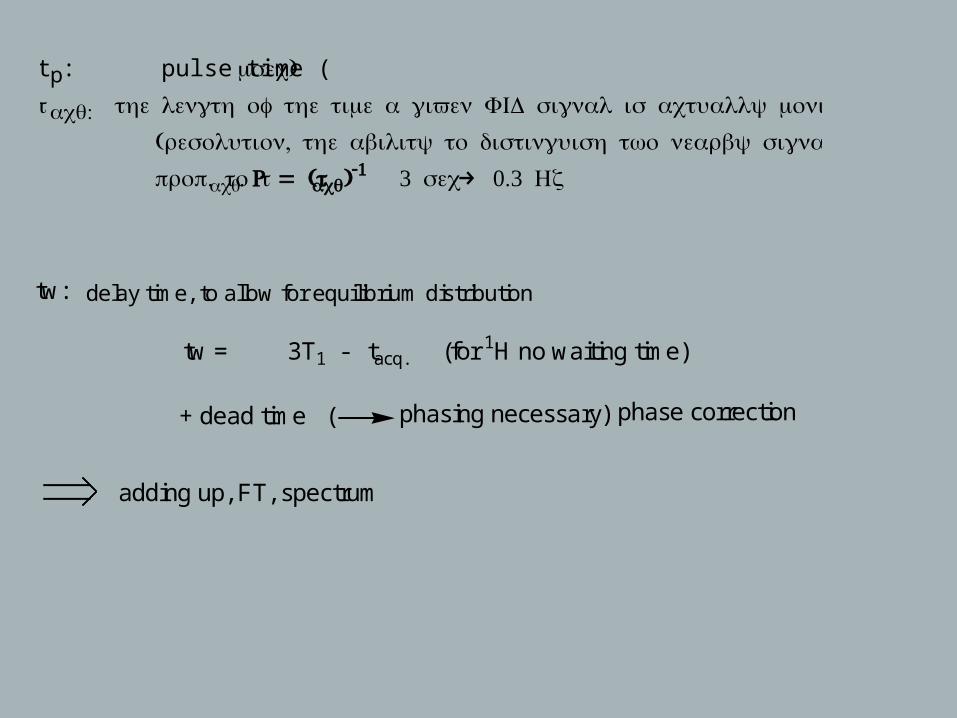
t p: pulse time ( μ )sec
t : acq the length of the time a given FID signal is actually monitored
( , , resolution the ability to distinguish two nearby signals is inversely
. prop to tacq. = (R tacq)-1 3 sec→ 0.3 Hz
tw: delay time, to allow for equilibrium distribution
tw = 3T1 - tacq.
+ dead time ( phasing necessary)
(for 1H no waiting time)
phase correction
adding up, FT, spectrum
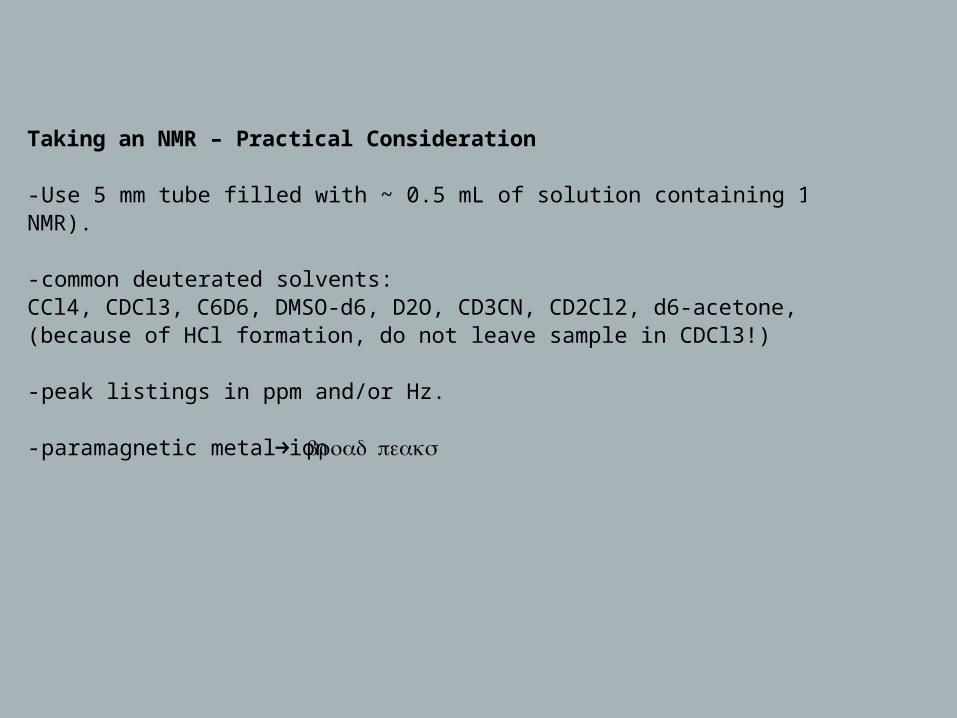
Taking an NMR – Practical Consideration
- Use 5 mm tube filled with ~ 0.5 mL of solution containing 1-5 mg of sample (1H NMR).
- common deuterated solvents:CCl4, CDCl3, C6D6, DMSO-d6, D2O, CD3CN, CD2Cl2, d6-acetone, CD3OD (because of HCl formation, do not leave sample in CDCl3!)
- peak listings in ppm and/or Hz.
- paramagnetic metal ion → broad peaks
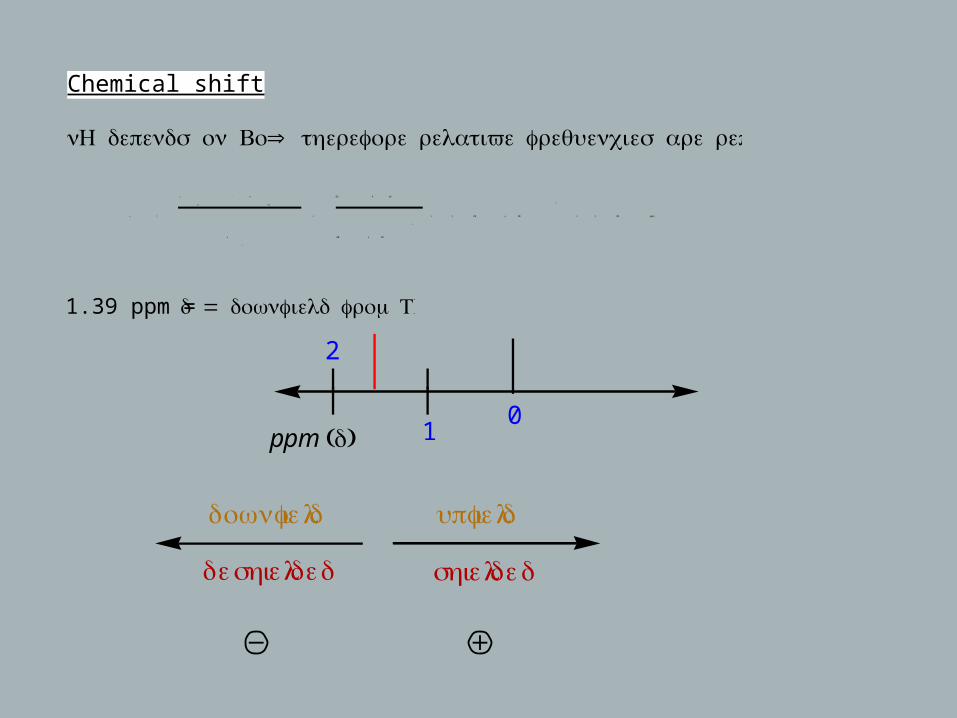
Chemical shift
ν H depends on Bo⇒ :therefore relative frequencies are reported
1.39 ppm = δ = .downfield from TMS
2
10
ppm (δ)
downfield
deshielded
upfield
shielded
ν =
ν
act .
− ν
TMS
ν
o
=
83 . 4 Hz
60 x 10
6
= 1 . 39 x 10
− 6
= 1 . 39 ppm
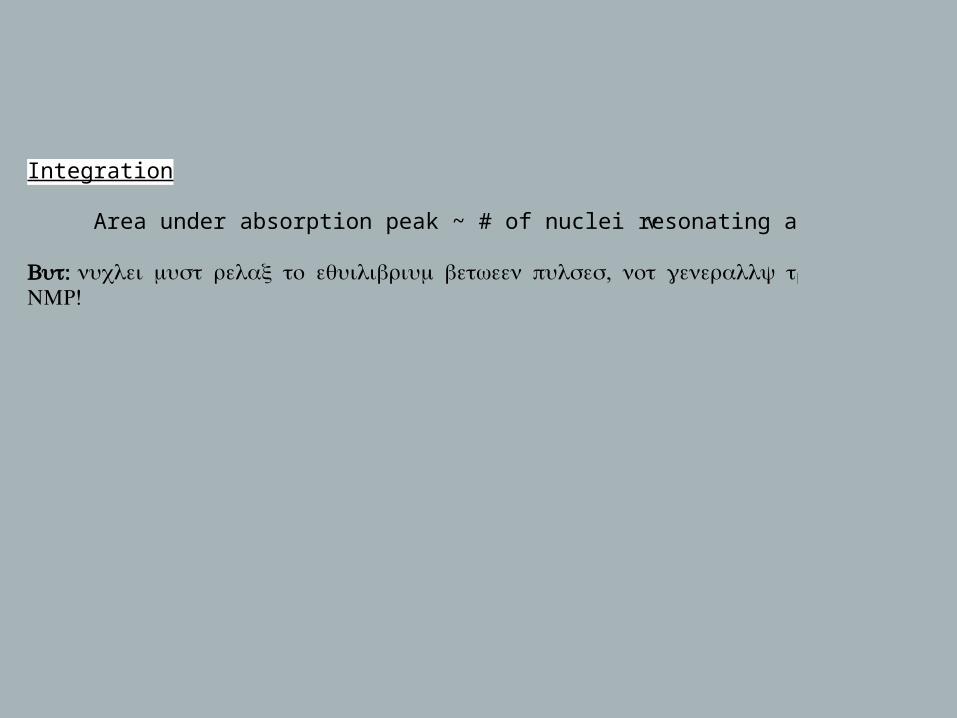
Integration
Area under absorption peak ~ # of nuclei resonating at that ν
:But , 13 nuclei must relax to equilibrium between pulses not generally true of C!NMR
First-Order Spin-Spin-Coupling
From previous discussions one could have gotten the impression that
a typical 1H NMR spectrum exhibits just one signal for each set of
equivalent 1H-nuclei and that the same thing is true for 13C spectra,
as well as for spectra of any other isotope. However, there are many
more lines in a spectrum, and while these extra lines do make a
spectrum more complex, they also offer valuable structural
information that complements the chemical shift data.
1H - 1H
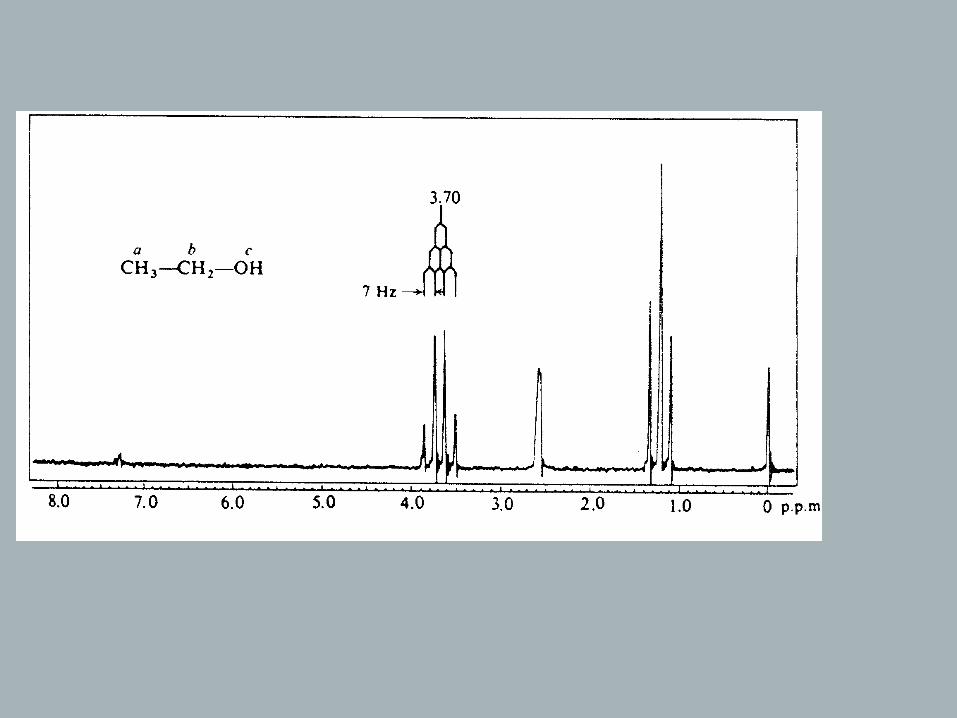
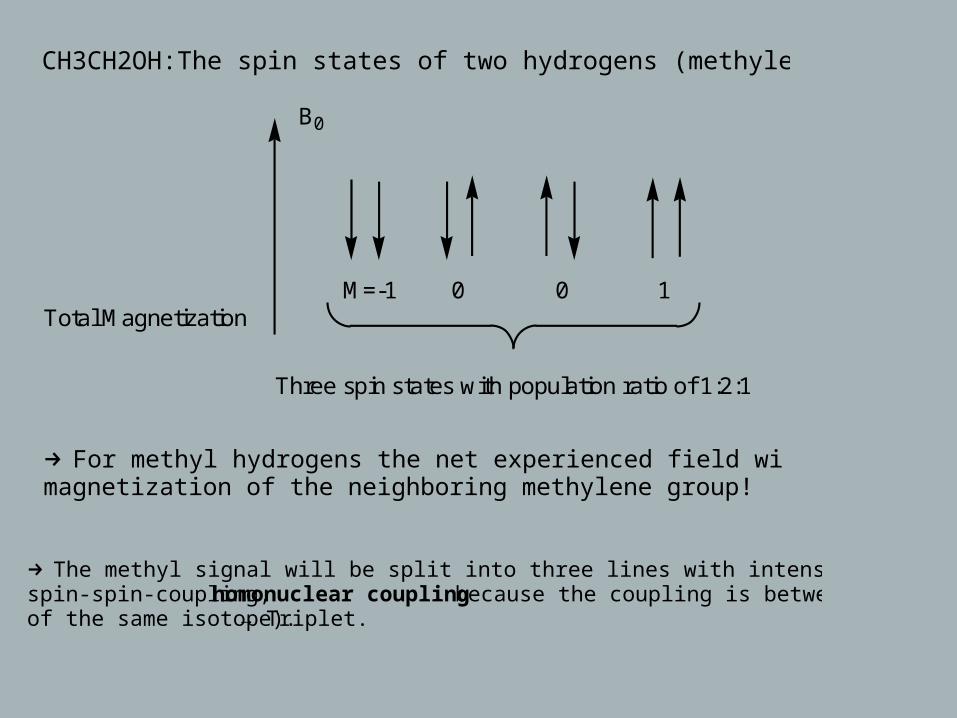
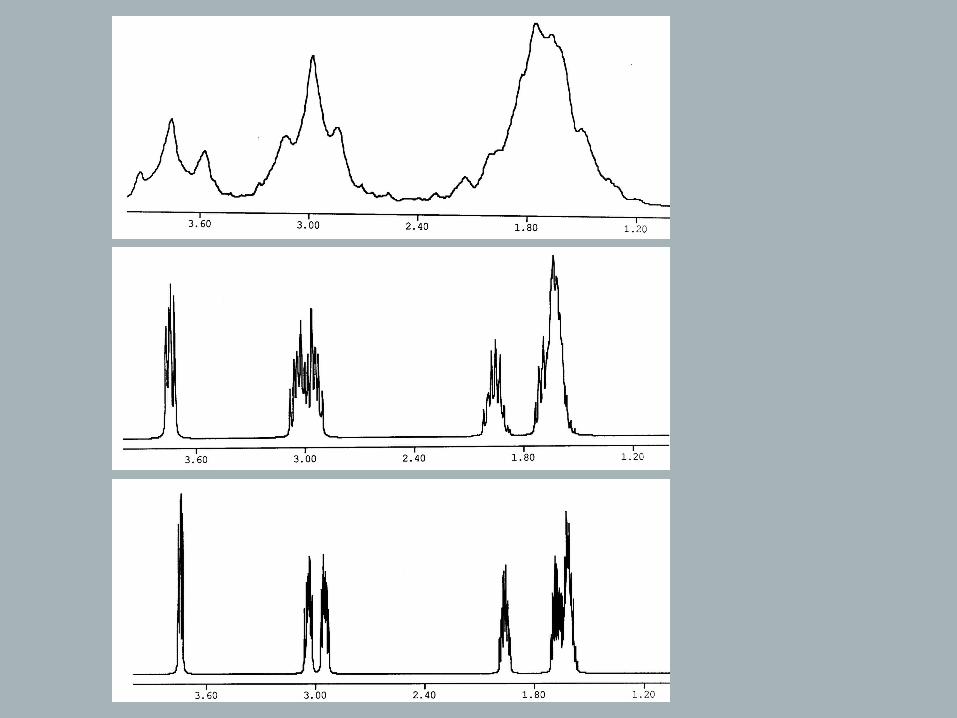
CH3CH2OH:The spin states of two hydrogens (methylene group):
→ For methyl hydrogens the net experienced field will depend on the magnetization of the neighboring methylene group!
→ The methyl signal will be split into three lines with intensity ratio 1 : 2 : 1 (= spin-spin-coupling, homonuclear coupling because the coupling is between nuclei of the same isotope). → Triplet.
B0
Total MagnetizationM=-1 0 0 1
Three spin states with population ratio of 1:2:1
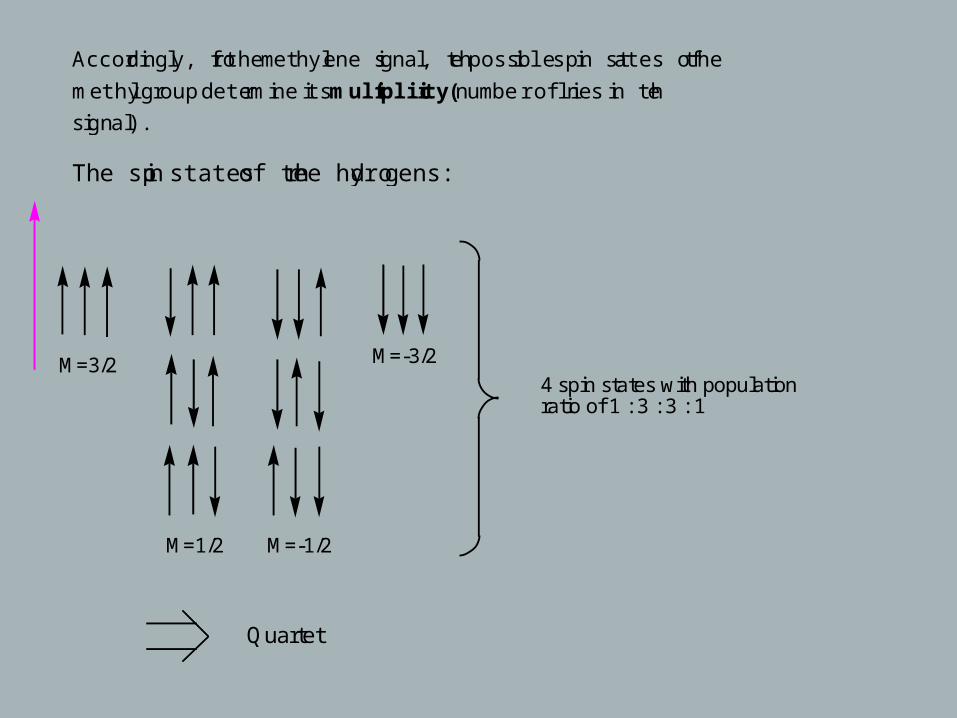
Accordingly, for the methylene signal, the possible spin states of the
methyl group determine its multiplicity (number of lines in the
signal).
The spin states of three hydrogens:
M=3/2
M=1/2 M=-1/2
M=-3/2
4 spin states with populationratio of 1 : 3 : 3 : 1
Quartet

Accordingly, a doublet is observed for hydrogens that are coupled to
a methine (CH) proton.
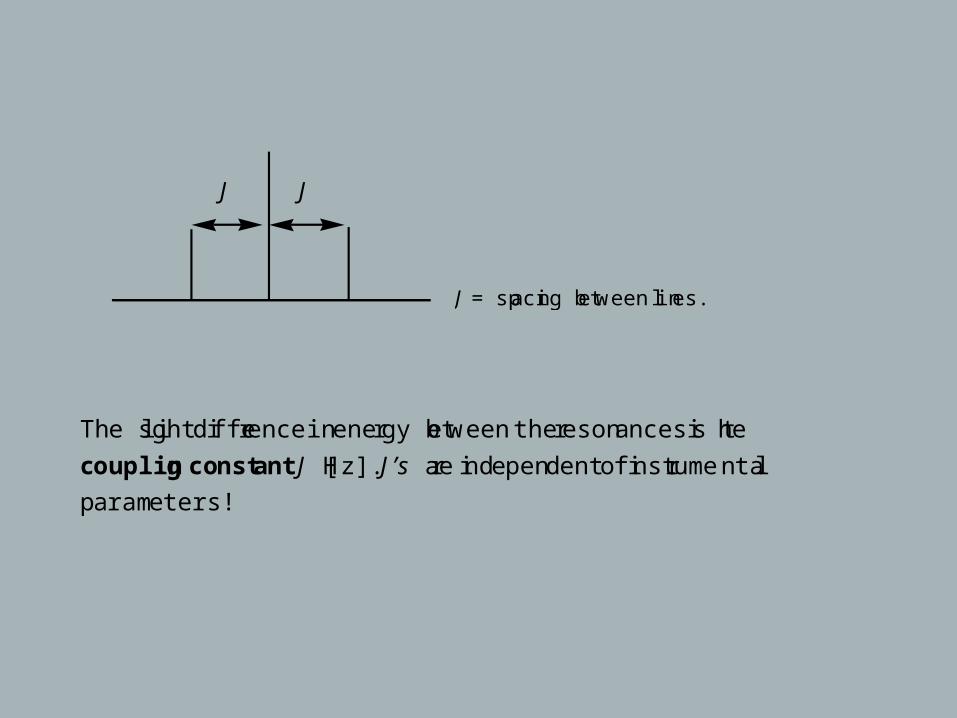
J = spacing between lines.
The slight difference in energy between the resonances is the
coupling constant J [Hz]. J’s are independent of instrumental
parameters!
J J
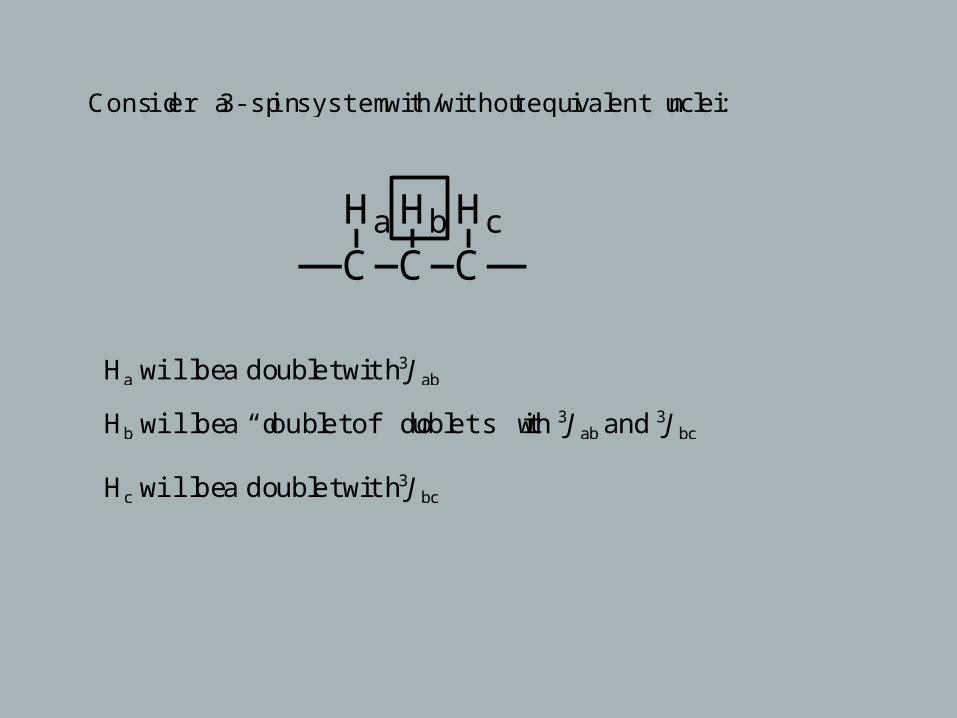
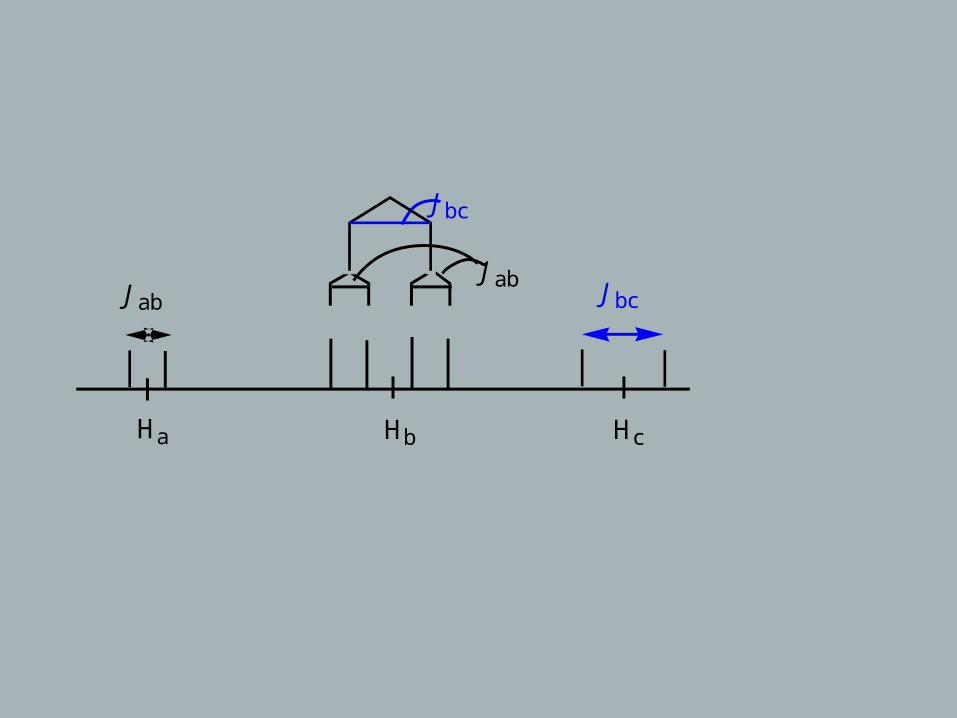
Consider a 3-spin system with/without equivalent nuclei:
Ha will be a doublet with 3Jab
Hb will be a “doublet of doublets” with 3Jab and 3Jbc
Hc will be a doublet with 3Jbc
CHa
CHb
CHc
Jab
Ha Hb Hc
Jbc
Jbc
Jab
13C NMR
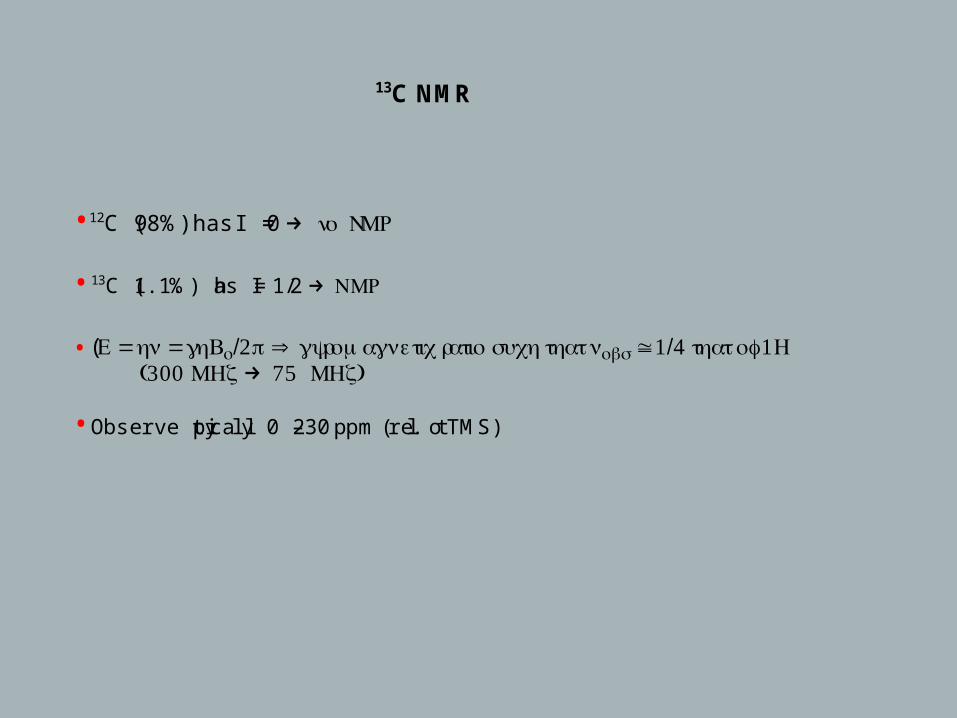
• 12C (98%) has I = 0 → n o NMR
• 13C (1.1.%) has I = 1/2 → NMR
•
• Observe typically 0 – 230 ppm (rel. to TMS)
(Ε = hν = γhBo/2π ⇒ gyromagnetic ratio such that νobs ≅ 1/4 that of 1H (300 MHz → 75 MHz)
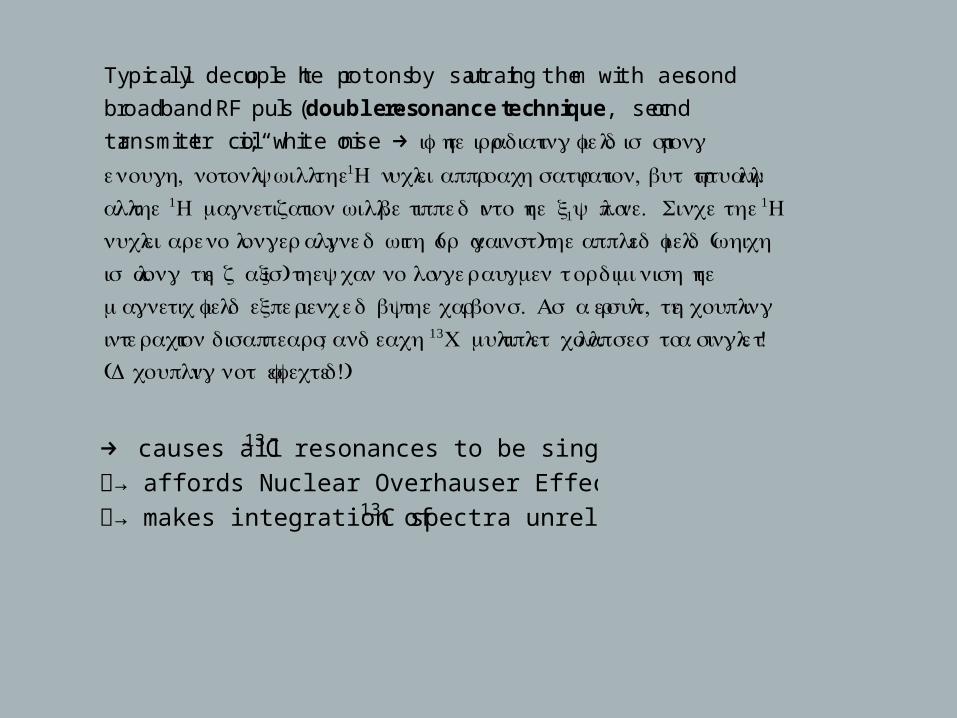
Typically decouple the protons by saturating them with a second
broadband RF puls (double resonance technique, second
transmitter coil; “white noise” → i f th e irradiatin g fiel d i s strongenough, not onl ywill the1H nucl ei approac h saturati ,on but virtually
a ll th e 1H magnetizati on willbe tippe d i nto th e x1 y pla . ne Since the1H
nucl ei are no longer aligne d wi (th o r agai ) nst the appli ed fiel (d which
i s alon g th e z axi ) s they ca n no longe r augmen t ordimini sh the
magneti c fiel d experience d bythe carbon . s A s a resul , t th e couplinginteractio n disappears, and each13C multipl et collap ses to a singlet!( D coupli ngn ot effected!)
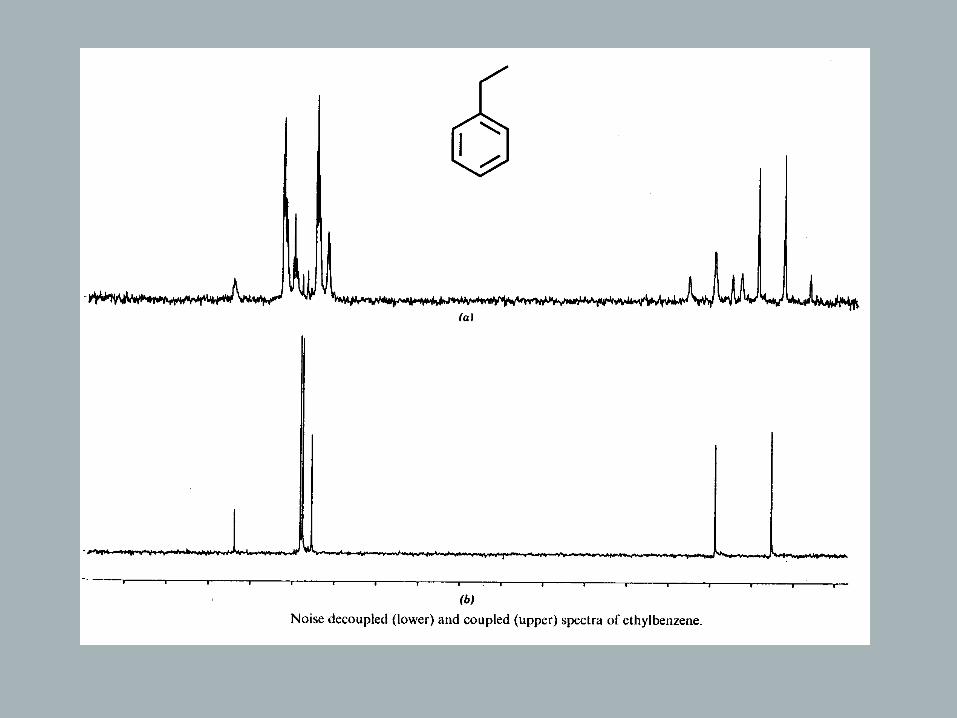
→ causes all 13C resonances to be singlets
→ affords Nuclear Overhauser Effect
→ makes integration of 13C spectra unreliable
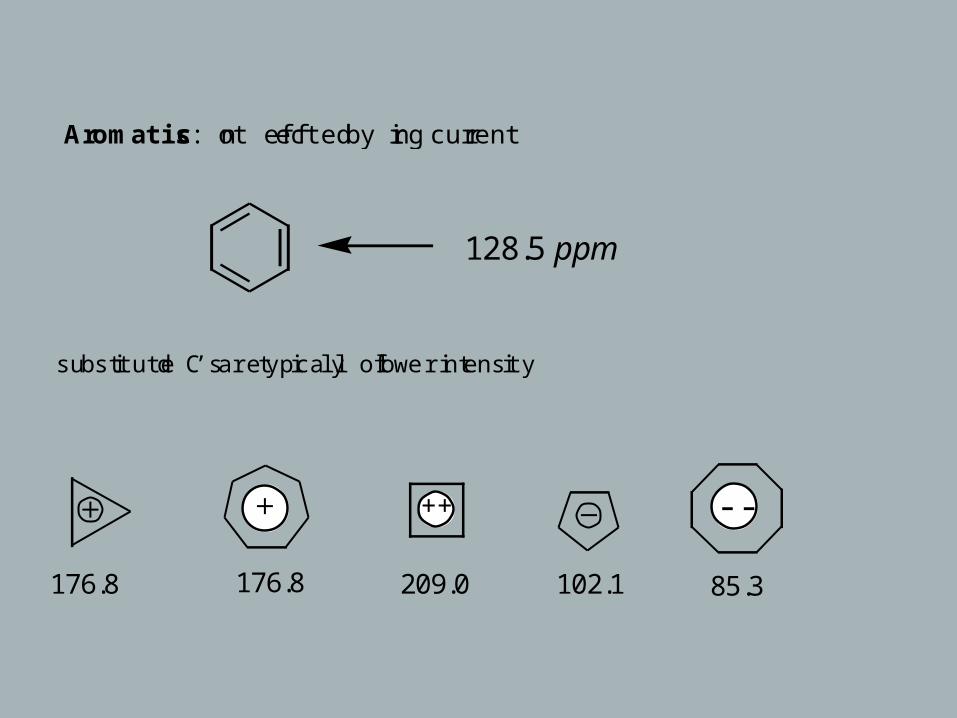
Aromatics: not effected by ring current
substituted C’s are typically of lower intensity
128.5 ppm
176.8 176.8
++
209.0 102.1
- -
85.3
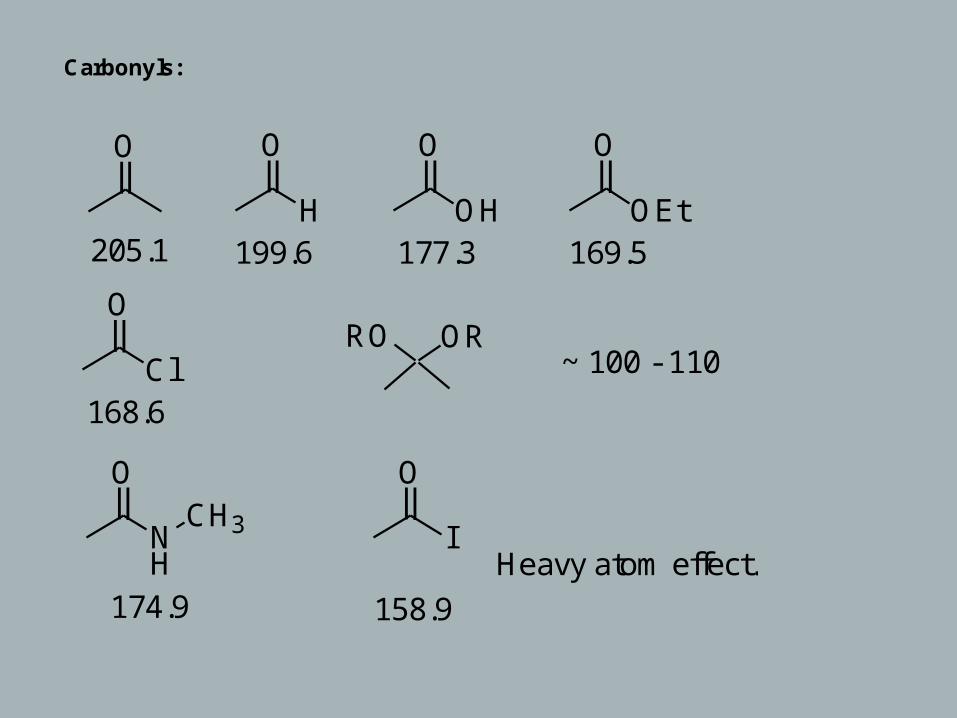
Carbonyls:
O O
H
O
OH
O
OEt
O
ClRO OR
O
NH
CH3
O
I
205.1 199.6 177.3 169.5
168.6
~ 100 - 110
Heavy atom effect.174.9 158.9


![Spectroscopy UV VIS [Compatibility Mode]](https://img.dokumen.tips/doc/110x75/55cf91af550346f57b8fa5bd/spectroscopy-uv-vis-compatibility-mode.jpg)


