Embed Size (px)
Citation preview
NBER WORKING PAPER SERIES
CHARTING THE ECONOMIC LIFE CYCLE
Ronald LeeSang-Hyop LeeAndrew Mason
Working Paper 12379http://www.nber.org/papers/w12379
NATIONAL BUREAU OF ECONOMIC RESEARCH1050 Massachusetts Avenue
Cambridge, MA 02138July 2006
Research for this paper was funded by two grants from the National Institutes of Health, NIA R01 AG025488and AG025247. The authors are grateful to other project participants for use of their estimates for othercountries and to Tim Miller, Comfort Sumida, Anchi Tung and Avi Ebenstein for their help withcalculations. The views expressed herein are those of the author(s) and do not necessarily reflect the viewsof the National Bureau of Economic Research.
©2006 by Ronald Lee, Sang-Hyop Lee and Andrew Mason. All rights reserved. Short sections of text, notto exceed two paragraphs, may be quoted without explicit permission provided that full credit, including ©notice, is given to the source.
Charting the Economic Life CycleRonald Lee, Sang-Hyop Lee and Andrew MasonNBER Working Paper No. 12379July 2006JEL No. J1
ABSTRACT
Understanding the economic lifecycle – how it varies and why – is important in its own right, butis also critical to understanding how changes in population age structure influence many features ofthe macroeconomy. Economic behavior over the life cycle can be summarized by the average levelsof consumption and labor earnings at each age, as shaped by biology, culture, institutions andindividual choice. Here we present estimates of these in detail for the US and Taiwan, showing theroles played by public and familial transfer systems as well as asset accumulation, and present morebasic profiles for selected additional countries drawing on studies from a larger project. Averageeconomic dependency occurs when consumption exceeds labor earnings, typically in childhood andold age. A changing population age distribution alters the relative numbers of weighted consumersand producers, as summarized by the support ratio. The “demographic dividend” occurs during asustained period of improving support ratios during the demographic transition, as can be shownusing these profiles. The estimated cross-sectional age profiles of labor income have a broadlysimilar hump shape. However, there are striking contrasts in the timing of earnings over the lifecycle. The consumption profiles reveal even more striking contrasts, with a flat age profile of totaladult consumption in Taiwan and a steeply rising one in the U.S. We believe these differences reflectthe extended family versus the state as the primary locus of transfers to the elderly. Profiles forprivate consumption are also quite variable, with Indonesia peaking early around age 25, Taiwanbeing essentially flat, and the US peaking late at around 55. Private expenditures on education showwide variations, with unusually high expenditures in some Asian countries. Because of possiblepublic-private substitutions, it is questionable to assign causality to either for differences in totalconsumption, but it is hard to avoid noticing that without public spending on Medicare andinstitutional Medicaid in the U.S., total consumption would decline after 55, whereas with them, itrises strongly. There is only a short period of life during which production exceeds consumptionbarely more than 30 years in the US, Taiwan, and Thailand. The brevity of this phase contrastssharply with high life expectancy, approaching 80 years in many countries.
Ronald LeeDemography and EconomicsUniversity of California2232 Piedmont AvenueBerkeley, CA 94720and [email protected]
Sang-Hyop LeeDepartment of EconomicsUniversity of Hawaii at Manoa2424 Maile Way, Saunders 542Honolulu, HI [email protected]
Andrew MasonDepartment of EconomicsUniversity of Hawaii at ManoaPopulation and Health StudiesEast-West Center2424 Maile Way, Saunders 542Honolulu, HI [email protected]
Introduction The shape of the demographic life cycle is of fundamental interest, which demographers recognize through extensive efforts to estimate, describe and interpret the age-shapes of fertility, mortality, marriage, divorce, and migration. These age-shapes are influenced by biology, culture, economic constraints and individual choice. Similarly, the shape of the economic life cycle is of fundamental interest in its own right, and this shape is influenced by the same set of factors. Here we will be primarily concerned with the estimation and description of the basic economic life cycle, and some illustrative comparisons of how it differs across countries and over time within countries in recent years.
Economic behavior over the life cycle can be summarized by the amount consumed at each age and by the amount produced through labor at each age. One sort of economic dependency occurs when consumption exceeds labor earnings, a condition that marks off periods in childhood and old age. From this point of view, an older person is economically dependent even if she has accumulated claims on output that more than offset her consumption, claims that could take the form of entitlements to transfers or ownership of assets. Often the economic lifecycle is treated in a highly stylized fashion. Dependency ratios and other similar age structure variables, for example, capture only the broadest features of the economic lifecycle, and quadratic functions smooth through important details of the age patterns. Our goal here is to measure it in comprehensive detail. However, we have not attempted to take time use into account, so such important issues as the time spent by parents caring for their children, or time spent caring for elderly relatives, are not covered here.
Individual consumption or production by age are seldom calculated, because attention naturally turns toward more disaggregated measures such as wages, labor force participation rates, hours worked, or household expenditures. However, although per capita consumption and production may seem like crude measures, they summarize and incorporate the influences of many factors that may have contradictory or complementary effects on the economic life cycle.
Demographic age profiles for fertility and mortality are of interest because they describe a basic aspect of human behavior. But they are also important because they can be applied to a population age distribution to calculate the number of births and deaths occurring in a period. Such a calculation requires the assumption, seldom made explicit, that variations in the population age distribution and in the age profiles of fertility and mortality, are independent. The Easterlin Hypothesis asserts the contrary: that an unusually large age group will experience unusually low fertility. Similarly, an unusually large share of young children in the population might, in some contexts, be expected to cause mortality of young children to be higher. The assumption of independence makes it possible to generate numbers, but various feedback processes render the calculations suspect.
Concerns of the same sort arise when age schedules of consumption and production are applied to population age distributions to generate levels of aggregate consumption and labor earnings, which we will call expected consumption and expected labor earnings. When the population age distribution changes, it alters their relative size, as summarized by the ratio of expected earnings to expected consumption, called the
2
support ratio.1 There has been recent interest in the demographic dividend, which occurs during a sustained period of improving support ratios during the demographic transition, and which is estimated using age profiles of per capita consumption and labor earnings of the sort described above. However, as with fertility and mortality, such calculations are undermined when there is feedback from the population age distribution to the age profiles of consumption and labor earning. For example, there is ample reason to expect an unusually large cohort to experience reduced earnings (Easterlin, 1978, and a large subsequent literature).2
Just as broad changes in aggregate economic dependency may be illuminated by age profiles of consumption and labor earnings in general, more specific consequences of changing population age distributions can be illuminated using per capita age profiles for more specific kinds of consumption, production, or other economic behaviors, but always in reference to population level age group averages rather than conditional on participation. Examples include the demand for housing (Mankiw and Weil, 1989; McFadden, 1994), stock market fluctuations (Poterba, 2004), saving rates (Modigliani, 1988; Mason, 1987, 1988; Cutler et al. 2001), interest rates, and impending fiscal problems (Lee and Edwards, 2001, 2002). As always, such disaggregation carries its own hazards, since there may be substitution across subcategories such as publicly provided health care or education, and private expenditures on these, and the overall patterns of change may be obscured. This paper will consider methodological issues in estimating the economic life cycle. It will then present cross-sectional estimates of consumption and labor earning for a number of countries, including some disaggregation into public and private, and a separate examination of expenditure on education. Next, we will consider how to interpret and explain the differences that are observed. Finally we will consider changes over time in the age profiles for Taiwan and the US since around 1980. The estimates presented here draw upon a number of studies that are being carried out as part of a larger study of the economic lifecycle and the reallocations systems - primarily through saving and public and familial transfers – that respond to the economic lifecycle. A system of accounts, called National Transfer Accounts, is being developed that is consistent with National Income and Product Accounts but provides much-needed age data. The methodology for constructing estimates is discussed briefly in this paper, but more detailed information will be available on the project website – www.ntaccounts.org. The researchers and a principle source for the estimates presented here are provided in the references section.
1 For example, Cutler et al (1991) estimate support ratios for the US from 1950 to 2050. The inverse of the support ratio is the Chayanov ratio. Chayanov (1966) used standardized age profiles of production and consumption to form ratios of expected consumers to expected producers at the household level. Such ratios are now known as “Chayanov ratios”. See e.g Lee and Kramer, 2002. 2 The effect of a small change in population age structure on the macro-economy can be decomposed into two additive components: the effect of the change in population age structure weighted by the initial age profiles of production and consumption (or other items of interest), plus the induced changes in the shapes of these age profiles weighted by the initial population age distribution (Lee, 1997). The first effect is compositional or mechanical, and the second is behavioral.
3
Conceptual Background
Individuals versus Households Age profiles of consumption and production are viewed from an individual, rather than a household, perspective in this paper. In economies where formal sector employment dominates, measuring production (or earnings) for individuals is a relatively straight-forward task. In traditional settings, where employment is informal and production is often organized within a family enterprise, estimating production by age for individuals is difficult. In any setting, allocating consumption to individuals is a challenging task, because most expenditure data are collected for households rather than individuals. Moreover, some goods are jointly consumed or involve increasing returns to scale so that allocating consumption to individuals inevitably involves arbitrary rules.
From the household perspective, production and consumption are attributes of households, varying with age of the household head. Constructing production and consumption profiles is more straight-forward, but there are tradeoffs involved. The first is that the effects of co-resident children and elderly on household consumption and production profiles must be explicitly modeled or – as is often the case – neglected altogether. Indeed, a large share of all societal income redistribution occurs within households, and would therefore be invisible to accounting on a household basis. The second is the difficulty of translating changes in population age structure into changes in the age structure of household heads and household membership.
Here we opt for the individual perspective, but irrespective of the methodology employed, the age patterns of consumption and production are central to understanding the role of population in the macroeconomy.
Forces shaping age profiles of consumption A large body of theory and empirical research in economics addresses the age-time trajectory of consumption chosen by individuals. In the absence of intergenerational transfers, the expected present value of consumption must be no greater than that of labor earnings over the life cycle. With perfect foresight about future labor earnings, taxes, survival, discount rates, and other relevant information, with perfect credit markets, and with typical assumptions about how consumption affects utility, standard lifecycle theory concludes that consumption will increase exponentially with age along the optimal path at a rate equal to the discount rate less the rate of time preference. Because this optimal path typically differs from the age trajectory of labor earnings, individuals borrow and lend at the market rate of interest to achieve the desired consumption path. The real world circumstances of individuals violate each of these assumptions, and a large literature explores the consequences. The ability of individuals to borrow is often limited by their current net worth, credit cards aside. Future wages are unknown due to uncertainty about the macroeconomy, career success, and health, for example. Intergenerational transfers are pervasive. An individual’s consumption is funded by his parents until the age of economic independence, which may not come until after age 20. Consequently adults must allocate a substantial portion of their income to consumption by their children. In most contexts, elderly people live and consume in the household of an adult child. Thus an individual’s consumption may be governed by at least three
4
different budget constraints over the life cycle, depending first on the resources of parents, then on personal resources, and finally on resources of children. Marriage, divorce and widowhood complicate the situation further. Bequests, which are highly uncertain in timing and amount, also alter the available resources. Some scholars have questioned the value of the lifecycle model altogether and proposed alternatives (Carroll, 1992; Carroll and Summers, 1991; Deaton, 1991).3
There are many problems in estimating individual consumption. Fertility and the age pattern of consumption may be jointly determined, in the sense that parents may choose to have fewer children precisely because they want to invest more resources in each one of them, as in the quantity-quality theory of fertility (Becker and Lewis, 1973). Only a fraction of the consumption in a household is assignable to individuals, even conceptually. Much is joint consumption of public goods, as when a family watches TV. Some consumption comes in the form of in-kind transfers from the government, for health care, education, food, housing, or energy assistance, and these transfers are chosen through the political process and subject to a government budget constraint. Very little research has sought to estimate consumption profiles for a society from cradle to grave, including both public and private transfers, as we seek to do in this paper.
Forces Shaping the Age Profiles of Labor Earnings Standard economic theory views work as a tradeoff between the utility of leisure and the utility of the consumption that increased work allows. An individual at each age chooses to work that number of hours which equates the marginal utility gained through these wages to the marginal utility lost from reduced leisure time. Experience, health and vitality, and other factors that vary over the life cycle affect the productivity of labor and, therefore, its wage value. But they also influence the utility of leisure. Variations with age in the competing demands on time at home, for example due to child rearing, also affect the opportunity cost of work. At some ages, the optimal choice may be not to work at all. In theory, with perfect credit markets, these decisions made at different ages are all closely linked over the life cycle. You can choose not to work and yet to consume at age 27, for example, by borrowing based on earnings you anticipate at age 52 with due account taken of discount rates and survival probabilities. In addition to entering the labor force or staying at home, individuals may spend time investing in their human capital through education or training, thereby raising their future earnings. Once working, they may devote some time to maintaining or upgrading skills, or they may let them decline. Work experience itself tends to raise productivity and wages. As with consumption, the real world is more complex. Credit markets are imperfect. Workers do not have complete flexibility in choosing their hours. Institutions may constrain wages to rise with age through seniority systems, regardless of productivity. The productivity of labor, and therefore wages, will depend on macroeconomic conditions that are outside the control and foresight of an individual. Public pension programs may be unexpectedly instituted or terminated, altering the life cycle budget constraint and perhaps introducing strong incentives to retire from the labor force or return to work. Changes in tax policies may alter the tradeoff between work and 3 Also see Attanasio, O.P., J. Banks, C. Meghir, and G. Weber. 1999. "Humps and Bumps in Lifetime Consumption." Journal of Business and Economic Statistics 17(1):22-35., which provides support for the lifecycle model.
5
leisure. Unemployment may thwart individual plans, and age discrimination may prevent older people from finding work. Aside from these contextual factors, it appears that individual productivity varies by age. Skirbekk (2003) reviews a dozen studies, concluding that they point to an inverse U-shaped individual productivity profile, with significant decreases taking place from around 50 years of age. There are a number of reasons for declining productivity at older ages. A large body of literature supports the view that mental abilities decline during adulthood (Maitland et al. 2000, Verhaegen and Salthouse, 1997). Poor physical and mental health is also strongly related to early retirement (Quinn et. al. 1990; Bound, 1991, Dwyer and Mitchell, 1999). Rapid technological progress has an uneven influence on skills and competencies by age (Autor et. al. 2003). Rapid changes in educational systems might also give middle-aged and younger workers a competitive advantage over their older counterparts.
All these factors can vary over time and between countries, leading to differences and changes in the way earnings vary with age. Perhaps most important, however, are the decisions made by three demographic groups. First, many teenagers and young adults are extending their time in school and delaying their entry into the labor force as returns to education rise. Second, many women are increasing the time spent in the labor force as rates of childbearing have declined and labor market opportunities have improved. Third, older men are withdrawing from the labor force at a younger age as incomes have risen and pensions have become available.
Methods for Constructing Consumption Profiles Consumption consists of private and public components. Age patterns of private consumption have been much more extensively analyzed, but public consumption – the consumption of in-kind transfers from the public sector – are important to developing a full picture of the lifecycle of consumption.
Private Consumption Consumer expenditure surveys provide information on household level consumption expenditures. Many studies have addressed the problem of allocating these consumption expenditures between adults and children, typically as part of an effort to estimate the costs of children. Much less is known about the allocation of household consumption between prime age adults and the elderly. This issue is not important in societies where the elderly live independently because their consumption can be directly observed. In societies where multigenerational living arrangements are common, the issue is an important one about which relatively little is known.
The general approach taken in the literature is based on some measure of the consumption utility of the adults in a household. With such a measure, we can ask by how much the total consumption of a household with one additional child would have to be increased in order to restore the adults’ consumption utility to its original level. The size of the increase measures the cost of that incremental child. The Engel method uses the share of the household budget spent on food as the measure of adult welfare. It has been used extensively (Espenshade, 1984), but it is also widely criticized on conceptual grounds. The difficulty with the method is that children may be more intensive consumers of food than are adults. If so, families with more
6
children would spend a larger share of their budgets on food because their real income is lower, but also because the household’s preferences are tilted toward food. Thus, children would appear to reduce the parent’s welfare more, and therefore to cost more, than is actually the case. The consensus among researchers is that Engel’s method yields an upward biased estimate of the cost of children. On a priori grounds we can only say that Engel’s method will generally yield a biased result (Deaton 1997). In the Rothbarth method, the welfare metric is the level of spending on goods that are consumed mainly by adults, usually taken to be tobacco, alcohol, and adult clothing. The Rothbarth method does not suffer from the same problem as Engel’s method because these adult goods are not consumed by children. The Rothbarth method, however, must assume that the presence of children in the household has no direct effect on the utility that adults derive from consuming their adult goods. Children must affect adult consumption of these goods only because they reduce the amount parents can spend on themselves. If the presence of children induces parents to smoke and drink more because of stress, for example, the Rothbarth method yields an under-estimate of the cost of children, and vice versa. Views vary as to whether or not this assumption is plausible.
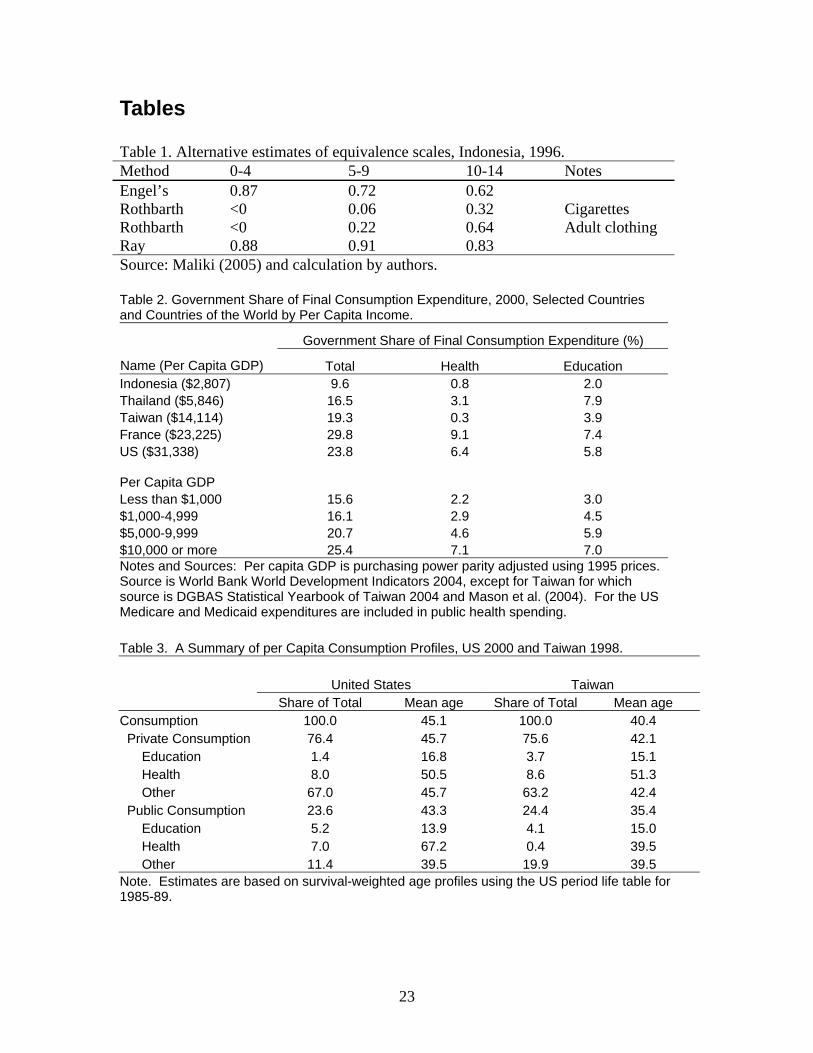
Several practical difficulties with the Rothbarth method limit its application. First, in some instances the only adult goods available are tobacco and alcohol. Expenditure on these is insensitive to income, owing to their addictive characteristics. Furthermore, in some societies alcohol and tobacco are rarely consumed. Second, the method cannot be used to allocate consumption among adults of different ages, and it is often contaminated by the presence of older children, who may also consume the “adult” goods. This leads to an underestimate of the cost of these children. While the Rothbarth method cannot be used to estimate expenditures for the elderly, the Engel method can be used to estimate age-profiles of consumption for all ages, but the flaws in the method make it relatively unattractive. Estimates are often reported in the form of equivalence scales which express the consumption going to different ages relative to that of a prime age adult. These scales are often called Equivalent Adult Consumer scales, or EAC. These have been estimated for many countries, both developing and developed, using the Engel and Rothbarth methods. It would be useful to address several questions. First, are the available methods robust? Do they yield plausible estimates of child costs when applied in varying contexts? Second, do the available methods suggest similar or substantially different equivalence scales when applied to the same data? If similar, the biases identified in the literature may be tolerable in practical applications. Third, does the comparison of estimates using the same method across countries or time yield useful information about changes or differences in child costs? Despite the extensive literature on equivalence scales, it is not yet clear to what extent these questions can be answered. Table 1 reports estimates of equivalence scales for Indonesia based on the 1996 socio-economic survey (SUSENAS; Maliki, 2005). Results from three methods are reported – the Engel method and, the Rothbarth method, and Ray’s demographic method, a variant of the Engel’s method which uses budget shares for several expenditure items rather than just food. The Rothbarth method was estimated using tobacco and adult clothing to represent adult goods.4 The results are not 4 Although alcohol is not illegal in Indonesia, the population is predominantly Islamic. Thus, alcohol is not an appropriate variable.
7
reassuring. The one consistent finding is that children consume less than adults. The Engel method and Ray method both yield high estimates for children. The Rothbarth method yields very low estimates, with children under five having a negative cost. The age pattern also varies across methods. Costs decline with age according to the Engel method, increase with age according to the Rothbarth estimates, and are non-monotonic according to the Ray method.
If the Engel method is upward biased and the Rothbarth method is downward biased, then the true value would lie somewhere in between. However, it cannot be conclusively demonstrated that the true value in fact lies between the two estimates.
These difficulties have led us to adopt a simple and transparent approach to allocating consumption to household members. First, we allocate education and health expenditures to members using a method similar to one employed by Attanasio et al. (1999). We regress total household education expenditures on the number of household members in each age group enrolled in school and the number of household members not enrolled, with the intercept suppressed. Private health expenditures are allocated using a similar regression approach, using numbers of household members in each age group as regressors. For some age groups, private health spending might be very low and estimated coefficients may sometimes be negative. To avoid this happening, health spending can be constrained to be non-negative.
Second, other household consumption is allocated to individuals using an ad hoc allocation rule. The allocation rule is based on an extensive review of the literature and follows the advice of Deaton (1997) that an ad hoc approach to child costs is probably the preferred approach, given problems of the Engel and Rothbarth methods. He suggests that children age 0-4 be 0.4 of an adult and the children age 5-14 be 0.5 and children 15 and older be 1. We employ a more continuous, but similar equivalence scale, which is equal to 1 for adults aged 20 or older, declines linearly from unity at age 20 to 0.4 at age 4 and below. Using these methods, we estimate consumption for each individual in each household in the sample. We average across all the individuals in the survey of a given age to construct age schedules of private expenditures on education, on health, and on other items. Often, expenditures are underreported in surveys, so some further adjustment of the age profiles may be desirable to make them consistent with reliable national level control totals for total private expenditures on health, on education, and on the balance of total private consumption. National Income and Product Accounts (NIPA) and other reliable public statistical sources provide suitable control data. In this way, the profiles can be made consistent with NIPA, in general, and private and government final consumption expenditure, in particular.
Public Consumption Public transfer programs are classified according to the following list of 11 expenditure categories—Public goods and services; Congestible goods and services; Health; Education; Sickness and disability; Old age; Survivors; Family and children; Unemployment; Housing; and Other. This classification scheme is based on the United Nation’s COFOG (Classification of Functions of Government) System. COFOG was developed by the UN in order to harmonize the accounting of government expenditures among the member nations.
8
Our approach is to assign the benefits to the individual for whom the government intends them. For example, an educational voucher might be provided by the government to the parents of school-age children. In this case, the benefits are assigned to the children who are receiving the education, not to the parents who received the voucher. In some cases the government may provide a single cash payment to an adult in the household on behalf of all members of the household. In this case, each household member is assigned their share of this benefit.
For estimation, we would like to know the cost of the service provided to the individual by the government. Survey data are unlikely to include such costs, but they can be calculated from administrative data. For example, Medicare (US) administrative data such as the Current Beneficiary Survey contain information on the medical costs of individuals. These data can be used to derive age profiles of costs of Medicare benefits. If we lack information on the actual costs incurred for services to individuals, then we obtain information on program usage. For example, hospital admissions data by age are used to develop an age profile of medical costs. If we lack information on program use, then the minimum data we need is program participation, for example, school enrollment rates by age. We can improve our estimate by using public school enrollment rates rather than general enrollment rates which include public and private schooling. We can further improve estimates by disaggregating by grade level of schooling since costs may differ substantially by grade level. Many public goods and services are not targeted at particular age groups. We allocate these equally to all members of the population.
Methods for Constructing Earnings Profiles Estimating labor income is straight-forward using individual survey data. It is the sum of earnings, fringe benefits, other labor income, and a share of entrepreneurial (self-employment) income. Entrepreneurial income is typically not reported in a manner that allows for decomposition into returns to labor versus returns to assets. Thus, we assign a pre-defined age invariant portion of individual entrepreneurial income as a return to labor. The labor income of an individual is then the sum of these individual components of compensation. In the case of Taiwan, self-employment income is provided on an individual basis and individual labor income is estimated directly as described above. However, in the US, entrepreneurial income is provided at the household level. In this case, we allocate it to individual members using a regression model, similar to that used in allocating household health and education expenditures. Household self-employment (entrepreneurial) income is regressed, with the intercept suppressed, on the total number of household members who are self-employed and the proportion of self-employed members in each age group. Analysis of the data for several other countries with individual entrepreneurial income indicates that the regression method is reliable.
Our earning age profiles are expressed per member of the population so they also reflect labor force participation rates, and reflect the average earnings of men and women.
9
Public and Private Consumption The consumption side of the economic lifecycle depends on both public and private consumption, but their relative importance is not easily judged. Private consumption is larger than public consumption. Many public programs, however, target particular age groups – education for the young, health care for the elderly. Important public programs, e.g., pension programs, family allowances, or unemployment benefits, provide cash rather than in-kind transfers. These programs lead to increases in private rather than in public consumption affecting the economic lifecycle indirectly. An additional complexity is that public consumption may crowd out private consumption with little effect on the composition or age pattern of total consumption. Thus, the public-private breakdown of consumption provides useful and suggestive information, but it is by no means definitive about how public policy influences the age pattern of total consumption.
Public Consumption The importance of public consumption varies quite substantially across countries (Table 2). In general, public consumption as a share of total consumption rises with per capita income, but demographic and institutional factors play very important roles. Public spending on health and education rise more sharply with income than does combined public spending, suggesting that age targeting is more important in high income countries. The relationship between the level of economic development and public consumption holds to some extent for the five countries compared below. Public consumption as a share of total consumption was smallest in Indonesia and Thailand and largest in France and the United States. Pubic spending on health is highest in France and the US, countries with both higher income and older populations. Public spending on education is high in France and the US, but also in Thailand which has lower income but a relatively large school-age population. The substantial variation among the five countries compared in Table 2 stands out, suggesting the importance of country-specific institutional factors. <INSERT TABLE 2 ABOUT HERE>
Results for Consumption There is a striking contrast between the cross-sectional age profiles of total consumption for Taiwan and the US, as shown in Figure1a and 1b. In the US, consumption rises by 150% from birth to the early 20s; in Taiwan the corresponding increase is only 67%. In the US, consumption rises by a further 67% from the early 20s to age 90, whereas in Taiwan, there is virtually no increase at all over this age range. In total, consumption more than quadruples from birth to age 90 in the US, while in Taiwan it grows by only two thirds. <Figure 1. Per Capita Consumption, Private and Public by Sector, United States, 2000 and Taiwan, 1998. ABOUT HERE> To be sure, these cross sections are a poor guide to the longitudinal changes for actual generations, which in Taiwan have been exceptionally rapid as we will see later, whereas
10
in the US they have been relatively slow. Nonetheless, these age profiles do tell us about the age gradient in consumption in any given year, and this gradient is flat in Taiwan for adult ages, and steeply sloped across all ages in the US. We believe that the family support system for the elderly in Taiwan, versus public sector transfers for the elderly in the US, lies behind this difference.
Age targeting of public consumption is less important in Taiwan than in the US. Public education targets school age children with a noticeable affect on their total consumption, but public education is less important in Taiwan. Note, however, that private education consumption is very high and that total spending on education is higher in Taiwan than in the US. Taiwan relies on national health insurance to fund health care spending and as a consequence (since all insurance is counted as private consumption, even if offered by the government) virtually all spending on health care is a component of private consumption. Taiwan’s National Health Insurance program was introduced in 1995 and by 1998 was 4.7% of total consumption as compared 6.4% for US Medicare and Medicaid. The elderly consume only modestly more health care services financed through NHI than do the young in Taiwan, whereas the US program is limited to those 65 and older. Private consumption of health care by the elderly in Taiwan, including NHI-funded care, is not much more important than private consumption of health care by US elderly. This may be one reason why consumption by the elderly in Taiwan is somewhat lower than consumption by prime age adults and why total consumption does not rise with age for the elderly. Similarly, that private consumption declines with age in the US cross-section may merely reflect substitution of public for private health care spending in the US as compared with Taiwan.
Figure 2 charts the age profile of public consumption by age relative to average public consumption for all those aged 0 to 85 for the US, Taiwan, Indonesia, Thailand, and France. In the absence of any age targeting, the profile would equal 1 at all ages. The extent of age targeting is most easily judged by comparing values for those in the 30-59 age groups. Judged in this way, the US and France target public consumption the most, while Indonesia targets public consumption the least. The extent of targeting in Thailand is similar to that in France, however, and the extent of Taiwan’s targeting is similar to Indonesia’s. Again, there is danger in looking at components of consumption as compared with total consumption, because public policy in Taiwan influences health consumption via public insurance rather than through the direct provision of health care. <Figure 2. Per Capita Public Consumption Age Profile ABOUT HERE> The age profile shows us the relative age orientation of public consumption in each country. The US and French programs target the young and the old. In the case of France, the allocation is roughly balanced with the young and the old receiving similar levels of public consumption. In the US, the program is biased more toward the elderly, particularly those 75 and older. In Taiwan, Indonesia, and Thailand the programs are dominated by consumption by the young to the extent that they are age targeted at all. In Indonesia age targeting is quite limited as compared to Taiwan or Thailand.
11
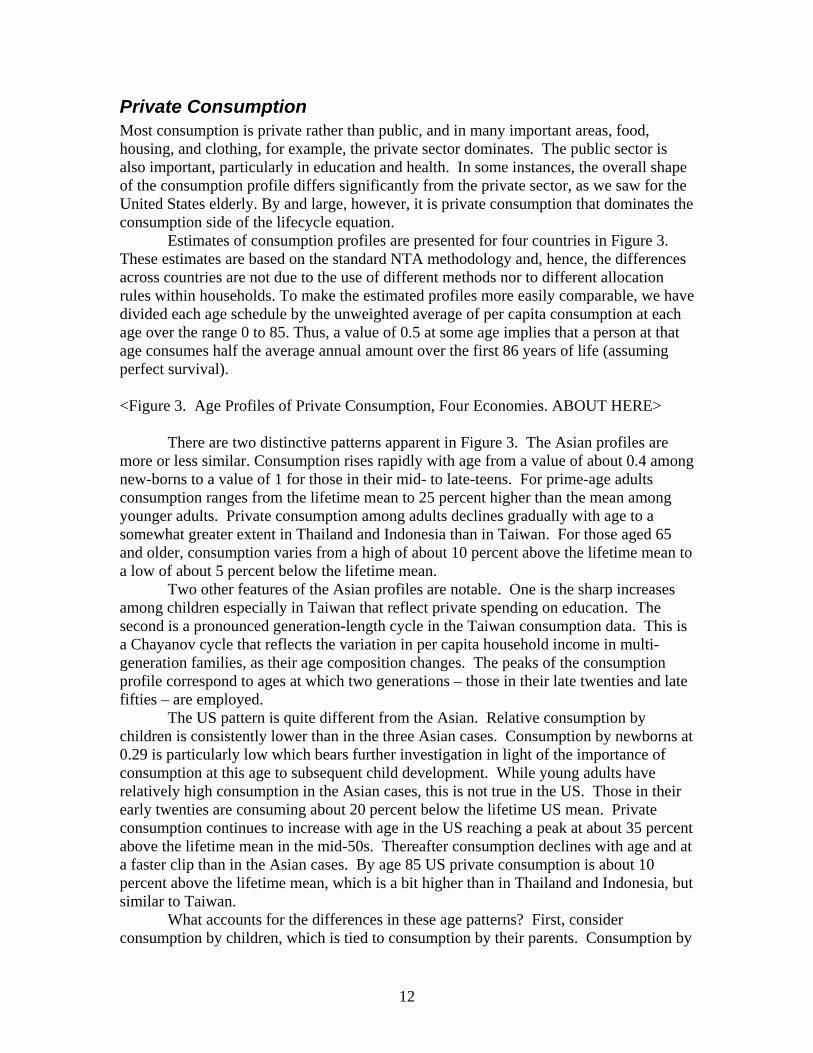
Private Consumption Most consumption is private rather than public, and in many important areas, food, housing, and clothing, for example, the private sector dominates. The public sector is also important, particularly in education and health. In some instances, the overall shape of the consumption profile differs significantly from the private sector, as we saw for the United States elderly. By and large, however, it is private consumption that dominates the consumption side of the lifecycle equation. Estimates of consumption profiles are presented for four countries in Figure 3. These estimates are based on the standard NTA methodology and, hence, the differences across countries are not due to the use of different methods nor to different allocation rules within households. To make the estimated profiles more easily comparable, we have divided each age schedule by the unweighted average of per capita consumption at each age over the range 0 to 85. Thus, a value of 0.5 at some age implies that a person at that age consumes half the average annual amount over the first 86 years of life (assuming perfect survival). <Figure 3. Age Profiles of Private Consumption, Four Economies. ABOUT HERE> There are two distinctive patterns apparent in Figure 3. The Asian profiles are more or less similar. Consumption rises rapidly with age from a value of about 0.4 among new-borns to a value of 1 for those in their mid- to late-teens. For prime-age adults consumption ranges from the lifetime mean to 25 percent higher than the mean among younger adults. Private consumption among adults declines gradually with age to a somewhat greater extent in Thailand and Indonesia than in Taiwan. For those aged 65 and older, consumption varies from a high of about 10 percent above the lifetime mean to a low of about 5 percent below the lifetime mean. Two other features of the Asian profiles are notable. One is the sharp increases among children especially in Taiwan that reflect private spending on education. The second is a pronounced generation-length cycle in the Taiwan consumption data. This is a Chayanov cycle that reflects the variation in per capita household income in multi-generation families, as their age composition changes. The peaks of the consumption profile correspond to ages at which two generations – those in their late twenties and late fifties – are employed. The US pattern is quite different from the Asian. Relative consumption by children is consistently lower than in the three Asian cases. Consumption by newborns at 0.29 is particularly low which bears further investigation in light of the importance of consumption at this age to subsequent child development. While young adults have relatively high consumption in the Asian cases, this is not true in the US. Those in their early twenties are consuming about 20 percent below the lifetime US mean. Private consumption continues to increase with age in the US reaching a peak at about 35 percent above the lifetime mean in the mid-50s. Thereafter consumption declines with age and at a faster clip than in the Asian cases. By age 85 US private consumption is about 10 percent above the lifetime mean, which is a bit higher than in Thailand and Indonesia, but similar to Taiwan. What accounts for the differences in these age patterns? First, consider consumption by children, which is tied to consumption by their parents. Consumption by
12

children is low in the US because children live in households which have low levels of consumption. The connection between consumption by adults of childrearing age and children is far from one-to-one, however. First, the rate of childbearing obviously matters. If parents have more children, then per capita consumption by both parents and children will be depressed. Second, the relationship between fertility and income matters. If low income (low consumption) adults have high fertility then consumption by children will be depressed. Third, the variance of childbearing matters. If the variance is high, a larger percentage of children will live in large families with lower per capita consumption than if the variance is low. Next consider adult consumption. One possible explanation is that the age profiles of consumption are influenced by the age profiles of current labor income. Consumption by young adults (and their children) may be lower in the US relative to older adults because young adults earn less relative to older adults in the US as compared to Asia. We will see later that labor income peaks at a younger age in these three Asian countries than in the US, but this explains a relatively small part of the difference in the consumption pattern. A final and important explanation is that private intergenerational transfers are much more important in the Asian countries than in the US. A much higher percentage of Asians live in multi-generation households, pool their budgets, and share standards of living. Private Education A potentially important explanation for the high level of private consumption of children and young adults in the Asian cases is a strong commitment to education. Emphasis on education is often mentioned as a key ingredient in East Asian economic success. Private spending on education is very high in Japan and Taiwan, as shown in Figure 4, and in South Korea (not shown). High spending on private education is not confined to East Asia – private spending in Brazil rivals that in Taiwan. <Figure 4. Private Education Consumption by Age. ABOUT HERE> Private spending by age reported in Figure 4 was estimated directly for each country using the standard NTA methodology described above. A relatively broad measure of education is used that includes pre-school costs and tutoring where it is available. The values are normalized by dividing by the average consumption of an adult 30 or older. The rather astonishing level of spending on private education in Japan stands out. Among children aged 16-18 private spending averages nearly half of the average adult private consumption of all goods and services. A substantial part of this expenditure is devoted to Juku – private tutoring that prepares students for college entrance examinations. High levels of spending are not limited to these age groups in Japan, however. Total education spending for ages 0 to 23 for the cross-section or synthetic cohort adds up to 4.1 years of mean adult consumption. Private spending on education in Taiwan and Brazil does not match the levels in Japan, but it is very high in any event. In Brazil and Taiwan lifetime spending for the synthetic cohort on education is 3.3 and 3.4 years of mean adult consumption, respectively. Lifetime spending is much less in the other countries for which estimates are available. In Thailand 0.8 years of adult consumption is devoted to education; in the
13
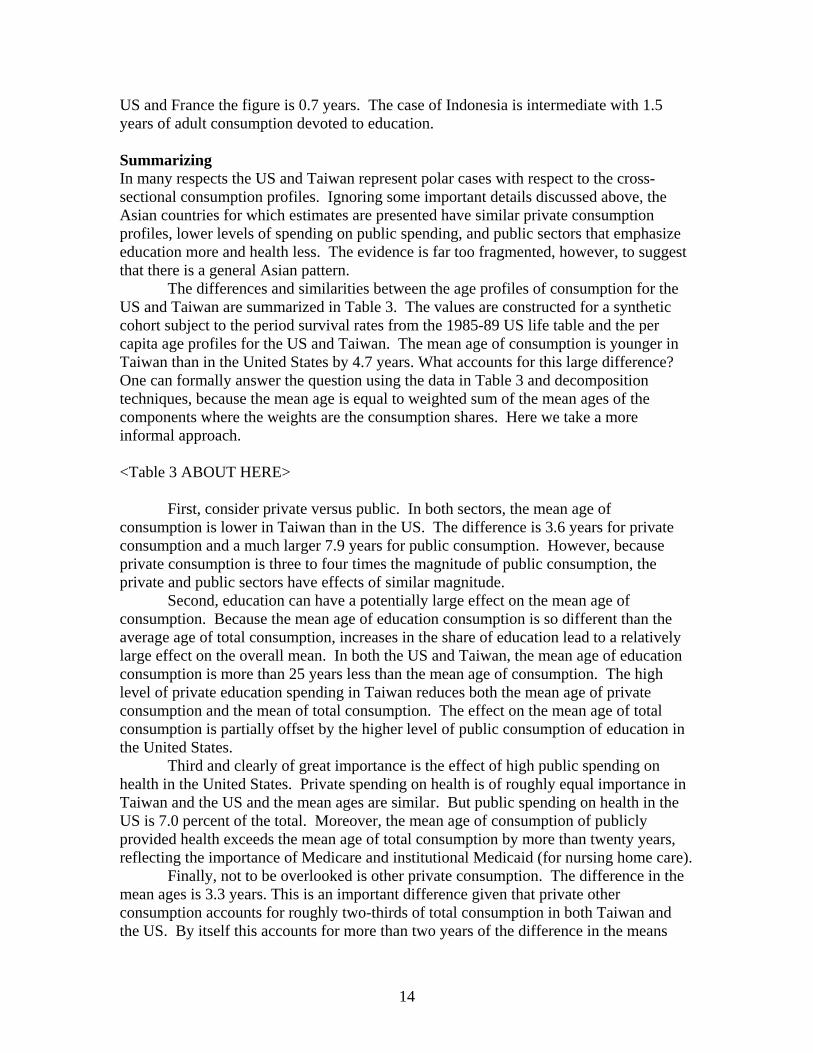
US and France the figure is 0.7 years. The case of Indonesia is intermediate with 1.5 years of adult consumption devoted to education. Summarizing In many respects the US and Taiwan represent polar cases with respect to the cross-sectional consumption profiles. Ignoring some important details discussed above, the Asian countries for which estimates are presented have similar private consumption profiles, lower levels of spending on public spending, and public sectors that emphasize education more and health less. The evidence is far too fragmented, however, to suggest that there is a general Asian pattern. The differences and similarities between the age profiles of consumption for the US and Taiwan are summarized in Table 3. The values are constructed for a synthetic cohort subject to the period survival rates from the 1985-89 US life table and the per capita age profiles for the US and Taiwan. The mean age of consumption is younger in Taiwan than in the United States by 4.7 years. What accounts for this large difference? One can formally answer the question using the data in Table 3 and decomposition techniques, because the mean age is equal to weighted sum of the mean ages of the components where the weights are the consumption shares. Here we take a more informal approach. <Table 3 ABOUT HERE> First, consider private versus public. In both sectors, the mean age of consumption is lower in Taiwan than in the US. The difference is 3.6 years for private consumption and a much larger 7.9 years for public consumption. However, because private consumption is three to four times the magnitude of public consumption, the private and public sectors have effects of similar magnitude. Second, education can have a potentially large effect on the mean age of consumption. Because the mean age of education consumption is so different than the average age of total consumption, increases in the share of education lead to a relatively large effect on the overall mean. In both the US and Taiwan, the mean age of education consumption is more than 25 years less than the mean age of consumption. The high level of private education spending in Taiwan reduces both the mean age of private consumption and the mean of total consumption. The effect on the mean age of total consumption is partially offset by the higher level of public consumption of education in the United States. Third and clearly of great importance is the effect of high public spending on health in the United States. Private spending on health is of roughly equal importance in Taiwan and the US and the mean ages are similar. But public spending on health in the US is 7.0 percent of the total. Moreover, the mean age of consumption of publicly provided health exceeds the mean age of total consumption by more than twenty years, reflecting the importance of Medicare and institutional Medicaid (for nursing home care). Finally, not to be overlooked is other private consumption. The difference in the mean ages is 3.3 years. This is an important difference given that private other consumption accounts for roughly two-thirds of total consumption in both Taiwan and the US. By itself this accounts for more than two years of the difference in the means
14
ages of total consumption. It underlines the significant difference in private consumption between the US and Asian countries described above. Differences in education spending and health spending do not, by themselves, explain why private consumption favors the young in Taiwan and the old in the United States.
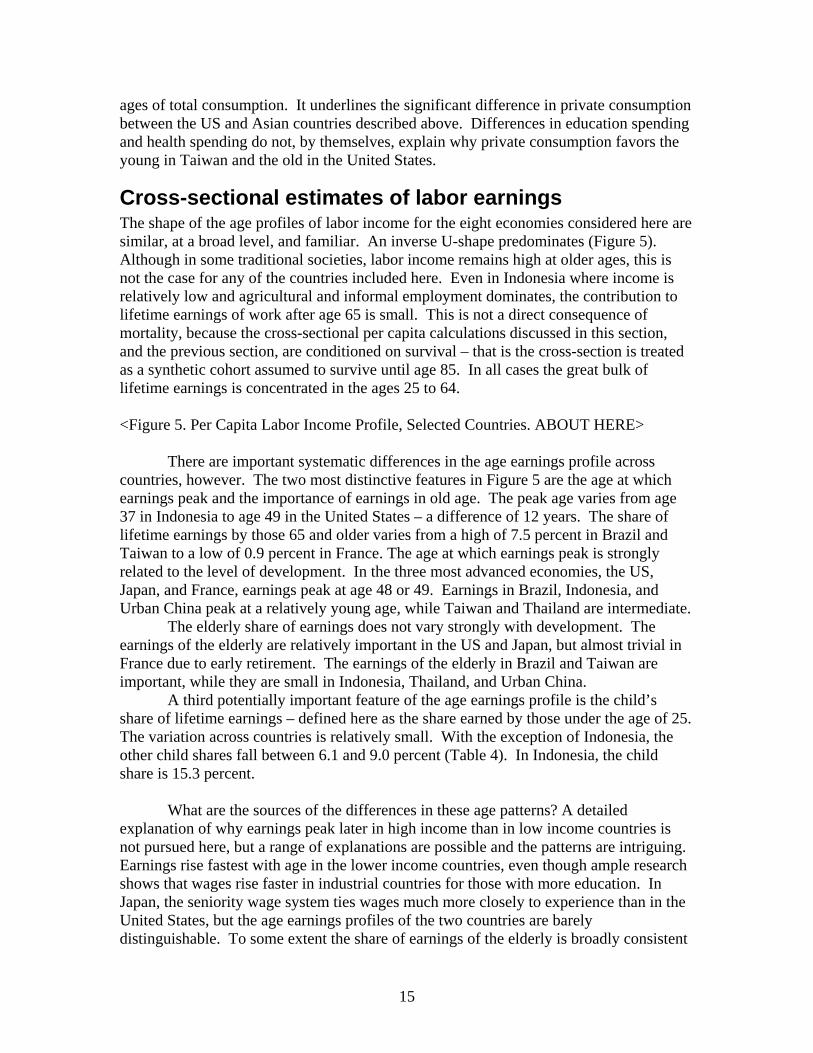
Cross-sectional estimates of labor earnings The shape of the age profiles of labor income for the eight economies considered here are similar, at a broad level, and familiar. An inverse U-shape predominates (Figure 5). Although in some traditional societies, labor income remains high at older ages, this is not the case for any of the countries included here. Even in Indonesia where income is relatively low and agricultural and informal employment dominates, the contribution to lifetime earnings of work after age 65 is small. This is not a direct consequence of mortality, because the cross-sectional per capita calculations discussed in this section, and the previous section, are conditioned on survival – that is the cross-section is treated as a synthetic cohort assumed to survive until age 85. In all cases the great bulk of lifetime earnings is concentrated in the ages 25 to 64. <Figure 5. Per Capita Labor Income Profile, Selected Countries. ABOUT HERE>
There are important systematic differences in the age earnings profile across countries, however. The two most distinctive features in Figure 5 are the age at which earnings peak and the importance of earnings in old age. The peak age varies from age 37 in Indonesia to age 49 in the United States – a difference of 12 years. The share of lifetime earnings by those 65 and older varies from a high of 7.5 percent in Brazil and Taiwan to a low of 0.9 percent in France. The age at which earnings peak is strongly related to the level of development. In the three most advanced economies, the US, Japan, and France, earnings peak at age 48 or 49. Earnings in Brazil, Indonesia, and Urban China peak at a relatively young age, while Taiwan and Thailand are intermediate.
The elderly share of earnings does not vary strongly with development. The earnings of the elderly are relatively important in the US and Japan, but almost trivial in France due to early retirement. The earnings of the elderly in Brazil and Taiwan are important, while they are small in Indonesia, Thailand, and Urban China.
A third potentially important feature of the age earnings profile is the child’s share of lifetime earnings – defined here as the share earned by those under the age of 25. The variation across countries is relatively small. With the exception of Indonesia, the other child shares fall between 6.1 and 9.0 percent (Table 4). In Indonesia, the child share is 15.3 percent.
What are the sources of the differences in these age patterns? A detailed explanation of why earnings peak later in high income than in low income countries is not pursued here, but a range of explanations are possible and the patterns are intriguing. Earnings rise fastest with age in the lower income countries, even though ample research shows that wages rise faster in industrial countries for those with more education. In Japan, the seniority wage system ties wages much more closely to experience than in the United States, but the age earnings profiles of the two countries are barely distinguishable. To some extent the share of earnings of the elderly is broadly consistent
15
with studies of the effects of pension and tax systems on labor incentives (Gruber and Wise, 2001; Gruber and Wise, 1999). As expected, the earnings shares of the elderly in Taiwan, the US, and Japan are quite high and in France quite low. But the low earnings share of the elderly in Urban China, where public pension systems are under-developed, and the high share in Brazil, where public pensions systems are very substantial, are surprising.
Clearly the broad measure of labor production emphasized here provides a different perspective as compared with more narrowly prescribed analyses that emphasize, for example, the wage profile for men. Institutional factors such as the seniority wage system and economic structure may prove to play a less important role than commonly believed.
Considering the consumption and earning profiles together So far, we have been considering consumption and earnings separately. It is also interesting to consider them together, for it is together that they determine the periods of economic dependency and the roles of intergenerational transfers. Table 5 summarizes and compares consumption and labor income profiles for five countries. The upper panel reports the two crossing points, the youngest age and oldest age at which labor earning exceeds total consumption, and the span of years between these. There are striking differences between the US, Taiwan and Thailand, where young adults don’t break even until age 25 or 26, and Indonesia, where they break even at age 20. <Table 5 ABOUT HERE> Differences at the other crossing age are smaller, but elders become net consumer earliest in Taiwan and the US after ages 56 and 57; and in Thailand and Indonesia after ages 59 and 60. The corresponding spans of net producing ages range from low values of only 31 years in Taiwan and the US, versus 40 years in Indonesia, with Thailand at 33 in between. These features of the economic life cycle can differ because of varying amounts of capital income versus labor income; differing levels of saving; differing enrollment in higher education, short-run economic fluctuations, differences in public policy and social systems; but also due to higher or lower support ratios which will raise or lower the whole consumption profile relative to the labor earnings profile across countries. We have not yet tried to parse out the specific factors responsible for the differences shown in the Table.
It is also interesting to compare the average ages of consumption and production for a synthetic cohort in these countries. Again, the mean ages are based on the per capita labor income and consumption profiles of each country, weighted by the US survival rates. The differences between these average ages indicate the direction and distance of reallocations of income across age within a synthetic life cycle, assuming a zero discount rate. We find that these reallocations are slightly upwards in the US (average age of consumption is 45.3 and the average age of earning is 44.4), while for Thailand they are slightly downwards (with a mean age of consumption at 41.5 and earning at 42.4). The
16
reallocations would traverse a greater age range elsewhere – in a downward direction in Taiwan and in the upward direction in Indonesia. It is striking that the US and Indonesia are grouped together as having net upward transfers given the many differences between these two countries. The mean age is very late in the US as compared with every other country, apparently due to the important role of Medicare expenditures on the elderly. This factor is counter-balanced to some extent by the late average age of earning. Indonesia, on the other hand, has a low mean age of consumption and a very low mean age of earning. To some extent both the earnings and consumption profiles reflect the schooling decisions being made there.
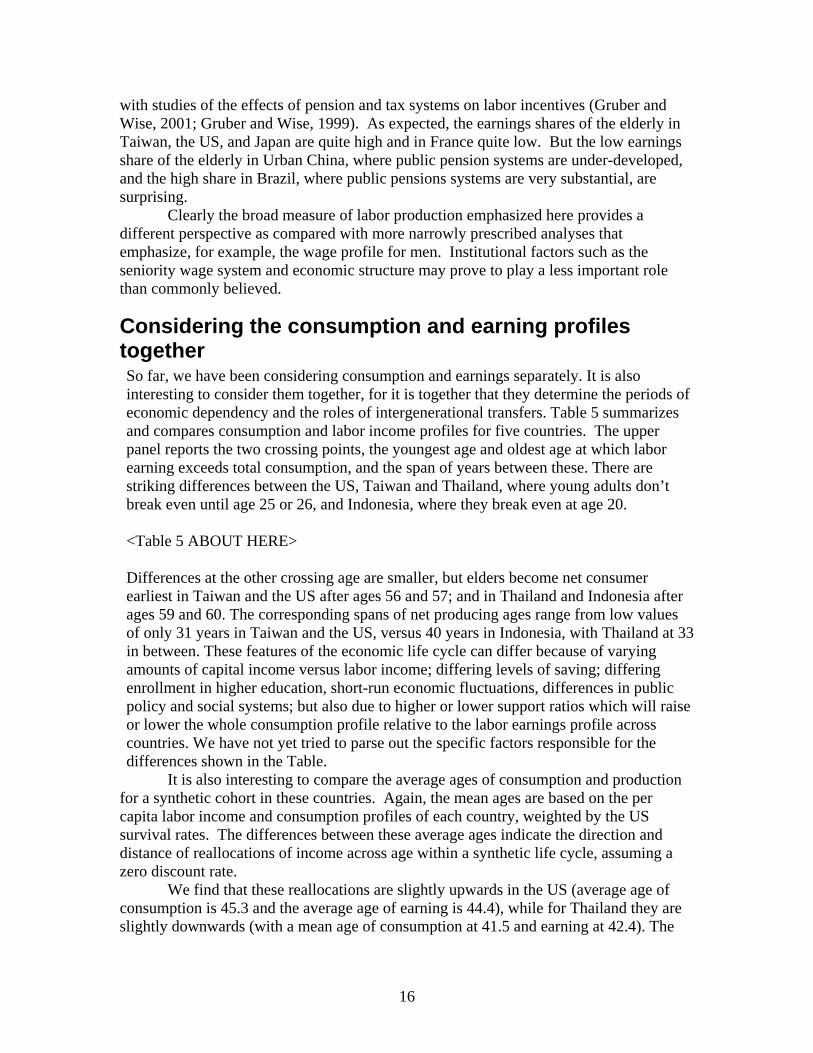
Changes in Consumption and Labor Income over Time Time series of private consumption and labor income age profiles have been estimated to this point only for Taiwan, from 1977 to 2002, and for the United States, from 1980 to 2000. A comparison of these two economies is quite interesting, however, for a variety of reasons, but particularly because of the great difference in their rates of economic growth. Here we will examine the rates of growth by age. We leave the examination of the cohort trends for another occasion. Figure 6 plots the average annual growth in real private consumption and labor income at each age. To remove the effects of short-term fluctuations, the estimates are based on five-year centered moving averages of the age profiles. Labor income for persons aged x in year t is the average of labor income of persons aged x for years t-2 to t+2. The time series are thereby reduced to 1979-1999 for Taiwan and for 1982-1997 for the US. The growth rates are presented only for ages 15 and older as those who were younger had no significant labor income in either economy. <Figure 6. Annual Growth of Private Consumption and Labor Income by Age, Real, Taiwan 1979-1999 and the US 1982-1997. ABOUT HERE> As should come as no surprise, the growth rates for both private consumption and labor income in Taiwan are substantially higher than in the US. For Taiwan, the age-profiles of consumption and labor income increased at annual real rates of 5.5% and 4.6% per year, respectively. The age profiles of consumption and labor income in the US shifted upwards at real annual rates of 1.9% and 1.3%.5 Growth in Taiwan was spectacular; in the US it was moderate. The stability of the age-profile of private consumption in Taiwan is remarkable. Consumption of those in their thirties and those in their mid-seventies and older grew somewhat faster than average. Consumption by those in their late fifties and early sixties grew somewhat slower than average. Overall, however, there is virtually no generational shift in consumption in Taiwan during this period. The lack of change is all the more surprising given the many other dramatic changes in Taiwan during this period, e.g., rapid economic growth and large changes in age structure. We believe that this sustained equality across adult ages reflects resource sharing within co-residential households, in contrast to the nuclear families of the U.S.
5 Values are calculated using survival weights to calculate average private consumption and labor income and explained in more detail above.
17
The consumption profile growth rates for the US are clearly more rapid above age 50 than below, with a difference of nearly one percent per year.6 This difference is substantial in comparison with the average US growth rate during this period. The labor income growth rates vary more with age than the consumption growth rates in both economies, more so in Taiwan than in the US. Certain features are common to both economies. The slowest growth was at the youngest ages – among teenagers in Taiwan and twenty-year-olds in the United States. The most rapid growth was at older ages – those in their mid-seventies and older in Taiwan and those in their sixties and older in the US. Note that at the highest ages, labor income in both economies is relatively low and a large percentage increase does not translate into a large absolute increase. In Taiwan, the labor income of adults near conventional retirement age grew much more slowly than the labor income of younger adults. Is there any connection between private consumption and labor income? The simple correlation between the age profiles of the growth rates of private consumption and labor income are 0.80 in the US and 0.50 in Taiwan. The size of the ‘effects’ are modest, however. An increase in the rate of growth of labor income by one percentage point is associated with a 0.26 percentage point increase in the rate of growth of private consumption in the US and a 0.09 percentage point increase in Taiwan. This is a rather modest amount of tracking, but reflects in part the inclusion of age groups (the young and the old) for which labor income is relatively unimportant. If we consider only those aged 21 to 60, the partial effect rises to 0.59 in the US and 0.49 in Taiwan; the simple correlation increases to 0.70 in Taiwan and 0.87 in the US. The effects are substantial, but still well below a value of one. This suggests that current earnings are to some extent driving private consumption, but there are also variations in consumption growth that exhibit a considerable degree of independence from variations in labor income.
Conclusions Understanding the economic lifecycle – how it varies and why – is important in its own right, but is also critical to understanding how changes in population age structure influence many features of the macroeconomy. There are few previous efforts, however, to estimate how consumption and production of individuals vary over the entire lifespan. A number of technical difficulties, some of which are described above, create substantial hurdles to such an enterprise.
We have presented estimates of labor earnings and consumption for a wide range of contemporary economies, including mature economies, rapidly growing economies, and low-income countries, from the West and from the East. The estimated cross-sectional age profiles of labor income are broadly similar and the hump shape is consistent with our expectations. However, there are striking contrasts in the timing of earnings over the life cycle, with the peak age ranging from 37 in Indonesia to 49 in the U.S.
The consumption profiles reveal even more striking contrasts, starting with the flat age profile of total consumption in Taiwan and the steeply rising one for the U.S., which we believe reflects the extended family versus the state as the primary locus of transfers to the elderly. Profiles for private consumption are also quite variable, with
6 Calculated by regressing the growth rate of private consumption on age.
18

Indonesia peaking early around age 25, Taiwan being essentially flat, and the US peaking late at around 55. Private expenditures on education show wide variations, with unusually high expenditures in some Asian countries. Because of possible public-private substitutions, it is questionable to assign causality to either for differences in total consumption, but it is hard to avoid noticing that without public spending on Medicare and institutional Medicaid in the U.S., total consumption would decline after 55, whereas with them, it rises strongly.
Considering the consumption and earnings profiles together, we are surprised by the short period of life during which individuals are producing more than they are consuming – barely more than 30 years in the US, Taiwan, and Thailand. The brevity of this phase contrasts sharply with high life expectancy, approaching 80 years in many countries.
We have also looked at two decades of change in the U.S. and in Taiwan. The stability of the Taiwan consumption profile is remarkable in light of its extraordinary economic growth, and we attribute this stability to the extended family. In the US we find that consumption at older ages has been rising over time considerably faster than in childhood, increasing the steepness of the lifecycle consumption gradient.
Many important questions remain to be explored, and we look forward both to broadening the analysis to include the experience of more countries and to deepening it by probing the causes of the differences we observe.
19
Sources: Figures and Tables France (1996): Zuber. S. (2004) Indonesia (1996): Maliki. (2005) Taiwan (1998): Mason et al. (2005) Thailand (1998): Amonthep, C. (2005) US (2000): Mason et al. (2005) Brazil (1996): Turra and Queiroz (2005) Japan (1999): Ogawa and Matsukura (2005) Urban China (2000): Wang and Mason (2005)
References Amonthep, C. 2005. National Transfer Account Project, http://www.schemearts.com/
proj/nta/. Attanasio, O.P., J. Banks, C. Meghir, and G. Weber. 1999. "Humps and Bumps in
Lifetime Consumption." Journal of Business and Economic Statistics 17(1):22-35.
Autor, D.H., F. Levy, and R.J. Murnane. 2003. "The Skill Content of Recent Technological Change: An Empirical Exploration." Quarterly Journal of Economics 118(4): 1279-1334.
Becker, G.S. and H.G. Lewis. 1973. "On the Interaction Between the Quantity and Quality of Children." Journal of Political Economy 18(2):S279-S288.
Bound, J. 1991. "Self-reported versus Objective Measures of Health in Retirement Models." The Journal of Human Resources 26(1):106-138.
Carroll, C.D. 1992. "The Buffer-Stock Theory of Saving: Some Macroeconomic Evidence." Brookings Papers on Economic Activity CXII(1):1-56.
Carroll, C.D. and L.H. Summers. 1991. "Consumption growth parallels income growth: Some new evidence." Pp. 305-343 in National Saving and Economic Performance: A National Bureau of Economic Research Project Report, edited by B.D. Bernheim and J.B. Shoven. Chicago: University of Chicago Press.
Chayanov, A.V. 1966 [1925]. The Theory of Peasant Economy, translated by D. Thorner et al. Homewood, IL: R.D. Irwin.
Cutler, D. M., J. M. Poterba, L. Sheiner, and L. Summers. (1990). "An Aging Society: Opportunity or Challenge?" Brookings Papers on Economic Activity (1):1-56.
Deaton, A. 1991. "Saving and Liquidity Constraints." Econometrica 59:1221-1248. Deaton, A. 1997. The Analysis of Household Surveys : A Microeconomic Approach to
Development Policy. Baltimore: Johns Hopkins University Press. Deaton, A. and C.H. Paxson. 1997. "The Effects of Economic and Population Growth on
National Saving and Inequality." Demography 34(1):97-114. Dwyer, D.S. and O. Mitchell. 1999. "Health Problems as Determinants of Retirement:
Are Self-Rated Measures Endogenous?" Journal of Health Economics 18(2):173-193.
Easterlin, Richard A., "What Will 1984 Be Like?," Demography v.15 (November, 1978), pp.397-432
Espenshade, T. 1984. Investing in Children: New Estimates of Parental Expenditures. Washington, D.C.: The Urban Institute Press.
20
Gruber, J.and D.A. Wise. 2001. "An International Perspective on Policies for an Aging Society." NBER Working Papers W8103.
Gruber, J.and D.A. Wise. 1999. "Introduction and Summary." pp. 437-474 in Social Security and Retirement around the World, edited by J. Gruber and D.A. Wise. Chicago: The University of Chicago Press.
Heston, Alan, Robert Summers and Bettina Aten, Penn World Table Version 6.1, Center for International Comparisons at the University of Pennsylvania (CICUP), October 2002.
Lee, R. 1997. "Population Dynamics: Equilibrium, Disequilibrium, and Consequences of Fluctuations, Chapter 19." Pp. 1063-1115 in Handbook of Population and Family Economics, v.1B, edited by M.R. Rosenzweig and O. Stark. North Holland.
Lee, R. and R. Edwards. 2001. The Fiscal Impact of Population Change. Seismic Shifts: The Economic Impact of Demographic Change, edited by J. S. Little and R. K. Triest. Federal Reserve Bank of Boston Conference Series, 46.
Lee, R. and R. Edwards (2002). The Fiscal Effects of Population Aging in the US: Assessing the Uncertainties. Tax Policy and Economy, edited by J.M. Poterba. NBER, MIT Press, 16: 141-181.
Lee, R. and K. Kramer. 2002. “Children’s Economic Roles in the Context of the Maya Family Life Cycle: Cain, Caldwell, and Chayanov Revisited.” Population and Development Review 28 (3):475-499.
Maitland, S. B., R. C. Intrieri, K. W. Schaie and S. L. Willis. 2000. "Gender Differences and Changes in Cognitive Abilities across the Adult Life Span." Aging, Neuropsychology, and Cognition 7(1):32-53.
Maliki. 2005. Three Essays on Education and Intergenerational Transfers, PhD Dissertation, Department of Economics, University of Hawaii.
Mankiw, N.G. and D.N. Weil. 1989. "The Baby Boom, The Baby Bust, and the Housing Market." Regional Science and Urban Economics 19(2):235-258.
Mason, A. 1987. National Saving Rates and Population Growth: A New Model and New Evidence. Pp.523-60 in Population Growth and Economic Development: Issues and Evidence. D. G. Johnson and R. D. Lee. Social Demography series, Madison, Wis.: University of Wisconsin Press.
Mason, A. 1988. "Saving, Economic Growth, and Demographic Change." Population and Development Review 14(1):113-44.
Mason, A., R. Lee, A. Tung, M. Lai, and T. Miller. 2005. "Population Aging and Intergenerational Transfers: Introducing Age into National Accounts", Annual Meeting of the Population Association of America, Philadelphia, PA, March 31 - April 2, 2005.
McFadden, D. 1994. "Demographics, the Housing Market, and the Welfare of the Elderly." Pp. 225-285 in Studies in the Economics of Aging edited by D. Wise. Chicago: The University of Chicago Press and NBER.
Modigliani, F. 1988. "Measuring the Contribution of Intergenerational Transfers to Total Wealth: Conceptual Issues and Empirical Findings." Modeling the Accumulation and Distribution of Wealth, edited by D. Kessler and A. Mason. Oxford, Oxford University Press: 21-52.
Ogawa, N. and R. Matsukura. 2005. "The Role of Older Persons' Changing Health and Wealth in an Aging Society: The Case of Japan," United Nations Expert Group
21
Meeting on Social and Economic Implications of Changing Population Age Structures, Mexico City, August 31 - September 2, 2005
Poterba, J. M. 2004. "Population Aging and Financial Markets." Symposium on Global Demographic Change: Economic Impacts and Policy Challenges, Jackson Hole, Wyoming.
Quinn, J.F., R. Burkhauser, and D.A. Myers. 1990. Passing the Torch: The Influence of Economic Incentives on Work and Retirement. Kalamazoo, MI: W.E. Upjohn Institute for Employment Research.
Skirbekk, Vegard. 2003. "Age and Individual Productivity: A Literature Survey." MPIDR Working Paper 2003-028. (Max Planck Institute for Demographic Research, Rostock.)
Turra, C. and B. Queiroz. 2005. "Before it's too late: Demographic Transition, Labor Supply and Social Security Problems in Brazil". United Nations Expert Group Meeting on Social and Economic Implications of Changing Population Age Structures, Mexico City, August 31 - September 2, 2005
Verhaegen, P. and T. A. Salthouse. 1997. "Meta-Analyses of Age-Cognition Relations in Adulthood. Estimates of Linear and Nonlinear Age Effects and Structural Models.” Psychological Bulletin 122(3):231-249.
Waldman, D. A. and B. J. Avolio 1986. “A Meta-Analysis of Age Differences in Job Performance.”, Journal of Applied Psychology, No. 71, pp. 33-38.
Wang Feng and Andrew Mason. 2005. "Demographic Dividends and Prospects for Economic Development in China," United Nations Expert Group Meeting on Social and Economic Implications of Changing Population Age Structure, Mexico City, 31 August - 2 September.
Zuber, S. 2004. National Transfer Account Project, http://www.schemearts.com/ proj/nta/.
22
Tables Table 1. Alternative estimates of equivalence scales, Indonesia, 1996. Method 0-4 5-9 10-14 Notes Engel’s 0.87 0.72 0.62 Rothbarth <0 0.06 0.32 Cigarettes Rothbarth <0 0.22 0.64 Adult clothing Ray 0.88 0.91 0.83 Source: Maliki (2005) and calculation by authors. Table 2. Government Share of Final Consumption Expenditure, 2000, Selected Countries and Countries of the World by Per Capita Income.
Government Share of Final Consumption Expenditure (%)
Name (Per Capita GDP) Total Health Education Indonesia ($2,807) 9.6 0.8 2.0 Thailand ($5,846) 16.5 3.1 7.9 Taiwan ($14,114) 19.3 0.3 3.9 France ($23,225) 29.8 9.1 7.4 US ($31,338) 23.8 6.4 5.8 Per Capita GDP Less than $1,000 15.6 2.2 3.0 $1,000-4,999 16.1 2.9 4.5 $5,000-9,999 20.7 4.6 5.9 $10,000 or more 25.4 7.1 7.0 Notes and Sources: Per capita GDP is purchasing power parity adjusted using 1995 prices. Source is World Bank World Development Indicators 2004, except for Taiwan for which source is DGBAS Statistical Yearbook of Taiwan 2004 and Mason et al. (2004). For the US Medicare and Medicaid expenditures are included in public health spending. Table 3. A Summary of per Capita Consumption Profiles, US 2000 and Taiwan 1998. United States Taiwan Share of Total Mean age Share of Total Mean age Consumption 100.0 45.1 100.0 40.4 Private Consumption 76.4 45.7 75.6 42.1 Education 1.4 16.8 3.7 15.1 Health 8.0 50.5 8.6 51.3 Other 67.0 45.7 63.2 42.4 Public Consumption 23.6 43.3 24.4 35.4 Education 5.2 13.9 4.1 15.0 Health 7.0 67.2 0.4 39.5 Other 11.4 39.5 19.9 39.5 Note. Estimates are based on survival-weighted age profiles using the US period life table for 1985-89.
23
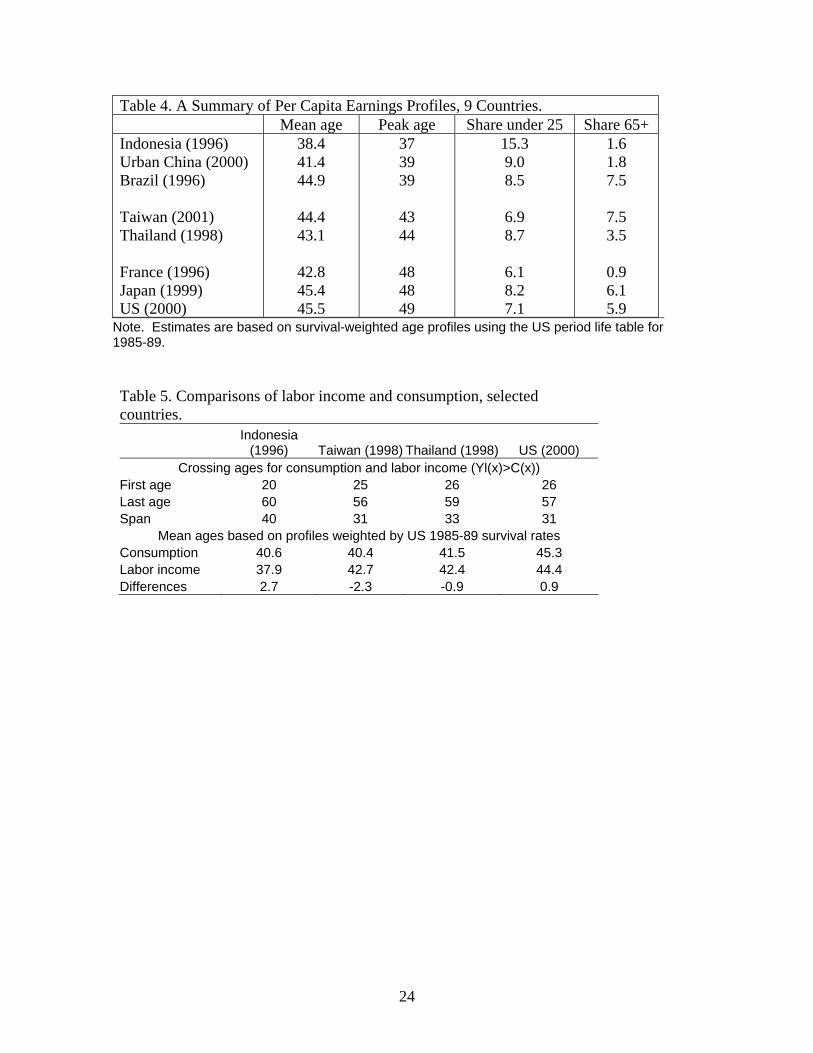
Table 4. A Summary of Per Capita Earnings Profiles, 9 Countries. Mean age Peak age Share under 25 Share 65+ Indonesia (1996) Urban China (2000) Brazil (1996) Taiwan (2001) Thailand (1998) France (1996) Japan (1999) US (2000)
38.4 41.4 44.9
44.4 43.1
42.8 45.4 45.5
37 39 39
43 44
48 48 49
15.3 9.0 8.5
6.9 8.7
6.1 8.2 7.1
1.6 1.8 7.5
7.5 3.5
0.9 6.1 5.9
Note. Estimates are based on survival-weighted age profiles using the US period life table for 1985-89. Table 5. Comparisons of labor income and consumption, selected countries.
Indonesia
(1996) Taiwan (1998) Thailand (1998) US (2000) Crossing ages for consumption and labor income (Yl(x)>C(x))
First age 20 25 26 26 Last age 60 56 59 57 Span 40 31 33 31
Mean ages based on profiles weighted by US 1985-89 survival rates Consumption 40.6 40.4 41.5 45.3 Labor income 37.9 42.7 42.4 44.4 Differences 2.7 -2.3 -0.9 0.9
24

Figure 1a. Per Capita Consumption, Private and Public by Sector, United States, 2000
0
5000
10000
15000
20000
25000
30000
35000
40000
45000
50000
0 5 10 15 20 25 30 35 40 45 50 55 60 65 70 75 80 85
Age
Per
cap
ita c
onsu
mpt
ion
($) Public Education
Public Health
Other Public
Private Education
Other Private
Private Health
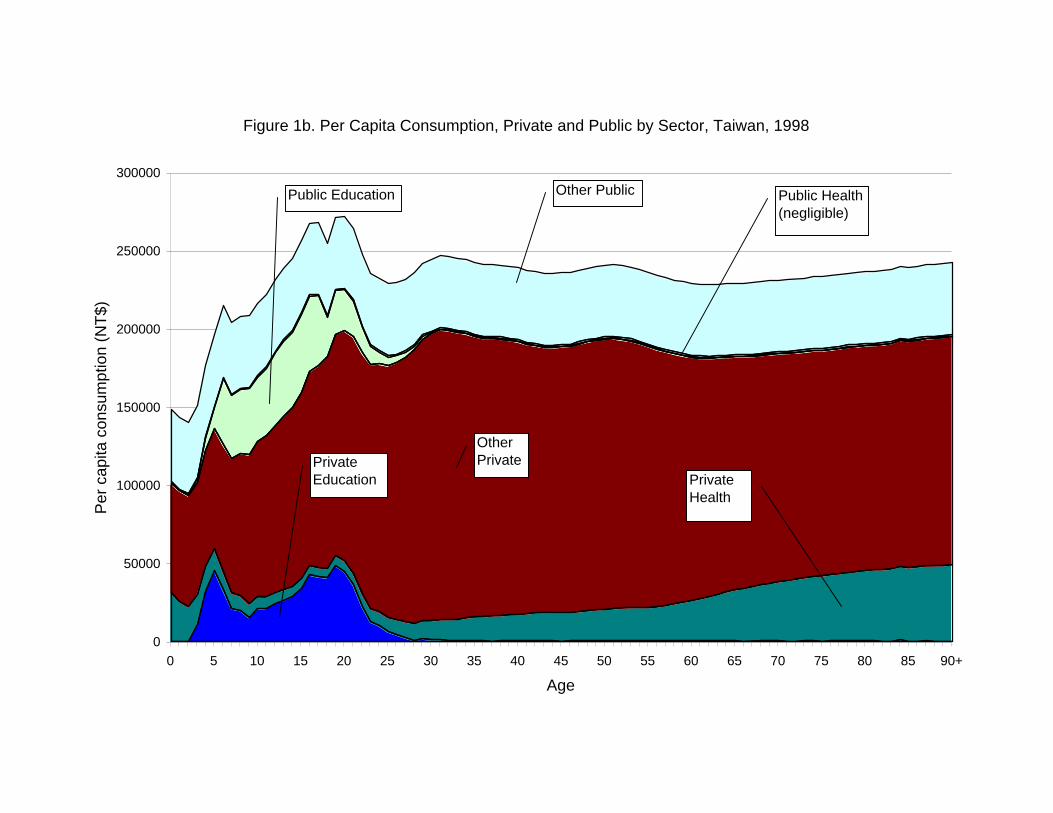
Figure 1b. Per Capita Consumption, Private and Public by Sector, Taiwan, 1998
0
50000
100000
150000
200000
250000
300000
0 5 10 15 20 25 30 35 40 45 50 55 60 65 70 75 80 85 90+
Age
Per
cap
ita c
onsu
mpt
ion
(NT
$)
Public Education Other Public Public Health (negligible)
Private Health
Other PrivatePrivate
Education
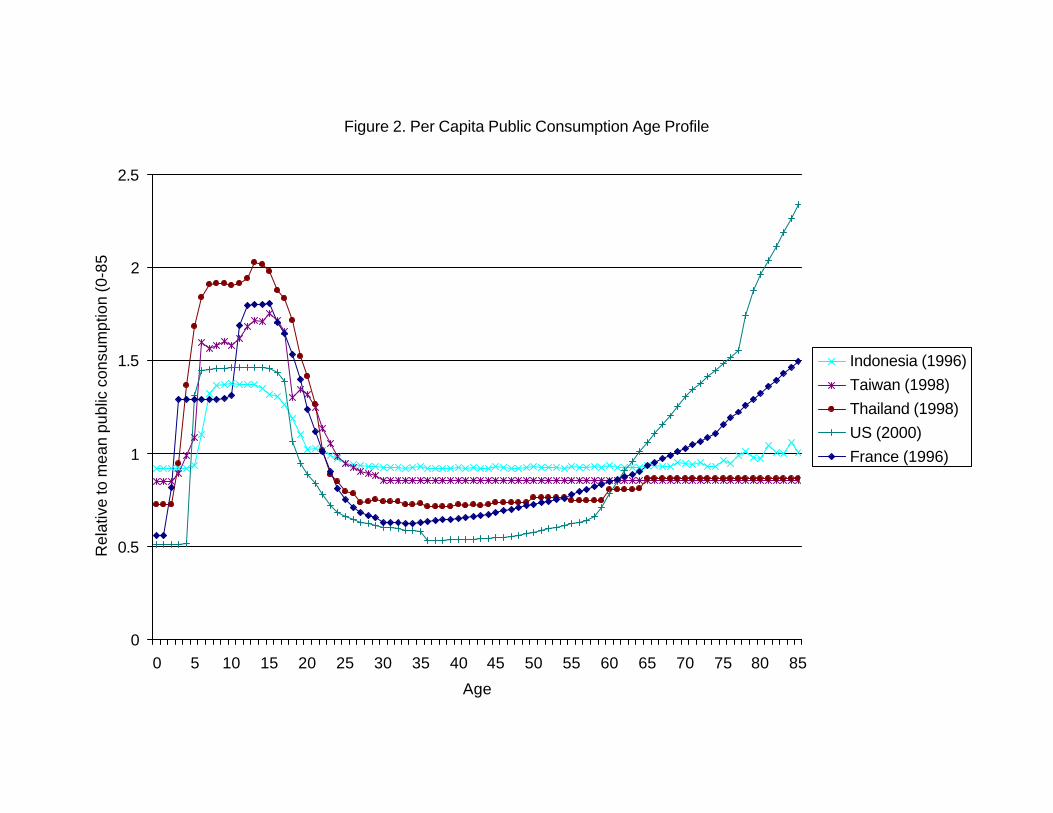
Figure 2. Per Capita Public Consumption Age Profile
0
0.5
1
1.5
2
2.5
0 5 10 15 20 25 30 35 40 45 50 55 60 65 70 75 80 85
Age
Rel
ativ
e to
mea
n pu
blic
con
sum
ptio
n (0
-85)
Indonesia (1996)Taiwan (1998)Thailand (1998)US (2000)France (1996)
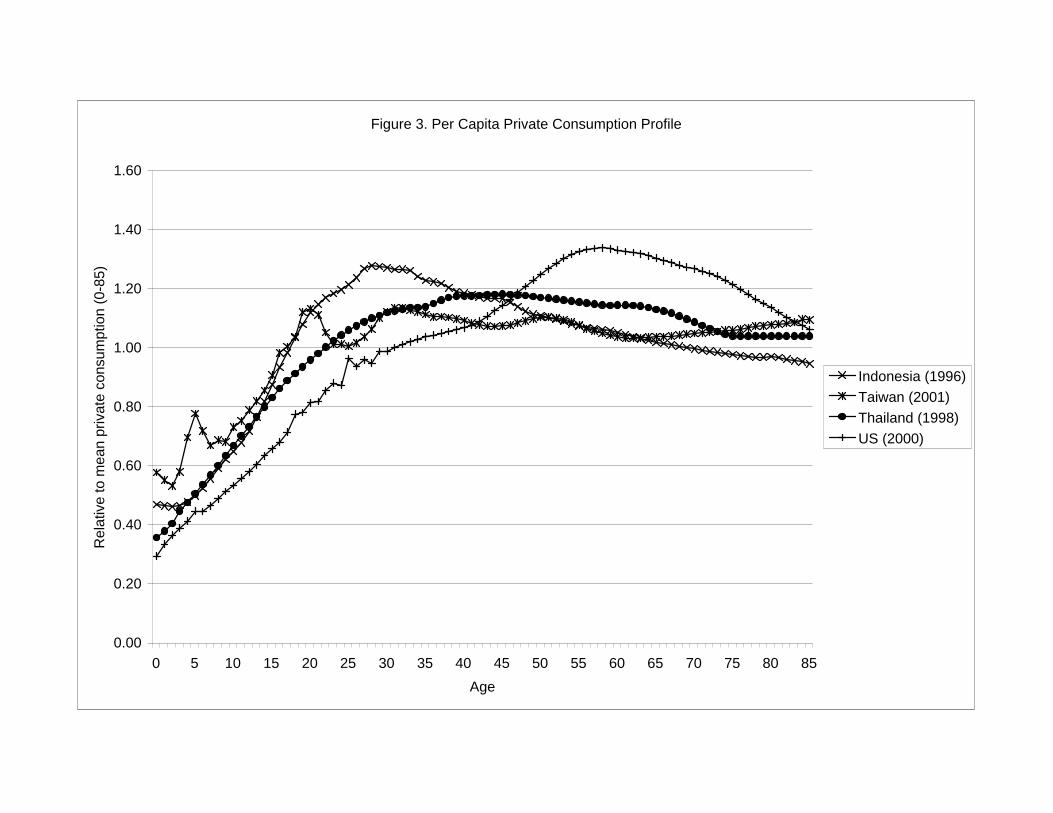
Figure 3. Per Capita Private Consumption Profile
0.00
0.20
0.40
0.60
0.80
1.00
1.20
1.40
1.60
0 5 10 15 20 25 30 35 40 45 50 55 60 65 70 75 80 85
Age
Rel
ativ
e to
mea
n pr
ivat
e co
nsum
ptio
n (0
-85)
Indonesia (1996)Taiwan (2001)Thailand (1998)US (2000)
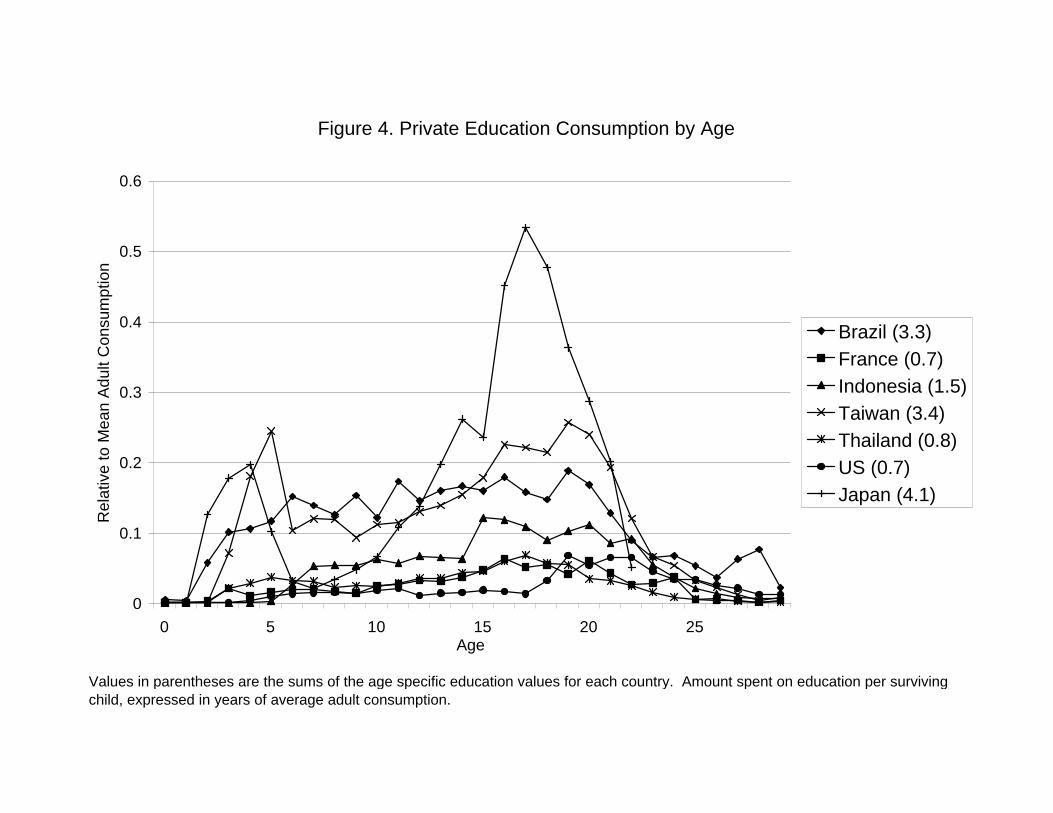
Figure 4. Private Education Consumption by Age
0
0.1
0.2
0.3
0.4
0.5
0.6
0 5 10 15 20 25Age
Rel
ativ
e to
Mea
n A
dult
Con
sum
ptio
n
Brazil (3.3)France (0.7)Indonesia (1.5)Taiwan (3.4)Thailand (0.8)US (0.7)Japan (4.1)
Values in parentheses are the sums of the age specific education values for each country. Amount spent on education per surviving child, expressed in years of average adult consumption.
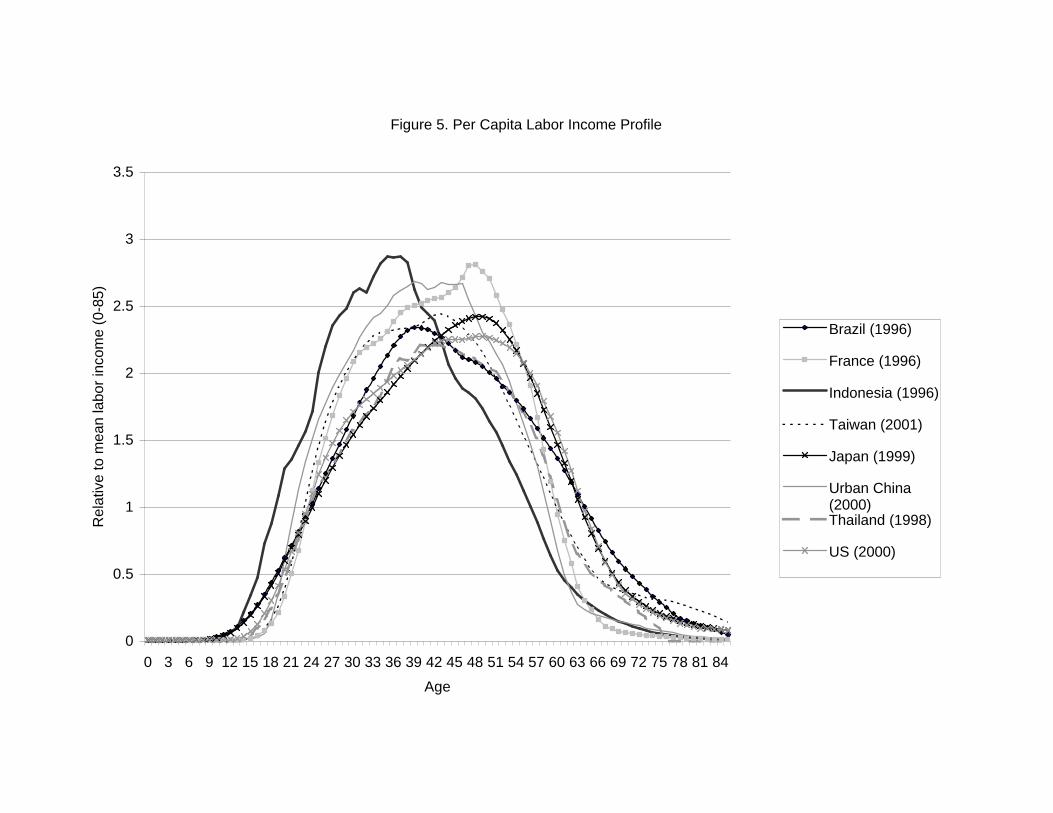
Figure 5. Per Capita Labor Income Profile
0
0.5
1
1.5
2
2.5
3
3.5
0 3 6 9 12 15 18 21 24 27 30 33 36 39 42 45 48 51 54 57 60 63 66 69 72 75 78 81 84
Age
Rel
ativ
e to
mea
n la
bor
inco
me
(0-8
5)
Brazil (1996)
France (1996)
Indonesia (1996)
Taiwan (2001)
Japan (1999)
Urban China(2000)Thailand (1998)
US (2000)
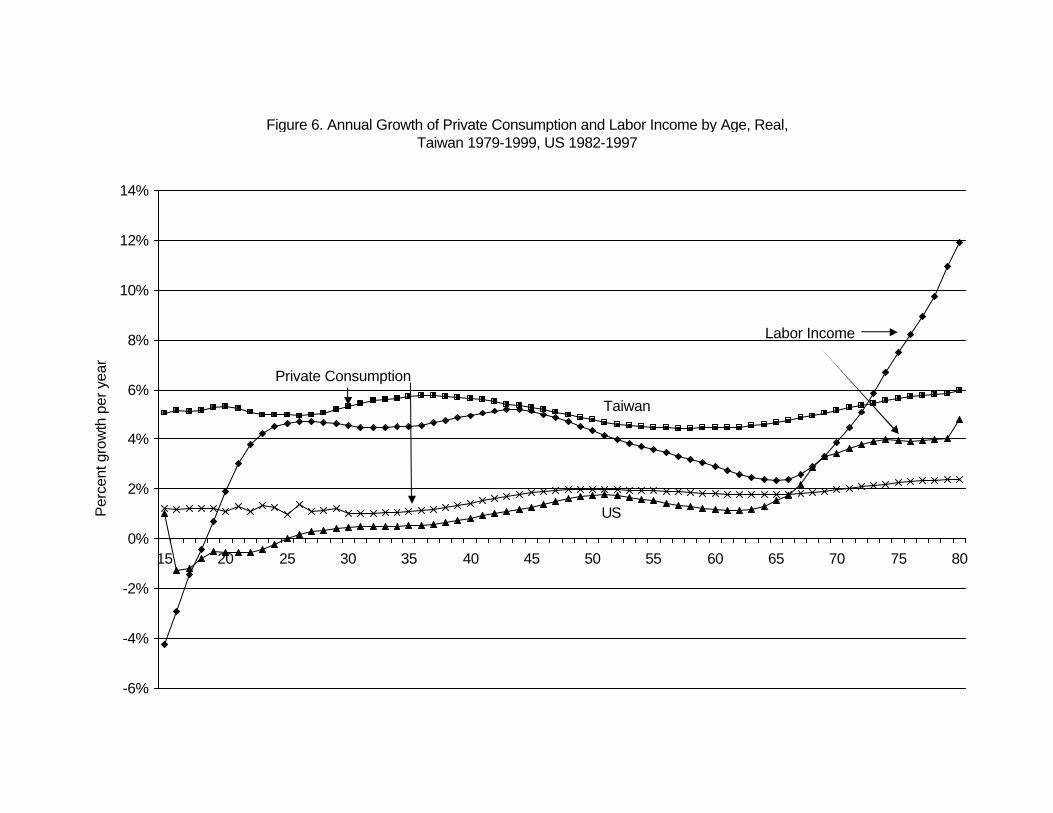
Figure 6. Annual Growth of Private Consumption and Labor Income by Age, Real, Taiwan 1979-1999, US 1982-1997
-6%
-4%
-2%
0%
2%
4%
6%
8%
10%
12%
14%
15 20 25 30 35 40 45 50 55 60 65 70 75 80
Per
cent
gro
wth
per
yea
r
Private Consumption
Labor Income
Taiwan
US