Embed Size (px)
Citation preview

will be smooth but curved. Two ormore equidistant hollows produce awavy surface. As the frequency ofthese waves increases, (i.e., as thespace between them decreases), theresulting surface would be consideredflat but rough. In fact, surfaces havingthe same height of irregularities are regarded as curved, wavy, orrough, according to the spacing ofthese irregularities.
Roughness and waviness can originate during manufacturing, andeach process may tend to produceone texture or the other. Waviness, the more widely spaced repetitivedeviations, can usually be attributed toindividual machining processes or toexternal environmental factors. Factorssuch as vibration, chatter, heattreatment, or warping strains caninduce waviness. Roughness, the finer,random irregularities of surface texture,more frequently results from chemicalor mechanical polishing, grinding orfinishing processes.
In addition to roughness and waviness, surface texture may exhibitdirectionality. The predominantdirection of surface irregularities isreferred to as lay. Lathe turning,milling, drilling, and grinding typicallyproduce surfaces with pronounced lay.
Defects are also considered acomponent of surface texture and mayrange from pitting and marring toscratches, warping, etc.
The surface of a manufacturedcomponent typically exhibits roughnesssuperimposed over waviness and may also include lay and/or defectsas well.
Characterizing Surface Texture
Surface texture is not a measurablequantity; it is not possible to assign aunique ”texture” value to every differentsurface. However, it is possible tomeasure some of the intrinsiccharacteristics, or parameters, ofsurface texture.
Surface parameters are generallydefined using profile data developedusing stylus-based measurementsystems. Stylus profilers, such as theDektak® Series profilers from VeecoInstruments Inc., use a variety ofdiamond-tipped styli to detect minutesurface variations in surfacetopography. In a profiler, the stylus ismechanically coupled to the core ofan LVDT (Linear Variable DifferentialTransformer). A precision stage movesthe sample surface across an opticallyflat reference surface beneath thestylus. As the stage moves the sample,the stylus rides over the surface,detecting roughness variations as smallas ten angstroms in height. The LVDTproduces an analog signalcorresponding to the vertical stylusmovement. This signal is amplified,conditioned, digitized and stored formanipulation, analysis and display.
High and Low Pass Filters
Dektak stylus profilers include a widerange of analyses for measuringparticular surface parameters. Theymay refer to roughness (designated asR parameters) or waviness (designatedas W parameters). As mentionedearlier, a typical surface exhibitsroughness superimposed over waviness.
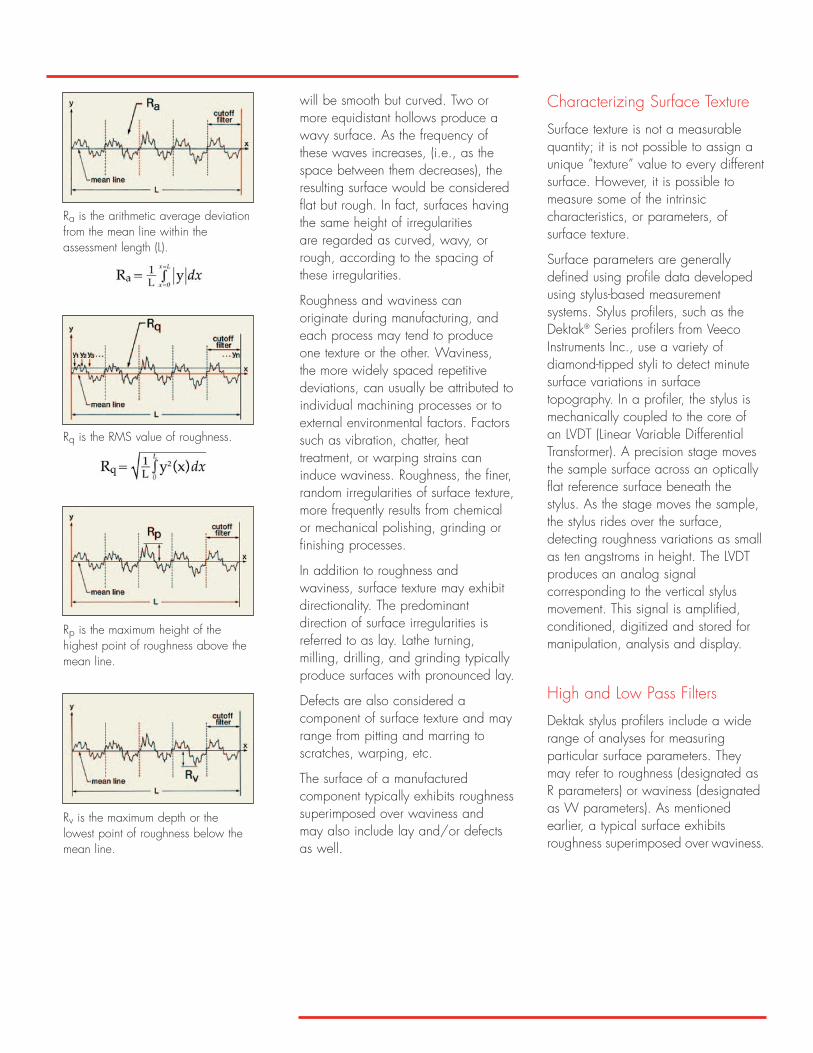
Ra is the arithmetic average deviationfrom the mean line within theassessment length (L).
Rq is the RMS value of roughness.
Rp is the maximum height of thehighest point of roughness above themean line.
Rv is the maximum depth or thelowest point of roughness below themean line.

To accurately measure surfaceroughness, the more widely-spacedwaviness deviations must be factoredout of the calculations. Dektak profilersemploy a user-selectable waviness(high pass) filter, in accordance withthe ANSI B46.1 specification, todelineate roughness from waviness.High frequency signals above theselected cutoff value are passed to theroughness algorithms. In this manner,analytical functions such as Ra(average roughness) are calculatedusing only high frequency roughnessdata. Similarly, a low pass filterremoves roughness components fromthe waviness calculations.
The rule of thumb for selecting the highpass filter value is 1/100 the length ofthe scan. It is recommended that thescan length be five to ten times longerthan the low pass cutoff wavelength.Once the desired filters have beenprogrammed, they are automaticallyapplied whenever a roughness orwaviness analysis is performed. Thescan data is conditioned by the cutofffilters and stored. The original,unfiltered profile remains unaffectedand can be displayed simultaneouslywith the filtered roughness andwaviness profiles (as in Figure 1).
Average Roughness
The one parameter that is standardizedall over the world and is specified and measured far more frequently thanany other is the arithmetic averageroughness height, or RoughnessAverage. Universally called Ra, it wasformerly known as AA (ArithmeticAverage) in the United States, and
CLA (Center Line Average) in theUnited Kingdom. It is defined as thearithmetic mean of the departures ofthe profile from the mean line. Anapproximation of average roughness(Ra) is obtained by adding the Yvalues without regard to sign anddividing the sum by the number ofsamples taken.
Ra is used to detect general variationsin overall profile height. A change inRa typically signifies a new variation in the process. It could be a change in the tool, the coolant, the material, or any other machine related factor.However, Ra cannot detect differencesin spacing and its distribution, or thepresence or absence of infrequentlyoccurring high peaks and deep valleys.
Rq (or also known as RMS) is the root-mean-square average of the departuresof the roughness profile from the meanline. Rq has statistical significancebecause it represents the standarddeviation of the profile heights and it is used in the more complexcomputation of skewness, the measureof the symmetry of a profile about themean line.
Dektak profilers include both the Raand Rq standard analytical functions,as well as other widely usedparameters for analyzing roughnessand waviness. The accompanyingfigures provide descriptions of severalof these parameters. Note that in eachof the figures showing roughnessparameters the scans are divided into five consecutive and equalportions representing the waviness filter cutoff length.
Rt is the sum total of the maximumvalley and maximum peak ofroughness.
Rz is the average height differencebetween the five highest peaks andthe five lowest valleys of roughness.
R3z is the distance between the thirdhighest peak and the third lowestvalley of roughness within a samplinglength, usually averaged over severalsampling lengths.
Wa is the arithmetic average deviationof waviness from the mean line.