Embed Size (px)
Citation preview
1
CHARACTERIZATION OF POLARONS AND EXCITONS IN MONODISPERSE PLATINUM ACETYLIDE MATERIALS
By
JULIA MARIE KELLER
A DISSERTATION PRESENTED TO THE GRADUATE SCHOOL OF THE UNIVERSITY OF FLORIDA IN PARTIAL FULFILLMENT
OF THE REQUIREMENTS FOR THE DEGREE OF DOCTOR OF PHILOSOPHY
UNIVERSITY OF FLORIDA
2010

2
© 2010 Julia Marie Keller

3
To my beautiful babies

4
ACKNOWLEDGMENTS
I must first acknowledge my mentor, Professor Kirk Schanze for his invaluable
encouragement, guidance and patience; he has taught me much beyond the science
presented herein, both how to be an individual thinker as well as a team player. I also
owe much gratitude to my committee members for their continued assistance, advice
and support, as well as John R. Miller for his time spent in collaboration with us. My
time with the entire Schanze group has been rewarding, but I want to thank Dr. Yongjun
Li especially; we shared a hood together, learned alongside each other, and we had a
load of laughs along the way. In him I have found a colleague and friend for life.
I ultimately thank my Lord and Savior Jesus Christ for carrying me through this
journey. I have been blessed with a wonderful, strong and selfless husband, Jonathan;
we share in this accomplishment. We have been blessed with a beautiful son, Joshua,
that has brought joy to every aspect of our lives, and we are very shortly expecting our
baby girl as we begin a new chapter. This is for them. My parents have also been on
this adventure with me, as well as my best friend in life, my twin sister Stephanie. Their
love, prayers and support have meant everything to me.
Finally, if it were not for all of my friends here I would not have survived. I must
particularly thank Phillip Shelton, Seth Dumbris, Dr. Kye Young Kim, Dr. John Peak,
Abby Shelton and Dr. Jarrett Vella for always providing me with a smile when I needed
it most. I also thank my close friends at Westside, especially the Robinsons, for being
my home away from home and for loving my family so well. I am blessed. I close this
chapter of my life with the words that I came in upon: ―Enter to think God‘s thoughts
after Him. Go forth to apply His thoughts in service‖.
5
TABLE OF CONTENTS page
ACKNOWLEDGMENTS .................................................................................................. 4
LIST OF TABLES ............................................................................................................ 7
LIST OF FIGURES .......................................................................................................... 8
ABSTRACT ................................................................................................................... 12
CHAPTER
1 INTRODUCTION TO PLATINUM ACETYLIDE MATERIALS ................................. 14
Introduction to Photophysics ................................................................................... 14 The Nature of Light and Matter ......................................................................... 14
Absorption of Light ........................................................................................... 15 Excited State Properties ................................................................................... 18 Energy Transfer ................................................................................................ 22
Electron Transfer .............................................................................................. 24 Marcus theory. ........................................................................................... 26
Solution phase electron transfer. ............................................................... 27 Spin dynamics of PET. ............................................................................... 28 PET in metal-organic dyads. ...................................................................... 29
Photophysical Properties of Conjugated Materials ........................................... 31
Molecular wires in conjugated organic systems ......................................... 32
Charge in organic conjugated systems ...................................................... 33 Excited states of organic conjugated systems ........................................... 35
Platinum Acetylide Materials ................................................................................... 37 Synthesis .......................................................................................................... 37 Photophysics .................................................................................................... 38
Objectives of the Current Study .............................................................................. 46
2 SYNTHESIS OF MONODISPERSE PLATINUM-ACETYLIDE OLIGOMERS END-CAPPED WITH NAPHTHALENE DIIMIDE UNITS......................................... 48
Introduction ............................................................................................................. 48 Results and Discussion........................................................................................... 50
Molecular Synthesis and Design ...................................................................... 50 Synthesis .......................................................................................................... 51 31P NMR Characterization ................................................................................ 54 Electrochemistry ............................................................................................... 57
Absorption and Photoluminescence Spectroscopy .......................................... 58 Summary and Conclusions ..................................................................................... 61 Experimental ........................................................................................................... 62
Materials and Instruments ................................................................................ 62
6
Synthesis .......................................................................................................... 63
3 NEGATIVE POLARON AND TRIPLET EXCITON DIFFUSION DYNAMICS IN PLATINUM-ACETYLIDE OLIGOMERS .................................................................. 76
Introduction ............................................................................................................. 76 Experimental ........................................................................................................... 78
Synthesis .......................................................................................................... 78 Steady State Photophysics ............................................................................... 78 Electrochemistry ............................................................................................... 79
Pulse Radiolysis ............................................................................................... 79 Ultrafast Transient Absorption Spectrometry .................................................... 81
Results .................................................................................................................... 82 Oligomer Structure ........................................................................................... 82
Characterization ............................................................................................... 84 Pulse Radiolysis and Negative Polaron Migration ............................................ 85
Photophysics and Exciton Transport ................................................................ 92 Steady state emission. ............................................................................... 93
Femtosecond transient absorption. ............................................................ 98 Random walk numerical simulation. ............................................................... 100
Discussion ............................................................................................................ 102
States are Concentrated................................................................................. 102 Mechanism of Transport ................................................................................. 103
Conclusion ............................................................................................................ 107
4 SYNTHESIS AND PHOTOPHYSICS OF PLATINUM CAPPED PHENYLENE ETHYNYLENE OLIGOMERS ............................................................................... 109
Introduction ........................................................................................................... 109 Synthesis .............................................................................................................. 113
Results and Discussion......................................................................................... 119 UV-Vis Absorbance ........................................................................................ 119
Steady State Photoluminescence ................................................................... 121 Fluorescence. .......................................................................................... 121 Phosphorescence. ................................................................................... 124
Transient Absorption ...................................................................................... 126 Conclusion ............................................................................................................ 128 Experimental ......................................................................................................... 129
Materials and Instruments .............................................................................. 129
Synthesis ........................................................................................................ 131
5 CONCLUSION ...................................................................................................... 144
APPENDIX: CHARACTERIZATION DATA ................................................................. 148
REFERENCES ............................................................................................................ 154
BIOGRAPHICAL SKETCH .......................................................................................... 165
7
LIST OF TABLES
Table page 3-1 Table of Energetics ............................................................................................. 84
3-2 Rate Constants for electron attachment to Platinum oligomer molecules (M) in THF at 296 K. ................................................................................................. 88
3-3 Kinetics of triplet exciton decay at 650 nm for the PtnNDI2 series. .................... 100
4-1 Summary of spectroscopic data for PhnPt2 series. ........................................... 119
8
LIST OF FIGURES
Figure page 1-1 The Franck-Condon principle. The figure was adopted from Atkins. .................. 17
1-2 Jabloski diagram illustrating possible transitions. ............................................... 21
1-3 Coulombic (Förster) mechanism for long-range energy transfer. ....................... 23
1-4 Electron exchange (Dexter) mechanism for short-range energy transfer. .......... 24
1-5 A schematic presentation of a photoinduced electron transfer process. ............. 25
1-6 Decay pathways of photoinduced electron transfer. ........................................... 26
1-7 Type 1 and 2 metal-organic dyads. .................................................................... 30
1-8 Examples of organic conjugated polymer structures. ......................................... 32
1-9 A conjugated oligomer in use as a molecular wire. ............................................. 33
1-10 Depiction of a polaron (a) and a bipolaron (b) in a poly(phenylene) material. .... 35
1-11 The general structural unit of a platinum acetylide. ............................................ 37
1-12 Crystal field splitting of the d orbitals of a square planar Pt(II) complex. ............ 39
1-13 Absorption and emission spectra of Pt-phenylethynyl monomer and polymer films. ................................................................................................................... 40
1-14 Series of platinum acetylide oligomers studied by Liu. ....................................... 42
1-15 Platinum acetylide polymer series studied by Wilson and coworkers. ................ 43
1-16 More extensive series of platinum acetylides studied by Köhler. ........................ 44
1-17 Singlet, triplet, and single-triplet splitting energies for a series of polymers and monomers studied by Köhler. ...................................................................... 45
1-18 A series of platinum acetylide oligomers studied by Rogers. .............................. 45
1-19 The series of diplatinum polyynediyl oligomers studied by Farley and coworkers. .......................................................................................................... 45
2-1 Chemical structures of the end-capped Pt-acetylide oligomers. ......................... 50
2-2 Synthesis of orthogonally-protected synthon 7. .................................................. 52
9
2-3 Synthesis of Pt2NDI2 (11) and Pt3NDI2 (12). ....................................................... 53
2-4 Synthesis of Pt6NDI2 (15) and Pt10NDI2 (17) oligomers ...................................... 54
2-5 31P NMR spectra for the PtnNDI2 series. (a) n = 2; (b) n = 3; (c) n = 6; (d) n = 10 ................................................................................................................. 55
2-6 Cyclic voltammagram of Pt2NDI2 (11) in methylene chloride with 0.1 M TBAH as electrolyte, vs. SCE. ...................................................................................... 58
2-7 UV-Vis (left) and steady state emission spectra (right) of PtnNDI2 series in degassed THF at 298K. ...................................................................................... 59
3-1 Structures of the current study: PtnNDI2, Pt2, Pt4, and NDI-H. ............................ 78
3-2 Scheme depicting the transport of charge to the NDI end caps via pulse radiolysis. ........................................................................................................... 81
3-3 Schematic of charge (a) and exciton (b) migration in PtnNDI2 oligomers. ........... 83
3-4 Energy level diagram of different charged and excited states of the PtnNDI2 oligomers. ........................................................................................................... 85
3-5 Spectra of Pt10NDI2- and NDIH- obtained from transient absorptions at 60
and 30 ns after pulse radiolysis in THF. The spectra are compared with that
for Pt4-. ............................................................................................................... 86
3-6 Visible and near infrared spectra of Pt10NDI2- and NDIH- obtained from
transient absorptions at 60 and 30 ns after pulse radiolysis in THF. The
spectra are compared with that for Pt4-. ............................................................. 86
3-7 Spectra of Pt2NDI2- and Pt6NDI2
- obtained from transient absorptions at 60 and 30 ns after pulse radiolysis in THF. ............................................................. 87
3-8 Transient absorption at 540 nm of 7.3 mM Pt10NDI2 in THF compared with that for Pt4 and with neat THF solvent. The single-shot instrument enabled 15 ps time resolution. .............................................................................................. 89
3-9 Transient absorption at 480 nm showing the formation of NDI2- in a 5.2 mM
solution of Pt10NDI2 in THF. ................................................................................ 92
3-10 Variable temperature steady state emission spectra of the PtnNDI2 oligomers vs. the low temperature emission of the NDI-H endcap (bottom) in degassed THF. ................................................................................................................... 94
3-11 Confinement of the triplet and singlet exciton in relation to distance to the NDI trap for Pt3NDI2 and Pt6NDI2. ...................................................................... 96
10
3-12 Conformational differences between energy minima of the ground state (left) and triplet state (right) of Pt2. .............................................................................. 97
3-13 Spectra of radical anion at various time intervals for n = 2 (top left), 3 (bottom left), 6 (top right) and 10 (bottom right). .............................................................. 98
3-14 Plot of the normalized TA kinetic traces of the PtnNDI2 series at 650 nm (top), 478 nm (middle) and simulated decay of the triplet exciton (bottom) assuming 27.2 ps/step. ....................................................................................................... 99
3-16 Polaron or exciton diffusion via a random hopping mechanism. Half (5 units) of a Pt10NDI2 molecule is shown. ...................................................................... 103
3-17 Calculating the rate of diffusional transport to the chain end. ........................... 104
3-18 The bi-exponential function found to describe decay of electrons injected into the Pt chains of Pt10NDI2 molecules compared with random walk simulations having steps of 27 ps in which each step moves one repeat unit left or right along the Pt10 chain. ......................................................................................... 105
3-19 Two possible reactions of the triplet excitons for PtnNDI2 oligomers. ............... 106
4-1 Various platinum acetylide compounds studied by Cooper, Rogers, et al. ....... 110
4-2 Series of dinuclear platinum acetylide complexes studied by Farley. ............... 111
4-3 General structure of the PhnPt2 series, where n = 1, 2, 4, 9. ............................ 112
4-4 Oligo(PPE) structures (top), absorption (left) and emission (right) spectra reported by Godt. .............................................................................................. 112
4-5 Synthesis of the Ph1Pt2 oligomer...................................................................... 114
4-7 Synthesis of orthogonally-protected intermediate 36. ....................................... 116
4-8 Synthesis of the Ph4Pt2 oligomer...................................................................... 116
4-9 Synthesis of synthon 43. .................................................................................. 117
4-10 Synthesis of the Ph9Pt2 oligomer...................................................................... 118
4-11 UV-Vis absorption spectra for PhnPt2 series. .................................................... 120
4-12 Delocalization of ground state within the PhnPt2 series. ................................... 121
4-13 Steady state photoluminescence spectra of the PhnPt2 series. ........................ 122
4-14 Delocalization of the singlet excitons for the PhnPt2 series. .............................. 123

11
4-15 Time-resolved emission spectrum of Ph9Pt2 in degassed THF. Excitation at
355 nm, spectrum recorded at a 10.15 s delay. ............................................. 125
4-16 Transient absorption spectra of PhnPt2 series. ................................................. 127
12
Abstract of Dissertation Presented to the Graduate School of the University of Florida in Partial Fulfillment of the Requirements for the Degree of Doctor of Philosophy
CHARACTERIZATION OF POLARONS AND EXCITONS IN MONODISPERSE
PLATINUM ACETYLIDE MATERIALS
By
Julia Marie Keller
May 2010
Chair: Kirk S. Schanze Major: Chemistry
The overall goal of this work was to design, synthesize and characterize various
series of platinum-acetylide oligomers in order to better understand the structure-
property relationships in these types of materials. Specifically, this research sought to
further define the photophysical properties of both triplet excitons and negative polarons
in these molecules by means of both steady-state and time-resolved methods. The
results of this work not only provide insight into the synthesis of monodisperse
organometallic oligomers, but they also provide a more in-depth understanding of both
the structure and dynamics of excited and charged states within conjugated systems
that feature organometallic or metal-organic moieties.
First, we report the synthesis and characterization of a series of monodisperse
platinum-acetylide oligomers PtnNDI2, where NDI is an easily reducible end group. The
oligomers were synthesized via an iterative-convergent approach utilizing
organometallic synthons that feature orthogonally protected terminal acetylene units.
The oligomers were characterized by electrochemistry, UV-visible absorption and
photoluminescence spectroscopy. The emission spectra reveal that the triplet exciton is
13
efficiently quenched in the NDI end-capped oligomers, and the quenching is thought to
arise due to exciton migration followed by photoinduced charge separation.
Variable temperature steady-state emission studies, pulse radiolysis
measurements and ultrafast transient absorption measurements were applied to
examine the transport dynamics of negative polaron and triplet exciton states in the
PtnNDI2 series. Ultrafast single shot experiments, compared to simulated random-walk
data, reveal trapping of the anion radical for Pt10NDI2 in short times with the lifetime for
polaron diffusion estimated to be ~27 ps. Low temperature emission studies reveal that
the rate-limiting step for exciton quenching is exciton diffusion. Femtosecond transient
absorption data was coupled with simulation data to extract a triplet exciton hopping
rate of ~27.2 ps.
Another series of platinum-acetylide oligomers PhnPt2 were also synthesized,
consisting of a phenylene ethynylene core of varying length capped by platinum end
groups. The study was meant to examine the effects on excited state properties
between two platinum moieties of increasing organic spacer distances. Optical data
conclude that the singlet exciton remains highly delocalized throughout the series, but
approaching its limit. The extent of delocalization in triplet exciton seems to have been
reached by Ph4Pt2, and phosphorescence yields at ambient temperatures decreased
with increasing spacer length until emission was almost elusive in the n=9 oligomer.
14
CHAPTER 1 INTRODUCTION TO PLATINUM ACETYLIDE MATERIALS
Platinum acetylide materials have attracted much attention over the last decade,
owing to both the unique photophysical properties they exhibit as well as their
application to optical and electronic fields. To gain a better understanding of these
materials, this chapter has been divided into two major sections. The first section
provides an overview of the basic concepts of photophysics such as light absorption,
emission, and photoinduced electron and energy transfer. The second section broadly
introduces platinum acetylide materials including synthetic methods and photophysical
properties.
Introduction to Photophysics
The Nature of Light and Matter
Light emission is generated as a result of energy changes of the valence electrons
in atoms and molecules. Because of the direct relationship between light and matter,
theories of both atomic structure and the nature of light have developed
simultaneously.1-3 The scientific understanding of the nature of light began with Sir
Isaac Newton‘s particle theory, introduced in his Opticks, published in 1704.4 According
to Newton, "Light is composed of tiny particles, or corpuscles, emitted by luminous
bodies." Around the same time, Huygens introduced his wave theory of light; however
this concept was not widely accepted until the 19th century when Maxwell developed
the classical electromagnetic theory. With the addition of a single term to existing laws,
the Maxwell equations converged the theories of electricity, magnetism and optics into
one single concept: the electromagnetic field. Maxwell had also discovered a
fundamental constant of nature, the speed of light (3 x 10⁸ m s-1). Concurrently, our
15
understanding of atomic theory was of the classical sense, describing electrons as
particles that obey Newton‘s laws of classical mechanics.
The conflicting models of the wave nature of light and the particle nature of
electrons were altered in the 1900s after Planck carried out his now famous blackbody
experiment. He suggested that the distribution of energy emitted by a blackbody was
not continuous but rather emitted in discrete packets called ―quanta‖. Inspired by his
findings, Einstein developed the modern theory of wave-particle duality of photons
(incorporating his observations of the photoelectric effect), concluding that energy of a
photon is proportional to its frequency. Following Einstein‘s lead, de Broglie
revolutionized the concept that electrons, and all matter, behave with dual wave-particle
nature. His formula, relating wavelength and momentum, was confirmed for electrons
by electron diffraction experiments. Schrödinger developed the proper mathematical
formulation describing the wavefunction of electrons. Now known as quantum theory,
this model has defined our current understanding of atomic structure. Today we
describe the nature of light and electrons as both waves and particles.5
Absorption of Light
The interaction of light with matter can provide useful information about molecular
electronic structure. When an atom or molecule absorbs light, electromagnetic radiation
is taken up by matter, typically via a valence shell electron, promoting it to a higher
energy level. Because the energy levels of the electrons in a molecule are not
continuous but discrete, the frequency of the incident light must equal the molecular
resonant frequency for absorption to occur. The energy of light absorbed therefore
provides the energy difference of the two molecular orbitals involved in the transition.
16
The relationship between the frequency of light absorbed and its energy is described in
Equation 1-1 below:
E = h = (hc/) (1-1)
where h is Planck‘s constant (6.63 x 10⁻³⁴ J∙s), is the frequency of light absorbed (sec-
1), c is the speed of light (3.0 x 10⁸ m∙s-1) and is the wavelength of light (m).
Another important feature of light absorption is the intensity of the light that is
absorbed by a molecule at a particular frequency, the absorbance. The relationship
between molecular absorbance and light intensity is described by the Beer-Lambert
Law (Equation 1-2):
A = -log (I/Io) = -log T = bc (1-2)
in which A is the absorbance at a particular frequency of light, I0 is the intensity of
incident light, I is the intensity of exiting light, T is the transmittance, is the molar
absorptivity of the molecule (L∙mol-1∙cm-1), b is the pathlength of the light (cm) and c is
the concentration of the absorbing species (mol∙L-1). The molar absorptivity is a
measure of the probability of the electronic transition; this property is proportional to the
transition dipole moment between the two electronic states.
While an electronic transition absorbs at a discrete energy by definition (Equation
1-1), molecular absorption spectra typically consist of broad absorption bands rather
than sharp lines. This phenomenon originates from the collective electronic transitions
that accompany the various vibrational states of the molecular bonds. These vibronic
transitions are explained by the Franck-Condon Principle;6,7 electronic transitions occur
very rapidly (10-15 s) compared to nuclear motions (10-13 s).
17
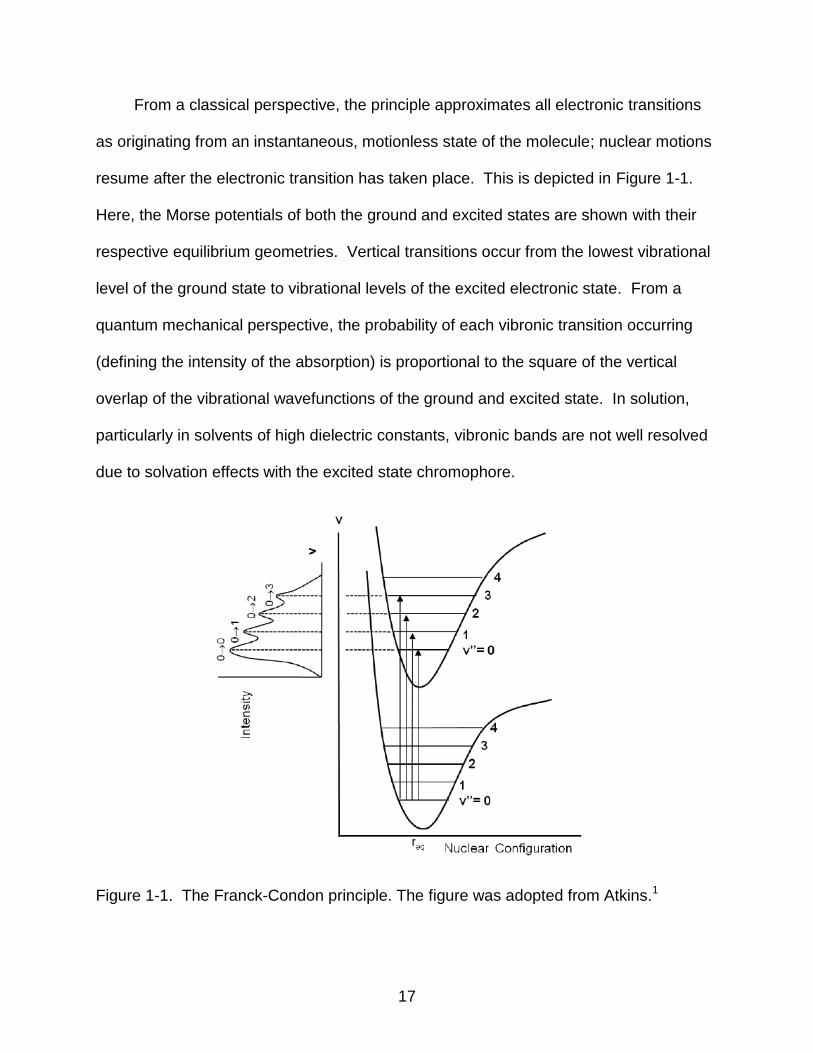
From a classical perspective, the principle approximates all electronic transitions
as originating from an instantaneous, motionless state of the molecule; nuclear motions
resume after the electronic transition has taken place. This is depicted in Figure 1-1.
Here, the Morse potentials of both the ground and excited states are shown with their
respective equilibrium geometries. Vertical transitions occur from the lowest vibrational
level of the ground state to vibrational levels of the excited electronic state. From a
quantum mechanical perspective, the probability of each vibronic transition occurring
(defining the intensity of the absorption) is proportional to the square of the vertical
overlap of the vibrational wavefunctions of the ground and excited state. In solution,
particularly in solvents of high dielectric constants, vibronic bands are not well resolved
due to solvation effects with the excited state chromophore.
Figure 1-1. The Franck-Condon principle. The figure was adopted from Atkins.1
18
Excited State Properties
From initial excitation to the first (‗hot‘) electronic excited state, the molecule
quickly relaxes to the lowest vibrational level of that state via either thermal or collisional
relaxation (Kasha‘s Rule). For solvated molecules, the rate of relaxation is dependent
on the viscosity of the solvent. Generally, solvent relaxation is short compared to the
lifetime of the excited state (10-13-10-12 s), allowing full relaxation of the excited state. In
the case of highly viscous solvents or short-lived excited states, however, other
processes may occur prior to complete equilibration of the excited molecule.
When the initial electronic state of the molecule is neutral, the electrons are
generally paired and of opposite spin states, according to Hund‘s Rule. Upon excitation
the electron does not change spin states, in keeping with spin restriction rules imposed
by quantum mechanics, and the initial excited state formed is termed a singlet excited
state (S1). In some instances, however, the spin of the promoted electron can flip,
changing the overall spin momentum of the excited molecule to three. This process is
referred to as intersystem crossing (ISC). The resulting state, a triplet state (T1), is
characterized by an excited state with electrons with parallel spins. Similar to initial
formation of the singlet excited state, the triplet excited state is initially formed in a ‗hot‘
state via coupling of equal energy singlet and triplet vibrational levels before relaxation
to the lowest vibrational level.
Intersystem crossing is ―forbidden‖ by quantum rules (due to conservation of
momentum), and in organic molecules it typically occurs at a slow rate and therefore
generates low yields of triplet. When strong spin-orbit coupling is present, however, the
rate and yield of ISC are greatly increased. Spin-orbit coupling is facilitated by the
heavy atom effect: this occurs when the spin angular momentum and orbital angular
19
momentum can interact in such a way that the total orbital momentum is conserved.
For this reason, ISC yields are typically higher in organometallic and inorganic
molecules—including platinum acetylides, the focus of this study.
The energy of the first triplet excited state is always lower in energy than that of
the first singlet excited state. Coulombic repulsion is higher for the singlet as the
electron spins are paired and are not forbidden to occupy the same space; for the
triplet, the spins are parallel and therefore forbidden to occupy the same region. The
singlet-triplet energy splitting (ES-T) is then larger for small molecules than for larger
molecules, typically.8
Upon equilibration of either metastable excited state, an electron will eventually
return to ground state configuration by one of two mechanisms: radiative or nonradiative
decay. For radiative decay processes, the excited electron deactivates by emission of a
photon equaling the energy difference from the equilibrated excited state to some
vibronic level of the ground state (similar to the absorption of a photon). Emission from
the singlet excited state is termed fluorescence (F); emission from the triplet excited
state is termed phosphorescence (P). Fluorescence is a quantum mechanically allowed
process as it involves a transition from states with the same spin, and it is therefore a
fast process (108 s-1).9 Phosphorescence is a forbidden process, and although
facilitated by spin-orbit coupling it is much slower (105-102 s-1). A third type of radiative
decay is called delayed fluorescence. The lifetime of this process is somewhat longer
as S1 is populated via an indirect route, namely via a thermally assisted T1S1
mechanism or via bimolecular triplet-triplet T1+T1S0+S1 annihilation mechanism.
Another phenomenon of radiative decay that is commonly seen is the Stokes shift;
20
recall that vibrational relaxation to the lowest excited state, v=0, is typically fast,
therefore the energy of the radiative decay will be smaller than that of absorption. This
results in fluorescence emission of a longer wavelength than absorption, and the extent
of the Stokes shift correlates to the structural differences between the ground and
singlet excited states.
Nonradiative decay is the other deactivation mechanism involved in excited state
relaxation. Here, the energy difference between two states of the same spin is
dissipated as heat. Both nonradiative decay and vibrational relaxation processes are
referred to as internal conversion (IC). The relative rate of this process is defined by the
energy gap law which relates a decrease in excited state energy with an exponential
increase in the rate of nonradiative decay. The energy gap law has been applied to
aromatic hydrocarbons, rare earth ions and more recently Pt-containing conjugated
polymers and monomers—the focus of the present study.10
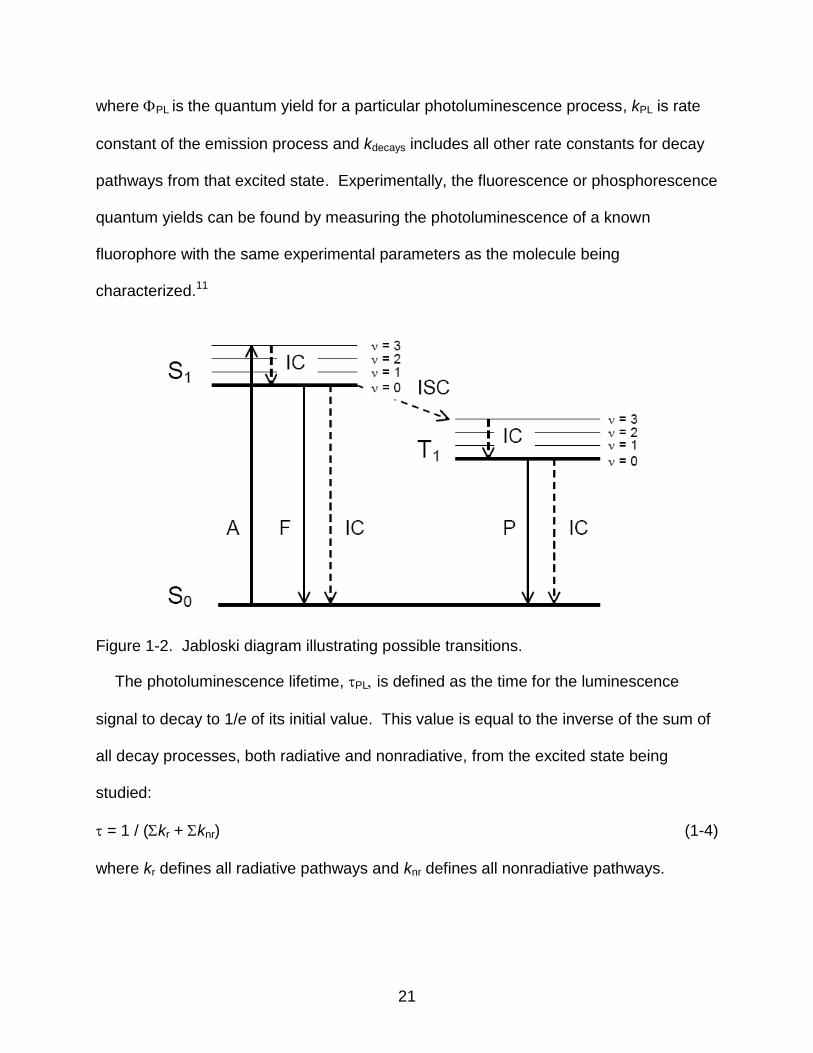
All of the above mentioned processes are depicted in the Jablonski diagram
shown in Figure 1-2. From these transitions, two additional characteristics of the
excited state need defining, as they will be frequently discussed herein: the
photoluminescence quantum yield, PL, and the lifetime, , of an excited state process.
The photoluminescence (PL) quantum yield defines the efficiency of a PL process; it is
calculated as a ratio of the number of photons emitted to the number of photons
absorbed. It is also defined as the ratio of the rate PL decay from a particular excited
state to the sum of the rates of all processes of decay from that excited state, given as:
PL = kPL / (kdecays) (1-3)
21
where PL is the quantum yield for a particular photoluminescence process, kPL is rate
constant of the emission process and kdecays includes all other rate constants for decay
pathways from that excited state. Experimentally, the fluorescence or phosphorescence
quantum yields can be found by measuring the photoluminescence of a known
fluorophore with the same experimental parameters as the molecule being
characterized.11
Figure 1-2. Jabloski diagram illustrating possible transitions.
The photoluminescence lifetime, PL is defined as the time for the luminescence
signal to decay to 1/e of its initial value. This value is equal to the inverse of the sum of
all decay processes, both radiative and nonradiative, from the excited state being
studied:
= 1 / (kr + knr) (1-4)
where kr defines all radiative pathways and knr defines all nonradiative pathways.
22
Energy Transfer
As well as the self-relaxation pathways from the excited state previously
discussed, an excited state may also return to the ground state via an energy transfer
mechanism. In the presence of an acceptor moiety, deactivation of the excited state
could occur by the bimolecular process given:
D* + A D + A* (1-5)
where D is the donor, A is the acceptor and * denotes the excited state. For this
process to occur, it is necessary that (1) the energy of D* is higher than the energy of A*
for the exchange to be thermodynamically favorable, and (2) the rate of energy transfer
must be within the lifetime of D*. Several different mechanisms of energy transfer
exists, but they can be broadly classified as either radiative transfer or radiationless
transfer processes.
Radiative energy transfer involves emission of D* followed by reabsorption of that
energy by the acceptor A, as shown below.
D + hv D*
D* D + hv‘
A + hv‘ A* (1-6)
It is necessary in this process that the absorption energies of A and the emission
energies of D* overlap to some extent. The solvent viscosity does not affect the rate of
energy transfer, and energy transfer is effective even from longer distances. Also
notable, the lifetime of D* is unaffected by the energy transfer process.
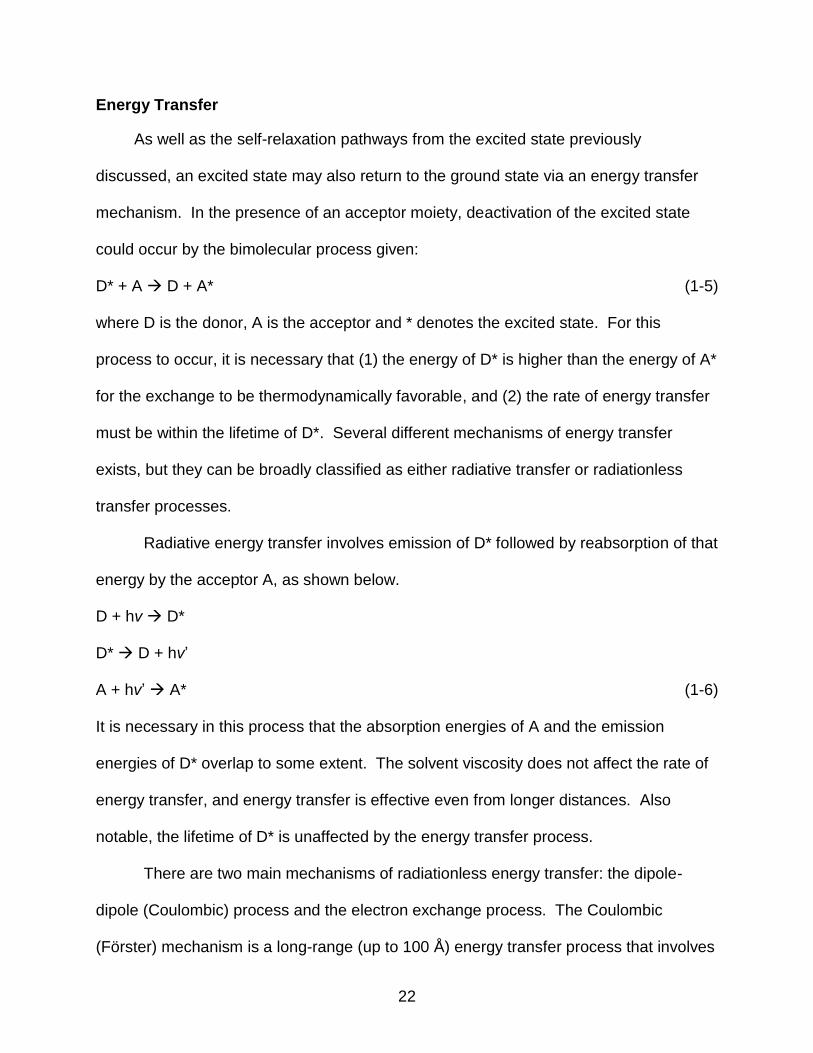
There are two main mechanisms of radiationless energy transfer: the dipole-
dipole (Coulombic) process and the electron exchange process. The Coulombic
(Förster) mechanism is a long-range (up to 100 Å) energy transfer process that involves
23
the coupling of both the ground and excited state oscillating dipoles.12 This interaction
causes perturbation of the electronic structures in both the donor and acceptor, leading
to excitation of the electron on the acceptor and deactivation of the donor electron. No
contact between the donor and acceptor is required, but the mechanism does
necessitate sufficient overlap of the absorption of A and the emission of D*, and only
singlet-singlet transfer is allowed. This mechanism is represented in Figure 1-3. The
probability for this mechanism is proportional to 1/R6
(where R is the distance between
the donor and the acceptor). The rate of energy transfer is independent of the solvent
viscosity, however the lifetime of the donor will be shortened by the process.
Figure 1-3. Coulombic (Förster) mechanism for long-range energy transfer.
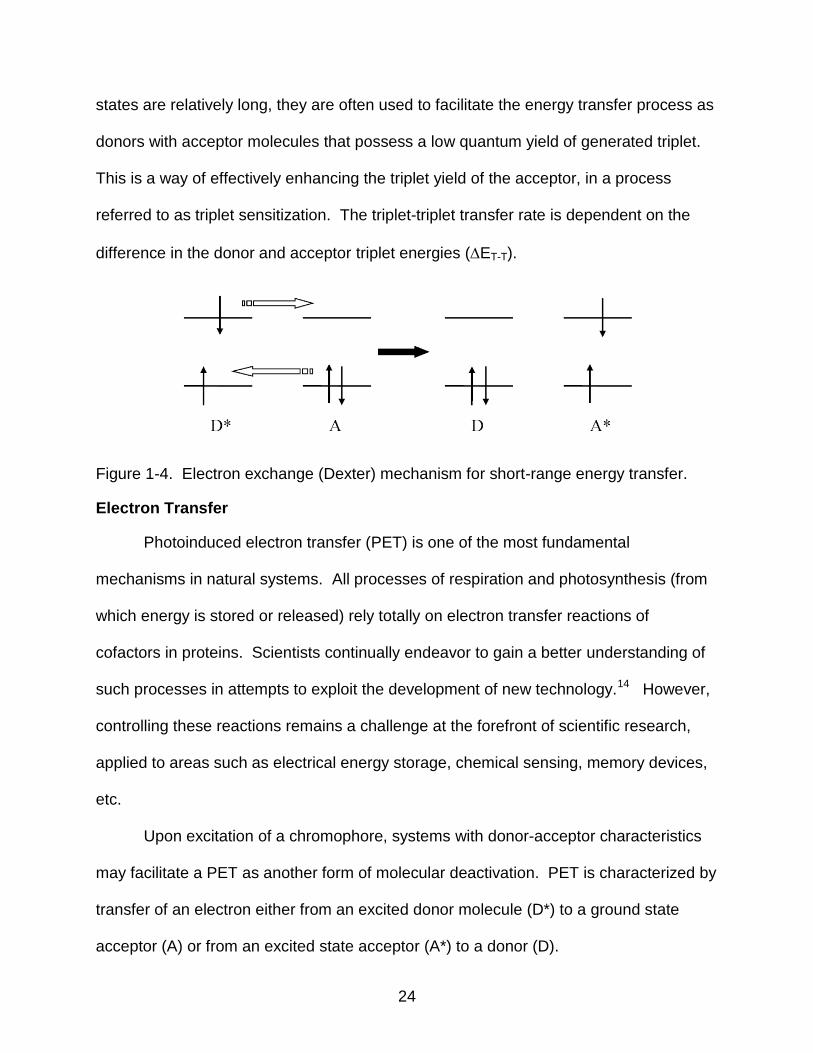
The electron exchange (Dexter), or collisional, mechanism involves overlap of
the orbitals between the donor and acceptor involved in the transfer.13 Therefore, this
process occurs for molecules that are in close proximity to one another (~10-15 Å). The
rate of energy transfer is limited by molecular diffusion of D* and A, and it is therefore
dependent on both the temperature and viscosity of the solvent. Both S-S and T-T
transfer mechanisms are allowed by this process, and this is the dominant mechanism
in triplet-triplet energy transfer. A schematic of this process is given in Figure 1-4.
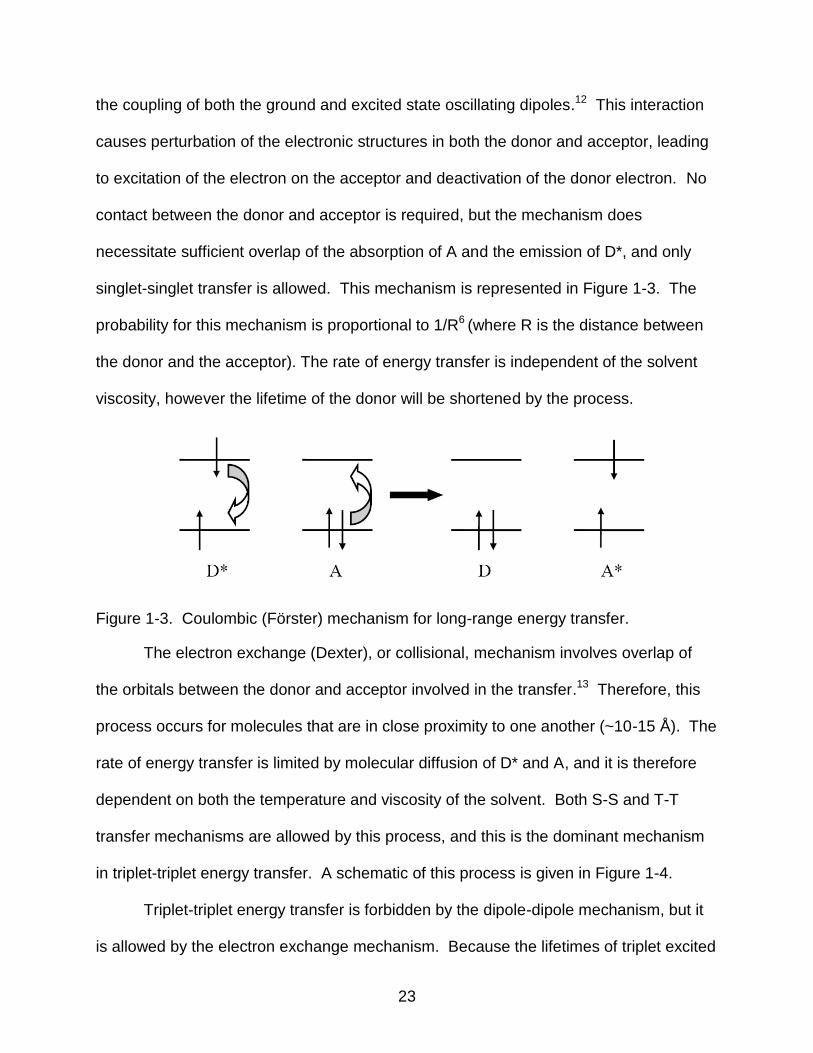
Triplet-triplet energy transfer is forbidden by the dipole-dipole mechanism, but it
is allowed by the electron exchange mechanism. Because the lifetimes of triplet excited
24
states are relatively long, they are often used to facilitate the energy transfer process as
donors with acceptor molecules that possess a low quantum yield of generated triplet.
This is a way of effectively enhancing the triplet yield of the acceptor, in a process
referred to as triplet sensitization. The triplet-triplet transfer rate is dependent on the
difference in the donor and acceptor triplet energies (ET-T).
Figure 1-4. Electron exchange (Dexter) mechanism for short-range energy transfer.
Electron Transfer
Photoinduced electron transfer (PET) is one of the most fundamental
mechanisms in natural systems. All processes of respiration and photosynthesis (from
which energy is stored or released) rely totally on electron transfer reactions of
cofactors in proteins. Scientists continually endeavor to gain a better understanding of
such processes in attempts to exploit the development of new technology.14 However,
controlling these reactions remains a challenge at the forefront of scientific research,
applied to areas such as electrical energy storage, chemical sensing, memory devices,
etc.
Upon excitation of a chromophore, systems with donor-acceptor characteristics
may facilitate a PET as another form of molecular deactivation. PET is characterized by
transfer of an electron either from an excited donor molecule (D*) to a ground state
acceptor (A) or from an excited state acceptor (A*) to a donor (D).
25
D* + A D+ + A-
D + A* D+ + A- (1-7)
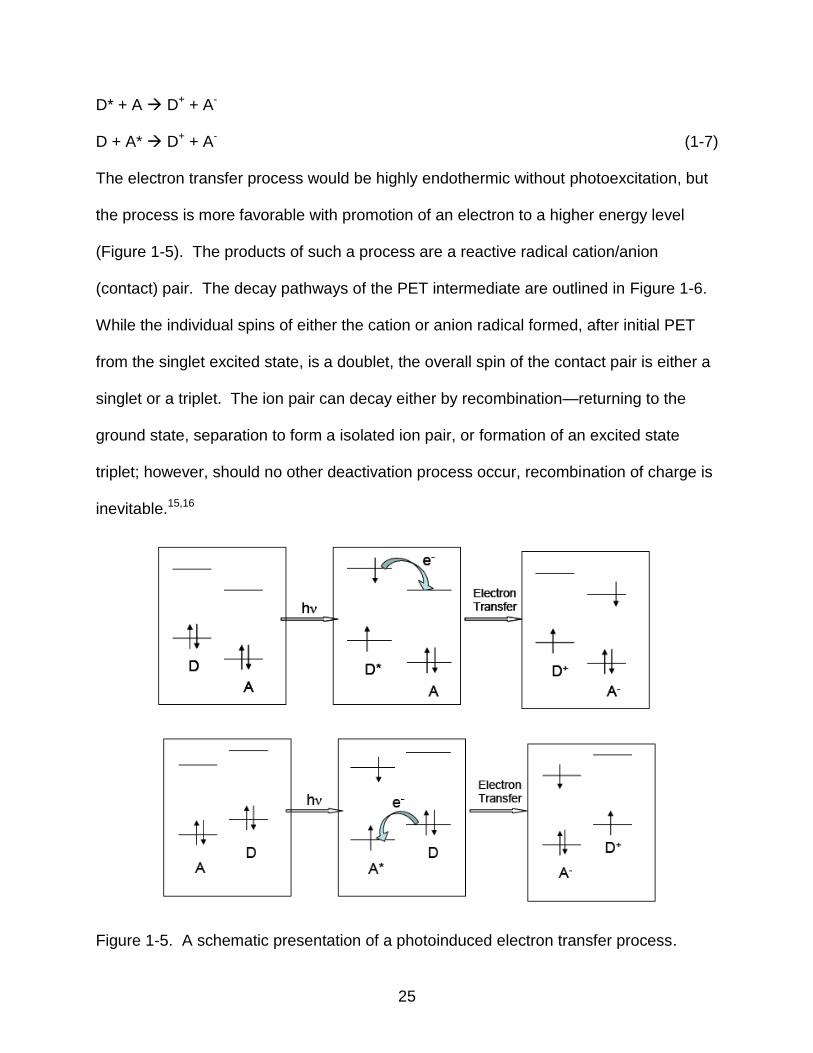
The electron transfer process would be highly endothermic without photoexcitation, but
the process is more favorable with promotion of an electron to a higher energy level
(Figure 1-5). The products of such a process are a reactive radical cation/anion
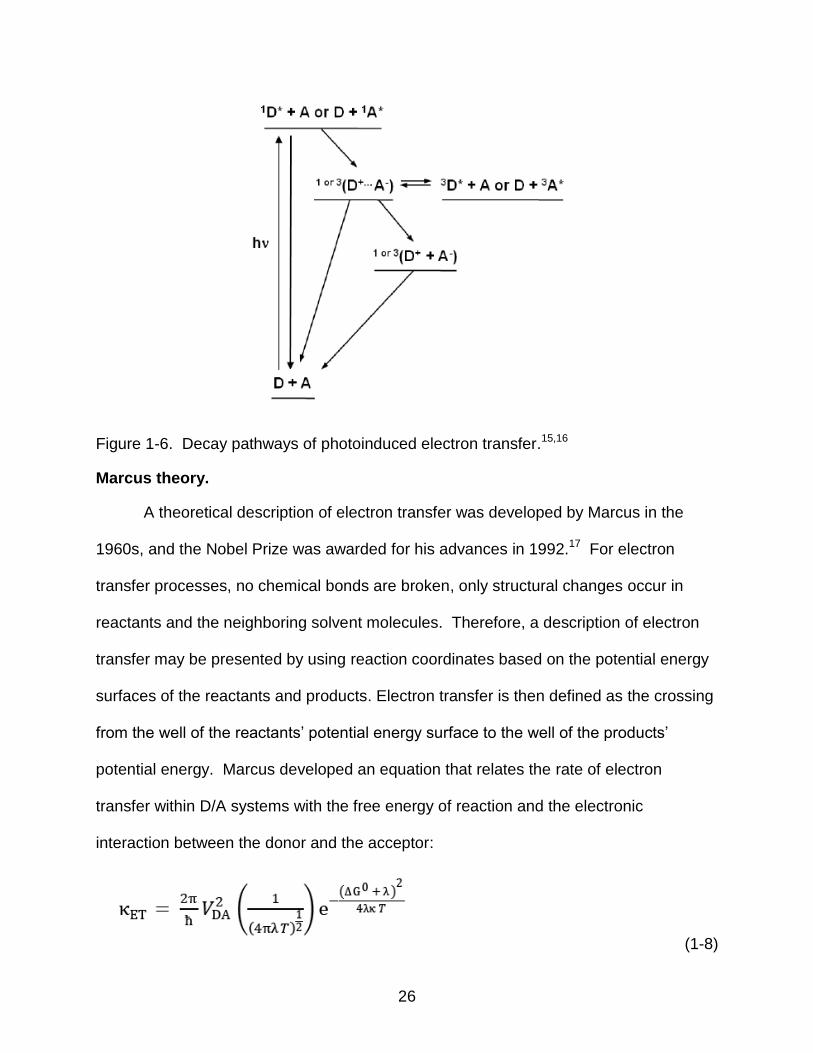
(contact) pair. The decay pathways of the PET intermediate are outlined in Figure 1-6.
While the individual spins of either the cation or anion radical formed, after initial PET
from the singlet excited state, is a doublet, the overall spin of the contact pair is either a
singlet or a triplet. The ion pair can decay either by recombination—returning to the
ground state, separation to form a isolated ion pair, or formation of an excited state
triplet; however, should no other deactivation process occur, recombination of charge is
inevitable.15,16
Figure 1-5. A schematic presentation of a photoinduced electron transfer process.
26
Figure 1-6. Decay pathways of photoinduced electron transfer.15,16
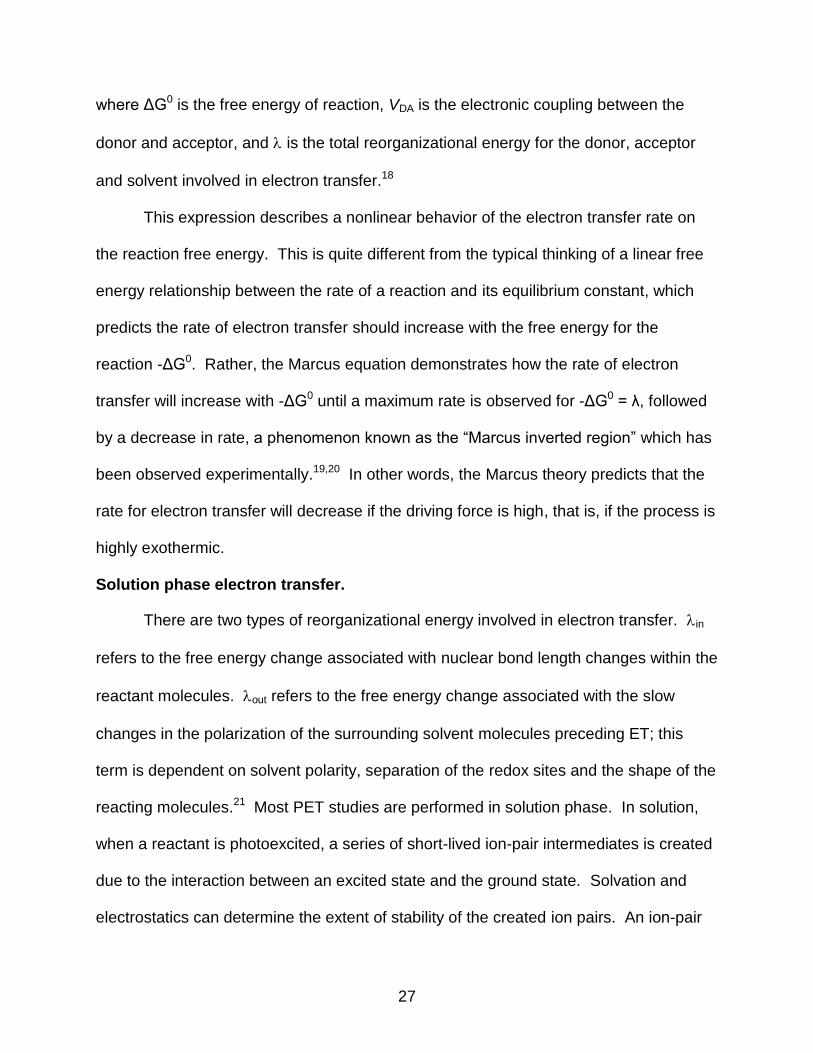
Marcus theory.
A theoretical description of electron transfer was developed by Marcus in the
1960s, and the Nobel Prize was awarded for his advances in 1992.17 For electron
transfer processes, no chemical bonds are broken, only structural changes occur in
reactants and the neighboring solvent molecules. Therefore, a description of electron
transfer may be presented by using reaction coordinates based on the potential energy
surfaces of the reactants and products. Electron transfer is then defined as the crossing
from the well of the reactants‘ potential energy surface to the well of the products‘
potential energy. Marcus developed an equation that relates the rate of electron
transfer within D/A systems with the free energy of reaction and the electronic
interaction between the donor and the acceptor:
(1-8)
27
where ΔG0 is the free energy of reaction, VDA is the electronic coupling between the
donor and acceptor, and is the total reorganizational energy for the donor, acceptor
and solvent involved in electron transfer.18
This expression describes a nonlinear behavior of the electron transfer rate on
the reaction free energy. This is quite different from the typical thinking of a linear free
energy relationship between the rate of a reaction and its equilibrium constant, which
predicts the rate of electron transfer should increase with the free energy for the
reaction -ΔG0. Rather, the Marcus equation demonstrates how the rate of electron
transfer will increase with -ΔG0 until a maximum rate is observed for -ΔG0 = λ, followed
by a decrease in rate, a phenomenon known as the ―Marcus inverted region‖ which has
been observed experimentally.19,20 In other words, the Marcus theory predicts that the
rate for electron transfer will decrease if the driving force is high, that is, if the process is
highly exothermic.
Solution phase electron transfer.
There are two types of reorganizational energy involved in electron transfer. in
refers to the free energy change associated with nuclear bond length changes within the
reactant molecules. out refers to the free energy change associated with the slow
changes in the polarization of the surrounding solvent molecules preceding ET; this
term is dependent on solvent polarity, separation of the redox sites and the shape of the
reacting molecules.21 Most PET studies are performed in solution phase. In solution,
when a reactant is photoexcited, a series of short-lived ion-pair intermediates is created
due to the interaction between an excited state and the ground state. Solvation and
electrostatics can determine the extent of stability of the created ion pairs. An ion-pair
28
that is separated by several solvent molecules results in a pair of geminate ions is
called a solvent-separated ion pair (SSIP); the driving force of ET in this type is given by
Rehm-Weller equation (Equation 1-9):
ΔGSSIP = E0(D+/D) - E0(A/A-) -ΔG* + wp-wR (1-9)
in which E0(D+/D) is the oxidation potential of the donor, E0(A/A-) is the reduction
potential of the acceptor, ΔG* is the free-energy of the equilibrated excited-state, and wP
and wR are the work terms for electrostatic interaction in the product (P) and in the
reactant (R) states. The work terms describe the influences of the donor and acceptor
charges (ZD and ZA) and their center-to-center distances from one another (dCC) in
relation to the static dielectric constant (S) of the solvent as shown (Equation 1-10).
w = ZDZAe2 / dccS (1-10)
This relationship describes a greater influence of electrostatics in nonpolar solvents and
predicts the greater feasibility for ion dissociation in more polar solvents.
The collision of neutral reactants within the solvent cage is said to form either a
contact ion pair (CIP) or an intimate CT complex, an exciplex. Solvent polarity and
reactant structures heavily influence the production of either; nonpolar solvents are
typically favored for exciplex formation, however, and this intermediate is generally
distinguished by the emission of light observed in the emission spectrum.
Spin dynamics of PET.
As PET can occur from either the singlet or triplet state, spin restriction rules
dictate that electron spin is usually conserved. However, there are some examples of
systems in which singlet-triplet intersystem crossing of an ion pair has been observed;
major factors that contribute to this conversion are hyperfine coupling, Zeeman splitting,
29
and spin-orbit coupling.22 When a force whose energy is stronger than the exchange
interaction, or charge separation energy (J), operates during electron transfer process,
electron spin multiplicity changes and ISC occurs.
Hyperfine coupling involves the interaction between the spin magnetic moment of
an unpaired electron and the nuclear spin magnetic moment. When J, between the
singlet and triplet, becomes smaller than this energy (ΔEhf > J), a spin flip takes place by
hyperfine coupling. For a solvent-separated ion pair or free ion, ISC is operated by the
hyperfine coupling mechanism because J becomes negligible at such large distances;
for a contact ion pair or exciplex, J becomes large due to small distance. The Zeeman
Effect describes splitting of degenerate electronic energies upon exposure to a
magnetic field; with increasing applied strength of the external field, Zeeman splitting
breaks up the T0 degeneracy into T+ and T- sublevels and may induce a spin flip via a
S-T transition. Spin-orbit coupling is generally not a common mechanism for ionic
intersystem crossing, as it usually involves the interaction of electrons about a single
atomic nucleus.
PET in metal-organic dyads.
A dyad is a supramolecular assembly consisting of a light-absorbing chromophore
and an electron donor or acceptor moiety. Much early work in the PET field has
focused on organic donor-acceptor systems (which most recently has encompassed
C60, porphyrins and phthalocyanines moieties),23-28 but research quickly began to
incorporate transition metals. While initial systems focused on bimolecular PET
dynamics, the development of unimolecular, covalently linked chromophore-quencher
systems grew increasingly popular concurrently with advancements in instrumentation
as well as synthetic methodologies. These systems provide the benefit of negating
30
diffusion dynamics by controlling the length and orientation of the spacer while also
allowing control or variation of the spacer between the donor and acceptor moieties;
they are generally characterized by long lifetimes of the charge separated (CS) state
which allows the possibility to collect the charges at corresponding electrodes in
photovoltaic devices, thus generating photocurrent. Because the field of PET is
extremely diverse, only metal-organic dyads will be mentioned.
Metal-organic dyads consist of a transition metal complex that serves as the light
absorbing chromophore, as well as an organic electron donor or acceptor. More
commonly, these systems contain a metal with a d6 electronic configuration; the lowest
excited state arises from a metal to ligand charge transfer (MLCT) transition that
involves promotion of a metal centered d electron into a ligand based * level. Two
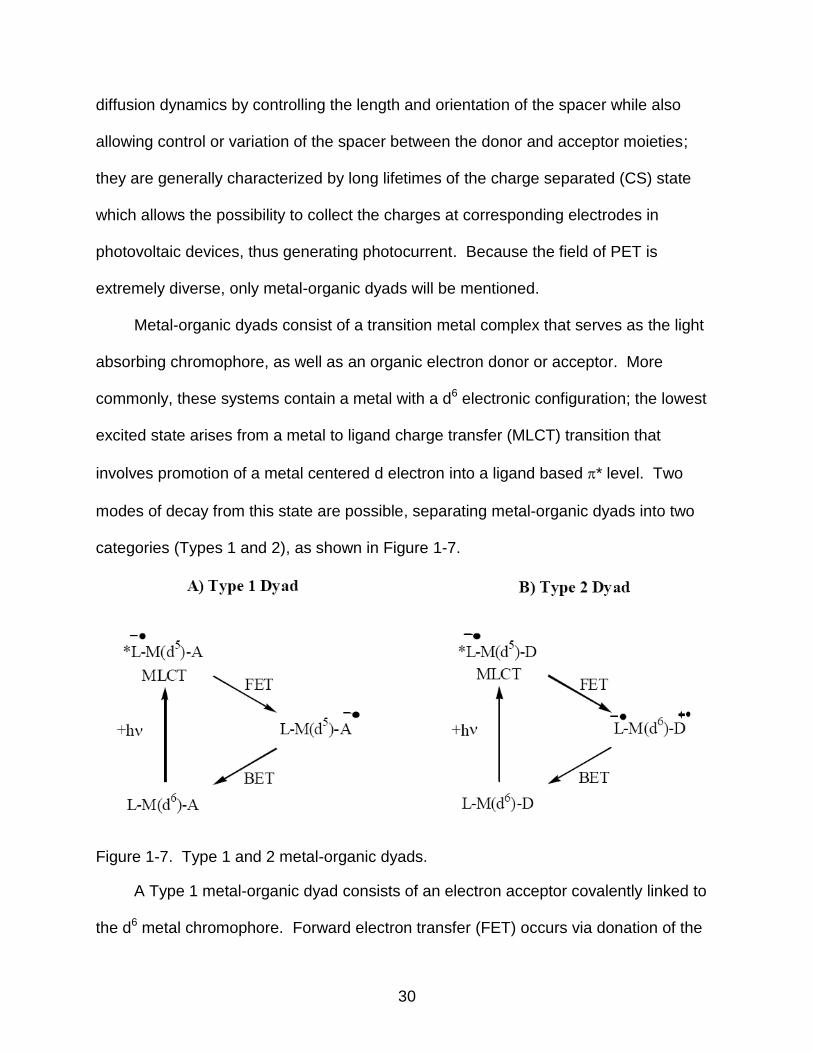
modes of decay from this state are possible, separating metal-organic dyads into two
categories (Types 1 and 2), as shown in Figure 1-7.
Figure 1-7. Type 1 and 2 metal-organic dyads.
A Type 1 metal-organic dyad consists of an electron acceptor covalently linked to
the d6 metal chromophore. Forward electron transfer (FET) occurs via donation of the
31
promoted MLCT electron to the empty * orbital of the organic acceptor. Back electron
transfer (BET) then occurs via electron transfer from the * orbital of the organic
acceptor back to the d-shell of the transition metal (Figure 1-7a). A Type 2 metal-
organic dyad consists of an electron donor covalently linked to the d6 metal
chromophore. FET occurs via electron transfer from a orbital of the organic donor to
the hole left in the d-shell of the transition metal from MLCT. BET then occurs via
charge recombination between the organic radical anion radical cations. (Figure 1-7b).
Several examples of these types exist in the literature, far too many to mention within.
Photophysical Properties of Conjugated Materials
Conjugated materials are unsaturated, meaning the entire molecule consists of
atoms with a continuous orbital system. The first report concerning the conductivity in
these types of materials described the redox properties of polyacetylene.29 Shirakawa,
Heeger,and MacDiarmid were more recently acknowledged in 2000 with the Nobel
Prize in Chemistry for their insights, as conjugated polymers have since been found
useful for a wide variety of applications, mainly in devices. Research has seen success
with these types of materials in light emitting diodes, light emitting electrochemical cells,
plastic lasers, and thin-film transistors.30 A wide variety of conjugated polymer
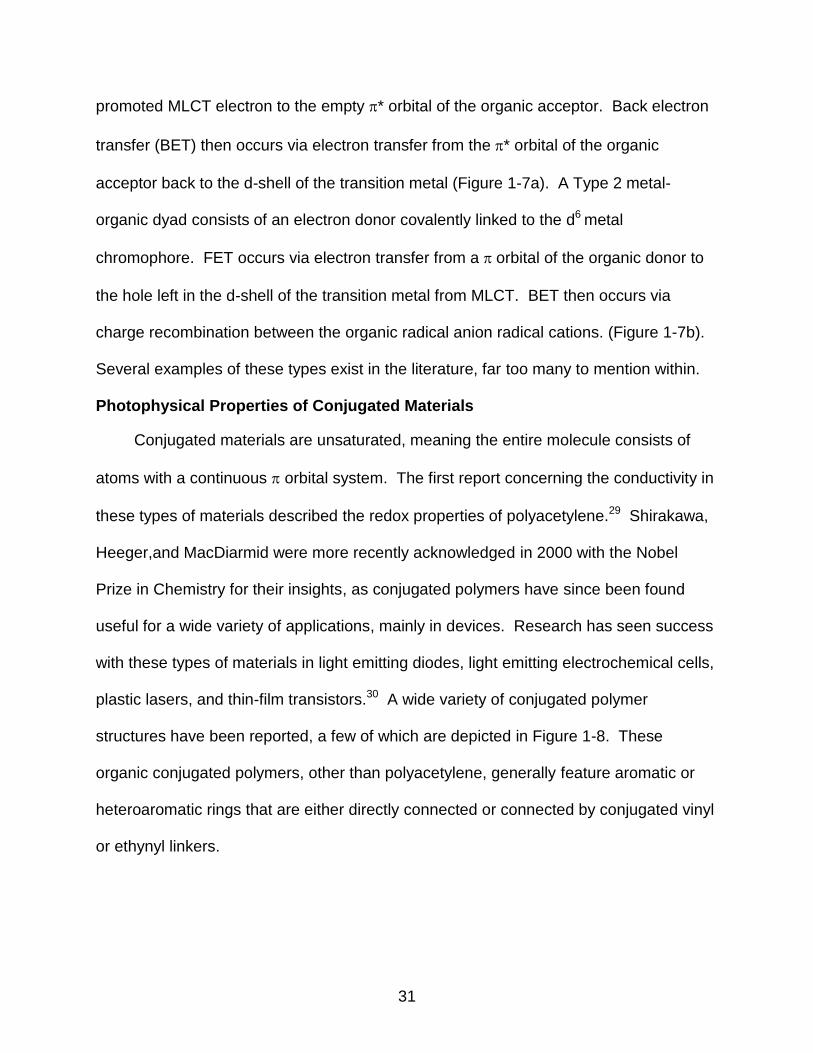
structures have been reported, a few of which are depicted in Figure 1-8. These
organic conjugated polymers, other than polyacetylene, generally feature aromatic or
heteroaromatic rings that are either directly connected or connected by conjugated vinyl
or ethynyl linkers.
32
Figure 1-8. Examples of organic conjugated polymer structures.
Molecular wires in conjugated organic systems
One major reason why conjugated polymers make excellent candidates for
electronic, electro-optical and optical applications is that they provide exceptional
transport properties for charges and excitons. Much research has focused on
understanding carrier transport properties in these materials, especially in
understanding bulk properties of polymers in films.31-35 However, another area in the
field remains focused on the transport properties of these materials as single-chain
―molecular wires‖, or single molecules acting as one-dimensional carriers.
For a molecule to exhibit ―molecular wire‖ properties, the appropriate molecular
geometry is required, as well as the molecule‘s ability to adopt a predictable
conformation. In addition, the material must be an excellent charge carrier and must
display similar energetics over a long distance of the molecule.36 Several examples of
conjugated organic materials used as molecular wires are known.37,38 The concept of
an organic molecular electronics device was first proposed by Aviram and Ratner39, but
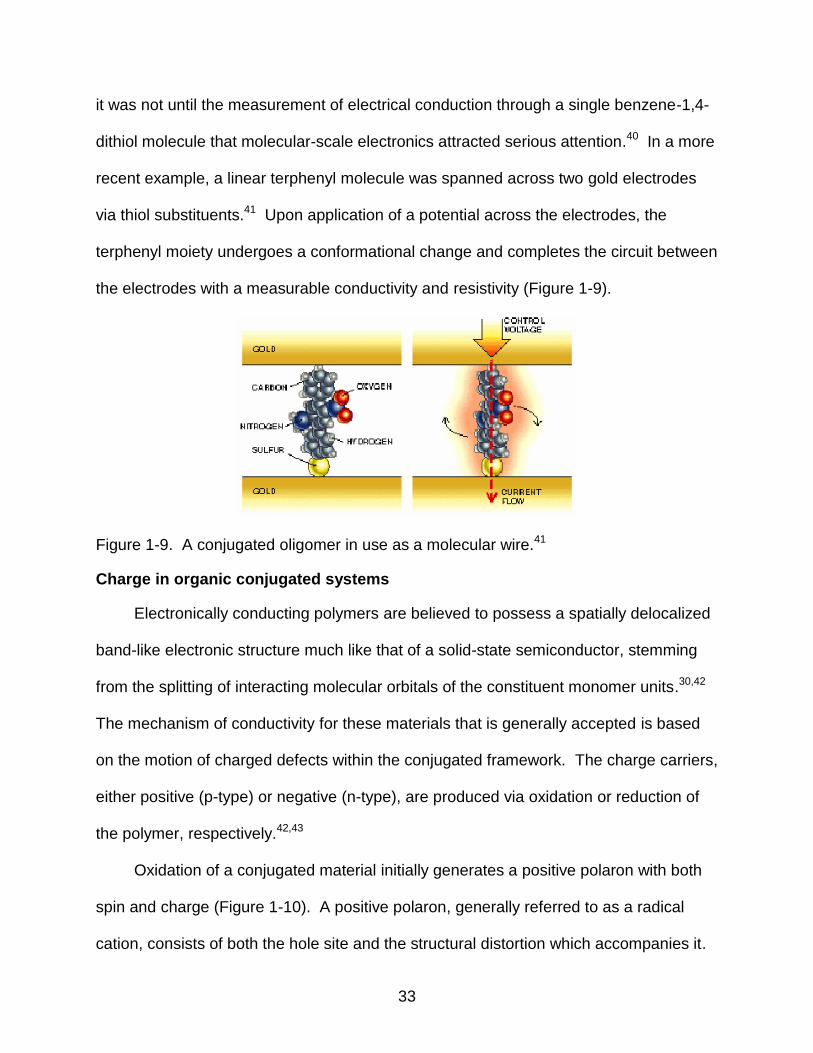
33
it was not until the measurement of electrical conduction through a single benzene-1,4-
dithiol molecule that molecular-scale electronics attracted serious attention.40 In a more
recent example, a linear terphenyl molecule was spanned across two gold electrodes
via thiol substituents.41 Upon application of a potential across the electrodes, the
terphenyl moiety undergoes a conformational change and completes the circuit between
the electrodes with a measurable conductivity and resistivity (Figure 1-9).
Figure 1-9. A conjugated oligomer in use as a molecular wire.41
Charge in organic conjugated systems
Electronically conducting polymers are believed to possess a spatially delocalized
band-like electronic structure much like that of a solid-state semiconductor, stemming
from the splitting of interacting molecular orbitals of the constituent monomer units.30,42
The mechanism of conductivity for these materials that is generally accepted is based
on the motion of charged defects within the conjugated framework. The charge carriers,
either positive (p-type) or negative (n-type), are produced via oxidation or reduction of
the polymer, respectively.42,43
Oxidation of a conjugated material initially generates a positive polaron with both
spin and charge (Figure 1-10). A positive polaron, generally referred to as a radical
cation, consists of both the hole site and the structural distortion which accompanies it.
34
(However, radical cations by strict definition are slightly different in that the term
particularly refers to self-trapped polarons). The cation and radical moieties form bound
species. Calculations have shown that the combination of nearby polarons would
produce a lower energy bipolaron (of the singlet spin pattern).44,45 Analogously,
reduction of a conjugated material would generate a radical anion species, or a negative
polaron. Lattice polarization (deformation about the charge carrier moiety) acts as a
potential well that hinders the movements of the charge, thus decreasing its mobility.
Assuming the charge defect is located between the same conjugated moieties, the
same energy barrier to migration exists in either direction of movement, meaning the
charge defect can migrate along the conjugated backbone of the material in either
direction without changing the energy of the backbone. This property is referred to as
the charge mobility of the polymer.
Charge transport, or electron transport (ET), on the intramolecular scale is viewed
as an interaction between an electron donor (D) linked to an electron acceptor (A)
through some bridging species (B). In general, there are two mechanisms for ET in
these D-B-A systems: superexchange and hopping mechanisms. Superexchange
occurs via a tunneling process; the electron never occupies the bridging unit during
ET.46 Transport via a hopping mechanism involves reduction (or oxidation) of the bridge
by the donor, then to the acceptor.47 The two processes may occur concurrently in the
same system, where the overall rate of electron transfer is equal to the additive rates of
each process.
35
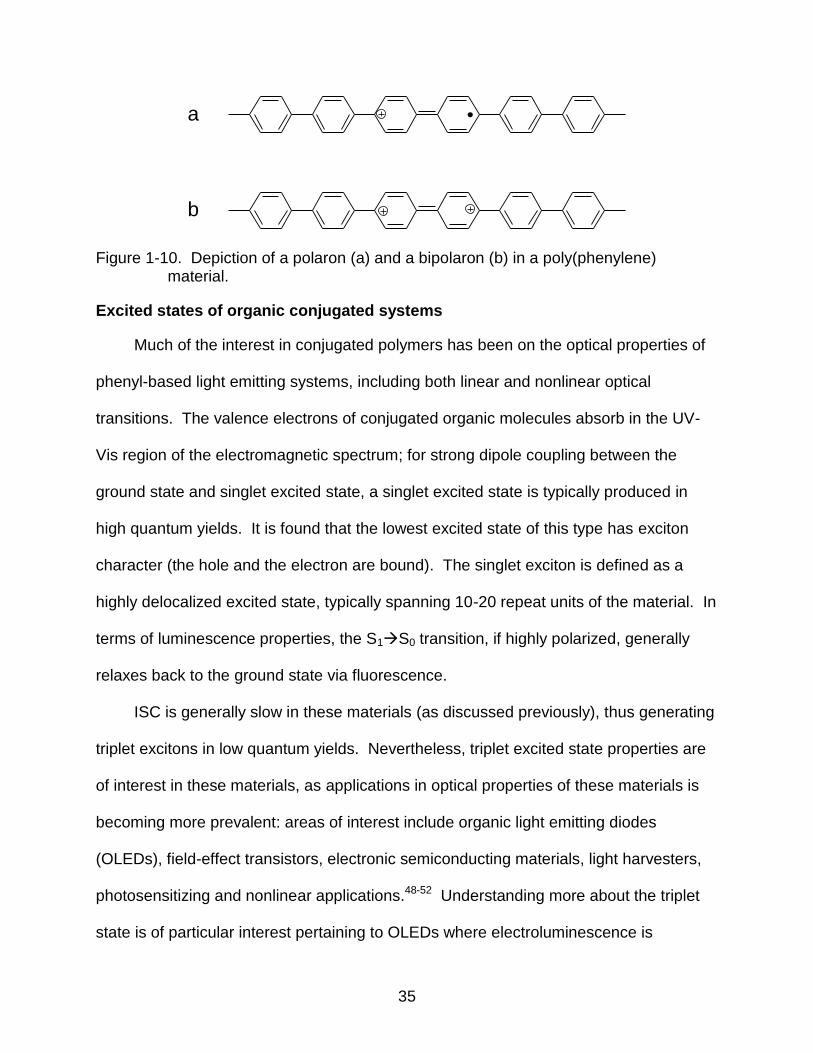
a
b
Figure 1-10. Depiction of a polaron (a) and a bipolaron (b) in a poly(phenylene) material.
Excited states of organic conjugated systems
Much of the interest in conjugated polymers has been on the optical properties of
phenyl-based light emitting systems, including both linear and nonlinear optical
transitions. The valence electrons of conjugated organic molecules absorb in the UV-
Vis region of the electromagnetic spectrum; for strong dipole coupling between the
ground state and singlet excited state, a singlet excited state is typically produced in
high quantum yields. It is found that the lowest excited state of this type has exciton
character (the hole and the electron are bound). The singlet exciton is defined as a
highly delocalized excited state, typically spanning 10-20 repeat units of the material. In
terms of luminescence properties, the S1S0 transition, if highly polarized, generally
relaxes back to the ground state via fluorescence.
ISC is generally slow in these materials (as discussed previously), thus generating
triplet excitons in low quantum yields. Nevertheless, triplet excited state properties are
of interest in these materials, as applications in optical properties of these materials is
becoming more prevalent: areas of interest include organic light emitting diodes
(OLEDs), field-effect transistors, electronic semiconducting materials, light harvesters,
photosensitizing and nonlinear applications.48-52 Understanding more about the triplet
state is of particular interest pertaining to OLEDs where electroluminescence is
36
generated via the recombination of electrons and holes. Emission yields are limited by
spin statistics for the recombination events, a large portion of which populate the non-
emissive triplet states of these materials.
Burrows and coworkers have measured the quantum yields of ISC in various
conjugated polymers using photoacoustic calorimetry.53 Polythiophenes generally
measured higher triplet yields (0.5-0.8) than poly(p-phenylene vinylene)s (0.01-0.04)
due to efficient spin-orbit coupling induced by the sulfur atom.
Singlet and triplet energies of various conjugated polymers were measured by
Burrows and Monkman using pulse radiolysis and energy transfer techniques.54 They
found a linear correlation between the triplet and singlet energy gaps for the polymers
studied. They also found that while planarity of the materials enhanced singlet state
delocalization and torsional angles localized the state, both had little effect on the triplet
state properties, concluding that the triplet exciton is much more localized than the
singlet exciton.
There has been a great deal of interest in studying the transport of excitons along
single chain conjugated materials. These investigations are typically performed in dilute
solutions, minimizing the probability of interchain interactions.55 One method of
investigating exciton transport in conjugated molecules involves the incorporation of low
energy trap sites within the molecule.56-59 Another method of investigation involves the
binding of small molecule quenchers to the conjugated material.60-62 In either scenario,
after photoexcitation of the conjugated material, exciton transfer is confirmed by the
quenching of the emission via either a PET process or emission from the lower energy
trap.
37
Platinum Acetylide Materials
Platinum acetylides are a class of organometallic compounds which exhibit useful
photophysical properties that lend to potential applications in areas such as optical
limiting63 or electroluminescent devices.64 These compounds are air-stable, -
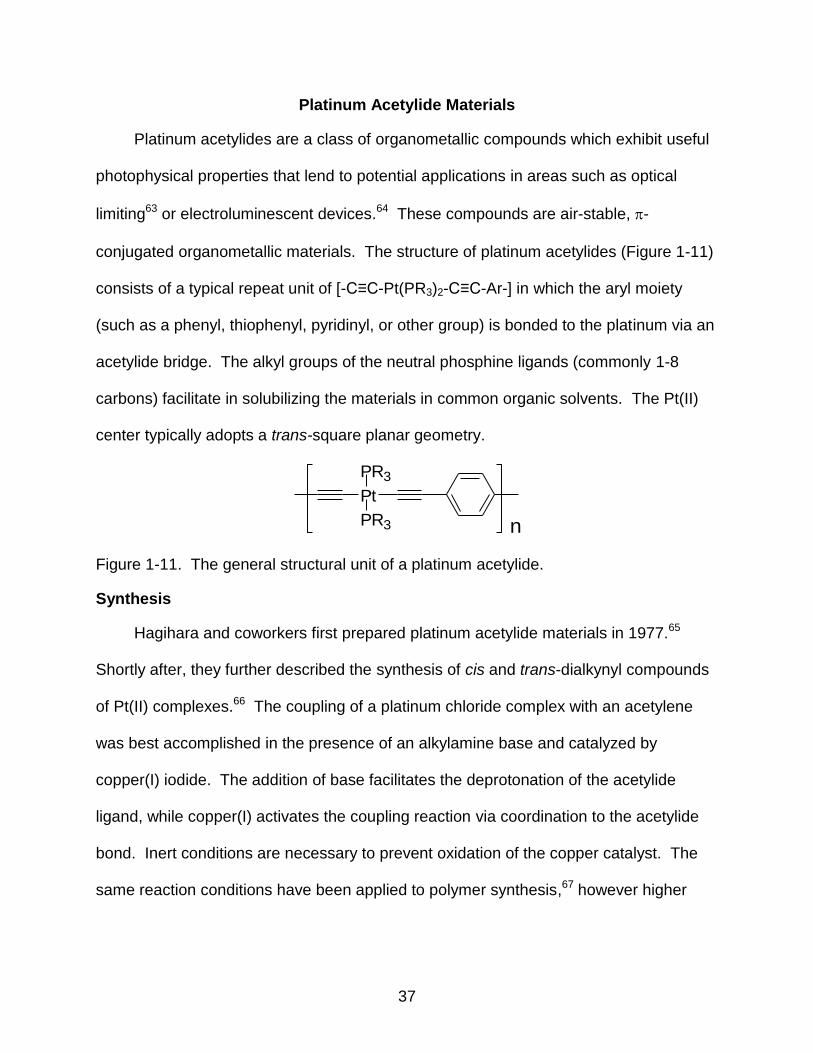
conjugated organometallic materials. The structure of platinum acetylides (Figure 1-11)
consists of a typical repeat unit of [-C≡C-Pt(PR3)2-C≡C-Ar-] in which the aryl moiety
(such as a phenyl, thiophenyl, pyridinyl, or other group) is bonded to the platinum via an
acetylide bridge. The alkyl groups of the neutral phosphine ligands (commonly 1-8
carbons) facilitate in solubilizing the materials in common organic solvents. The Pt(II)
center typically adopts a trans-square planar geometry.
Pt
PR3
PR3 n
Figure 1-11. The general structural unit of a platinum acetylide.
Synthesis
Hagihara and coworkers first prepared platinum acetylide materials in 1977.65
Shortly after, they further described the synthesis of cis and trans-dialkynyl compounds
of Pt(II) complexes.66 The coupling of a platinum chloride complex with an acetylene
was best accomplished in the presence of an alkylamine base and catalyzed by
copper(I) iodide. The addition of base facilitates the deprotonation of the acetylide
ligand, while copper(I) activates the coupling reaction via coordination to the acetylide
bond. Inert conditions are necessary to prevent oxidation of the copper catalyst. The
same reaction conditions have been applied to polymer synthesis,67 however higher
38
molecular weights are afforded with the reaction of trimethyltin-protected acetylides and
platinum chloride under conditions of heat.68
It was more recently found that either the cis or trans-Pt(PR3)Cl2 starting complex
could be used to yield a trans-platinum acetylide product, as cis-trans isomerization is
known to occur in the presence of tertiary amines. Either isomer can be distinguished
by 31P NMR,69-71 observing the coupling between phosphorus and an NMR active
isotope; JPt-P (195Pt, I=1/2, 33.8% natural abundance), is generally below 2500 Hz for
trans isomers and above 2500 Hz for cis isomers.
Photophysics
On a more fundamental level, platinum acetylide materials provide a platform for
investigation of conjugation mediated by metal d/carbon p interactions.72
Introduction of a heavy metal such as platinum into the conjugated backbone of organic
structures provides insight into the triplet excited state that had been elusive in strictly
organic systems. The strong spin-orbit coupling induced by heavy metals provide an
increase both the rate of ISC and radiative decay from the triplet; direct measurement of
phosphorescence readily provides information as to the energy, vibrational structure
and lifetime of the T1 state.73
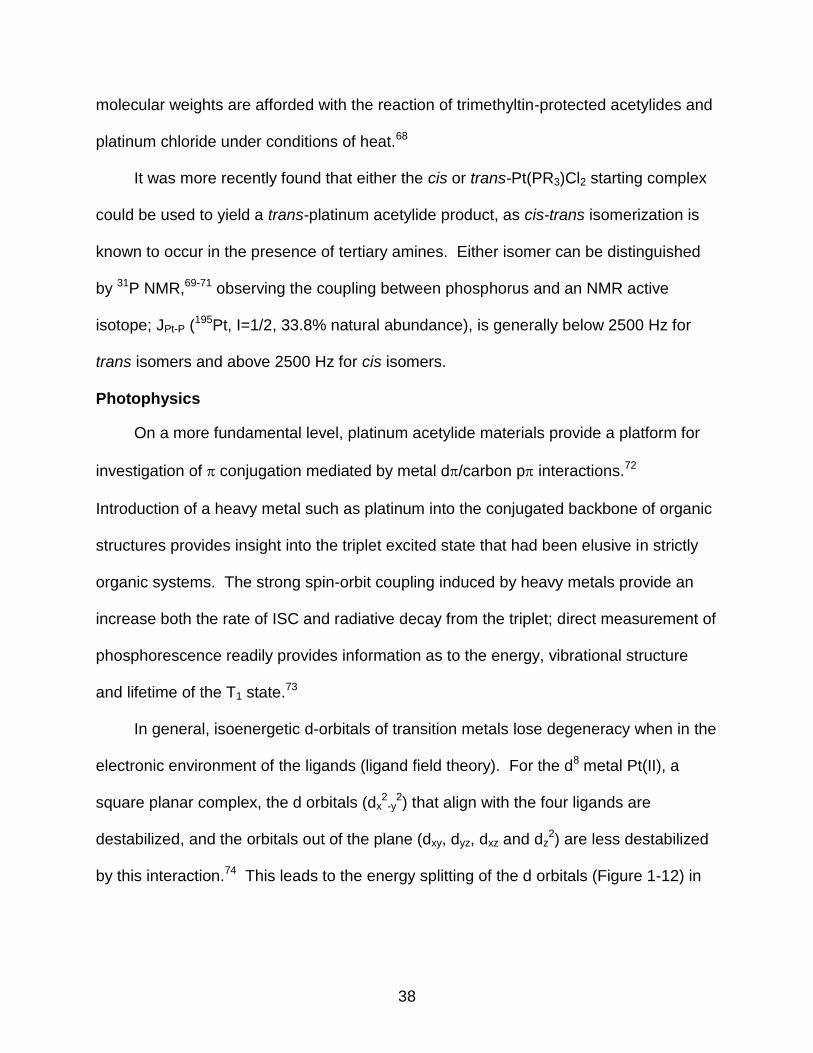
In general, isoenergetic d-orbitals of transition metals lose degeneracy when in the
electronic environment of the ligands (ligand field theory). For the d8 metal Pt(II), a
square planar complex, the d orbitals (dx2-y
2) that align with the four ligands are
destabilized, and the orbitals out of the plane (dxy, dyz, dxz and dz2) are less destabilized
by this interaction.74 This leads to the energy splitting of the d orbitals (Figure 1-12) in
39
which electronic transitions involving Pt(II) would involve the dxy (HOMO) and dx2-y
2
(LUMO) energy levels.
Figure 1-12. Ligand field splitting of the d orbitals of a square planar Pt(II) complex.
In platinum acetylide compounds, optical transitions involve both the platinum d
and ligand pz/ orbitals due to mixing.72,75 The extent of hybridization between the
metal and ligands varies depending on the spacer used. For acetylene or
phenylacetylene ligands, mixing with the d orbitals in Pt(II) is also exhibited in the
photophysics of the compounds. Chawdhury et al.76 have demonstrated the
preservation of conjugation through the platinum centers in a series of thienyl-platinum
acetylide dimers and polymers, noting the lowering of the S0S1 transition energy with
the introduction of platinum. In general, the emission bands of platinum acetylides
generally show significant vibronic progressions; this feature is common for MLCT or -
* transition states, but not common for d-d transitions which are usually sharp and
structureless. The phosphorescent lifetimes are also intermediate between common 3-
* and 3MLCT lifetimes, indicating again the hybridization of the orbitals. In general,
40
studies find that the fundamental optical transitions in these materials originates from
mainly -* transitions in ligand with some contributions from Pt(II) d-orbitals.77
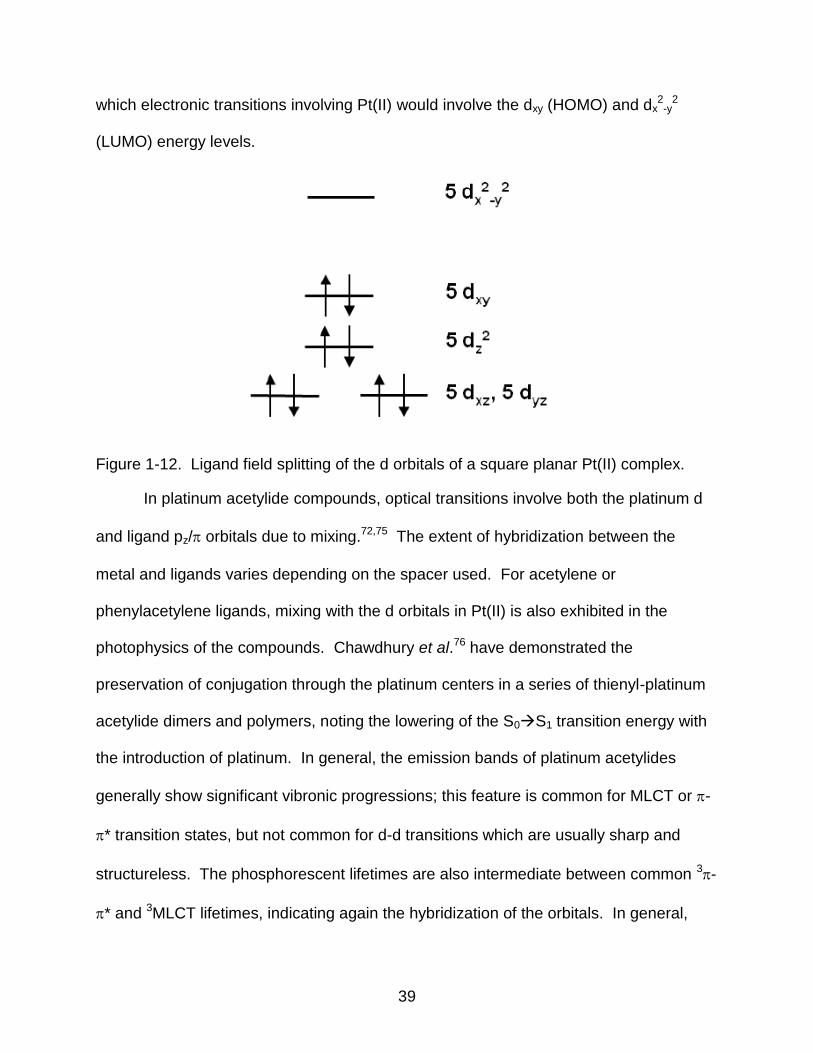
Much of the initial photochemical characterization of platinum acetylides was
carried out by Lewis, Friend and coworkers.10,68,71,76,78-86 Polymers and monomers
containing phenylene-ethynylene spacers generally absorb around 300-400 nm (Figure
1-13).73 Polymeric structures typically absorbed at lower energies than the respective
monomers, indication a higher extent of delocalization in the ground state geometry.
Figure 1-13. Absorption and emission spectra of Pt-phenylethynyl monomer and polymer films. The figure was adopted from Kohler.73
41
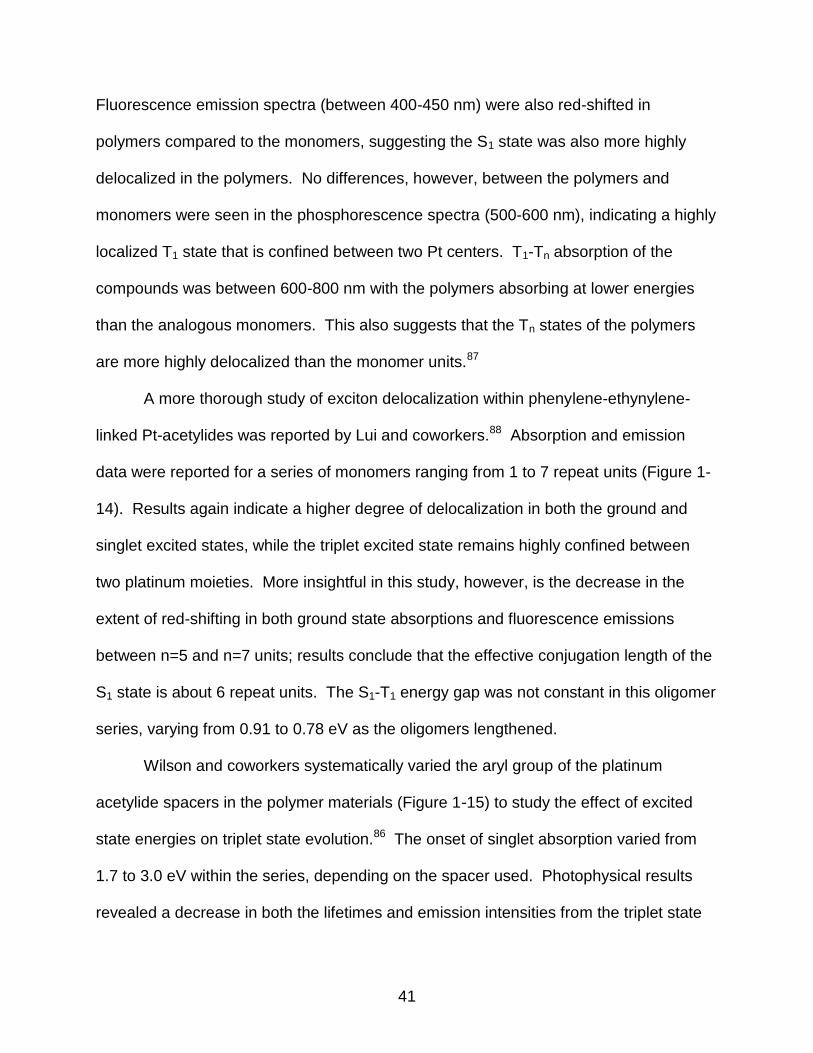
Fluorescence emission spectra (between 400-450 nm) were also red-shifted in
polymers compared to the monomers, suggesting the S1 state was also more highly
delocalized in the polymers. No differences, however, between the polymers and
monomers were seen in the phosphorescence spectra (500-600 nm), indicating a highly
localized T1 state that is confined between two Pt centers. T1-Tn absorption of the
compounds was between 600-800 nm with the polymers absorbing at lower energies
than the analogous monomers. This also suggests that the Tn states of the polymers
are more highly delocalized than the monomer units.87
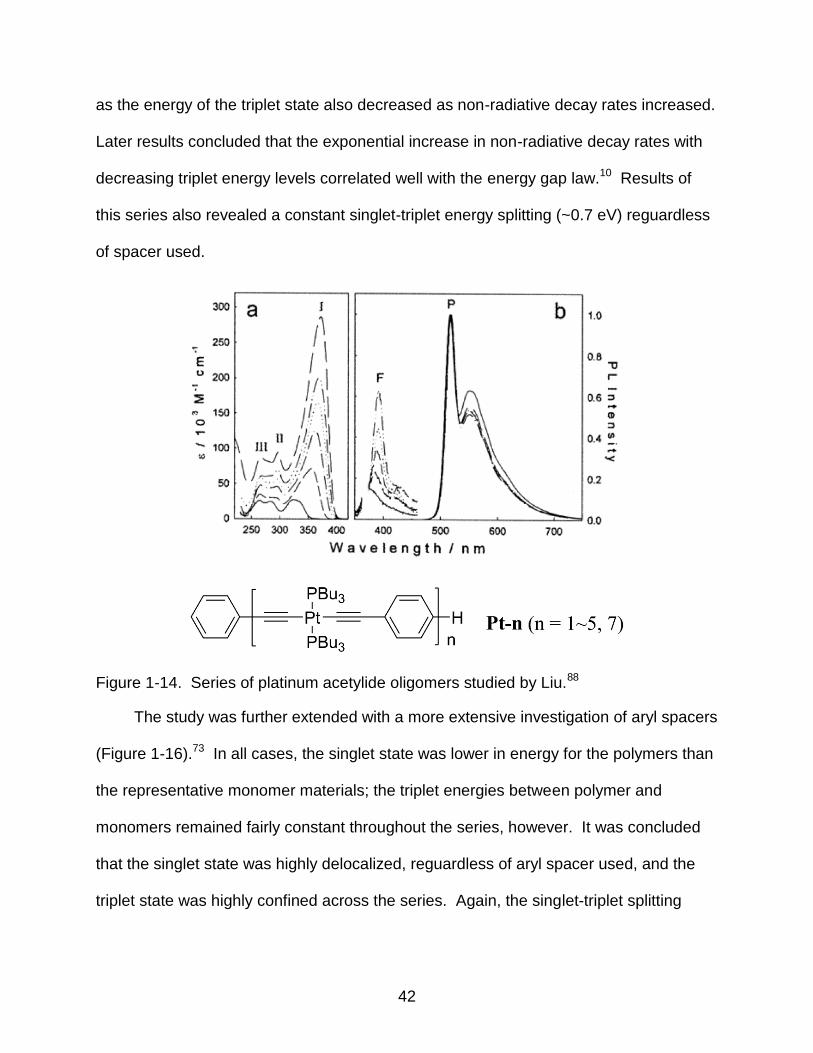
A more thorough study of exciton delocalization within phenylene-ethynylene-
linked Pt-acetylides was reported by Lui and coworkers.88 Absorption and emission
data were reported for a series of monomers ranging from 1 to 7 repeat units (Figure 1-
14). Results again indicate a higher degree of delocalization in both the ground and
singlet excited states, while the triplet excited state remains highly confined between
two platinum moieties. More insightful in this study, however, is the decrease in the
extent of red-shifting in both ground state absorptions and fluorescence emissions
between n=5 and n=7 units; results conclude that the effective conjugation length of the
S1 state is about 6 repeat units. The S1-T1 energy gap was not constant in this oligomer
series, varying from 0.91 to 0.78 eV as the oligomers lengthened.
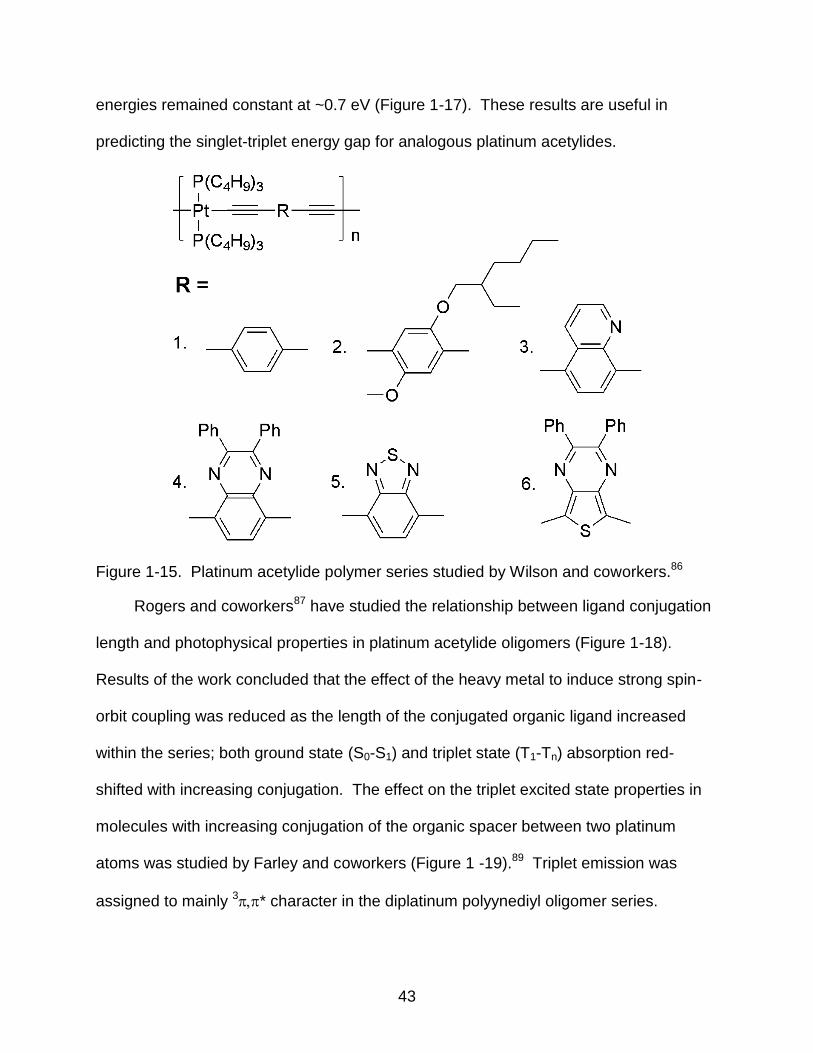
Wilson and coworkers systematically varied the aryl group of the platinum
acetylide spacers in the polymer materials (Figure 1-15) to study the effect of excited
state energies on triplet state evolution.86 The onset of singlet absorption varied from
1.7 to 3.0 eV within the series, depending on the spacer used. Photophysical results
revealed a decrease in both the lifetimes and emission intensities from the triplet state
42
as the energy of the triplet state also decreased as non-radiative decay rates increased.
Later results concluded that the exponential increase in non-radiative decay rates with
decreasing triplet energy levels correlated well with the energy gap law.10 Results of
this series also revealed a constant singlet-triplet energy splitting (~0.7 eV) reguardless
of spacer used.
Figure 1-14. Series of platinum acetylide oligomers studied by Liu.88
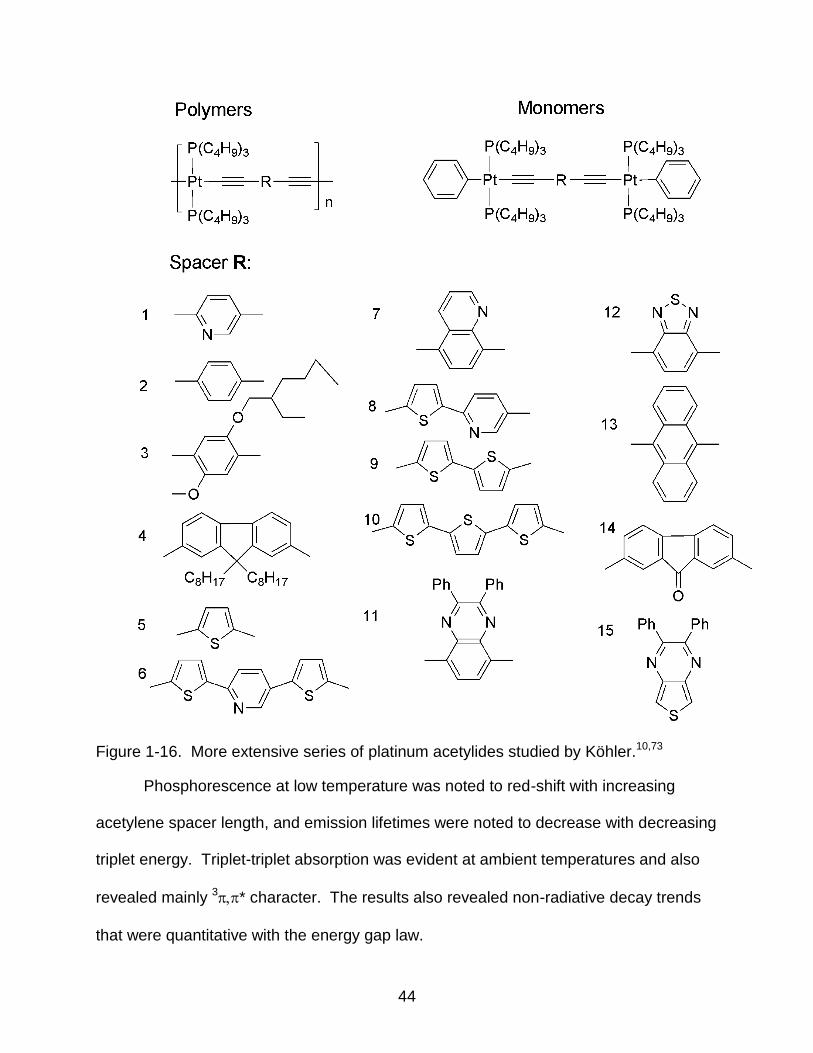
The study was further extended with a more extensive investigation of aryl spacers
(Figure 1-16).73 In all cases, the singlet state was lower in energy for the polymers than
the representative monomer materials; the triplet energies between polymer and
monomers remained fairly constant throughout the series, however. It was concluded
that the singlet state was highly delocalized, reguardless of aryl spacer used, and the
triplet state was highly confined across the series. Again, the singlet-triplet splitting
43
energies remained constant at ~0.7 eV (Figure 1-17). These results are useful in
predicting the singlet-triplet energy gap for analogous platinum acetylides.
Figure 1-15. Platinum acetylide polymer series studied by Wilson and coworkers.86
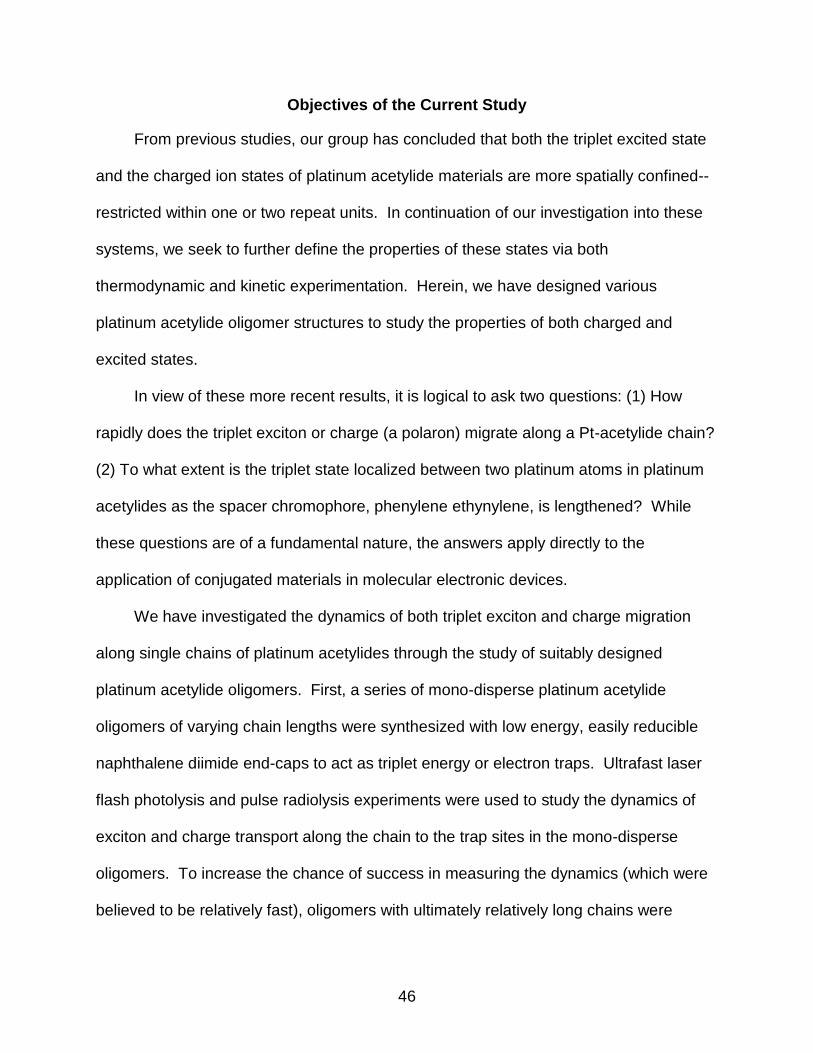
Rogers and coworkers87 have studied the relationship between ligand conjugation
length and photophysical properties in platinum acetylide oligomers (Figure 1-18).
Results of the work concluded that the effect of the heavy metal to induce strong spin-
orbit coupling was reduced as the length of the conjugated organic ligand increased
within the series; both ground state (S0-S1) and triplet state (T1-Tn) absorption red-
shifted with increasing conjugation. The effect on the triplet excited state properties in
molecules with increasing conjugation of the organic spacer between two platinum
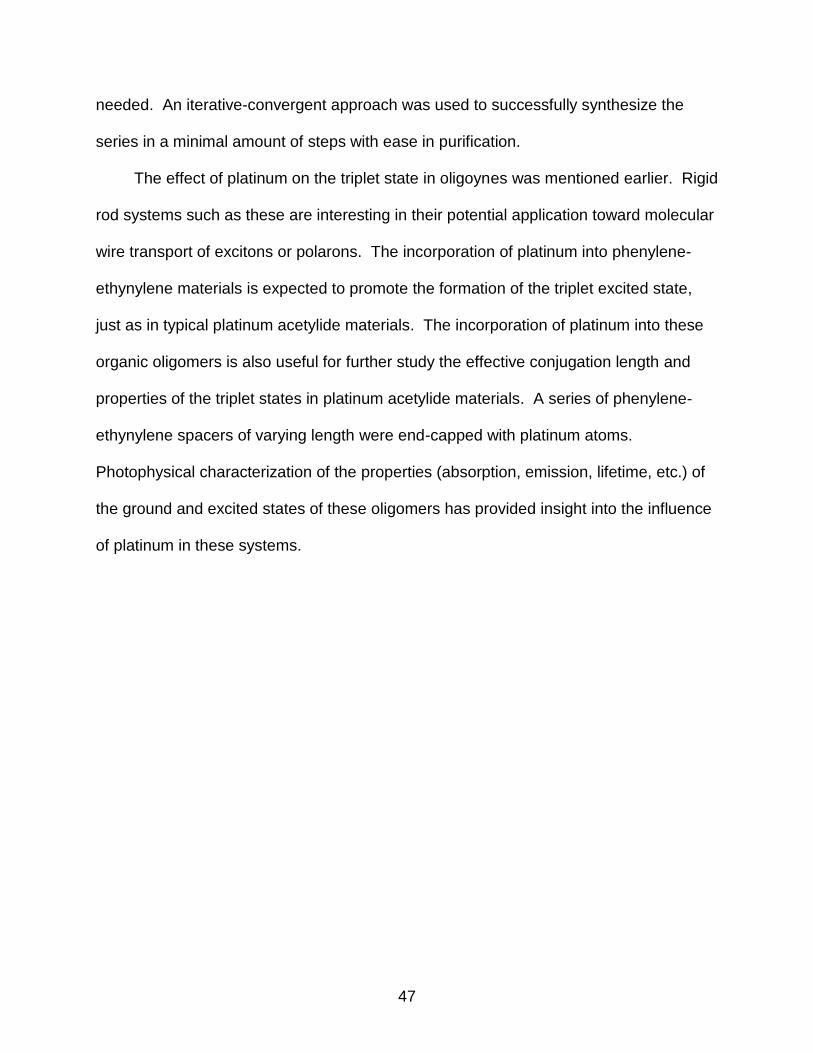
atoms was studied by Farley and coworkers (Figure 1 -19).89 Triplet emission was
assigned to mainly 3* character in the diplatinum polyynediyl oligomer series.
44
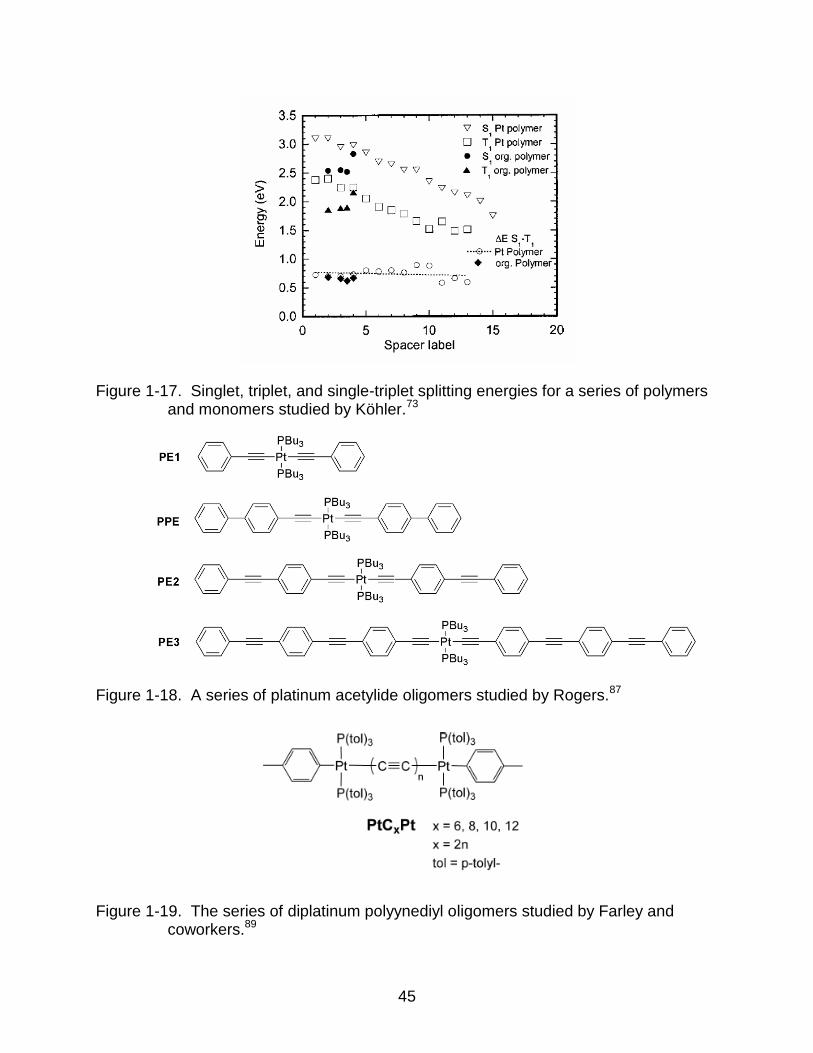
Figure 1-16. More extensive series of platinum acetylides studied by Köhler.10,73
Phosphorescence at low temperature was noted to red-shift with increasing
acetylene spacer length, and emission lifetimes were noted to decrease with decreasing
triplet energy. Triplet-triplet absorption was evident at ambient temperatures and also
revealed mainly 3* character. The results also revealed non-radiative decay trends
that were quantitative with the energy gap law.
45
Figure 1-17. Singlet, triplet, and single-triplet splitting energies for a series of polymers and monomers studied by Köhler.73
Figure 1-18. A series of platinum acetylide oligomers studied by Rogers.87
Figure 1-19. The series of diplatinum polyynediyl oligomers studied by Farley and coworkers.89
46
Objectives of the Current Study
From previous studies, our group has concluded that both the triplet excited state
and the charged ion states of platinum acetylide materials are more spatially confined--
restricted within one or two repeat units. In continuation of our investigation into these
systems, we seek to further define the properties of these states via both
thermodynamic and kinetic experimentation. Herein, we have designed various
platinum acetylide oligomer structures to study the properties of both charged and
excited states.
In view of these more recent results, it is logical to ask two questions: (1) How
rapidly does the triplet exciton or charge (a polaron) migrate along a Pt-acetylide chain?
(2) To what extent is the triplet state localized between two platinum atoms in platinum
acetylides as the spacer chromophore, phenylene ethynylene, is lengthened? While
these questions are of a fundamental nature, the answers apply directly to the
application of conjugated materials in molecular electronic devices.
We have investigated the dynamics of both triplet exciton and charge migration
along single chains of platinum acetylides through the study of suitably designed
platinum acetylide oligomers. First, a series of mono-disperse platinum acetylide
oligomers of varying chain lengths were synthesized with low energy, easily reducible
naphthalene diimide end-caps to act as triplet energy or electron traps. Ultrafast laser
flash photolysis and pulse radiolysis experiments were used to study the dynamics of
exciton and charge transport along the chain to the trap sites in the mono-disperse
oligomers. To increase the chance of success in measuring the dynamics (which were
believed to be relatively fast), oligomers with ultimately relatively long chains were
47
needed. An iterative-convergent approach was used to successfully synthesize the
series in a minimal amount of steps with ease in purification.
The effect of platinum on the triplet state in oligoynes was mentioned earlier. Rigid
rod systems such as these are interesting in their potential application toward molecular
wire transport of excitons or polarons. The incorporation of platinum into phenylene-
ethynylene materials is expected to promote the formation of the triplet excited state,
just as in typical platinum acetylide materials. The incorporation of platinum into these
organic oligomers is also useful for further study the effective conjugation length and
properties of the triplet states in platinum acetylide materials. A series of phenylene-
ethynylene spacers of varying length were end-capped with platinum atoms.
Photophysical characterization of the properties (absorption, emission, lifetime, etc.) of
the ground and excited states of these oligomers has provided insight into the influence
of platinum in these systems.
48
CHAPTER 2 SYNTHESIS OF MONODISPERSE PLATINUM-ACETYLIDE OLIGOMERS END-
CAPPED WITH NAPHTHALENE DIIMIDE UNITS
Introduction
There has been much research in the field of conjugated polymers toward the
advancement of new optical and electronic applications.30,90-93 For over two decades,
most of the research has focused on the use of purely organic materials, however
investigations of organometallic and metal-organic frameworks are becoming
increasingly popular.94-97 Interest in the incorporation of heavy metals into conjugated
materials includes both studies of fundamental photophysical properties of these
compounds as well as their application in areas of non-linear optics and
optoelectronics.63,98-102
One promising field that our group has focused on has been the study of platinum
(Pt)-acetylide materials of the type [-Pt(PR3)2-CC-Ar-CC-], where Ar is an organic
arene and the stereochemistry at the square planar Pt(II) center is trans-.88,103-105
Studies have provided considerable insight into the effect of the platinum center within a
-conjugated electronic system. These polymers have demonstrated useful application
in organic solar cells and as non-linear absorption materials.63,99-102,106 The addition of
the platinum center most significantly effects the π-framework via a strong spin-orbit
coupling, effectively mixing the singlet and triplet excited states which leads to efficient
production of long-lived triplet excitons.72,75,77
Our group as previously described the results of spectroscopic studies designed
toward characterizing the properties of triplet excitons in Pt-acetylide oligomers and
polymers.88,103,104 More recently, we have performed pulse radiolysis107 experiments to
49
characterize the spectroscopy and spatial extent of negative ion-radicals (polarons)
produced by reduction of the platinum acetylide oligomers.108 The conclusions of the
spectroscopic and pulse radiolysis studies reveal that triplet excitons and negative
polarons are spatially confined on the Pt-acetylide chain, delocalized to an extent
corresponded to approximately a single repeat unit, e.g., [-Pt-CC-Ph-CC-Pt-], where
Ph = 1,4-phenylene.104,108 As a continuation of these findings, we have developed a
series of Pt-acetylide oligomers that are end-capped with molecular units that can act as
―traps‖ for triplet excitons or negative polarons produced on the chains. Time-resolved
spectroscopic studies of such end-capped oligomers carried out using laser flash
photolysis and pulse radiolysis have provided considerable insight into the kinetics of
triplet exciton and negative polaron diffusion rates in Pt-acetylide materials.
This chapter reports the synthetic work accomplished towards the objective of
synthesizing a series of mono-disperse Pt-acetylide oligomers that are end-capped with
naphthalene diimide units, PtnNDI2, Figure 2-1. The goal of the synthetic work was to
prepare relatively long oligomer chains in order to more successfully measure the
dynamics of exciton and polaron hopping along the chains as well as intrinsically
increasing the relative concentration of the Pt-acetylide units vs. end-cap units.58,109-112
The synthetic approach used to construct these oligomers is based on an iterative-
convergent method; this approach involves application of organometallic synthons with
orthogonally protected terminal acetylenes. There has been considerable research
focused on the synthesis of mono-disperse, organic -conjugated oligomers,90,113-120
however relatively few studies have been reported describing the preparation of
oligomers that contain regular repeats of metal centers in the -conjugated
50
sequence.88,121 The synthetic work described herein is useful, as the protecting group
approach that is developed is general and could be used towards the synthesis of a
variety of Pt-acetylide based oligomers and dendrimers.
Results and Discussion
Molecular Synthesis and Design
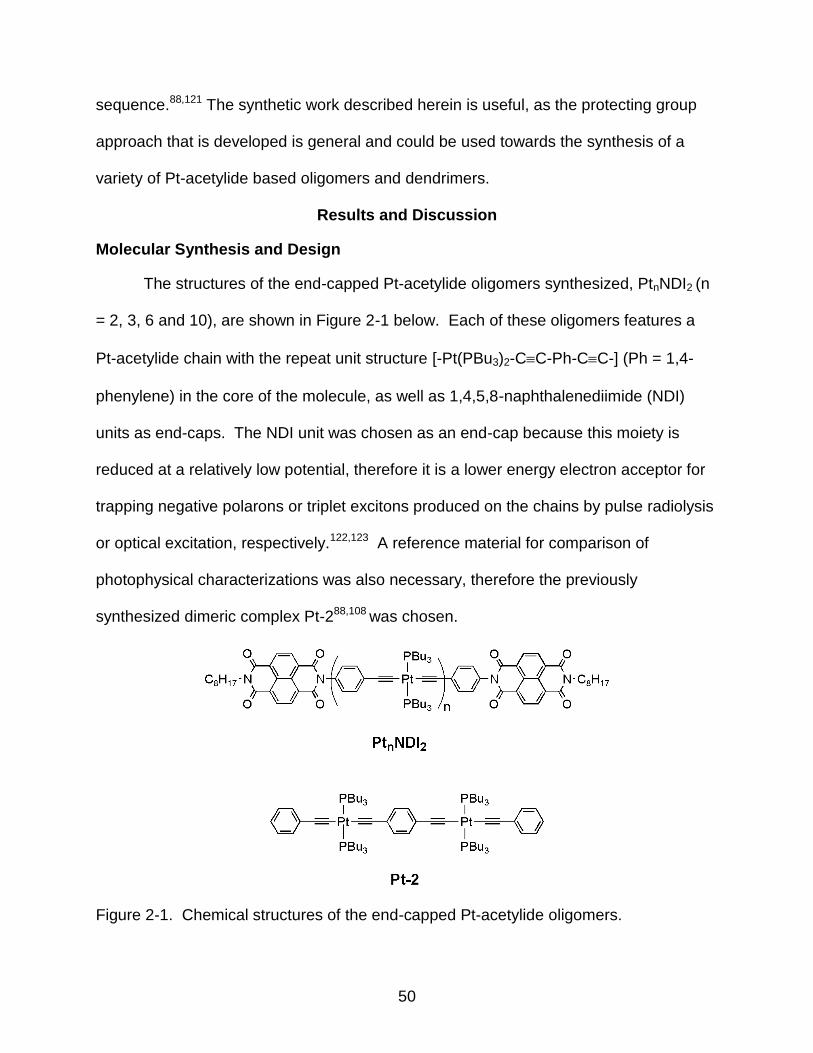
The structures of the end-capped Pt-acetylide oligomers synthesized, PtnNDI2 (n
= 2, 3, 6 and 10), are shown in Figure 2-1 below. Each of these oligomers features a
Pt-acetylide chain with the repeat unit structure [-Pt(PBu3)2-CC-Ph-CC-] (Ph = 1,4-
phenylene) in the core of the molecule, as well as 1,4,5,8-naphthalenediimide (NDI)
units as end-caps. The NDI unit was chosen as an end-cap because this moiety is
reduced at a relatively low potential, therefore it is a lower energy electron acceptor for
trapping negative polarons or triplet excitons produced on the chains by pulse radiolysis
or optical excitation, respectively.122,123 A reference material for comparison of
photophysical characterizations was also necessary, therefore the previously
synthesized dimeric complex Pt-288,108 was chosen.
Figure 2-1. Chemical structures of the end-capped Pt-acetylide oligomers.
51
The synthesis of the longer oligomers of the series (i.e., n = 6 and 10) presented a
general synthetic challenge. Three basic synthetic routes were considered when
outlining the synthesis, as each had advantages and drawbacks. The simplest
synthetic approach would perhaps have been use of the fractionation method.90 Here, a
short-lived AA/BB type polymerization reaction of Pt(PBu3)2Cl2 and 1,4-
diethynylbenzene could be carried out, followed by quenching the reaction early with the
appropriate end-cap. The drawback in this approach would be the separation and
isolation of the oligomers because the reaction would be uncontrolled, resulting in a
complex mixture of oligomers with different chain lengths. A stepwise, totally directed
approach90 was perhaps most obvious, but this would involve a completely linear
synthesis with group protection/deprotection needed at each step in the sequence.
While product isolation via this route would be much less difficult, the synthesis would
require many steps, compromising the overall yields of the target oligomers.121
Previously, our group as applied the iterative method toward preparation of
monodisperse platinum acetylide oligomers,88,103,104,108 however because of the need for
longer chain lengths in the for dynamics experiments we chose the iterative-convergent
approach for the task.90,124,125 This method involves the synthesis of an unsymmetric
platinum acetylide oligomer segment containing orthogonal protecting groups as a
primary synthon (structure 7, Figure 2-2). Synthetically building from the center of the
oligomer and out also ultimately reduced the number of overall steps involved in
assembly of the longer oligomers.
Synthesis
The route used to construct the primary synthon 7 is outlined in Figure 2-2 below.
Monomeric complex 3 was first prepared via selective deprotection of the
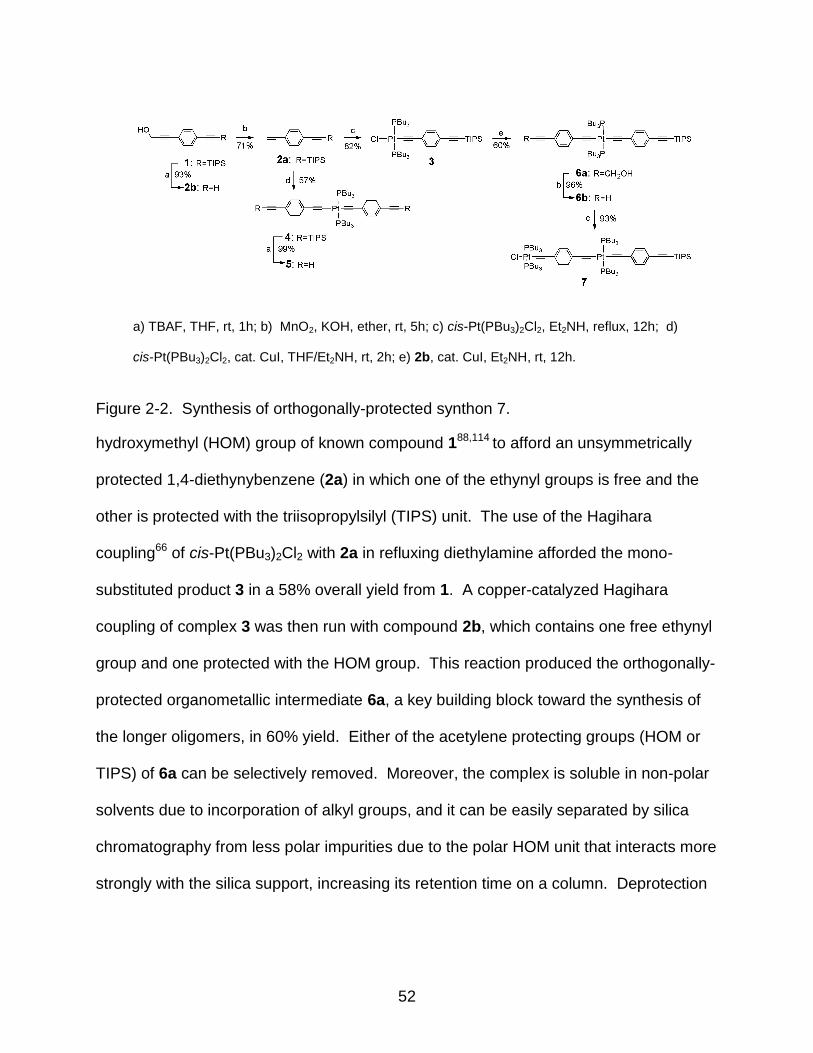
52
Figure 2-2. Synthesis of orthogonally-protected synthon 7.
hydroxymethyl (HOM) group of known compound 188,114 to afford an unsymmetrically
protected 1,4-diethynybenzene (2a) in which one of the ethynyl groups is free and the
other is protected with the triisopropylsilyl (TIPS) unit. The use of the Hagihara
coupling66 of cis-Pt(PBu3)2Cl2 with 2a in refluxing diethylamine afforded the mono-
substituted product 3 in a 58% overall yield from 1. A copper-catalyzed Hagihara
coupling of complex 3 was then run with compound 2b, which contains one free ethynyl
group and one protected with the HOM group. This reaction produced the orthogonally-
protected organometallic intermediate 6a, a key building block toward the synthesis of
the longer oligomers, in 60% yield. Either of the acetylene protecting groups (HOM or
TIPS) of 6a can be selectively removed. Moreover, the complex is soluble in non-polar
solvents due to incorporation of alkyl groups, and it can be easily separated by silica
chromatography from less polar impurities due to the polar HOM unit that interacts more
strongly with the silica support, increasing its retention time on a column. Deprotection
a) TBAF, THF, rt, 1h; b) MnO2, KOH, ether, rt, 5h; c) cis-Pt(PBu3)2Cl2, Et2NH, reflux, 12h; d)
cis-Pt(PBu3)2Cl2, cat. CuI, THF/Et2NH, rt, 2h; e) 2b, cat. CuI, Et2NH, rt, 12h.
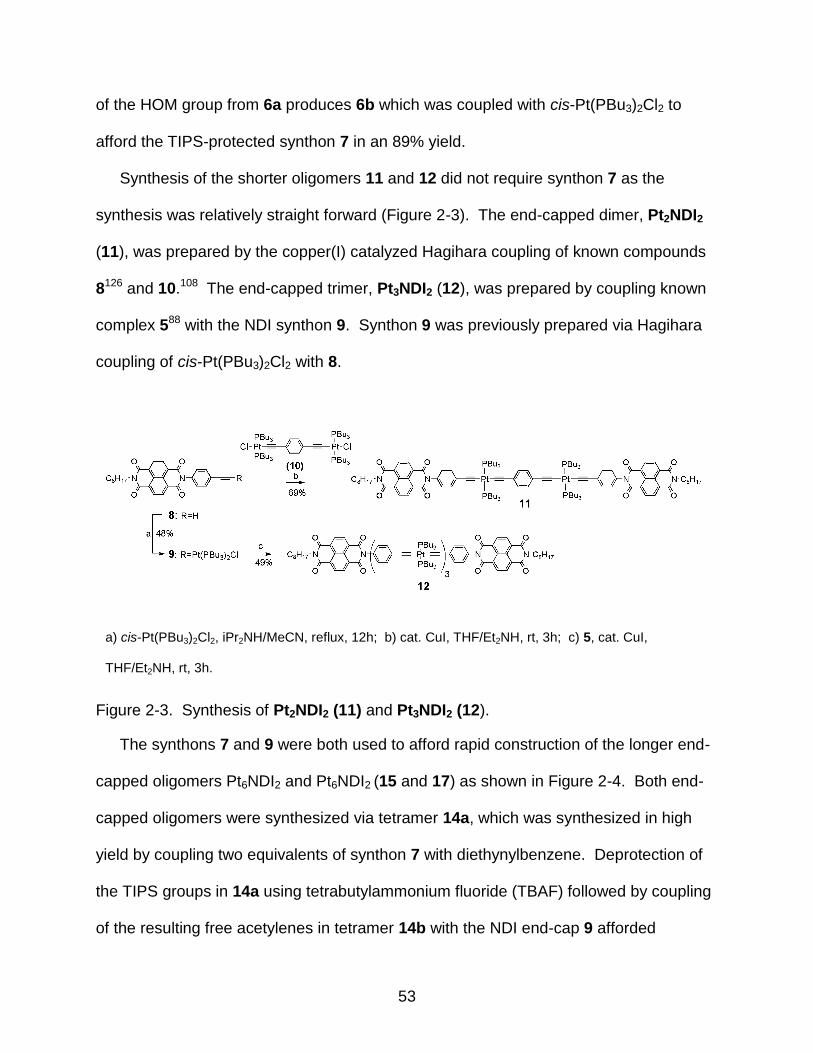
53
of the HOM group from 6a produces 6b which was coupled with cis-Pt(PBu3)2Cl2 to
afford the TIPS-protected synthon 7 in an 89% yield.
Synthesis of the shorter oligomers 11 and 12 did not require synthon 7 as the
synthesis was relatively straight forward (Figure 2-3). The end-capped dimer, Pt2NDI2
(11), was prepared by the copper(I) catalyzed Hagihara coupling of known compounds
8126 and 10.108 The end-capped trimer, Pt3NDI2 (12), was prepared by coupling known
complex 588 with the NDI synthon 9. Synthon 9 was previously prepared via Hagihara
coupling of cis-Pt(PBu3)2Cl2 with 8.
Figure 2-3. Synthesis of Pt2NDI2 (11) and Pt3NDI2 (12).
The synthons 7 and 9 were both used to afford rapid construction of the longer end-
capped oligomers Pt6NDI2 and Pt6NDI2 (15 and 17) as shown in Figure 2-4. Both end-
capped oligomers were synthesized via tetramer 14a, which was synthesized in high
yield by coupling two equivalents of synthon 7 with diethynylbenzene. Deprotection of
the TIPS groups in 14a using tetrabutylammonium fluoride (TBAF) followed by coupling
of the resulting free acetylenes in tetramer 14b with the NDI end-cap 9 afforded
a) cis-Pt(PBu3)2Cl2, iPr2NH/MeCN, reflux, 12h; b) cat. CuI, THF/Et2NH, rt, 3h; c) 5, cat. CuI,
THF/Et2NH, rt, 3h.
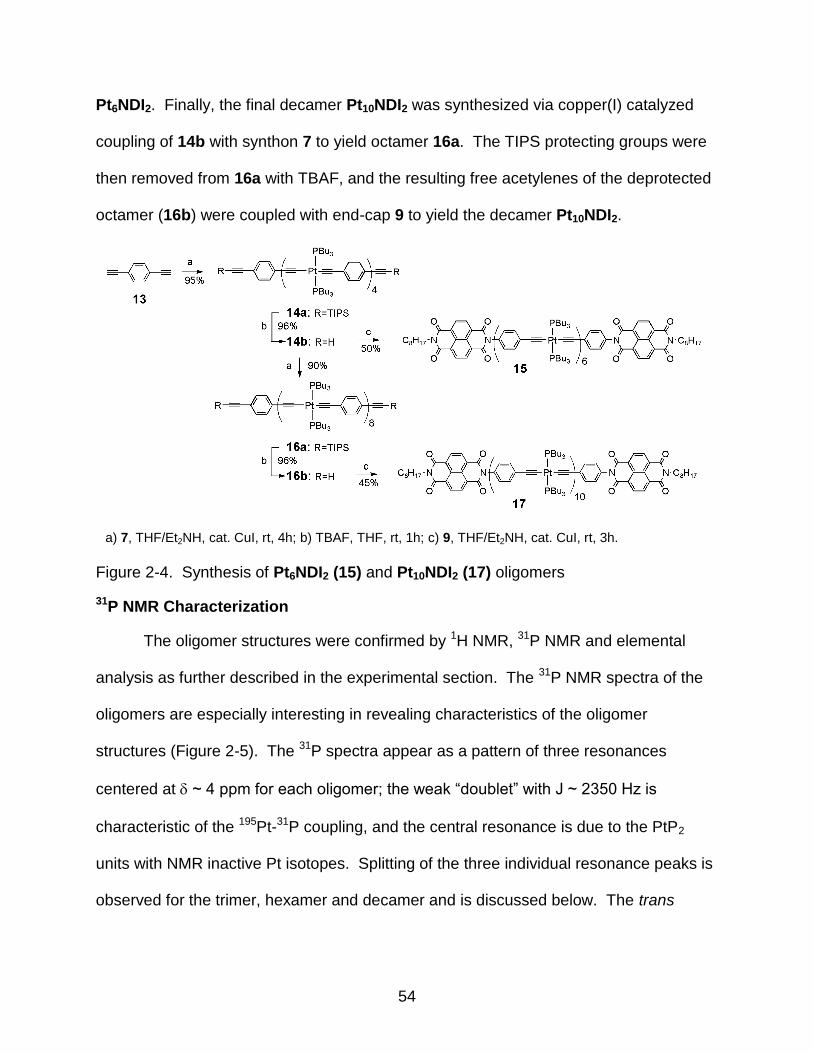
54
Pt6NDI2. Finally, the final decamer Pt10NDI2 was synthesized via copper(I) catalyzed
coupling of 14b with synthon 7 to yield octamer 16a. The TIPS protecting groups were
then removed from 16a with TBAF, and the resulting free acetylenes of the deprotected
octamer (16b) were coupled with end-cap 9 to yield the decamer Pt10NDI2.
Figure 2-4. Synthesis of Pt6NDI2 (15) and Pt10NDI2 (17) oligomers
31P NMR Characterization
The oligomer structures were confirmed by 1H NMR, 31P NMR and elemental
analysis as further described in the experimental section. The 31P NMR spectra of the
oligomers are especially interesting in revealing characteristics of the oligomer
structures (Figure 2-5). The 31P spectra appear as a pattern of three resonances
centered at ~ 4 ppm for each oligomer; the weak ―doublet‖ with J ~ 2350 Hz is
characteristic of the 195Pt-31P coupling, and the central resonance is due to the PtP2
units with NMR inactive Pt isotopes. Splitting of the three individual resonance peaks is
observed for the trimer, hexamer and decamer and is discussed below. The trans
a) 7, THF/Et2NH, cat. CuI, rt, 4h; b) TBAF, THF, rt, 1h; c) 9, THF/Et2NH, cat. CuI, rt, 3h.
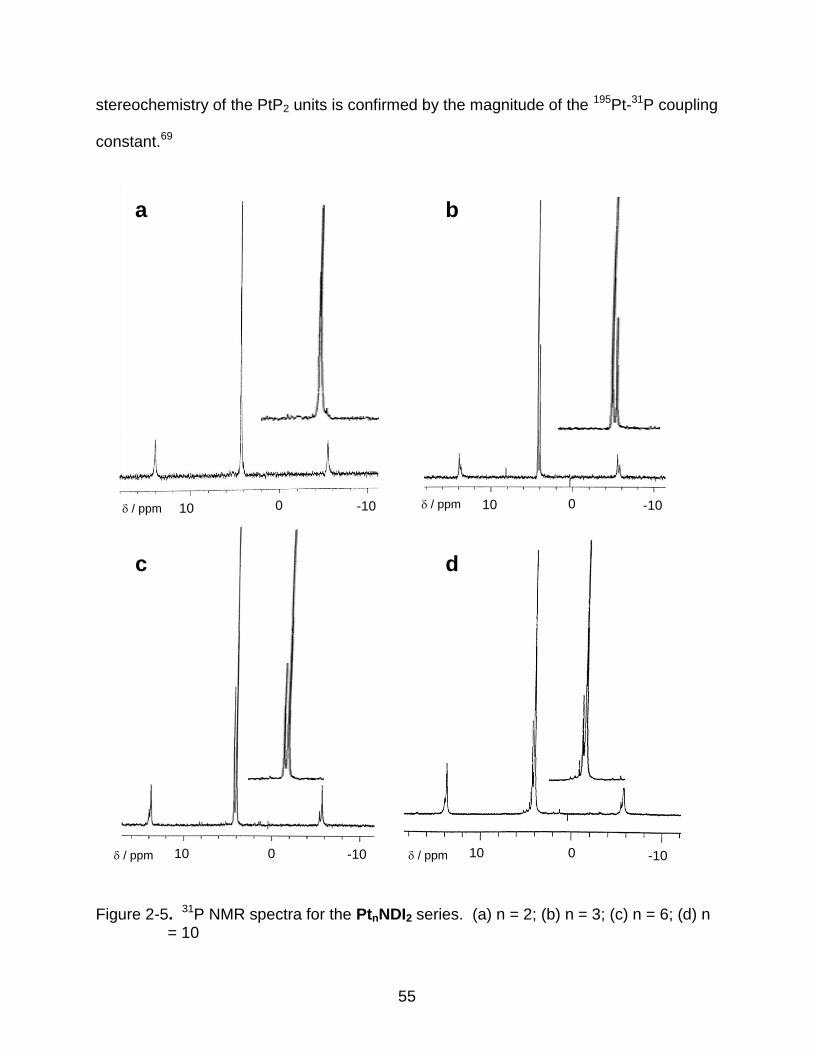
55
stereochemistry of the PtP2 units is confirmed by the magnitude of the 195Pt-31P coupling
constant.69
Figure 2-5. 31P NMR spectra for the PtnNDI2 series. (a) n = 2; (b) n = 3; (c) n = 6; (d) n = 10
10 -10 0 -10 0 10 / ppm / ppm
-10 0 10 / ppm -10 0 10 / ppm
a b
c d
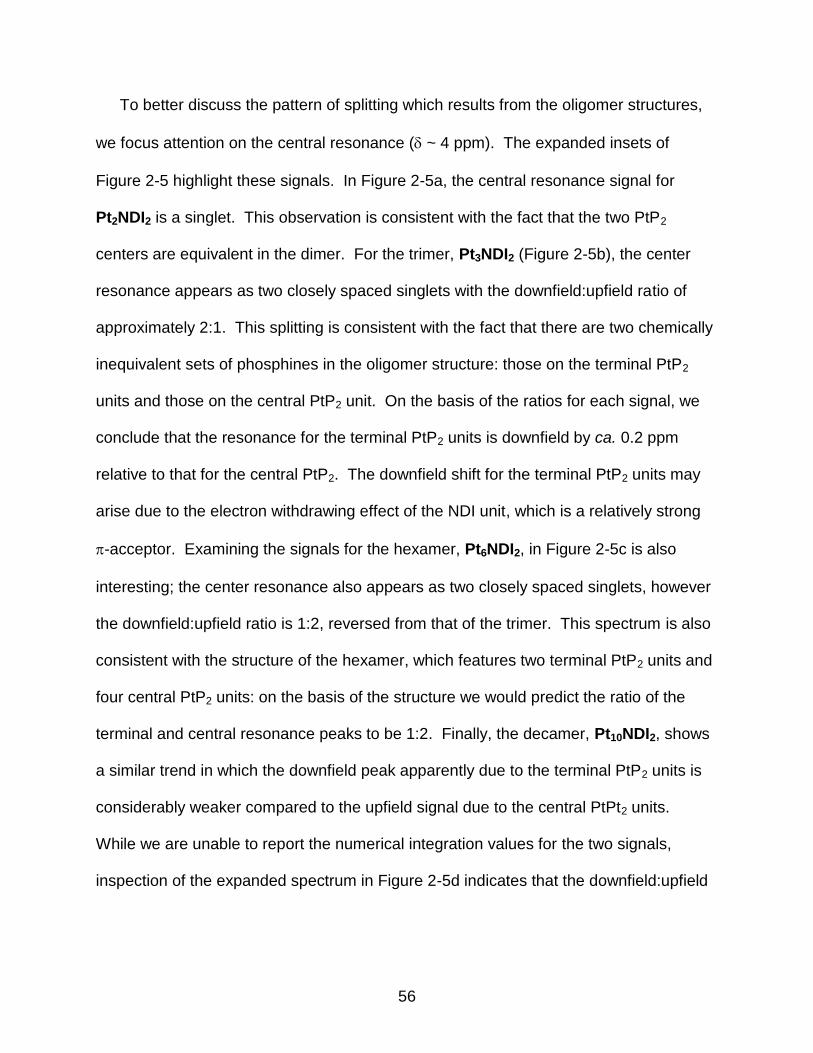
56
To better discuss the pattern of splitting which results from the oligomer structures,
we focus attention on the central resonance ( ~ 4 ppm). The expanded insets of
Figure 2-5 highlight these signals. In Figure 2-5a, the central resonance signal for
Pt2NDI2 is a singlet. This observation is consistent with the fact that the two PtP2
centers are equivalent in the dimer. For the trimer, Pt3NDI2 (Figure 2-5b), the center
resonance appears as two closely spaced singlets with the downfield:upfield ratio of
approximately 2:1. This splitting is consistent with the fact that there are two chemically
inequivalent sets of phosphines in the oligomer structure: those on the terminal PtP2
units and those on the central PtP2 unit. On the basis of the ratios for each signal, we
conclude that the resonance for the terminal PtP2 units is downfield by ca. 0.2 ppm
relative to that for the central PtP2. The downfield shift for the terminal PtP2 units may
arise due to the electron withdrawing effect of the NDI unit, which is a relatively strong
-acceptor. Examining the signals for the hexamer, Pt6NDI2, in Figure 2-5c is also
interesting; the center resonance also appears as two closely spaced singlets, however
the downfield:upfield ratio is 1:2, reversed from that of the trimer. This spectrum is also
consistent with the structure of the hexamer, which features two terminal PtP2 units and
four central PtP2 units: on the basis of the structure we would predict the ratio of the
terminal and central resonance peaks to be 1:2. Finally, the decamer, Pt10NDI2, shows
a similar trend in which the downfield peak apparently due to the terminal PtP2 units is
considerably weaker compared to the upfield signal due to the central PtPt2 units.
While we are unable to report the numerical integration values for the two signals,
inspection of the expanded spectrum in Figure 2-5d indicates that the downfield:upfield
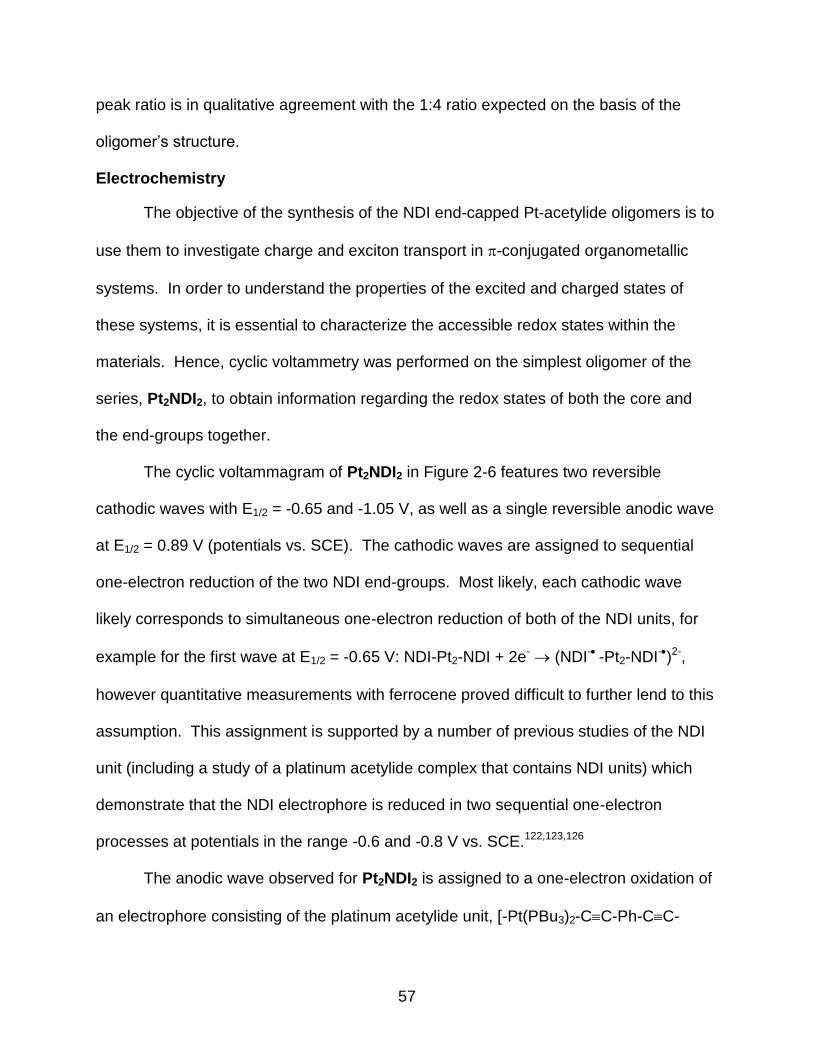
57
peak ratio is in qualitative agreement with the 1:4 ratio expected on the basis of the
oligomer‘s structure.
Electrochemistry
The objective of the synthesis of the NDI end-capped Pt-acetylide oligomers is to
use them to investigate charge and exciton transport in -conjugated organometallic
systems. In order to understand the properties of the excited and charged states of
these systems, it is essential to characterize the accessible redox states within the
materials. Hence, cyclic voltammetry was performed on the simplest oligomer of the
series, Pt2NDI2, to obtain information regarding the redox states of both the core and
the end-groups together.
The cyclic voltammagram of Pt2NDI2 in Figure 2-6 features two reversible
cathodic waves with E1/2 = -0.65 and -1.05 V, as well as a single reversible anodic wave
at E1/2 = 0.89 V (potentials vs. SCE). The cathodic waves are assigned to sequential
one-electron reduction of the two NDI end-groups. Most likely, each cathodic wave
likely corresponds to simultaneous one-electron reduction of both of the NDI units, for
example for the first wave at E1/2 = -0.65 V: NDI-Pt2-NDI + 2e- (NDI- -Pt2-NDI-)2-,
however quantitative measurements with ferrocene proved difficult to further lend to this
assumption. This assignment is supported by a number of previous studies of the NDI
unit (including a study of a platinum acetylide complex that contains NDI units) which
demonstrate that the NDI electrophore is reduced in two sequential one-electron
processes at potentials in the range -0.6 and -0.8 V vs. SCE.122,123,126
The anodic wave observed for Pt2NDI2 is assigned to a one-electron oxidation of
an electrophore consisting of the platinum acetylide unit, [-Pt(PBu3)2-CC-Ph-CC-
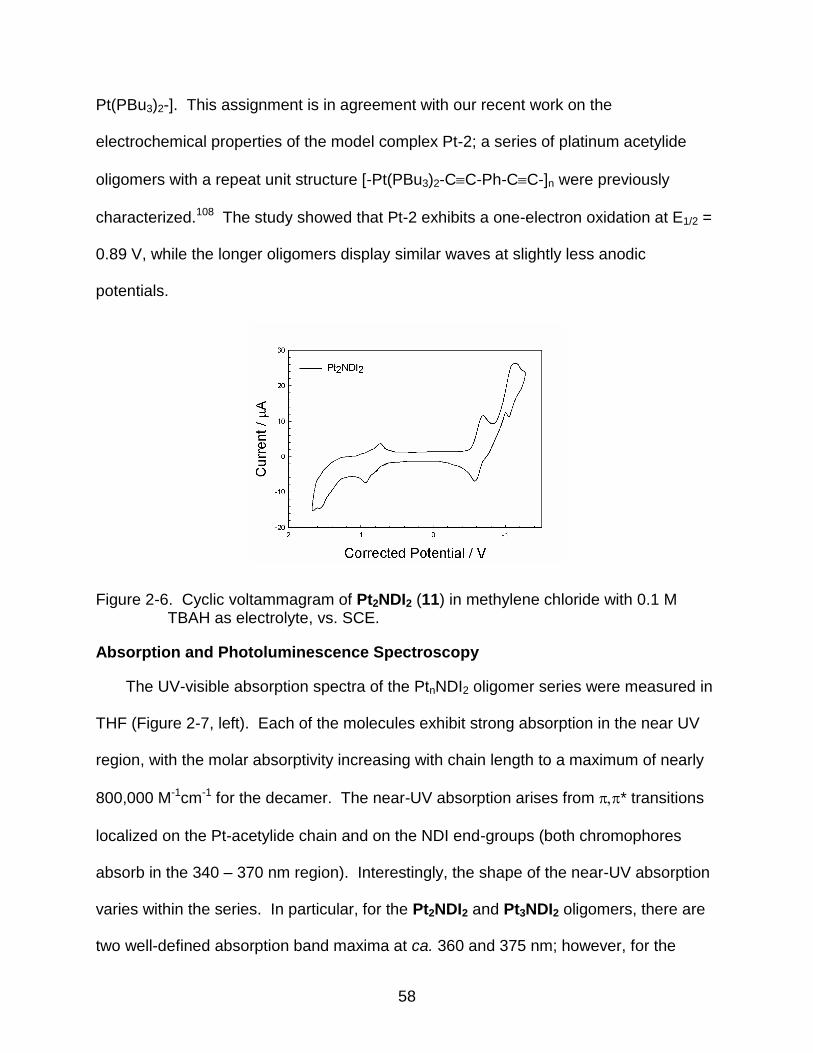
58
Pt(PBu3)2-]. This assignment is in agreement with our recent work on the
electrochemical properties of the model complex Pt-2; a series of platinum acetylide
oligomers with a repeat unit structure [-Pt(PBu3)2-CC-Ph-CC-]n were previously
characterized.108 The study showed that Pt-2 exhibits a one-electron oxidation at E1/2 =
0.89 V, while the longer oligomers display similar waves at slightly less anodic
potentials.
Figure 2-6. Cyclic voltammagram of Pt2NDI2 (11) in methylene chloride with 0.1 M TBAH as electrolyte, vs. SCE.
Absorption and Photoluminescence Spectroscopy
The UV-visible absorption spectra of the PtnNDI2 oligomer series were measured in
THF (Figure 2-7, left). Each of the molecules exhibit strong absorption in the near UV
region, with the molar absorptivity increasing with chain length to a maximum of nearly
800,000 M-1cm-1 for the decamer. The near-UV absorption arises from * transitions
localized on the Pt-acetylide chain and on the NDI end-groups (both chromophores
absorb in the 340 – 370 nm region). Interestingly, the shape of the near-UV absorption
varies within the series. In particular, for the Pt2NDI2 and Pt3NDI2 oligomers, there are
two well-defined absorption band maxima at ca. 360 and 375 nm; however, for the
59
hexamer and decamer the band sharpens and only a single band maximum is seen at
370 nm. This variation is believed to arise due to the relative contribution of the
platinum acetylide chain and NDI chromophores across the series. More specifically,
the absorption is dominated by * transitions localized on the NDI end-group
chromophore for the shorter oligomers. The absorption of the NDI chromophore
features a pronounced vibronic progression with maxima at 360 and 380 nm,122 which
Figure 2-7. UV-Vis (left) and steady state emission spectra (right) of PtnNDI2 series in degassed THF at 298K.
are clearly resolved in the Pt2NDI2 spectrum. The near-UV absorption is increasingly
dominated by the long-axis polarized * transition localized on the organometallic
conjugated core segment as the length of the Pt-acetylide chain increases. The near-
UV absorption in Pt10NDI2 measures ca. 85% absorption on the Pt-acetylide chain, with
ca. 15% or less of the oscillator strength on the NDI end-caps. The series of weaker
transitions at higher energy also become more prominent in the longer oligomers; these
transitions have been previously assigned as arising from short-axis polarized *
transitions on the platinum acetylide chain.88,127
60
Photoluminescence spectroscopy is also important in the characterization of these
materials as it provides insight into the excited state dynamics of the NDI end-capped
oligomers. A comparison in the emission of the PtnNDI2 series with the emission of the
model complex, Pt-2 is plotted in Figure 2-8 (right). The spectra were measured for
argon-degassed solutions and the intensities are normalized to demonstrate the relative
emission quantum yields of the NDI end-capped oligomers vs. the model comparison
compound Pt-2. The Pt-2 the emission is dominated by a structured band with max =
519 nm with a vibronic shoulder at lower energy. This emission is observed for all
platinum acetylide oligomers with the repeat unit structure [-Pt(PBu3)2-CC-Ph-CC-]
and has phosphorescence characterized as arising from the triplet excited state
(exciton). Previous studies have shown that the phosphorescence energy is invariant
with oligomer chain length, an observation that suggests that the spatially confined
nature of the triplet exciton to a relatively short chain segment.88,104
Notably, the phosphorescence emission is hardly observed for any of the PtnNDI2
oligomers, a result which clearly indicates the accessibility of a more competative non-
radiative pathway that very efficiently quenches the triplet exciton prior to
phosphorescence. Emission quantum yield studies were performed and conclude that
the quenching of the Pt-acetylide phosphorescence is nearly quantitative, with the
quantum yields for the NDI end-capped oligomers in the range ФP ~ 0.1-0.2 %
compared to the yield of Pt-2 which has ФP ~ 5%.88
The electrochemical studies of Pt2NDI2 provide insight concerning the mechanism
for the triplet exciton quenching. In particular, on the basis of the cyclic voltammetry
studies it is concluded that a charge separated state in which one NDI acceptor is
61
reduced and the Pt-acetylide chain is oxidized, e.g., NDI-[-(Pt(PBu3)2-CC-Ph-CC-)+]-
NDI-, lies at ca. 1.55 eV relative to the ground state. (The charge transfer state energy
is estimated by taking the difference in the oxidation and reduction potentials of
Pt2NDI2.)128 This state lies well below the energy of the triplet exciton state, which lies
at ca. 2.4 eV, as estimated from the band maximum of the phosphorescence. Thus, we
conclude that the triplet quenching arises from rapid intramolecular photoinduced
electron transfer,
NDI-[-3(Pt(PBu3)2-CC-Ph-CC-)*]-NDI NDI-[-(Pt(PBu3)2-CC-Ph-CC-+)]-NDI-,
which is much faster compared to radiative decay of the triplet exciton. In the following
chapter details of picosecond transient absorption spectroscopy experiments will be
provided that confirm that this process occurs, and that also provide very significant
insight concerning the dynamics of triplet exciton diffusion within the longer platinum
acetylide oligomers.
Summary and Conclusions
An iterative-convergent synthetic method to prepare a series of mono-disperse
platinum acetylide oligomers that contain as many as 10 repeat units has been
successfully developed. The oligomers are end-functionalized with naphthalene diimide
electron acceptors for use in studies of exciton and electron transport. The iterative-
convergent synthetic approach uses organometallic synthons that feature either (or
both) HOM or TIPS as protecting groups for the terminal acetylene moieties. These
protecting groups are orthogonal: they are removed under different conditions in high
synthetic yields affording monofunctional synthons that can be used in subsequent
iterative react-deprotect sequences to construct the longer oligomers. In addition to
62
serving as a protecting group, the polar nature of the HOM unit also has the benefit of
facilitating the chromatographic separations. In particular, oligomers that are end-
functionalized with the HOM group elute more slowly on silica gel columns compared to
the (less polar) reaction by-products and oligomers that contain only the TIPS protecting
groups.
Precedence for the use of the HOM and TIPS as orthogonal protecting groups in
synthesis of oligomers comes from the work of Godt et al;114 this group demonstrated
the strategy in the synthesis of phenylene ethynylene oligomers with nine repeat units.
Takahashi et al121 used a TIPS protected terminal acetylene organometallic
intermediate in a platinum acetylide dendrimer synthesis that was carried out through
four generations. However, prior to this work we are unaware of the prior use of
orthogonal acetylene protecting groups in the synthesis of organometallic oligomers.
Experimental
Materials and Instruments
All solvents and chemicals used for synthesis of the platinum acetylide oligomers
were reagent grade and used without purification unless noted. Silica gel (Silicycle Inc.,
230-400 mesh, 40-63 microns, 60 Å) was used for all flash chromatography. All silyl-
acetylene starting materials were purchased from GFS Chemical; potassium
tetrachloroplatinate and palladium-bis(triphenylphosphyl) dichloride were purchased
from Strem Chemicals; all other chemicals were purchased from Sigma-Aldrich. 1H and
31P NMR spectra were obtained on a Varian 300-MHz spectrometer using deuterated
chloroform (CDCl3) as the solvent and tetramethylsilane (TMS) as the internal
reference. Elemental analysis was performed from Robertson Microlit Laboratories for
all of the final oligomers. Decomposition temperatures were also estimated for all
63
oligomers synthesized using a standard Melt-temp apparatus. All newly-synthesized
intermediates were characterized by TOF-MS and elemental analysis.
Cyclic voltammetry experiments were performed in dry methylene chloride
(CH2Cl2) solution containing 0.1 M tetra-n-butylammonimum hexafluorophosphate
(TBAHFP) as the supporting electrolyte. The three-electrode setup consisted of a
platinum microdisk (2 mm2) working electrode, a platinum wire auxiliary electrode and a
silver wire reference electrode. Solutions were degassed with argon flow prior to
measurements, maintaining positive argon pressure during the measurements. The
concentrations of oligomers in the solutions were 1 mM. A scan rate of 100 mV/s was
used. All potentials were internally calibrated against the ferrocene/ferricinium couple (E
= 0.43 V vs. SCE in CH2Cl2) and potentials plotted vs. SCE.
Steady-state absorption spectra were recorded on a Varian Cary 100 dual-beam
spectrophotometer. Corrected steady-state emission measurements were conducted
on a SPEX F-112 fluorescence spectrometer. Samples were degassed by argon
purging for 30 min and concentrations were adjusted to produce ―optically dilute‖
solutions (i.e., Amax< 0.20) in THF. Quantum yields were calculated using Ru(byp)3Cl2
as a known reference.129
Synthesis
cis-bis(Tributylphosphine)dichloroplatinum(II) was prepared by literature methods.
Yield = 1.45 g (89.5%). M.p. 138-139oC.130
3-{4-[(Triisopropylsilyl)-ethynyl]-phenyl}-prop-2-yn-1-ol (1). This compound was
synthesized by literature methods. 88,103,104,108 Yield 3.1 g (32.7%). M.p. 61-63oC. 1H
NMR (300 MHz, CDCl3) δ 1.20 (s, 21H), 3.82 (br s, 1H), 4.58 (s, 2H), 7.40 (dd, 4H).
64
1-Ethynyl-4-(tri-iso-propylsilylethynyl)-benzene (2a) was prepared by literature
methodology.108 Yield = 1.31 g (71.2%). M.p. 47-48oC. 1H NMR (75 MHz, CDCl3) δ 1.18
(s, 21H), 3.15 (s, 1H), 7.45 (s, 4H). Mass spec. (DIP-CI-HRMS) calc‘d for C19H26Si
[M+H]+ 283.1877, found [M+H]+ 283.1867.
3-(4-Ethynyl-phenyl)-prop-2-yn-1-ol (2b). To a 25 mL round bottom flask with a
stir bar was added 1 (1.5 g, 4.80 mmol) and THF (5 mL). The solution was degassed 5
min under argon, followed by the addition of TBAF, 1 M in THF (11.9 mL, 11.9 mmol).
The reaction was let stir at room temperature for 1 h. After this time, the solution was
diluted with Et2O and washed with both D.I. water and brine. The organic layer was
then dried over NaSO4(s). The solvent was evaporated to give a crude brown solid that
was purified by flash chromatography (silica gel, 1:1 to 3:1 hexane/CH2Cl2, then addition
of 1% MeOH to afford fraction 2 as product). The solvent of the second fraction was
evaporated to afford a dark brown oil as the product. Yield 0.70 g (93%). 1H NMR (300
MHz, CDCl3) δ 1.25 (br, 1H), 3.15 (s, 1H), 4.45 (s, 2H), 7.38 (dd, 4H). M.p. 70-71oC.114
trans-Bis(tributylphosphine)chloro{(4-Ethynyl-phenylethynyl)-triisopropyl-
silane}platinum(II) (3). 2a (0.36 g, 1.28 mmol) and HNEt2 (30 mL) were added to a
round bottom flask with a stir bar. The mixture was stirred and degassed with argon for
10 min, follow by the addition of cis-Pt(PBu3)2 Cl2 (0.95 g, 1.41 mmol). The reaction
was stirred at reflux under argon overnight, then cooled and diluted with CH2Cl2. The
organic solution was washed with both d.i. water and brine then dried over NaSO4(s).
TLC in 5:1 hexane/CH2Cl2 gave 4 spots (spot 3 was product). Solvent was evaporated
to give a crude solid that was purified by flash chromatography (silica gel, 9:1 to 3:1
hexane/CH2Cl2). Fraction 3 solvent was evaporated to afford a yellow crystalline solid
65
that did not phosphoresce under a long wave UV lamp. Yield 0.97 g (82.6%). M.p. 65-
67oC. 1H NMR (300 MHz, CDCl3) δ 0.89 (t, 18H), 1.18 (s, 21H), 1.3-1.6 (br m, 24H),
1.98 (br m, 12H), 7.14 (d, 2H), 7.31 (d, 2H). 31P NMR (CDCl3) δ 8.0 (J = 2356 Hz).
Mass Spec. (+TOF-HRMS) Calc‘d for C43H79ClP2PtSiNa [M+Na]+ 939.4658; Found
[M+Na]+ 939.4685. Anal. Calcd. for C43H79ClP2PtSi : C, 56.34; H, 8.69; N, 0.0. Found
C, 56.62; H, 9.05; N, 0.01.
trans-Bis(tributylphosphine)bis{(4-Ethynyl-phenylethynyl)-triisopropyl-
silane}platinum(II) (4). To a 50 mL round bottom flask with a stir bar was added 2a
(0.30 g, 1.06 mmol), cis-Pt (PBu3)2Cl2 (0.33 g, 0.48 mmol) and HNEt2 (10 mL). The
solution was degassed with argon for 10 min, followed by the addition of CuI (~3 mg).
Within minutes, the reaction was a bright yellow color with salt formation. After 1 h, the
solvent was evaporated and the solid diluted with CH2Cl2. The organic solution was
washed with D.I. water and brine, then dried over NaSO4(s). Evaporation of solvent
afforded a crude yellow oil that was purified by flash chromatography (silica gel, 100%
hexane to 4:1 hexane/CH2Cl2). Fractions 1 and 2 were impurities; fraction 3 was eluted
as a large yellow band. Solvent was removed to yield a yellow crystalline solid as
product. Yield 0.32 g (57%). M.p. 65-68oC. 1H NMR (300 MHz, CDCl3) δ 0.88 (t, 17H),
1.08 (s, 39H), 1.19 (sextet, 12H), 1.55 (br m, 12H), 2.05 (br m, 12H), 7.13 (d, 4H), 7.29
(d, 4H); 31P NMR (CDCl3) δ 4.2 (JPt-P = 2346.94 Hz).88
trans-Bis(tributylphosphine)bis(4-ethynyl-phenylethynyl)platinum(II) (5). To a 25
mL round bottom flask with a stir bar was added 4 (300 mg, 0.26 mmol) and THF (5
mL). The solution was degassed 5 min with argon, followed by the addition of TBAF, 1
M in THF (0.77 mL, 0.77 mmol). The reaction was stirred at room temperature for 1 h.
66
TLC (silica, 10:1 hexane/acetone) revealed complete transformation of the starting
material. The solution was diluted with Et2O and washed with both D.I. water and brine.
The organic solution was dried over MgSO4(s), and the solvent was removed to give a
crude yellow solid that was purified by a short flash chromatography column (silica gel,
10:1 hexane/acetone). The eluted yellow fraction solvent was evaporated to afford a
yellow crystalline solid (starburst-like crystals). Yield 218 mg (99%). M.p. 85-88oC. 1H
NMR (300 MHz, CDCl3) δ 0.91 (t, 18H), 1.45 (m, 12H), 1.55 (m, 12H), 2.10 (br m, 12H),
3.09 (s, 2H), 7.19 (d, 4H), 7.32 (d, 4H).88
trans-Bis(tributylphosphine)-[2-{4-(prop-1-yn-3-ol)phenyl}ethyne]-[2-{4-(2-
triisopropylsilyl-1-phenylethynyl}ethyne (6a). To a round bottom flask with a stir bar was
added 3 (0.55 g, 0.60 mmol) and 2b (94 mg, 0.60 mmol). HNEt2 (15 mL) was added
and the solution was degassed for 10 min under argon. CuI (2 mg) was then added
under argon flow, and the reaction was let stir at room temperature overnight. The
solution was then diluted with CH2Cl2 and washed with D.I. water and brine. The bright
yellow organic solution was dried over MgSO4(s), then solvent was evaporated to give a
dark yellow oil. The crude product was purified by flash chromatography (silica gel,
CH2Cl2). Fraction 2, a bright yellow band on the column, was evaporated to afford a
yellow solid. Yield 0.37 g (60%). 1H NMR (300 MHz, CDCl3) δ 1.0 (t, 19 H), 1.2 (s,
21H), 1.4-1.8 (br m, 24H), 2.05 (br, 1H), 2.21 (br m, 12H), 4.60 (br s, 2H), 7.28 (dd, 4H),
7.41 (dd, 4H); 31P NMR (CDCl3) δ 4.1(JPt-P = 2346.33 Hz).
Complex (6b). To a 100 mL round bottom flask with a stir bar was added 6 (0.40
g, 0.39 mmol) and Et2O (20 mL). The solution was degassed with argon, followed by
the addition of powdered KOH (0.22 g, 8.86 mmol) and activated MnO2 (0.67 g, 7.72
67
mmol). The reaction was let stir at room temperature for 12 h, and then it was
quenched with D.I. water. The solution was diluted with Et2O and washed with 5%
HCl(aq), D.I. water, and brine. The organic layer was dried over NaSO4(s), and the
solvent was removed to give a crude orange oil that was purified by flash
chromatography (silica gel, 9:1 CH2Cl2/hexane). Fraction 1 eluted as a yellow band off
of the column, and this was evaporated to give the product as a yellow oil. Yield = 0.38
g (96%). 1H NMR (300 MHz, CDCl3) δ 0.91 (t, 18H), 1.13 (s, 20H), 1.35-1.70 (br m,
24H), 2.10 (br m, 12H), 3.1 (s, 1H), 7.19 (dd, 4H), 7.35 (dd, 4H); 31P NMR (CDCl3) δ
4.1(JPt-P = 2346.34 Hz).
Complex (7). To a 100 mL round bottom flask with a stir bar was added 6b (250
mg, 0.25 mmol) and HNEt2 (30 mL). The mixture was stirred and degassed at room
temperature under argon for 10 min, followed by the addition of cis-PtCl2(PBu3)2 (200
mg, 0.30 mmol). The reaction was heated to reflux and let stir under argon overnight.
After 15 h, the reaction was cooled and the solvent evaporated to give a crude yellow
oil. The sample was diluted with CH2Cl2 and washed with D.I. water and brine. The
organic layer was dried over NaSO4(s), and then the solvent was removed to afford a
yellow oil. The crude oil was purified by flash chromatography (silica gel, 4:1 then 2:1
hexane/CH2Cl2). Fraction 2 moved as a large yellow band through the column. Solvent
was evaporated then put under vacuum 2 h to give a yellow solid product, although
residual hexane was difficult to completely remove. Yield = 380 mg (93%). M.p. 73-
74oC. 1H NMR (300 MHz, CDCl3) δ 0.8-1.0 (m, 45H *some hexane incorporated), 1.12
(s, 21H), 1.26 (m, *hexane), 1.37-1.70 (br m, 50H), 1.92-2.22 (br m, 24H), 7.07 (dd, 4H),
7.18 (d, 2H), 7.30 (d, 2H); 31P NMR (CDCl3) δ 4.2 (JPt-P = 2346.34 Hz). Mass Spec.
68
(+TOF-HRMS) Calc‘d for C154H274Cl2P8Pt4 Si2Na2 [2M+2Na]+2 1663.3327; Found
[2M+2Na]+2 1663.8327. Anal. Calcd. for C77H137ClP4Pt2Si : C, 56.37; H, 8.42; N, 0.0.
Found C, 56.65; H, 8.75; N, 0.04.
N-(4’-Ethynylphenyl)-N’-(octyl)naphthalene-1,8:4,5-tetracarboxydiimide (8). This
compound was prepared via routes previously decribed in the literature. All intermediate
data given. N-(n-octyl)naphthalene-1,8-dicarboxyanhydride-4,5-dicarboximide122: Yield
= 2.87 g (20.4%). 1H NMR (300 MHz, CDCl3) δ 0.88 (t, 3H), 1.30 (br m, 12H), 4.20 (t,
2H), 8.80 (s, 4H). M.p. 173-175oC. Mass spec. (DIP-CI-HRMS) calc‘d for C22H21NO5,
[M+H]+ 380.1492; found, [M+H]+ 380.1510. N-(4’-iodophenyl)-N’-(octyl)naphthalene-
1,8:4,5-tetracarboxydiimide131: Yield 1.31 g (85.6%). 1H NMR (300 MHz, CDCl3) δ 0.90
(t, 3H), 1.30 (br m, 10H), 1.70 (m, 2H), 4.20 (t, 2H), 7.2 (d, 2H), 7.6 (d, 2H), 8.80 (s, 4H).
M.p. 252-253oC. Mass spec. (DIP-CI-HRMS) calc‘d for C28H25N2O4I [M+H]+ 581.0932,
found [M+H]+ 581.0884. Anal. Calcd. for C28H25N2O4I: C, 57.94; H, 4.34; N, 4.83.
Found C, 58.23; H, 4.27; N, 4.77.
N-(4’-(2-Triisopropylsilyl-ethynylphenyl)-N’-(octyl)naphthalene-1,8:4,5-
tetracarboxydiimide. To a 250 mL schlenk flask with stir bar was added N-(4‘-
iodophenyl)-N‘-(octyl)naphthalene-1,8:4,5-tetracarboxydiimide (1.88 g, 3.24 mmol) and
1:1:1 THF/iPr2NH/CH3CN (120 mL). The solution was stirred and degassed at room
temperature for 30 min, followed by addition of Pd(PPh3)4/CuI via schlenk technique.
The solution was further degassed and heated to 40oC, followed by addition of TIPS
acetylene (1.18 g, 6.48 mmol) via syringe. The light yellow solution turned a darker
yellow color immediately, and the reaction was let stir under argon for 12 h, in which
time the reaction turned a dark brown color. After 12 h the solution was cooled and
69
diluted with CHCl3, then washed with satd‘ NH4Cl(aq), 10% HCl(aq), and brine. The
organic layer was dried over NaSO4(s), then the solvent was evaporated to give a crude
brown solid. The product was purified by flash chromatography (silica, CHCl3). The
second fraction was isolated as the yellow solid product. Yield = 1.97g (95.6%). M.p.
253-255oC. 1H NMR (300 MHz, CDCl3) δ 0.88 (t, 3H), 1.15 (s, 21H), 1.30 (br m, 10H),
1.70 (m, 2H), 4.20 (t, 2H), 7.28 (d, 2H), 7.68 (d, 2H), 8.80 (s, 4H). Mass Spec. (+TOF-
HRMS) Calc‘d for C39H46N 2O4SiNa [M+Na]+ 657.3119; Found [M+Na]+ 657.3119. Anal.
Calcd. for C39H46N2O4Si: C, 73.78; H, 7.30; N, 4.41. Found C, 73.51; H, 7.51; N, 4.28.
N-(4’-Ethynylphenyl)-N’-(octyl)naphthalene-1,8:4,5-tetracarboxydiimide (8): To a
round bottom flask with a stir bar was added N-(4‘-(2-TIPS-ethynylphenyl)-N‘-
(octyl)naphthalene-1,8:4,5-tetracarboxydiimide (1.97 g, 3.10 mmol) and THF (45 mL).
The solution was stirred and degassed under argon for 15 min, followed by addition of
TBAF, 1M in THF (6.83 mL, 6.83 mmol) to the reaction. This was stirred at room
temperature for 4 h, followed by dilution with CH2Cl2. The organic layer was washed
with D.I. water and brine, then it was dried over NaSO4(s). The solvent was evaporated
to give a dark yellow solid. Flash chromatography (silica gel, 10:1 CHCl3/Hexane, 4:1
CHCl3/THF) was used to purify the solid. The product was recovered as a yellow solid
in the second eluted fraction. Yield = 1.07 g (72.3%). M.p. 257-259oC. 1H NMR (300
MHz, CDCl3) δ 0.88 (t, 3 H), 1.30 (br m, 10H), 1.75 (m, 2H), 3.10 (s, 1H), 4.20 (t, 2H),
7.28 (d, 2H), 7.68 (d, 2 H), 8.80 (s, 4H). Mass spec. (DIP-CI-HRMS) for C30H26N2O4
[M+H]+ 479.1965, found [M+H]+ 479.1972.131
Complex (9). To a 200 mL round bottom flask equipped with a stir bar was added
8 (0.82, 1.71 mmol), iPr2NH (30 mL) and MeCN (60 mL). The mixture was stirred and
70
degassed with argon for 10 min, followed by addition of cis-Pt(PBu3)2 Cl2 (1.49 g, 2.23
mmol). The reactions was refluxed overnight, then cooled to room temperature and
diluted with CH2Cl2. The organic solution was washed with D.I. water and brine, then it
was dried over NaSO4(s). The solvent was removed to give a dark red solid. The crude
product was purified by flash chromatography (silica gel, CH2Cl2). The first fraction
eluted was a yellow band of Pt (II) starting material; the second fraction was the pure
product 9 as a bright orange band. All other color remained at the top of the column.
The solvent was evaporated from fraction 2 to yield an orange powder. This product
was recrystalized in hexane to afford a very small, shiny needle-like powder. Yield
0.91g (48%). M.p. 145-146oC. 1H NMR (300 MHz, CDCl3) δ 0.8-1.0 (br m, 19H), 1.2-
1.8 (br m, 25H), 2.0 (br m, 11H), 4.20 (t, 2H), 7.15 (d, 2H), 7.40 (d, 2H), 8.80 (s, 4H); 31P
NMR (CDCl3) δ 8.1 (JPt-P = 2365.26). Mass Spec. (+TOF-MS) Calc‘d for
C54H79ClN2O4P2PtNa [M+Na]+ 1135.4751; Found [M+Na]+ 1135.4768. Anal. Calcd. for
C54H79ClN2O4P2Pt: C, 58.29; H, 7.16; N, 2.52. Found C, 58.43; H, 7.36; N, 2.42.
Complex (10). This compound was prepared by literature procedure.108 Yield =
0.58 g (90%). M.p. 103-104oC. 1H NMR (75 MHz, CDCl3) δ 0.91 (t, 36H), 1.45 (m,
24H), 1.55 (m, 24H), 2.0 (br m, 24H), 7.05 (s, 4H); 13C NMR (300 MHz, CDCl3) δ 14.0,
22.1, 24.5, 26.3, 101.6, 215.3, 130.5; 31P NMR (121 MHz, CDCl3) δ +7.89 (JPt-P =
2390.8 Hz). Mass Spec. (+TOF-HRMS) Calc‘d for C58H112Cl2P4Pt2Na [M+Na]+
1416.6276; Found [M+Na]+ 1416.6275.
Pt2NDI2 (11). To a 50 mL flask with stir bar was added the 8 (60 mg, 0.13 mmol),
10 (80 mg, 0.06 mmol), THF (3.5 mL) and diethylamine (2 mL). The solution was stirred
and degassed with argon for 30 min, followed by the addition of CuI (3 mg) under argon
71
flow. The reaction was stirred at room temperature for 1.5 h. The orange/brown
reaction mixture was diluted with CH2Cl2, then washed with D.I. water and brine, and
dried over NaSO4(s). Evaporation of the organic solvent gave a crude dark green solid.
The product was purified by flash chromatography (silica gel, 1:1 hexane/CH2Cl2, then
5:2:1 CH2Cl2/CHCl3/hexane) to elute the product as the second fraction. Solvent was
evaporated to give the product as a dark green solid. Yield = 90 mg (69.4%).
Decomposition temperature: 197-199oC. 1H NMR (300 MHz, CDCl3) δ 0.90 (m, 42H),
1.20-1.80 (br m, 74H), 2.15 (br m, 27H), 4.20 (t, 4H), 7.15 (d, 8H), 7.42 (d, 4H), 8.80 (s,
8H); 31P NMR (CDCl3) δ 4.27 (JPt-P = 2354.33 Hz). Mass Spec. (MALDI-TOF) Calc‘d for
C118H126N4O8P4Pt2 [M+.] 2278.07; Found [M+.] 2278.06. Anal. Calcd. for
C118H126N4O8P4Pt2: C, 62.20; H, 7.17; N, 2.46. Found C, 62.40; H, 7.22; N, 2.27.
Pt3NDI2 (12). To a 50 mL round bottom flask equipped with a stir bar was added 5
(76 mg, 89.9 µmol), 9 (220 mg, 0.20 mmol), HNEt2 (5 mL) and THF (3 mL). The
solution was degassed under argon for 10 min, followed by the addition of CuI (~1 mg)
to the solution. The reaction was stirred under argon for 2 h. In this time, the mixture
turned from a light orange color to a dark orange/brown color. TLC (silica, 1:1
hexane/CH2Cl2) revealed a complete consumption of the starting materials. The
solution was diluted with CH2Cl2 and washed with both D.I. water and brine. The
organic layer was dried over NaSO4(s), and the solvent was removed to give a dark
green solid that was purified by flash chromatography (silica gel, 1:1:0 to 1:1:(1%)
hexane/CH2Cl2/(acetone)). Fraction 2 moved as a dark orange band down the column;
solvent was removed to afford a green solid product. Yield 290 mg (49%).
Decomposition temp. 216-217oC. 1H NMR (300 MHz, CDCl3) δ 0.8-1.1 (br m, 59H),
72
1.1-1.8 (br m, 99H), 2.08 (br m, 34H), 4.20 (t, 4H), 7.1 (br m, 12H), 7.41 (d, 4H), 8.80 (s,
8H); 31P NMR (CDCl3) δ 4.2 (JPt-P = 2355.49 Hz), 4.0 (JPt-P = 2363.43 Hz). Anal. Calcd.
for C152H220N4O8P6Pt3: C, 60.81; H, 7.39; N, 1.87. Found C, 60.62; H, 7.40; N, 1.78.
1,4-Diethynylbenzene (13) was prepared by previous literature methods.88,103
Yield = 0.92 g (88.5%). M.p. 91-93oC (90-94oC). 1H NMR (300 MHz, CDCl3) δ 3.18 (s,
2H), 7.42 (s, 4H).
Complex (14a). To a 50 mL round bottom flask with stir bar was added 1,4-
diethynylbenzene 13 (15 mg, 0.12 mmol), 7 (425 mg, 0.26 mmol), THF (5 mL) and
HNEt2 (15 mL). The solution was degassed for 10 min under argon, followed by the
addition of CuI (3 mg). The reaction was stirred under argon for 3 h at room
temperature, followed by quenching it with D.I. water. The solution was diluted with
CH2Cl2, washed with D.I. water and brine, and dried over NaSO4(s). The solvent was
evaporated to afford a crude yellow solid that was purified by flash chromatography
(silica gel, 100:1 hexane/ acetone). Fraction 1 traveled as a yellow band down the
column, and solvent was evaporated to give a yellow solid as product. Yield = 0.38 g
(95%). M.p. 161-162oC. 1H NMR (300 MHz, CDCl3) δ 0.91 (t, 72H), 1.13 (s, 42H),
1.38-1.48 (br m, 99H), 2.15 (br m, 49H), 7.10 (s, 12H), 7.18 (d, 4H), 7.32 (d, 4H); 31P
NMR (CDCl3) δ 4.0 (JPt-P = 2365.87 Hz), 4.2 (JPt-P = 2355.49 Hz). Mass Spec. (MALDI-
TOF-HRMS with HABA as matrix) Calc‘d for C1654H278P8Pt4 Si2 [M]+ 3333.7813; Found
[M]+ 3333.7568.
Complex (14b). To a 25 mL round bottom flask with a stir bar was added 14a (230
mg, 0.07 mmol) and THF (5 mL). The mixture was degassed for 10 min, followed by
the addition of TBAF, 1 M in THF (0.69 mL, 0.69 mmol) via syringe. The reaction was
73
let stir at room temperature with the flask covered in aluminum foil for 1 h, and then it
was quenched with D.I. water and diluted with CH2Cl2. The organic layer was washed
with D.I. H2O and brine, and it was dried over NaSO4(s). Once the organic solvent was
evaporated, the crude yellow solid was purified by flash chromatography (silica gel, 20:1
hexane/acetone). Fraction 1 was collected as a yellow solution. The solvent was
evaporated to afford a light yellow solid as product. Yield = 210 mg (96%). 1H NMR
(CDCl3) δ 0.91 (t, 71H), 1.05 (s, 5H *TIPS-F salt contaminate in NMR sample), 1.38-
1.48 (br m, 99H), 2.15 (br, 48H), 3.09 (s, 2H), 7.10 (s, 12H), 7.18 (d, 4H), 7.32 (d, 4H) ;
31P NMR (CDCl3) δ 3.95 (JPt-P = 2352.43 Hz), 4.2 (JPt-P = 2356 Hz).
Pt6NDI2 (15). To a 50 mL round bottom flask with a stir bar was added 9 (163 mg,
146 μmol), 14b (200 mg, 66 μmol), THF (5 mL) and HNEt2 (5 mL). The solution was
degassed with argon for 5 min, followed by the addition of CuI (2 mg). Within 2 min the
reaction turned a dark orange color and became somewhat opaque with salt formation.
After 3 h, the reaction was quenched with D.I. H2O, diluted with CH2Cl2 and washed
twice with brine. The organic layer was dried over NaSO4(s) and then the solvent
removed to give a crude green/brown solid. The product was purified by flash
chromatography (silica gel, 2:1 CHCl3/hexane), eluting the product as a red band down
the column. Solvent was removed from this fraction to afford a dark green solid
product, although some residual hexane proved difficult to remove. Yield 170 mg
(50.1%). Decomposition Temp. > 400oC. 1H NMR (300 MHz, CDCl3) δ 0.90 (m, 108H)
1.2-1.7 (br m, 171H), 2.15 (br m, 74H), 4.20 (t, 4H), 7.0-7.2 (br d, 25H), 7.42 (d, 4H), 8.8
(s, 7H); 31P NMR (CDCl3) δ 4.04 (JPt-P = 2365.3 Hz), 4.28 (JPt-P = 2356.1 Hz); Anal.
74
Calcd. for C254H394N4O8P12Pt6: C, 58.96; H, 7.68; N, 1.08. Found C, 58.78; H, 8.00; N,
0.98.
Complex (16a). To a 50 mL round bottom flask with a stir bar was added 14b (218
mg, 0.07 mmol), 7 (249 mg, 0.15 mmol), iPr2NH (8 mL) and THF (3 mL). The solution
was degassed with argon for 10 min, followed by addition of CuI (~1 mg). The reaction
was stirred under argon at room temperature overnight. After 15 h, the solvent was
evaporated and the crude solid diluted in CH2Cl2. The organic solution was washed
with D.I. water and brine, and then dried with NaSO4(s). The solvent was evaporated to
give a crude yellow solid that was purified by flash chromatography (silica gel, 1:1 to 2:1
CH2Cl/hexane) as fraction 2 (fraction 1 was a very small band on the column; fraction 2
was a very large yellow band). Solvent was evaporated from this fraction to afford a
light yellow solid as product. Yield 395 mg (90%). 1H NMR (300 MHz, CDCl3) δ 0.90 (t,
145H), 1.12 (s, 40H), 1.3-1.7 (br m, 201H), 2.15 (br m, 97H), 7.05-7.20 (m, 30H), 7.32
(d, 4H); 31P NMR (CDCl3) δ 4.0 (JPt-P = 2349.38 Hz), 4.2 (JPt-P = 2369.53 Hz).
Complex (16b). To a 25 mL round bottom flask with a stir bar was added 16a (120
mg, 19 μmol) and THF (5 mL). The solution was degassed with argon for 5 min,
followed by the addition of TBAF, 1 M in THF (56.4 μL, 56.5 μmol) via syringe. The
reaction was stirred at room temperature under argon with the flask covered in
aluminum foil (to prevent light exposure) for 1 h. After this time, the reaction was diluted
with CH2Cl2 and washed with D.I. water and brine. The organic layer was dried over
NaSO4(s) and solvent then evaporated to afford a crude yellow solid. The product was
purified by flash chromatography (silica gel, 3:1 CH2Cl2/hexane). Fraction 1, a yellow
band on the column, was collected and the solvent evaporated to give a yellow solid
75
product, however some residual hexane proved difficult to remove. Yield 100 mg
(96%). 1H NMR (300 MHz, CDCl3) δ 0.90 (br t, 180H *with hydrocarbon solvents), 1.26
(s, 42H *TIPS-F salt contaminate), 1.3-1.7 (br m, 203H *with hc solvents), 2.15 (br m,
96H), 3.10 (s, 2H), 7.05-7.20 (m, 31H), 7.32 (d, 4H); 31P NMR (300 MHz, CDCl3) δ 4.0
(JPt-P = 2366.87 Hz), 4.2 (JPt-P = 2348.24 Hz).
Pt10NDI2 (17). To a 25 mL round bottom flask with a stir bar was added 16b (400
mg, 65.9 µmol), 9 (161 mg, 145.2 µmol), HNEt2 (8 mL) and THF (8 mL). The solution
was degassed under argon for 10 min, followed by the addition of CuI (~1 mg). The
reaction was stirred at room temperature under argon for 4 h. After this time, the
solution was diluted with CH2Cl2 and washed with both D.I. water and brine. The
organic layer was dried over NaSO4(s), and then the solvent was evaporated to give a
dark green crude solid. The product mixture was purified by flash chromatography
(silica gel, 2:1:(1%) to 3:1:(1%) to 5:1:(1%) CH2Cl2/hexane/(MeOH) ). Fractions 1 and
2 (both yellow color) were degraded starting materials, and fraction 3 (dark orange
band) was eluted, samples collected and solvent evaporated to afford a dark green solid
as product. Yield 240 mg (45.0%). Decomposition temp. > 400oC. 1H NMR (300 MHz,
CDCl3) δ 0.95 (m, 188H), 1.1-1.9 (br m, 263H), 2.15 (br s, 120H), 4.20 (br t, 4H), 7.13
(br s, 38H), 7.45 (br d, 4H), 8.80 (s, 8H) ; 31P NMR (CDCl3) δ 4.0 (JPt-P = 2365.26 Hz),
4.2 (JPt-P = 2365 Hz ); Anal. Calcd. C390H626N4O8P20Pt10: C, 58.05; H, 7.82; N, 0.69.
Found C, 57.98; H 7.68; N, 0.72.
76
CHAPTER 3 NEGATIVE POLARON AND TRIPLET EXCITON DIFFUSION DYNAMICS IN
PLATINUM-ACETYLIDE OLIGOMERS
Introduction
Electron and energy transfer are two of the most significant and fundamental
processes in chemistry and in biology, and especially so for optical and electronic
applications. However, while many issues remain to be clarified for these materials,
even more challenges occur in trying to manipulate, by synthesis, positioning and
excitation, the rate processes within these materials. Conjugated organic materials
have been the focus of a vast amount of research directed toward addressing
fundamental scientific questions, as well as developing new advanced materials, for
these applications.30 While a great deal of effort has been directed toward organic
materials, the more recent incorporation of various transition metals (i.e. IrIII, PdII, PtII,
RuII, OsIII, HgI, etc.) within the framework of selected conjugated organic chromophores
has created a wide range of new materials that exhibit interesting photophysical
properties.94,132-141 One such example has been in the area of organic light emitting
diode (OLED) research, where the use of metal-organic materials has increased the
device efficiencies substantially to afford more efficient electrophosphorescence.64,142-147
Among these metal-organic materials, platinum-acetylides have generated attention in
both optical and optoelectronic applications due to both their interesting excited state
properties which are dominated by highly populated, long-lived triplet states, as well as
their known charge carrier properties.88,103,104,108
In our group‘s ongoing efforts to explore the fundamental properties of these
materials, we have previously defined the triplet exciton as a spatially confined state
localized on a chromophore consisting of one to two Pt-acetylide repeat units.104,108
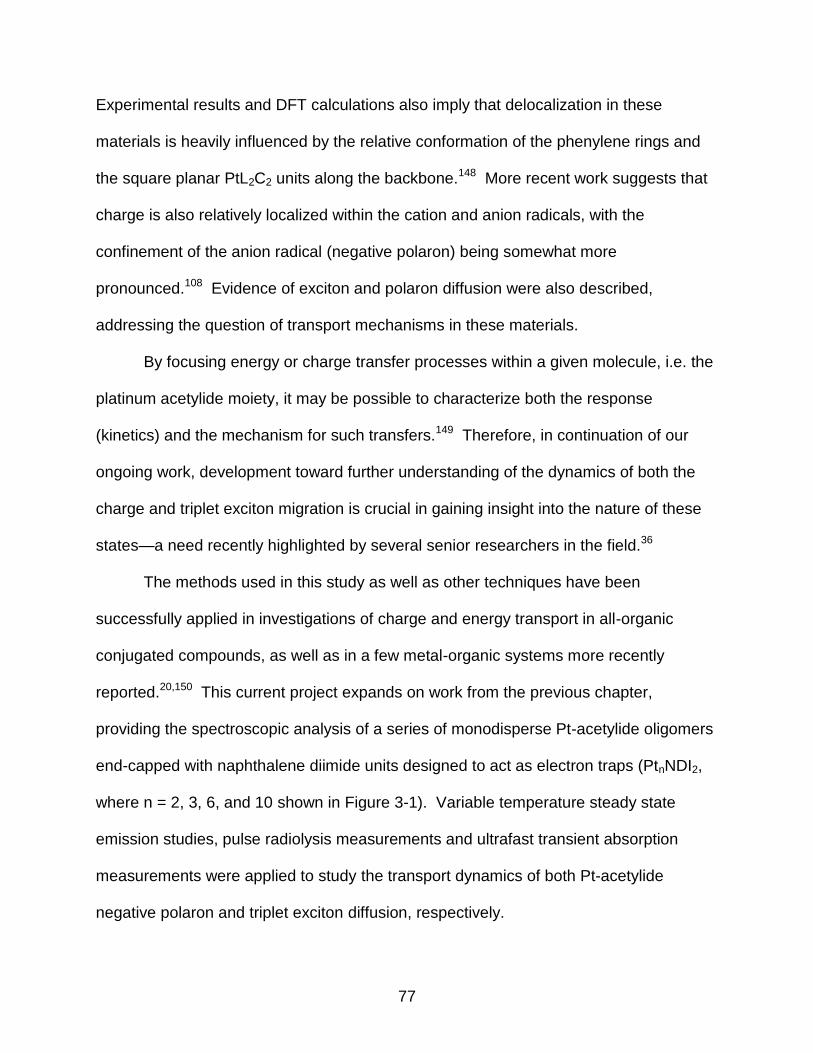
77
Experimental results and DFT calculations also imply that delocalization in these
materials is heavily influenced by the relative conformation of the phenylene rings and
the square planar PtL2C2 units along the backbone.148 More recent work suggests that
charge is also relatively localized within the cation and anion radicals, with the
confinement of the anion radical (negative polaron) being somewhat more
pronounced.108 Evidence of exciton and polaron diffusion were also described,
addressing the question of transport mechanisms in these materials.
By focusing energy or charge transfer processes within a given molecule, i.e. the
platinum acetylide moiety, it may be possible to characterize both the response
(kinetics) and the mechanism for such transfers.149 Therefore, in continuation of our
ongoing work, development toward further understanding of the dynamics of both the
charge and triplet exciton migration is crucial in gaining insight into the nature of these
states—a need recently highlighted by several senior researchers in the field.36
The methods used in this study as well as other techniques have been
successfully applied in investigations of charge and energy transport in all-organic
conjugated compounds, as well as in a few metal-organic systems more recently
reported.20,150 This current project expands on work from the previous chapter,
providing the spectroscopic analysis of a series of monodisperse Pt-acetylide oligomers
end-capped with naphthalene diimide units designed to act as electron traps (PtnNDI2,
where n = 2, 3, 6, and 10 shown in Figure 3-1). Variable temperature steady state
emission studies, pulse radiolysis measurements and ultrafast transient absorption
measurements were applied to study the transport dynamics of both Pt-acetylide
negative polaron and triplet exciton diffusion, respectively.
78
Figure 3-1. Structures of the current study: PtnNDI2, Pt2, Pt4, and NDI-H.
Experimental
Synthesis
In an effort directed towards developing an understanding of charge and energy
transfer in conjugated metal-organic materials, an extended series of naphthalene
diimide (NDI) end-capped Pt-acetylide oligomers, PtnNDI2, have been prepared, where
n = 2, 3, 6, and 10 (Figure 3-1). Preparation of these compounds was described in
Chapter 2.
Steady State Photophysics
Steady-state absorption spectra were recorded on a Varian Cary 100 dual-beam
spectrophotometer. Corrected steady-state emission measurements were conducted
on a SPEX F-112 fluorescence spectrometer. Samples were degassed by argon
purging for 30 min and concentrations were adjusted to produce ―optically dilute‖
79
solutions (i.e., Amax < 0.20). Photoluminescence quantum yields were determined
according to the ―optically dilute‖ method described by Demas and Crosby.151 Low-
temperature fluorescence measurements were made by cooling the samples in a LN2
cooled Oxford Instruments OptistatDN-1704 optical cryostat connected to an Omega
CYC3200 temperature controller, and emission measurements were conducted on a
PTI fluorescence spectrometer. Samples were degassed by four repeated cycles of
freeze-pump-thaw on a high vacuum line.
Electrochemistry
Cyclic voltammetry (CV) experiments were performed in a dry methylene chloride
(CH2Cl2) solution containing 0.1 M tetra-n-butylammonium hexafluorophosphate
(TBAHFP) as the supporting electrolyte. The three-electrode setup consisted of a
platinum microdisk (2 mm2) working electrode, a platinum wire auxiliary electrode and a
silver wire reference electrode. Solutions were degassed with argon flow prior to
measurements, maintaining positive argon pressure during the measurements. The
concentrations of oligomers in the solutions were 1 mM. A 100 mV/s scan rate was
used. All potentials were internally calibrated against the ferrocene/ferricinium couple
(E = 0.43 V vs. SCE in CH2Cl2) and potentials plotted vs. SCE.134
Pulse Radiolysis
This work was carried out at the Brookhaven National Laboratory Laser-Electron
Accelerator Facility (LEAF). The LEAF facility and the methods used are described
elsewhere,107,152,153 as are application to conjugated polymers.110,111,150 Briefly, the
electron pulse (≤ 50 ps duration) was focused into a quartz cell with an optical path
length of 20 or 5 mm containing tetrahydrofuran (THF) solutions under argon. The
monitoring light source was a pulsed xenon arc lamp. Wavelengths were selected
80
using either 40 nm or 10 nm bandpass interference filters. Transient absorption signals
were detected with either silicon (EG&G FND-100Q, ≤ 1000 nm), or InGaAs (GPD
Optoelectronics GAP-500L, ≥ 1100 nm) photodiodes or a biplanar phototube
(Hamamatsu R1328U-03, ≤ 650 nm) and digitized with a LeCroy 8620A-oscilloscope.
While most measurements have 2-4 ns time resolution, 125 ps system rise time was
attained in the visible using the biplanar phototube, and short path cells. Molar
extinction coefficients of the radical anions were calculated using G(e-THF)=0.60 in
THF,154,155 where G is the radiation chemical yield. To account for capture of geminate
electrons, many of which decay in times near 1 ns, electron decay in neat THF was
analyzed within Figure 3-2 below. The extinction coefficients obtained were smaller
than those reported earlier for Ptn ions.108
The Optical Fiber Single-Shot (OFSS) system obtains still faster time resolution. It
operates on a beamline at LEAF where the electron pulse is compressed to ~5 ps
duration. The OFSS system is a new instrument that obtains 15 ps overall time
resolution using single electron pulses.156 Signal to noise is enhanced by averaging
data from ~25 pulses. Briefly it measures transient absorption utilizing laser probe
pulses with wavelengths selected by an optical parametric amplifier. Each probe pulse
passes through an optical fiber bundle composed of ~100 fibers having different
lengths, separating the probe pulse into 100 mini-pulses having different time delays.
The bundle is then imaged into the region of the sample irradiated by the 5 ps electron
pulse, and then imaged on a CCD array camera.
Charge transport to the NDI end caps was analyzed in the scheme below (Figure
3-2). Fast electrons pass through the sample cell creating ionization that primarily
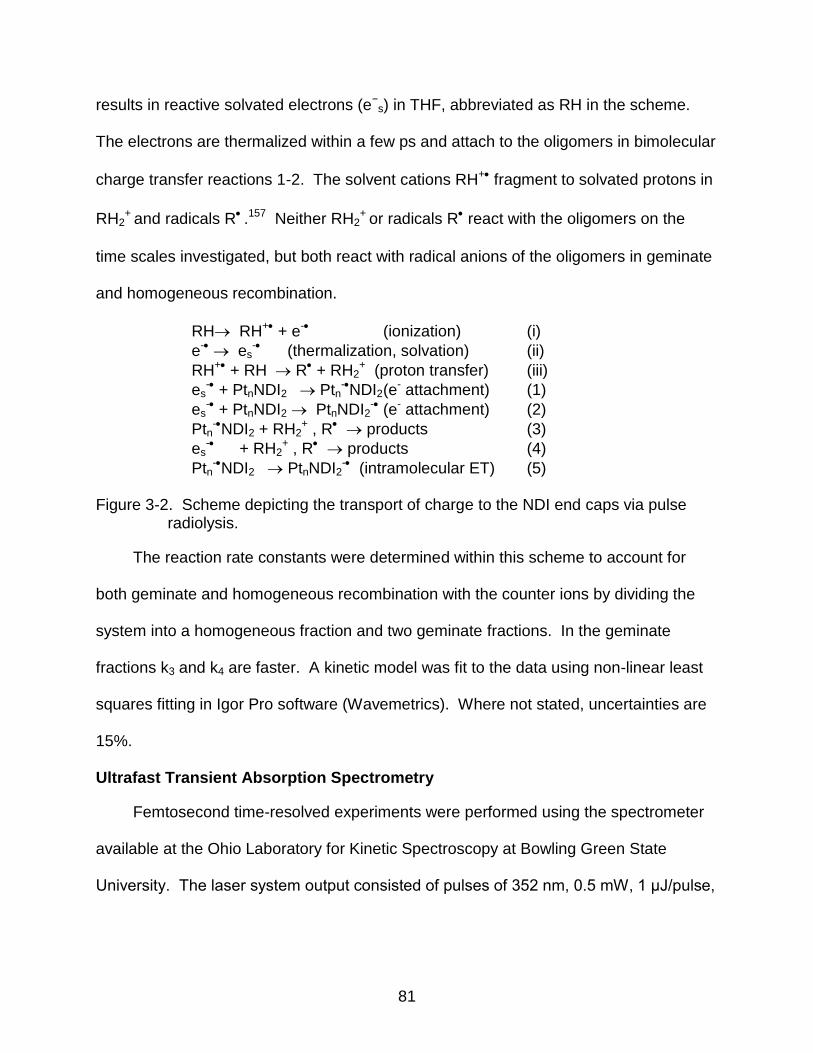
81
results in reactive solvated electrons (e−s) in THF, abbreviated as RH in the scheme.
The electrons are thermalized within a few ps and attach to the oligomers in bimolecular
charge transfer reactions 1-2. The solvent cations RH+ fragment to solvated protons in
RH2+ and radicals R .157 Neither RH2
+ or radicals R react with the oligomers on the
time scales investigated, but both react with radical anions of the oligomers in geminate
and homogeneous recombination.
RH RH+ + e- (ionization) (i)
e- es- (thermalization, solvation) (ii)
RH+ + RH R + RH2+ (proton transfer) (iii)
es- + PtnNDI2 Ptn
-NDI2 (e- attachment) (1)
es- + PtnNDI2 PtnNDI2
- (e- attachment) (2)
Ptn-NDI2 + RH2
+ , R products (3)
es- + RH2
+ , R products (4)
Ptn-NDI2 PtnNDI2
- (intramolecular ET) (5)
Figure 3-2. Scheme depicting the transport of charge to the NDI end caps via pulse radiolysis.
The reaction rate constants were determined within this scheme to account for
both geminate and homogeneous recombination with the counter ions by dividing the
system into a homogeneous fraction and two geminate fractions. In the geminate
fractions k3 and k4 are faster. A kinetic model was fit to the data using non-linear least
squares fitting in Igor Pro software (Wavemetrics). Where not stated, uncertainties are
15%.
Ultrafast Transient Absorption Spectrometry
Femtosecond time-resolved experiments were performed using the spectrometer
available at the Ohio Laboratory for Kinetic Spectroscopy at Bowling Green State
University. The laser system output consisted of pulses of 352 nm, 0.5 mW, 1 μJ/pulse,
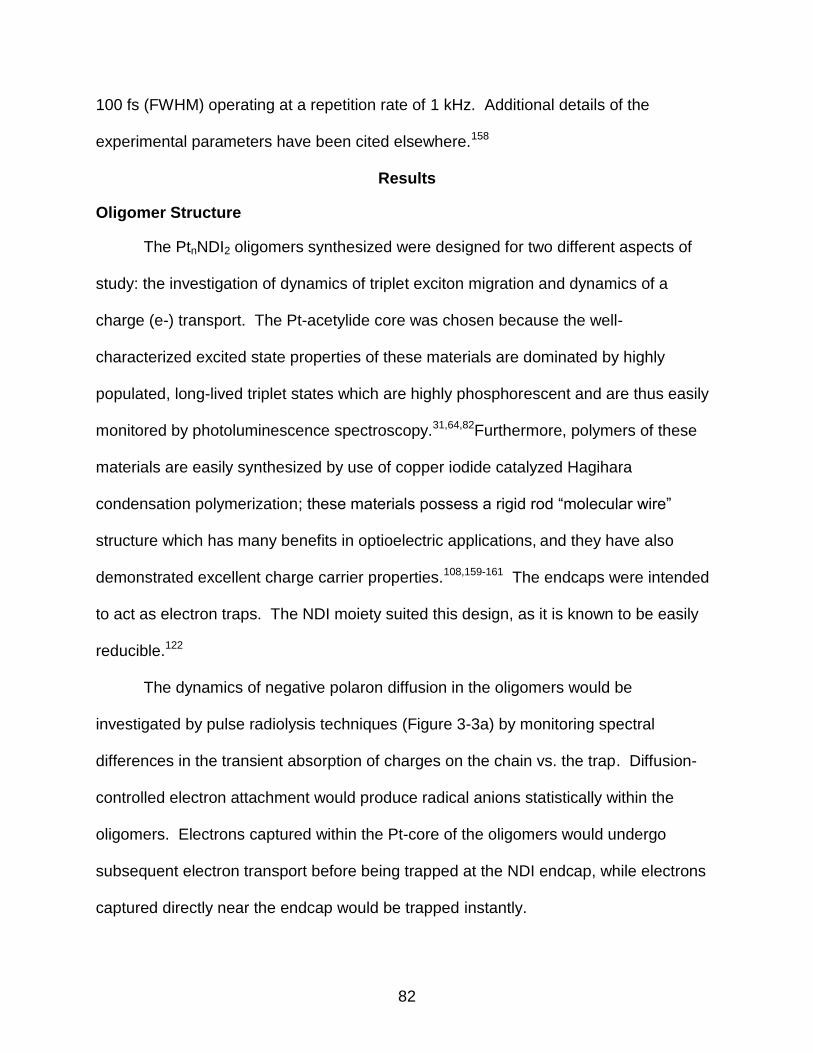
82
100 fs (FWHM) operating at a repetition rate of 1 kHz. Additional details of the
experimental parameters have been cited elsewhere.158
Results
Oligomer Structure
The PtnNDI2 oligomers synthesized were designed for two different aspects of
study: the investigation of dynamics of triplet exciton migration and dynamics of a
charge (e-) transport. The Pt-acetylide core was chosen because the well-
characterized excited state properties of these materials are dominated by highly
populated, long-lived triplet states which are highly phosphorescent and are thus easily
monitored by photoluminescence spectroscopy.31,64,82Furthermore, polymers of these
materials are easily synthesized by use of copper iodide catalyzed Hagihara
condensation polymerization; these materials possess a rigid rod ―molecular wire‖
structure which has many benefits in optioelectric applications, and they have also
demonstrated excellent charge carrier properties.108,159-161 The endcaps were intended
to act as electron traps. The NDI moiety suited this design, as it is known to be easily
reducible.122
The dynamics of negative polaron diffusion in the oligomers would be
investigated by pulse radiolysis techniques (Figure 3-3a) by monitoring spectral
differences in the transient absorption of charges on the chain vs. the trap. Diffusion-
controlled electron attachment would produce radical anions statistically within the
oligomers. Electrons captured within the Pt-core of the oligomers would undergo
subsequent electron transport before being trapped at the NDI endcap, while electrons
captured directly near the endcap would be trapped instantly.
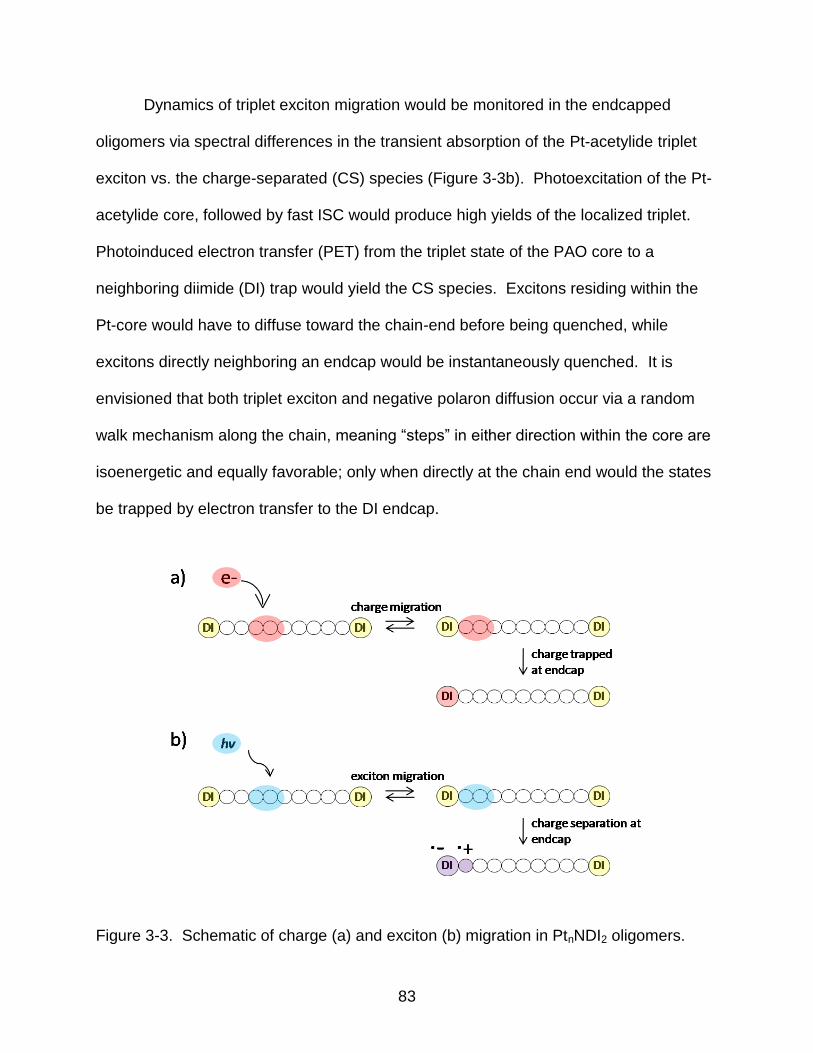
83
Dynamics of triplet exciton migration would be monitored in the endcapped
oligomers via spectral differences in the transient absorption of the Pt-acetylide triplet
exciton vs. the charge-separated (CS) species (Figure 3-3b). Photoexcitation of the Pt-
acetylide core, followed by fast ISC would produce high yields of the localized triplet.
Photoinduced electron transfer (PET) from the triplet state of the PAO core to a
neighboring diimide (DI) trap would yield the CS species. Excitons residing within the
Pt-core would have to diffuse toward the chain-end before being quenched, while
excitons directly neighboring an endcap would be instantaneously quenched. It is
envisioned that both triplet exciton and negative polaron diffusion occur via a random
walk mechanism along the chain, meaning ―steps‖ in either direction within the core are
isoenergetic and equally favorable; only when directly at the chain end would the states
be trapped by electron transfer to the DI endcap.
Figure 3-3. Schematic of charge (a) and exciton (b) migration in PtnNDI2 oligomers.
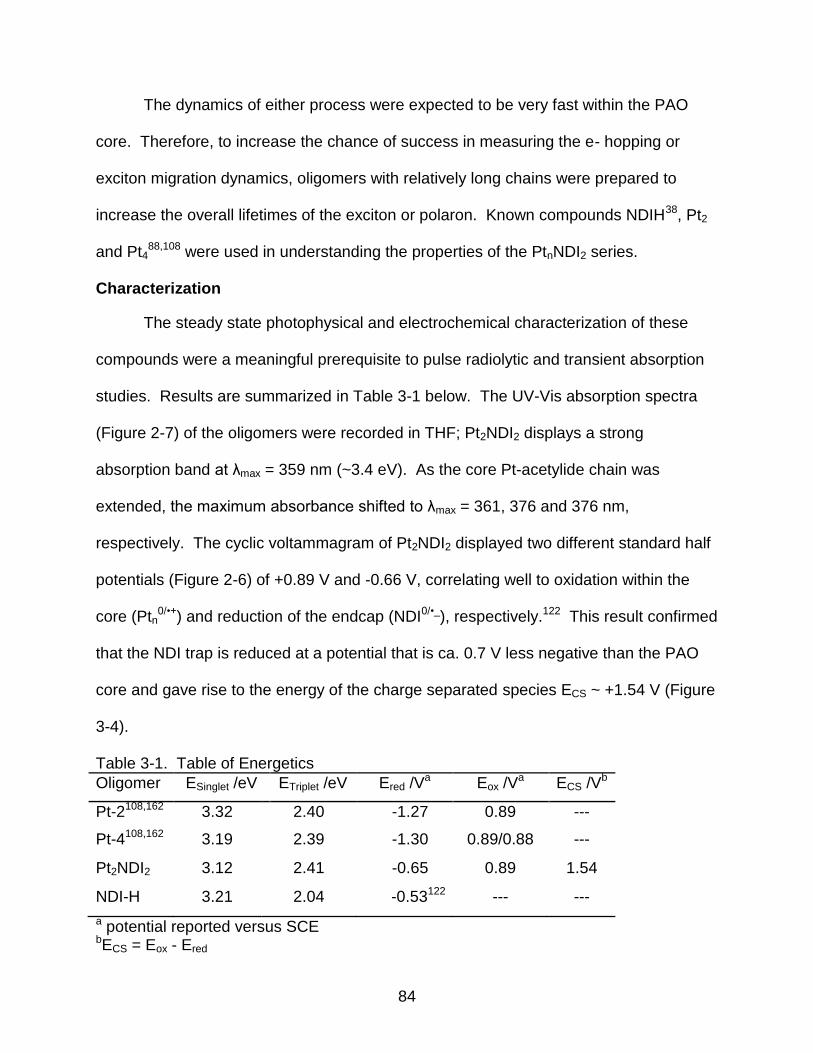
84
The dynamics of either process were expected to be very fast within the PAO
core. Therefore, to increase the chance of success in measuring the e- hopping or
exciton migration dynamics, oligomers with relatively long chains were prepared to
increase the overall lifetimes of the exciton or polaron. Known compounds NDIH38, Pt2
and Pt488,108 were used in understanding the properties of the PtnNDI2 series.
Characterization
The steady state photophysical and electrochemical characterization of these
compounds were a meaningful prerequisite to pulse radiolytic and transient absorption
studies. Results are summarized in Table 3-1 below. The UV-Vis absorption spectra
(Figure 2-7) of the oligomers were recorded in THF; Pt2NDI2 displays a strong
absorption band at λmax = 359 nm (~3.4 eV). As the core Pt-acetylide chain was
extended, the maximum absorbance shifted to λmax = 361, 376 and 376 nm,
respectively. The cyclic voltammagram of Pt2NDI2 displayed two different standard half
potentials (Figure 2-6) of +0.89 V and -0.66 V, correlating well to oxidation within the
core (Ptn0/•+) and reduction of the endcap (NDI0/•_), respectively.122 This result confirmed
that the NDI trap is reduced at a potential that is ca. 0.7 V less negative than the PAO
core and gave rise to the energy of the charge separated species ECS ~ +1.54 V (Figure
3-4).
Table 3-1. Table of Energetics
Oligomer ESinglet /eV ETriplet /eV Ered /Va Eox /V
a ECS /Vb
Pt-2108,162 3.32 2.40 -1.27 0.89 ---
Pt-4108,162 3.19 2.39 -1.30 0.89/0.88 ---
Pt2NDI2 3.12 2.41 -0.65 0.89 1.54
NDI-H 3.21 2.04 -0.53122 --- ---
a potential reported versus SCE bECS = Eox - Ered
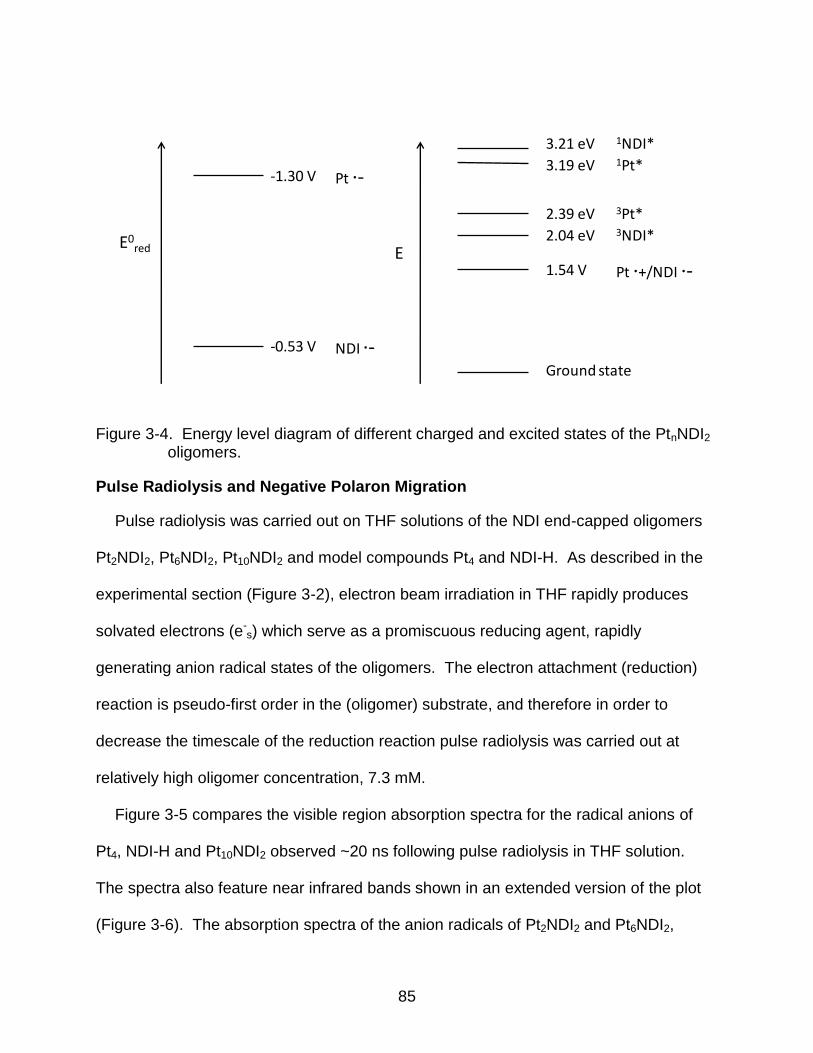
85
-0.53 V
Pt ∙--1.30 V
NDI ∙-
1.54 V Pt ∙+/NDI ∙-
2.04 eV 3NDI*
2.39 eV 3Pt*
3.19 eV 1Pt*
3.21 eV 1NDI*
E0red E
Ground state
Figure 3-4. Energy level diagram of different charged and excited states of the PtnNDI2 oligomers.
Pulse Radiolysis and Negative Polaron Migration
Pulse radiolysis was carried out on THF solutions of the NDI end-capped oligomers
Pt2NDI2, Pt6NDI2, Pt10NDI2 and model compounds Pt4 and NDI-H. As described in the
experimental section (Figure 3-2), electron beam irradiation in THF rapidly produces
solvated electrons (e-s) which serve as a promiscuous reducing agent, rapidly
generating anion radical states of the oligomers. The electron attachment (reduction)
reaction is pseudo-first order in the (oligomer) substrate, and therefore in order to
decrease the timescale of the reduction reaction pulse radiolysis was carried out at
relatively high oligomer concentration, 7.3 mM.
Figure 3-5 compares the visible region absorption spectra for the radical anions of
Pt4, NDI-H and Pt10NDI2 observed ~20 ns following pulse radiolysis in THF solution.
The spectra also feature near infrared bands shown in an extended version of the plot
(Figure 3-6). The absorption spectra of the anion radicals of Pt2NDI2 and Pt6NDI2,
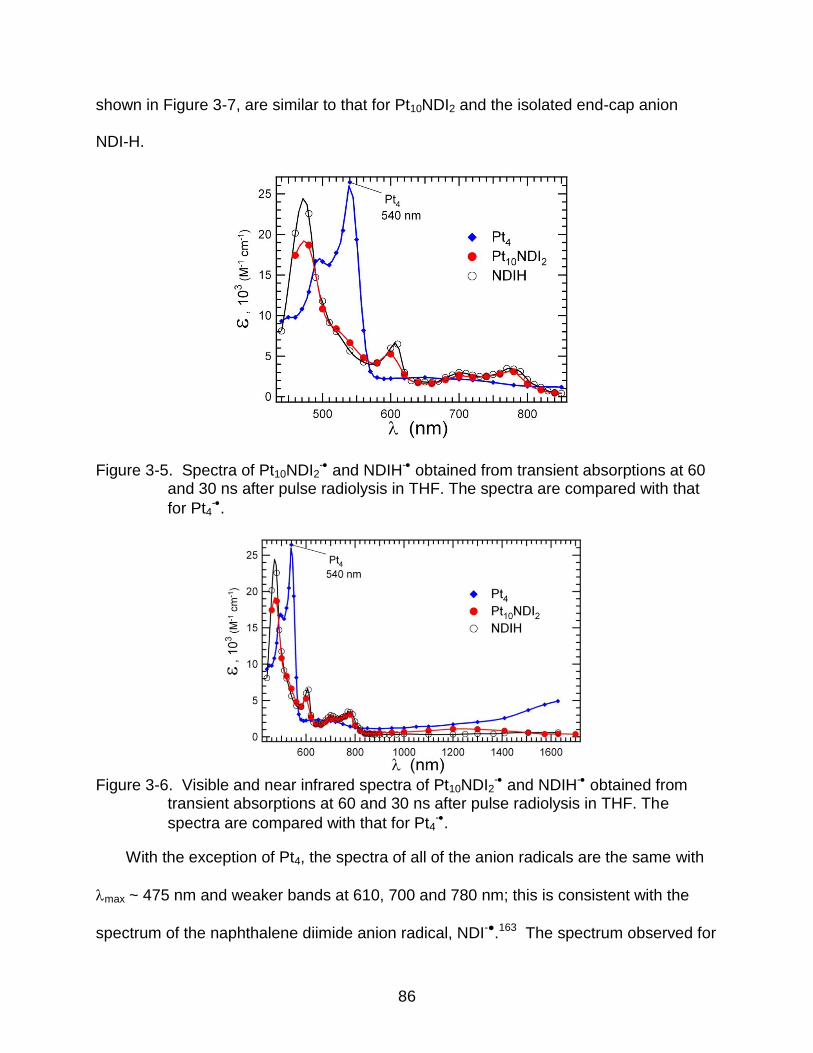
86
shown in Figure 3-7, are similar to that for Pt10NDI2 and the isolated end-cap anion
NDI-H.
Figure 3-5. Spectra of Pt10NDI2- and NDIH- obtained from transient absorptions at 60
and 30 ns after pulse radiolysis in THF. The spectra are compared with that
for Pt4-.
Figure 3-6. Visible and near infrared spectra of Pt10NDI2
- and NDIH- obtained from transient absorptions at 60 and 30 ns after pulse radiolysis in THF. The
spectra are compared with that for Pt4-.
With the exception of Pt4, the spectra of all of the anion radicals are the same with
max ~ 475 nm and weaker bands at 610, 700 and 780 nm; this is consistent with the
spectrum of the naphthalene diimide anion radical, NDI-●.163 The spectrum observed for
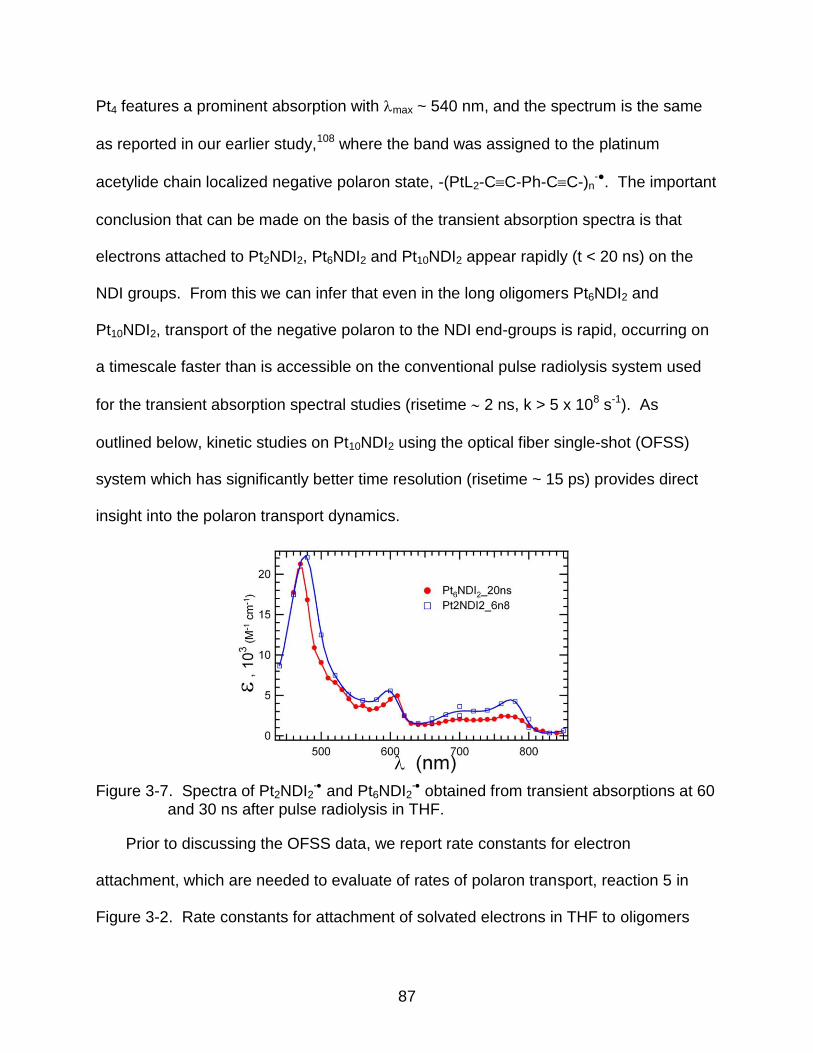
87
Pt4 features a prominent absorption with max ~ 540 nm, and the spectrum is the same
as reported in our earlier study,108 where the band was assigned to the platinum
acetylide chain localized negative polaron state, -(PtL2-CC-Ph-CC-)n-●. The important
conclusion that can be made on the basis of the transient absorption spectra is that
electrons attached to Pt2NDI2, Pt6NDI2 and Pt10NDI2 appear rapidly (t < 20 ns) on the
NDI groups. From this we can infer that even in the long oligomers Pt6NDI2 and
Pt10NDI2, transport of the negative polaron to the NDI end-groups is rapid, occurring on
a timescale faster than is accessible on the conventional pulse radiolysis system used
for the transient absorption spectral studies (risetime 2 ns, k > 5 x 10⁸ s-1). As
outlined below, kinetic studies on Pt10NDI2 using the optical fiber single-shot (OFSS)
system which has significantly better time resolution (risetime ~ 15 ps) provides direct
insight into the polaron transport dynamics.
Figure 3-7. Spectra of Pt2NDI2
- and Pt6NDI2- obtained from transient absorptions at 60
and 30 ns after pulse radiolysis in THF.
Prior to discussing the OFSS data, we report rate constants for electron
attachment, which are needed to evaluate of rates of polaron transport, reaction 5 in
Figure 3-2. Rate constants for attachment of solvated electrons in THF to oligomers
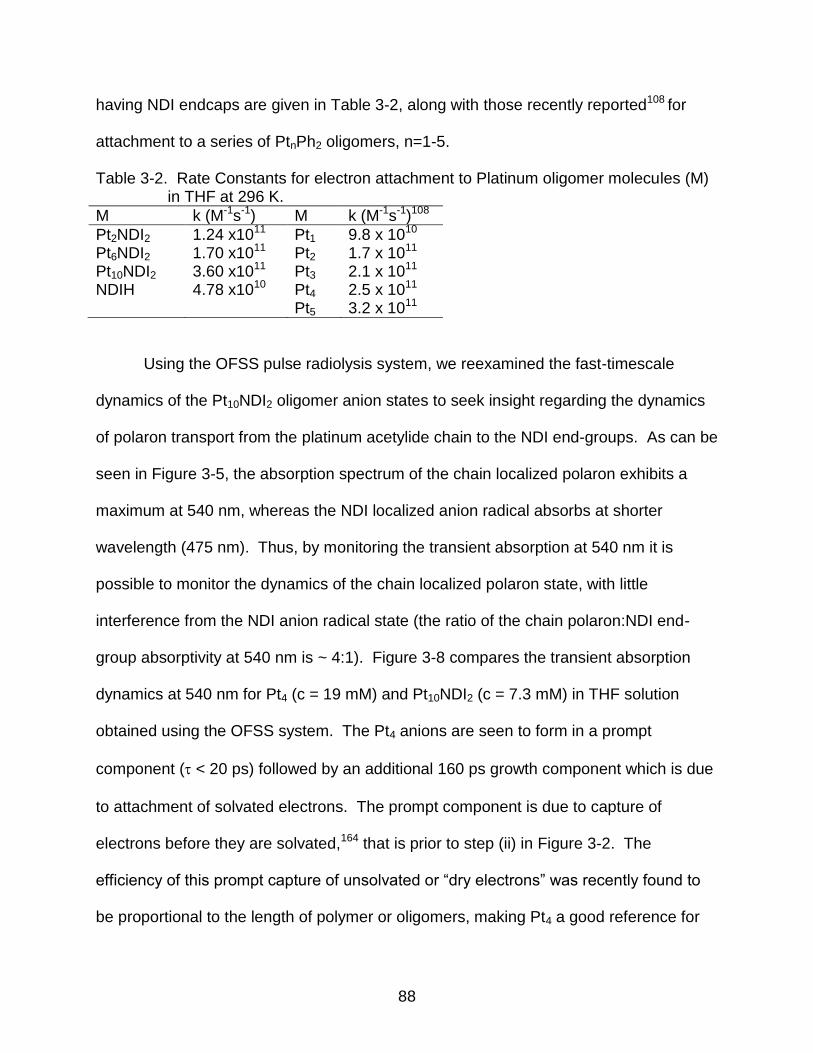
88
having NDI endcaps are given in Table 3-2, along with those recently reported108 for
attachment to a series of PtnPh2 oligomers, n=1-5.
Table 3-2. Rate Constants for electron attachment to Platinum oligomer molecules (M) in THF at 296 K.
M k (M-1s-1) M k (M-1s-1)108
Pt2NDI2 1.24 x10¹¹ Pt1 9.8 x 10¹⁰ Pt6NDI2 1.70 x10¹¹ Pt2 1.7 x 10¹¹ Pt10NDI2 3.60 x10¹¹ Pt3 2.1 x 10¹¹ NDIH 4.78 x10¹⁰ Pt4 2.5 x 10¹¹ Pt5 3.2 x 10¹¹
Using the OFSS pulse radiolysis system, we reexamined the fast-timescale
dynamics of the Pt10NDI2 oligomer anion states to seek insight regarding the dynamics
of polaron transport from the platinum acetylide chain to the NDI end-groups. As can be
seen in Figure 3-5, the absorption spectrum of the chain localized polaron exhibits a
maximum at 540 nm, whereas the NDI localized anion radical absorbs at shorter
wavelength (475 nm). Thus, by monitoring the transient absorption at 540 nm it is
possible to monitor the dynamics of the chain localized polaron state, with little
interference from the NDI anion radical state (the ratio of the chain polaron:NDI end-
group absorptivity at 540 nm is ~ 4:1). Figure 3-8 compares the transient absorption
dynamics at 540 nm for Pt4 (c = 19 mM) and Pt10NDI2 (c = 7.3 mM) in THF solution
obtained using the OFSS system. The Pt4 anions are seen to form in a prompt
component ( < 20 ps) followed by an additional 160 ps growth component which is due
to attachment of solvated electrons. The prompt component is due to capture of
electrons before they are solvated,164 that is prior to step (ii) in Figure 3-2. The
efficiency of this prompt capture of unsolvated or ―dry electrons‖ was recently found to
be proportional to the length of polymer or oligomers, making Pt4 a good reference for
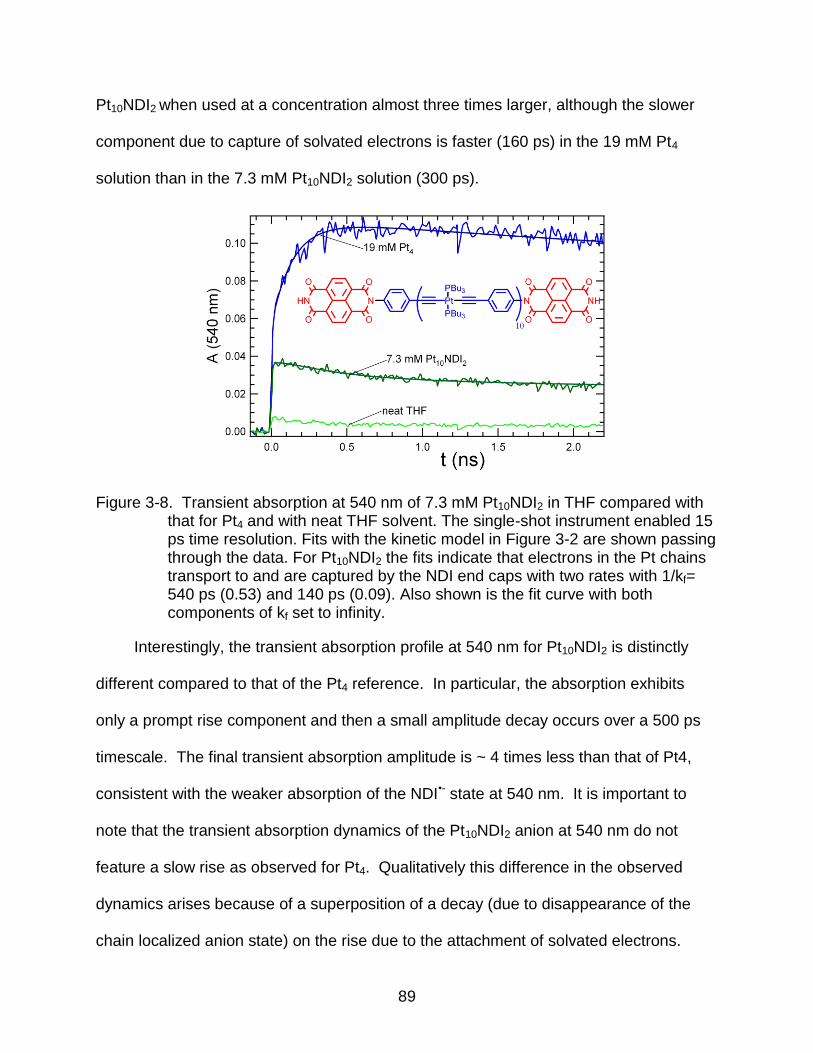
89
Pt10NDI2 when used at a concentration almost three times larger, although the slower
component due to capture of solvated electrons is faster (160 ps) in the 19 mM Pt4
solution than in the 7.3 mM Pt10NDI2 solution (300 ps).
Figure 3-8. Transient absorption at 540 nm of 7.3 mM Pt10NDI2 in THF compared with that for Pt4 and with neat THF solvent. The single-shot instrument enabled 15 ps time resolution. Fits with the kinetic model in Figure 3-2 are shown passing through the data. For Pt10NDI2 the fits indicate that electrons in the Pt chains transport to and are captured by the NDI end caps with two rates with 1/kf= 540 ps (0.53) and 140 ps (0.09). Also shown is the fit curve with both components of kf set to infinity.
Interestingly, the transient absorption profile at 540 nm for Pt10NDI2 is distinctly
different compared to that of the Pt4 reference. In particular, the absorption exhibits
only a prompt rise component and then a small amplitude decay occurs over a 500 ps
timescale. The final transient absorption amplitude is ~ 4 times less than that of Pt4,
consistent with the weaker absorption of the NDI•- state at 540 nm. It is important to
note that the transient absorption dynamics of the Pt10NDI2 anion at 540 nm do not
feature a slow rise as observed for Pt4. Qualitatively this difference in the observed
dynamics arises because of a superposition of a decay (due to disappearance of the
chain localized anion state) on the rise due to the attachment of solvated electrons.
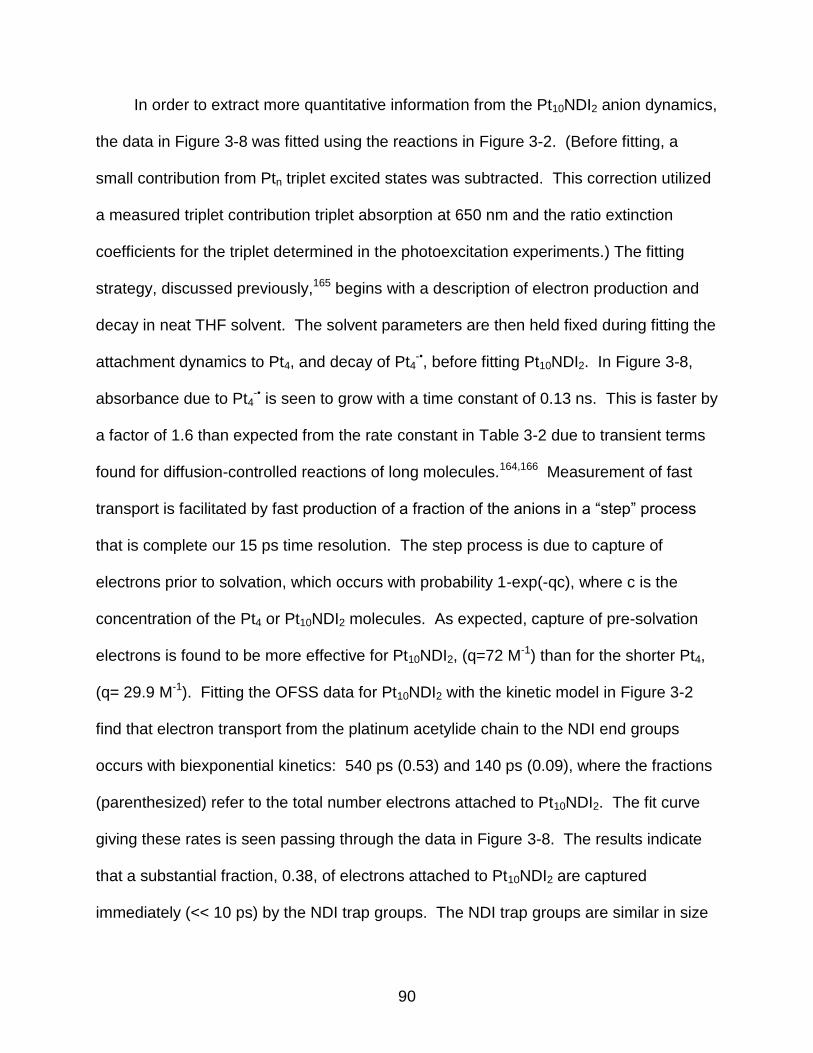
90
In order to extract more quantitative information from the Pt10NDI2 anion dynamics,
the data in Figure 3-8 was fitted using the reactions in Figure 3-2. (Before fitting, a
small contribution from Ptn triplet excited states was subtracted. This correction utilized
a measured triplet contribution triplet absorption at 650 nm and the ratio extinction
coefficients for the triplet determined in the photoexcitation experiments.) The fitting
strategy, discussed previously,165 begins with a description of electron production and
decay in neat THF solvent. The solvent parameters are then held fixed during fitting the
attachment dynamics to Pt4, and decay of Pt4-•, before fitting Pt10NDI2. In Figure 3-8,
absorbance due to Pt4-• is seen to grow with a time constant of 0.13 ns. This is faster by
a factor of 1.6 than expected from the rate constant in Table 3-2 due to transient terms
found for diffusion-controlled reactions of long molecules.164,166 Measurement of fast
transport is facilitated by fast production of a fraction of the anions in a ―step‖ process
that is complete our 15 ps time resolution. The step process is due to capture of
electrons prior to solvation, which occurs with probability 1-exp(-qc), where c is the
concentration of the Pt4 or Pt10NDI2 molecules. As expected, capture of pre-solvation
electrons is found to be more effective for Pt10NDI2, (q=72 M-1) than for the shorter Pt4,
(q= 29.9 M-1). Fitting the OFSS data for Pt10NDI2 with the kinetic model in Figure 3-2
find that electron transport from the platinum acetylide chain to the NDI end groups
occurs with biexponential kinetics: 540 ps (0.53) and 140 ps (0.09), where the fractions
(parenthesized) refer to the total number electrons attached to Pt10NDI2. The fit curve
giving these rates is seen passing through the data in Figure 3-8. The results indicate
that a substantial fraction, 0.38, of electrons attached to Pt10NDI2 are captured
immediately (<< 10 ps) by the NDI trap groups. The NDI trap groups are similar in size
91
to one repeat unit of the Pt chain, so Pt10NDI2 can be considered to comprise twelve
units. If each of these twelve units captures electrons with equal probability, then the
observed 38% immediate capture corresponds to electrons attached centering on the
NDI groups and the first 1.3 Pt units adjacent to NDI: if a Pt-• polaron is centered on or
within 1.3 repeat units of and NDI, it transfers immediately to the NDI. Those polarons
formed in the central 7.4 units of the chain are observed as Pt-• that must diffuse along
the chain to react with the NDI trap.
It would be desirable to monitor the 475 nm absorption due to NDI-• in order to
observe fast appearance of electrons at the NDI end groups. However, measurement
at 475 nm is difficult because the intense absorption of ground state neutral Pt10NDI2
molecules at the high concentration needed to capture electrons reduces the analyzing
light intensity by a factor of ~100. In addition the OFSS instrument is not yet able to
operate effectively at 475 nm. A measurement at 480 nm with a biplanar phototube
detector (150 ps nominal resolution) is shown in Figure 3-9. While the data are very
noisy because of the low transmittance of the solution and consequently weak probe
light intensity, it does indicate that the NDI-• absorption rises within 500 ps to the level
expected based on the Pt10NDI2-• absorption spectrum in Figure 3-5. While the S/N of
this data does not allow quantitative determination of the growth rate of the NDI-•
absorption, the data is fully consistent with the observations at 540 nm, supporting the
conclusion that almost all electrons attached to Pt10NDI2 appear within 700 ps on the
NDI end groups.
92
Figure 3-9. Transient absorption at 480 nm showing the formation of NDI2
- in a 5.2 mM solution of Pt10NDI2 in THF. The data are very noisy due to intense absorption by the Pt10NDI2 molecules, which reduces the probe light intensity by a factor of ~100 at this high concentration. In addition to noise the data are affected during the first ~300 ps by emission. The noisy measurements on Pt10NDI2 are compared with observations on Pt4 at 480 nm, and at the 540
nm spectral maximum of Pt4-. The absorption at 480 nm in the Pt10NDI2
solution, relative to those in the Pt4 solution, is consistent with nearly complete transfer of electrons to the NDI end groups by ~500 ps.
Photophysics and Exciton Transport
The second investigation for these oligomers was to examine the dynamics of
triplet exciton transport along the Pt-acetylide chain (Figure 3-3b). Because absorption
spectra of the PAOs are dominated by * transitions from the Pt-acetylide backbone,
photoexcitation mainly affords excitons which are localized on the conjugated chain.
Due to incorporation of the heavy metal in the backbone, intersystem crossing is rapid
(~1012 s-1) and relatively high yields of the triplet exciton are generated; fluorescence
yields are relatively low due to the slower rate of radiative decay (~109 s-1). Therefore,
within very short times of excitation the triplet state is almost quantitatively poplulated. It
has been shown that the triplet exciton in these systems is spatially confined, with a
chromophore structure consisting of the single -[-Pt(PR3)2-C≡C-Ar-C≡C-Pt(PR3)2-]- unit,
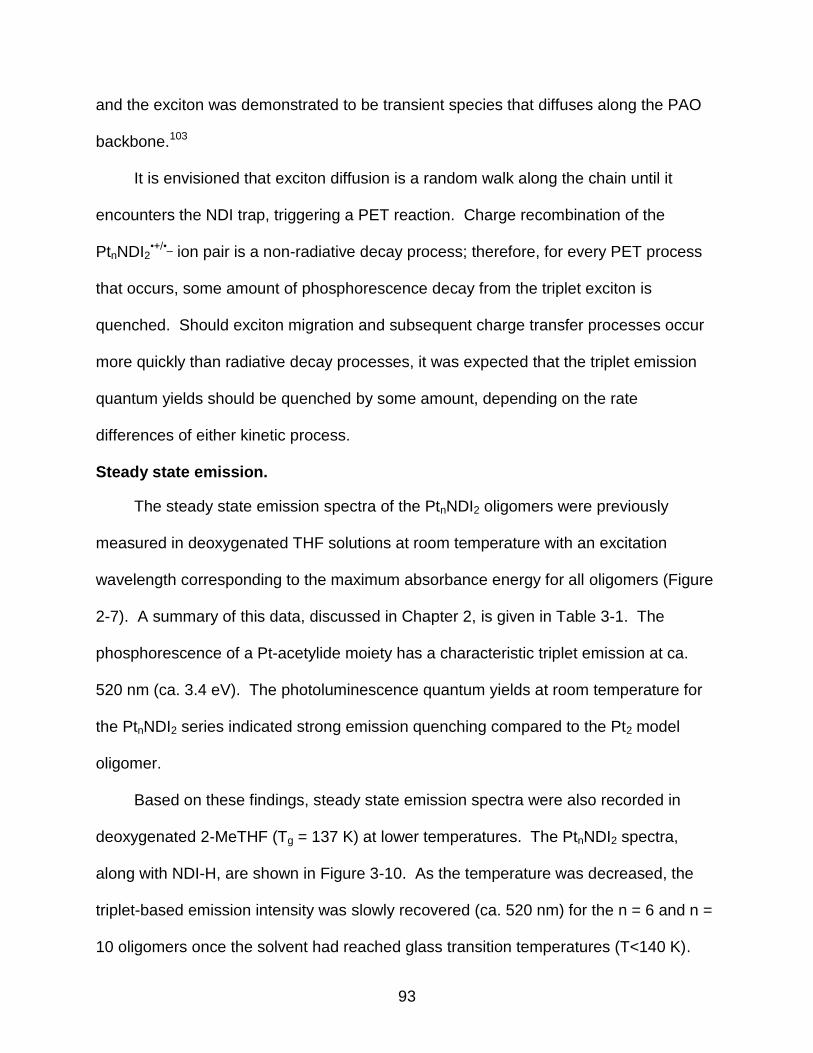
93
and the exciton was demonstrated to be transient species that diffuses along the PAO
backbone.103
It is envisioned that exciton diffusion is a random walk along the chain until it
encounters the NDI trap, triggering a PET reaction. Charge recombination of the
PtnNDI2•+/•_ ion pair is a non-radiative decay process; therefore, for every PET process
that occurs, some amount of phosphorescence decay from the triplet exciton is
quenched. Should exciton migration and subsequent charge transfer processes occur
more quickly than radiative decay processes, it was expected that the triplet emission
quantum yields should be quenched by some amount, depending on the rate
differences of either kinetic process.
Steady state emission.
The steady state emission spectra of the PtnNDI2 oligomers were previously
measured in deoxygenated THF solutions at room temperature with an excitation
wavelength corresponding to the maximum absorbance energy for all oligomers (Figure
2-7). A summary of this data, discussed in Chapter 2, is given in Table 3-1. The
phosphorescence of a Pt-acetylide moiety has a characteristic triplet emission at ca.
520 nm (ca. 3.4 eV). The photoluminescence quantum yields at room temperature for
the PtnNDI2 series indicated strong emission quenching compared to the Pt2 model
oligomer.
Based on these findings, steady state emission spectra were also recorded in
deoxygenated 2-MeTHF (Tg = 137 K) at lower temperatures. The PtnNDI2 spectra,
along with NDI-H, are shown in Figure 3-10. As the temperature was decreased, the
triplet-based emission intensity was slowly recovered (ca. 520 nm) for the n = 6 and n =
10 oligomers once the solvent had reached glass transition temperatures (T<140 K).
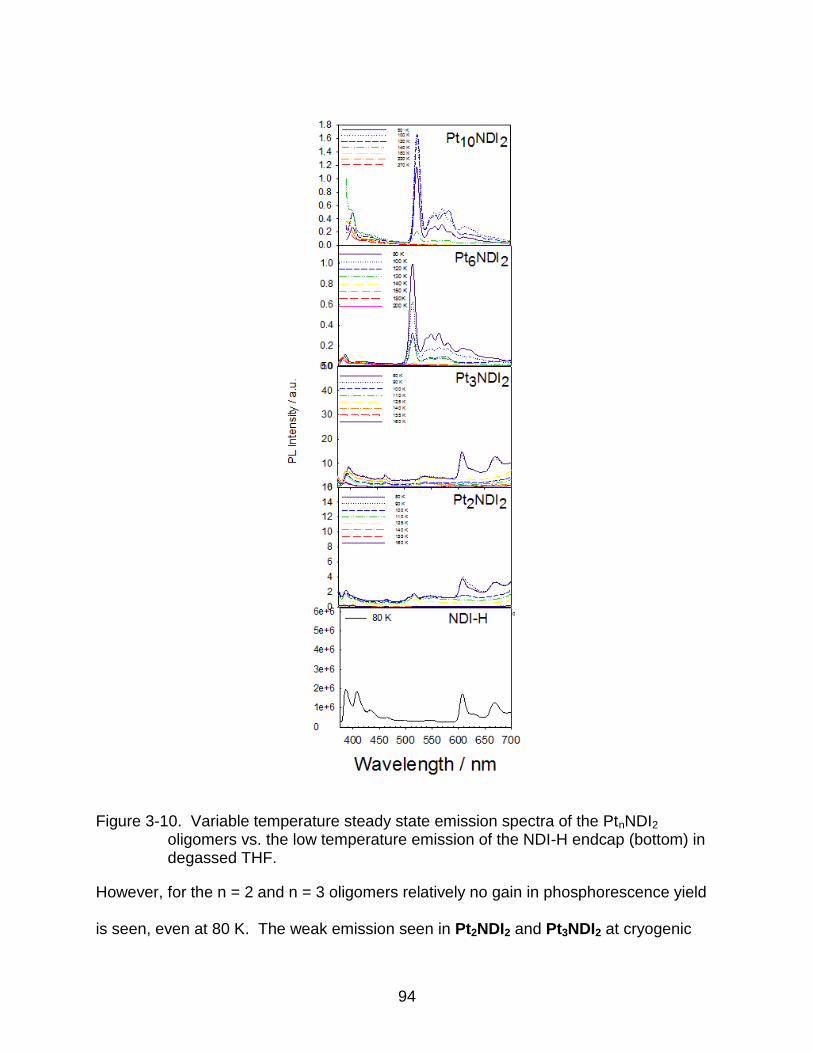
94
Figure 3-10. Variable temperature steady state emission spectra of the PtnNDI2 oligomers vs. the low temperature emission of the NDI-H endcap (bottom) in degassed THF.
However, for the n = 2 and n = 3 oligomers relatively no gain in phosphorescence yield
is seen, even at 80 K. The weak emission seen in Pt2NDI2 and Pt3NDI2 at cryogenic
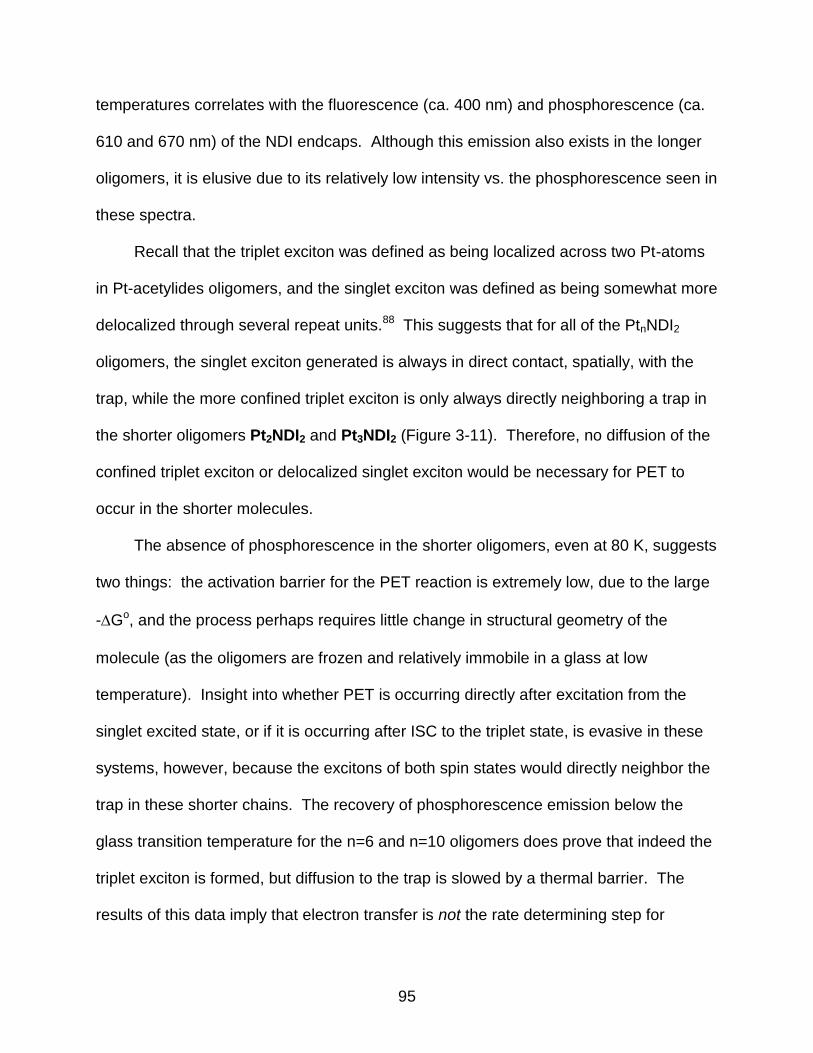
95
temperatures correlates with the fluorescence (ca. 400 nm) and phosphorescence (ca.
610 and 670 nm) of the NDI endcaps. Although this emission also exists in the longer
oligomers, it is elusive due to its relatively low intensity vs. the phosphorescence seen in
these spectra.
Recall that the triplet exciton was defined as being localized across two Pt-atoms
in Pt-acetylides oligomers, and the singlet exciton was defined as being somewhat more
delocalized through several repeat units.88 This suggests that for all of the PtnNDI2
oligomers, the singlet exciton generated is always in direct contact, spatially, with the
trap, while the more confined triplet exciton is only always directly neighboring a trap in
the shorter oligomers Pt2NDI2 and Pt3NDI2 (Figure 3-11). Therefore, no diffusion of the
confined triplet exciton or delocalized singlet exciton would be necessary for PET to
occur in the shorter molecules.
The absence of phosphorescence in the shorter oligomers, even at 80 K, suggests
two things: the activation barrier for the PET reaction is extremely low, due to the large
-Go, and the process perhaps requires little change in structural geometry of the
molecule (as the oligomers are frozen and relatively immobile in a glass at low
temperature). Insight into whether PET is occurring directly after excitation from the
singlet excited state, or if it is occurring after ISC to the triplet state, is evasive in these
systems, however, because the excitons of both spin states would directly neighbor the
trap in these shorter chains. The recovery of phosphorescence emission below the
glass transition temperature for the n=6 and n=10 oligomers does prove that indeed the
triplet exciton is formed, but diffusion to the trap is slowed by a thermal barrier. The
results of this data imply that electron transfer is not the rate determining step for
96
exciton quenching in the longer oligomers, but rather the triplet migration is the slow,
rate determining step.
Pt Pt PtPBu3
PBu3
PBu3
PBu3
PBu3
PBu3
N NN N
O
O
O
O
O
O
O
O
Oct Oct
Pt Pt PtPBu3
PBu3
PBu3
PBu3
PBu3
PBu3
N NN N
O
O
O
O
O
O
O
O
Oct Oct
PtPBu3
PBu3
N N
O
O
O
O
OctPt PtPBu3
PBu3
PBu3
PBu3
NN
O
O
O
O
Oct Pt Pt PtPBu3
PBu3
PBu3
PBu3
PBu3
PBu3
PtPBu3
PBu3
N N
O
O
O
O
OctPt PtPBu3
PBu3
PBu3
PBu3
NN
O
O
O
O
Oct Pt Pt PtPBu3
PBu3
PBu3
PBu3
PBu3
PBu3
kPET
kPET
kPET
khop
Singlet Exciton
Triplet ExcitonkPET > khop
Figure 3-11. Confinement of the triplet and singlet exciton in relation to distance to the NDI trap for Pt3NDI2 and Pt6NDI2.
Previous low temperature studies of Pt-acetylide oligomers found that in glass
solvents, Ptn oligomers exhibited luminescence similar to the longer PtnNDI2 oligomers
arising from several states due to differences in conformers that do not interconvert
during the lifetime of the triplet state in frozen glass.104 The different conformation
states were said to arise as a result of rotation of the phenylene rings relative to the
planes defined by the square planar PtP2C2 units (Figure 3-12). DFT calculations
agreed with experimental observations, citing that the energy minimal ground state
conformation for a Ptn chain—in which all phenylene units are twisted out of the plane
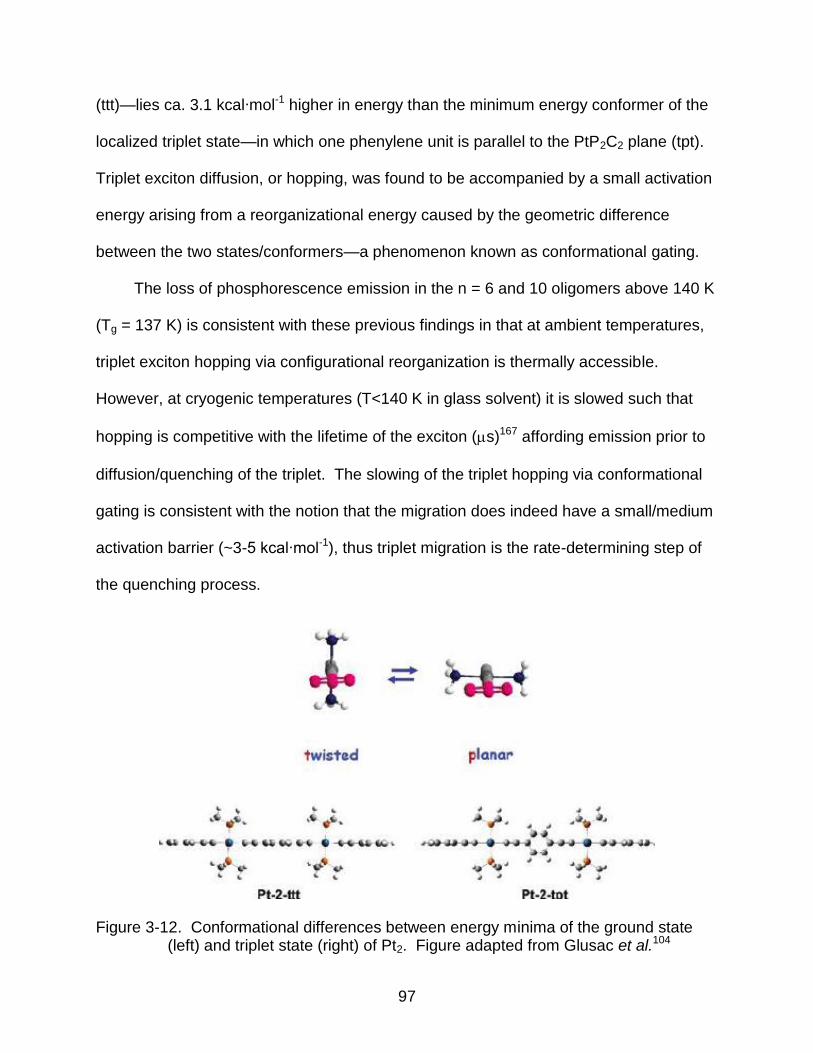
97
(ttt)—lies ca. 3.1 kcal∙mol-1 higher in energy than the minimum energy conformer of the
localized triplet state—in which one phenylene unit is parallel to the PtP2C2 plane (tpt).
Triplet exciton diffusion, or hopping, was found to be accompanied by a small activation
energy arising from a reorganizational energy caused by the geometric difference
between the two states/conformers—a phenomenon known as conformational gating.
The loss of phosphorescence emission in the n = 6 and 10 oligomers above 140 K
(Tg = 137 K) is consistent with these previous findings in that at ambient temperatures,
triplet exciton hopping via configurational reorganization is thermally accessible.
However, at cryogenic temperatures (T<140 K in glass solvent) it is slowed such that
hopping is competitive with the lifetime of the exciton (s)167 affording emission prior to
diffusion/quenching of the triplet. The slowing of the triplet hopping via conformational
gating is consistent with the notion that the migration does indeed have a small/medium
activation barrier (~3-5 kcal∙mol-1), thus triplet migration is the rate-determining step of
the quenching process.
Figure 3-12. Conformational differences between energy minima of the ground state (left) and triplet state (right) of Pt2. Figure adapted from Glusac et al.104
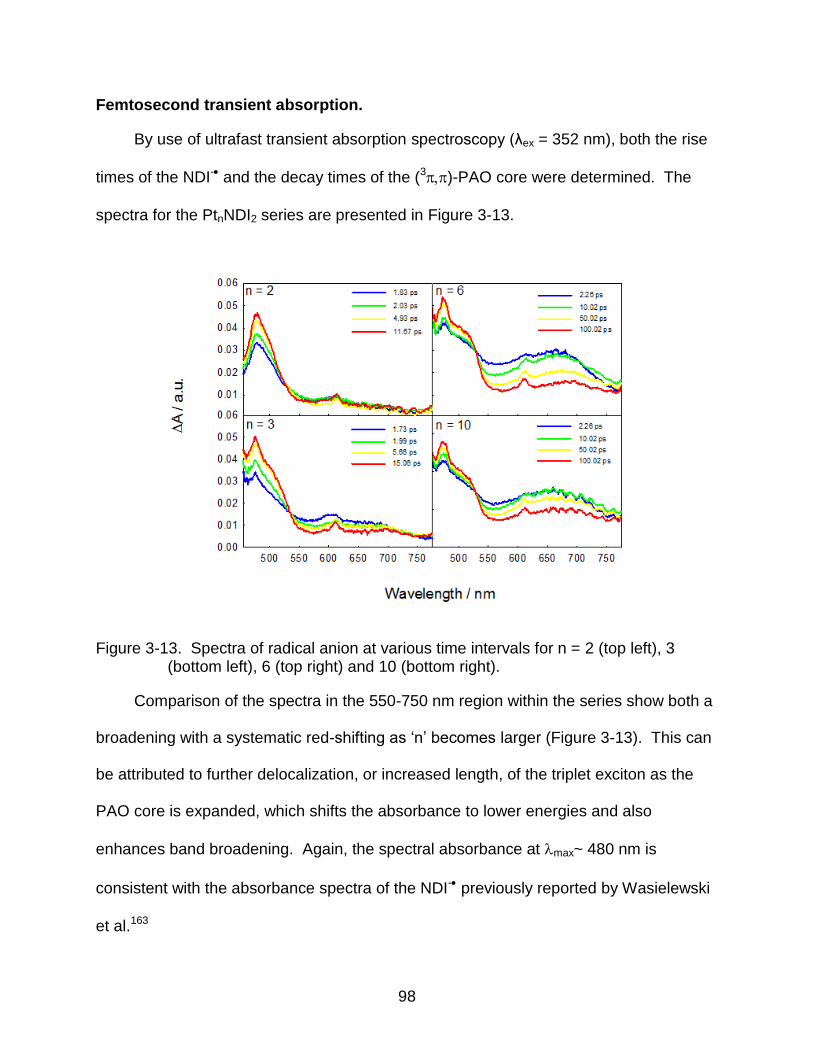
98
Femtosecond transient absorption.
By use of ultrafast transient absorption spectroscopy (λex = 352 nm), both the rise
times of the NDI- and the decay times of the (3)-PAO core were determined. The
spectra for the PtnNDI2 series are presented in Figure 3-13.
Figure 3-13. Spectra of radical anion at various time intervals for n = 2 (top left), 3 (bottom left), 6 (top right) and 10 (bottom right).
Comparison of the spectra in the 550-750 nm region within the series show both a
broadening with a systematic red-shifting as ‗n‘ becomes larger (Figure 3-13). This can
be attributed to further delocalization, or increased length, of the triplet exciton as the
PAO core is expanded, which shifts the absorbance to lower energies and also
enhances band broadening. Again, the spectral absorbance at max~ 480 nm is
consistent with the absorbance spectra of the NDI- previously reported by Wasielewski
et al.163
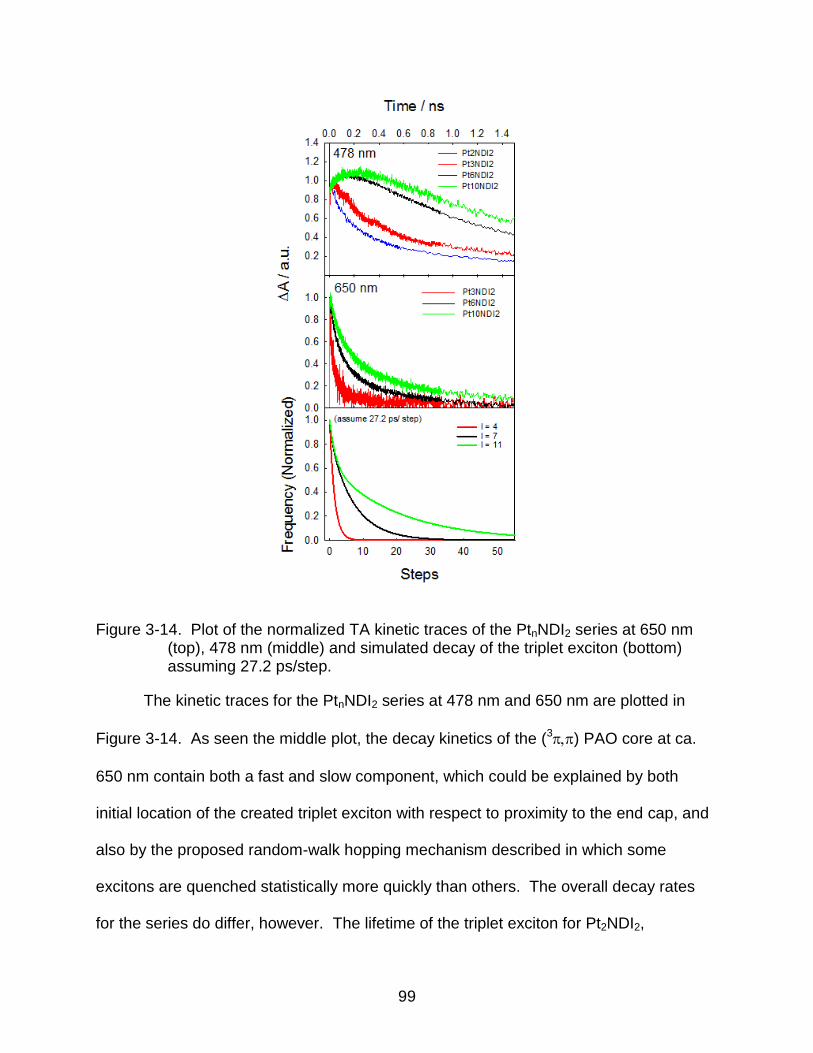
99
Figure 3-14. Plot of the normalized TA kinetic traces of the PtnNDI2 series at 650 nm (top), 478 nm (middle) and simulated decay of the triplet exciton (bottom) assuming 27.2 ps/step.
The kinetic traces for the PtnNDI2 series at 478 nm and 650 nm are plotted in
Figure 3-14. As seen the middle plot, the decay kinetics of the (3) PAO core at ca.
650 nm contain both a fast and slow component, which could be explained by both
initial location of the created triplet exciton with respect to proximity to the end cap, and
also by the proposed random-walk hopping mechanism described in which some
excitons are quenched statistically more quickly than others. The overall decay rates
for the series do differ, however. The lifetime of the triplet exciton for Pt2NDI2,
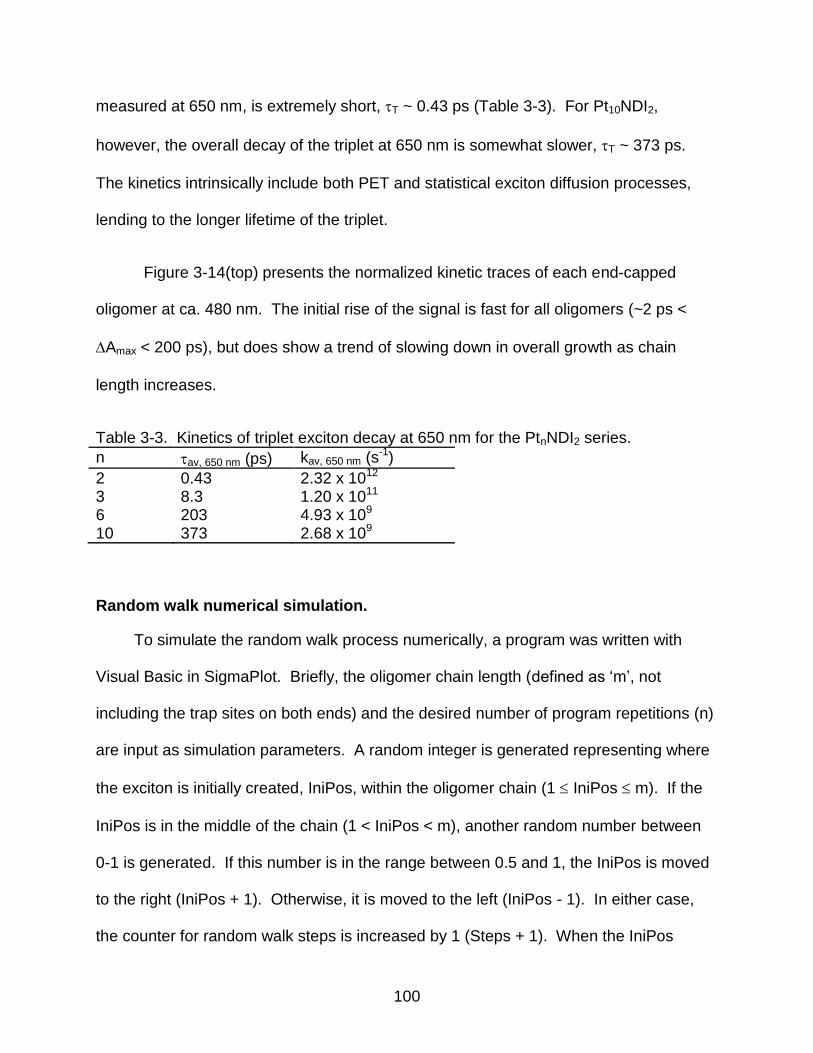
100
measured at 650 nm, is extremely short, T ~ 0.43 ps (Table 3-3). For Pt10NDI2,
however, the overall decay of the triplet at 650 nm is somewhat slower, T ~ 373 ps.
The kinetics intrinsically include both PET and statistical exciton diffusion processes,
lending to the longer lifetime of the triplet.
Figure 3-14(top) presents the normalized kinetic traces of each end-capped
oligomer at ca. 480 nm. The initial rise of the signal is fast for all oligomers (~2 ps <
Amax < 200 ps), but does show a trend of slowing down in overall growth as chain
length increases.
Table 3-3. Kinetics of triplet exciton decay at 650 nm for the PtnNDI2 series.
n av, 650 nm (ps) kav, 650 nm (s-1)
2 0.43 2.32 x 10¹²
3 8.3 1.20 x 10¹¹
6 203 4.93 x 10⁹
10 373 2.68 x 10⁹
Random walk numerical simulation.
To simulate the random walk process numerically, a program was written with
Visual Basic in SigmaPlot. Briefly, the oligomer chain length (defined as ‗m‘, not
including the trap sites on both ends) and the desired number of program repetitions (n)
are input as simulation parameters. A random integer is generated representing where
the exciton is initially created, IniPos, within the oligomer chain (1 IniPos m). If the
IniPos is in the middle of the chain (1 < IniPos < m), another random number between
0-1 is generated. If this number is in the range between 0.5 and 1, the IniPos is moved
to the right (IniPos + 1). Otherwise, it is moved to the left (IniPos - 1). In either case,
the counter for random walk steps is increased by 1 (Steps + 1). When the IniPos
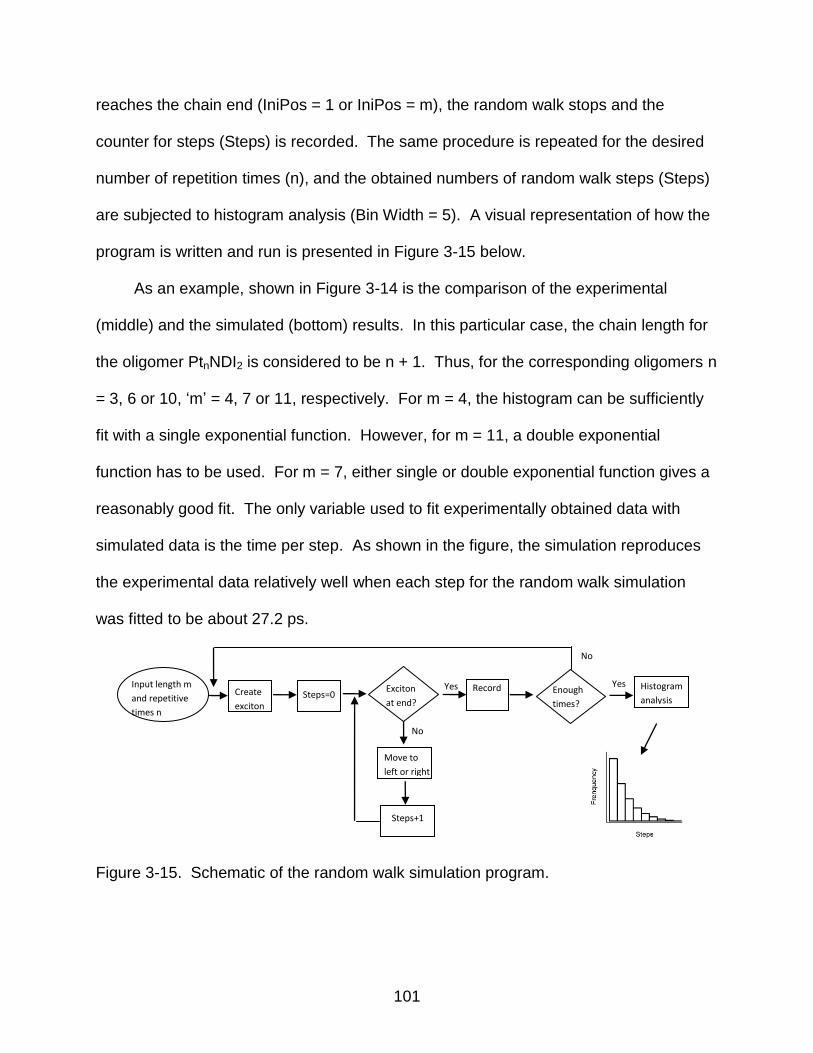
101
reaches the chain end (IniPos = 1 or IniPos = m), the random walk stops and the
counter for steps (Steps) is recorded. The same procedure is repeated for the desired
number of repetition times (n), and the obtained numbers of random walk steps (Steps)
are subjected to histogram analysis (Bin Width = 5). A visual representation of how the
program is written and run is presented in Figure 3-15 below.
As an example, shown in Figure 3-14 is the comparison of the experimental
(middle) and the simulated (bottom) results. In this particular case, the chain length for
the oligomer PtnNDI2 is considered to be n + 1. Thus, for the corresponding oligomers n
= 3, 6 or 10, ‗m‘ = 4, 7 or 11, respectively. For m = 4, the histogram can be sufficiently
fit with a single exponential function. However, for m = 11, a double exponential
function has to be used. For m = 7, either single or double exponential function gives a
reasonably good fit. The only variable used to fit experimentally obtained data with
simulated data is the time per step. As shown in the figure, the simulation reproduces
the experimental data relatively well when each step for the random walk simulation
was fitted to be about 27.2 ps.
No
No
Move to
left or right
Steps+1
Steps=0 Exciton
at end? Yes Record
Steps
Enough
times?
Yes Histogram
analysis Input length m
and repetitive
times n
Create
exciton
Figure 3-15. Schematic of the random walk simulation program.
102
Discussion
States are Concentrated
As discussed previously, optical data obtained from previous studies of the Ptn
series reveal that the polarons in PAOs are spatially confined.108 More specifically,
absorption spectra of the negative polarons generated via pulse radiolysis ionization
techniques for the Ptn series conclude virtually no change in spectra from the Pt2 to Pt7
oligomers; spectra of the Ptn- generated display a characteristic maximum absorption at
540 nm. Similarly, the triplet exciton of the Ptn series was found to be spatially
concentrated between two platinum atoms; this conclusion was based on similar 3*
phosphorescence emission energies (ca. 520 nm) throughout the series, as well as very
similar triplet-triplet absorption energies (ca. 650 nm) regardless of oligomer length.88
The spatial confinement of these states exists due to lattice polarization, or
structural deformities, within the backbone that disrupt conjugation along the chains.
Density functional calculations of both the triplet exciton and negative polaron of Pt2
revealed differences in minimal energy geometries between the ground state species
and the exciton or polaron states that contribute to the localization of these states.104,108
Specifically, the lowest energy geometry of the ground state exists with all phenyl
groups of Pt2 in the plane perpendicular to the square planar platinum atoms (as
discussed previously); the minimum energy geometry of the negative polaron was
calculated with all phenyl moieties parallel to this plane. The calculated barrier to
rotation of the phenyl ring in the radical anion species was estimated to be ~ 15
kcal/mol. The calculated geometry energy minimum for the triplet exciton exists with
only the center phenylene unit in plane; barrier to rotation was estimated to be ~ 3.1
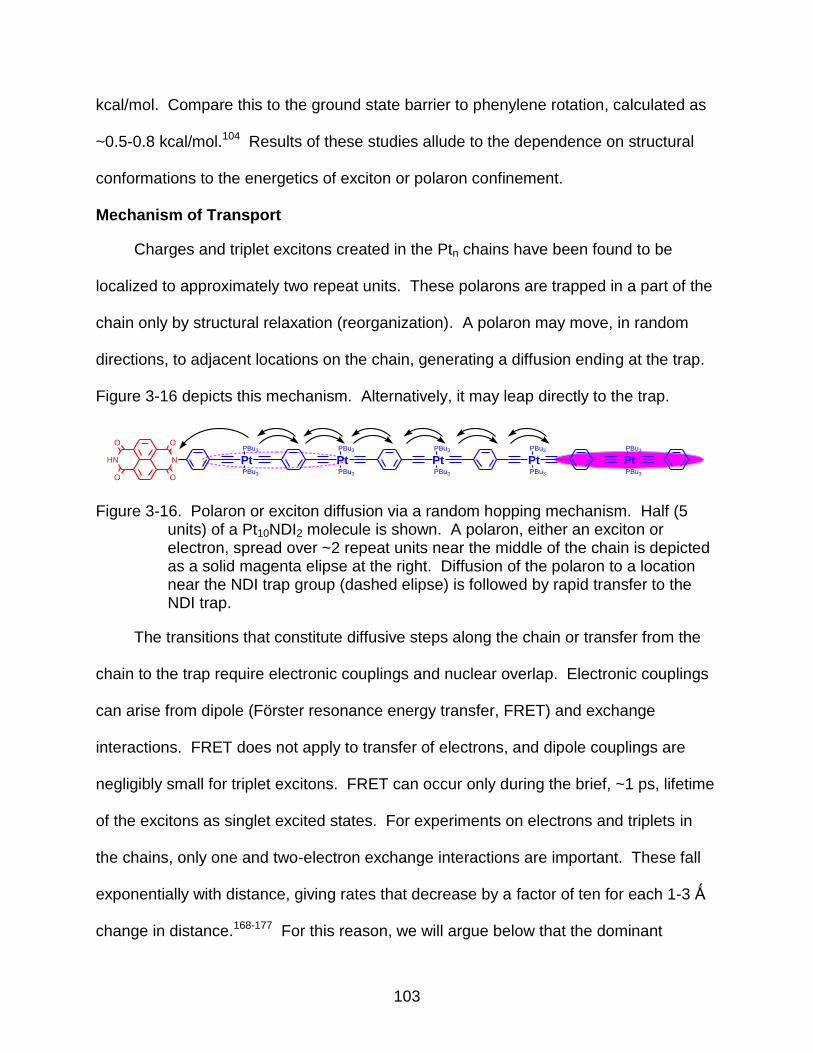
103
kcal/mol. Compare this to the ground state barrier to phenylene rotation, calculated as
~0.5-0.8 kcal/mol.104 Results of these studies allude to the dependence on structural
conformations to the energetics of exciton or polaron confinement.
Mechanism of Transport
Charges and triplet excitons created in the Ptn chains have been found to be
localized to approximately two repeat units. These polarons are trapped in a part of the
chain only by structural relaxation (reorganization). A polaron may move, in random
directions, to adjacent locations on the chain, generating a diffusion ending at the trap.
Figure 3-16 depicts this mechanism. Alternatively, it may leap directly to the trap.
PtPBu3
PBu3
NHN
O
O O
O
PtPBu3
PBu3
PtPBu3
PBu3
PtPBu3
PBu3
PtPBu3
PBu3
Figure 3-16. Polaron or exciton diffusion via a random hopping mechanism. Half (5 units) of a Pt10NDI2 molecule is shown. A polaron, either an exciton or electron, spread over ~2 repeat units near the middle of the chain is depicted as a solid magenta elipse at the right. Diffusion of the polaron to a location near the NDI trap group (dashed elipse) is followed by rapid transfer to the NDI trap.
The transitions that constitute diffusive steps along the chain or transfer from the
chain to the trap require electronic couplings and nuclear overlap. Electronic couplings
can arise from dipole (Förster resonance energy transfer, FRET) and exchange
interactions. FRET does not apply to transfer of electrons, and dipole couplings are
negligibly small for triplet excitons. FRET can occur only during the brief, ~1 ps, lifetime
of the excitons as singlet excited states. For experiments on electrons and triplets in
the chains, only one and two-electron exchange interactions are important. These fall
exponentially with distance, giving rates that decrease by a factor of ten for each 1-3 Ǻ
change in distance.168-177 For this reason, we will argue below that the dominant
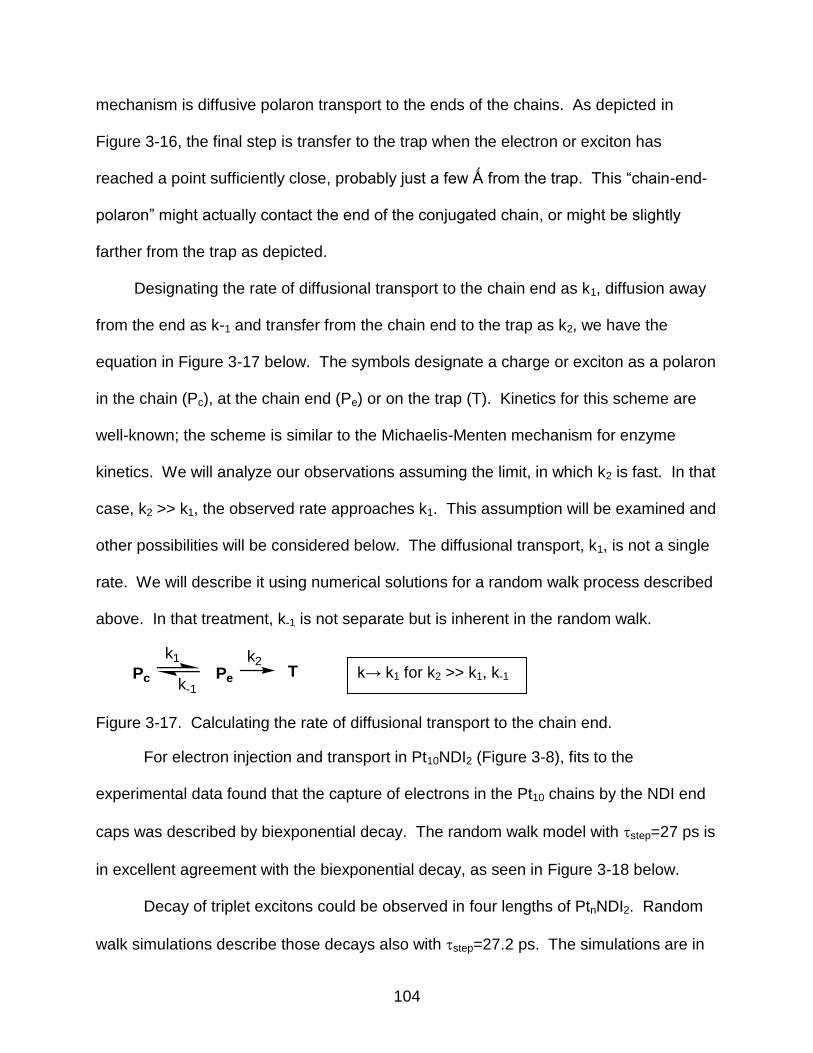
104
mechanism is diffusive polaron transport to the ends of the chains. As depicted in
Figure 3-16, the final step is transfer to the trap when the electron or exciton has
reached a point sufficiently close, probably just a few Ǻ from the trap. This ―chain-end-
polaron‖ might actually contact the end of the conjugated chain, or might be slightly
farther from the trap as depicted.
Designating the rate of diffusional transport to the chain end as k1, diffusion away
from the end as k-1 and transfer from the chain end to the trap as k2, we have the
equation in Figure 3-17 below. The symbols designate a charge or exciton as a polaron
in the chain (Pc), at the chain end (Pe) or on the trap (T). Kinetics for this scheme are
well-known; the scheme is similar to the Michaelis-Menten mechanism for enzyme
kinetics. We will analyze our observations assuming the limit, in which k2 is fast. In that
case, k2 >> k1, the observed rate approaches k1. This assumption will be examined and
other possibilities will be considered below. The diffusional transport, k1, is not a single
rate. We will describe it using numerical solutions for a random walk process described
above. In that treatment, k-1 is not separate but is inherent in the random walk.
Pc Pe
k1
k-1
k2T
Figure 3-17. Calculating the rate of diffusional transport to the chain end.
For electron injection and transport in Pt10NDI2 (Figure 3-8), fits to the
experimental data found that the capture of electrons in the Pt10 chains by the NDI end
caps was described by biexponential decay. The random walk model with step=27 ps is
in excellent agreement with the biexponential decay, as seen in Figure 3-18 below.
Decay of triplet excitons could be observed in four lengths of PtnNDI2. Random
walk simulations describe those decays also with step=27.2 ps. The simulations are in
k→ k1 for k2 >> k1, k-1
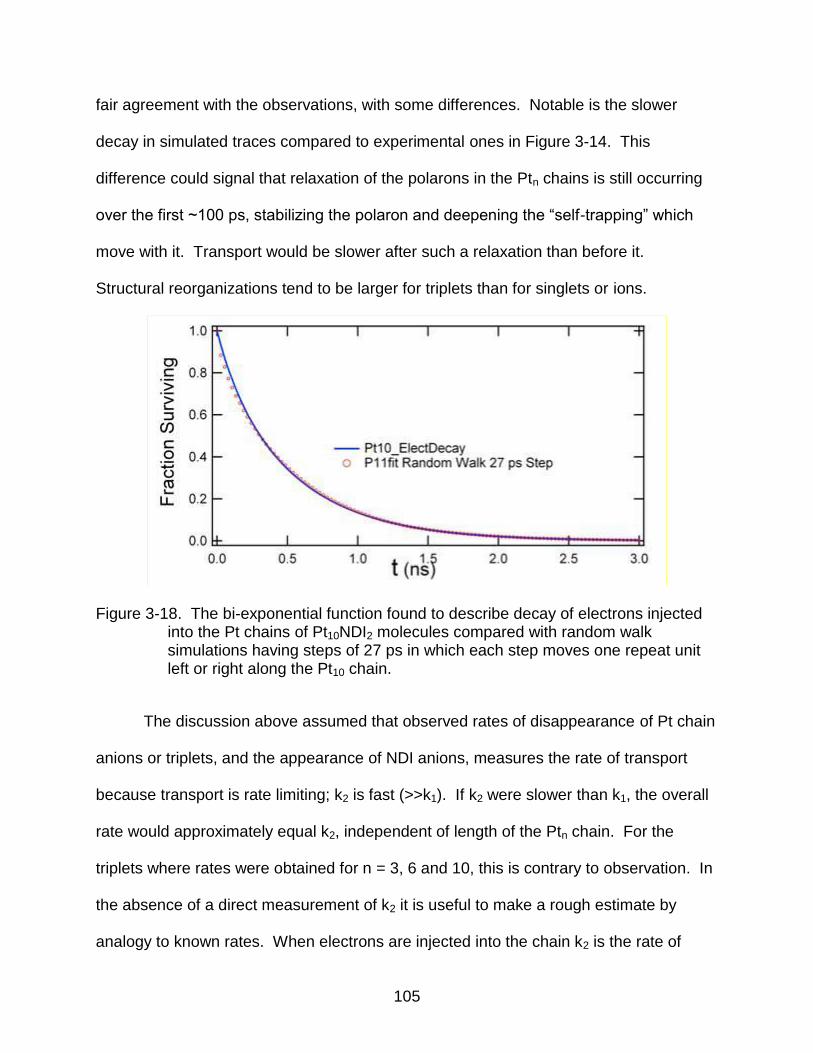
105
fair agreement with the observations, with some differences. Notable is the slower
decay in simulated traces compared to experimental ones in Figure 3-14. This
difference could signal that relaxation of the polarons in the Ptn chains is still occurring
over the first ~100 ps, stabilizing the polaron and deepening the ―self-trapping‖ which
move with it. Transport would be slower after such a relaxation than before it.
Structural reorganizations tend to be larger for triplets than for singlets or ions.
Figure 3-18. The bi-exponential function found to describe decay of electrons injected into the Pt chains of Pt10NDI2 molecules compared with random walk simulations having steps of 27 ps in which each step moves one repeat unit left or right along the Pt10 chain.
The discussion above assumed that observed rates of disappearance of Pt chain
anions or triplets, and the appearance of NDI anions, measures the rate of transport
because transport is rate limiting; k2 is fast (>>k1). If k2 were slower than k1, the overall
rate would approximately equal k2, independent of length of the Ptn chain. For the
triplets where rates were obtained for n = 3, 6 and 10, this is contrary to observation. In
the absence of a direct measurement of k2 it is useful to make a rough estimate by
analogy to known rates. When electrons are injected into the chain k2 is the rate of
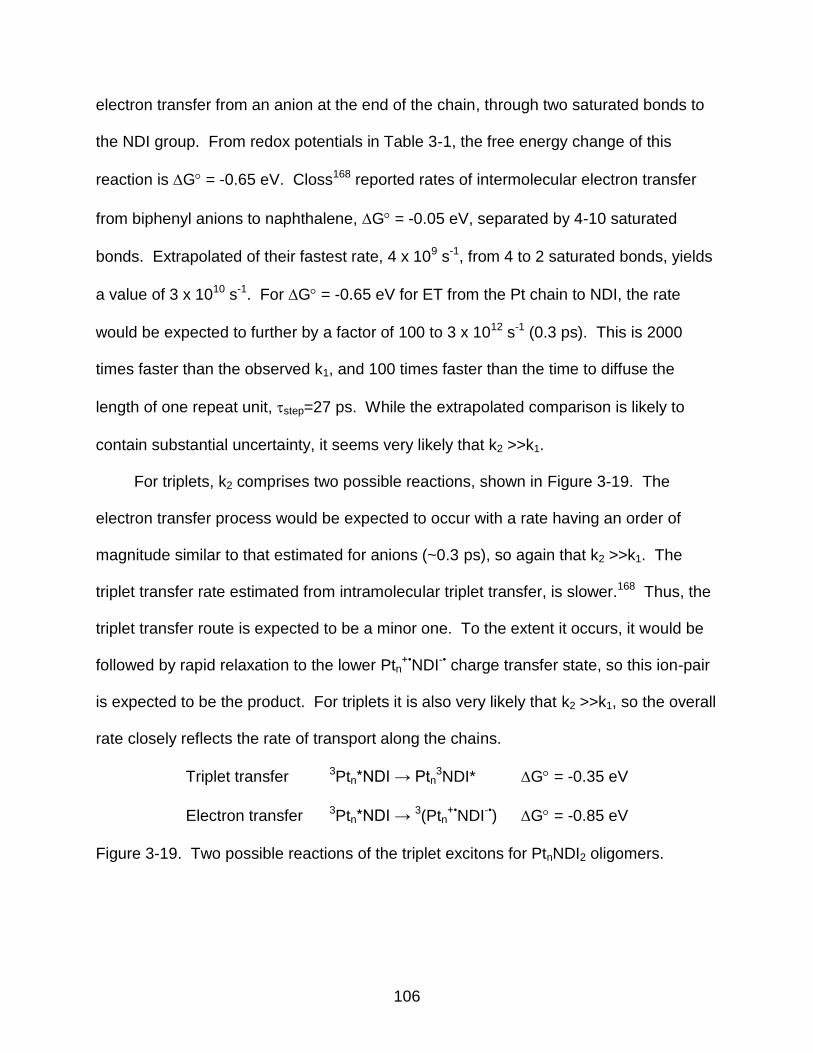
106
electron transfer from an anion at the end of the chain, through two saturated bonds to
the NDI group. From redox potentials in Table 3-1, the free energy change of this
reaction is G= -0.65 eV. Closs168 reported rates of intermolecular electron transfer
from biphenyl anions to naphthalene, G= -0.05 eV, separated by 4-10 saturated
bonds. Extrapolated of their fastest rate, 4 x 10⁹ s-1, from 4 to 2 saturated bonds, yields
a value of 3 x 10¹⁰ s-1. For G= -0.65 eV for ET from the Pt chain to NDI, the rate
would be expected to further by a factor of 100 to 3 x 10¹² s-1 (0.3 ps). This is 2000
times faster than the observed k1, and 100 times faster than the time to diffuse the
length of one repeat unit, step=27 ps. While the extrapolated comparison is likely to
contain substantial uncertainty, it seems very likely that k2 >>k1.
For triplets, k2 comprises two possible reactions, shown in Figure 3-19. The
electron transfer process would be expected to occur with a rate having an order of
magnitude similar to that estimated for anions (~0.3 ps), so again that k2 >>k1. The
triplet transfer rate estimated from intramolecular triplet transfer, is slower.168 Thus, the
triplet transfer route is expected to be a minor one. To the extent it occurs, it would be
followed by rapid relaxation to the lower Ptn+•NDI-• charge transfer state, so this ion-pair
is expected to be the product. For triplets it is also very likely that k2 >>k1, so the overall
rate closely reflects the rate of transport along the chains.
Triplet transfer 3Ptn*NDI → Ptn3NDI* G = -0.35 eV
Electron transfer 3Ptn*NDI → 3(Ptn+•NDI-•) G = -0.85 eV
Figure 3-19. Two possible reactions of the triplet excitons for PtnNDI2 oligomers.
107
Conclusion
Variable temperature steady-state emission studies, pulse radiolysis experiments
and ultrafast transient absorption measurements were applied to examine the transport
mechanism and dynamics of negative polaron and triplet exciton states in the PtnNDI2
series. Pulse radiolysis experiments were applied to measure the rate of negative
polaron diffusion within the series. While OFSS data obtained for growth kinetics in the
480 nm region was not quantitative (due to concentration issues as well as experimental
limitations with OFSS), the biexponential decay data at 540 nm fit well with random-walk
simulation data suggesting the time per ‗step‘ of the negative polaron in the Pt-acetylide
chain is about 27 ps. This data infers a fast ET from a chain-end polaron to the endcap
and a slower, rate-determining diffusion of the negative polaron within the chain.
Emission spectra for the series at low temperatures (below the glass transition for
Me-THF) revealed recovery of the phosphorescence in the n = 6 and 10 oligomers and
not the n=2 or 3 oligomers. This data demonstrated the effective population of the
triplet via ISC, and results implied the necessity of structural reorganization within the
backbone of the oligomer for triplet exciton diffusion to occur. This was not necessary
for PET processes to occur, as quenching of the triplet was evident for the short-
chained oligomers even in the glass state of the solvent. This data provided evidence
that PET is fast compared to the triplet exciton diffusion, which is rate-determining in the
quenching process.
Ultrafast transient absorption measurements also confirmed population of the
triplet exciton via absorption at ca. 650 nm. The decay of this state was found to be
biexponential: the fast component is suggested to be PET from a triplet exciton at the
chain end directly connected to the NDI trap, whereas the slow component consists of

108
random exciton diffusion toward the chain end. When compared to simulated random-
walk decay data, a lifetime of ~27.2 ps/step for the triplet exciton was extrapolated. This
is the first known report of intramolecular negative polaron or exciton hopping rates in
platinum acetylide materials.
109
CHAPTER 4 SYNTHESIS AND PHOTOPHYSICS OF PLATINUM CAPPED PHENYLENE
ETHYNYLENE OLIGOMERS
Introduction
There has been a wide range of platinum acetylide structures reported in the
literature, including oligomers, polymers, and dendrimers, used for many different
optical and electronic applications owing to the unique photophysical properties of these
materials. In general, the key aspect toward the advancement of materials applications
is to define distinct relationships between chemical structure and spectroscopic
properties. The nature of the structure-property relationship is also fundamentally
important in understanding the interaction of light with matter and the information that
can be elicited from experiments. One such issue is the relationship between structure
and the delocalization of the singlet and triplet excitons.
As discussed previously, our group has recently focused on studying
delocalization of the singlet and triplet states of platinum acetylide oligomers.88 It was
found that ground state absorbance and fluorescence properties are dependent on the
length of the material, as these states are defined as being delocalized through the
metal-organic framework. The triplet state, however, was concluded to be confined,
and the properties of this state change very little in relation to changes in the length of
the Pt-acetylide.
Most of the studies investigating extended pi conjugation in the organic ligands of
platinum acetylide oligomers focus on a single platinum atom and various ligands, or
oligomers and polymers with identical repeat units; the understanding of delocalization
in excited states is therefore limited. One example of such is a set of studies reported
by Cooper and Rogers, et al.77,87,178-182 Symmetrically substituted, mono-substituted
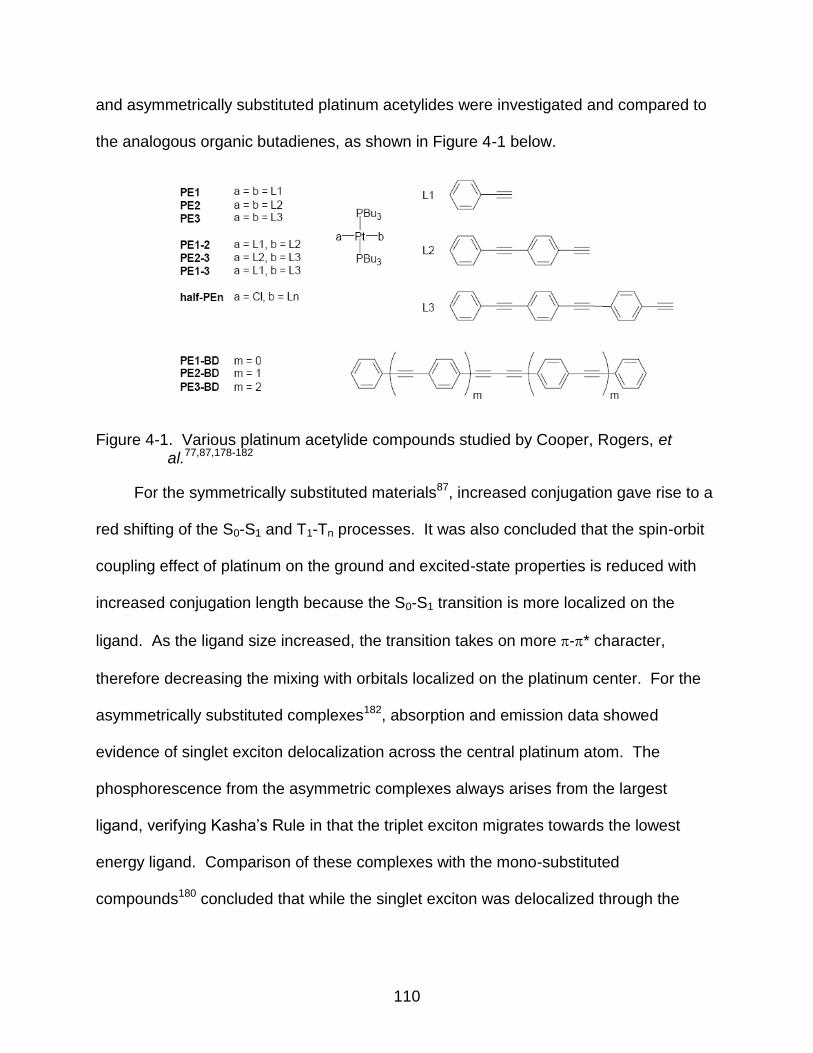
110
and asymmetrically substituted platinum acetylides were investigated and compared to
the analogous organic butadienes, as shown in Figure 4-1 below.
Figure 4-1. Various platinum acetylide compounds studied by Cooper, Rogers, et al.77,87,178-182
For the symmetrically substituted materials87, increased conjugation gave rise to a
red shifting of the S0-S1 and T1-Tn processes. It was also concluded that the spin-orbit
coupling effect of platinum on the ground and excited-state properties is reduced with
increased conjugation length because the S0-S1 transition is more localized on the
ligand. As the ligand size increased, the transition takes on more -* character,
therefore decreasing the mixing with orbitals localized on the platinum center. For the
asymmetrically substituted complexes182, absorption and emission data showed
evidence of singlet exciton delocalization across the central platinum atom. The
phosphorescence from the asymmetric complexes always arises from the largest
ligand, verifying Kasha‘s Rule in that the triplet exciton migrates towards the lowest
energy ligand. Comparison of these complexes with the mono-substituted
compounds180 concluded that while the singlet exciton was delocalized through the
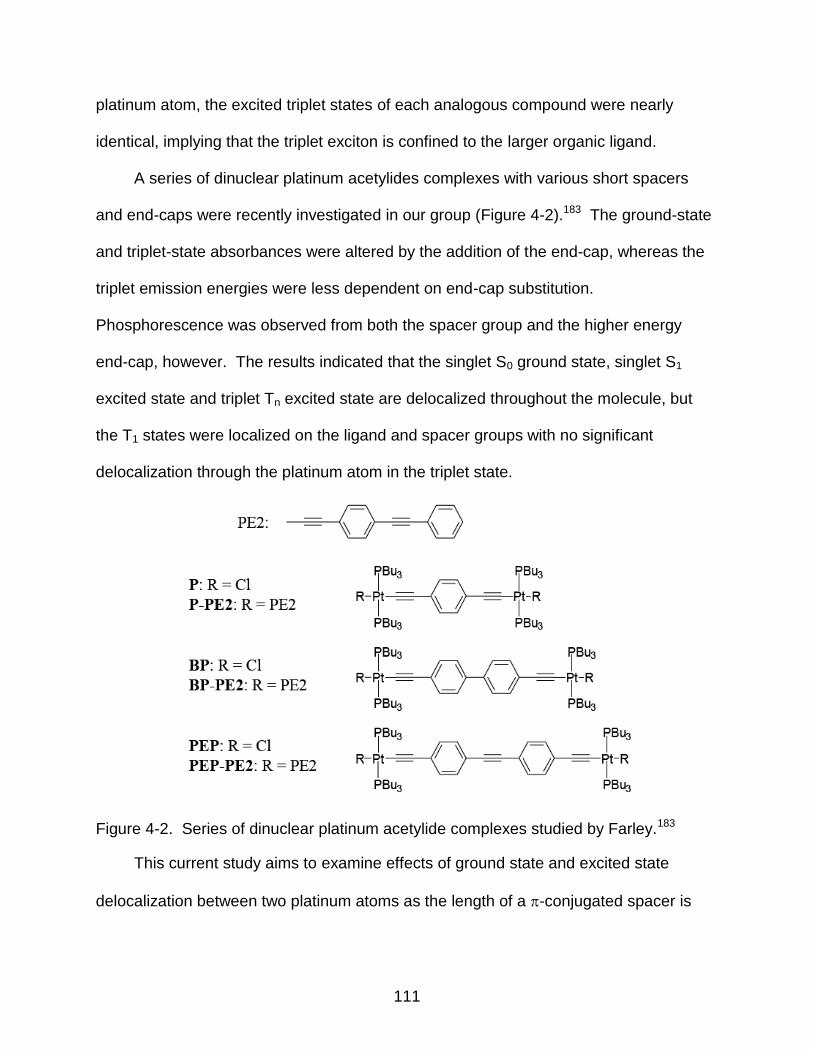
111
platinum atom, the excited triplet states of each analogous compound were nearly
identical, implying that the triplet exciton is confined to the larger organic ligand.
A series of dinuclear platinum acetylides complexes with various short spacers
and end-caps were recently investigated in our group (Figure 4-2).183 The ground-state
and triplet-state absorbances were altered by the addition of the end-cap, whereas the
triplet emission energies were less dependent on end-cap substitution.
Phosphorescence was observed from both the spacer group and the higher energy
end-cap, however. The results indicated that the singlet S0 ground state, singlet S1
excited state and triplet Tn excited state are delocalized throughout the molecule, but
the T1 states were localized on the ligand and spacer groups with no significant
delocalization through the platinum atom in the triplet state.
Figure 4-2. Series of dinuclear platinum acetylide complexes studied by Farley.183
This current study aims to examine effects of ground state and excited state
delocalization between two platinum atoms as the length of a -conjugated spacer is
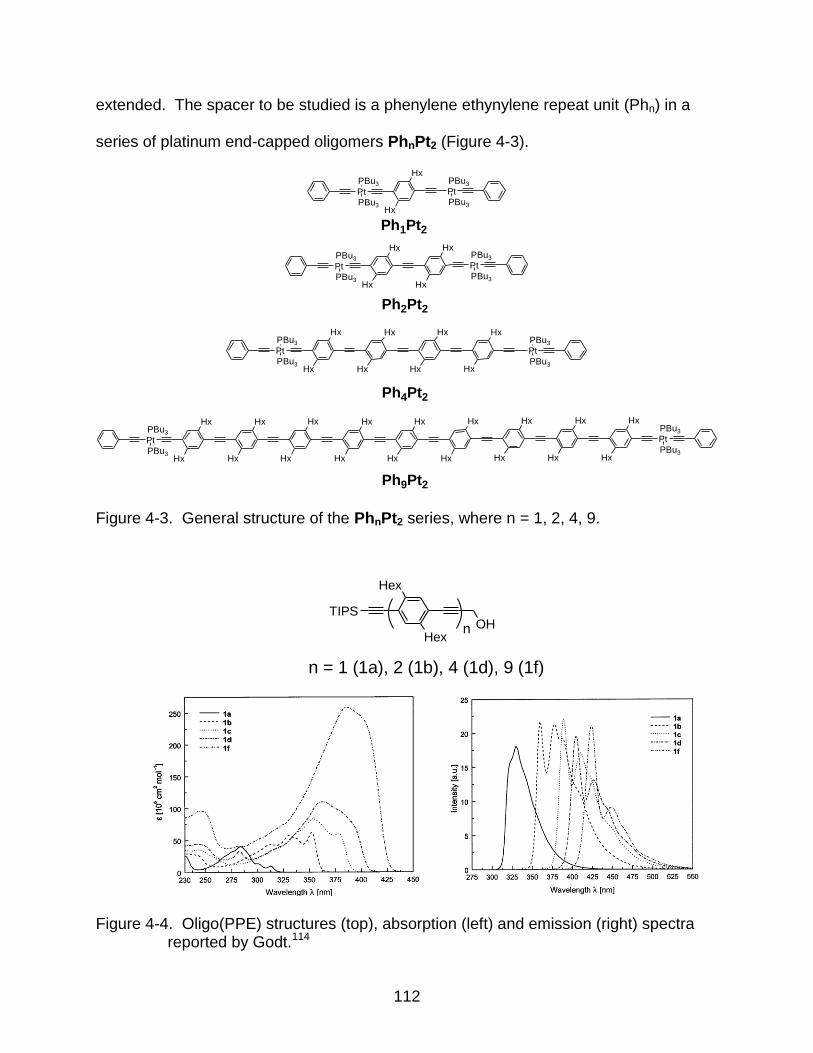
112
extended. The spacer to be studied is a phenylene ethynylene repeat unit (Phn) in a
series of platinum end-capped oligomers PhnPt2 (Figure 4-3).
Hx
Hx
Hx
Hx
Hx
Hx
Hx
Hx
Hx
Hx
Pt
PBu3
PBu3
Pt
PBu3
PBu3
Hx
Hx
Hx
Hx
Hx
Hx
Hx
Hx
Hx
Hx
Hx
Hx
Pt
PBu3
PBu3
Pt
PBu3
PBu3
Hx
Hx
Hx
Hx
PtPBu3
PBu3
Pt
PBu3
PBu3
Hx
Hx
Hx
Hx
Pt
PBu3
PBu3
Hx
Hx
Pt
PBu3
PBu3
Ph1Pt2
Ph2Pt2
Ph4Pt2
Ph9Pt2
Figure 4-3. General structure of the PhnPt2 series, where n = 1, 2, 4, 9.
Hex
HexOH
TIPS
n
n = 1 (1a), 2 (1b), 4 (1d), 9 (1f)
Figure 4-4. Oligo(PPE) structures (top), absorption (left) and emission (right) spectra reported by Godt.114
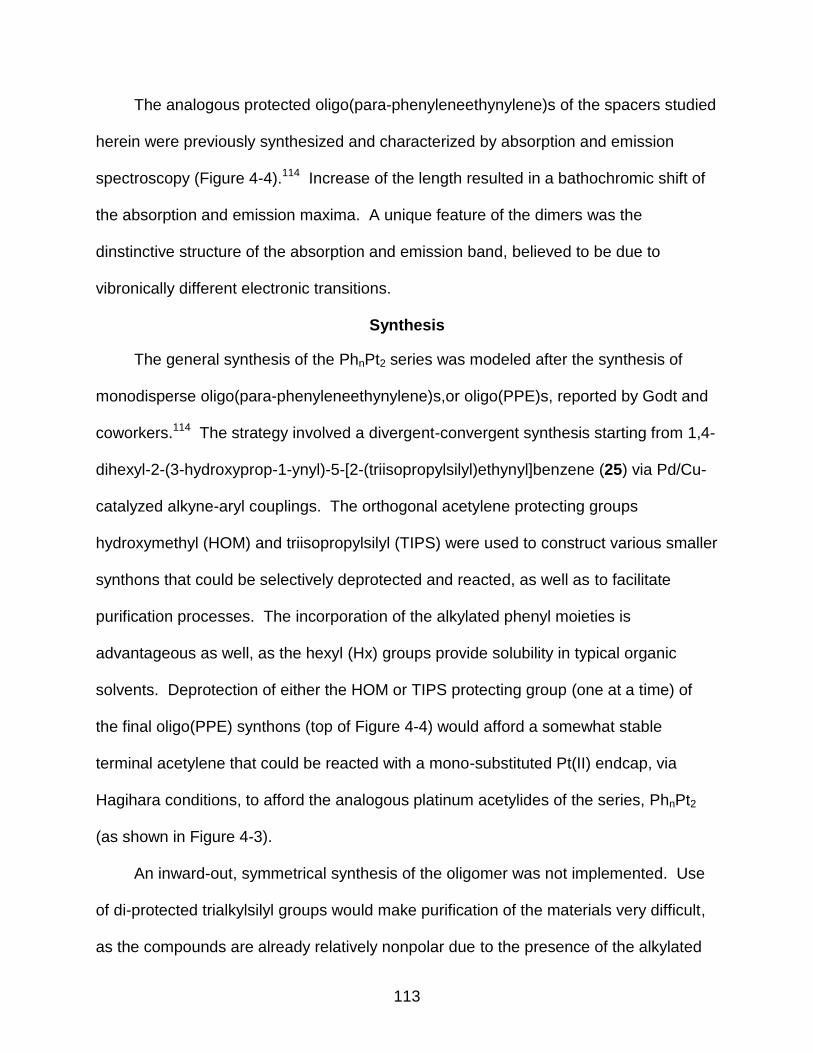
113
The analogous protected oligo(para-phenyleneethynylene)s of the spacers studied
herein were previously synthesized and characterized by absorption and emission
spectroscopy (Figure 4-4).114 Increase of the length resulted in a bathochromic shift of
the absorption and emission maxima. A unique feature of the dimers was the
dinstinctive structure of the absorption and emission band, believed to be due to
vibronically different electronic transitions.
Synthesis
The general synthesis of the PhnPt2 series was modeled after the synthesis of
monodisperse oligo(para-phenyleneethynylene)s,or oligo(PPE)s, reported by Godt and
coworkers.114 The strategy involved a divergent-convergent synthesis starting from 1,4-
dihexyl-2-(3-hydroxyprop-1-ynyl)-5-[2-(triisopropylsilyl)ethynyl]benzene (25) via Pd/Cu-
catalyzed alkyne-aryl couplings. The orthogonal acetylene protecting groups
hydroxymethyl (HOM) and triisopropylsilyl (TIPS) were used to construct various smaller
synthons that could be selectively deprotected and reacted, as well as to facilitate
purification processes. The incorporation of the alkylated phenyl moieties is
advantageous as well, as the hexyl (Hx) groups provide solubility in typical organic
solvents. Deprotection of either the HOM or TIPS protecting group (one at a time) of
the final oligo(PPE) synthons (top of Figure 4-4) would afford a somewhat stable
terminal acetylene that could be reacted with a mono-substituted Pt(II) endcap, via
Hagihara conditions, to afford the analogous platinum acetylides of the series, PhnPt2
(as shown in Figure 4-3).
An inward-out, symmetrical synthesis of the oligomer was not implemented. Use
of di-protected trialkylsilyl groups would make purification of the materials very difficult,
as the compounds are already relatively nonpolar due to the presence of the alkylated
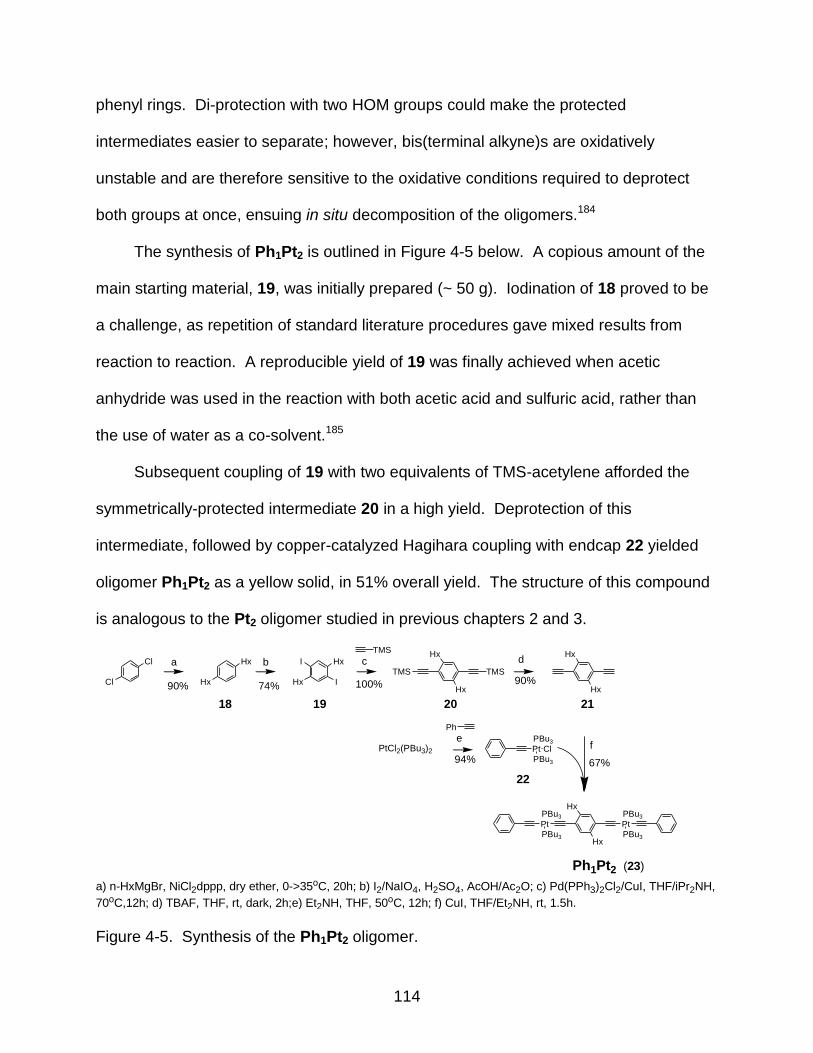
114
phenyl rings. Di-protection with two HOM groups could make the protected
intermediates easier to separate; however, bis(terminal alkyne)s are oxidatively
unstable and are therefore sensitive to the oxidative conditions required to deprotect
both groups at once, ensuing in situ decomposition of the oligomers.184
The synthesis of Ph1Pt2 is outlined in Figure 4-5 below. A copious amount of the
main starting material, 19, was initially prepared (~ 50 g). Iodination of 18 proved to be
a challenge, as repetition of standard literature procedures gave mixed results from
reaction to reaction. A reproducible yield of 19 was finally achieved when acetic
anhydride was used in the reaction with both acetic acid and sulfuric acid, rather than
the use of water as a co-solvent.185
Subsequent coupling of 19 with two equivalents of TMS-acetylene afforded the
symmetrically-protected intermediate 20 in a high yield. Deprotection of this
intermediate, followed by copper-catalyzed Hagihara coupling with endcap 22 yielded
oligomer Ph1Pt2 as a yellow solid, in 51% overall yield. The structure of this compound
is analogous to the Pt2 oligomer studied in previous chapters 2 and 3.
Cl
Cl Hx
Hx
Hx
HxI
I
Hx
Hx
TMSTMS
Hx
Hx
PtCl2(PBu3)2 Pt Cl
PBu3
PBu3
Hx
Hx
Pt Pt
PBu3
PBu3
PBu3
PBu3
Ph1Pt2
a
90% 74%
TMS
a) n-HxMgBr, NiCl2dppp, dry ether, 0->35oC, 20h; b) I2/NaIO4, H2SO4, AcOH/Ac2O; c) Pd(PPh3)2Cl2/CuI, THF/iPr2NH,
70oC,12h; d) TBAF, THF, rt, dark, 2h;e) Et2NH, THF, 50oC, 12h; f) CuI, THF/Et2NH, rt, 1.5h.
b c d
100% 90%
e
94%
Ph
f
67%
18 19 20 21
22
(23)
Figure 4-5. Synthesis of the Ph1Pt2 oligomer.
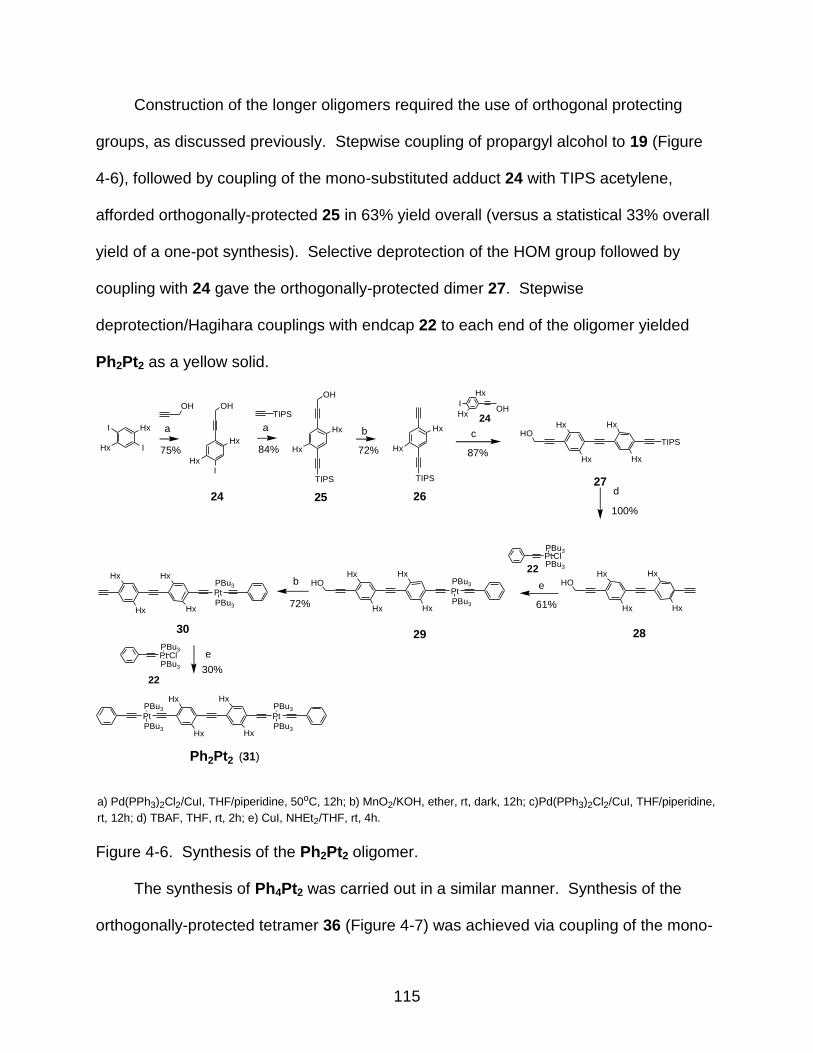
115
Construction of the longer oligomers required the use of orthogonal protecting
groups, as discussed previously. Stepwise coupling of propargyl alcohol to 19 (Figure
4-6), followed by coupling of the mono-substituted adduct 24 with TIPS acetylene,
afforded orthogonally-protected 25 in 63% yield overall (versus a statistical 33% overall
yield of a one-pot synthesis). Selective deprotection of the HOM group followed by
coupling with 24 gave the orthogonally-protected dimer 27. Stepwise
deprotection/Hagihara couplings with endcap 22 to each end of the oligomer yielded
Ph2Pt2 as a yellow solid.
Hx
Hx
I
OH
Hx
Hx
OH
TIPS
Hx
Hx
TIPS
Hx
Hx
IOH
Hx
HxHO
TIPSHx
HxI
I
Hx
HxHO
Hx
HxHO
Pt
PBu3
PBu3
Hx
Hx
PtPBu3
PBu3
Hx
Hx
Pt
PBu3
PBu3
Pt
PBu3
PBu3
Ph2Pt2
a ba
OHTIPS
75% 84% 72%
c
87%
100%
d
Hx
Hx
Hx
Hx61%
eb
72%
e
30%
PtClPBu3
PBu3
Pt ClPBu3
PBu3
Hx
Hx
Hx
Hx
Hx
Hx
24 25 26
27
22
282930
(31)
24
22
a) Pd(PPh3)2Cl2/CuI, THF/piperidine, 50oC, 12h; b) MnO2/KOH, ether, rt, dark, 12h; c)Pd(PPh3)2Cl2/CuI, THF/piperidine,
rt, 12h; d) TBAF, THF, rt, 2h; e) CuI, NHEt2/THF, rt, 4h.
Figure 4-6. Synthesis of the Ph2Pt2 oligomer.
The synthesis of Ph4Pt2 was carried out in a similar manner. Synthesis of the
orthogonally-protected tetramer 36 (Figure 4-7) was achieved via coupling of the mono-
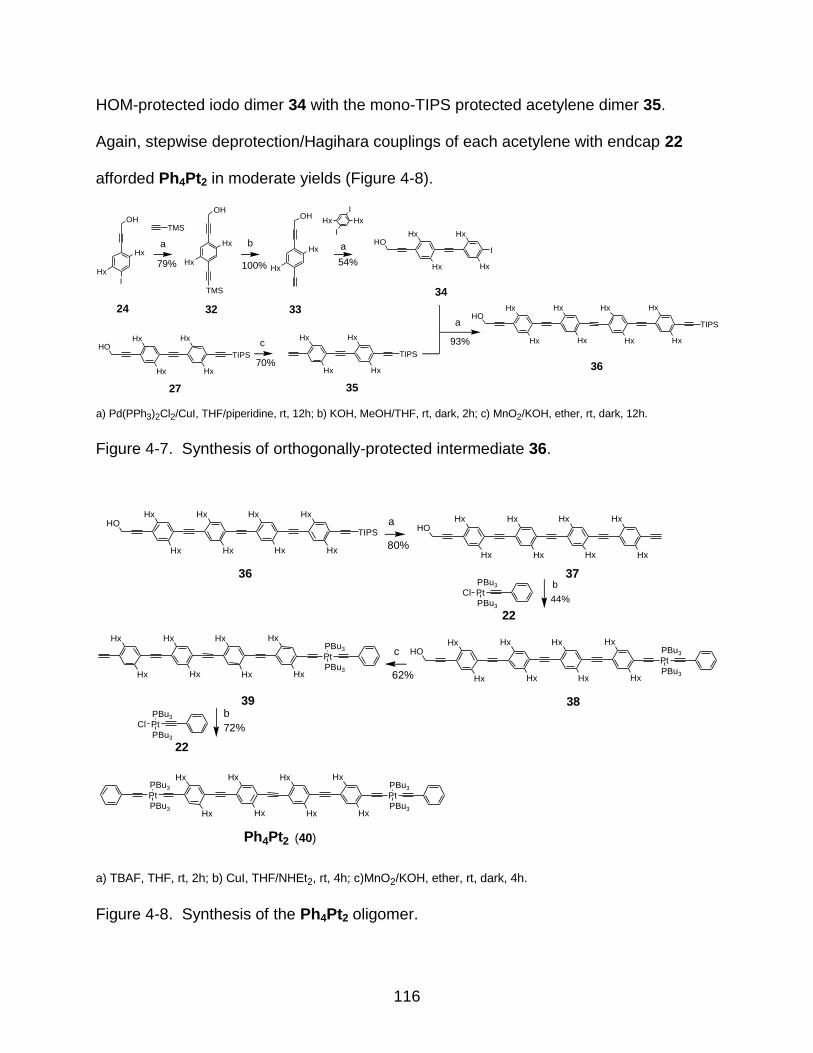
116
HOM-protected iodo dimer 34 with the mono-TIPS protected acetylene dimer 35.
Again, stepwise deprotection/Hagihara couplings of each acetylene with endcap 22
afforded Ph4Pt2 in moderate yields (Figure 4-8).
Hx
Hx
OH
TMS
Hx
HxHO
I
Hx
Hx
OH
Hx
Hx
I
OH
Hx
HxHO
TIPS
Hx
Hx
TIPS
Hx
HxHO
Hx
Hx
TIPS
a b a
c
a
a) Pd(PPh3)2Cl2/CuI, THF/piperidine, rt, 12h; b) KOH, MeOH/THF, rt, dark, 2h; c) MnO2/KOH, ether, rt, dark, 12h.
79% 100% 54%
Hx Hx
I
I
TMS
70%
Hx
Hx
Hx
HxHx
Hx
93%Hx
Hx
24 32 33
34
27 35
36
Hx
Hx
Figure 4-7. Synthesis of orthogonally-protected intermediate 36.
Hx
Hx
Hx
Hx
Pt
PBu3
PBu3
Hx
HxHO
Hx
Hx
TIPS
Hx
HxHO
Hx
Hx
Hx
HxHO
Hx
Hx
PtPBu3
PBu3
Hx
Hx
Hx
Hx
Pt
PBu3
PBu3
Pt
PBu3
PBu3
Ph4Pt2
Hx
Hx
Hx
Hx
Hx
Hx
Hx
Hx
Hx
Hx
Hx
Hx
Hx
Hx
Hx
Hx
Hx
Hx
Hx
Hx
a
b
c
b
62%
72%
80%
a) TBAF, THF, rt, 2h; b) CuI, THF/NHEt2, rt, 4h; c)MnO2/KOH, ether, rt, dark, 4h.
44%
Cl PtPBu3
PBu3
Cl PtPBu3
PBu3
36 37
22
38
22
(40)
39
Figure 4-8. Synthesis of the Ph4Pt2 oligomer.
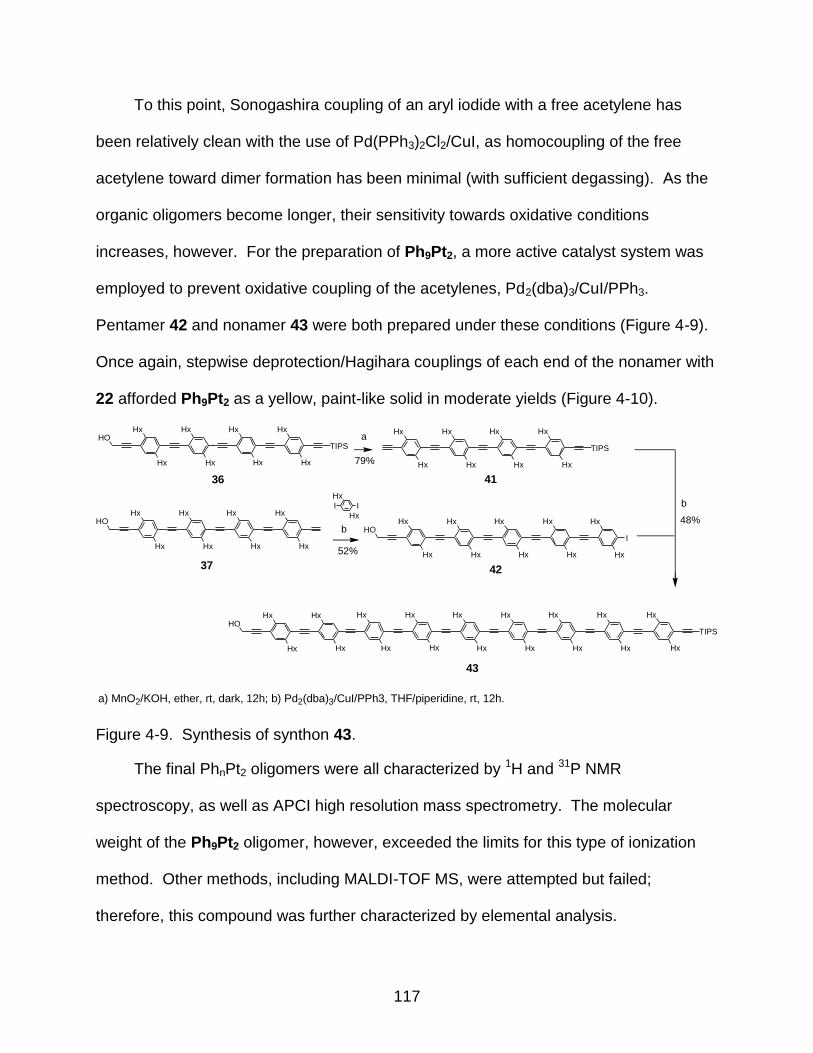
117
To this point, Sonogashira coupling of an aryl iodide with a free acetylene has
been relatively clean with the use of Pd(PPh3)2Cl2/CuI, as homocoupling of the free
acetylene toward dimer formation has been minimal (with sufficient degassing). As the
organic oligomers become longer, their sensitivity towards oxidative conditions
increases, however. For the preparation of Ph9Pt2, a more active catalyst system was
employed to prevent oxidative coupling of the acetylenes, Pd2(dba)3/CuI/PPh3.
Pentamer 42 and nonamer 43 were both prepared under these conditions (Figure 4-9).
Once again, stepwise deprotection/Hagihara couplings of each end of the nonamer with
22 afforded Ph9Pt2 as a yellow, paint-like solid in moderate yields (Figure 4-10).
Hx
Hx
Hx
Hx
TIPS
Hx
Hx
I I
Hx
HxHO
Hx
HxHO
Hx
Hx
TIPS
Hx
Hx
Hx
Hx
Hx
Hx
TIPS
Hx
Hx
Hx
Hx
Hx
Hx
Hx
Hx
Hx
Hx
Hx
Hx
Hx
Hx
Hx
Hx
Hx
Hx
a
Hx
HxHO
Hx
HxHx
Hx
Hx
HxHx
HxHO
Hx
HxHx
Hx
Hx
Hx
I
Hx
Hx
b
b
a) MnO2/KOH, ether, rt, dark, 12h; b) Pd2(dba)3/CuI/PPh3, THF/piperidine, rt, 12h.
36 41
37 42
43
79%
52%
48%
Figure 4-9. Synthesis of synthon 43.
The final PhnPt2 oligomers were all characterized by 1H and 31P NMR
spectroscopy, as well as APCI high resolution mass spectrometry. The molecular
weight of the Ph9Pt2 oligomer, however, exceeded the limits for this type of ionization
method. Other methods, including MALDI-TOF MS, were attempted but failed;
therefore, this compound was further characterized by elemental analysis.
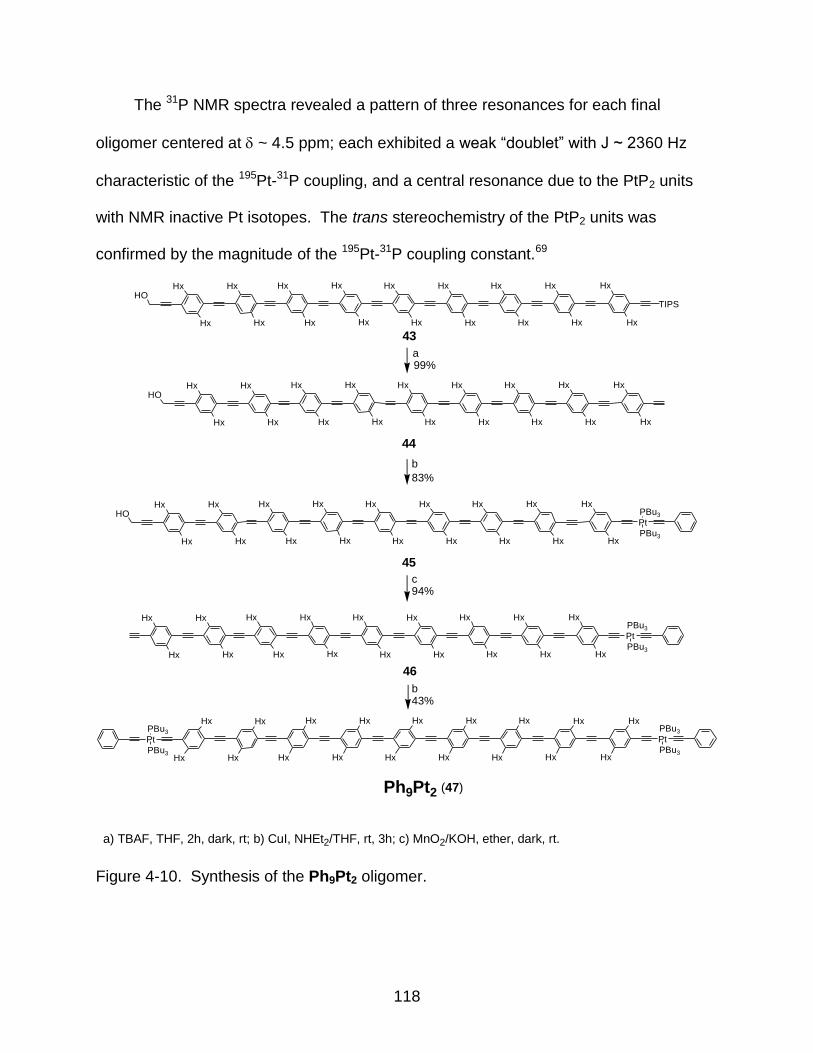
118
The 31P NMR spectra revealed a pattern of three resonances for each final
oligomer centered at ~ 4.5 ppm; each exhibited a weak ―doublet‖ with J ~ 2360 Hz
characteristic of the 195Pt-31P coupling, and a central resonance due to the PtP2 units
with NMR inactive Pt isotopes. The trans stereochemistry of the PtP2 units was
confirmed by the magnitude of the 195Pt-31P coupling constant.69
Hx
HxHO
Hx
Hx
Hx
Hx
Hx
Hx
TIPS
Hx
HxHO
Hx
Hx
Hx
Hx
Hx
Hx
Hx
HxHO
Hx
Hx
Hx
Hx
Hx
Hx
Hx
Hx
Hx
Hx
Hx
Hx
Hx
Hx
Pt
Pt
PBu3
PBu3
PBu3
PBu3
Hx
Hx
Hx
Hx
Hx
Hx
Hx
Hx
Hx
Hx
Pt
PBu3
PBu3
Pt
PBu3
PBu3
Ph9Pt2
Hx
Hx
Hx
Hx
Hx
Hx
Hx
Hx
Hx
Hx
Hx
Hx
Hx
Hx
Hx
Hx
Hx
Hx
Hx
Hx
Hx
Hx
Hx
Hx
Hx
Hx
Hx
Hx
Hx
Hx
a
a) TBAF, THF, 2h, dark, rt; b) CuI, NHEt2/THF, rt, 3h; c) MnO2/KOH, ether, dark, rt.
b
c
b
99%
83%
94%
43%
Hx
Hx
Hx
Hx
Hx
Hx
Hx
Hx
Hx
Hx
Hx
Hx
Hx
Hx
Hx
Hx
Hx
Hx
43
44
45
46
(47)
Figure 4-10. Synthesis of the Ph9Pt2 oligomer.
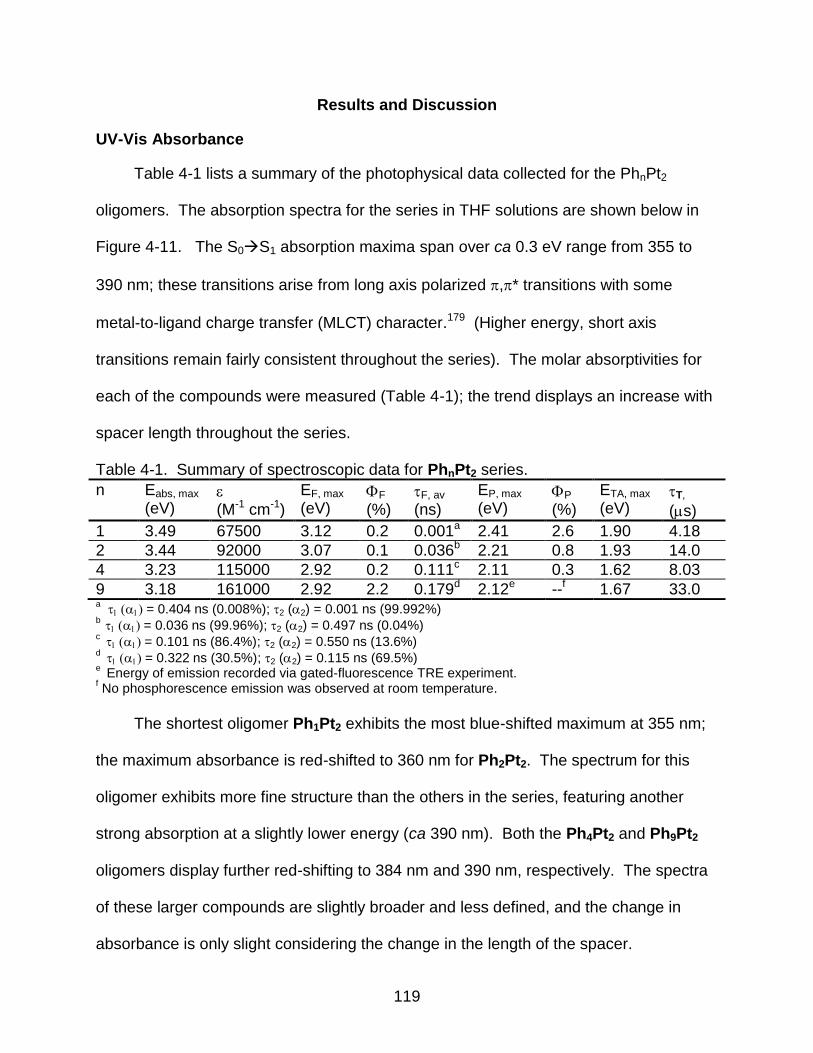
119
Results and Discussion
UV-Vis Absorbance
Table 4-1 lists a summary of the photophysical data collected for the PhnPt2
oligomers. The absorption spectra for the series in THF solutions are shown below in
Figure 4-11. The S0S1 absorption maxima span over ca 0.3 eV range from 355 to
390 nm; these transitions arise from long axis polarized ,* transitions with some
metal-to-ligand charge transfer (MLCT) character.179 (Higher energy, short axis
transitions remain fairly consistent throughout the series). The molar absorptivities for
each of the compounds were measured (Table 4-1); the trend displays an increase with
spacer length throughout the series.
Table 4-1. Summary of spectroscopic data for PhnPt2 series.
n Eabs, max
(eV) (M-1 cm-1)
EF, max (eV)
F (%)
F, av (ns)
EP, max (eV)
P (%)
ETA, max (eV)
T,
(s)
1 3.49 67500 3.12 0.2 0.001a 2.41 2.6 1.90 4.18
2 3.44 92000 3.07 0.1 0.036b 2.21 0.8 1.93 14.0
4 3.23 115000 2.92 0.2 0.111c 2.11 0.3 1.62 8.03
9 3.18 161000 2.92 2.2 0.179d 2.12e --f 1.67 33.0 a = 0.404ns (0.008%); 2 (2) = 0.001 ns (99.992%)
b = 0.036ns (99.96%); 2 (2) = 0.497 ns (0.04%)
c = 0.101ns (86.4%); 2 (2) = 0.550 ns (13.6%)
d = 0.322ns (30.5%); 2 (2) = 0.115 ns (69.5%)
e Energy of emission recorded via gated-fluorescence TRE experiment.
f No phosphorescence emission was observed at room temperature.
The shortest oligomer Ph1Pt2 exhibits the most blue-shifted maximum at 355 nm;
the maximum absorbance is red-shifted to 360 nm for Ph2Pt2. The spectrum for this
oligomer exhibits more fine structure than the others in the series, featuring another
strong absorption at a slightly lower energy (ca 390 nm). Both the Ph4Pt2 and Ph9Pt2
oligomers display further red-shifting to 384 nm and 390 nm, respectively. The spectra
of these larger compounds are slightly broader and less defined, and the change in
absorbance is only slight considering the change in the length of the spacer.
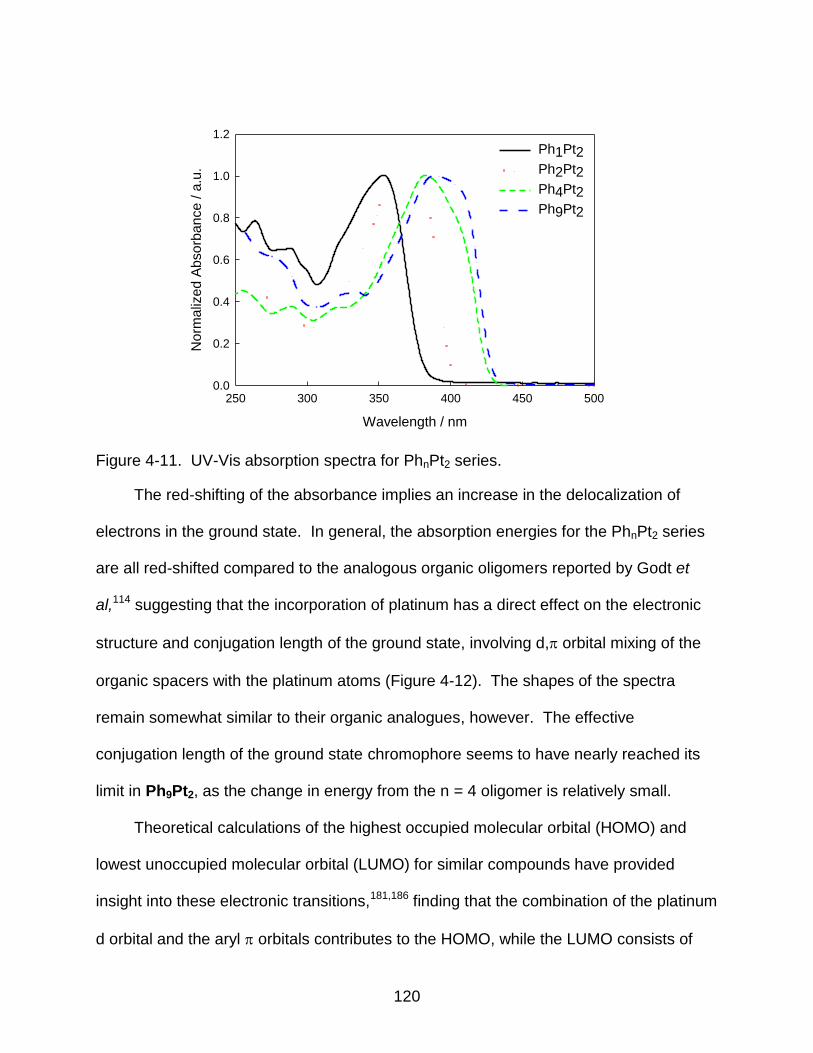
120
Wavelength / nm
250 300 350 400 450 500
Norm
aliz
ed A
bsorb
ance / a
.u.
0.0
0.2
0.4
0.6
0.8
1.0
1.2
Ph1Pt2
Ph2Pt2
Ph4Pt2
Ph9Pt2
Figure 4-11. UV-Vis absorption spectra for PhnPt2 series.
The red-shifting of the absorbance implies an increase in the delocalization of
electrons in the ground state. In general, the absorption energies for the PhnPt2 series
are all red-shifted compared to the analogous organic oligomers reported by Godt et
al,114 suggesting that the incorporation of platinum has a direct effect on the electronic
structure and conjugation length of the ground state, involving d, orbital mixing of the
organic spacers with the platinum atoms (Figure 4-12). The shapes of the spectra
remain somewhat similar to their organic analogues, however. The effective
conjugation length of the ground state chromophore seems to have nearly reached its
limit in Ph9Pt2, as the change in energy from the n = 4 oligomer is relatively small.
Theoretical calculations of the highest occupied molecular orbital (HOMO) and
lowest unoccupied molecular orbital (LUMO) for similar compounds have provided
insight into these electronic transitions,181,186 finding that the combination of the platinum
d orbital and the aryl orbitals contributes to the HOMO, while the LUMO consists of
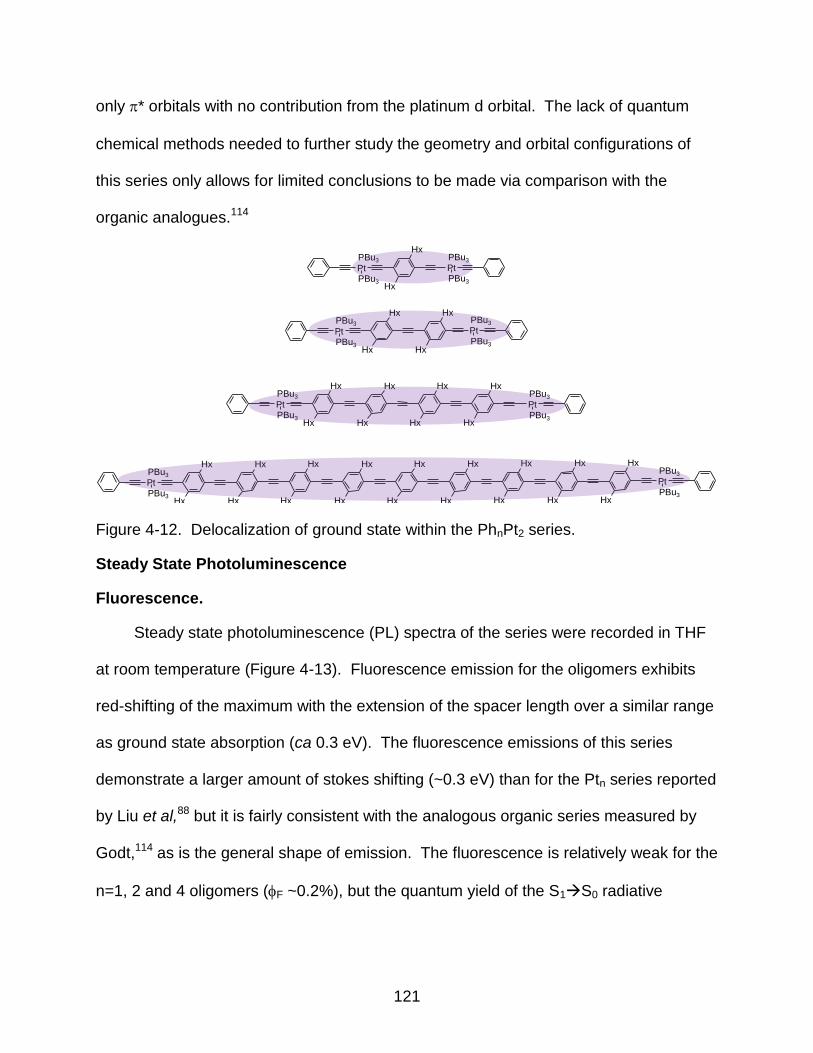
121
only * orbitals with no contribution from the platinum d orbital. The lack of quantum
chemical methods needed to further study the geometry and orbital configurations of
this series only allows for limited conclusions to be made via comparison with the
organic analogues.114
Hx
Hx
Hx
Hx
Hx
Hx
Hx
Hx
Hx
Hx
PtPBu3
PBu3
PtPBu3
PBu3
Hx
Hx
Hx
Hx
Hx
Hx
Hx
Hx
Hx
Hx
Hx
Hx
PtPBu3
PBu3
Pt
PBu3
PBu3
Hx
Hx
Hx
Hx
PtPBu3
PBu3
Pt
PBu3
PBu3
Hx
Hx
Hx
Hx
Pt
PBu3
PBu3
Hx
Hx
PtPBu3
PBu3
Figure 4-12. Delocalization of ground state within the PhnPt2 series.
Steady State Photoluminescence
Fluorescence.
Steady state photoluminescence (PL) spectra of the series were recorded in THF
at room temperature (Figure 4-13). Fluorescence emission for the oligomers exhibits
red-shifting of the maximum with the extension of the spacer length over a similar range
as ground state absorption (ca 0.3 eV). The fluorescence emissions of this series
demonstrate a larger amount of stokes shifting (~0.3 eV) than for the Ptn series reported
by Liu et al,88 but it is fairly consistent with the analogous organic series measured by
Godt,114 as is the general shape of emission. The fluorescence is relatively weak for the
n=1, 2 and 4 oligomers (F ~0.2%), but the quantum yield of the S1S0 radiative
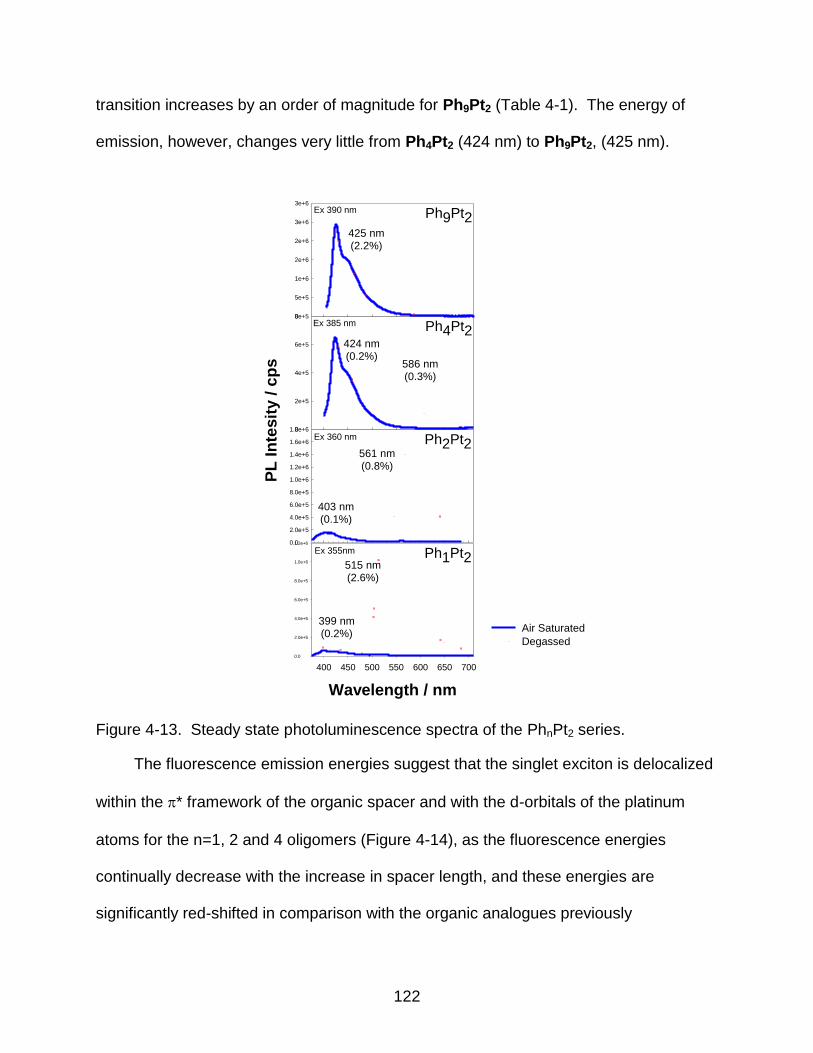
122
transition increases by an order of magnitude for Ph9Pt2 (Table 4-1). The energy of
emission, however, changes very little from Ph4Pt2 (424 nm) to Ph9Pt2, (425 nm).
PL
In
tesit
y /
cp
s
0.0
2.0e+5
4.0e+5
6.0e+5
8.0e+5
1.0e+6
1.2e+6
1.4e+6
1.6e+6
1.8e+6
403 nm(0.1%)
561 nm(0.8%)
Ph2Pt2
0
2e+5
4e+5
6e+5
8e+5
424 nm(0.2%)
586 nm(0.3%)
Ph4Pt2
0
5e+5
1e+6
2e+6
2e+6
3e+6
3e+6
425 nm(2.2%)
Ph9Pt2Ex 390 nm
Ex 385 nm
Ex 360 nm
Wavelength / nm
400 450 500 550 600 650 700
0.0
2.0e+5
4.0e+5
6.0e+5
8.0e+5
1.0e+6
1.2e+6
Ph1Pt2515 nm(2.6%)
399 nm(0.2%)
Air Saturated
Degassed
Ex 355nm
Figure 4-13. Steady state photoluminescence spectra of the PhnPt2 series.
The fluorescence emission energies suggest that the singlet exciton is delocalized
within the * framework of the organic spacer and with the d-orbitals of the platinum
atoms for the n=1, 2 and 4 oligomers (Figure 4-14), as the fluorescence energies
continually decrease with the increase in spacer length, and these energies are
significantly red-shifted in comparison with the organic analogues previously
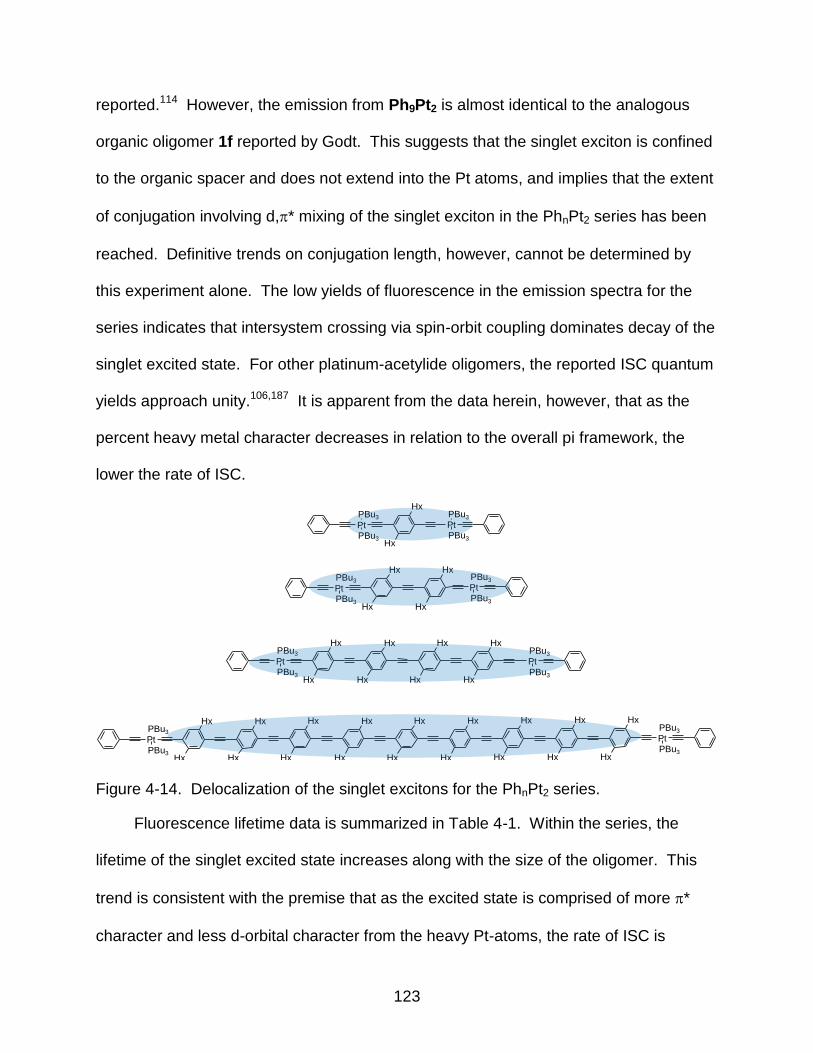
123
reported.114 However, the emission from Ph9Pt2 is almost identical to the analogous
organic oligomer 1f reported by Godt. This suggests that the singlet exciton is confined
to the organic spacer and does not extend into the Pt atoms, and implies that the extent
of conjugation involving d,* mixing of the singlet exciton in the PhnPt2 series has been
reached. Definitive trends on conjugation length, however, cannot be determined by
this experiment alone. The low yields of fluorescence in the emission spectra for the
series indicates that intersystem crossing via spin-orbit coupling dominates decay of the
singlet excited state. For other platinum-acetylide oligomers, the reported ISC quantum
yields approach unity.106,187 It is apparent from the data herein, however, that as the
percent heavy metal character decreases in relation to the overall pi framework, the
lower the rate of ISC.
Hx
Hx
Hx
Hx
Hx
Hx
Hx
Hx
Hx
Hx
PtPBu3
PBu3
PtPBu3
PBu3
Hx
Hx
Hx
Hx
Hx
Hx
Hx
Hx
Hx
Hx
Hx
Hx
PtPBu3
PBu3
Pt
PBu3
PBu3
Hx
Hx
Hx
Hx
PtPBu3
PBu3
Pt
PBu3
PBu3
Hx
Hx
Hx
Hx
Pt
PBu3
PBu3
Hx
Hx
PtPBu3
PBu3
Figure 4-14. Delocalization of the singlet excitons for the PhnPt2 series.
Fluorescence lifetime data is summarized in Table 4-1. Within the series, the
lifetime of the singlet excited state increases along with the size of the oligomer. This
trend is consistent with the premise that as the excited state is comprised of more *
character and less d-orbital character from the heavy Pt-atoms, the rate of ISC is
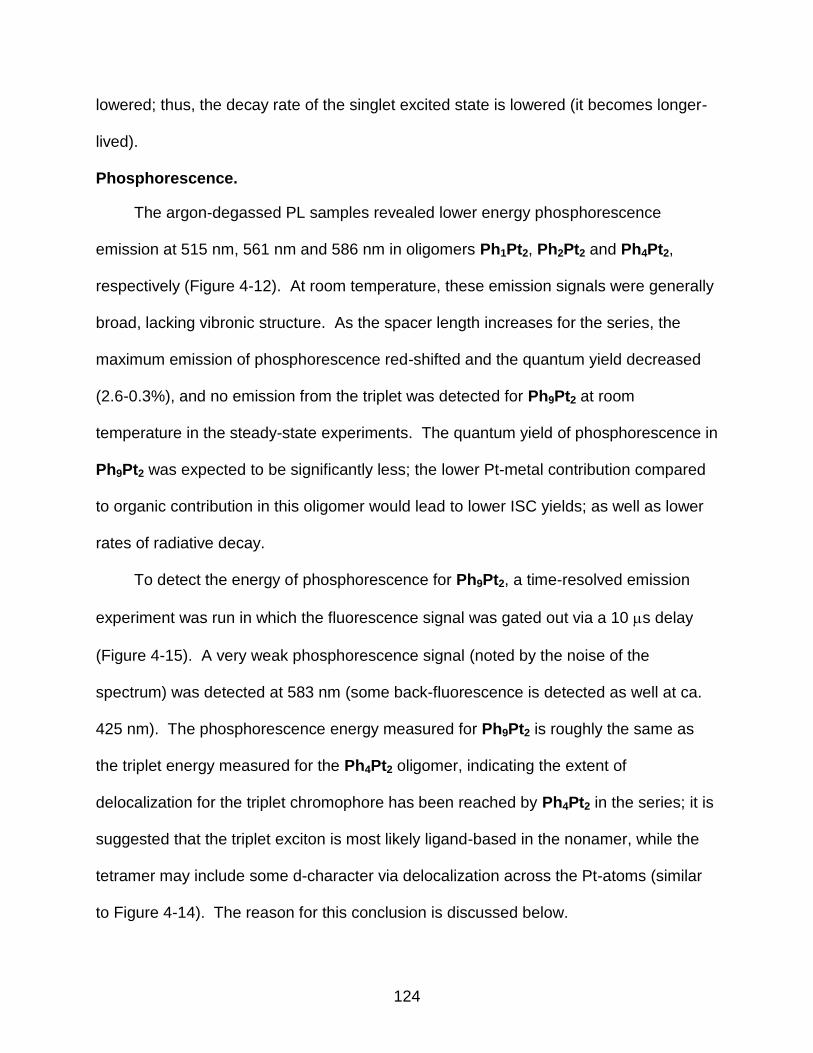
124
lowered; thus, the decay rate of the singlet excited state is lowered (it becomes longer-
lived).
Phosphorescence.
The argon-degassed PL samples revealed lower energy phosphorescence
emission at 515 nm, 561 nm and 586 nm in oligomers Ph1Pt2, Ph2Pt2 and Ph4Pt2,
respectively (Figure 4-12). At room temperature, these emission signals were generally
broad, lacking vibronic structure. As the spacer length increases for the series, the
maximum emission of phosphorescence red-shifted and the quantum yield decreased
(2.6-0.3%), and no emission from the triplet was detected for Ph9Pt2 at room
temperature in the steady-state experiments. The quantum yield of phosphorescence in
Ph9Pt2 was expected to be significantly less; the lower Pt-metal contribution compared
to organic contribution in this oligomer would lead to lower ISC yields; as well as lower
rates of radiative decay.
To detect the energy of phosphorescence for Ph9Pt2, a time-resolved emission
experiment was run in which the fluorescence signal was gated out via a 10 s delay
(Figure 4-15). A very weak phosphorescence signal (noted by the noise of the
spectrum) was detected at 583 nm (some back-fluorescence is detected as well at ca.
425 nm). The phosphorescence energy measured for Ph9Pt2 is roughly the same as
the triplet energy measured for the Ph4Pt2 oligomer, indicating the extent of
delocalization for the triplet chromophore has been reached by Ph4Pt2 in the series; it is
suggested that the triplet exciton is most likely ligand-based in the nonamer, while the
tetramer may include some d-character via delocalization across the Pt-atoms (similar
to Figure 4-14). The reason for this conclusion is discussed below.
125
Wavelength / nm
400 500 600 700 800
PL
In
ten
sity /
a.u
.
0
10000
20000
30000
40000
50000Ph9Pt2Ex 355 nm
10.15 s delay
583 nm
Figure 4-15. Time-resolved emission spectrum of Ph9Pt2 in degassed THF. Excitation
at 355 nm, spectrum recorded at a 10.15 s delay.
The phosphorescence emission in dinuclear platinum compounds is generally
characterized as originating from the * ligand-basedtriplet state, even though
population of T1 occurs via efficient spin-orbit coupling between the excited organic
ligands and the heavy metal platinum atom. Emission from this state is not typically
seen at room temperature for strictly organic phenylene-ethynylene materials, however
low temperature studies of similar monomers and polymers,73 as well theoretical
calculations of similar oligomer structures,188 give insight into the energies of the triplet
states in similar organic structures for comparison with the dinuclear platinum series
herein. PL experiments of PPE films at 80K reveal triplet energies around 1.9 eV;73
these values most likely correlate to the highest degree of delocalization within the 3*
exciton in PPEs. Similarly, quantum mechanical calculations of OPEs suggest similar
lowest energies in oligomers greater than n = 10 repeat units.188
Predicted T1 energies for OPEs with ‗n‘ repeat units were also reported188, and
calculated values can loosely be compared to the ET1 of the platinum-capped PhnPt2
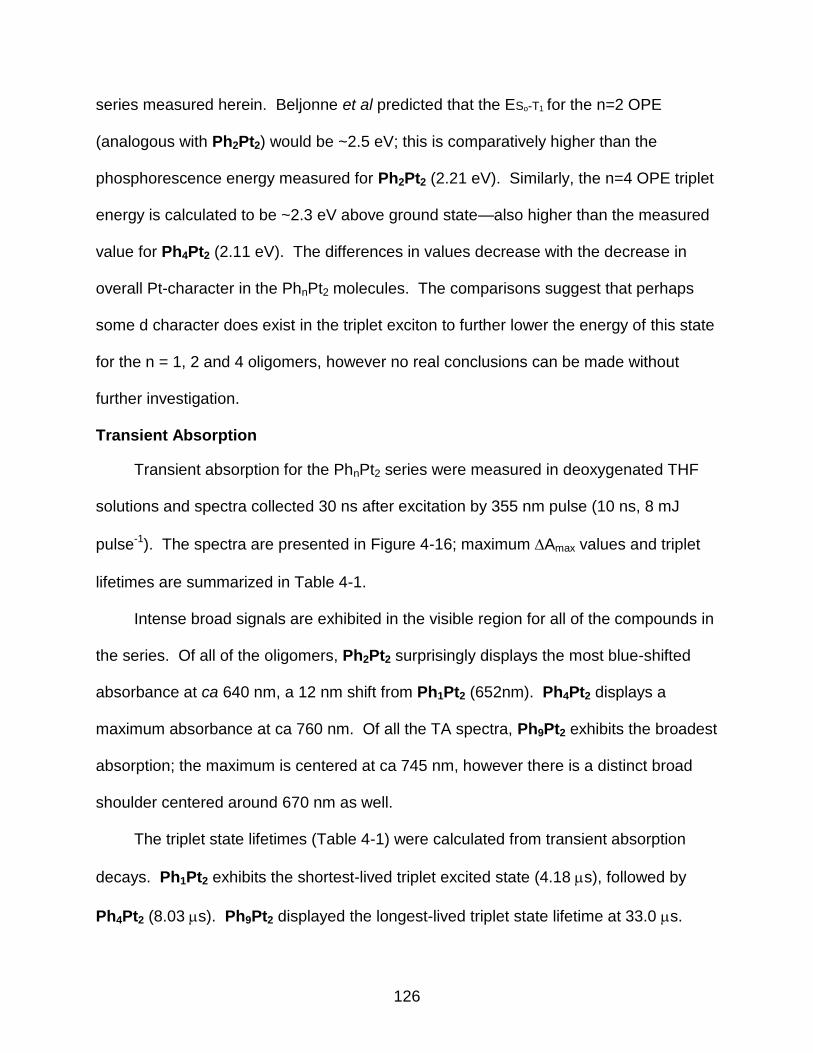
126
series measured herein. Beljonne et al predicted that the ESo-T1 for the n=2 OPE
(analogous with Ph2Pt2) would be ~2.5 eV; this is comparatively higher than the
phosphorescence energy measured for Ph2Pt2 (2.21 eV). Similarly, the n=4 OPE triplet
energy is calculated to be ~2.3 eV above ground state—also higher than the measured
value for Ph4Pt2 (2.11 eV). The differences in values decrease with the decrease in
overall Pt-character in the PhnPt2 molecules. The comparisons suggest that perhaps
some d character does exist in the triplet exciton to further lower the energy of this state
for the n = 1, 2 and 4 oligomers, however no real conclusions can be made without
further investigation.
Transient Absorption
Transient absorption for the PhnPt2 series were measured in deoxygenated THF
solutions and spectra collected 30 ns after excitation by 355 nm pulse (10 ns, 8 mJ
pulse-1). The spectra are presented in Figure 4-16; maximum Amax values and triplet
lifetimes are summarized in Table 4-1.
Intense broad signals are exhibited in the visible region for all of the compounds in
the series. Of all of the oligomers, Ph2Pt2 surprisingly displays the most blue-shifted
absorbance at ca 640 nm, a 12 nm shift from Ph1Pt2 (652nm). Ph4Pt2 displays a
maximum absorbance at ca 760 nm. Of all the TA spectra, Ph9Pt2 exhibits the broadest
absorption; the maximum is centered at ca 745 nm, however there is a distinct broad
shoulder centered around 670 nm as well.
The triplet state lifetimes (Table 4-1) were calculated from transient absorption
decays. Ph1Pt2 exhibits the shortest-lived triplet excited state (4.18 s), followed by
Ph4Pt2 (8.03 s). Ph9Pt2 displayed the longest-lived triplet state lifetime at 33.0 s.
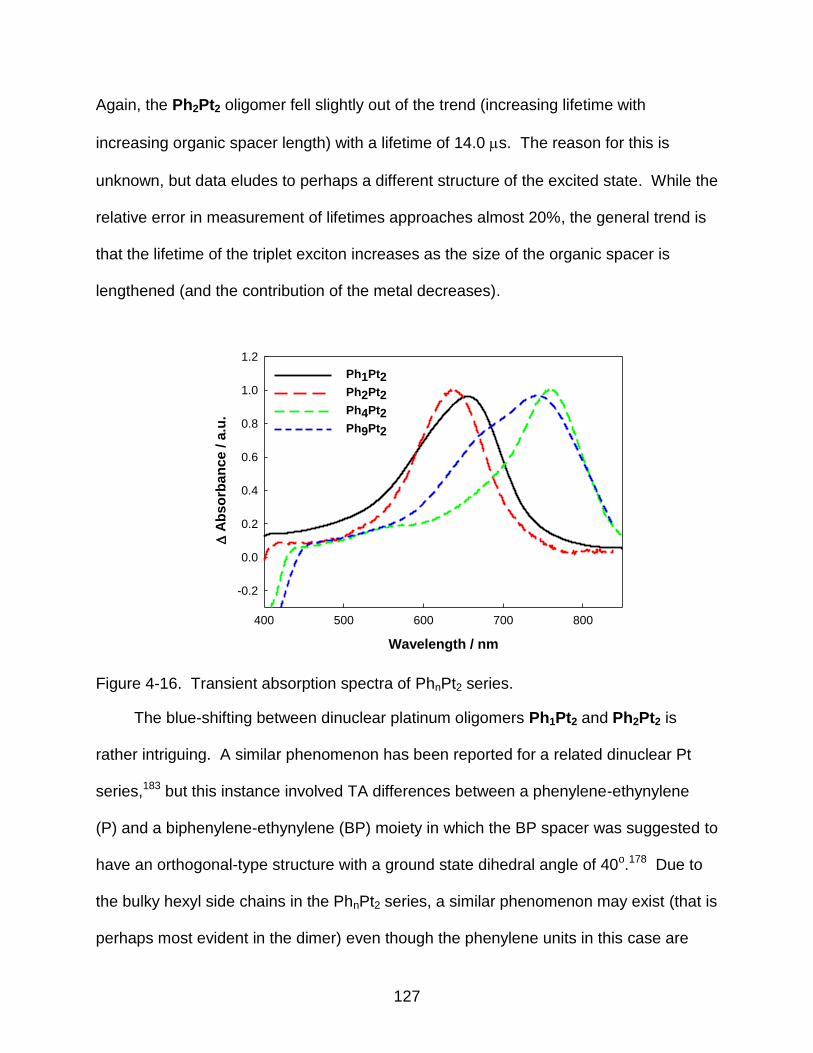
127
Again, the Ph2Pt2 oligomer fell slightly out of the trend (increasing lifetime with
increasing organic spacer length) with a lifetime of 14.0 s. The reason for this is
unknown, but data eludes to perhaps a different structure of the excited state. While the
relative error in measurement of lifetimes approaches almost 20%, the general trend is
that the lifetime of the triplet exciton increases as the size of the organic spacer is
lengthened (and the contribution of the metal decreases).
Wavelength / nm
400 500 600 700 800
A
bs
orb
an
ce
/ a
.u.
-0.2
0.0
0.2
0.4
0.6
0.8
1.0
1.2
Ph1Pt2
Ph2Pt2
Ph4Pt2
Ph9Pt2
Figure 4-16. Transient absorption spectra of PhnPt2 series.
The blue-shifting between dinuclear platinum oligomers Ph1Pt2 and Ph2Pt2 is
rather intriguing. A similar phenomenon has been reported for a related dinuclear Pt
series,183 but this instance involved TA differences between a phenylene-ethynylene
(P) and a biphenylene-ethynylene (BP) moiety in which the BP spacer was suggested to
have an orthogonal-type structure with a ground state dihedral angle of 40o.178 Due to
the bulky hexyl side chains in the PhnPt2 series, a similar phenomenon may exist (that is
perhaps most evident in the dimer) even though the phenylene units in this case are
128
further spatially separated by an ethynyl linker. However, without quantum chemical
methods to study the geometry and orbital configurations of this series, limited
conclusions can be made. The idea that the central phenyl rings in the dimer-are
twisted, which disrupts the conjugation, could be plausible; this could also explain
oddities in the triplet lifetime of this oligomer, but because the exact conjugation length
is not known for the PhnPt2 series, it is not possible to determine trends based purely on
conjugation length. The apparent blue-shifting between the n=4 and n=9 oligomers is
not as surprising, as the nonamer does display a very broad absorption spectra in
relation to the tetramer, suggesting multiple geometries of the excited Tn state exist in
the longer oligomer. It is believed that the conjugation length of this excited triplet state
had been reached based on the spectral data.
Conclusion
A series of platinum end-capped phenylene-ethynylene oligomers, PhnPt2 were
synthesized via an iterative-convergent route described by Godt et al114 incorporating
the use of orthogonal protecting groups to produce a variety of intermediate synthons.
The molecules consisted of various sized organic spacer repeat units (n = 1, 2, 4 and 9)
spanning two trans-Pt(PBu3)2(-CΞC-Ph) groups; the compounds were designed to
characterize the influence of the heavy metal Pt atoms on the organic systems.
In comparison with the organic analogues previously reported114, it was shown that
the introduction of Pt in these systems affected the ground state absorption energies
throughout the series, in which d,-mixing was suggested to cause bathochromic
shifting within the oligomers. The singlet excited state was also shown to be affected by
the introduction of the Pt end groups; red-shifting of fluorescence emission was noted
129
for oligomers n = 1-4, while the singlet exciton was proposed to be mainly ligand-based
in the nonamer. The fluorescence lifetimes of the oligomers were characterized,
concluding that as the contribution of Pt vs. organic spacer decreased, the lifetimes of
the singlet state increased, owing to less decay via ISC. The conclusion from the data
was that the singlet ground and excited state were delocalized throughout the series,
however the extent of delocalization in these states seemed to be reaching its limits.
Phosphorescence energies exhibited red-shifting (and a decrease in quantum
efficiency) with an increase in spacer length for n=1-4 oligomers, but no emission was
measured for the nonamer at via steady state experiments, as the quantum yield of this
state was too low to detect vs. the fluorescence emission. Gated fluorescence
experiments of the nonamer revealed very weak phosphorescence at the same energy
as the tetramer, suggesting the extent of triplet exciton delocalization had been reached
by n = 4. Population of the triplet state was also apparent in all oligomers, as all
compounds exhibited broad transient absorptions. The general trend for Tn
delocalization was similar to other states: an increase in organic spacer implied an
increased conjugation length of the exciton. The data suggested that extent of
delocalization of this state had been reached as well. Ph2Pt2 was a bit of an anomaly in
the group, displaying the highest energy TA transition. Reasons for this phenomenon
are inconclusive in this study as more work is needed to investigate the
structure/property relationships of the series.
Experimental
Materials and Instruments
All solvents and chemicals used for synthesis of the platinum acetylide oligomers
were reagent grade and used without purification unless noted. Silica gel (Silicycle Inc.,
130
230-400 mesh, 40-63 microns, 60 Å) was used for all flash chromatography. All silyl-
acetylene starting materials were purchased from GFS Chemical; potassium
tetrachloroplatinate and palladium-bis(triphenylphosphyl) dichloride were purchased
from Strem Chemicals; all other chemicals were purchased from Sigma-Aldrich. 1H and
31P NMR spectra were obtained on a Varian 300-MHz spectrometer using deuterated
chloroform (CDCl3) as the solvent and tetramethylsilane (TMS) as the internal
reference. The synthesis of compounds 18,189 19,185 22, 88 24-29, 114 32-36114 and 41-
43114 has been previously described in the literature.
Steady-state absorption spectra were recorded on a Varian Cary 100 dual-beam
spectrophotometer. Corrected steady-state emission measurements were conducted
on a PTI fluorescence spectrometer. Samples were degassed by argon purging for 30
min and concentrations were adjusted to produce ―optically dilute‖ solutions (i.e., Amax<
0.20) in THF. Quantum yields were calculated using Ru(byp)3Cl2 as a known
reference.129
Time-resolved emission measurements were carried out on a home-built
apparatus consisting of a Continuum Surelite series Nd:YAG laser as the excitation
source (λ = 355 nm, 10 ns fwhm, < 1mJ/pulse) and detection measured with a Princeton
Instruments PI-MAX intensified CCD camera detector coupled to an Acton SpectraPro
150 spectrograph. The camera delay was set to 150 ns, and the gate set to 10 s. The
spectrum was recorded as an average of 500 images. The signal was relatively low,
therefore the slit to the CCD was opened up (> 50 microns) until emission was detected.
Samples were degassed in THF for 45 minutes with argon in a longneck fluorescence
cell.
131
Transient absorption measurements were conducted on a home-built
apparatus,183 which used a Nd: YAG laser for excitation and PI-Max intensified CCD
camera coupled with spectrograph as a detector. Sample concentration were adjusted
so that A355 nm ≈ 0.8. Triplet lifetimes were calculated using TA decay data via single
exponential global fitting parameters in the SpecFit analysis software.
Fluorescence lifetimes were obtained using the time correlated single photon
counting technique (TCSPC) with a PicoQuant FluoTime 100 Compact Fluorescence
Lifetime Spectrophotometer. Excitation was achieved using a UV pulsed diode laser
(max 375 nm, P <10 mW). The laser was pulsed using an external BK Precision 4011A
5 MHz function generator. Decays were obtained using biexponential fitting parameters
within the PicoQuant PicoHarp software.
Synthesis
cis-Bis(tributylphosphine)dichloroplatinum(II) was prepared by literature methods.
Yield 70%. M.p. 138-139oC.130
1,4-di-n-hexylbenzene (18) is a known compound and was prepared by the
literature method.189 Yield 90%. B.p.(100 mtorr) 90oC. 1H NMR (300 MHz, CDCl3) δ
0.88 (t, 6H), 1.3 (m, 4H), 1.6 (m, 12H), 2.6 (t, 4H), 7.1 (s, 4H).189
1,4-di-n-hexyl-2,5-diiodobenzene (19) is known and was prepared by literature
procedure.185 Sodium periodate (6.0 g, 28 mmol, 40% excess) and diiodine (21.3 g, 84
mmol, 40% excess) were stirred into a mixture of glacial acetic acid (100 mL) and acetic
anhydride (50 mL) at 5oC. Concentrated sulfuric acid (26.6 mL, 500 mmol) was then
added slowly to the stirring suspension. 1,4-Dihexylbenzene (17.3 g, 70 mmol) was
added to this solution and stirring was continued for 4 h at room temperature. The
132
reaction mixture was then poured into an ice-water mixture containing previously
dissolved Na2SO3 (fume hood). Over about 15 minutes, all precipitate was formed and
filtered, washing with cold ethanol. Recrystallization of the product from ethanol
resulted in 26 g of pure white, needle-like crystals. Yield 74%. M.p. 47oC. 1H NMR (300
MHz, CDCl3) δ 0.88 (t, 6H), 1.35 (m, 12H), 1.55 (m, 4H), 2.6 (t, 4H), 7.6 (s, 2H).114
2,5-Bis-trimethylsilanylethynyl-1,4-dihexylbenzene (20).113 To a round bottom
flask was added 2,5-diiodo-1,4-dihexylbenzene (3.0g, 6.02 mmol), isopropanol (20 mL)
and THF (30 mL). The mixture was stirred and degassed with argon for 20 min, then
Pd(PPh3)Cl2 (0.211 g, 0.301 mmol) and CuI (57 mg, 0.301 mmol) were added quickly.
The flask was degassed an additional 5 min, then TMS-acetylene (2.13 mL, 15.1 mmol)
was added via syringe. The solution was heated to 70oC and reacted for 12 h under
argon gas. The solvents were evaporated, then the crude oil was diluted with ether,
washed with water and brine, then dried over NaSO4(s). The filtered solute was dried
and run through a short silica plug using 90:10 petroleum ether:CH2Cl2 as eluent. The
product was collected and the solvent evaporated to give 2.7g of a yellow oil. Yield
100%. 1H NMR (300 MHz, CDCl3) δ 0.22 (t, 18H), 0.88 (m, 6H), 1.31 (m, 12H), 1.60 (m,
4H), 2.68 (t, 4H), 7.22 (s, 2H). 13C NMR (CDCl3) δ 0.2, 14.4, 22.9, 29.5, 30.9, 32.0,
34.4, 99.0, 104.2, 122.8, 132.7, 142.8. The product was used as is toward further
reaction.
2,5-Diethynyl-1,4-dihexylbenzene (21). Methanol (15 mL), THF (10 mL) and 2,5-
bis-trimethylsilanylethynyl-1,4-dihexylbenzene (1.0 g, 2.29 mmol) were degassed with
argon for 30 min, then powdered KOH (0.77 g, 13.7 mmol) was added. The reaction
was stirred in a dark flask for 2 h at room temperature until a crude aliquot confirmed
133
the reaction was complete via NMR. The reaction was then quenched with water,
diluted with ether, and the organic layer dried over NaSO4(s). After filtration, the solute
was evaporated to afford the crude product as 0.62 g of a pure yellow oil. Yield 93%.
1H NMR (300 MHz, CDCl3) δ 0.85 (t, 6H), 1.25 (m, 12H), 1.55 (m, 4H), 2.63 (t, 4H), 3.26
(s, 2H), 7.27 (s, 2H). This crude product was used as is toward further synthesis.
trans-Bis(tributylphosphine)chloro(2-phenylethynyl)-platinum(II) (22) is a known
compound and was prepared by literature methods.88 Yield 94%. 1H NMR (300 MHz,
CDCl3) δ 0.90 (t, 18H), 1.35-1.65 (m, 24H), 2.0 (m, 12H), 7.1-7.3 (m, 5H); 31P NMR
(CDCl3) δ 7.94 (JPt-P = 2373.81 Hz).88
Ph1Pt2 (23). The crude 2,5-diethynyl-1,4-dihexylbenzene ( 0.26 g, 0.89 mmol),
trans-bis(tributylphosphine)chloro(2-phenylethynyl)-platinum(II) (1.5 g, 2.04 mmol),
diethylamine (18 mL) and THF (12 mL) were mixed and degassed with argon for 30
min, followed by the addition of CuI (5 mg, 26.5 mol). The solution was allowed to
react for 1.5 h and then quenched with water. The organics were extracted with CH2Cl2
and dried over NaSO4(s). After filtration and evaporation of solvent, the crude yellow oil
was loaded onto a column (silica, flash) loaded with 2:1 hexanes/CH2Cl2. Fraction 2
(Rf~0.3) was a dark yellow band that exhibited yellow phosphorescence under long
wave UV light under argon stream. The solvent was evaporated and this fraction was
collected as 1.0 g of solid yellow product. Yield 67%. 1H NMR (300 MHz, CDCl3) δ 0.85
(t, 6H), 1.25 (m, 12H), 1.55 (m, 4H), 2.63 (t, 4H), 3.26 (s, 2H), 7.27 (s, 2H). 31P NMR
(CDCl3) δ 4.44 (JPt-P = 2367.08 Hz). Mass Spec. (APCI-HR) Calc‘d for C86H146P4Pt2
[M++H] 1694.9765; Found [M++H] 1694.9741.
134
3-(2,5-Dihexyl-4-iodo-phenyl)-prop-2-yn-1-ol (24) is a known compound and was
prepared by the literature method114 to afford a brown/tan solid. Yield 75%. M.p. 37.5-
38.0oC (Lit. 38.4-38.6oC). 1H NMR (300 MHz, CDCl3) δ 0.88 (m, 6H), 1.22-1.42 (m,
12H), 1.47-1.65 (m, 5H), 2.61 (d, 2H), 2.63 (d, 2H), 4.50 (d, 2H), 7.21 (s, 1H), 7.63 (s,
1H).114
3-{2,5-Dihexyl-4-[(triisopropylsilanyl)-ethynyl]-phenyl}-prop-2-yn-1-ol (25) is known
and was prepared by the literature method114 to produce a yellow-orange oil. Yield
84%. 1H NMR (300 MHz, CDCl3) δ 0.88 (m, 6H), 1.15 (s, 21H) 1.22-1.42 (m, 12H),
1.58-1.65 (m, 4H), 2.69 (d, 2H), 2.73 (d, 2H), 4.50 (d, 2H), 7.22 (s, 1H), 7.26 (s, 1H).114
(4-Ethynyl-2,5-dihexyl-phenylethynyl)-triisopropyl-silane (26) is a known compound
and was prepared according to literature method114 to afford an orange oil. Yield 72%.
1H NMR (300 MHz, CDCl3) δ 0.85-0.95 (m, 6H), 1.17 (s, 21H) 1.22-1.42 (m, 12H), 1.59-
1.66 (m, 4H), 2.75 (m, 4H), 3.29 (s, 1H), 7.30 (s, 1H), 7.31 (s, 1H).114
3-(4-{2,5-Dihexyl-4-[(triisopropylsilanyl)-ethynyl]-phenylethynyl}-2,5-dihexyl-
phenyl)-prop-2-yn-1-ol (27) is a known compound prepared from literature method114 to
afford the product as a yellow oil. Yield 87%. 1H NMR (300 MHz, CDCl3) δ 0.82-0.95
(m, 12H), 1.15 (s, 21H) 1.21-1.45 (m, 24H), 1.55 (s, 1H), 1.58-1.72 (m, 8H), 2.66-2.80
(m, 8H), 4.51 (d, 2H), 7.25 (s, 1H), 7.26 (s, 1H), 7.27 (s, 1H), 7.28 (s, 1H).114
3-[4-(4-Ethynyl-2,5-dihexyl-phenylethynyl)-2,5-dihexyl-phenyl]-prop-2-yn-1-ol (28).
To a round bottom flask with a stir bar was added 3-(4-{2,5-Dihexyl-4-
[(triisopropylsilanyl)-ethynyl]-phenylethynyl}-2,5-dihexyl-phenyl)-prop-2-yn-1-ol (1.3 g,
1.73 mmol) and THF (20 mL). The mixture was degassed for 30 min with argon
followed by the addition of TBAF, 1 M in THF (3.47 mL, 3.47 mmol) via syringe. The
135
solution was allowed to react at room temperature for 2 h before it was quenched with
water. The organic solution was extracted with ether and dried over magnesium sulfate.
After filtration of the drying agent and evaporation of solvent, 1.3 g of a yellow/brown oil
was collected as the crude product. Yield (crude) 100%. 1H NMR (300 MHz, CDCl3) δ
0.81-0.92 (m, 12H), 1.15 (s, 21H) 1.20-1.42 (m, 24H), 1.55-1.71 (m, 8H), 2.67-2.80 (m,
8H), 3.29 (s, 1H), 4.51 (s, 2H), 7.26-7.27 (m, 2H), 7.30-7.31 (m, 2H). The product was
used without further purification toward the next step of the synthesis.
Ph2OH1Pt1 (29). To a round bottom flask with a stir bar was added 28 (181 mg,
0.252 mmol), 22 (0.40 g, 0.509 mmol), THF (10 mL) and diethylamine (8 mL). The
mixture was degassed with argon for 30 min, followed by the addition of CuI (1.7 mg,
9.1 mol). The solution was reacted for 4 h at room temperature, followed by
evaporation of the solvent once TLC confirmed complete disappearance of the free
acetylene starting material. The crude product was diluted with CH2Cl2, washed with
water and brine, and dried over NaSO4(s). The crude material was concentrated into
and oil and loaded onto a column (silica, flash) prepped with 3:1 hexanes/CH2Cl2. The
third fraction was eluted as yellow band, exhibiting orange phosphorescence on TLC
with long wave UV light under argon flow. Evaporation of the solvent afforded 200 mg
of yellow oil product used as is toward further synthesis. Yield 61%. 1H NMR (300
MHz, CDCl3) δ 0.84-0.96 (t, 30H), 1.25-1.72 (m, 57H), 2.09-2.17 (m, 12H), 2.69-2.82
(m, 8H), 4.54 (d, 3J(H,H) = 6Hz, 2H), 7.08-7.31 (m, 9H). 31P NMR (CDCl3) δ 4.45 (JPt-P =
2360.45 Hz).
Ph2(CCH)1Pt1 (30). Ph2OH1Pt1 (200 mg, 0.155 mmol) and ether (20 mL) were
stirred and degassed 30 min under argon flow in a dark flask, followed by a total of 5
136
sequential additions (at 1 hour intervals) of MnO2 (0.336g, 3.87 mmol) and powdered
KOH (87 mg, 1.55 mmol). The reaction was allowed to go to completion at room
temperature overnight, then it was filtered through a silica plug and rinsed with diethyl
ether, to collect the crude deprotected product. The solvent of the filtrate was
evaporated to afford 140 mg of crude product as a yellow oil. Yield (crude) 72%. The
crude product was used as is toward the next step of the synthesis without further
purification.
Ph2Pt2 (31). Ph2(CCH)1Pt1 (140 mg, 0.111 mmol), 22 (204 mg, 0.277 mmol),
diethylamine (10 mL) and THF (10 mL) were stirred and degassed with argon for 30
min, followed by the addition of CuI (0.5 mg). The solution was allowed to react at room
temperature for 4 h, and then the solvent was evaporated. The crude product mixture
was diluted with CH2Cl2, washed with water and brine and then dried over NaSO4(s).
After filtration and evaporation of solvent, the crude oil was loaded onto a column (silica,
flash) prepped and eluted with 1:1 hexanes/CH2Cl2. The first fraction eluted was a
yellow band whose spot on TLC (long wave UV/argon stream) exhibited orange
phosphorescence. The solvent was evaporated to afford 70 mg of yellow solid product.
Yield 30%. Elemental Analysis for C106H174P4Pt2: Calculated C 64.87%, H 8.94%;
Found C 64.43%, H 8.67%. 1H NMR (300 MHz, CDCl3) δ 0.83-0.96 (m, 48H), 1.22-1.72
(m, 80H), 1.95-2.28 (m, 24H), 2.68-2.80 (m, 8H), 7.07-7.31 (m, 14H). 31P NMR (CDCl3)
δ 4.51 (JPt-P = 2359.16 Hz).
3-(2,5-Dihexyl-4-trimethylsilanylethynyl-phenyl)-prop-2-yn-1-ol (32) is a known
compound prepared by literature procedure114 to afford a brown oil product. Yield 79%.
1H NMR (300 MHz, CDCl3) δ 0.19 (s, 9H), 0.74-0.86 (m, 6H), 1.15-1.32 (m, 12H), 1.43-
137
1.58 (m, 4H), 2.10 (br s, 1H), 2.54-2.62 (m, 4H), 4.43 (s, 2H), 7.13 (s, 1H), 7.17 (s,
1H).114
3-(4-Ethynyl-2,5-dihexyl-phenyl)-prop-2-yn-1-ol (33) is known and was prepared
by literature method114 to produce the product as a red/brown oil. Yield 100%. 1H NMR
(300 MHz, CDCl3) δ 0.82-0.92 (m, 6H), 1.18-1.40 (m, 12H), 1.51-1.65 (m, 4H), 2.10 (br
s, 1H), 2.62-2.74 (m, 4H), 3.26 (s, 1H), 4.51 (s, 2H), 7.23 (s, 1H), 7.27 (s, 1H).114
3-[4-(2,5-Dihexyl-4-iodo-phenylethynyl)-2,5-dihexyl-phenyl]-prop-2-yn-1-ol (34) is
known and was prepared by literature method114 to afford the product as a yellow solid.
Yield 54%. M.p. 58.2-59.0oC (Lit. 62oC). 1H NMR (300 MHz, CDCl3) δ 0.82-1.00 (m,
12H), 1.20-1.51 (m, 24H), 1.51-1.77 (m, 8H), 1.84 (t, 1H), 2.63-2.85 (m, 8H), 4.53 (d,
2H), 7.29-7.34 (3 s, 3H), 7.70 (s, 1H).114
Ph2TIPS1(CCH)1 (35) is a known compound and was prepared according to
literature method114 to afford the product as a brown/red oil. Yield 70%. 1H NMR (300
MHz, CDCl3) δ 0.82-0.95 (m, 12H), 1.15 (s, 21H) 1.22-1.48 (m, 24H), 1.56-1.73 (m, 8H),
2.68-2.8 (m, 8H), 3.37 (s, 1H), 7.32-7.34 (4 s, 4H).114
Ph4TIPS1OH1 (36) is a known compound prepared similarly to literature
methods,114 only Pd2(dba)3/CuI/PPh3 (0.045/0.08/0.15 equiv. vs. starting material,
where 1.0 equiv = 1.12 mmol) was used rather than the Pd(PPh3)2Cl2/CuI catalyst
system, minimizing the amount of acetylene dimer formation drastically. Yield 96%. 1H
NMR (300 MHz, CDCl3) δ 0.81-0.98 (m, 24H), 1.16 (s, 21H), 1.35-1.52 (m, 48H), 1.54-
1.79 (m, 16H), 2.71-2.88 (m, 16H), 4.52 (s, 2H), 7.31-33 (2 s, 2H), 7.35-7.36 (2 s, 2H),
7.39-7.40 (2 s, 4H).114
138
Ph4OH1(CCH)1 (37) is known and was prepared according to literature method114,
however the product was purified by column chromatography (silica, flash) prepped and
eluted with 1:1 petroleum ether/CH2Cl2. The product was collected in the first fraction
as a yellow solid. Yield 80%. Mp 89-91oC (Lit. 91oC). 1H NMR (300 MHz, CDCl3) δ
0.82-0.98 (m, 24H), 1.24-1.48 (m, 48H), 1.59-1.76 (m, 16H), 2.71-2.87 (m, 16H), 3.30
(s, 1H) 4.54 (d, 2H), 7.29 (s, 1H), 7.34 (m, 3H), 7.37-7.39 (m, 4H).114
Ph4OH1Pt1 (38). To a round bottom flask were added Ph4OH1(CCH)1 (0.10 g,
0.089 mmol), 22 (78 mg, 0.106 mmol), THF (7 mL) and diethylamine (10 mL). The
solution was degassed under argon flow for 30 min, followed by the addition of CuI (0.5
mg). The solution was allowed to react at room temperature for 1.5 h until TLC
revealed completion of reaction. The solution was quenched with water and the
organics extracted with CH2Cl2 and dried (NaSO4). Filtration of the drying agent and
evaporation of the solvent gave a crude yellow/orange oil that was loaded onto a
column (silica, flash) prepped with 2:1 petroleum ether/CH2Cl2, then switched to 1:1
after elution of fraction 2. The first two fractions that eluted (Rr ~ 0.8 and 0.5) were
biproducts. The third fraction eluted was a yellow band (Rf ~ 0.3); the solvent was
evaporated to yield 70 mg of a yellow oil that slowly became a solid. Yield 44%. 1H
NMR (300 MHz, CDCl3) δ 0.82-1.00 (m, 42H), 1.21-1.81 (m, 88H), 2.02 -2.22 (m, 12H),
2.69-2.88 (m, 16H), 4.56 (s, 2H), 7.09-7.40 (m, 13H). 31P NMR (CDCl3) δ 4.57 (JPt-P =
2361.37 Hz). Mass Spec. (APCI-HR) Calc‘d for C115H174OP2Pt [M+Cl]+ 1864.2392;
Found [M+Cl]+ 1864.2392.
Ph4(CCH)1Pt1 (39). The starting material Ph4OH1Pt1 (0.18 g, 0.098 mmol) and
ether (15 mL) were stirred and degassed with argon for 30 min in a dark flask. Hourly
139
portions (3 total) of MnO2 (0.214 g, 2.46 mmol) and powdered KOH (55 mg, 0.984
mmol) were then added until the reaction was complete. TLC monitoring showed
reaction completion after 4 h. The reaction was filtered through a small plug of silica,
washing with ether, then the concentrated filtrate was separated on a column (silica,
flash) prepped with 3:1 petroleum ether/CH2Cl2. Fraction 1 was a small biproduct of the
deprotection, and fraction 2 (eluted as a light yellow band, TLC showing green
fluorescence and red phosphorescence under long wave UV light/argon flow) was
collected as 110 mg of yellow oil product. Yield 62%. 1H NMR (300 MHz, CDCl3) δ
0.82-0.96 (m, 42H), 1.24-1.51 (m, 60H), 1.52-1.77 (m, 28H), 2.04 -2.20 (m, 12H), 2.71-
2.88 (m, 16H), 3.31 (s, 1H) 4.56 (s, 2H), 7.08-7.39 (m, 13H). 31P NMR (CDCl3) δ 4.53
(JPt-P = 2360.98 Hz). The product was used as is toward further synthesis.
Ph4Pt2 (40). Diethylamine (10 mL), Ph4(CCH)1Pt1 (110 mg, 0.0611 mmol) and 22
(104 mg, 0.141 mmol) were stirred and degassed with argon for 30 min, followed by the
addition of CuI (<1 mg, about 0.04 equiv.). The reaction was allowed to stir at room
temperature for 2 h, then quenched with water when TLC revealed that the reaction was
complete. The organics were extracted with CH2Cl2 and dried (NaSO4); after filtration of
the drying agent and evaporation of solvent, the crude oil was loaded onto a column
(silica, flash) prepped and eluted with 2:1 hexanes/CH2Cl2. The first fraction eluted as a
yellow band (Rf ~ 0.25), and TLC revealed the spot as being fluorescent blue/green and
phosphorescent red (with argon flow). Collection of the fraction afforded 110 mg of
yellow solid product. Yield 72%. 1H NMR (300 MHz, CDCl3) δ 0.82-0.97 (m, 60H),
1.22-1.76 (m, 100H), 2.30-2.25 (m, 24H), 2.71-2.87 (m, 16H), 7.09-7.24 (m, 8H), 7.26-
140
7.31 (m, 6H), 7.33-7.37 (m, 4H). 31P NMR (CDCl3) δ 4.54 (JPt-P = 2363.43 Hz). Mass
Spec. (APCI-HR) Calc‘d for C146H230P4Pt2 [M++H] 2499.6346; Found [M++H] 2499.6371.
Ph4TIPS1(CCH)1 (41) is a known compound prepared by literature method114 to
afford the product as a yellow solid. Yield 79%. M.p. 79oC (Lit 79oC). 1H NMR (300
MHz, CDCl3) δ 0.82-0.95 (m, 24H), 1.16 (s, 21H) 1.26-1.50 (m, 48H), 1.59-1.79 (m,
16H), 2.72-2.87 (m, 16H), 3.31 (s, 1H), 7.31-7.4 (m, 8H).114
Ph5I1OH1 (42) is a known compound prepared by literature method114 to afford a
yellow solid. Yield 52%. M.p. 120oC (Lit. 121oC). 1H NMR (300 MHz, CDCl3) δ 0.81-
0.99 (m, 30H), 1.25-1.51 (m, 60H), 1.56-1.81 (m, 20H), 2.64-2.90 (m, 20H), 4.58 (s,
2H), 7.31 (s, 1H), 7.34 (s, 1H), 7.36 (s, 1H), 7.40 (br s, 6H), 7.72 (s, 1H).114
Ph9TIPS1OH1 (43) is a known compound prepared by literature method114 to yield
the product as a bright yellow solid. Yield 48%. M.p. 184.5-186.0oC (Lit. 187oC). 1H
NMR (300 MHz, CDCl3) δ 0.81-0.98 (m, 54H), 1.16 (s, 21H), 1.26-1.79 (m, 144H), 2.71-
2.89 (m, 36H), 4.52 (s, 2H), 7.31-33 (2 s, 2H), 7.35-7.36 (2 s, 2H), 7.37-7.45 (m,
14H).114
Ph9OH1(CCH)1 (44). Deprotection of Ph9TIPS1OH1 (170 mg, 0.065 mmol) was
accomplished by degassing this starting material in THF (15 mL) for 30 min with argon,
followed by the addition of 1 M TBAF in THF (0.176 mL, 0.176 mmol) via syringe. The
reaction was allowed to stir in a dark flask for 2 h until complete, and then quenched
with water. The organic portion was extracted with CH2Cl2, dried over NaSO4(s),
followed by filtration of the drying agent and evaporation of the solvent to afford a crude
oil. This crude mixture was loaded onto a column (silica, flash) prepped and eluted with
1:1 petroleum ether/CH2Cl2. The product was eluted as a bright yellow band on the
141
column (Rf 0.5), exhibiting bright yellow fluorescence on TLC. The collected fractions
were evaporated to give the product as 160 mg of a bright yellow solid. Yield 99%. 1H
NMR (300 MHz, CDCl3) δ 0.82-0.97 (m, 54H), 1.25-1.51 (m, 108H), 1.59-1.80 (m 36H),
2.69-2.90 (m, 36H), 3.30 (s, 1H), 4.53 (d, 3J(H,H) = 6Hz, 2H), 7.28-7.39 (m, 18H). The
material was used as is toward further synthesis.
Ph9OH1Pt1 (45). To a round bottom flask equipped with stir bar was added
Ph9OH1(CCH)1 (0.150 g, 0.061 mmol), 22 (0.120 g, 0.164 mmol), THF (10 mL) and
diethylamine (9 mL). The solution was stirred and degassed under argon flow for 30
min, followed by the addition of CuI (0.4 mg, 2.20 mol). The reaction was stirred at
room temperature for 3 h until TLC confirmed that all of the limiting reagent was
consumed, and the reaction was quenched with water. The organic portions were
extracted with CH2Cl2, washed with saturated NH4Cl(aq) and brine, and then dried over
NaSO4(s). The solvent was evaporated after filtration of the drying agent to give a bright
yellow crude solid that was loaded onto a column (silica, flash) prepped with 3:1
petroleum ether/CH2Cl2. Fractions 1 and 2 were eluted as either starting materials or
side products. The solvent was increased gradually to 2:1 petroleum ether/CH2Cl2 and
the third fraction (bright yellow band, fluorescent yellow on column) was collected as the
product, 160 mg of a bright yellow solid (no phosphorescence was apparent by TLC
under N2(g) flow). Yield 83%. 1H NMR (300 MHz, CDCl3) δ 0.82-1.00 (m, 72H), 1.22-
1.82 (m, 180H), 2.00-2.22 (m, 12H), 2.66-3.02 (m, 36H), 4.56 (s, 2H), 7.09-7.42 (m,
23H). 31P NMR (CDCl3) δ 4.55 (JPt-P = 2357.93 Hz). The compound was used as is
toward further synthesis.
142
Ph9(CCH)1Pt1 (46). A mixture of Ph9OH1Pt1 (160 mg, 50.4 mol) and ether (20
mL) was stirred and degassed under argon flow for 30 min in a dark flask, followed by
five hourly addition of portions of MnO2 (107 mg, 1.23 mmol) and powdered KOH (28
mg, 0.49 mmol) until the reaction was complete. After 5 h, the reaction was almost
finished and it was left to run to completion overnight; the solution was filtered through a
silica gel plug, washing with CH2Cl2, and the filtrate was collected and evaporated. The
crude oil was loaded onto a column (silica, flash) prepped with 2:1 petroleum
ether/CH2Cl2. The first fraction was a small amount of byproduct (fluorescent blue on
column). The second fraction to elute was fluorescent yellow on the column. This large
fraction was collected and the solvent evaporated to afford 150 mg of yellow oil as
product. Yield 94%. 1H NMR (300 MHz, CDCl3) δ 0.72-0.98 (m, 72H), 1.20-1.82 (m,
168H), 2.02-2.24 (m, 12H), 2.66-2.94 (m, 36H), 3.31 (s, 1H), 7.08-7.42 (m, 23H). 31P
NMR (CDCl3) δ 4.54 (JPt-P = 2362.20 Hz). The compound was used as is for further
reaction.
Ph9Pt2 (47). A round bottom flask was charged with Ph9(CCH)1Pt1 (150 mg, 47.7
mol), 22 (105 mg, 0.143 mmol), THF (10 mL) and diethylamine (15 mL). The solution
was degassed for 45 min under argon flow, followed by the addition of a catalytic
amount of CuI (0.4 mg, 1.91 mol). The reaction was stirred at room temperature for 4
h then quenched with water. The organics were extracted with CH2Cl2, washed with
NH4Cl(aq) and brine, then dried over NaSO4(s). The drying agent was removed and the
solvent evaporated to afford a crude yellow oil. The crude oil was loaded onto a column
(silica, flash) prepped with 4:1 petroleum ether/CH2Cl2. The first few fractions to elute
were organic byproducts and the excess starting material. The third fraction was eluted
143
as a yellow band (fluorescent yellow on the column). This fraction was collected and
the solvent evaporated to yield 80 mg of pure yellow (slowly forming) solid product.
(*About 20 mg of product was also collected with the fourth fraction, containing
acetylene starting material byproduct.) Yield 43%. Elemental Analysis for
C247H374P4Pt2: Calculated C 76.89%, H 9.78%; Found C 76.81%, H 10.10%. 1H NMR
(300 MHz, CDCl3) δ 0.80-0.97 (m, 90H), 1.22-1.79 (m, 192H), 2.04-2.21 (m, 24H), 2.64-
2.91 (m, 36H), 7.09-7.24 (m, 8H), 7.26-7.32 (m, 6H), 7.34-7.40 (m, 14H). 31P NMR
(CDCl3) δ 4.56 (JPt-P = 2357.85 Hz).
144
CHAPTER 5 CONCLUSION
The previous chapters of this dissertation have reviewed both the synthesis and
photophysics of various types of -conjugated oligomers containing platinum. The
current studies have focused on further exploration of the fundamental photophysical
properties of both charged and excited states of these materials to better understand
their potential role in device applications, as well as to further investigate the properties
of the triplet excited state that remain relatively elusive in strictly organic materials.
The main challenge in unifying a structure/property relationship in these materials
was to synthesize discrete molecules of varying structures for comparison of properties.
There has been considerable research focused on the synthesis of mono-disperse,
organic -conjugated oligomers,90,113-120 however relatively few studies have been
reported describing the preparation of oligomers that contain regular repeats of metal
centers in the -conjugated sequence.88,121 The synthetic work described in Chapter 2
is useful, as the protecting group approach that was developed is general and could be
used towards the synthesis of a variety of Pt-acetylide based oligomers and dendrimers.
This chapter more specifically reported the synthesis of a series of mono-disperse Pt-
acetylide oligomers that were end-capped with naphthalene diimide units, PtnNDI2. In
order to more successfully measure the dynamics of exciton and polaron hopping along
the chains, relatively long oligomer chains were needed.58,109-112 The synthetic
approach used to construct these oligomers was based on an iterative-convergent
method incorporating organometallic synthons with orthogonally protected terminal
acetylenes. Oligomers n = 2, 3, 6, and 10 were successfully prepared, both quickly and
with ease in separation, via this route. This work was significant as well because it is
145
the first know report to utilize orthogonal acetylene protecting groups in the synthesis of
organometallic oligomers.
After synthesis of the monodisperse PtnNDI2 series had been completed, studies
of charge and energy transport in these compounds was investigated and reported in
Chapter 3. Charges and triplet excitons created in platinum acetylide chains have been
found to be localized to approximately two repeat units. These states are said to be
trapped in a part of the chain only by structural relaxation (reorganization), therefore it
was predicted that a polaron or exciton may move in random directions to adjacent
locations on the chain. While evidence of migration had previously been reported, an in
depth investigation of neither the rates of migration nor the mechanism had been
reported. This study utilized ultrafast transient absorption and pulse radiolysis
techniques to experimentally capture the rates of triplet exciton and negative polaron
migration in these chains via spectroscopic evidence of either PET or electron capture
at the NDI unit, respectively. To correlate the somewhat complex kinetics of these
processes with migration rates, simulated data of a random-walk mechanism was
generated and fit to match experimental data. Results conclude that a hopping
mechanism is most likely dominate for both exciton and polaron migration along these
chains; both processes are fast, and hopping rates for each were estimated to be about
27 ps. This is the first known report of intrachain diffusion rate measurements in these
materials.
Another fundamental question that was studied in this dissertation was to further
define the extent of delocalization of the triplet exciton in platinum acetylide compounds.
As stated previously, in typical Pt-acetylides consisting of an ethynyl-phenyl-ethynyl
146
spacer between platinum atoms, the exciton had been reported to be highly confined
between one to two repeat units based on optical data; calculations alluded to
geometric constraints in the confinement the triplet exciton. Other work had studied the
extent of triplet delocalization in Pt-capped oligoynes, however in these materials mixing
of the metal and ligand orbitals was found to be minimal. Chapter 4 specifically
addressed the question of the extent of exciton delocalization in phenylene ethynylene-
ligand based platinum-acetylide materials. To study the relationship of increased
conjugation length between two platinum moieties, a series of PhnPt2 oligomers were
synthesized, where n = 1, 2, 4 and 9. Examination of optical data concluded that the
ground state remains highly delocalized throughout the series while quickly approaching
its limit in the Ph9Pt2 compound. The extent of delocalization in the singlet and triplet
excitons seems to have been reached by Ph4Pt2, as well as the delocalization in the Tn
state. Phosphorescence yields at ambient temperatures decreased with increasing
spacer length until emission was almost elusive in the n = 9 oligomer.
There are several avenues of interest that could spawn future work in these areas.
One such project may be to examine differences between intrachain negative and
positive polaron hopping rates in platinum acetylide compounds. The confinement
energies of these states are notably different, therefore it is expected that the diffusional
rates may also differ. Design of molecules would be imperative in this study as well,
and a suitable hole trap would need to be incorporated into a platinum acetylide, ideally
a trap with a distinct spectroscopic fingerprint that absorbs in different regions of the
spectrum than the platinum acetylide radical cations.
147
Another avenue of interest would be to further investigate the properties of the
PhnPt2 series in terms of their potential applications in nonlinear absorption. It is well
known that platinum acetylides are good candidates in this field, and the higher
conjugation lengths between platinum moieties may be of interest toward these
applications. Using a variable-wavelength excitation source such as an optically
parametric oscillator (OPO), a greater understanding of the multiphoton absorption
properties could be investigated. These properties could also be examined on a
temporal scale, that is, through excitation by a short (ps) laser pulse. Such information
is essential in the development of materials for use as broad-band optical limiters.
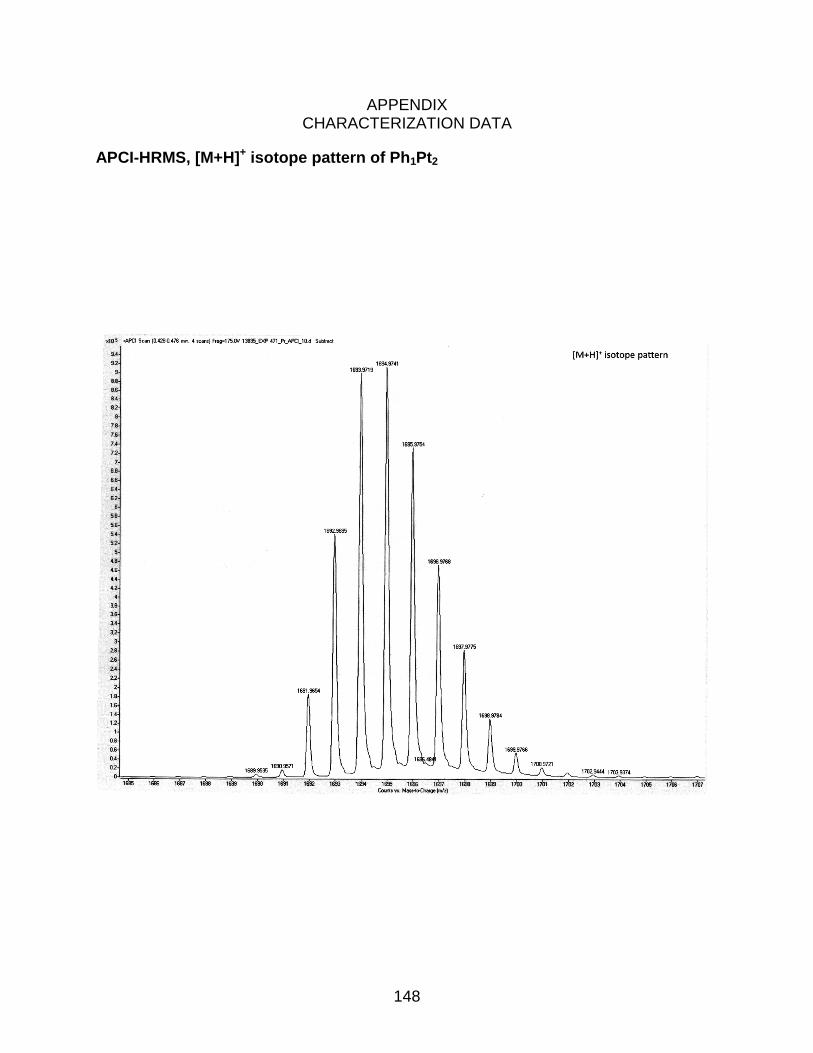
148
APPENDIX CHARACTERIZATION DATA
APCI-HRMS, [M+H]+ isotope pattern of Ph1Pt2
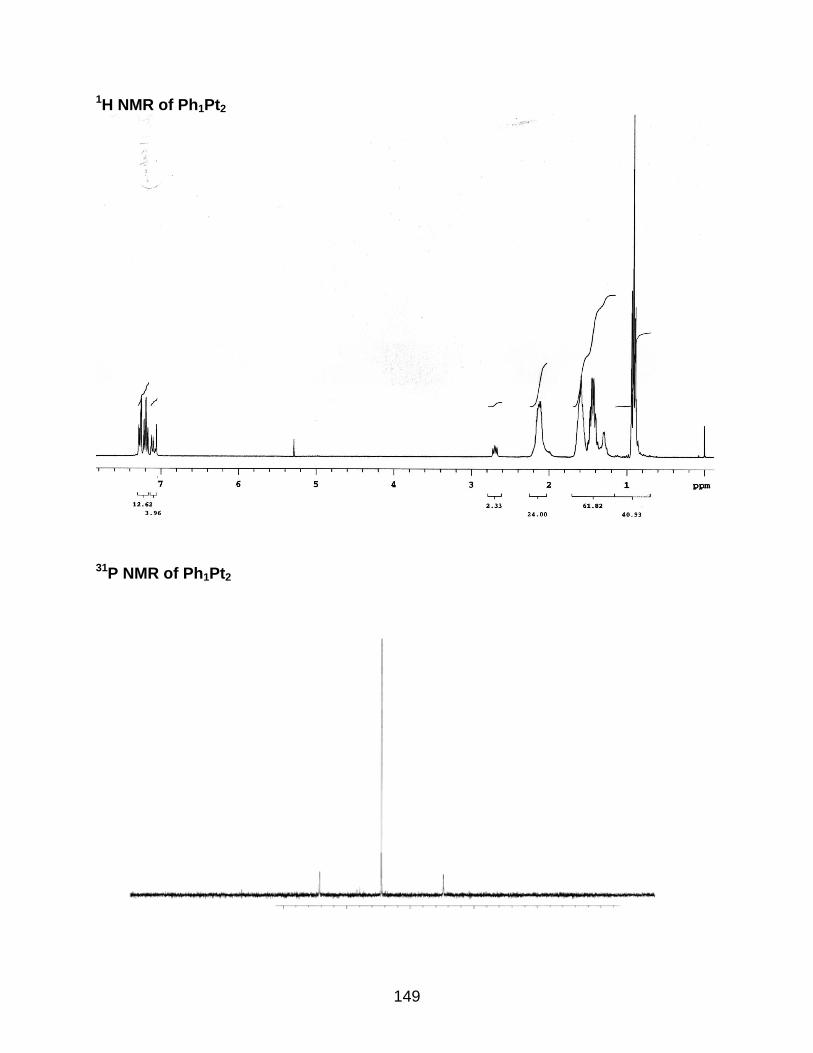
149
1H NMR of Ph1Pt2
31P NMR of Ph1Pt2
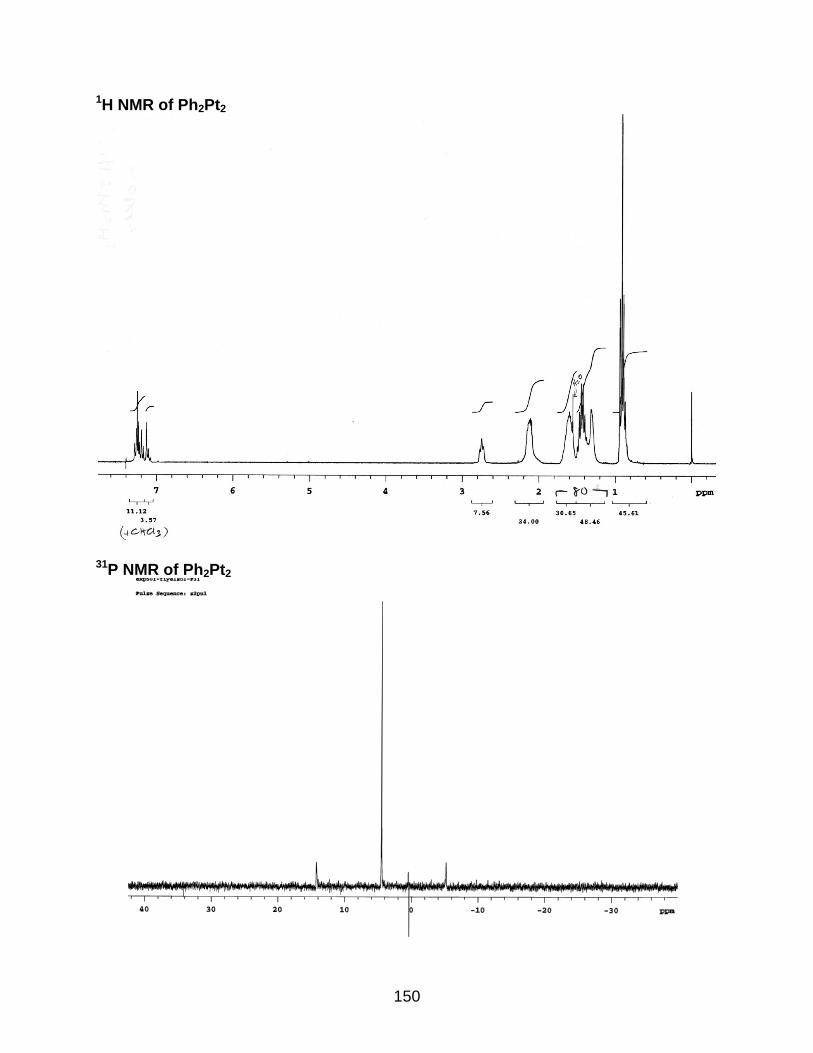
150
1H NMR of Ph2Pt2
31P NMR of Ph2Pt2
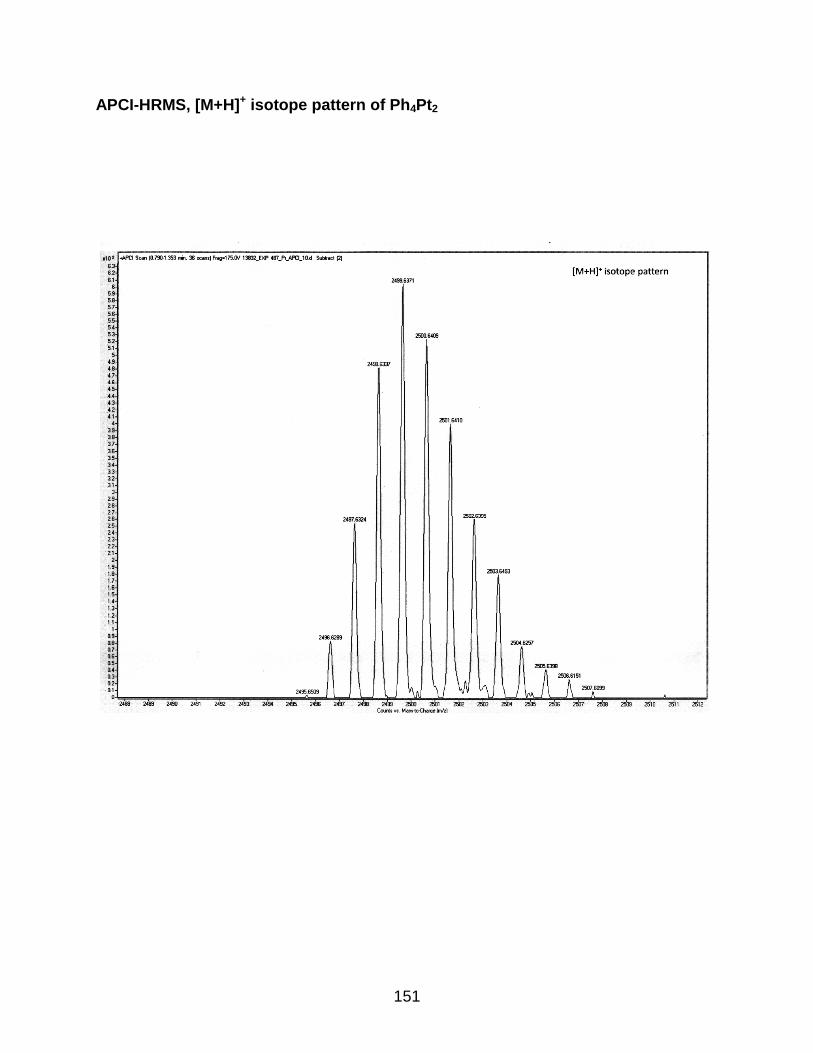
151
APCI-HRMS, [M+H]+ isotope pattern of Ph4Pt2
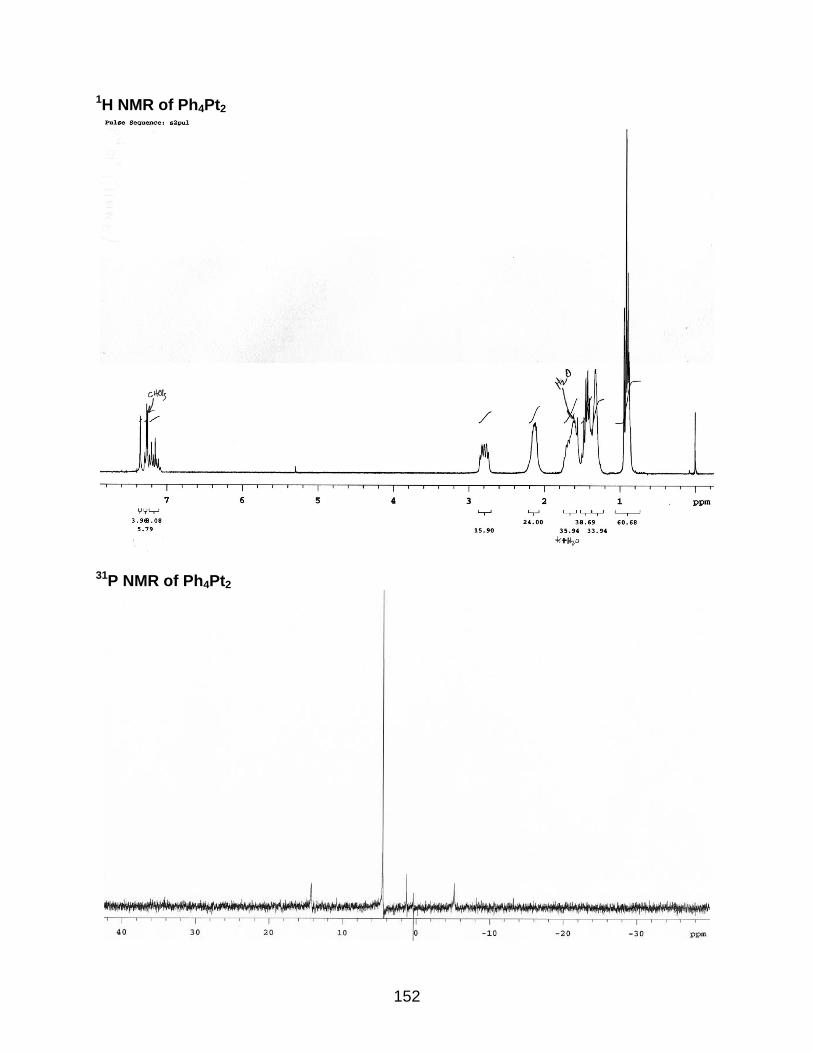
152
1H NMR of Ph4Pt2
31P NMR of Ph4Pt2
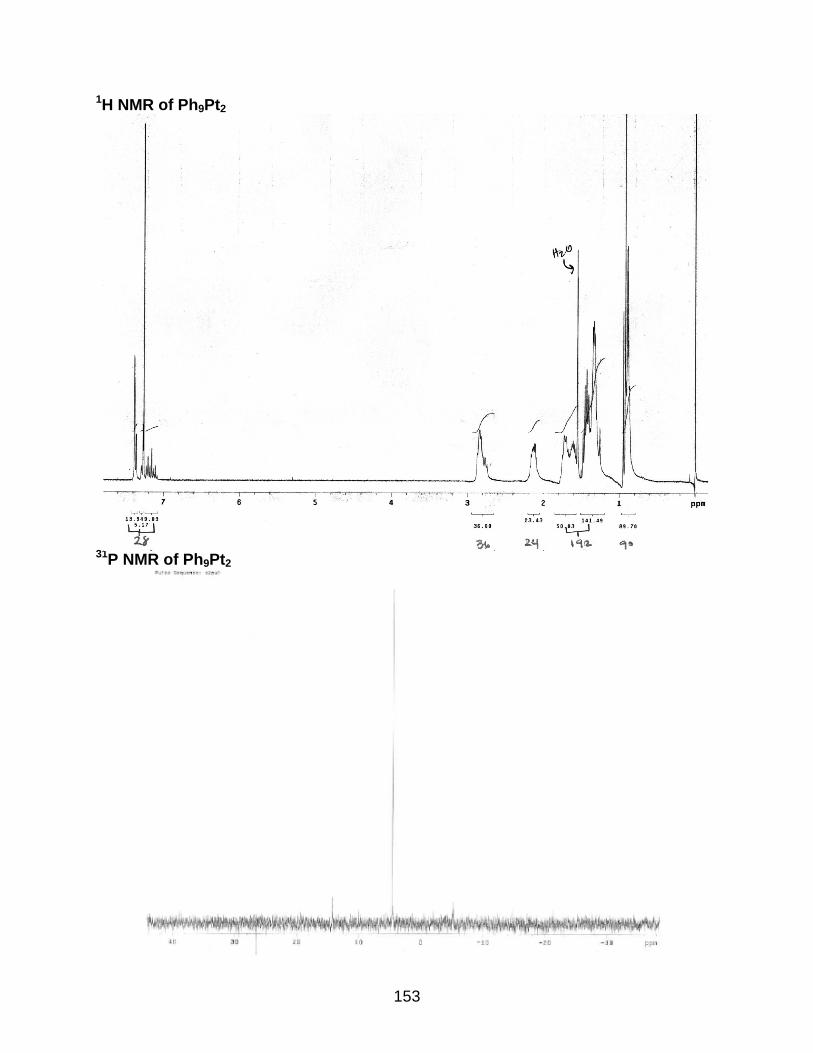
153
1H NMR of Ph9Pt2
31P NMR of Ph9Pt2
154
REFERENCES
1. Atkins, P. W., Physical Chemistry. W. H. Freeman and Co.: New York, 1940.
2. Tripler, P. A., Physics for Scientists and Engineers. Worth Publishers: New York, 1994.
3. Born, N., Atomic Theory and the Description of Nature. AMS Press: New York, 1934.
4. Newton, I., Opticks. The Warnock Library: London, 1704.
5. Turro, N. J., Modern Molecular Photochemistry. University Science Books: Sausalito, 1991.
6. Franck, J. Trans. Faraday Soc. 1926, 21, 0536-0542.
7. Condon, E. Phys. Rev. 1926, 28, 1182-1201.
8. McGlynn, S. P.; Smith, F. J.; Cilento, G. Photochem. Photobiol. 1964, 3, 269-294.
9. Ingle, J. D. J. C., S. R, In Spectrochemical Analysis. Prentice-Hall, Inc.: Upper Saddle River, 1988; p 342.
10. Wilson, J. S.; Chawdhury, N.; Al-Mandhary, M. R. A.; Younus, M.; Khan, M. S.; Raithby, P. R.; Kohler, A.; Friend, R. H. J. Am. Chem. Soc. 2001, 123, 9412-9417.
11. Williams, A. T. R.; Winfield, S. A.; Miller, J. N. Analyst 1983, 108, 1067-1071.
12. Forster, T. Discuss. Faraday Soc. 1959, 7-17.
13. Dexter, D. L. J. Chem. Phys. 1953, 21, 836-850.
14. Kim, D.; Osuka, A. Acc. Chem. Res. 2004, 37, 735-745.
15. Kavarnos, G. J., Fundamentals of Photoinduced Electron Transfer. VCH Publisher: New York, 1993.
16. Mattay, J., Topics in Current Chemistry. 1990; p 156.
17. Marcus, R. A. Rev. Mod. Phys. 1993, 65, 599-610.
18. Marcus, R. A. J. Chem. Phys. 1956, 24, 966-978.
19. Piotrowiak, P. Chem. Soc. Rev. 1999, 28, 143-150.
155
20. Closs, G. L.; Calcaterra, L. T.; Green, N. J.; Penfield, K. W.; Miller, J. R. J. Phys. Chem. 1986, 90, 3673-3683.
21. Gust, D.; Moore, T. A.; Liddell, P. A.; Nemeth, G. A.; Makings, L. R.; Moore, A. L.; Barrett, D.; Pessiki, P. J.; Bensasson, R. V.; Rougee, M.; Chachaty, C.; Deschryver, F. C.; Vanderauweraer, M.; Holzwarth, A. R.; Connolly, J. S. J. Am. Chem. Soc. 1987, 109, 846-856.
22. Turro, N. J. Pure Appl. Chem. 1981, 53, 259-286.
23. DeGraziano, J. M.; Macpherson, A. N.; Liddell, P. A.; Noss, L.; Sumida, J. P.; Seely, G. R.; Lewis, J. E.; Moore, A. L.; Moore, T. A.; Gust, D. New J. Chem. 1996, 20, 839-851.
24. Gust, D.; Moore, T. A.; Moore, A. L. Acc. Chem. Res. 2001, 34, 40-48.
25. Imahori, H.; Guldi, D. M.; Tamaki, K.; Yoshida, Y.; Luo, C. P.; Sakata, Y.; Fukuzumi, S. J. Am. Chem. Soc. 2001, 123, 6617-6628.
26. Vehmanen, V.; Tkachenko, N. V.; Tauber, A. Y.; Hynninen, P. H.; Lemmetyinen, H. Chem. Phys. Lett. 2001, 345, 213-218.
27. Imahori, H.; Fukuzumi, S. Adv. Funct. Mater. 2004, 14, 525-536.
28. Mataga, N.; Chosrowjan, H.; Taniguchi, S. J. Photochem. Photobio., C-Photochem. Rev. 2005, 6, 37-79.
29. Shirakawa, H.; Louis, E. J.; Macdiarmid, A. G.; Chiang, C. K.; Heeger, A. J. J. Chem. Soc.-Chem. Commun. 1977, 578-580.
30. Skotheim, T. A.; Reynolds, J. R., Handbook of Conducting Polymers. 3rd ed.; CRC press: Boca Raton, 2006.
31. Kokil, A.; Shiyanovskaya, I.; Singer, K. D.; Weder, C. J. Am. Chem. Soc. 2002, 124, 9978-9979.
32. Babel, A.; Jenekhe, S. A. J. Phys. Chem. B 2003, 107, 1749-1754.
33. Sirringhaus, H.; Tessler, N.; Friend, R. H. Science 1998, 280, 1741-1744.
34. Fuchigami, H.; Tsumura, A.; Koezuka, H. App. Phys. Lett. 1993, 63, 1372-1374.
35. Campbell, I. H.; Smith, D. L.; Neef, C. J.; Ferraris, J. P. App. Phys. Lett. 1999, 74, 2809-2811.
36. Adams, D. M.; Brus, L.; Chidsey, C. E. D.; Creager, S.; Creutz, C.; Kagan, C. R.; Kamat, P. V.; Lieberman, M.; Lindsay, S.; Marcus, R. A.; Metzger, R. M.; Michel-Beyerle, M. E.; Miller, J. R.; Newton, M. D.; Rolison, D. R.; Sankey, O.; Schanze, K. S.; Yardley, J.; Zhu, X. Y. J. Phys. Chem. B 2003, 107, 6668-6697.
156
37. Ashwell, G. J.; Chwialkowska, A. Chem. Commun. 2006, 1404-1406.
38. Ashwell, G. J.; Tyrrell, W. D.; Urasinska, B.; Wang, C. S.; Bryce, M. R. Chem. Commun. 2006, 1640-1642.
39. Aviram, A.; Ratner, M. A. Chem. Phys. Lett. 1974, 29, 277-283.
40. Reed, M. A.; Zhou, C.; Muller, C. J.; Burgin, T. P.; Tour, J. M. Science 1997, 278, 252-254.
41. Reed, M. A.; Tour, J. M. Scientific American 2000, 282, 86-93.
42. Wilbourn, K.; Murray, R. W. J. Phys. Chem. 1988, 92, 3642-3648.
43. Frommer, J. E. C., R. R., Encyclopedia of Polymer Science and Engineering. Wiley: New York, 1986; Vol. 5.
44. Chung, T. C.; Kaufman, J. H.; Heeger, A. J.; Wudl, F. Phys. Rev. B 1984, 30, 702-710.
45. Bredas, J. L.; Chance, R. R.; Silbey, R. Phys. Rev. B 1982, 26, 5843-5854.
46. McConnell, H. J. Chem. Phys. 1961, 35, 508-&.
47. Ratner, M. A., Jortner, J., Molecular Electronics. Blackwell: Oxford, UK, 1997; p 73-118.
48. Skotheim, T. A. E., R. L.; Reynolds, J. R., Handbook of Conducting Polymers. 2nd ed.; Marcel Dekker: New York, 1998.
49. Bernier, P., Lefrant, S., Bidan, G., Advances in Synthetic Metals. Twenty Years of Progress in Science and Technology. Elsevier: Elsevier, 1999.
50. Burroughes, J. H.; Bradley, D. D. C.; Brown, A. R.; Marks, R. N.; Mackay, K.; Friend, R. H.; Burns, P. L.; Holmes, A. B. Nature 1990, 347, 539-541.
51. Gunder, P., Nonlinear Optical Effects and Materials. Springer: New York, 2000.
52. Brabec, C. J.; Sariciftci, N. S.; Hummelen, J. C. Adv. Funct. Mater. 2001, 11, 15-26.
53. Burrows, H. D.; de Melo, J. S.; Serpa, C.; Arnaut, L. G.; Miguel, M. D.; Monkman, A. P.; Hamblett, I.; Navaratnam, S. Chem. Phys. 2002, 285, 3-11.
54. Monkman, A.; Burrows, D. Synth. Met. 2004, 141, 81-86.
55. Candeias, L. P.; Grozema, F. C.; Padmanaban, G.; Ramakrishnan, S.; Siebbeles, L. D. A.; Warman, J. M. J. Phys. Chem. B 2003, 107, 1554-1558.
157
56. Swager, T. M.; Gil, C. J.; Wrighton, M. S. J. Phys. Chem. 1995, 99, 4886-4893.
57. Pschirer, N. G.; Byrd, K.; Bunz, U. H. F. Macromolecules 2001, 34, 8590-8592.
58. Beljonne, D.; Pourtois, G.; Silva, C.; Hennebicq, E.; Herz, L. M.; Friend, R. H.; Scholes, G. D.; Setayesh, S.; Mullen, K.; Bredas, J. L. Proc. Natl. Acad. Sci. U. S. A. 2002, 99, 10982-10987.
59. Silverman, E. E.; Cardolaccia, T.; Zhao, X. M.; Kim, K. Y.; Haskins-Glusac, K.; Schanze, K. S. In The triplet state in Pt-acetylide oligomers, polymers and copolymers, 2005; pp 1491-1500.
60. Swager, T. M. Acc. Chem. Res. 1998, 31, 201-207.
61. Zhou, Q.; Swager, T. M. J. Am. Chem. Soc. 1995, 117, 12593-12602.
62. Wang, B.; Wasielewski, M. R. J. Am. Chem. Soc. 1997, 119, 12-21.
63. Westlund, R.; Malmstrom, E.; Lopes, C.; Ohgren, J.; Rodgers, T.; Saito, Y.; Kawata, S.; Glimsdal, E.; Lindgren, M. Adv. Funct. Mater. 2008, 18, 1939-1948.
64. Wilson, J. S.; Dhoot, A. S.; Seeley, A.; Khan, M. S.; Kohler, A.; Friend, R. H. Nature 2001, 413, 828-831.
65. Sonogashira, K.; Takahashi, S.; Hagihara, N. Macromolecules 1977, 10, 879-880.
66. Sonogashira, K.; Fujikura, Y.; Yatake, T.; Toyoshima, N.; Takahashi, S.; Hagihara, N. J. Organomet. Chem. 1978, 145, 101-108.
67. Takahashi, S.; Kariya, M.; Yatake, T.; Sonogashira, K.; Hagihara, N. Macromolecules 1978, 11, 1063-1066.
68. Johnson, B. F. G.; Kakkar, A. K.; Khan, M. S.; Lewis, J.; Dray, A. E.; Friend, R. H.; Wittmann, F. J. Mater. Chem. 1991, 1, 485-486.
69. Mather, G. G.; Pidcock, A.; Rapsey, G. J. N. J. Chem. Soc.-Dalton Trans. 1973, 2095-2099.
70. Sonogashira, K.; Kataoka, S.; Takahashi, S.; Hagihara, N. J. Organomet. Chem. 1978, 160, 319-327.
71. Lewis, J.; Long, N. J.; Raithby, P. R.; Shields, G. P.; Wong, W. Y.; Younus, M. J. Chem. Soc.-Dalton Trans. 1997, 4283-4288.
72. Beljonne, D.; Wittmann, H. F.; Kohler, A.; Graham, S.; Younus, M.; Lewis, J.; Raithby, P. R.; Khan, M. S.; Friend, R. H.; Bredas, J. L. J. Chem. Phys. 1996, 105, 3868-3877.
158
73. Kohler, A.; Wilson, J. S.; Friend, R. H.; Al-Suti, M. K.; Khan, M. S.; Gerhard, A.; Bassler, H. J. Chem. Phys. 2002, 116, 9457-9463.
74. Crabtree, R. H., The Organometallic Chemistry of the Transition Metals. John Wiley & Sons, Inc.: Hoboken, 2005.
75. Frapper, G.; Kertesz, M. Inorg. Chem. 1993, 32, 732-740.
76. Chawdhury, N.; Kohler, A.; Friend, R. H.; Wong, W. Y.; Lewis, J.; Younus, M.; Raithby, P. R.; Corcoran, T. C.; Al-Mandhary, M. R. A.; Khan, M. S. J. Chem. Phys. 1999, 110, 4963-4970.
77. Cooper, T. M.; Blaudeau, J. P.; Hall, B. C.; Rogers, J. E.; McLean, D. G.; Liu, Y. L.; Toscano, J. P. Chem. Phys. Lett. 2004, 400, 239-244.
78. Lewis, J.; Khan, M. S.; Kakkar, A. K.; Johnson, B. F. G.; Marder, T. B.; Fyfe, H. B.; Wittmann, F.; Friend, R. H.; Dray, A. E. J. Organomet. Chem. 1992, 425, 165-176.
79. Younus, M.; Kohler, A.; Cron, S.; Chawdhury, N.; Al-Mandhary, M. R. A.; Khan, M. S.; Lewis, J.; Long, N. J.; Friend, R. H.; Raithby, P. R. Angew. Chem.-Int. Edit. 1998, 37, 3036-3039.
80. Chawdhury, N.; Younus, M.; Raithby, P. R.; Lewis, J.; Friend, R. H. Opt. Mat. 1998, 9, 498-501.
81. Chawdhury, N.; Kohler, A.; Friend, R. H.; Younus, M.; Long, N. J.; Raithby, P. R.; Lewis, J. Macromolecules 1998, 31, 722-727.
82. Wittmann, H. F.; Friend, R. H.; Khan, M. S.; Lewis, J. J. Chem. Phys. 1994, 101, 2693-2698.
83. Khan, M. S.; Al-Mandhary, M. R. A.; Al-Suti, M. K.; Corcoran, T. C.; Al-Mahrooqi, Y.; Attfield, J. P.; Feeder, N.; David, W. I. F.; Shankland, K.; Friend, R. H.; Kohler, A.; Marseglia, E. A.; Tedesco, E.; Tang, C. C.; Raithby, P. R.; Collings, J. C.; Roscoe, K. P.; Batsanov, A. S.; Stimson, L. M.; Marder, T. B. New J. Chem. 2003, 27, 140-149.
84. Khan, M. S.; Al-Mandhary, M. R. A.; Al-Suti, M. K.; Feeder, N.; Nahar, S.; Kohler, A.; Friend, R. H.; Wilson, P. J.; Raithby, P. R. J. Chem. Soc.-Dalton Trans. 2002, 2441-2448.
85. Khan, M. S.; Al-Mandhary, M. R. A.; Al-Suti, M. K.; Hisahm, A. K.; Raithby, P. R.; Ahrens, B.; Mahon, M. F.; Male, L.; Marseglia, E. A.; Tedesco, E.; Friend, R. H.; Kohler, A.; Feeder, N.; Teat, S. J. J. Chem. Soc.-Dalton Trans. 2002, 1358-1368.
86. Wilson, J. S.; Kohler, A.; Friend, R. H.; Al-Suti, M. K.; Al-Mandhary, M. R. A.; Khan, M. S.; Raithby, P. R. J. Chem. Phys. 2000, 113, 7627-7634.
159
87. Rogers, J. E.; Cooper, T. M.; Fleitz, P. A.; Glass, D. J.; McLean, D. G. J. Phys. Chem. A 2002, 106, 10108-10115.
88. Liu, Y.; Jiang, S. J.; Glusac, K.; Powell, D. H.; Anderson, D. F.; Schanze, K. S. J. Am. Chem. Soc. 2002, 124, 12412-12413.
89. Farley, R. T.; Zheng, Q. L.; Gladysz, J. A.; Schanze, K. S. Inorg. Chem. 2008, 47, 2955-2963.
90. Tour, J. M. Chem. Rev. 1996, 96, 537-554.
91. Mullen, K.; Wegner, G. Adv. Mater. 1998, 10, 433-436.
92. Martin, R. E.; Diederich, F. Angew. Chem. Int. Ed. Engl. 1999, 38, 1351-1377.
93. Tour, J. M. J. Org. Chem. 2007, 72, 7477-7496.
94. Liu; Y. Li, Y.; Schanze, K. S. J. Photochem. Photobiol. C: Phtochem. Rev. 2002, 3, 1-23.
95. Ren, T. Organometallics 2005, 24, 4854-4870.
96. Wong, W. Y.; Ho, C. L. Coord. Chem. Rev. 2006, 250, 2627-2690.
97. Khan, M. S.; Al-Mandhary, M. R. A.; Al-Suti, M. K.; Al-Battashi, F. R.; Al-Saadi, S.; Ahrens, B.; Bjernemose, J. K.; Mahon, M. F.; Raithby, P. R.; Younus, M.; Chawdhury, N.; Kohler, A.; Marseglia, E. A.; Tedesco, E.; Feeder, N.; Teat, S. J. Dalt. Trans. 2004, 2377-2385.
98. Kohler, A.; Wittmann, H. F.; Friend, R. H.; Khan, M. S.; Lewis, J. Synth. Met. 1996, 77, 147-150.
99. Guo, F. Q.; Kim, Y. G.; Reynolds, J. R.; Schanze, K. S. Chem. Commun. 2006, 1887-1889.
100. Mei, J.; Ogawa, K.; Kim, Y.-G.; Heston, N. C.; Arenas, D. J.; Nasrollahi, Z.; McCarley, T. D.; Tanner, D. B.; Reynolds, J. R.; Schanze, K. S. ACS App. Mat. Int. 2009, 1, 150-161.
101. Rogers, J. E.; Slagle, J. E.; Krein, D. M.; Burke, A. R.; Hall, B. C.; Fratini, A.; McLean, D. G.; Fleitz, P. A.; Cooper, T. M.; Drobizhev, M.; Makarov, N. S.; Rebane, A.; Kim, K. Y.; Farley, R.; Schanze, K. S. Inorg. Chem. 2007, 46, 6483-6494.
102. G.-J. Zhou, W. Y. W. C. Y. Z. L. Adv. Funct. Mater. 2007, 17, 963-975.
103. Silverman, E. E.; Cardolaccia, T.; Zhao, X. M.; Kim, K. Y.; Haskins-Glusac, K.; Schanze, K. S. Coord. Chem. Rev. 2005, 249, 1491-1500.
160
104. Glusac, K.; Kose, M. E.; Jiang, H.; Schanze, K. S. J. Phys. Chem. B 2007, 111, 929-940.
105. Cardolaccia, T.; Li, Y. J.; Schanze, K. S. J. Am. Chem. Soc. 2008, 130, 2535-2545.
106. McKay, T. J.; Bolger, J. A.; Staromlynska, J.; Davy, J. R. J. Chem. Phys. 1998, 108, 5537-5541.
107. Wishart, J. F.; Cook, A. R.; Miller, J. R. Rev. Sci. Instrum. 2004, 75, 4359-4366.
108. Cardolaccia, T.; Funston, A. M.; Kose, M. E.; Keller, J. M.; Miller, J. R.; Schanze, K. S. J. Phys. Chem. B 2007, 111, 10871-10880.
109. Hennebicq, E.; Pourtois, G.; Scholes, G. D.; Herz, L. M.; Russell, D. M.; Silva, C.; Setayesh, S.; Grimsdale, A. C.; Mullen, K.; Bredas, J. L.; Beljonne, D. J. Am. Chem. Soc. 2005, 127, 4744-4762.
110. Funston, A. M.; Silverman, E. E.; Miller, J. R.; Schanze, K. S. J. Phys. Chem. B 2004, 108, 1544-1555.
111. Funston, A. M.; Silverman, E. E.; Schanze, K. S.; Miller, J. R. J. Phys. Chem. B 2006, 110, 17736-17742.
112. Asaoka, S.; Takeda, N.; Lyoda, T.; Cook, A. R.; Miller, J. R. J. Am. Chem. Soc. 2008, 130, 11912-11920.
113. Ziener, U.; Godt, A. J. Org. Chem. 1997, 62, 6137-6143.
114. Kukula, H.; Veit, S.; Godt, A. Eur. J. Org. Chem. 1999, 277-286.
115. Shortell, D. B.; Palmer, L. C.; Tour, J. M. Tetrahedron 2001, 57, 9055-9065.
116. Maya, F.; Tour, J. M. Tetrahedron 2004, 60, 81-92.
117. Flatt, A. K.; Dirk, S. M.; Henderson, J. C.; Shen, D. E.; Su, J.; Reed, M. A.; Tour, J. M. Tetrahedron 2003, 59, 8555-8570.
118. Flatt, A. K.; Yao, Y. X.; Maya, F.; Tour, J. M. J. Org. Chem. 2004, 69, 1752-1755.
119. Bauerle, P.; Fischer, T.; Bidlingmeier, B.; Stabel, A.; Rabe, J. P. Angew. Chem.-Int Edit. 1995, 34, 303-307.
120. Kromer, J.; Rios-Carreras, I.; Fuhrmann, G.; Musch, C.; Wunderlin, M.; Debaerdemaeker, T.; Mena-Osteritz, E.; Bauerle, P. Angew. Chem.-Int. Edit. 2000, 39, 3481.
121. Onitsuka, K.; Fujimoto, M.; Ohshiro, N.; Takahashi, S. Angew. Chem.-Int. Edit. 1999, 38, 689-692.
161
122. Greenfield, S. R.; Svec, W. A.; Gosztola, D.; Wasielewski, M. R. J. Am. Chem. Soc. 1996, 118, 6767-6777.
123. Lukas, A. S.; Miller, S. E.; Wasielewski, M. R. J. Phys. Chem. B 2000, 104, 931-940.
124. Schumm, J. S.; Pearson, D. L.; Tour, J. M. Angew. Chem.-Int Edit. 1994, 33, 1360-1363.
125. Jiang, H.; Lin, W. B. J. Am. Chem. Soc. 2004, 126, 7426-7427.
126. Shavaleev, N. M.; Adams, H.; Best, J.; Weinstein, J. A. J. Organomet. Chem. 2007, 692, 921-925.
127. Wilson, J. S.; Wilson, R. J.; Friend, R. H.; Kohler, A.; Al-Suti, M. K.; Al-Mandhary, M. R. A.; Khan, M. S. Phys. Rev. B 2003, 67.
128. Oevering, H.; Paddonrow, M. N.; Heppener, M.; Oliver, A. M.; Cotsaris, E.; Verhoeven, J. W.; Hush, N. S. J. Am. Chem. Soc. 1987, 109, 3258-3269.
129. Harriman, A. Chem. Commun. 1977, 777-778.
130. Kauffman, G. B.; Teter, L. A. Inorganic Syntheses 1963, 7, 9-12.
131. Redmore, N. P.; Rubtsov, I. V.; Therien, M. J. J. Am. Chem. Soc. 2003, 125, 8769-8778.
132. Cunningham, G. B.; Li, Y. T.; Liu, S. X.; Schanze, K. S. J. Phys. Chem. B 2003, 107, 12569-12572.
133. Pappenfus, T. M.; Mann, K. R. Inorg. Chem. 2001, 40, 6301-6307.
134. Jones, N. D.; Wolf, M. O.; Giaquinta, D. M. Organometallics 1997, 16, 1352-1354.
135. Barbieri, A.; Ventura, B.; Barigelletti, F.; De Nicola, A.; Quesada, M.; Ziessel, R. Inorg. Chem. 2004, 43, 7359-7368.
136. Clot, O.; Akahori, Y.; Moorlag, C.; Leznoff, D. B.; Wolf, M. O.; Batchelor, R. J.; Patrick, B. O.; Ishii, M. Inorg. Chem. 2003, 42, 2704-2713.
137. Thomas, K. R. J.; Lin, J. T.; Lin, K. J. Organometallics 1999, 18, 5285-5291.
138. Encinas, S.; Flamigni, L.; Barigelletti, F.; Constable, E. C.; Housecroft, C. E.; Schofield, E. R.; Figgemeier, E.; Fenske, D.; Neuburger, M.; Vos, J. G.; Zehnder, M. Chem.-Eur. J. 2002, 8, 137-150.
139. Graf, D. D.; Mann, K. R. Inorg. Chem. 1997, 36, 150-157.
162
140. Back, R.; Lennox, R. B. Langmuir 1992, 8, 959-964.
141. Zhu, Y. B.; Wolf, M. O. J. Am. Chem. Soc. 2000, 122, 10121-10125.
142. Baldo, M. A.; Thompson, M. E.; Forrest, S. R. Nature 2000, 403, 750-753.
143. Tang, K. C.; Liu, K. L.; Chen, I. C. Chem. Phys. Lett. 2004, 386, 437-441.
144. Ikai, M.; Tokito, S.; Sakamoto, Y.; Suzuki, T.; Taga, Y. App. Phys. Lett. 2001, 79, 156-158.
145. Adachi, C.; Baldo, M. A.; Forrest, S. R.; Thompson, M. E. App. Phys. Lett. 2000, 77, 904-906.
146. Baldo, M. A.; O'Brien, D. F.; You, Y.; Shoustikov, A.; Sibley, S.; Thompson, M. E.; Forrest, S. R. Nature 1998, 395, 151-154.
147. Adachi, C.; Baldo, M. A.; Thompson, M. E.; Forrest, S. R. J. App. Phys. 2001, 90, 5048-5051.
148. Glusac, K. D. S., K. S. Polymer Preprints 2002, 43, 87-88.
149. Weiss, E. A. W., M. R.; Ratner, M.A., Molecules as Wires: Molecule-Assisted Movement of Charge and Energy. Top. Cur. Chem. Springer-Verlag: Berline Heidelberg, 2005.
150. Takeda, N.; Asaoka, S.; Miller, J. R. J. Am. Chem. Soc. 2006, 128, 16073-16082.
151. Demas, J. N.; Crosby, G. A. J. Phys. Chem. 1971, 75, 991-&.
152. Wishart, J. F., Accelerators for Ultrafast Phenomena in "Radiation Chemistry: Present Status and Future Trends". Elsevier Science: 2001; Vol. 87, p 21-35.
153. Miller, J. R., Penfield, K., Johnson, M., Closs, G., Green, N. Adv. Chem. Ser. 1998, 254, 161-176.
154. De Waele, V.; Sorgues, S.; Pernot, P.; Marignier, J. L.; Monard, H.; Larbre, J. P.; Mostafavi, M. Chem. Phys. Lett. 2006, 423, 30-34.
155. De Waele, V.; Sorgues, S.; Pernot, P.; Marignier, J. L.; Mostafavi, M. Nucl. Sci. Tech.s 2007, 18, 10-15.
156. Cook, A. R.; Shen, Y. Z. Rev. Sci. Instrum. 2009, 80.
157. Tranthi, T. H.; Koulkes-Pujo, A. M. J. Phys. Chem. 1983, 87, 1166-1169.
158. Danilov, E. O.; Pomestchenko, I. E.; Kinayyigit, S.; Gentili, P. L.; Hissler, M.; Ziessel, R.; Castellano, F. N. J. Phys. Chem. A 2005, 109, 2465-2471.
163
159. Martin, R. E.; Diederich, F. Angew. Chem.-Int. Edit. 1999, 38, 1350-1377.
160. Tour, J. M. Chem. Rev. 1996, 96, 537-553.
161. Moore, J. S. Acc. Chem. Res. 1997, 30, 402-413.
162. Glusac, K. D.; Jiang, S. J.; Schanze, K. S. Chem. Commun. 2002, 2504-2505.
163. Gosztola, D.; Niemczyk, M. P.; Svec, W.; Lukas, A. S.; Wasielewski, M. R. J. Phys. Chem. A 2000, 104, 6545-6551.
164. Sreearunothai, P.; Asaoka, S.; Cook, A. R.; Miller, J. R. J. Phys. Chem. A 2009, 113, 2786-2795.
165. Asaoka, S. T., Norihiko; Iyoda, Tomokazu; Cook, Andrew; Miller, John R. J. Am. Chem. Soc. submitted.
166. Grozema, F. C.; Hoofman, R.; Candeias, L. P.; de Haas, M. P.; Warman, J. M.; Siebbeles, L. D. A. J. Phys. Chem. A 2003, 107, 5976-5986.
167. Schanze, K. S.; Silverman, E. E.; Zhao, X. M. J. Phys. Chem. B 2005, 109, 18451-18459.
168. Closs, G. L.; Johnson, M. D.; Miller, J. R.; Piotrowiak, P. J. Am. Chem. Soc. 1989, 111, 3751-3753.
169. Kim, K.; Jordan, K. D.; Paddonrow, M. N. J. Phys. Chem. 1994, 98, 11053-11058.
170. Sikes, H. D.; Smalley, J. F.; Dudek, S. P.; Cook, A. R.; Newton, M. D.; Chidsey, C. E. D.; Feldberg, S. W. Science 2001, 291, 1519-1523.
171. Creager, S.; Yu, C. J.; Bamdad, C.; O'Connor, S.; MacLean, T.; Lam, E.; Chong, Y.; Olsen, G. T.; Luo, J. Y.; Gozin, M.; Kayyem, J. F. J. Am. Chem. Soc. 1999, 121, 1059-1064.
172. Giacalone, F.; Segura, J. L.; Martin, N.; Guldi, D. M. J. Am. Chem. Soc. 2004, 126, 5340-5341.
173. Atienza, C.; Martin, N.; Wielopolski, M.; Haworth, N.; Clark, T.; Guldi, D. M. Chem. Commun. 2006, 3202-3204.
174. Atienza-Castellanos, C.; Wielopolski, M.; Guldi, D. M.; van der Pol, C.; Bryce, M. R.; Filippone, S.; Martin, N. Chem. Commun. 2007, 5164-5166.
175. Albinsson, B.; Martensson, J. J. Photochem. Photobio., C-Photochem. Rev. 2008, 9, 138-155.
164
176. Sachs, S. B.; Dudek, S. P.; Hsung, R. P.; Sita, L. R.; Smalley, J. F.; Newton, M. D.; Feldberg, S. W.; Chidsey, C. E. D. J. Am. Chem. Soc. 1997, 119, 10563-10564.
177. Warman, J. M.; Smit, K. J.; Jonker, S. A.; Verhoeven, J. W.; Oevering, H.; Kroon, J.; Paddon-Row, M. N.; Oliver, A. M. Chem. Phys. 1993, 170, 359-80.
178. Cooper, T. M.; McLean, D. G.; Rogers, J. E. Chem. Phys. Lett. 2001, 349, 31-36.
179. Rogers, J. E.; Hall, B. C.; Hufnagle, D. C.; Slagle, J. E.; Ault, A. P.; McLean, D. G.; Fleitz, P. A.; Cooper, T. M. J. Chem. Phys. 2005, 122, 214701-214708.
180. Cooper, T. M.; Krein, D. M.; Burke, A. R.; McLean, D. G.; Rogers, J. E.; Slagle, J. E.; Fleitz, P. A. J. Phys. Chem. A 2006, 110, 4369-4375.
181. Cooper, T. M.; Hall, B. C.; McLean, D. G.; Rogers, J. E.; Burke, A. R.; Turnbull, K.; Weisner, A.; Fratini, A.; Liu, Y.; Schanze, K. S. J. Phys. Chem. A 2005, 109, 999-1007.
182. Cooper, T. M.; Krein, D. M.; Burke, A. R.; McLean, D. G.; Rogers, J. E.; Slagle, J. E. J. Phys. Chem. A 2006, 110, 13370-13378.
183. Farley, R. T. Photophysics of Platinum and Iridium Organometallic Materials: From Molecular Wires to Nonlinear Optics. Dissertation, University of Florida, Gainesville, 2007.
184. Huang, S. L.; Tour, J. M. Tet. Lett. 1999, 40, 3347-3350.
185. Lulinski, P.; Skulski, L. Bull. Chem. Soc. Jpn. 2000, 73, 951-956.
186. Emmert, L. A.; Choi, W.; Marshall, J. A.; Yang, J.; Meyer, L. A.; Brozik, J. A. J. Phys. Chem. A 2003, 107, 11340-11346.
187. Staromlynska, J.; McKay, T. J.; Bolger, J. A.; Davy, J. R. J. Opt. Soc. Am. B-Opt. Phys. 1998, 15, 1731-1736.
188. Beljonne, D.; Shuai, Z.; Pourtois, G.; Bredas, J. L. J. Phys. Chem. A 2001, 105, 3899-3907.
189. Rehahn, H. S. t., A.-D.; Feast, W. J. Synthesis 1988, 5, 386-388.

165
BIOGRAPHICAL SKETCH
Julia Marie Keller was born in Owensboro, Kentucky, daughter to Stephen and
Rebecca Raymer, along with her identical twin sister, Stephanie. She attended
Western Kentucky University in Bowling Green, Kentucky on a music scholarship from
1998-2002, graduating in May 2002 summa cum laude and college scholar with a B.S.
in chemistry. She then attended graduate school at WKU from 2002-2004, working
under Professor Donald W. Slocum in the area of Directed ortho-Metalation chemistry.
During this time, she was awarded the McNally Graduate Fellowship and attained an
M.S. in chemistry. Julia then attended the University of Florida for graduate school,
working under Professor Kirk S. Schanze in the area of physical organic chemistry,
studying the synthesis and photophysics of Platinum Acetylide materials. During this
time, Julia was awarded a Proctor and Gamble Fellowship, both a Departmental and a
University Teaching Award, the Jones Award for Creativity, and the Proctor and Gamble
Award for Excellence in Graduate Research. She was also one of fifty U.S. delegates
selected to attend the Meeting of the Nobel Laureates in Lindau, Germany (funded by
ORAU). During this time of studying for her doctoral degree in chemistry, Julia married
Jonathan Keller in December of 2005; they had their first son, Joshua, in June 2008 and
are expecting the arrival of their daughter Hayleigh in May 2010.


![Polarons - arXiv.org e-Print archivearXiv:cond-mat/0004497v2 [cond-mat.str-el] 30 Apr 2000 Polarons J.T. Devreese Universiteit Antwerpen, Belgium, and Technische Universiteit Eindhoven,](https://img.dokumen.tips/doc/110x75/5eda5ef8b3745412b5713b73/polarons-arxivorg-e-print-archive-arxivcond-mat0004497v2-cond-matstr-el.jpg)