Embed Size (px)
Citation preview
Chem. Rev. 1995, 95, 677-695 677
Characterization of Catalytic Surfaces by Isotopic-Transient Kinetics during Steady-State Reaction
Schohn L. Shannon and James G. Goodwin, Jr.*
Chemical and Petroleum Engineering Deparfmenf, University of Pittsburgh, Pittsburgh, Pennsylvania 15261
Received November 17, 1994 (Revised Manuscript Received Februaly 14, 1995)
Contents I.
11. 111. IV. V. VI.
VII. VIII.
IX.
lntroduction Experimental Measurement SSITKA Reaction Parameter Determinations Mechanistic Assessments Experimental Considerations Reactions Studied Future Directions for SSITKA Summary References
677 677 678 685 686 690 693 693 694
1. lntroduction Steady-state isotopic-transient kinetic analysis
(SSITKA) is a very useful technique for the kinetic study of heterogeneous catalytic reactions. Initially developed by Happe1,l Bennett,2 and Biloen? SSITKA has been used in a number of studies to determine in situ kinetic information about the reaction mech- anism and the catalyst-surface reaction intermedi- ates. The technique is based upon the detection of isotopic labels in the reactor effluent species versus time following a switch (step change) in the isotopic labeling of one of the reactant species in the reactor feed. In addition to maintaining isothermal and isobaric reaction conditions, the reactant and product concentrations and flow rates remain undisturbed during the step change. Thus, in the absence of isotopic mass effects, steady-state reaction conditions are maintained under isotopic-transient operation. The reaction intermediates present on the catalyst surface do not change, and unlike for other transient technique^,^-^ analysis of the steady- state kinetic behavior of the catalyst surface is possible. An isotopic-step input is typically used so that the transient behavior of the less-active catalytic sites is included in the kinetic determinations, information which may be lost when using an isotopic-pulse technique. Steady-state kinetic information which has been obtained from SSITKA includes concentra- tions of different types of adsorbed reaction interme- diates, coverages, surface lifetimes, site heterogene- ity, activity distributions, and identification of possible mechanisms.
This overview of SSITKA includes discussions of the technique of steady-state isotopic-transient label- ing for kinetic study, the mathematical formalisms used in transient analysis, the kinetic parameters
* To whom all correspondence should be addressed.
0009-2665/95/0795-0677$15.50/0
which can be obtained, the experimental consider- ations of the technique, and the reactions to which SSITKA has been applied.
/I. Experimental Measurement
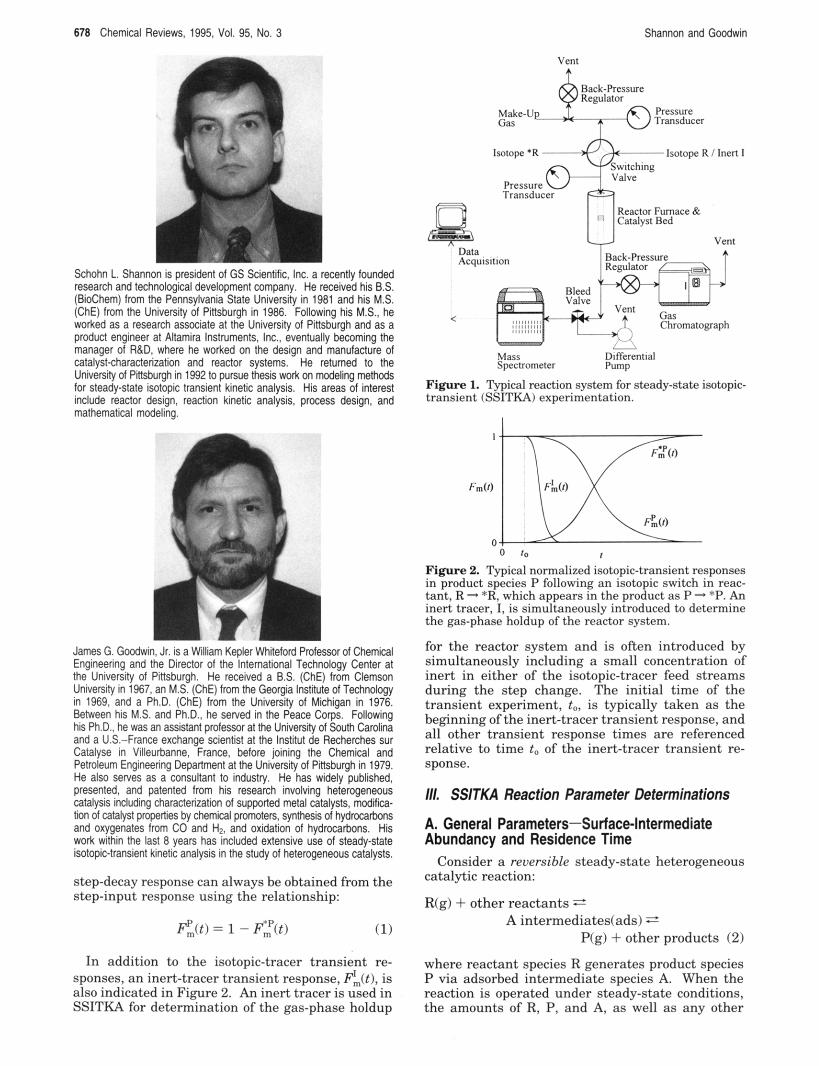
The SSITKA method is based upon the inclusion of one or more stable isotopic labels in a reactant species. A typical SSITKA reaction system is shown in Figure 1. Beginning at steady-state reaction conditions using a particular isotopic label, the inlet feed stream is switched to another feed stream containing a different isotopic labeling of the reactant species. The result is the introduction of a step input of the new isotopic label in the reactant. If the switch is performed quickly and the feed streams are pres- sure and flow rate balanced prior to the switch, steady-state conditions, in the absence of isotopic mass effects, of the reaction system are maintained. As the reactant progresses through the reactor and reacts on the catalyst surface to form product, the new isotopic label is distributed between reaction product(s) and unreacted reactant as the old isotopic label is replaced by the new isotopic label. The decaying transient response of the old label and the increasing transient response of the new label are monitored at the system outlet by a mass spectrom- eter to differentiate between the isotopic masses. If the mass spectrometer is operated under minimal fragmentation of the detected effluent species, the transient responses of the isotopic labels specific to different product species can be determined. A gas chromatograph is usually used to calibrate the mass spectrometer detection of the reactant and product concentrations.
Figure 2 presents the typical transient responses, also termed relaxation curves, of a differential-bed plug-flow reactor (PFR) following a step change in the isotopic labeling of reactant R, R - *R, which subsequently appears in product P as P - *P. In Figure 2, the transient response to a step input of the new isotopic label is designated as the F*,P(t) step-input response of the product (the subscript m indicates a measured response). The step-input response is a statistical distribution representing the probability that an isotopic label remains adsorbed on the catalyst surface or appears in the effluent stream with time. It has become common in SSITKA to use the step-decay response of the old isotopic label (the label prior to the switch), designated by pm(t) in Figure 2, in order to follow the isotopic transient. The
0 1995 American Chemical Society
678 Chemical Reviews, 1995, Vol. 95, No. 3 Shannon and Goodwin
Schohn L. Shannon is president 01 GS Scientific. lnc. a recently founded research and technological development company. He received his B.S. (BioChem) from the Pennsyivania State University in 1981 and his M.S. (ChE) from the University of Plnsburgh in 1986. Following his M.S., he worked as a research associate at the University of Pittsburgh and as a product engineer at Altamira Instruments, Inc., eventually becoming the manager of R&D, where he worked on the design and manufacture of catalyst-characterization and reactor systems. He returned to the University of Pinsburgh in 1992 to pursue thesis work on modeling methods for steady-state isotopic transient kinetic analysis. His areas 01 interest include reactor design, reaction kinetic analysis, process design, and mathematical modeling.
-
James G. Goodwin. Jr. is a William Kepler Whitelord Professor 01 Chemical Engineering and the Director of the International Technology Center at the University of Pinsburgh. He received a B.S. (ChE) from Clemson University in 1967, an M.S. (ChE) lrom the Georgia Institute of Technology in 1969, and a Ph.D. (ChE) from the University of Michigan in 1976. Between his M.S. and Ph.D., he SeNed in the Peace Corps. Following his Ph.D., he was an assistant professor at the University 01 South Carolina and a US.-France exchange scientist at the lnstitut de Recherches sur Catalyse in Villeurbanne. France, belore joining the Chemical and Petroleum Engineering Depaltment at the University of Pinsburgh in 1979. He also Selves as a consultant to industry He has widely published, presented, and patented from his research involving heterogeneous catalysis including characterization of suppolted metal catalysts, modifica- tion of catalyst propelties by chemical promoters, synthesis of hydrocartons and oxygenates from CO and H2, and oxidation of hydrocarbons. His work within the last 8 years has included extensive use of steady-state isotopic-transient kinetic analysis in the study of heterogeneous catalysts.
step-decay response can always be obtained from the step-input response using the relationship:
= 1 - F’,P(t) (1)
In addition to the isotopic-tracer transient re- sponses, an inert-tracer transient response, ~!, , ( t ) , is also indicated in Figure 2. An inert tracer is used in SSITKA for determination of the gas-phase holdup
Vent
Vent Data Acquisition
< Chromatograph
Mars Differential Spectrometer Pump
Figure 1. Typical reaction system for steady-state isotopic- transient (SSITKA) experimentation.
0 10 I
Figure 2. Typical normalized isotopic-transient responses in product species P following an isotopic switch in reac- tant, R - *R, which appears in the product as P - *P. An inert tracer, I, is simultaneously introduced to determine the gas-phase holdup of the reactor system.
for the reactor system and is often introduced by simultaneously including a small concentration of inert in either of the isotopic-tracer feed streams during the step change. The initial time of the transient experiment, to, is typically taken as the beginning of the inert-tracer transient response, and all other transient response times are referenced relative to time to of the inert-tracer transient re- sponse.
111. SSlTKA Reaction Paramefer Deferminations
A. General Parameters-Surface-Intermediate Abundancy and Residence Time
Consider a reversible steady-state heterogeneous catalytic reaction:
R(g) + other reactants t A intermediates(ads1 t
P(g) + other products (2)
where reactant species R generates product species P via adsorbed intermediate species A. When the reaction is operated under steady-state conditions, the amounts of R, P, and A, as well as any other
Characterization of Catalytic Surfaces by SSITKA Chemical Reviews, 1995, Vol. 95, NO. 3 679
a.) Steady-State, f < 0
R -R ra if it -A r n iz
b.) At I = O
‘R P
c.) F o r O < f < t P
‘R P, ‘P
d.) As I + m
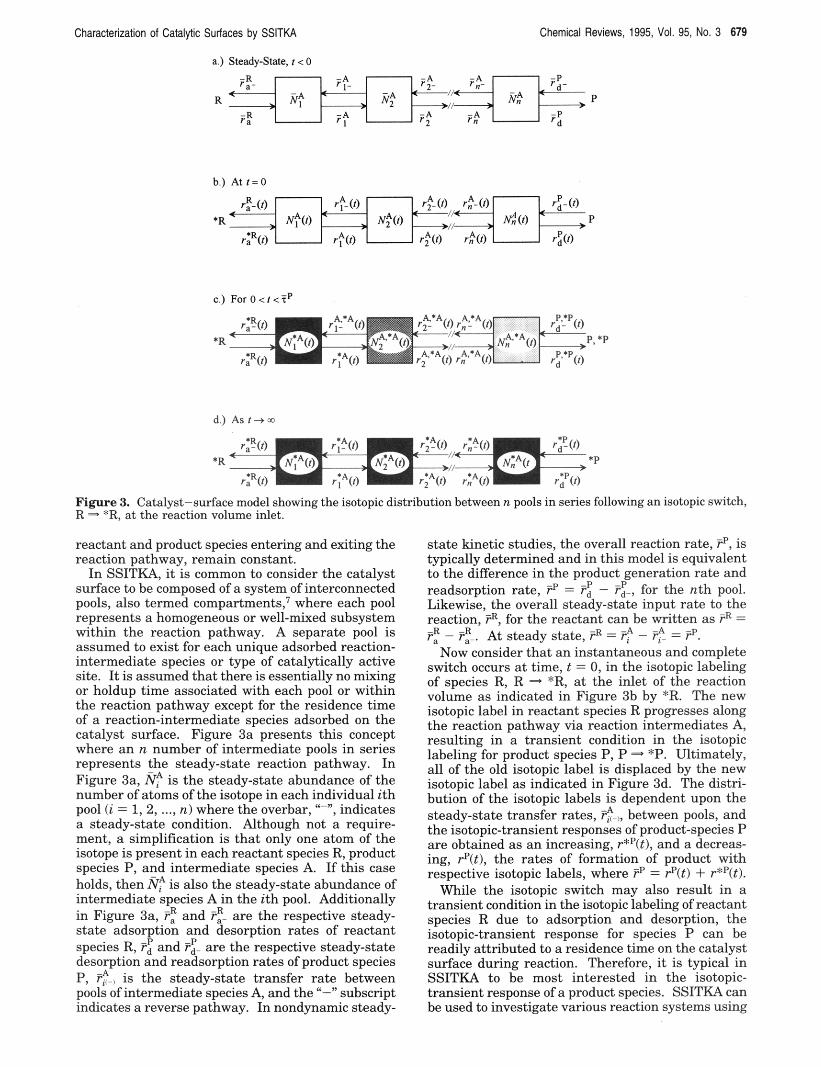
Figure 3. Catalyst-surface model showing the isotopic distribution between n pools in series following an isotopic switch, R - *R. at the reaction volume inlet.
reactant and product species entering and exiting the reaction pathway, remain constant.
In SSITKA, it is common to consider the catalyst surface to be composed of a system of interconnected pools, also termed compartments,? where each pool represents a homogeneous or well-mixed subsystem within the reaction pathway. A separate pool is assumed to exist for each unique adsorbed reaction- intermediate species or type of catalytically active site. It is assumed that there is essentially no mixing or holdup time associated with each pool or within the reaction pathway except for the residence time of a reaction-intermediate species adsorbed on the catalyst surface. Figure 3a presents this concept where an n number of intermediate pools in series represents the steady-state reaction pathway. In Figure 3a, Nf is the steady-state abundance of the number of atoms of the isotope in each individual ith pool ( i = 1,2, ..., n ) where the overbar, ‘‘-”, indicates a steady-state condition. Although not a require- ment, a simplification is that only one atom of the isotope is present in each reactant species R, product species P, and intermediate species A. If this case holds, then Nf is also the steady-state abundance of intermediate species A in the ith pool. Additionally in Figure 3a, Ff and e. are the respective steady- state adsorption and desorption rates of reactant species R, 7; and F!. are the respective steady-state desorption and readsorption rates of product species P, e.) is the steady-state transfer rate between pools of intermediate species A, and the “-” subscript indicates a reverse pathway. In nondynamic steady-
state kinetic studies, the overall reaction rate, 9, is typically determined and in this model is equivalent to the difference in the product generation rate and readsorption rate, FP = i$ - Fz., for the nth pool. Likewise, the overall steady-state input rate to the reaction, F, for the reactant can be written as F = Fz - e-. At steady state, F =
Now consider that an instantaneous and complete switch occurs a t time, t = 0, in the isotopic labeling of species R, R - *R, at the inlet of the reaction volume as indicated in Figure 3b by *R. The new isotopic label in reactant species R progresses along the reaction pathway via reaction intermediates A, resulting in a transient condition in the isotopic labeling for product species P, P - *P. Ultimately, all of the old isotopic label is displaced by the new isotopic label as indicated in Figure 3d. The distri- bution of the isotopic labels is dependent upon the steady-state transfer rates, e.), between pools, and the isotopic-transient responses of product-species P are obtained as an increasing, r*4t), and a decreas- ing, P(t), the rates of formation of product with respective isotopic labels, where Fp = rP(t) + r*P(t).
While the isotopic switch may also result in a transient condition in the isotopic labeling of reactant species R due to adsorption and desorption, the isotopic-transient response for species P can be readily attributed to a residence time on the catalyst surface during reaction. Therefore, it is typical in SSITKA to be most interested in the isotopic- transient response of a product species. SSITKA can be used to investigate various reaction systems using
- 7: = FP.
680 Chemical Reviews, 1995, Vol. 95, No. 3
a,) Decay rate
Shannon and Goodwin
a,) Decay response
b.) Production rate b.) Input response
n i / - . 4 0 2 0 r
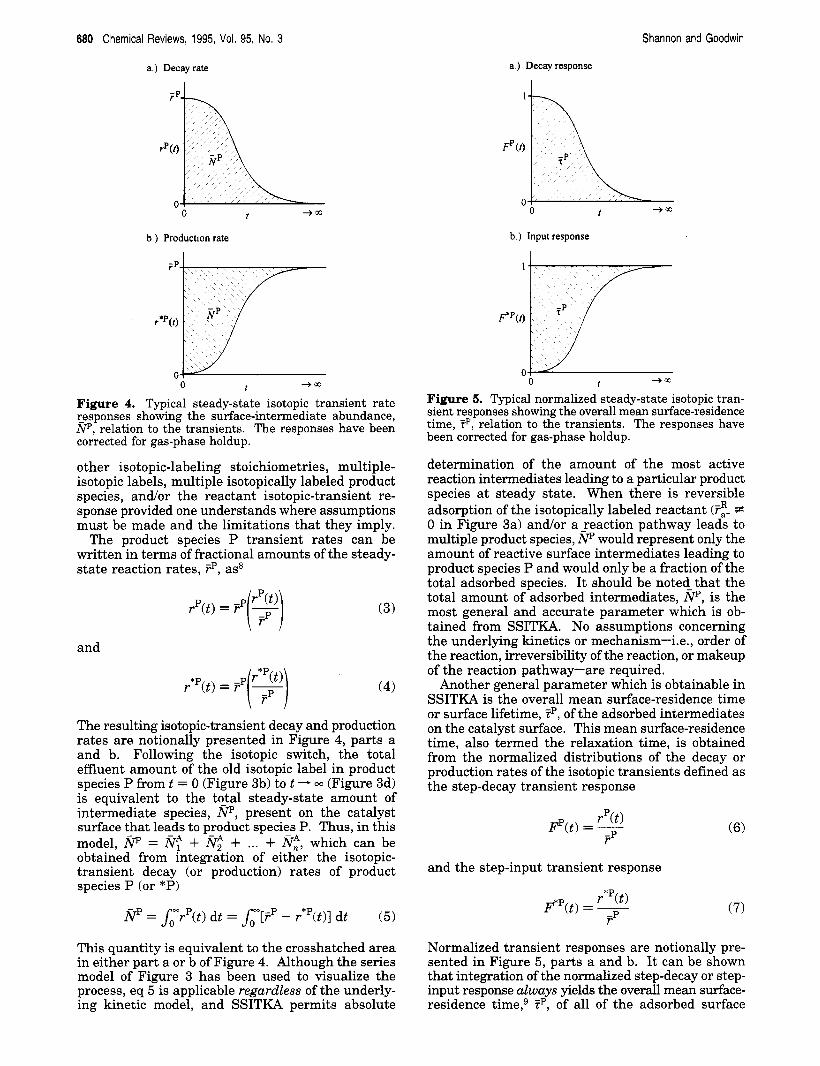
Figure 4. Typical steady-state isotopic transient rate Lesponses showing the surface-intermediate abundance, W, relation to the transients. The responses have been corrected for gas-phase holdup.
other isotopic-labeling stoichiometries, multiple- isotopic labels, multiple isotopically labeled product species, andor the reactant isotopic-transient re- sponse provided one understands where assumptions must be made and the limitations that they imply.
The product species P transient rates can be written in terms of fractional amounts of the steady- state reaction rates, F ~ , as8
and
(3)
(4)
The resulting isotopic-transient decay and production rates are notionally presented in Figure 4, parts a and b. Following the isotopic switch, the total effluent amount of the old isotopic label in product species P from t = 0 (Figure 3b) to t - DJ (Figure 3d) is equivalent to the @tal steady-state amount of intermediate species, Np, present on the catalyst surface that leads to product species P. Thus, in this model, = nf + &$ + ... + nt, which can be obtained from integration of either the isotopic- transient decay (or production) rates of product species P (or *P)
Np = hmrp(t) dt = hm[FP - r*'(t)l dt ( 5 )
This quantity is equivalent to the crosshatched area in either part a or b of Figure 4. Although the series model of Figure 3 has been used to visualize the process, eq 5 is applicable regardless of the underly- ing kinetic model, and SSITKA permits absolute
-+m - 0 r Figure 6. Typical normalized steady-state isotopic tran- sient responses showing the overall mean surface-residence time, Tp, relation to the transients. The responses have been corrected for gas-phase holdup.
determination of the amount of the most active reaction intermediates leading to a particular product species at steady state. When there is reversible adsorption of the isotopically labeled reactant (7:- 7t 0 in Figure 3a) and/or ajeaction pathway leads to multiple product species, Np would represent only the amount of reactive surface intermediates leading to product species P and would only be a fraction of the total adsorbed species. It should be noted-that the total amount of adsorbed intermediates, Np, is the most general and accurate parameter which is ob- tained from SSITKA. No assumptions concerning the underlying kinetics or mechanism-i.e., order of the reaction, irreversibility of the reaction, or makeup of the reaction pathway-are required.
Another general parameter which is obtainable in SSITKA is the overall mean surface-residence time or surface lifetime, Tp, of the adsorbed intermediates on the catalyst surface. This mean surface-residence time, also termed the relaxation time, is obtained from the normalized distributions of the decay or production rates of the isotopic transients defined as the step-decay transient response
and the step-input transient response
(7)
Normalized transient responses are notionally pre- sented in Figure 5 , parts a and b. It can be shown that integration of the normalized step-decay or step- input response aZways yields the overall mean surface- residence time,g TP, of all of the adsorbed surface
Characterization of Catalytic Surfaces by SSITKA
intermediates which lead to product species P, or
Chemical Reviews, 1995, Vol. 95, No. 3 681
n
This quantity is equivalent to the crosshatched area indicated in either part a or b in Figure 5. Like p, SSITKA permits determination of the overall mean surface-residence time, ip, of the reaction intermedi- ates at steady state leading to a particular product species regardless of the underlying kinetic model, i.e., the reaction rate expression or the reaction pathway. However, this mean surface-residence time is more subjective in its interpretation than the amount of adsorbed intermediate species, especially in the presence of reversible reaction pathways.
Rearranging eq 6, P ( t ) = PP(t), substituting this result into eq 5, and using the integral relation of eq 8 yields
and rearranging eq 9 yields
Equation 10 is the general relation for the overall reaction rate at steady state and is also valid regard- less of the underlying kinetics or mechanism. For non dynamic or global steady-state kinetic experi- ments, only the overall reaction rate, P, is determin- able. However, as indicated by eqs 5 and 8, SSITKA permits separate measurement of the abundance of surface intermediates which lead to a particular product, p, and the overall mean residence time, ip, of those intermediates on the catalyst surface, some- thing which cannot be accomplished by other global steady-state reaction methods where the determined reaction rate is the quotient of these two terms as expressed by eq 10.
While @ and ip are the most general parameters, additional kinetic parameters which can be deter- mined from SSITKA are based upon, and thus specific to, assumptions and mechanistic models for the catalyst-surface reaction. These kinetic param- eters are discussed in the following sections.
B. Specific Parameters-lrreversi ble Catalyst-Surface Models 1. Single Poo/-Irreversible Adsorption and Reaction
Consider an irreversible reaction
R(g) - A intermediates(ads1- P(g) (11)
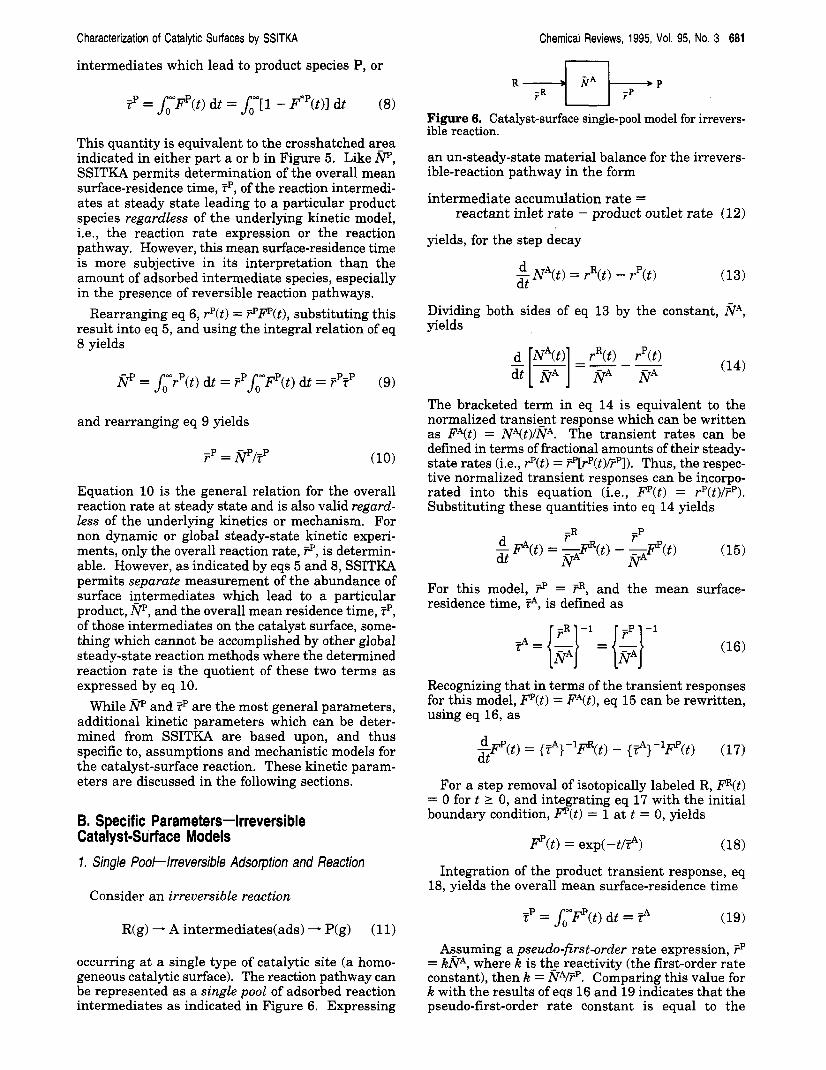
occurring at a single type of catalytic site (a homo- geneous catalytic surface). The reaction pathway can be represented as a single pool of adsorbed reaction intermediates as indicated in Figure 6. Expressing
Figure 6. Catalyst-surface single-pool model for irrevers- ible reaction.
an un-steady-state material balance for the irrevers- ible-reaction pathway in the form
intermediate accumulation rate =
yields, for the step decay
reactant inlet rate - product outlet rate (12)
d - dt NA(t) = rR( t ) - rP( t )
Dividing both sides of eq 13 by the constant, nA, yields
The bracketed term in eq 14 is equivalent to the normalized transient response which can be written as FAct) = NAct)/NA. The transient rates can be defined in terms of fractional amounts of their steady- state rates (i.e., P(t) = P[rP( t )F]) . Thus, the respec- tive normalized transient responses can be incorpo- rated into this equation (i.e., 2%) = rP(t)/FP). Substituting these quantities into eq 14 yields
For this model, P = F, and the mean surface- residence time, FA, is defined as
Recognizing that in terms of the transient responses for this model, FP(t) = FAct), eq 15 can be rewritten, using eq 16, as
For a step removal of isotopically labeled R, P(t) = 0 for t 2 0, and integrating eq 17 with the initial boundary condition, P(t) = 1 at t = 0, yields
= exp<--t/P) (18)
Integration of the product transient response, eq 18, yields the overall mean surface-residence time
= hwR@(t) dt = T? (19)
AEsuming a pseudo-first-order rate expression, P = MA, where K is th_e reactivity (the first-order rate constant), then k = N A P . Comparing this value for k with the results of eqs 16 and 19 indicates that the pseudo-first-order rate constant is equal to the
682 Chemical Reviews, 1995, Vol. 95, No. 3 Shannon and Goodwin
2
R 3f
4
w
c J
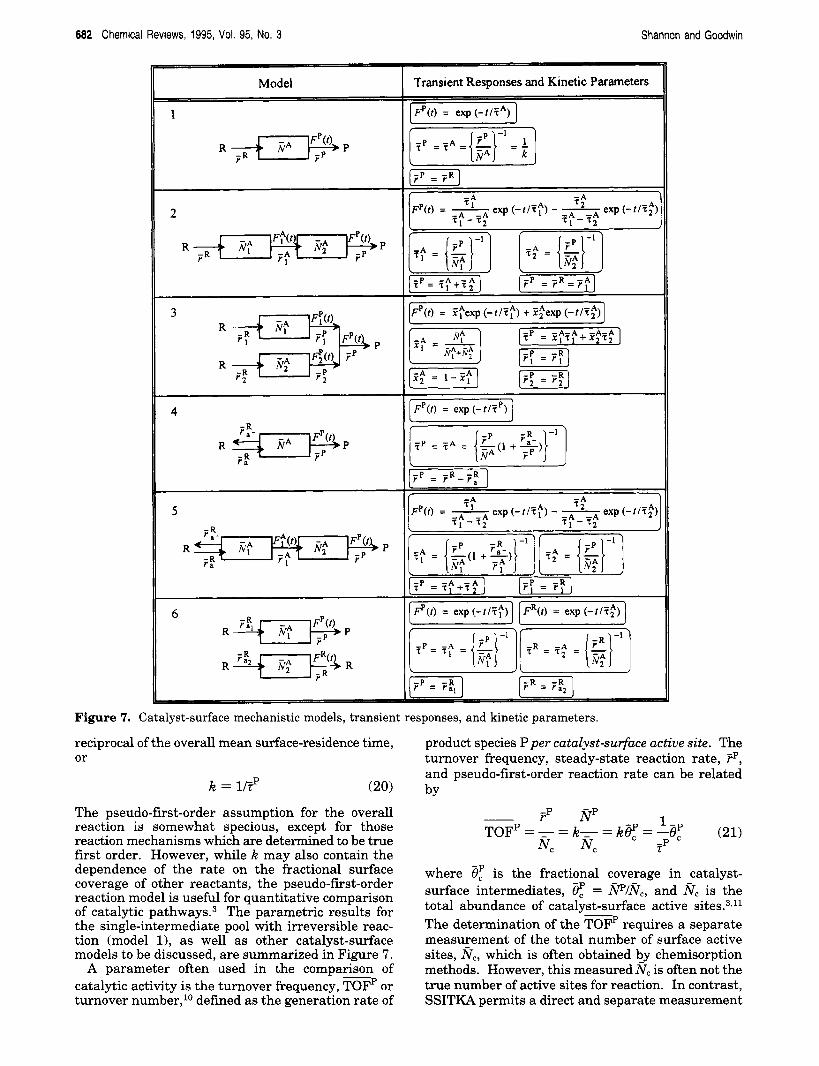
Figure 7. Catalyst-surface mechanistic models, transient responses, and kinetic parameters.
reciprocal of the overall mean surface-residence time, or
k=lP (20) The pseudo-first-order assumption for the overall reaction is somewhat specious, except for those reaction mechanisms which are determined to be true first order. However, while k may also contain the dependence of the rate on the fractional surface coverage of other reactants, the pseudo-first-order reaction model is useful for quantitative comparison of catalytic pathway^.^ The parametric results for the single-intermediate pool with irreversible reac- tion (model 11, as well as other catalyst-surface models t o be discussed, are summarized in Figure 7.
A parameter often used in the comparison of catalytic activity is the turnover frequency, TOF or turnover number,1° defined as the generation rate of
7
product species P per catalyst-surface active site. The turnover frequency, steady-state reaction rate, Fp, and pseudo-first-order reaction rate can be related by
1
where 8; is the fractional coverage in catalyst- surface intermediates, 8; = @/Nc, and Nc is the total abundance of catalyst-surface active s i t e ~ . ~ J ' The determination of the TOFP requires a separate measurement of the total number of surface active sites, Nc, which is often obtained by chemisorption methods. However, this measured N, is often not the true number of active sites for reaction. In contrast, SSITKA permits a direct and separate measurement
-
Characterization of Catalytic Surfaces by SSITKA
of the abundance of surface intermediates, p, and the reactivity, k = lEp, during the reaction at steady state. Consequently, the reactivity, k, determined by SSITKA, assuming first-order reaction, is a more accurate measure of the absolute turnover frequency.
2. Pools in Series-Irreversible Adsorption, Intermediate Pathways, and Reaction
The previous material-balance method can be extended to a serial-pool model for n number of pools, and the transient response is given by73
Chemical Reviews, 1995, Vol. 95, No. 3 683
Integration of the product transient response yields the overall mean surface-residence time
n
n = 1, 2, 3, ... (22)
Integration of the product transient response pro- vides the overall mean surface-residence time
n
9 =e= e+ ... +e= C$ (23) i = l
where the individual time constant of each interme- diate pool is given by
= {$/m;}-1 (24)
The parametric results for two pools in series (model 2) is shown in Figure 7. The overall mean surface-residence time of the isotope leading to product P, Tp, is the sum of the time constants for each pool. Since the integration is not able to provide a unique identification of the individual time con- stants attributable to each pool, other analytical techniques must be employed in order to obtain this information. One method is to use an iterative curve fit of the experimental transient response (corrected for gas-phase holdup) to determine Tf and $.12
3. Pools in ParalleF-Irreversible Adsorption and Reaction A heterogeneous catalyst surface may be charac-
terized by multiple active sites acting in parallel. Each type of site can be represented by a pool with distinct adsorbed surface intermediates.12 Following a similar derivation as that used for the single-pool model, the transient response for n parallel pools with irreversible reaction is given by
(25) i=l
where Zf is the steady-state fractional amount of the surface intermediates in the ith pool
NF i = 1, 2, e . . , n (26) -A - xi -
n
j=1
i = l
where the individual time constant of each interme- diate pool is given by
-P -1 e=[+} The parametric results for two parallel pools with
irreversible reaction (model 3) is shown in Figure 7. Since the analysis is not able to provide a unique identification of the individual time constants at- tributable to each pool, other techniques must be employed to separately determine their values. One method uses partial isotopic exchange which is discussed in a subsequent section.
C. Specific Parameters-Reversible Processes 1. Single Pool and Pools in Series-Reversible Adsorption
Consider an irreversible reaction,
R(g) t A intermediatedads) - P(g) (29)
but occurring with reversible adsorption of reactant at a single pool (model 4 in Figure 7). Expressing a material balance for the reversible pathway in the form of eq 12 and using a similar derivation as used for a single pool with irreversible reaction yields the product transient response
P(t> = exp(-t/e> (30) Integration of the product transient response yields
the overall mean surface-residence time
If one can assume-that the reactjon is pseudo-first order, then FP = kNA and k = Fp/NA, thus
(32)
If ?f- can be determined, an exact value for k can be determined. Unfortunately, this rate is difficult to determine. If k is estimated using lrtp
then the value determined fork, kest, is the maximum value possible. Obviously, as the desorption of reactant R becomes less significant (7;- << P), k approaches UTP.
The previous material-balance method can be readily extended to n number of pools in series. The parametric results for a two-serial-pool model (model

684 Chemical Reviews, 1995, Vol. 95, No. 3 Shannon and Goodwin
The time constant for each pool is given by
Figure 8. Catalyst-surface two-serial-pool model for ir- reversible reaction with a reversible reaction-intermediate step and reversible adsorption of reactant.
5) with reversible adsorption and irreversible reaction are summarized in Figure 7.
2. Pools in Series- Reversible Intermediate Pathways For a pools-in-series model involving reuersible
reaction-intermediate pathways with irreversible re- action, the previous material-balance method yields for a two-pool model (Figure 8) in convenient matrix f ~ r m ~ , ~
The material balance can be extended to multiple pools in series where each pool requires an additional material-balance equation.
In order to obtain the underlying rate parameters from the transient responses, eq 34 requires solution. Unfortunately, the material balances and their bound- ary conditions become quite complicated for even simple reaction systems, and attempts at solution often result in analytical impasses. The problem of analytical solution becomes acute in the determina- tion of product transient responses whenever a reversible reaction-intermediate pathway or overall reversible reaction is involved. Consequently, quan- titative modeling in SSITKA is currently limited to simpler irreversible-kinetic models. Due to the in- herent linearity of the isotopic-tracing method,8 qualitative analyses using Laplace transforms and transfer functions have been developed to investigate whether it is possible to uniquely identify the rate parameters or determine the difference between proposed surface models without obtaining an ana- lytical solution.13J4
3. Intermediate Pools in ParalleF Reversible Adsorption The transient response for n parallel pools with
reversible adsorption and irreversible reaction is similar to the n-parallel-pool irreversible-reaction model, except that the transient response is written in terms of the fractional amounts of the product
n
which are given by
(35)
Integration of the product transient response yields the overall mean surface-residence time
i=l
D. Specific Parameters-Reversible Reaction The presence of reversible reaction, such as in
ammonia synthesis where the NH3 is in equilibrium with the catalyst surface, presents difficulties in the interpretation of the transient responses.15 The previous model derivations have excluded reversible reactions because of the inability to be able to obtain analytical solutions for the product transient re- sponse based upon catalyst-surface modeling. This difficulty is similar to that encountered when dealing with reversible reaction-intermediate pathways. How- ever, a numerical method using nonlinear least- squares regression has been recently developed for determination of kinetic parameters based upon catalyst-surface models involving re~ersibi l i ty .~~ It should be noted that the presence of reversibility does cot prevent determination of the general parameters, Np and Tp, using SSITKA but does lead to increased complexities in the interpretation of these param- eters.
E. Surface or Intermediate Heterogeneity If it can be assumed that a reaction is pseudo-first
order, then the relative heterogeneity of the catalyst surface can be determined by the logarithmic behav- ior of the isotopic transient. Figure 9 presents the semilogarithmic plot for both the single-pool (homo- geneous) and parallel-pool (heterogeneous) models. The presence of curvature in the plot is indicative of surface heterogeneity (i.e., multiple pools in paral-
If the parallel-pool model for pseudo-first-order irreversible reaction is extended to an infinite num- ber of pools in parallel, the heterogeneity of the
ie11.15
~
+ Single Pool 0 Two Parallel Pools
r 0
Figure 9. Semilogarithmic plot contrasting homogeneous and heterogeneous catalytic-surface isotopic-transient re- s p o n s e ~ . ~ ~
Cjy? j=1
Characterization of Catalytic Surfaces by SSITKA
100-
$ .Ak) SO-
0
Chemical Reviews, 1995, Vol. 95, No. 3 685
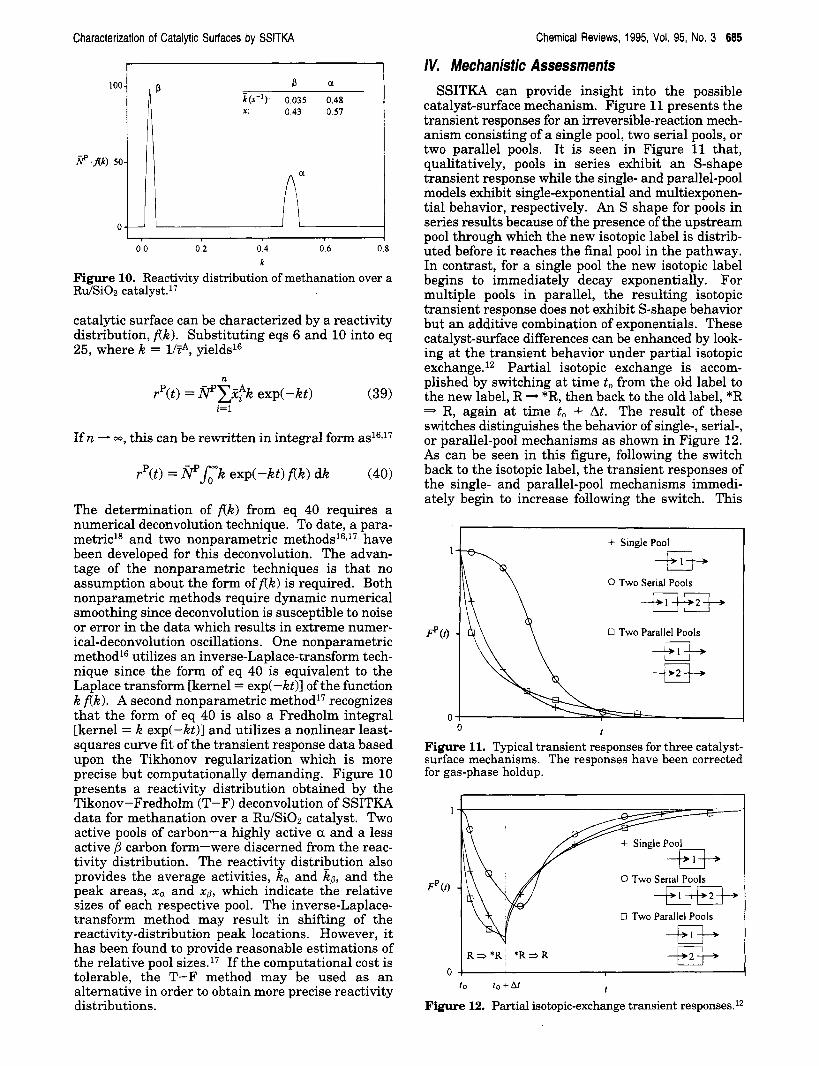
IV. Mechanistic Assessments SSITKA can provide insight into the possible
catalyst-surface mechanism. Figure 11 presents the transient responses for an irreversible-reaction mech- anism consisting of a single pool, two serial pools, or two parallel pools. It is seen in Figure 11 that, qualitatively, pools in series exhibit an S-shape transient response while the single- and parallel-pool models exhibit single-exponential and multiexponen- tial behavior, respectively. An S shape for pools in series results because of the presence of the upstream pool through which the new isotopic label is distrib- uted before it reaches the final pool in the pathway. In contrast, for a single pool the new isotopic label begins to immediately decay exponentially. For multiple pools in parallel, the resulting isotopic transient response does not exhibit S-shape behavior but an additive combination of exponentials. These catalyst-surface differences can be enhanced by look- ing at the transient behavior under partial isotopic exchange.12 Partial isotopic exchange is accom- plished by switching at time to from the old label to the new label, R *R, then back to the old label, *R - R, again at time to + At. The result of these switches distinguishes the behavior of single-, serial-, or parallel-pool mechanisms as shown in Figure 12. As can be seen in this figure, following the switch back to the isotopic label, the transient responses of the single- and parallel-pool mechanisms immedi- ately begin to increase following the switch. This
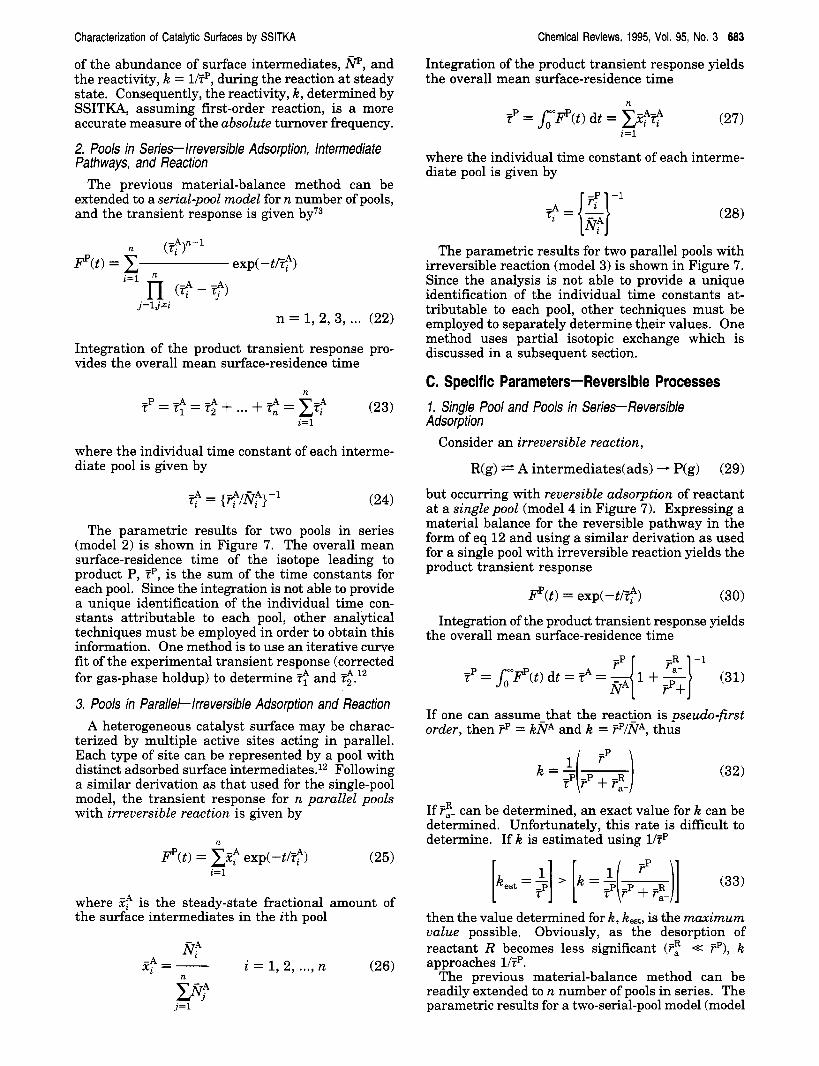
p P a k(S-') 0035 048 X 043 O S 7
-- 00 02 04 06 08
k Figure 10. Reactivity distribution of methanation over a RdSiOz cata1y~t. l~
catalytic surface can be characterized by a reactivity distribution, fck). Substituting eqs 6 and 10 into eq 25, where k = UTA, yields16
If n - 03, this can be rewritten in integral form as16J7
The determination of fck) from eq 40 requires a numerical deconvolution technique. To date, a para- metricls and two nonparametric methods16J7 have been developed for this deconvolution. The advan- tage of the nonparametric techniques is that no assumption about the form of fck) is required. Both nonparametric methods require dynamic numerical smoothing since deconvolution is susceptible to noise or error in the data which results in extreme numer- ical-deconvolution oscillations. One nonparametric method16 utilizes an inverse-Laplace-transform tech- nique since the form of eq 40 is equivalent to the Laplace transform [kernel = exp(-kt)] of the function k fck). A second nonparametric method17 recognizes that the form of eq 40 is also a Fredholm integral [kernel = k exp(-kt)] and utilizes a nonlinear least- squares curve fit of the transient response data based upon the Tikhonov regularization which is more precise but computationally demanding. Figure 10 presents a reactivity distribution obtained by the Tikonov-Fredholm (T-F) deconvolution of SSITKA data for methanation over a Ru/SiOz catalyst. Two active pools of carbon-a highly active a and a less active carbon form-were discerned from the reac- tivity distribution. The reactivity distribution also provides the average activities, ka and kp, and the peak areas, xa and xp, which indicate the relative sizes of each respective pool. The inverse-Laplace- transform method may result in shifting of the reactivity-distribution peak locations. However, it has been found to provide reasonable estimations of the relative pool sizes.17 If the computational cost is tolerable, the T-F method may be used as an alternative in order to obtain more precise reactivity distributions.
+ SinglePool 1
0 Two Serial Pools
0 Two Parallel Pools
0 t 0
Figure 11. Typical transient responses for three catalyst- surface mechanisms. The responses have been corrected for gas-phase holdup.
0 Two Serial Pools
0 Two Parallel Pools
-La--+ R = * R * R = R
0 - 4 I
t to to + A t
Figure 12. Partial isotopic-exchange transient responses.12
686 Chemical Reviews, 1995, Vol. 95, No. 3
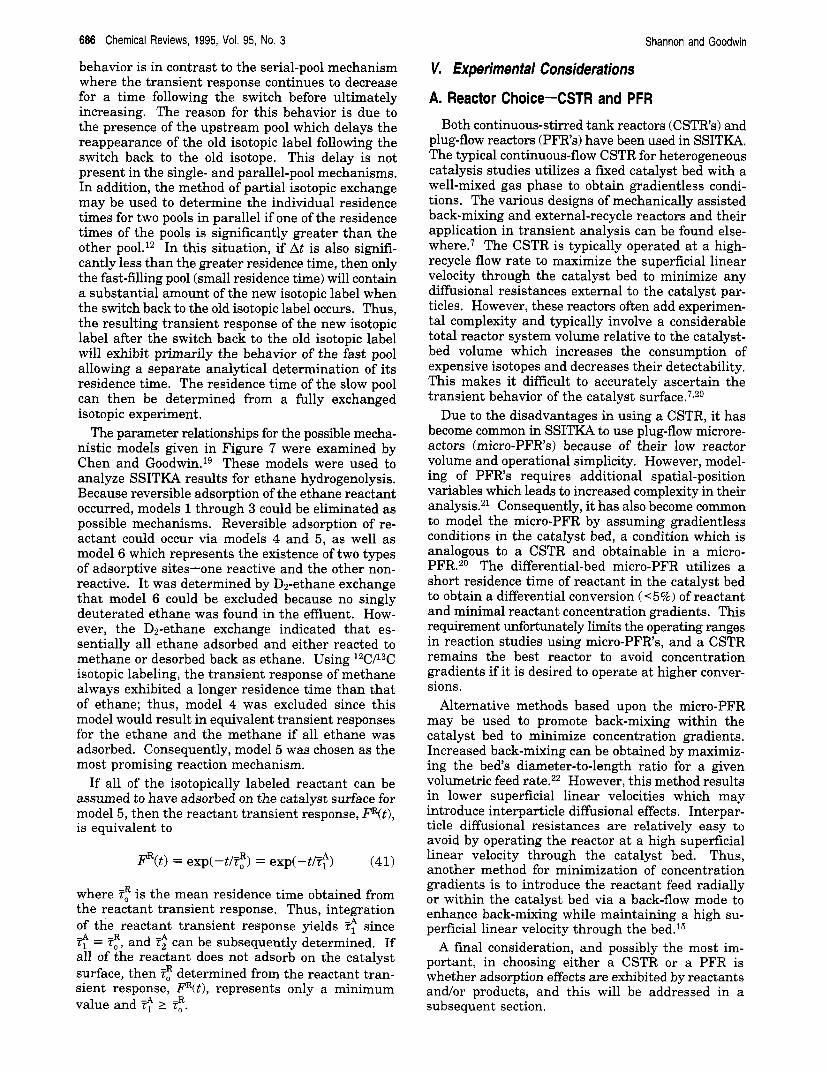
behavior is in contrast to the serial-pool mechanism where the transient response continues to decrease for a time following the switch before ultimately increasing. The reason for this behavior is due to the presence of the upstream pool which delays the reappearance of the old isotopic label following the switch back to the old isotope. This delay is not present in the single- and parallel-pool mechanisms. In addition, the method of partial isotopic exchange may be used to determine the individual residence times for two pools in parallel if one of the residence times of the pools is significantly greater than the other po01.l~ In this situation, if At is also signifi- cantly less than the greater residence time, then only the fast-filling pool (small residence time) will contain a substantial amount of the new isotopic label when the switch back to the old isotopic label occurs. Thus, the resulting transient response of the new isotopic label after the switch back to the old isotopic label will exhibit primarily the behavior of the fast pool allowing a separate analytical determination of its residence time. The residence time of the slow pool can then be determined from a fully exchanged isotopic experiment.
The parameter relationships for the possible mecha- nistic models given in Figure 7 were examined by Chen and G00dwin.l~ These models were used to analyze SSITKA results for ethane hydrogenolysis. Because reversible adsorption of the ethane reactant occurred, models 1 through 3 could be eliminated as possible mechanisms. Reversible adsorption of re- actant could occur via models 4 and 5, as well as model 6 which represents the existence of two types of adsorptive sites-one reactive and the other non- reactive. It was determined by Dz-ethane exchange that model 6 could be excluded because no singly deuterated ethane was found in the effluent. How- ever, the D2-ethane exchange indicated that es- sentially all ethane adsorbed and either reacted to methane or desorbed back as ethane. Using 12C/13C isotopic labeling, the transient response of methane always exhibited a longer residence time than that of ethane; thus, model 4 was excluded since this model would result in equivalent transient responses for the ethane and the methane if all ethane was adsorbed. Consequently, model 5 was chosen as the most promising reaction mechanism.
If all of the isotopically labeled reactant can be assumed to have adsorbed on the catalyst surface for model 5, then the reactant transient response, F W , is equivalent to
Shannon and Goodwin
3%) = exp(-t/e) = exp(-t/$) (41)
where e is the mean residence time obtained from the reactant transient response, Thus, integration of the reactant transient response yields $ since $ = e, and can be subsequently determined. If all of the reactant does not adsorb on the catalyst surface, then e determined from the reactant tran- sient response, FR(t), represents only a minimum value and e L e.
V. Experimental Considerations
A. Reactor Choice-CSTR and PFR
Both continuous-stirred tank reactors (CSTRs) and plug-flow reactors (PFR’s) have been used in SSITKA. The typical continuous-flow CSTR for heterogeneous catalysis studies utilizes a fixed catalyst bed with a well-mixed gas phase to obtain gradientless condi- tions. The various designs of mechanically assisted back-mixing and external-recycle reactors and their application in transient analysis can be found else- where.7 The CSTR is typically operated at a high- recycle flow rate to maximize the superficial linear velocity through the catalyst bed to minimize any diffusional resistances external to the catalyst par- ticles. However, these reactors often add experimen- tal complexity and typically involve a considerable total reactor system volume relative to the catalyst- bed volume which increases the consumption of expensive isotopes and decreases their detectability. This makes it difficult to accurately ascertain the transient behavior of the catalyst s ~ r f a c e . ~ , ~ ~
Due to the disadvantages in using a CSTR, it has become common in SSITKA to use plug-flow microre- actors (micro-PFR’s) because of their low reactor volume and operational simplicity. However, model- ing of PFRs requires additional spatial-position variables which leads to increased complexity in their analysis.21 Consequently, it has also become common to model the micro-PFR by assuming gradientless conditions in the catalyst bed, a condition which is analogous to a CSTR and obtainable in a micro- PFR.20 The differential-bed micro-PFR utilizes a short residence time of reactant in the catalyst bed to obtain a differential conversion (<5%) of reactant and minimal reactant concentration gradients. This requirement unfortunately limits the operating ranges in reaction studies using micro-PFRs, and a CSTR remains the best reactor to avoid concentration gradients if it is desired to operate at higher conver- sions.
Alternative methods based upon the micro-PFR may be used to promote back-mixing within the catalyst bed to minimize concentration gradients. Increased back-mixing can be obtained by maximiz- ing the bed’s diameter-to-length ratio for a given volumetric feed rate.22 However, this method results in lower superficial linear velocities which may introduce interparticle diffusional effects. Interpar- ticle diffusional resistances are relatively easy to avoid by operating the reactor at a high superficial linear velocity through the catalyst bed. Thus, another method for minimization of concentration gradients is to introduce the reactant feed radially or within the catalyst bed via a back-flow mode to enhance back-mixing while maintaining a high su- perficial linear velocity through the bed.15
A final consideration, and possibly the most im- portant, in choosing either a CSTR or a PFR is whether adsorption effects are exhibited by reactants and/or products, and this will be addressed in a subsequent section.
Characterization of Catalytic Surfaces by SSITKA
B. Gas-Phase Holdup Correction When evaluating the transient response of an
isotopically labeled species measured at the reactor outlet, two latent contributing sources-the reactor and the catalyst surface-must be considered in the transient response modeling and analysis. There are two methods which have been used in the application of an inert tracer for gas-phase holdup determination in SSITKA.
The first method is composed of two separate determinations. The "nonideality of the step input" is determined based on the inert-tracer transient response of an empty reactor assumed to be operated under identical conditions as the reactor containing the catalyst. This forcing function is then used in subsequent analysis. Likewise, the "back-mixing" attributable to the catalyst bed is determined using a separate inert-tracer step input to the catalyst bed, and the resulting transient response is termed the mixing function. Empirical curve fitting of the forc- ing function and the mixing function, typically using multiple-CSTR models, permits determination of their individual transient behavior, and this method has been used to verify CSTR behavior in a micro- PFR using a large diameter-to-length catalyst bed designed to promote back-mixing as a CSTR.23
The second method for gas-phase holdup determi- nation is the inclusion of a small concentration of the inert tracer in one of the inlet streams during the isotopic switch (Figure 2).11 This inert-tracer tran- sient response contains both transient contributions of the nonideal step input and the back-mixing within the reactor and the catalyst bed.
A nonadsorbable inert tracer (such as Ar or He), distinguishable from any inert diluent in the feed streams, is typically used for determination of the gas-phase holdup. System linearity is maintained if a only small amount of inert tracer is used, and with the sensitivity of a mass spectrometer this require- ment is easily met. It is also assumed that the mass, momentum, and heat transport properties of the inert tracer are identical to the reactant and product species. The difference between the measured inert- tracer and isotopic-tracer transient responses is attributable to residence time on the catalyst surface. It can be shown by mass balance that the mean surface-residence time, tp, is obtained from
Chemical Reviews, 1995, Vol. 95, No. 3 687
(42)
where the < and < are obtained by integration of the respective isotopic- and inert-tracer transient responses and are equivalent to the areas under each response as indicated in Figure 13, parts a and b. Subscript m indicates the measured or observed response, and subscript g refers to the gas-phase holdup. Consequently, the mean surface-residence time, tP, can always be determined from the mea- sured isotopic- and inert-tracer transient responses. In Figure 13, parts a and b, the rectangular area under the inert-tracer transient response to the left of time to is the gas-phase holdup attributable to pure time delay of the gases in the system while the area to the right of time to is attributable to the system nonidealities including back-mixing and the nonideal
' 0 l o f
V .
0 l o f
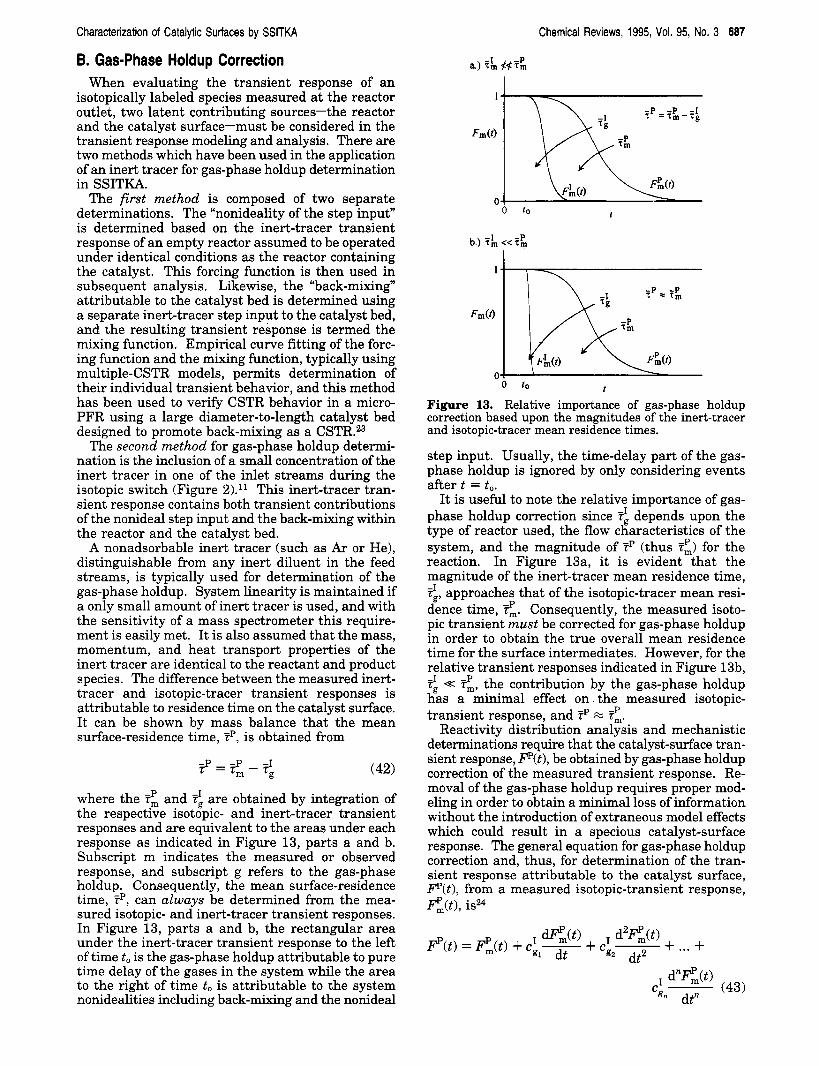
Figure 13. Relative importance of gas-phase holdup correction based upon the magnitudes of the inert-tracer and isotopic-tracer mean residence times.
step input. Usually, the time-delay part of the gas- phase holdup is ignored by only considering events after t = to.
It is useful to note the relative importance of gas- phase holdup correction since < depends upon the type of reactor used, the flow characteristics of the system, and the magnitude of tp (thus <) for the reaction. In Figure 13a, it is evident that the magnitude of the inert-tracer mean residence time, <, approaches that of the isotopic-tracer mean resi- dence time, <. Consequently, the measured isoto- pic transient must be corrected for gas-phase holdup in order to obtain the true overall mean residence time for the surface intermediates. However, for the relative transient responses indicated in Figure 13b, < << <, the contribution by the gas-phase holdup has a minimal effect on the measured isotopic- transient response, and tp x <.
Reactivity distribution analysis and mechanistic determinations require that the catalyst-surface tran- sient response, FP(t), be obtained by gas-phase holdup correction of the measured transient response. Re- moval of the gas-phase holdup requires proper mod- eling in order to obtain a minimal loss of information without the introduction of extraneous model effects which could result in a specious catalyst-surface response. The general equation for gas-phase holdup correction and, thus, for determination of the tran- sient response attributable to the catalyst surface, FP(t), from a measured isotopic-transient response, FP,(t), is24

688 Chemical Reviews, 1995, Vol. 95, No. 3
where ci:s are n constant coefficients determined from the measured inert-tracer transient response, FL(t1. If the overall reactor can be characterized as an n number of equal CSTR’s in series, then
1 2-1
i! j=o c;, = -($,.n(n - j ) i = 1 , 2 , 3 , ..., n (44)
where 2 is the mean residence time for each indi- vidual C?STR. If n = 1, then eq 43 reduces to
Shannon and Goodwin
(45)
which is applicable only for gas-phase holdup correc- tion of a single ideal CSTR.15 In applying eq 43 to plug-flow reactor (PFR) systems, the number of required terms becomes large, approaching infinity for an ideal PFR. Unfortunately, the use of even several terms still leads to substantial error because of the inherent inaccuracies in higher-order numer- ical differentiation. However, eq 45 should not be used for PFR systems, including differential micro- PFR’s, since it also neglects the higher-order terms of eq 43 and can lead to substantial error in the gas- phase holdup correction. Therefore, while eq 42 can still be used regardless of the reactor type, more robust methods need to be developed for gas-phase holdup correction of transient responses obtained from PFRs if analytical methods requiring the cor- rected transient response, such as reactivity-distribu- tion analysis and transient-response curve fitting, are to be applied more correctly in SSITKA. However, if $ is relatively small (2 << <, Figure 13b) then the effects of gas-phase holcfup and back-mixing can be ignored in analyses without introducing excessive error. Consequently, model parameters can be ob- tained using common numerical techniques such as iterative curve fitting of the measured transient responses.21
C. isotopic Effect The mechanistic modeling and kinetic parameter
determinations in SSITKA assume that steady-state reaction conditions are maintained by the method of isotopic substitution. This is not the situation for hydrogeddeuterium (WD) isotopic exchanges, such as H a D , CHJCH3D, or C2HdC2H5D, because of the kinetic and thermodynamic differences arising from the relatively large mass differences and bonding energies between hydrogen isotopes.25 Therefore, caution must be exercised when interpreting WD isotopic-based transient responses because the ki- netic rates and surface intermediates may be sub- stantially displaced from steady state following the isotopic switch. However, WD exchanges remain useful for indicating or identifying bond breakages within a particular molecular species following ad- sorption-desorption or reaction. The isotopic effect lessens as the mass of the isotope increases, and the isotopic effects for reactions involving 12C/13C, 14N/ 15N, or 160/180 are minimal.
D. Diffusion Effects Concentration gradients in the catalyst bed (inter-
particle) or within the catalyst particles (intrapar-
ticle) may result from diffusional effects and sub- stantially affect the transient responses which interferes with the determination of the underlying kinetic parameters attributable to the catalyst- surface reaction. The presence of interparticle or external diffusional effects can often be determined experimentally by varying the gas space velocity. These effects can be relatively easily avoided by operating at high space velocities through the cata- lyst bed. However, intraparticle or pore diffusion may not be readily avoidable and is dependent upon the diffusivitiee of the gases, the reaction rate and stoichiometry, and the catalyst physical parameters including pore size, porosity, tortuosity, and particle diameter. The presence of intraparticle diffusional effects can be determined experimentally by varying the catalyst-particle diameter.
It is usually desirable to avoid intraparticle diffu- sional effects in order to obtain the true intrinsic reaction rate, and this may be accomplished by using very small diameter catalyst particles (low Thiele modulus) or, if possible a nonporous support. For SSITKA mean residence-time resolutions down to 1 s, catalyst-particle diameters of << cm should be used to limit diffusional effects based upon a typical effective diffisivity of De = cm2/s for porous silica or alumina supported catalyst^.^
Because of the short transient response times, it is difficult to use SSITKA to measure the diffusivities associated with catalyst supports such as porous and nonporous silica or alumina. However,‘given the low intracrystalline diffusivities of molecules in zeolites, it may be possible to use isotopic transients to investigate diffusional effects in zeolites.26
Since little work has been done in the application of SSITKA to studying diffusional effects, this re- mains an important area for future development and application of SSITKA where the determination of both diffusional and kinetic parameters at steady- state reaction conditions might be able to be ac- complished.
E. Adsorption Effects 1. Reactant A d s o r ~ t i o ~ Chromatogra~~ic Effect
A chromatographic effect has been observed in PFR’s for the transient responses of strongly adsorb- ing, fast-equilibrating reactant species such as CO in CO hydrogenation.ll Figure 14 indicates this effect where the isotopic transient response of the CO reactant does not simultaneously appear with the Ar inert-tracer transient response but appears later, paralleling the Ar response. This holdup was at-
0 ( 0 I
Figure 14. Chromatographic effect in CO hydrogenation.ll
Characterization of Catalytic Surfaces by SSITKA
tributed to equilibrated adsorption-desorption of the 13C0 with a large reservoir of l2C0 adsorbed on the catalyst which required a finite time to be displaced by the 13C0. A similar effect was observed for H D 2 exchanges in NH3 synthesis s t ~ d i e s l ~ , ~ ~ which was due to adsorptiodabsorption odin the reactor walls that resulted in a large reservoir of H2 in the reactor system. Likewise, benzene exchanges in benzene hydrogenation2s exhibited a chromatographic effect where both benzene and cyclohexane adsorbed readily on the reactor walls and within the catalyst bed. The presence of these large reservoirs for adsorptiod desorption results in isotopic concentration gradients within the reactor system or along the catalyst-bed length which is exhibited as a chromatographic effect following the isotopic switch. This complicates the interpretation of the product-species transient re- sponses, and simplified corrections have been applied in the analysis of transient responses involving a chromatographic effect.28 The isotopic concentration gradients may be minimized in a PFR by operating at high space velocities; however, if a large adsorption reservoir is present, the chromatographic effect can- not be avoided.29 Consequently, a CSTR reactor is then preferred to eliminate any isotopic concentration gradients with respect to the catalyst bed and sim- plify the interpretation of the transient re~p0nses.l~
2. Product Readsorption
The effects of readsorption in SSITKA are perhaps the most difficult to avoid or interpret, and the presence of readsorption can lead to substantial contributions to the transient responses and interfere with the determination of the underlying kinetics of the catalyst surface. If readsorption of product occurs or another species adsorbs at the reactive sites, then there is a reduced activity and reaction rate. If readsorption of product occurs at nonreactive sites, the activity will not be affected; however, the abun- dance of surface intermediates leading to product determined from the transient rate response will be the sum from both the reactive and nonreactive adsorption sites. Hence, the mean surface-residence time attributed to the reaction will be overestimated, and the reactivity will be underestimated. Even if product does not readily adsorb, multiple adsorptions of reactant prior to reaction can lead to overestima- tions of the mean surface-residence time.
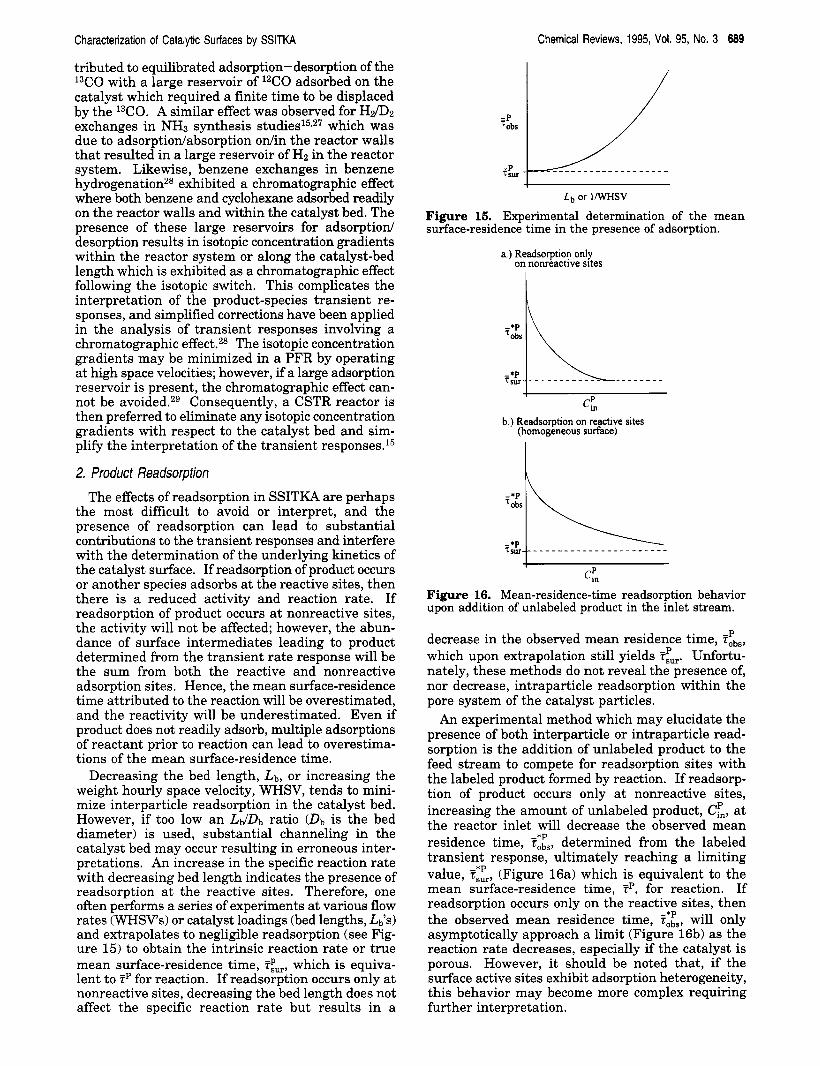
Decreasing the bed length, Lb, or increasing the weight hourly space velocity, WHSV, tends to mini- mize interparticle readsorption in the catalyst bed. However, if too low an LdDb ratio (Db is the bed diameter) is used, substantial channeling in the catalyst bed may occur resulting in erroneous inter- pretations. An increase in the specific reaction rate with decreasing bed length indicates the presence of readsorption at the reactive sites. Therefore, one often performs a series of experiments at various flow rates (WHSV's) or catalyst loadings (bed lengths, L<s) and extrapolates to negligible readsorption (see Fig- ure 15) to obtain the intrinsic reaction rate or true mean surface-residence time, T:w, which is equiva- lent to tP for reaction. If readsorption occurs only at nonreactive sites, decreasing the bed length does not affect the specific reaction rate but results in a
Chemical Reviews, 1995, Vol. 95, No. 3 689
Lb or 1 M S V
Figure 15. Experimental determination of the mean surface-residence time in the presence of adsorption.
a,) Readsorption only on nonreactive sites
I
CP" b.) Readsorption on reactive sites
(homogeneous surface)
-'P 'obs
L. in
Figure 16. Mean-residence-time readsorption behavior upon addition of unlabeled product in the inlet stream.
decrease in the observed mean residence time, gbs, which upon extrapolation still yields cur. Unfortu- nately, these methods do not reveal the presence of, nor decrease, intraparticle readsorption within the pore system of the catalyst particles.
A n experimental method which may elucidate the presence of both interparticle or intraparticle read- sorption is the addition of unlabeled product to the feed stream to compete for readsorption sites with the labeled product formed by reaction. If readsorp- tion of product occurs only at nonreactive sites, increasing the amount of unlabeled product, C;, at the reactor inlet will decrease the observed mean residence time, Tz:s, determined from the labeled transient response, ultimately reaching a limiting value, T z L , (Figure 16a) which is equivalent to the mean surface-residence time, TP, for reaction. If readsorption occurs only on the reactive sites, then the observed mean residence time, T:Ls, will only asymptotically approach a limit (Figure 16b) as the reaction rate decreases, especially if the catalyst is porous. However, it should be noted that, if the surface active sites exhibit adsorption heterogeneity, this behavior may become more complex requiring further interpretation.
690 Chemical Reviews, 1995, Vol. 95, No. 3 Shannon and Goodwin
Micro-PFR's typically have the advantages over CSTR's of a shorter residence time of the gas-phase species in the catalyst bed and lower gas-phase concentrations which tend to decrease interparticle readsorption. However, even at differential conver- sion of reactant (<El%) in a micro-PFR, substantial product concentration gradients may develop. If readsorption for a reactant or product species is inherently intrusive in the determination of the true catalyst-surface reaction behavior, such as in am- monia synthesis where NH3 is in equilibrium with
VI. Reactions Studied To date, SSITKA has contributed significantly to
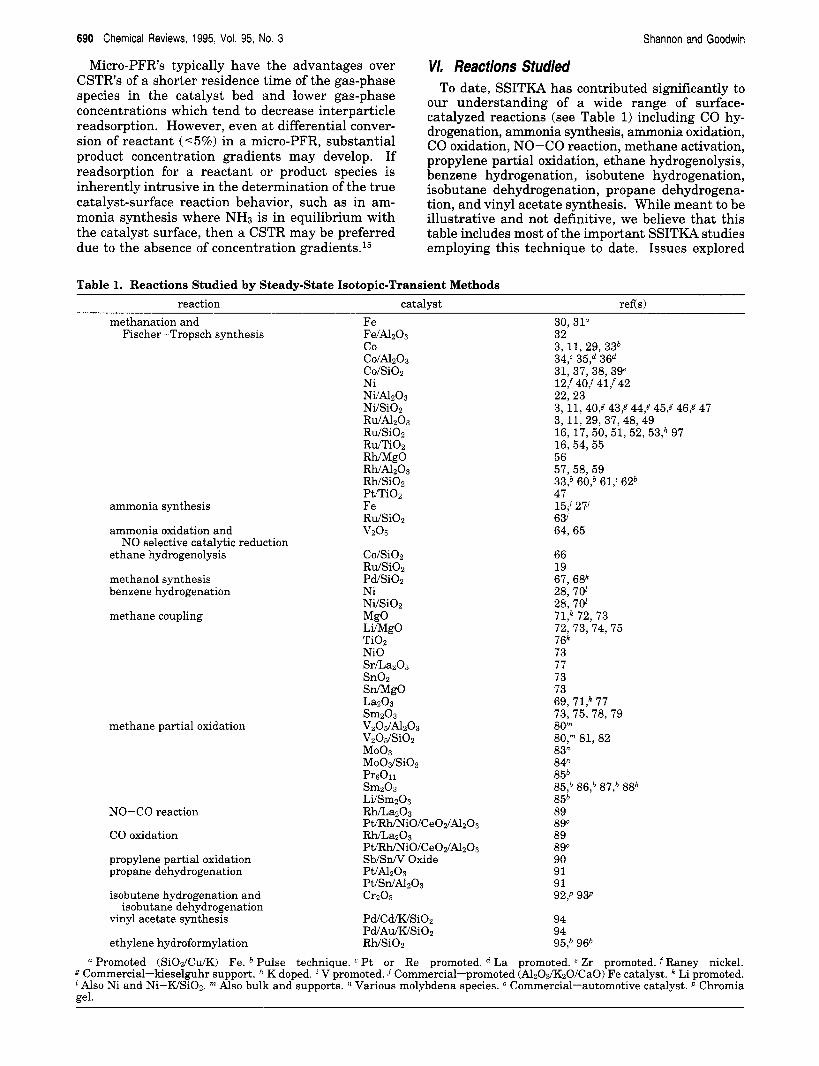
our understanding of a wide range of surface- catalyzed reactions (see Table 1) including CO hy- drogenation, ammonia synthesis, ammonia oxidation, CO oxidation, NO-CO reaction, methane activation, propylene partial oxidation, ethane hydrogenolysis, benzene hydrogenation, isobutene hydrogenation, isobutane dehydrogenation, propane dehydrogena- tion, and vinyl acetate synthesis. While meant to be illustrative and not definitive. we believe that this
the catalyst surface, then a CSTR may be preferred due to the absence of concentration gradients.15
table includes most of the important SSITKA studies employing this technique to date. Issues explored
Table 1. Reactions Studied by Steady-State Isotopic-Transient Methods
reaction catalyst refis) methanat ion and F e 30, 31"
Fischer-Tropsch synthesis Fe/Al203 32 c o 3, 11, 29, 33b CO/Al203 34,' 35: 36* Co/SiOz 31, 37, 38, 3 9 Ni 121 401 41,f 42 Ni/A1203 22,23 Ni/SiOz RdAl203 RdSiO2 RuiTiOz 16, 54, 55 Rh/MgO 56 Rh/&03 57, 58, 59 Rh/SiOz 33,b 60,b 61,2 62b Pt/TiOz 47
RdSiO2 6 3
3, 11, 40,g 43,g 44,g 45,g 46: 47 3, 11, 29, 37, 48, 49 16, 17, 50, 51, 52, 53,h 97
ammonia synthesis F e 15: 27J
ammonia oxidation and vzo6 64,65
e thane hydrogenolysis Co/SiOz 66 RdSiO2 19
methanol synthesis P d S i 0 2 67, 68k benzene hydrogenation Ni 28, 70'
NUSiOz 28, 70' methane coupling MgO 71,k 72, 73
Li/MgO 72, 73, 74, 75 Ti02 76k NiO 73 Sr/La203 77 SnO2 73 smgo 73 La203 69, 71,k 77 Smz03 73, 75, 78, 79 ~ z ~ S / A 1 z ~ 3 80" V2O&XO2 80," 81, 82 Moo3 83" MoOdSiOz 84"
NO selective catalytic reduction
methane par t ia l oxidation
Pr6011 85b Sm203 85,b 86,b 87,b 8tib Li/SmzO3 85b
NO-CO reaction Rh/LazOs 89 Pt/Rh/NiO/Ce02/Al~03 89"
CO oxidation Rh/LazO3 89 Pt/Rh/NiO/Ce02/Al~03 89"
propylene par t ia l oxidation Sb lSnN Oxide 90 propane dehydrogenation PUN203 91
Pt/Sn/Al203 91
vinyl acetate synthesis Pd/Cd/WSiOz 94 Pd/Au/wSiO2 94
isobutene hydrogenation and Cr203 92,p 9 3 isobutane dehydrogenation
ethylene hydroformylation Rh/SiOz 95,b 96b Promoted (SiOdCuM) Fe. Pulse technique. Pt or Re promoted. La promoted. e Zr promoted. f Raney nickel.
g Commercial-kieselguhr support. K doped. V promoted. J Commercial-promoted (Al203/KzO/Ca0) F e catalyst. Li promoted. Also bulk and supports. " Various molybdena species. Commercial-automotive catalyst. p Chromia
gel. Also Ni and Ni-WSiO2.
Characterization of Catalytic Surfaces by SSITKA
using SSITKA have included such things as the role of lattice oxygen in partial oxidation, mechanisms or pathways of reaction, the presence and implications of site heterogeneity, the role of chemical promoters, the effect of temperature and partial pressure of reactants on surface coverage of intermediates, and the consequence of readsorption of products on reac- tion. Due to space limitations, only the most signifi- cant findings of the representative reactions of am- monia synthesis, CO hydrogenation, ethane hydro- genolysis, and methane activation are given. These reactions, however, include those which have been studied the most by SSITKA (CO hydrogenation and methane activation). Citations have been chosen primarily to show how SSITKA has been used to discern information about catalyst systems. The reader is referred to the original papers cited in Table 1 for complete details of the findings for all of the reactions studied.
Chemical Reviews, 1995, Vol. 95, No. 3 691
Biloen et uZ.ll found by studying a series of Ni, Co, and Ru catalysts that only a small fraction of the carbidic overlayer on the catalyst surfaces belonged to the active intermediates. Their results suggested that both methane and higher hydrocarbons were formed from a common pool of intermediates, prob- ably C1.
Numerous studies have addressed this issue of surface coverage during CO hydrogenation. In gen- eral, regardless of whether the catalyst employed is Co, Rh, Ni, Fe, Ru, or Pt, the active catalyst surface is primarily covered by reversibly adsorbing CO and low-activity carbidic species. Only a small fraction (typically <lo%) is covered by active surface intermediates of methane or higher hydro-
that the active surface carbon on a Co/silica catalyst is common to both methanol and hydrocarbon prod- ucts. He suggests that this intermediate possesses the original C-0 bond but is different from adsorbed co.
Using SSITKA, Stockwell et ~ 1 . ~ ~ were able to show that for Fischer-Tropsch synthesis on an Fe/Al203 catalyst, bulk carbide did not participate significantly in the formation of products.
In perhaps the first SSITKA study to address the role of promoters in a catalyst, Yang et uL40 were able to conclude that the structural promoter A 1 2 0 3 in Raney Ni increases the activity of the catalyst by increasing the surface abundance of intermediates rather than by changing their reactivity. Soong and Biloen41 also investigated the aging of a Raney Ni catalyst during methanation. They were able to suggest, on the basis of isotopic transients taken at various times-on-stream, that loss of activity was due to a decrease in the most active intermediates. Their results clearly indicated the existence of two pools of intermediates, one 7 times more reactive than the other.
Chain growth during Fischer-Tropsch (F-T) syn- thesis has been the subject of a number of stud-
found that the reactive carbon appears to spend most of its lifetime on the catalyst surface as C1 species. However, after formation of CZ species, chain growth is rapid.48 In addition, chain growth was found to be best described by terminal addition to what becomes the olefinic end of the hydrocarbon molecule. Krishna and Bell54 were able to show clearly that ethylene can initiate chain growth as well as serve as a source of C1 monomer species for additional chain propagation.
Goodwin and ~ ~ - ~ o r k e r s ~ ~ , ~ ~ , ~ ~ , ~ ~ , ~ ~ have addressed the influence of promoters on hydrocarbon synthesis. Hoost and G ~ o d w i n ~ ~ found that K promotion of Ru resulted in a decrease in overall activity due to the decrease in reactivity of both the C1 (high activity) and C1 (low activity) intermediates. Deactivation with time-on-stream was due solely to the decrease in surface concentration of the active intermediates and not to a change in the reactivity of the interme- diates. On the basis of a separate study using both CO hydrogenation and ethane hydrogenolysis, Hoost and Goodwing’ suggested that K promotion affects
carbons.11,32,33,39,51,53,55,57-59 However, &s38 has found
ies.29,31,48,49,54,55 Mims and co-~orker~31,48,49 have
A. Ammonia Synthesis SSITKA has been used to study ammonia synthesis
at temperature and pressure on a commercial am- monia synthesis Fe catalyst (Haldor Topsoe KMIR).27 The results suggested that *N is the most abundant reactive intermediate on the surface during steady- state reaction. Analysis of the ammonia isotopic transients by inspection (using a semilog plot)15 and by the inverse Laplace transform method16 indicated that the reactive surface exhibited site heterogeneity, especially above 700 “C. This is not surprising considering that KMIR contains a number of promot- ers.
In a more recent paper, Nwalor and Goodwid3 reported the results of a study of K promotion of Ru. It is well known that K promotion greatly increases the rate of ammonia synthesis on Ru catalysts, and it had been previously suggested by numerous in- vestigators that this increase in the rate was due to a promotion of N2 dissociation or to an increase in surface intermediates. By using SSITKA, Nwalor and Goodwin were able to show that the increase in rate was due primarily to the creation of a set of “super” active sites rather than an increase in the number of reactive surface intermediates. While all the sites on the catalyst showed some increase in activity upon promotion, the “super” active sites exhibited activities more than an order of magnitude higher. While constituting only 20% of the active sitedintermediates, these “super” active sites ac- counted for 78% of the reaction in the promoted catalyst.
B. CO Hydrogenation 1. Hydrocarbon Synthesis
One of the earliest SSITKA studies of CO hydro- genation was that of Happel et ~ 1 . ~ ~ By using transient isotopic tracing of 13C0, l80, and D, they were able to establish that carbon dioxide formation during methanation on a Ni catalyst appeared to occur directly and not via the water-gas-shift reac- tion.
692 Chemical Reviews, 1995, Vol. 95, No. 3
the carbidic overlayer by regulating the catalyst's hydrogenation capabilities.
La has been suggested to be useful as a chain growth promoter for Co F-T catalysts. La promotion of Co/Al203 was found to decrease the selectivity of methane.35,36 Low levels of La promotion increased the activity of the catalyst. However, for La/Co > 0.1, there was a decrease in overall catalyst activity. The affect on activity seemed to be related especially to a change in surface concentration of the active intermediates. Deconvolution of the isotopic tran- sients indicated that La promotion affects methane site activity by increasing the reactivity of the most active pool of intermediates.
Zr, on the other hand, has been shown to be a significant rate promoter for Co/SiOZ as well as a selectivity promoter at high loadings.39 The effect on rate is especially great initially. This initial rate increase is a function of both an increase in reactivity and an increase in surface concentration of the intermediates. However, both of these parameters decline significantly with time-on-stream.
2. Oxygenate Synthesis Methanol synthesis on Li-promoted Pd/Si02 has
been studied by SSITKA.67,68 Li is well known to be a methanol rate promoter for Pd. The SSITKA results indicated that the surface concentration of active intermediates increased upon promotion, al- though the sitehtermediate activity decreased. How- ever, because the increase in surface concentration was so much greater than the decrease in activity, the rate of methanol formation increased.
Koerts and van SantenG1 investigated the effect of vanadium promotion of RWSiO2. They found that ethanal formation appeared to occur at two different types of sites. V promotion decreased the desorption rate of ethanal while enhancing its hydrogenation to ethanol. Although V did not affect the rate of CO insertion into surface CH, species, it did increase the concentration of active oxygenated species.
By using a variation of SSITKA, Chuang et U Z . ~ ~ has been able to show why an increase in reaction pressure results in the increased formation of oxy- genated species such as acetaldehyde on Rh catalysts. With increasing pressure, the surface-residence time of CH, species increases permitting the greater insertion of CO.
C. Ethane Hydrogenolysis Ethane hydrogenolysis has been studied by SSIT-
KA on both Ru19 and C O . ~ ~ Chen and Goodwinlg have developed mathematics and methodology for han- dling a reaction such as this which includes reversible steps. They were able to show that ethane hydro- genolysis can be modeled as two intermediate pools in series-the first consisting of dicarbon species and the second monocarbon species. The surface concen- tration and reactivity of intermediates for each of these pools were able t o be estimated. The surface coverage of monocarbon species increased with tem- perature while that of dicarbon species remained constant. The activation energies of the surface reactions of di- and monocarbon species were esti- mated to be ca. 36 and 9 kcaL"o1, respectively. The
Shannon and Goodwin
former is similar to the overall activation energy for ethane hydrogenolysis on Ru, suggesting that C-C bond breakage is the rate-limited step. The activa- tion energy for the reaction of monocarbon species is typical of hydrogenation reactions.
Ethane hydrogenolysis was used to help character- ize the effect of aqueous impregnation on Co/SiO2. Aqueous impregnation and drying of a reduced and passivated Co/SiO2 catalyst led to the formation of Co silicate. SSITKA indicated that the surface concentration of active intermediates during ethane hydrogenolysis declined as a result of the changes in the catalyst. The pseudo-first-order rate con- stants, on the other hand, increased slightly, probably due to the reduction in the size of the Co-metal particles.
D. Methane Activation 1. Coupling
Methane activation, of all the reactions studied, has perhaps been the biggest challenge for SSITKA due to the high temperatures required. At temper- atures in excess of 550 "C, surface residence times of reactive intermediates would be expected to be very low, perhaps below the detectability limit of the technique. Ekstrom and L a p s z e w i ~ z ~ ~ - ~ ~ were the first to successfully demonstrate that information could be gathered by SSITKA for this reaction. For a number of rare-earth catalysts, they were able to conclude that the reaction involves only a small number of active sites, that gas-phase oxygen rapidly exchanges with lattice oxygen, and that methane conversion is dependent on the rate of lattice-oxygen exchange. Because of the methodology used by them, accurate surface-residence times for carbon leading to ethane were not able to be determined. However, Peil et uZ.72,74~75,78~79 were able to determine surface- residence times for the carbon in the products for Li/ MgO and Sm203. On Sm2O3, the surface-residence time for carbon leading to ethane was 4 s at a reaction temperature of 600 "C. However, the resi- dence times for CO and C02 were only 2-3 s, suggesting that the nonselective products can be made directly and are not just secondary products of methyl radicals or ethane. Methane was shown to adsorb reversibly for a detectable time for tempera- tures (650 "C on all active ~ a t a l y s t s . ~ ~ ~ ~ ~ ~ ~ ~
The oxygen reaction pathway has also been ex- plored by SSITKA. Lattice oxygen was shown to be important in determining the rate of methane activa- t i ~ n . ~ ~ Peil et C L Z . ~ ~ provide a discussion of how lattice- oxygen difisivities can be determined under reaction conditions.
2. Partial Oxidation The partial oxidation of methane offers interesting
possibilities since the valuable chemicals, methanol and formaldehyde, are formed directly. A number of studies have been reported which utilized SSITKA to study this reaction on supported and unsupported vanadia,a0,81,a2 m~lybdena ,~~ and silica-supported mo- l ~ b d e n a . ~ ~ Methane was found to adsorb reversibly only if a catalyst was active for reaction.81 It was speculated that different types of "sites" involved in

Characterization of Catalytic Surfaces by SSITKA
the formation of HCHO, CO, and CzH6 may cor- respond to vanadium oxide species in different redox states. While secondary reaction of HCHO has been shown to result in CO, the SSITKA results indicated that readsorption of HCHO was irreversible, leading to the nonselective product. Results indicate signifi- cant exchange of oxygen between the support and the active phase for silica-supported vanadiasO and mo- l ~ b d e n a . ~ ~ The redox nature of vanadidsilica was evidenced by the increase in lattice oxygen exchange in the presence of methane.80
Chemical Reviews, 1995, Vol. 95, No. 3 693
the use of discrete eMuent sampling on line followed by gas chromatography, reaction to convert products to species more amenable to isotopic analysis, and mass spectrometry, the second limitation has been able to be effectively overcome for the Fischer- Tropsch ~ y n t h e s i s . ~ ~ ~ ~ ~ Another approach has been to use GC-MS combined with NMR for product analysis to determine 13C location in a hydrocarbon molecule .31
VI/. Future Directions for SSlTKA Research is proceeding on numerous aspects of
SSITKA. Theoretical work in our laboratories is aimed at improving gas-phase holdup subtraction and developing a mathematical model for the isotopic transients observed.24 Improvement of gas-phase holdup subtraction will enable the technique to be better applied to the study of heterogeneously cata- lyzed reactions having surface intermediates with short residence times. The development of a math- ematical model will provide us with the ability to evaluate the impact of various processes on the isotopic transients.
An investigation in our laboratories has just begun to better understand the effects of readsorptionl diffusion of reactants and products on the transients. I t is possible that more information about these processes will be able to be derived directly from the transients in the future.
Russell et aLg8 have shown by calculations that SSITKA should be able to be applied to reaction on a catalyst surface from the liquid phase provided certain requirements are met. This obviously pre- sents significant challenges due the inherent greater residence time in a reactor for liquid-phase reactions. However, for certain liquid-phase reactions, applica- tion of SSITKA would seem to be possible, even if perhaps more limited than for gas-phase reactions.
Finally, the list of gas-phase reactions studied by SSITKA has been growing steadily since the middle 1980s when only CO hydrogenation had been ad- dressed. This list will undoubtedly grow and be applied to more complex reactions, such as reported in the recent paper on the synthesis of vinyl acetate.94 In theory, the primary limitations are the cost of isotopes, the complexity of the product mixture and its analysis by mass spectrometry, and the surface residence times of the intermediates. However, by
VI//. Summary SSITKA is a powerful technique for the kinetic
study of heterogeneous catalytic reactions and has been used in a number of studies to determine in situ kinetic information about the catalyst-surface reac- tion intermediates and mechanisms at steady state. Other transient methods such as stop-flow tech- niques, often result in substantial disturbance of the catalyst-surface behavior, something which does not occur in SSITKA.
Table 2 summarizes the steady-state kinetic pa- rameters which have been determined from SSITKA. The certainty in the parameter determination de- creases in descending order in the table. The most general steady-state kinetic parameters which %re determined from SSITKA are the abundances, Np, and overall mean residence time, Tp, of the catalyst- surface reaction intermediates which lead to a par- ticular product. SSITKA permits determination of these parameters independent of the underlying kinetic mechanism of the reaction. Through mecha- nistic assumptions and modeling, other steady-state kinetic parameters which can be determined from SSITKA include surface concentrations of different types of adsorbed reaction intermediates, coverages, surface lifetimes, turnover frequencies, site hetero- geneity, activity distributions, and identification of possible mechanisms. SSITKA also provides the ability to determine the effects of different prepara- tion methods, supports, promoters, and poisons on the steady-state behavior of catalysts. While provid- ing fundamental catalytic information, SSITKA is also suitable for the characterization of commercial catalysts at industrial reaction condition^.^^
Since SSITKA is a relatively new technique (in use less than 15 years) and has been shown to be a powerful method for determining steady-state kinetic mechanisms and parameters, it is expected be ap- plied with increasing frequency, especially as it is introduced into new areas of reaction study. SSITKA
Table 2. Most Common Steady- State Kinetic Parameters Determined by SSITKA kinetic parameters assumptions comments
abundance of adsorbed surface -
mean surface-residence time of
reactivity: k
intermediates leading to P: Np
adsorbed intermediates leading to P: Tp
surface coverage of adsorbed intermediates leading to P: 8:
determined value is independent of a single reactant isotopic element is the underlying kinetic model; however,
any detailed value is dependent upon a n assumed kinetic model
parameter underestimation occurs for reversible-reaction pathway
measured number of sites may be different than the true number of active sites, Le., if obtained from chemisorption
proper gas- hase holdup correction of the measure$ product-s ecies transient response is required'
incorporated per single product species
overall reaction is pseudo-first order
accurate number of active sites is obtainable from separate measurement
parallel pools (a Reterogeneous surface) surface consists of seudo-first-order reactivity distribution: f l k )
694 Chemical Reviews, 1995, Vol. 95, No. 3
has the potential for determining additional kinetic parameters which are difficult to measure, or cannot currently be measured, including those for reactions in zeolites and others principally affected by mass- transfer resistances. In addition, liquid-phase reac- tions may theoretically be studied3 including those catalyzed by immobilized enzymes.98
Acknowledgments. This work was funded under National Science Foundation Grant no. CTS-9312519.
IX. References Happel, J. Chem. Eng. Sci. 1978,33, 1567. Bennett, C. 0. In Catalysis Under Transient Conditions, Bell, A. T.. Heeedus. L. L.. Eds.: ACS SvmDosium Series: American Chemical-Society: Washington, De, f982; Vol. 178,’p 1. Biloen, P. J . Mol. Catal. 1983,21, 17. Kobayashi, H.; Kobayashi, M. Catal. Rev.-Sci. Eng. 1974,lO (21, 139. Bennett, C. 0. Catal. Rev.-Sci. Eng. 1976, 13 (21, 121. Schwarz, J. A.; Falconer, J . L. Catal. Today 1990, 7 (11, 1. Happel, J. Isotopic Assessment of Heterogeneous Catalysts; Academic Press: Orlando, FL, 1986. Le Cardinal, G.; Walter, E.; Bertrand, P.; Zoulalian, A.; Gelus, M. Chem. Eng. Sci. 1977,32, 733. Smith, J. M. Chemical Engineering Kinetics, 3rd ed.; McGraw- Hill: New York, 1981. Boudart, M. AIChE J . 1972,18,465. Biloen, P.; Helle, J. N.; van den Berg, F. G. A.; Sachtler, W. M. H. J . Catal. 1983, 81, 450. Soong, Y.; Krishna, K.; Biloen, P. J . Catal. 1986, 97, 330. Park, S. W.; Himmelblau, D. M. Chem. Eng. J . 1982,25, 163. Happel, J.; Walter, E.; Lecourtier, Y. Ind. Eng. Chem. Fund. 1986.25. 704. Nwalor, ‘J. U. Ph.D. Dissertation, University of Pittsburgh, Pittsburgh, PA, 1988. de Pontes, M.; Yokomizo, G. H.; Bell, A. T. J . Catal. 1987, 104, 147. Hoost, T. E.; Gocdwin, J. G., Jr. J . Catal. 1992, 134, 678. Scott, K. F.; Phillips, C. S. G. J . Chromatogr. Sci. 1983,21, 125. Chen, B.; Goodwin, J. G., Jr. Isotopic Transient Kinetic Analysis of Ethane Hydrogenolysis on RdSiOz. J. Catal., in press. Huang, Y.-J.; Lee, P.-I.; Schwarz, J. A.; Heydweiller, J. C. Chem. Eng. Commun. 1985,39, 355. Happel, J.; Walter, E.; Lecourtier, Y. J . Catal. 1990, 123, 12. Stockwell, D. M.; Bennett, C. 0. J . Catal. 1988, 110, 354. Stockwell, D. M.; Chung, J . S.; Bennett, C. 0. J . Catal. 1988, 112, 135. Shannon, S. L. Ph.D. Dissertation, University of Pittsburgh, 1995. Ozaki, A. Isotopic Studies of Heterogeneous Catalysis; Academic Press: New York, 1977. Efstathiou, A. M.; Suib, S. L.; Bennett, C. 0. J . Catal. 1992,135, 223. Nwalor, J . U.; Goodwin, J. G., Jr.; Biloen, P. J . Catal. 1989,117, 121. Mirodatos, C. J . Phys. Chem. 1986, 90, 481. Zhang, X.; Biloen, P. J . Catal. 1986, 98, 468. Mims, C. A,; McCandlish, L. E. J . Am. Chem. SOC. 1985, 107, 696. Mims, C. A.; McCandlish, L. E. J. Phys. Chem. 1987,91, 929. Stockwell, D. M.; Bianchi, D.; Bennett, C. 0. J . Catal. 1988,113, 13.
(33) Sidall, J. H.; Miller, M. L.; Delgass, W. N. Chem. Eng. Commun. 1989, 83, 241.
(34) Vada, S.; Hoff, A,; Adnanes, E.; Schanke, D.; Holmen, A. Fischer- Tropsch Synthesis on Supported Cobalt Catalysts Promoted by Platinum and Rhenium. Submitted to J . Catal.
(35) Vada, S.; Chen, B.; Goodwin, J. G., Jr . Isotopic Transient Study of La Promotion of Co/AlzO3 for CO Hydrogenation. Submitted to J . Catal.
(36) Vada, S.; Kazi, A. M.; Bedu-Addo, F. K.; Chen, B.; Goodwin, J. G., Jr . In Natural Gas Conversion 11, Proceedings of the Third Natural Gas Conversion Symposium, Sydney, July 4-9, 1993; Curry-Hyde, H. E., Howe, R. F., Eds.; Elsevier Science Publish- ers: Amsterdam, 1994; Vol. 81, p 443.
(37) Zhang, X.; Biloen, P. Chem. Eng. Commun. 1986, 44, 303. (38) Mims, C. A. Catal. Lett. 1988, 1, 293. (39) Ali S.; Chen, B.; Goodwin, J . G., Jr . Zr Promotion of Co/SiOz for
Fischer-Tropsch Synthesis. Submitted to J . Catal. (40) Yang, C. H.; Soong, Y.; Biloen, P. In Proceedings, 8th Interna-
tional Congress on Catalysis, Berlin (West), 2-6 July, 1984; Verlag Chemie: Weinheim, West Germany, 1984; Vol. 2, p 3.
(41) Soong, Y.; Biloen, P. Langmuir 1985, 1, 768.
Shannon and Goodwin
Nwalor, J. U.; Hoost, T. E.; Godbole, G. G.; Goodwin, J . G., Jr.; Biloen, P. In Proceedings, 9th International Congress on Cataly- sis, Calgary, 1988; Phillips, M. J., Ternan, M., Eds.; Chemical Institute of Canada: Ottawa, ON, 1988; Vol. 2, p 875. Happel, J.; Suzuki, J.; Kokayeff, P.; Fthenakis, V. J . Catal. 1980, 65, 59. Happel, J.; Cheh, H. Y.; Otarod, M.; Ozawa, S.; Severdia, A. J.; Yoshida. T.: Fthenakis. V. J . Catal. 1982. 75. 314. Otarod, M.;’Ozawa, S.;Yin, F.; Chew, M.;’Cheh, H. Y.; Happel, J. J . Catal. 1983, 84, 156. Happel, J . ; Cheh, H. Y.; Otarod, M.; Bajars, L.; Hnatow, M. A.; Yin, F. In Proceedings, 8th International Congress on Catalysis, Berlin (West). 2-6 Julv. 1984: Verlae Chemie: Weinheim. West Germany, 1984; Vol. i , ’p 395. Yang, C. H.; Soong, Y.; Biloen, P. J . Catal. 1985, 94, 306. Mims, C. A.; McCandlish, L. E.; Melchior, M. T. Catal. Lett. 1988, 1, 121. Mims, C. A,; Krajewski, J . J.; Rose, K. D.; Melchior, M. T. Catal. Lett. 1990, 7, 119. Bell, A. T.; Winslow, P. In Proceedings, 8th International Congress on Catalysis, Berlin (West), 2-6 July, 1984; Verlag Chemie: Weinheim, West Germany, 1984; Vol. 3, p 175. Winslow, P.; Bell, A. T. J . Catal. 1984, 86, 158. Bell, A. T. In Proceedings, 9th International Congress on Catalysis, Calgay, 1988; Phillips, M. J., Ternan, M., Eds.; Chemical Institute of Canada: Ottawa, ON, 1988; Vol. 5, p 134. Hoost, T. E.; Goodwin, J. G., Jr. J. Catal. 1992, 137, 22. Krishna, K. R.; Bell, A. T. Catal. Lett. 1992, 14, 305. Krishna, K. R.; Bell, A. T. In New Frontiers in Catalysis, Proceedings of the 10th International Congress on Catalysis, Budapest, 19-24 July, 1992; Guczi, L., Solymosi, F., Tetenyi, P., Eds.; Akademiai Kiad6: Budapest, Hungary, 1993; Part A, p 181. Efstathiou, A. M. J . Mol. Catal. 1991, 67, 229. Efstathiou, A. M.; Bennett, C. 0. Chem. Eng. Commun. 1989, 83, 129. Efstathiou, A. M.; Bennett, C. 0. J . Catal. 1989, 120, 137. Efstathiou, A. M.; Chafik, T.; Bianchi, D.; Bennett, C. 0. J . Catal. 1994, 148, 224. Koerts, T.; Welters, W. J. J. ; van Santen, R. A. J . Catal. 1992, 134, 1. Koerts, T.; van Santen, R. A. J . Catal. 1992, 134, 13. Chuang, S. C.; Balakos, M. W.; Krishnamurthy, R.; Srinivas, G. In Natural Gas Conversion 11, Proceedings of the Third Natural Gas Conversion Symposium, Sydney, July 4-9, 1993; Curry-Hyde, H. E., Howe, R. F., Eds.; Elsevier Science Publish- ers: Amsterdam, 1994; Vol. 81. Nwalor, J. U.; Goodwin, J . G., Jr . In Perspectives in Catalysis: Ammonia Synthesis and Beyond. Tops@e, H., Boudart, M., Norskw, J. K., Eds. Top. Catal. 1994, 1. Ozkan, U. S.; Cai, Y.; Kumthekar, M. W. J . Catal. 1994, 149, 375. Ozkan, U. S.; Cai, Y.; Kumthekar, M. W. J . Catal. 1994, 149, 390. Haddad, G. J.; Goodwin, J. G., Jr. The Impact of Aqueous Impregnation on the Properties of Prereduced vs. Precalcined Co/SiOz. Submitted to J . Catal. Vada, S.; Goodwin, J. G., Jr . Analysis of Li Promotion of Methanol Synthesis on PdSiOZ using Isotopic Transient Kinet- ics. Submitted to J . Phys. Chem. Kazi, A. M.; Chen, B.; Goodwin, J. G., Jr.; Marcelin, G. Li+ Promotion of Pd/SiOz: The Effect on Hydrogenation, Hydro- genolysis, and Methanol Synthesis. Submitted to J . Catal. Lacombe, S.; Sanchez, J . G.; Delichere, P.; Mozzanega, H.; Tatibouet, J . M.; Mirodatos, C. Catal. Today 1992, 13, 273. Mirodatos, C.; Dalmon, J. A.; Martin, G. A. J . Catal. 1987,105, 405. Mirodatos, C.; Holmen, A,; Mariscal, R.; Martin, G. A. Catal. Today 1990, 6, 601. Peil, K. P.; Goodwin, J. G., Jr.; Marcelin, G. J . Catal. 1991,131, 143. Peil, K. P.; Marcelin, G. M.; Goodwin, J. G., Jr . In Direct Methane Conversion by Oxidative Processes: Fundamental and Engineer- ing Aspects; Wolf, E. E., Ed.; Van Nostrand Reinhold: New York, 1992; p 138. Peil, K. P.; Goodwin, J. G., Jr.; Marcelin, G. J . Phys. Chem. 1989, 93, 5977. Peil, K. P.; Goodwin, J . G., Jr.; Marcelin, G. In Natural Gas Conversion, Proceedings of the Natural Gas Conversion Sym- posium, Oslo, August 12-17, 1990; Holmen, A., Jens, K.-J., Kolboe, S., Eds.; Elsevier Science Publishers: Amsterdam, 1991; Vol. 61. D 73.
-
77) Kalenik, Z.; Wolf, E 78) Peil, K. P.; Goodwin, J . G., Jr.; Marcelin, G. J . Am. Chem. SOC.
1990,112, 6129.
556. (79) Peil, K. P.; Goodwin, J. G., Jr.; Marcelin, G. J . Catal. 1991,132,
Characterization of Catalytic Surfaces by SSITKA
(80) Koranne, M. M.; Goodwin, J. G., Jr.; Marcelin, G. J. Catal. 1994, 148, 378.
(81) Koranne, M. M.; Goodwin, J. G., Jr.; Marcelin, G. J. Phys. Chem. 1993, 97, 673.
(82) Koranne, M. M.; Goodwin, J. G., Jr.; Marcelin, G. In New Frontiers in Catalysis, Proceedings of the 10th International Congress on Catalysis, Budapest, 19-24 July, 1992; Guczi, L., Solymosi, F., TMnyi, P., Eds.; Akademiai Kiad6: Budapest, Hungary, 1993; Part A, p 119.
(83) Smith, M. R.; Ozkan, U. S. J. Catal. 1993, 142, 226. (84) Mauti, R.; Mims, C. A. Catal. Lett. 1993, 21, 201. (85) Ekstrom, A.; Lapszewicz, J. A. J. Phys. Chem. 1989, 93, 5230. (86) Ekstrom, A.; Lapszewicz, J. A. J. Am. Chem. SOC. 1988, 110,
5226. (87) Ekstrom, A.; Lapszewicz, J. A. J. Chem. SOC., Chem. Commun.
1988, 797. (88) Ekstrom, A.; Lapszewicz, J. A. Symposium on Direct Conversion
of Methane to Higher Homologues, American Chemical Society Los Angeles Meeting, Sept. 25-30, 1988; The Division of Petroleum Chemistry, Inc., American Chemical Society: Wash- ington, DC, 1988; p 430.
(89) Oukaci, R.; Blackmond, D. G.; Goodwin, J. G., Jr.; Gallaher, G. R. In Catalytic Control of Air Pollution: Mobile and Stationary Sources; Silver, R. G., Sawyer, J. E., Summers, J. C., Eds.; ACS Symposium Series 495; American Chemical Society: Washing- ton, DC, 1992; Chapter 5, p 61.
Chemical Reviews, 1995, Vol. 95, No. 3 695
(90) Saleh-Alhamed, Y. A.; Hudgins, R. R.; Silveston, P. L.; Peil, K. P.; Goodwin, J. G., Jr. Unpublished work at the University of Pittsburgh, Pittsburgh, PA, 1992.
(91) BariAs, 0. A. Ph.D. Dissertation, University of Trondheim, Trondheim, Norway, 1993.
(92) Happel, J.; Kao, J.-Y.; Yoshikiyo, M.; Chen, Z.; Takeyasu, 0.; Hnatow, M. A.; Cheh, H. Y.; Walter, E.; Lecourtier, Y. In Proceedings, 9th International Congress on Catalysis, Calgary, 1988; Phillips, M. J., Ternan, M., Eds.; Chemical Institute of Canada: Ottawa, ON, 1988; p 1457.
(93) Kao, J.-Y.; Piet-Lahanier, H.; Walter, E.; Happel, J. J. Catal. 1992,133, 383.
(94) Crathorne, E. A.; MacGowan, D.; Morris, S. R.; Rawlinson, A.
(95) Balakos, M. W.; Chuang, S. S. C. J. Catal. 1998, 151, 253. (96) Balakos, M. W.; Chuang, S. S. C. J. Catal. 1996, 151, 266. (97) Hoost, T. E.; Goodwin, J. G., Jr. In Catalyst Deactivation 1991;
Bartholomew, C. H., Butt, J. B., Eds.; Elsevier Science Publish- ers: Amsterdam, 1991; p 691.
(98) Russell, A. J.; Chatterjee, S.; Rapanovitch, I.; Goodwin, J. G., Jr. In Biomolecules in Organic Solvents; CRC Press: West Palm Beach, FL, 1992; p 91.
CR940051C
P. J. Catal. 1994, 149, 254.