Embed Size (px)
Citation preview

185
ANNALS OF GEOPHYSICS, VOL. 46, N. 2, April 2003
Characteristics of the boundary layer at Ny-Ålesund in the Arctic
during the ARTIST fi eld experiment
Stefania Argentini (1), Angelo Pietro Viola (1), Giangiuseppe Mastrantonio (1), Alberto Maurizi (2),Teodoro Georgiadis (2) and Marianna Nardino (2)
(1) Istituto di Scienze dell'Atmosfera e del Clima (ISAC), CNR, Roma, Italy(2) Istituto di Biometeorologia (IBIMET), CNR, Bologna, Italy
AbstractA preliminary analysis of boundary layer data acquired during the Arctic Radiation and Turbulence Interaction Study Experiment (ARTIST) at Ny-Ålesund (Spitzbergen) in 1998 is presented. As expected, the wind fi eld and the thermal structure of the boundary layer are strongly infl uenced by the katabatic fl ow blowing along the Kongsfjorden. In particular, if the large scale circulation has a component along the same direction, the resulting low level wind reaches velocities comparable with geostrophic wind. Stable to neutral conditions occurred most of the time, sustaining inversion or spiky layers respectively, depending on the wind intensity. The behaviour of some micrometeorological parameters was examined in relation to the general fl ow pattern and the characteristics of this area. The highest values of surface sensible heat fl ux (with negative sign) were observed during daytime, in presence of forced convection, due to the transfer of warmer upper layer air into the surface layer.
Mailing address: Dr. Stefania Argentini, Istituto di Scienze dell’Atmosfera e del Clima (ISAC), CNR, Via Fosso del Cavaliere 100, 00133 Roma, Italy; e-mail: [email protected]
Key words Arctic - planetary boundary layer -sodar- turbulence
1. Introduction
A fi eld experiment was carried out in Sval-bard area in spring 1998 in the framework of the EC program ARTIST (Arctic Radiation and Turbulence Interaction Study). The objective of ARTIST was to improve the knowledge of the atmospheric properties during the sea-ice melting season and evaluate the relationship between the local dynamics, some micrometeorological parameters and the general fl ow pattern. The experiment was carried out by several European scientifi c institutions that provided airborne and
ground-based measurements of wind, surface measurements of turbulence and radiation, as well as satellite and conventional meteorological data. A detailed description of the whole fi eld programme, with the complete data inventory of ARTIST is given by Hartmann et al. (1999).
The present work highlights some obser-vational results obtained from the analysis of ground-based and turbulent measurements at Ny-Ålesund in the Kongsfjorden in Spitzbergen Island. In particular, some aspects of the Arctic boundary layer structure, and the behaviour of the atmospheric parameters governing the boundary layer evolution are discussed in the general meteorological and geographical context.
2. Site and instrumentation
The Svalbard Islands are situated in the east part of the Arctic basin, 1000 km from the North Pole at an average latitude of 80°N.

186
Stefania Argentini, Angelo Pietro Viola, Giangiuseppe Mastrantonio, Alberto Maurizi, Teodoro Georgiadis and Marianna Nardino
The main island of Svalbard is Spitzbergen where the climatic infl uence of the Gulf Stream allows small communities to live there. The northernmost community lives in Ny-Ålesund (78.933°N, 11.933°E, 11 m a.s.l.) (fi g. 1a,b) and principally cares about the Arctic station.
Due to the site characteristics and thanks to the logistic support of the Ny-Ålesund community, this place was chosen to carry out the turbulence and ground-based boundary layer measurements during the ARTIST fi eld experiment that took place between March 15 and April 16, 1998.
The instrumentation employed in the fi eld work included: a three-axis Doppler sodar, a tethersounding station, a micrometeorologicalstation, a sensor to measure the ground fl ux, and three subsoil thermometers.
The sodar was located along the coast of the Kongsfi orden in the Zeppelin Bay (S in fi g. 1b) to avoid the noise due to the human activity of the Ny-Ålesund village. The tethersounding station was set up along an old mine road at the foot of a small coal hill at about 20 m a.s.l. (T in fi g. 1b) to avoid interference with the sodar measurements and to have free space to release the balloon. An ISO 20 container was also placed nearby to recover the balloon during strong wind episodes. The fl ight control and the data acquisition were done at the Italian Base (IB in fi g. 1b). The mast with micrometeorological sensors was located between the sodar and the tethersounding station (R in fi g. 1b).
The sodar, similar to the one used in some Antarctic campaigns by Argentini et al. (1992, 1996) is a monostatic three-axis Doppler system with 1.2 m diameter antennas that simultaneously emit three acoustic tones, one from each antenna, at 1750, 2000 and 2250 Hz. Two of the antennas were tilted 20° off the vertical, while the third one pointed vertically. The length of the acoustic pulse was 100 ms. The harmonic analysis of the signal to retrieve the radial wind was made with 0.16 s length samples, corresponding to approximately a 27 m depth layer, the fi rst of which was at 50 m. The height reached by the sodar profi les ranged between 200 m and 900 m depending on the signal to noise ratio, and the wind conditions. A cross-beam confi guration was chosen for the antennas; the tilted anten-nas were positioned at the acute vertices of a
rectangular triangle and oriented towards the vertically pointing antenna. As the vertical and tilted antennas were 25 m apart, they crossed at a height of 67 m. An angle of 30° was chosen between the Y axis and the North to avoid the noise from the Ny-Ålesund village.
The harmonic analysis of the received signal was then performed to derive the wind profi le and to visualise the dynamic evolution of the airfl ow crossing the antenna’s beam. The spectral analysis used to retrieve the Doppler shift and the echo intensity for each channel was carried out through a two-step procedure as explained by Mastrantonio and Fiocco (1982). For each channel, the processing of the returned signal provided the profi les of the radial wind velocity and echo intensity. The data were retained when a parameter related to the signal-to-noise ratio S/N exceeded the threshold of 0.75 (Mastrantonio and Fiocco, 1982).
The tethersounding system included a re-ceiving ground station, and an airborne sensor package consisting of dry and wet bulb ther-mometers, pressure, wind speed and wind di-rection sensors and a 403.5 MHz transmitter. A 5 m3 balloon, properly shaped to facilitate orientation upwind and retrievable by a winch with 1000 m of tetherline was used to fl y the tethersonde. The temperature sensors have an accuracy of ± 0.5 °C. The wind speed, obtained by a three-cup anemometer, has an accuracy of ± 0.25 ms–1, whereas the wind direction is measured with a magnetic compass that relies on the orientation of the balloon within an accuracy of ± 5°, when the balloon is suitably stable. An aneroid barometer measures the pressure with an accuracy of ± 1 hPa. During flight, the electronics of the tethersonde scanned the sensors sequentially and transmitted raw data to the ground station every 6 s. The altitude of the sensor package above the surface was estimated from the pressure and temperature profiles.
The balloon could be released only when the ground wind speed was less then 6 ms–1. Before each launch a pre-fl ight control was conducted by measuring the temperature and pressure with ground sensors. The correct operation of the system (including battery check) and data quality were checked on-line to allow for any real time modifi cation of the balloon fl ight.

187
Characteristics of the boundary layer at Ny-Ålesund in the Arctic during the ARTIST fi eld experiment
a
b
Fig. 1a,b. a) Map of the Kongsfjorden Spitsbergen Island; b) map of Ny-Ålesund and location of the experiment sites: 3-axes Doppler Sodar (S), Radiation and fast response sensors mast (R), Italian Base (IB), Tethersounding station (T).

188
Stefania Argentini, Angelo Pietro Viola, Giangiuseppe Mastrantonio, Alberto Maurizi, Teodoro Georgiadis and Marianna Nardino
The micrometeorological station was installed in a fl at zone with little obstruction nearby. The instrumentation consisted of a Metek sonic thermo-anemometer (mod. USA-1) mounted on top of a 3 m mast, a fast response Campbell Kripton hygrometer (mod. KH20), and a Kipp and Zonen net radiometer (mod. CNR1).
The sonic thermo-anemometer was oriented to the north with an accuracy of 1.5°, and its vertical alignment was assured by two optical levels allowing a precision of 1°.
The fast hygrometer was used to estimate the latent heat fl ux by means of the eddy-covariance technique. Both sonic anemometer and fast hygrometer data were acquired at a frequency of 10 Hz and then collected by a MeteoFlux acquisition system (Sozzi and Favaron, 1996) to provide the real-time values of the three wind components and sonic temperature. Using three axis rotations (Sozzi and Favaron, 1996) the data were processed to derive all the turbulence variables, as well as, the sensible and the latent heat fl uxes.
The net radiometer was used to determine the solar radiation budget. The incoming and outgoing components of the shortwave and longwave radiation were separately measured to derive the net radiation Rn. The shortwave net radiation Swn was obtained by two pyranometers: one facing upward, to measure the incoming solar radiation and the other facing downward to measure the radiation refl ected by the snow surface. The longwave net radiation Lwn was obtained by two pyrgeometers to measure the incoming and outgoing components separately. The self-heating of the instruments was controlled by a platinum-wire thermistor incorporated in the CNR1’s body.
The sub-soil temperatures were measured using two termocouples buried in the snow at depths of 3 cm, 8 cm and 17.5 cm respectively.
3. Wind fi eld observations
According to the climatology of the Spitz-bergen (Førland et al., 1997), the prevailing winds in the area blow from the NE-SE sector, except during the summer. However, the low-level circulation is strongly infl uenced by the
orography and by fl ows of local origin. These fl ows, which move along valleys and fi ords, are drainage winds transporting cold and heavy air from the inland glaciers to the warmer sea. These considerations refer to winds measured at 10 m by the weather stations located in the area. Since the sodar supplies vertical profi les, sometimes up to several hundred meters, it is possible to inspect whether the observed three-dimensional wind fi eld is in agreement with the climatology and how it varies with height.
For about 12 days during the fi eld experiment (from March 19 to April 1), the wind speed often reached peaks of 18 ms–1 with average values higher than seasonal observations. The noise created by high wind velocities caused strong limitations in the range of the sodar measurements.
Fig. 2a-c. Scatter plot of the wind speed versus the wind direction during ARTIST at 65 m (a) and 224 m (b) for sodar and at 3 m for sonic data (c).
a
b
c

189
Characteristics of the boundary layer at Ny-Ålesund in the Arctic during the ARTIST fi eld experiment
Figure 2a-c reports the scatter plots of the wind speed against the wind direction at 65 m and 224 m (sodar), and 3 m (sonic anemometer), respectively. Above 224 m the statistics is too poor to yield an accurate description of the wind speed behaviour. As expected, the sonic anemometer data present a larger scatter due to the infl uence of local roughness.
Two main wind directions can be recognized: one around 100°-150°, along which the highest wind speeds are recorded, and one with a lower intensity peak at 300°-360°. These two directions correspond to the SE-NW geographic orienta-tion of the Kongsfjorden, whose orographic characteristics are responsible for the forcing of the wind direction along this axis. The fact that the strongest winds are observed from SE sector mainly depends on synoptic circulation that often has a southern component. From the NW sector only fl ows with velocities greater than 6 ms–1
seem to overpass the mountains ridge north of the Kongsfjorden and reach Ny-Ålesund.
The wind dynamics in the fjord area of Ny-Ålesund is very complicated. Figure 2a-c shows that the wind speed at 65 m often exceeds that at 224 m. This is due to the existence of drainage fl ows, with a peak below 224 m, moreover a deviation of about 10°-20° from the mean direc-tion for velocities higher than 8 ms–1 is evident at 65 m (fi g. 2a) because the fl ow is less infl uenced by the local orography.
Figure 3 plots the direction and speed at 1100 GMT of the geostrophic and low level wind as a function of time. The geostrophic wind was obtained by using radiosoundings while the sodar data at 65 m were used for the low level wind. A difference of about 30°-40° is observed from March 24 to 30 when the wind speed at both level is about 10-14 ms–1. In this case the geostrophic wind enhances the katabatic fl ow. Between April 6 and 12 the geostrophic wind rotates to the northern sector with a decline in the wind intensity although the low level wind still persist from E-SE. A large deviation (ranging
Fig. 3. Time series of the low level wind given by SODAR at 65 m, and the geostrophic wind by radiosounding during ARTIST at 1100 GMT.

190
Stefania Argentini, Angelo Pietro Viola, Giangiuseppe Mastrantonio, Alberto Maurizi, Teodoro Georgiadis and Marianna Nardino
between 50° and 180°) is observed between the two fl ows. It would appear that in this case the geostrophic wind does not infl uence the fl ow along the Kongsfjorden which will be simply gravity driven downslope the glacier. This large rotation between the surface and geostrophic fl ows is determined by the position of the high-low pressure system, that causes a coupling of the low level and geostrophic circulation when the low pressure centre is located SW of Svalbard and a de-coupling when an opposite situation occurs.
An example of the three dominant flow patterns encountered at Ny-Ålesund is pre-sented in fi g. 4a-d. In order to show the role of the orography in this area, the wind direction measured at the research station on Mount Zeppelin at an altitude of 473 m (full dot) south
of Ny-Ålesund is also plotted. As shown by Beine et al. (2001), south-east fl ows are the most common situation at Ny-Ålesund. In fi g. 4a a rotation of the wind direction is observed around 600 m. The depth of this layer is determined by the orographic influence on the large scale wind fi eld and the presence of the katabatic wind in the lower level. Several superimposed fl ows may be present within this layer with the intensity of the katabatic fl ow determining the height of the katabatic layer. In other cases (fi g. 4b,c) the katabatic fl ow was confi ned to the fi rst 300-400 m while a superimposed fl ow blowing from 0-30° could be observed above 400 m. In both cases the sodar and the Zeppelin station observed, within a deviation of ± 10°, a northerly fl ow while the wind in Ny-Ålesund was from 120°. In the case of northerly fl ow at Ny-Ålesund, fi nally, the fl ow was from the same direction at the Zeppelin station (fi g. 4d).
4. Thermal structure and stability of the atmosphere
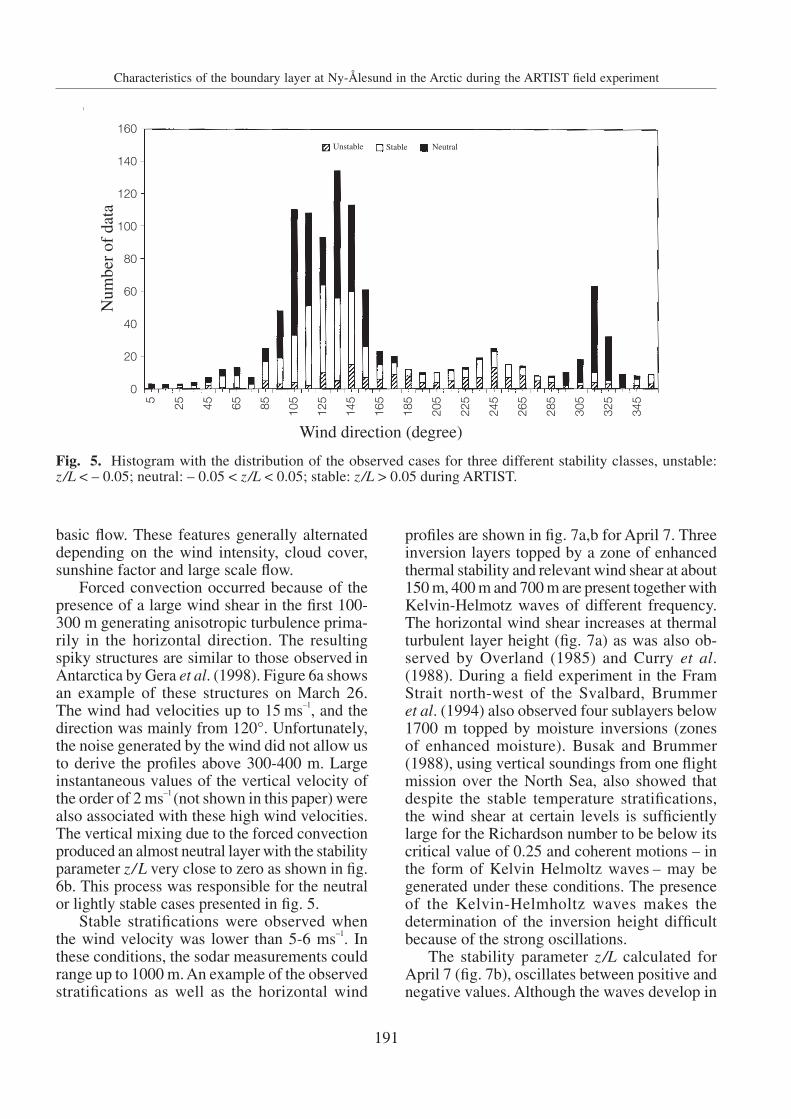
The sonic anemometer data, even if they refer to point measurements, can provide quantities such as the Monin Obukhov length (L) which indicate the stability conditions of the boundary layer. The histogram in fi g. 5 shows the statistics of z/L (z = 3 m is the height of the sensor) as a function of wind direction. These values were divided into three classes: according to unstable (z /L < –0.05), neutral (–0.05 < z /L < 0.05), and stable (z /L > 0.05) conditions. The plot shows two main peaks in the sectors centred around 120° and 310°, corresponding to the two predominant wind directions. Most of the time neutral conditions occur in these two sectors. Stable conditions with thermal stratifi cations at different levels are mainly observed when the wind blows in the sector centred at 120°. Unstable situations, occurring under very light wind conditions, can span from 90° to 270°, with a peak at 245°. The predominant structures observed by the sodar during the experiment were spiky layer, caused by forced convection, in the fi rst period of the campaign until April 1 and stable stratifi cations, often modulated by internal gravity waves, generated by shear of the
Fig. 4a-d. Typical 1 h averaged wind profi les (circle) observed at Ny-Ålesund, the wind direction measured at the Zeppelin research station (full dot) is given for comparison. a) April 7 between 2000-2100 ST; b) April 6 between 0900-1000; c) April 5 between 1900-2000; d) April 5 between 0200-0300.
a b
c d
191
Characteristics of the boundary layer at Ny-Ålesund in the Arctic during the ARTIST fi eld experiment
basic fl ow. These features generally alternated depending on the wind intensity, cloud cover, sunshine factor and large scale fl ow.
Forced convection occurred because of the presence of a large wind shear in the fi rst 100-300 m generating anisotropic turbulence prima-rily in the horizontal direction. The resulting spiky structures are similar to those observed in Antarctica by Gera et al. (1998). Figure 6a showsan example of these structures on March 26. The wind had velocities up to 15 ms–1, and the direction was mainly from 120°. Unfortunately, the noise generated by the wind did not allow us to derive the profi les above 300-400 m. Large instantaneous values of the vertical velocity of the order of 2 ms–1(not shown in this paper) were also associated with these high wind velocities. The vertical mixing due to the forced convection produced an almost neutral layer with the stability parameter z/L very close to zero as shown in fi g. 6b. This process was responsible for the neutral or lightly stable cases presented in fi g. 5.
Stable stratifi cations were observed when the wind velocity was lower than 5-6 ms–1. In these conditions, the sodar measurements could range up to 1000 m. An example of the observed stratifi cations as well as the horizontal wind
profi les are shown in fi g. 7a,b for April 7. Three inversion layers topped by a zone of enhanced thermal stability and relevant wind shear at about 150 m, 400 m and 700 m are present together with Kelvin-Helmotz waves of different frequency. The horizontal wind shear increases at thermal turbulent layer height (fi g. 7a) as was also ob-served by Overland (1985) and Curry et al.(1988). During a fi eld experiment in the Fram Strait north-west of the Svalbard, Brummeret al. (1994) also observed four sublayers below 1700 m topped by moisture inversions (zones of enhanced moisture). Busak and Brummer (1988), using vertical soundings from one fl ight mission over the North Sea, also showed that despite the stable temperature stratifi cations, the wind shear at certain levels is suffi ciently large for the Richardson number to be below its critical value of 0.25 and coherent motions – in the form of Kelvin Helmoltz waves – may be generated under these conditions. The presenceof the Kelvin-Helmholtz waves makes the determination of the inversion height diffi cult because of the strong oscillations.
The stability parameter z /L calculated for April 7 (fi g. 7b), oscillates between positive and negative values. Although the waves develop in
Fig. 5. Histogram with the distribution of the observed cases for three different stability classes, unstable: z/L < – 0.05; neutral: – 0.05 < z/L < 0.05; stable: z/L > 0.05 during ARTIST.

192
Stefania Argentini, Angelo Pietro Viola, Giangiuseppe Mastrantonio, Alberto Maurizi, Teodoro Georgiadis and Marianna Nardino
b
Fig. 6a,b. a) Sodar facsimile and horizontal velocity recorded at Ny-Ålesund on March 26, 1998 during forced convection; b) stability parameter z /L as a function of solar time.
Solar Time (h)
z / L
0:00 2:00 4:00 6:00 8:00 10:00 12:00 14:00 16:00 18:00 20:00 22:00 0:00
a
b
Fig. 7a,b. a) Sodar facsimile and horizontal velocity recorded at Ny-Ålesund on April 7, 1998 showing a stable layer with waves; b) stability parameter z/L as a function of solar time.
a stable boundary layer, these oscillations may be attributed to upward and downward oscillations of air masses with different thermal and dynamic characteristics. Although these values are not
representative of the «real» stability conditions, they are suffi ciently indicative of the thermal structure of the atmosphere to be used as an indicator of the presence of waves.
a

193
Characteristics of the boundary layer at Ny-Ålesund in the Arctic during the ARTIST fi eld experiment
Use of the sodar for measuring the turbulent components of the wind is still problematic (Wilczak et al., 1996), but some quantities such as the variance of the vertical velocity give values that are correct if the data are properly analysed. In these cases, as shown by Angevine et al. (1994) and Argentini et al. (1999), these values are more representative than in situ surface measurements, since they are less sensitive to surface conditions than a point sensor.
5. Surface fl uxes
The surface fl uxes have been calculated from the covariances of the temperature, humidity and vertical fl uctuations, using sonic anemometer and fast hygrometer measurements.
The behaviour of the sensible heat flux (H0), Turbulent Kinetic Energy (TKE), and of vertical momentum fl uxes (u'w'), for the whole measurement period are presented in fi g. 8 a,b
Fig. 8a-c. a) Behaviour of the sensible heat fl ux; b) turbulent kinetic energy; c) vertical momentum fl ux, during ARTIST.
a
b
c

194
Stefania Argentini, Angelo Pietro Viola, Giangiuseppe Mastrantonio, Alberto Maurizi, Teodoro Georgiadis and Marianna Nardino
and c, respectively. Until the end of March the sensible heat fl ux is, most of the time, negative as expected under stable atmospheric conditions. The highest values of sensible heat fl ux, TKE and momentum flux are reached for strong wind speeds. When the mechanical turbulence is high, the strong vertical mixing produces a remarkable sensible heat fl ux transfer from the atmosphere to the surface (negative sign). During the last measurement period (early to mid-April), characterised by weaker winds and a low cloud coverage (as pointed out later), the sensible heat fl ux tends to assume positive values (convective atmospheric conditions).
It is noted that the behavior of TKE and momentum fl ux are negatively correlated. The radiative budget at the surface, obtained through the radiometric measurements, is shown in fi g. 9. The low values of the net radiation Rn indicate that very low energy is available at these latitudes. The shortwave net fl ux Swn has an increasing trend due to the increase in the daytime period. The
straight lines in the Swn and Rn plots are due to the shadow of the mast on the radiometer. The fi rst measurement period was characterised by intense cloud coverage days with very low values of Swn
and irregular behaviour. Low cloud coverage was present after April 4.
Finally, the value of the sub-surface fl ux through the measurements of the snow temperature at different depth was calculated.
The value of the fl ux in the soil, if no water-phase changes occur at the surface, is given by two terms: one due to the heat transferred by conduction and the other caused by transmission of the shortwave radiation into the snow (Bintanja and van den Broeke, 1995). This parameterisation was applied to our measurements using two snow temperatures to obtain the conduction heat, and the shortwave radiation component for the radiative heating. Figure 10 a-c shows the values of the fl uxes into the snow obtained using three different temperature gradients; Glow using the difference between T2 and T3, Gup
Fig. 9. Behaviour of the net radiation, longwave net radiation and shortwave net radiation for the whole measurement period.

195
Characteristics of the boundary layer at Ny-Ålesund in the Arctic during the ARTIST fi eld experiment
between T1 and T2 and, Gthick between T1 and T3.The general behaviour of Glow is smoother than the corresponding Gup and Gthick calculated in the uppermost and thickest layers respectively. This is a direct consequence of the smaller fl uctuations at greater depths. Ground fl uxes minima are observed when the surface temperature reaches a minimum (generally during the night). Under these conditions the snow temperature in the deeper layers is higher than at the surface and the heat fl ux is directed upwards.
In interpreting these results we should bear in mind that Gup is surely over-estimated because the upper part of the temperature sensor tends to heat itself during clear days. Indeed, the last days of
Fig. 10a-c. Time evolution of the fl ux into the snow calculated with three different temperature gradients: a) T2 - T3 for Glow; b) T1 - T2 for Gup, and c) T1 - T3 for Gthick, being T1 at 3 cm, T2 at 8 cm and T3 at 17.5 cm below the surface respectively.
a
b
c
the measurement campaign show a higher value of the fl ux into the snow. Moreover, during night time in clear days the Glow values were almost 10 Wm–2 lower than the corresponding Gup values. This can be explained considering that during the night the surface temperature and the snow temperature at 8 cm decreased following almost the same slope, whereas the snow temperature at 17.5 cm decreased more gently, so that the difference between the decreasing rate of T2
and T3 was larger than between T1 and T2. These temperature differences indicate that the sensor T2
is not deep enough to account for all heat stored in the snow or released toward the surface during the day. The sensor T3 is probably at the most appropriate reference depth for calculating heat exchanges between the surface and the deepest layers.
6. Summary
We have presented some preliminary ob-servational results from the ground-based measurements during the field experiment ARTIST in Ny-Ålesund. Neutral conditions were observed from the two predominant wind directions centred in the 120° and 310° sectors. A minor peak with the 20% of unstable cases was observed at 245° while stable conditions were mainly distributed around the sector at 120°. The thermal structure of the atmosphere was recorded with a sodar system. Two main features were observed: spiky layers and stable stratifi cations. Spiky layers, due to the presence of forced con-vection, were observed in correspondence of high wind speed, stratifi ed fl ows with waves occurred for low wind velocities. The two features mostly alternated with each other depending on the wind intensity. To further characterise wavy and well mixed layers, the vertical velocity vari-ances were measured over time, using the sonic anemometer and the sodar. A general consistency was observed between the two sets of data during forced convection when the atmosphere, under the infl uence of strong mechanical mixing along the vertical, presents air masses with similar properties at the two sensors. A comparison between the wind in the boundary layer and the geostrophic wind estimated by radiosoundings

196
Stefania Argentini, Angelo Pietro Viola, Giangiuseppe Mastrantonio, Alberto Maurizi, Teodoro Georgiadis and Marianna Nardino
was undertaken. For moderate to high wind speed a deviation of about 30° is observed between the two directions; in this case the geostrophic wind contributes to enhance the katabatic fl ow intensity and persistence. A deviation (ranging between 50° and 180°) was observed for weak winds.
The highest values of the sensible heat fl uxes were observed during day time under forced convection because of the transfer of warmer upper layer air into the surface layer.
The radiometric and temperature meas-urements were utilised to compute the net ra-diation and subsurface heat fl ux. The fl ux into the snow depends on several factors such as the depth of the snow layer, the thermal con-ductivity and the fraction of solar radiation absorbed by the surface. An analysis of gradient fl uxes G, obtained for different snow layers, showed that the most representative values are those of the layer between the surface and the deepest temperature sensor. However, further studies are necessary to arrive at more complete parameterisation schemes of the conductive and radiative components of the subsurface heat fl ux.
Acknowledgements
This research was supported by the EC Environment and Climate Research Program n. CT97-0487. Funding for the logistics in Ny-Ålesund was provided by the Italian «Progetto Strategico Artide». The authors wish to thank «Piano Nazionale Ricerche in Antartide» for providing the instrumentation used in the fi eld work, as well as Mr. A. Conidi for his help during the fi eld experiment.
REFERENCES
ANGEVINE, W.M., R.J. DOVIAK and Z. SORBJAN (1994): Remote sensing of vertical velocity variance and sur-face heat fl ux in a convective boundary layer, J. Appl. Meteorol., 33 (8), 977-983.
ARGENTINI, S., G. MASTRANTONIO, G. FIOCCO and R. OCONE(1992): Complexity of the wind fi eld as observed by a sodar system and by automatic weather stations on the
Nansen Ice Sheet, Antarctica, during summer 1988-1989: two cases studies, Tellus, 44B, 422-429.
ARGENTINI, S., G. MASTRANTONIO, A. VIOLA, P. PETTRÉand G. DARGAUD (1996): Sodar performances and preliminary results after one year measurements at Adelie coast, East Antarctica, Boundary Layer Meteorol., 81, 75-103.
ARGENTINI, S., G. MASTRANTONIO and F. LENA (1999): The convective boundary layer during winter in the urban aerea of Milano: a few cases study, Boundary Layer Meteorol., 93, 253-267.
BEINE, H.J., S. ARGENTINI, A. MAURIZI, G. MASTRANTONIOand A. VIOLA (2001): The local wind fi eld a Ny-Ålesund and Zeppelin mountain at Svalbard, Meteorol. Atmos.Phys., 78, 107-113.
BINTANJA, R. and M.R. VAN DEN BROEKE (1995): The surface energy balance of Antarctic snow Blue Ice, J.Appl. Meteorol., 34, 902-926.
BRUMMER, B., B. BUSAK, H. HOEBER and G. KRUSPE (1994): Boundary-layer observations over water and Arctic sea-ice during on-ice air fl ow, Boundary Layer Meteorol.,68, 75-108.
BUSAK, B. and B. BRUMMER (1988): A case study of Kelvin-Helmholtz waves within an off-shore stable boundary layer: observations and linear model, Boundary Layer Meteorol., 44, 105-135.
CURRY, J.A., E.E. EBERT and G.F. HERMAN (1988): Mean and turbulence structure of the summertime Arctic cloudy boundary layer, Q. J. R. Meteorol. Soc., 114, 715-746.
FØRLAND, E.J., I. HANSEN-BAUER and P.Ø. NORDLI (1997): Climate statistics and long-term series of temperature and precipitation at Svalbard and Jan Mayen, Den Norske Meteorologiske Institutt, Oslo, Norway, Rep. OMNI 39/90 KLIMA, pp. 40.
GERA, B.S., S. ARGENTINI, G. MASTRANTONIO, A. VIOLA and A. WEILL (1998): Characteristics of the boundary layer thermal structure at a coastal region of Adelie land, East Antarctica, Antarct. Sci., 10 (1), 89-98.
HARTMANN, J., F. ALBERS, S. ARGENTINI, A. BOCHERT,U. BONAFÈ, W. COHRS, A. CONIDI, D. FREESE, T. GEORGIADIS, A. IPPOLITI, L. KALESCHKE, C. LUPKES,U. MAIXNER, G. MASTRANTONIO, F. RAVEGNANI, A. REUTER, G. TRIVELLONE and A. VIOLA (1999): Arctic Radiation and Turbulence Interaction Study (ARTIST), Alfred-Wegener-Institute für Polar Meeresforschung, Bremerhaven, Germany, Rep. on Polar Research 305/1999, pp. 81.
MASTRANTONIO, G. and G. FIOCCO (1982): Accuracy of wind velocity determination with doppler sodar, J. Appl. Meteorol., 21, 820-830.
OVERLAND, J.E. (1985): Atmospheric boundary layer structure and drag coeffi cients over sea ice, J. Geophys. Res., 90 (5), 9029-9049.
SOZZI, R. and M. FAVARON (1996): Sonic anemometry and thermometry: theoretical basis and data-processing software, Environ. Software, 11 (4), 259-270.
WILCZAK, J.M., E.E. GOSSARD, W.D. NEFF and L. EBERHARD(1996): Ground-based remote sensing of the atmospheric boundary layer: 25 years of progress, Boundary Layer Meteorol., 78, 321-349.


![arXiv:1611.04457v1 [astro-ph.EP] 14 Nov 2016 · 3 LAL-IMCCE, Universit e de Lille, 1 Impasse de l’Observatoire, 59000 Lille, France 4 IAPS-INAF, via Fosso del Cavaliere 100, 00133](https://img.dokumen.tips/doc/110x75/5ec736487afe2f58aa4d3f01/arxiv161104457v1-astro-phep-14-nov-2016-3-lal-imcce-universit-e-de-lille.jpg)


![arXiv:0808.2505v1 [astro-ph] 18 Aug 2008Alessandro Chieffi Istituto Nazionale di Astrofisica - Istituto di Astrofisica Spaziale e Fisica Cosmica, Via Fosso del Cavaliere, I-00133,](https://img.dokumen.tips/doc/110x75/6099e33e2c74c94cbf5f03d5/arxiv08082505v1-astro-ph-18-aug-2008-alessandro-chieif-istituto-nazionale-di.jpg)


![arXiv:1305.3789v1 [astro-ph.IM] 16 May 2013 · 2018. 9. 6. · INAF/IAPS, Via Fosso del Cavaliere 100, I-00133, Roma, Italy and INFN/Sezione di Roma 2, viale della Ricerca Scientifica](https://img.dokumen.tips/doc/110x75/607e71bb93161351d0352414/arxiv13053789v1-astro-phim-16-may-2013-2018-9-6-inafiaps-via-fosso-del.jpg)


