Embed Size (px)
Citation preview
Characterisation of Ugandan raw-minerals for firebricks -before and after sintering.
John Baptist Kirabira
Licentiate thesis
Royal Institute of Technology
Department of Materials Science and Engineering Division of Mechanical Metallurgy
Stockholm 2003
ii
Akademisk avhandling som med tillstånd av Kungl Tekniska Högskolan framlägges till offentlig granskning för avläggande av teknisk licentiatexamen onsdagen den 10 december 2003 kl. 10.00 vid Institutionen för Materialvetenskap, Kungl Tekniska Högskolan, föreläsningssal B2, Brinellvägen 23, Stockholm. Fakultetsopponent är docent Tommy Ekström, Lönnviksvägen 66, 178 90, Ekerö. ISBN 91-7283-645-8 ISRN KTH/MSE--03/60--SE+MEK/AVH © John Baptist Kirabira, November 2003

iii
Contents 1. Introduction ................................................................................................................... 1
1.1 Presentation of the thesis .................................................................................. 1 1.2 Materials and manufacture of firebricks ...................................................... 2
2. Experimental Techniques .......................................................................................... 2 3. Summary of results ..................................................................................................... 4 4. Conclusions.................................................................................................................. 18 5. Suggestions of future work ..................................................................................... 18 Acknowledgements............................................................................................................. 19 References ............................................................................................................................. 20 APPENDIX: PAPERS (I-III) ........................................................................................... 21
1
1. Introduction
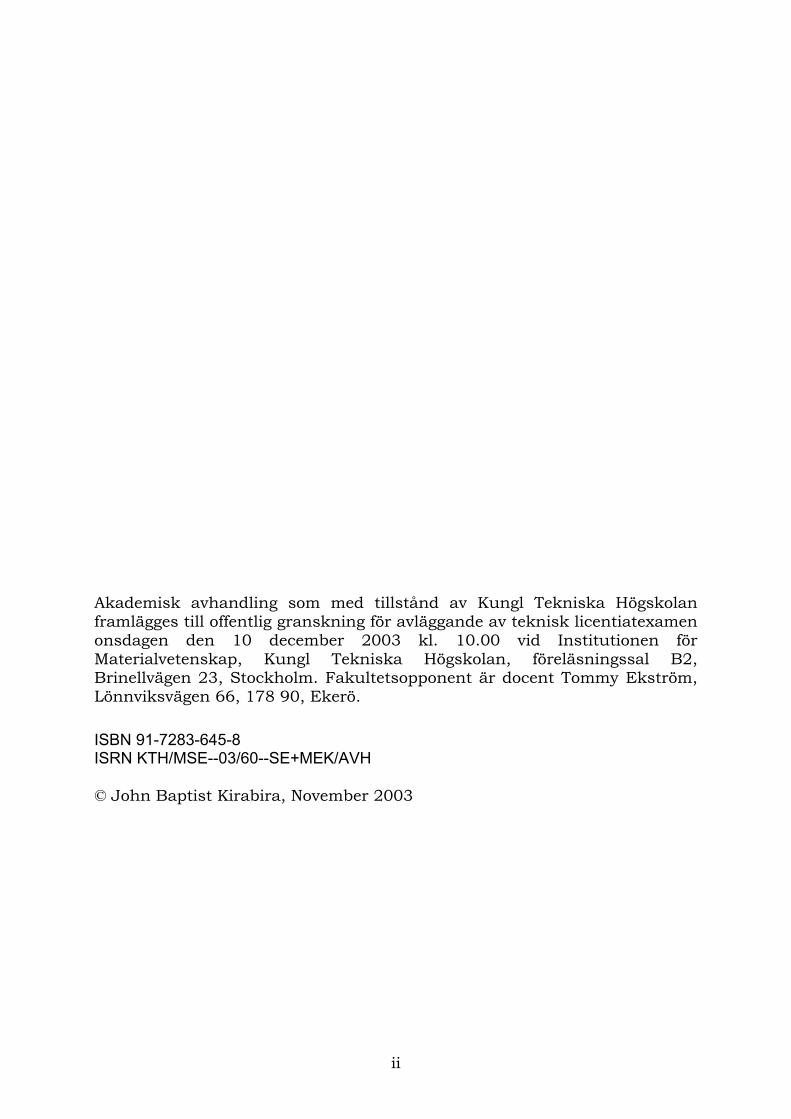
1.1 Presentation of the thesis The present thesis deals with the minerals, naturally occurring in the Lake Victoria region in Uganda, specially suited for manufacturing of refractory firebricks. It includes the following three papers:
1. “State of the Art Paper on development and manufacture of firebrick refractories from locally available alumina-rich clays in Uganda”, John Baptist Kirabira*, Stefan Jonsson**, Joseph Kadoma Byaruhanga*
2. “Powder Characterization of High Temperature Ceramic raw materials in the Lake Victoria Region” , John Baptist Kirabira*, Stefan Jonsson**, Joseph Kadoma Byaruhanga*
3. “Production of firebrick refractories from kaolinitic clays of the Lake Victoria region”, John Baptist Kirabira*, Stefan Jonsson**, Joseph Kadoma Byaruhanga*
*Department of Mechanical Engineering, Faculty of Technology, Makerere University, P.O. Box 7062, Kampala, Uganda, email: [email protected] **Department of Materials Science and Engineering, Royal Institute of Technology (KTH), Brinellvägen 23, SE-100 44 Stockholm, Sweden, email: [email protected] The first paper is a “state of the art” paper and covers the classification of ceramics, definition of refractories and their classification, their applications and their characteristics, the major refractories, the raw materials, the major mineral sources and how they are formed and transported in nature, the characterisation methods for raw materials, the high-temperature reactions during sintering including discussions on the Al2O3-SiO2 phase diagram, manufacturing of refractories, and finally, the benefits of exploiting Ugandan ceramic deposits. The second paper covers the characterisation of minerals from two kaolin deposits (Mutaka and Mutundwe) and a ball-clay deposit (Mukono) in Uganda. Both raw- and beneficiated minerals are characterised with respect to chemical composition, morphology, density, particle size distribution, surface area, and finally, weight changes and phase transformations on heating. In addition, the mineral constitution of the raw powders is investigated by XRD. The third paper investigates the properties of six formulated and fired sample bricks. The bricks are characterised with respect to dry shrinkage, firing shrinkage, true porosity, apparent- and real density, water absorption, phase constitution after firing at 1250, 1300, 1400 and 1500°C, respectively, and finally, the cold crushing strength. Sieve analyses of the Mutaka kaolin and Mukono ball clay are also given.
2
Since the first paper thoroughly covers all details of concern in manufacturing of firebricks, a short introduction will be given here, only.
1.2 Materials and manufacture of firebricks Firebricks, like other ceramic products are processed through three main stages: raw materials preparation, consolidation to compacts and densification by sintering. The main constituents of firebricks are alumina (Al2O3) and silica (SiO2). These systems are normally based on kaolinitic clays which generally present substantial shrinkage when fired. In consideration of shrinkage and cracking of the product, raw materials are fired, crushed and size graded into stable grog (calcined fireclay) and mixed with ground clay slip. The grog promotes drying and limits dry shrinkage whereas the clay promotes sintering and bonding during firing. The materials used for making grog are generally more refractory than the bonding material. The grog is crushed into different granulometry fractions; course (1 to 3mm), middle (0.25 to 1mm) and fine (≤0.25mm). The crushed grog is mixed in different batches and then bonded with a slip normally made of clay/kaolin mixture (0.125mm). The grog/slip mixture is then shaped by press-forming. The formed shapes are dried and fired i.e. sintered at temperatures between 1200 and 1500ºC for 6 to 24 hours. The higher the alumina content, the higher the firing temperature. The fired samples generally are left to cool in the furnace.
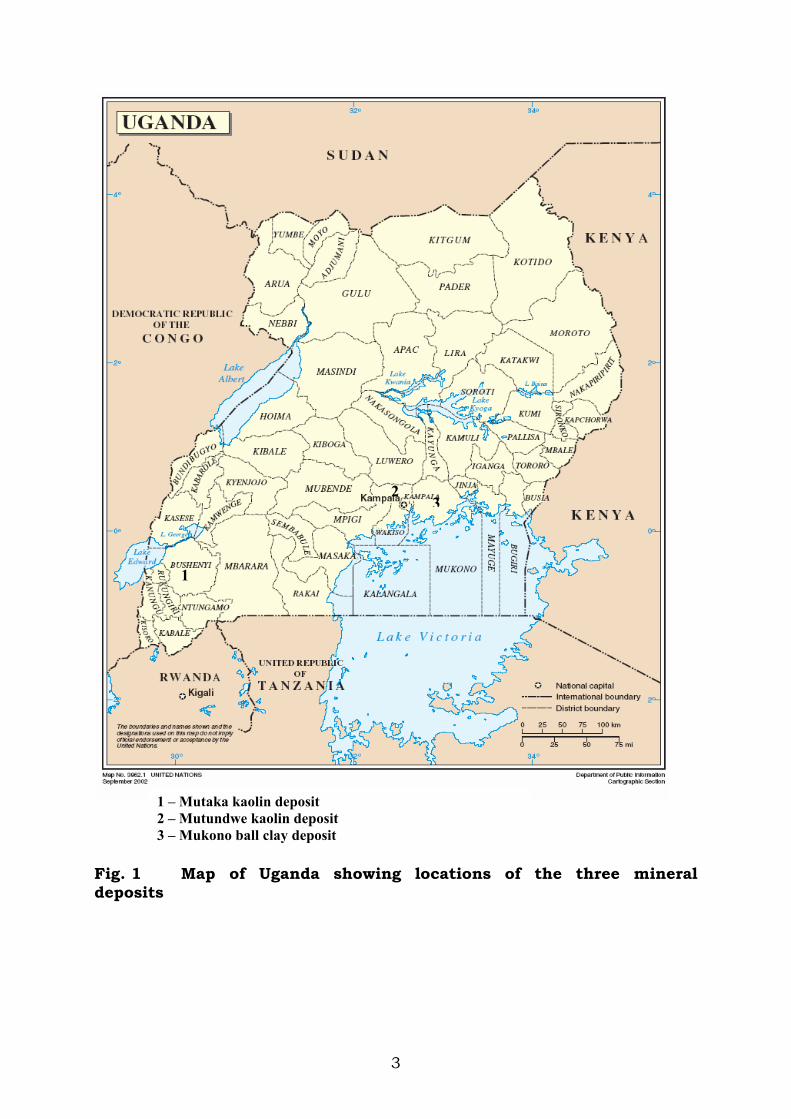
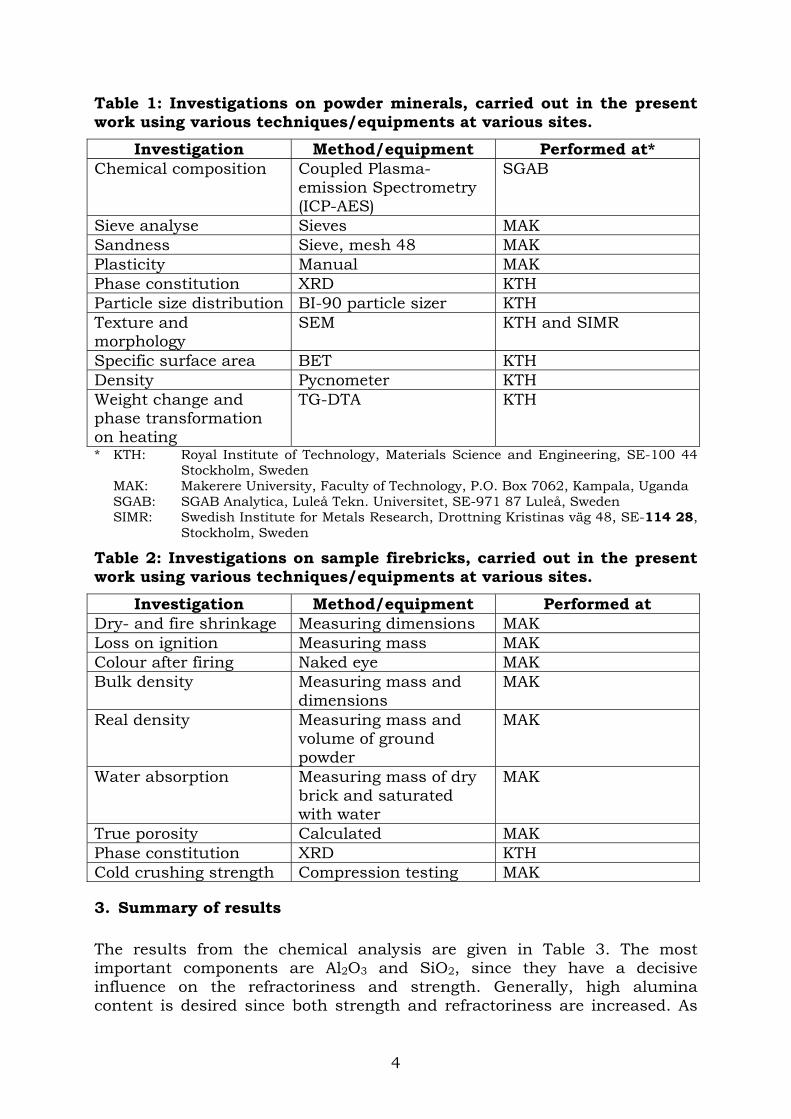
2. Experimental Techniques The mineral samples were colleted from local deposits in Uganda as shown in Fig. 1, and in order to assure representative samples, not less than 300kg were collected from each deposit and sub-divided into two parts for further processing. One part, referred to as "raw", was ground and homogenised while the other part, referred to as "processed", was mixed with water to form a homogeneous slip. The slip was passed through various sieves to remove course particles, stones, humus and sand. Then it was passed over a magnetic separator to remove iron and, finally, it was dried. The experimental work carried out in the present thesis covers a long range of techniques. The specific details are given in the appended papers and only a short summary is given here covering the types of investigations, method/equipment used and where the investigations were performed. The investigations on powders and on bricks are listed in Table 1 and Table 2 respectively.
3
Fig. 1 Map of Uganda showing locations of the three mineral deposits
1
2 3
1 – Mutaka kaolin deposit 2 – Mutundwe kaolin deposit 3 – Mukono ball clay deposit
4
Table 1: Investigations on powder minerals, carried out in the present work using various techniques/equipments at various sites.
Investigation Method/equipment Performed at* Chemical composition Coupled Plasma-
emission Spectrometry (ICP-AES)
SGAB
Sieve analyse Sieves MAK Sandness Sieve, mesh 48 MAK Plasticity Manual MAK Phase constitution XRD KTH Particle size distribution BI-90 particle sizer KTH Texture and morphology
SEM KTH and SIMR
Specific surface area BET KTH Density Pycnometer KTH Weight change and phase transformation on heating
TG-DTA KTH
* KTH: Royal Institute of Technology, Materials Science and Engineering, SE-100 44 Stockholm, Sweden
MAK: Makerere University, Faculty of Technology, P.O. Box 7062, Kampala, Uganda SGAB: SGAB Analytica, Luleå Tekn. Universitet, SE-971 87 Luleå, Sweden SIMR: Swedish Institute for Metals Research, Drottning Kristinas väg 48, SE-114 28,
Stockholm, Sweden
Table 2: Investigations on sample firebricks, carried out in the present work using various techniques/equipments at various sites.
Investigation Method/equipment Performed at Dry- and fire shrinkage Measuring dimensions MAK Loss on ignition Measuring mass MAK Colour after firing Naked eye MAK Bulk density Measuring mass and
dimensions MAK
Real density Measuring mass and volume of ground powder
MAK
Water absorption Measuring mass of dry brick and saturated with water
MAK
True porosity Calculated MAK Phase constitution XRD KTH Cold crushing strength Compression testing MAK
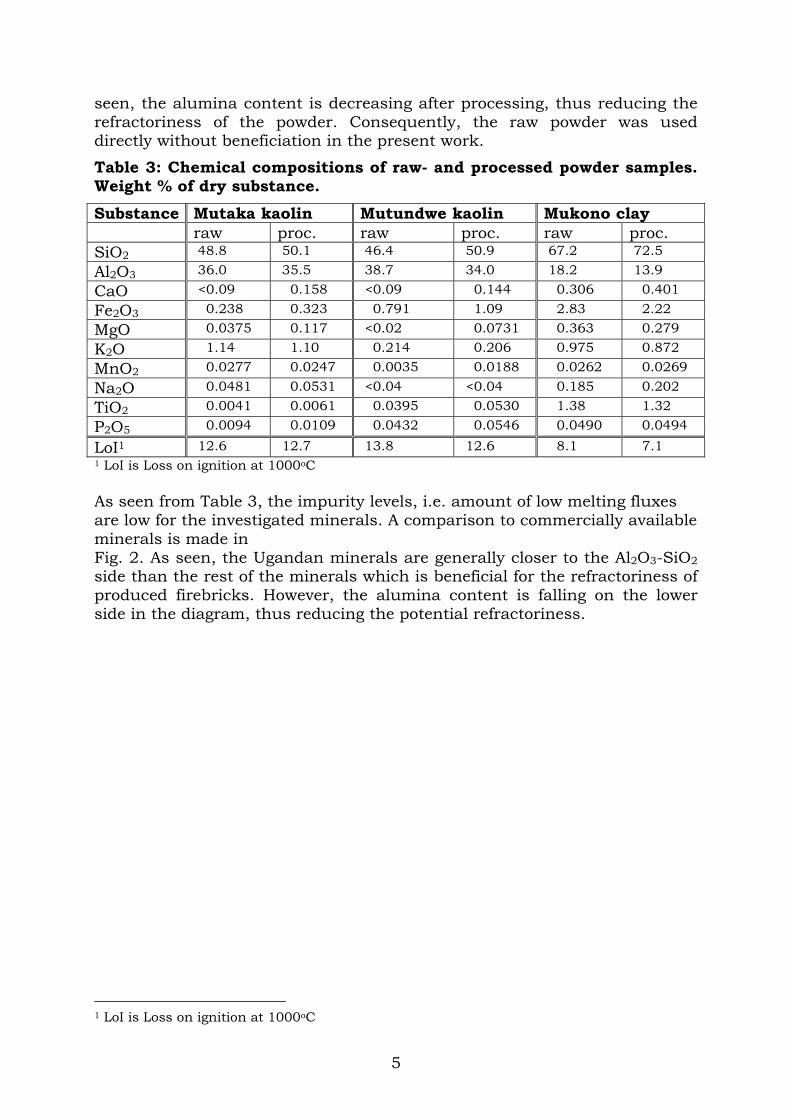
3. Summary of results The results from the chemical analysis are given in Table 3. The most important components are Al2O3 and SiO2, since they have a decisive influence on the refractoriness and strength. Generally, high alumina content is desired since both strength and refractoriness are increased. As
5
seen, the alumina content is decreasing after processing, thus reducing the refractoriness of the powder. Consequently, the raw powder was used directly without beneficiation in the present work.
Table 3: Chemical compositions of raw- and processed powder samples. Weight % of dry substance. Substance Mutaka kaolin Mutundwe kaolin Mukono clay raw proc. raw proc. raw proc. SiO2 48.8 50.1 46.4 50.9 67.2 72.5
Al2O3 36.0 35.5 38.7 34.0 18.2 13.9
CaO <0.09 0.158 <0.09 0.144 0.306 0.401
Fe2O3 0.238 0.323 0.791 1.09 2.83 2.22
MgO 0.0375 0.117 <0.02 0.0731 0.363 0.279
K2O 1.14 1.10 0.214 0.206 0.975 0.872
MnO2 0.0277 0.0247 0.0035 0.0188 0.0262 0.0269
Na2O 0.0481 0.0531 <0.04 <0.04 0.185 0.202
TiO2 0.0041 0.0061 0.0395 0.0530 1.38 1.32
P2O5 0.0094 0.0109 0.0432 0.0546 0.0490 0.0494
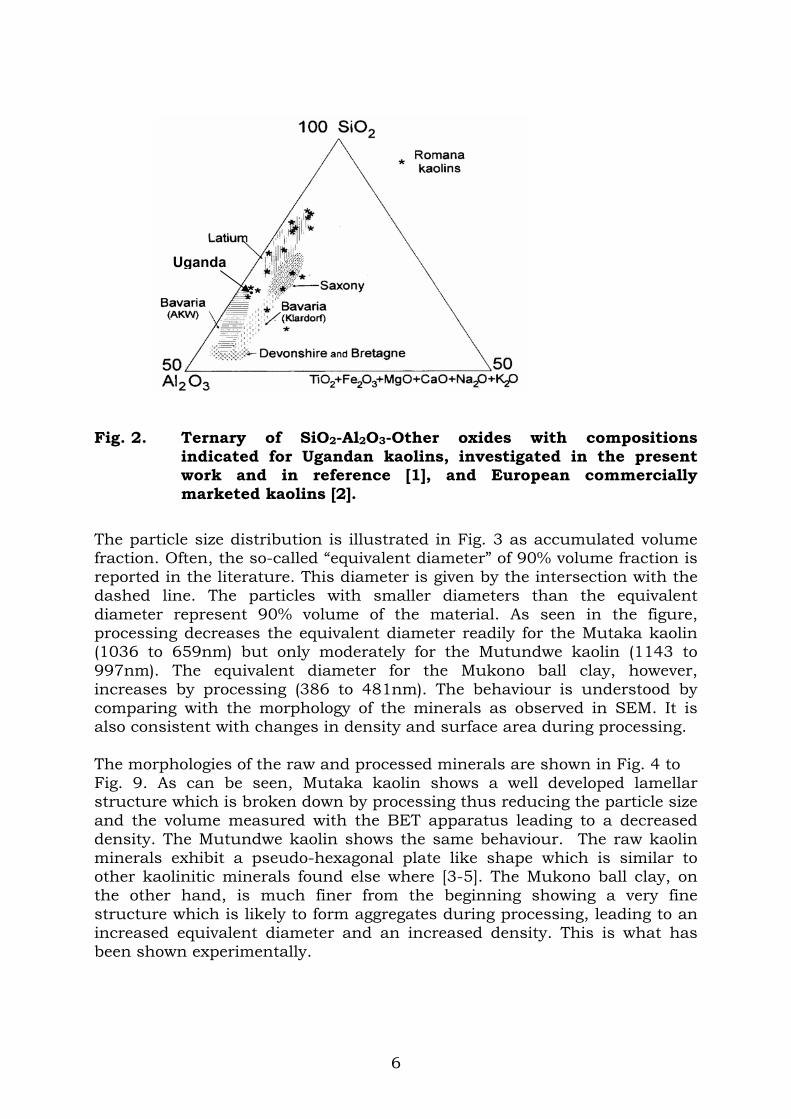
LoI1 12.6 12.7 13.8 12.6 8.1 7.1 1 LoI is Loss on ignition at 1000oC As seen from Table 3, the impurity levels, i.e. amount of low melting fluxes are low for the investigated minerals. A comparison to commercially available minerals is made in Fig. 2. As seen, the Ugandan minerals are generally closer to the Al2O3-SiO2 side than the rest of the minerals which is beneficial for the refractoriness of produced firebricks. However, the alumina content is falling on the lower side in the diagram, thus reducing the potential refractoriness.
1 LoI is Loss on ignition at 1000oC
6
Fig. 2. Ternary of SiO2-Al2O3-Other oxides with compositions
indicated for Ugandan kaolins, investigated in the present work and in reference [1], and European commercially marketed kaolins [2].
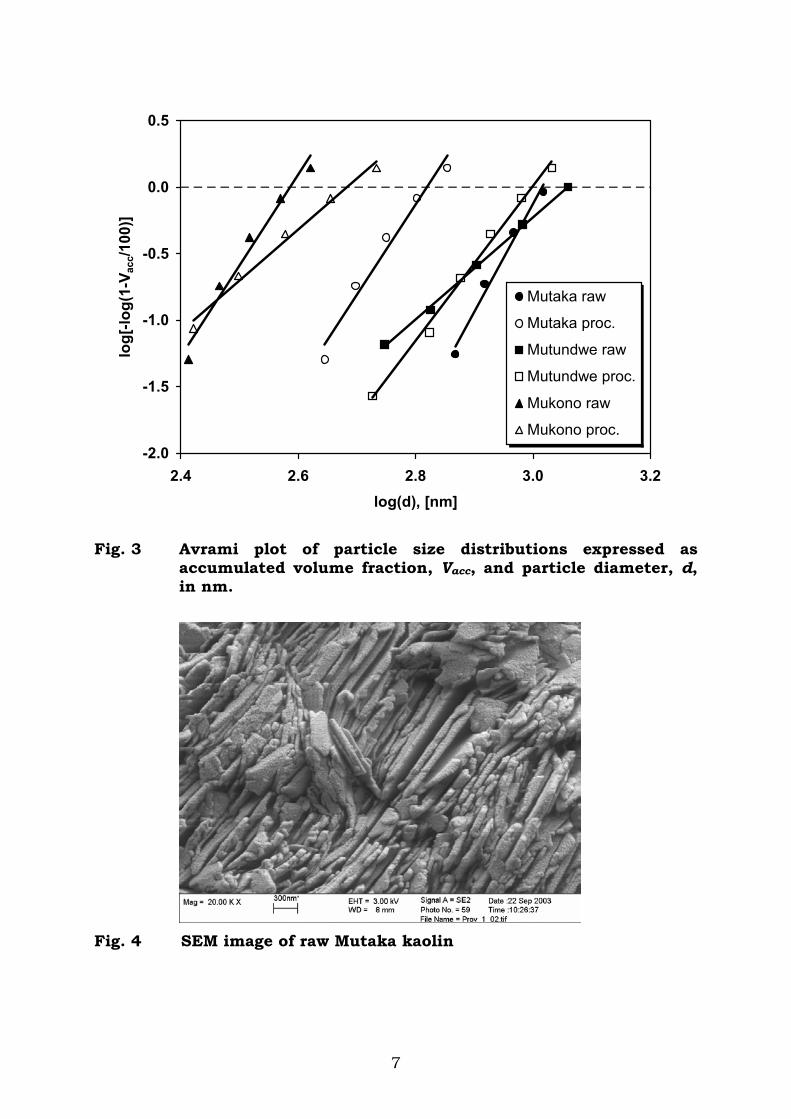
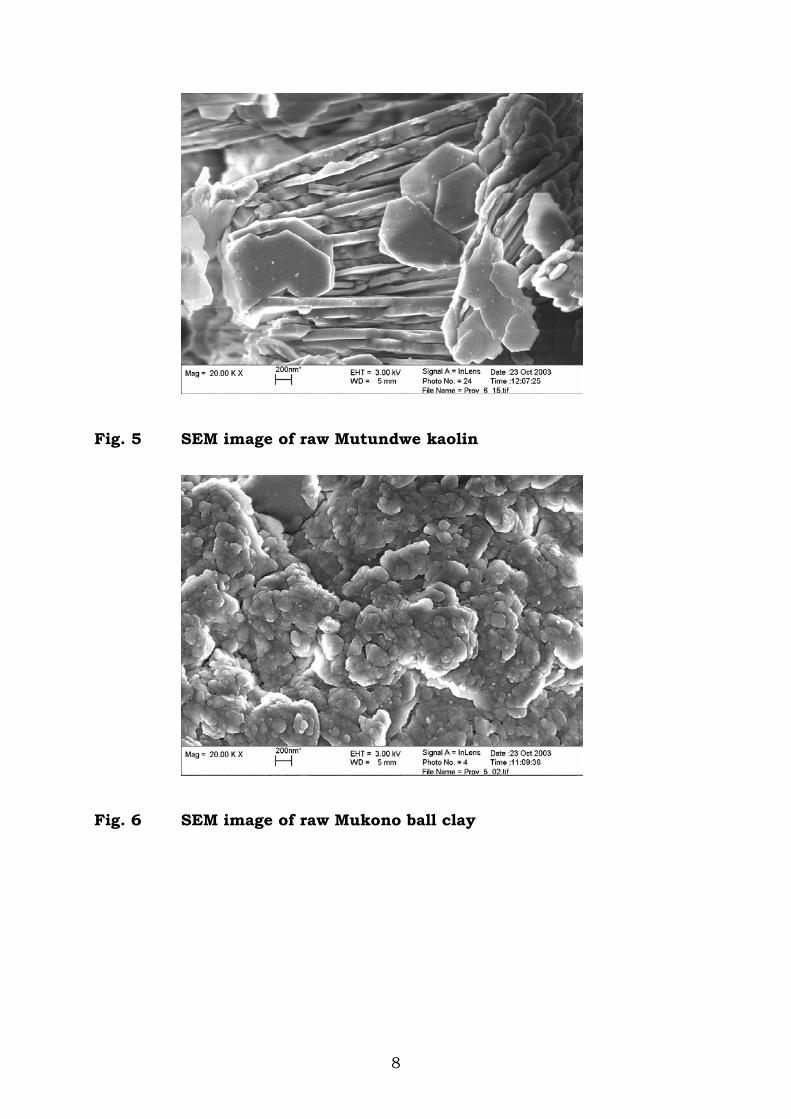
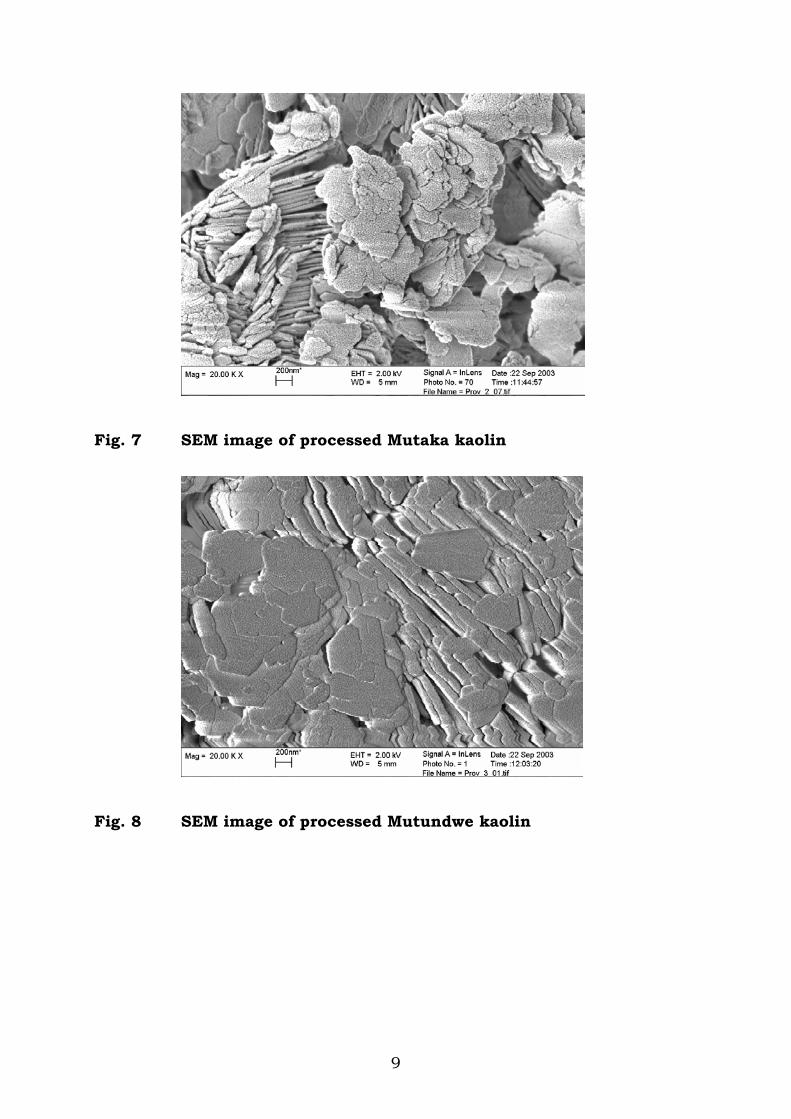
The particle size distribution is illustrated in Fig. 3 as accumulated volume fraction. Often, the so-called “equivalent diameter” of 90% volume fraction is reported in the literature. This diameter is given by the intersection with the dashed line. The particles with smaller diameters than the equivalent diameter represent 90% volume of the material. As seen in the figure, processing decreases the equivalent diameter readily for the Mutaka kaolin (1036 to 659nm) but only moderately for the Mutundwe kaolin (1143 to 997nm). The equivalent diameter for the Mukono ball clay, however, increases by processing (386 to 481nm). The behaviour is understood by comparing with the morphology of the minerals as observed in SEM. It is also consistent with changes in density and surface area during processing. The morphologies of the raw and processed minerals are shown in Fig. 4 to Fig. 9. As can be seen, Mutaka kaolin shows a well developed lamellar structure which is broken down by processing thus reducing the particle size and the volume measured with the BET apparatus leading to a decreased density. The Mutundwe kaolin shows the same behaviour. The raw kaolin minerals exhibit a pseudo-hexagonal plate like shape which is similar to other kaolinitic minerals found else where [3-5]. The Mukono ball clay, on the other hand, is much finer from the beginning showing a very fine structure which is likely to form aggregates during processing, leading to an increased equivalent diameter and an increased density. This is what has been shown experimentally.
Uganda
7
-2.0
-1.5
-1.0
-0.5
0.0
0.5
2.4 2.6 2.8 3.0 3.2log(d), [nm]
log[
-log(
1-V a
cc/1
00)]
Mutaka raw
Mutaka proc.
Mutundwe raw
Mutundwe proc.
Mukono raw
Mukono proc.
Fig. 3 Avrami plot of particle size distributions expressed as
accumulated volume fraction, Vacc, and particle diameter, d, in nm.
Fig. 4 SEM image of raw Mutaka kaolin
8
Fig. 5 SEM image of raw Mutundwe kaolin
Fig. 6 SEM image of raw Mukono ball clay
9
Fig. 7 SEM image of processed Mutaka kaolin
Fig. 8 SEM image of processed Mutundwe kaolin
10
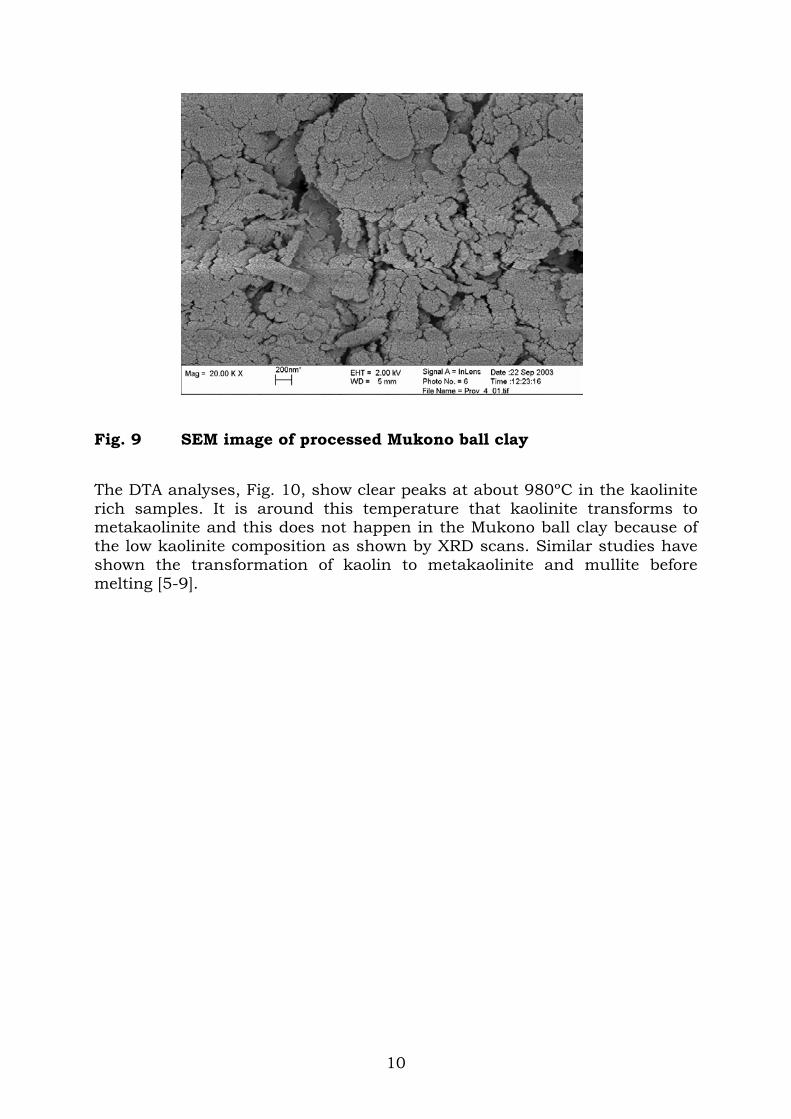
Fig. 9 SEM image of processed Mukono ball clay
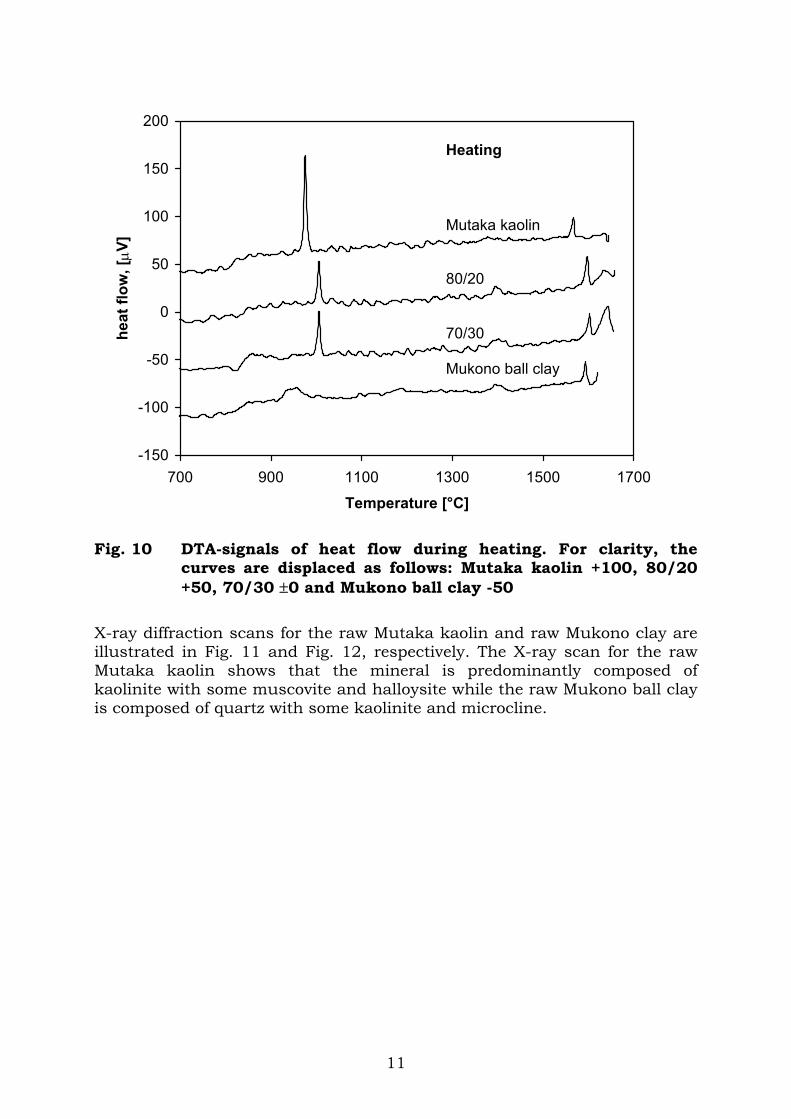
The DTA analyses, Fig. 10, show clear peaks at about 980ºC in the kaolinite rich samples. It is around this temperature that kaolinite transforms to metakaolinite and this does not happen in the Mukono ball clay because of the low kaolinite composition as shown by XRD scans. Similar studies have shown the transformation of kaolin to metakaolinite and mullite before melting [5-9].
11
-150
-100
-50
0
50
100
150
200
700 900 1100 1300 1500 1700
Temperature [°C]
heat
flow
, [µV
]
Heating
Mutaka kaolin
80/20
70/30
Mukono ball clay
Fig. 10 DTA-signals of heat flow during heating. For clarity, the
curves are displaced as follows: Mutaka kaolin +100, 80/20 +50, 70/30 ±0 and Mukono ball clay -50
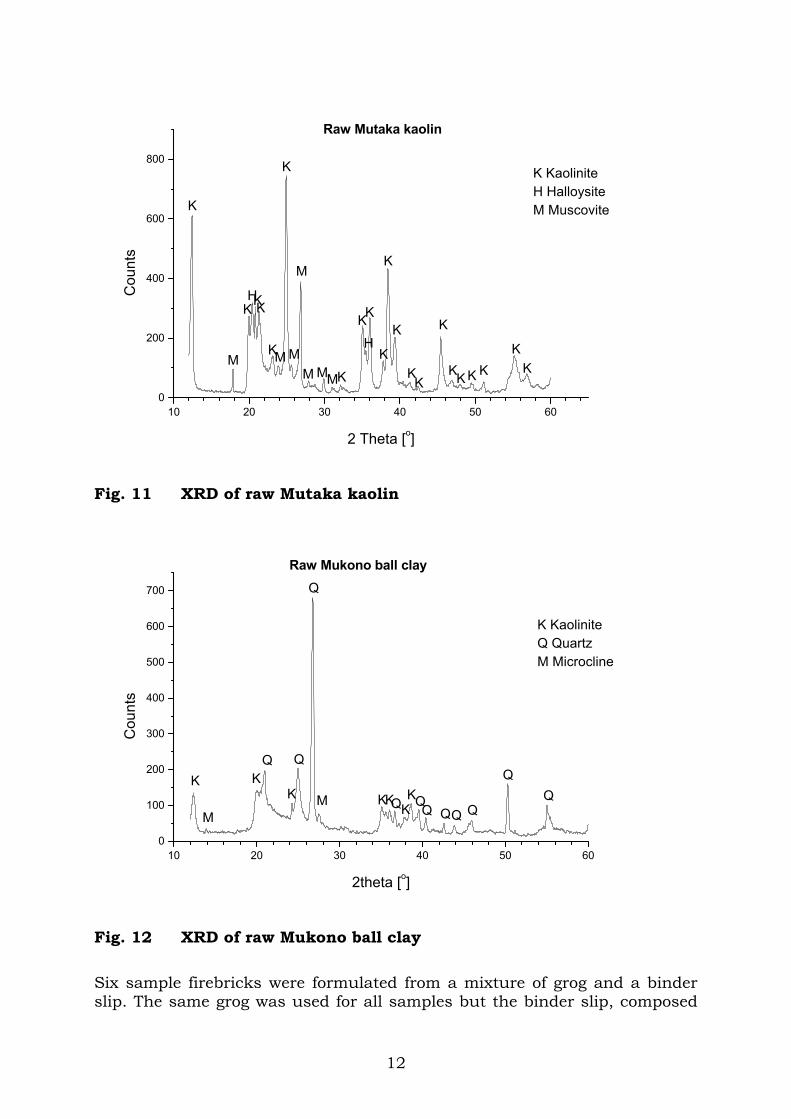
X-ray diffraction scans for the raw Mutaka kaolin and raw Mukono clay are illustrated in Fig. 11 and Fig. 12, respectively. The X-ray scan for the raw Mutaka kaolin shows that the mineral is predominantly composed of kaolinite with some muscovite and halloysite while the raw Mukono ball clay is composed of quartz with some kaolinite and microcline.
12
10 20 30 40 50 600
200
400
600
800K KaoliniteH HalloysiteM Muscovite
KK
KKKK
K
KK
K
K
K
K
H
K
KMMM
M
M
K
MK
KKH
K
M
K
Raw Mutaka kaolinC
ount
s
2 Theta [o]
Fig. 11 XRD of raw Mutaka kaolin
10 20 30 40 50 600
100
200
300
400
500
600
700
K KaoliniteQ QuartzM Microcline
QQQQQKKQKKM
Q
Q
K
QK
M
K
Raw Mukono ball clay
Cou
nts
2theta [o]
Fig. 12 XRD of raw Mukono ball clay Six sample firebricks were formulated from a mixture of grog and a binder slip. The same grog was used for all samples but the binder slip, composed
13
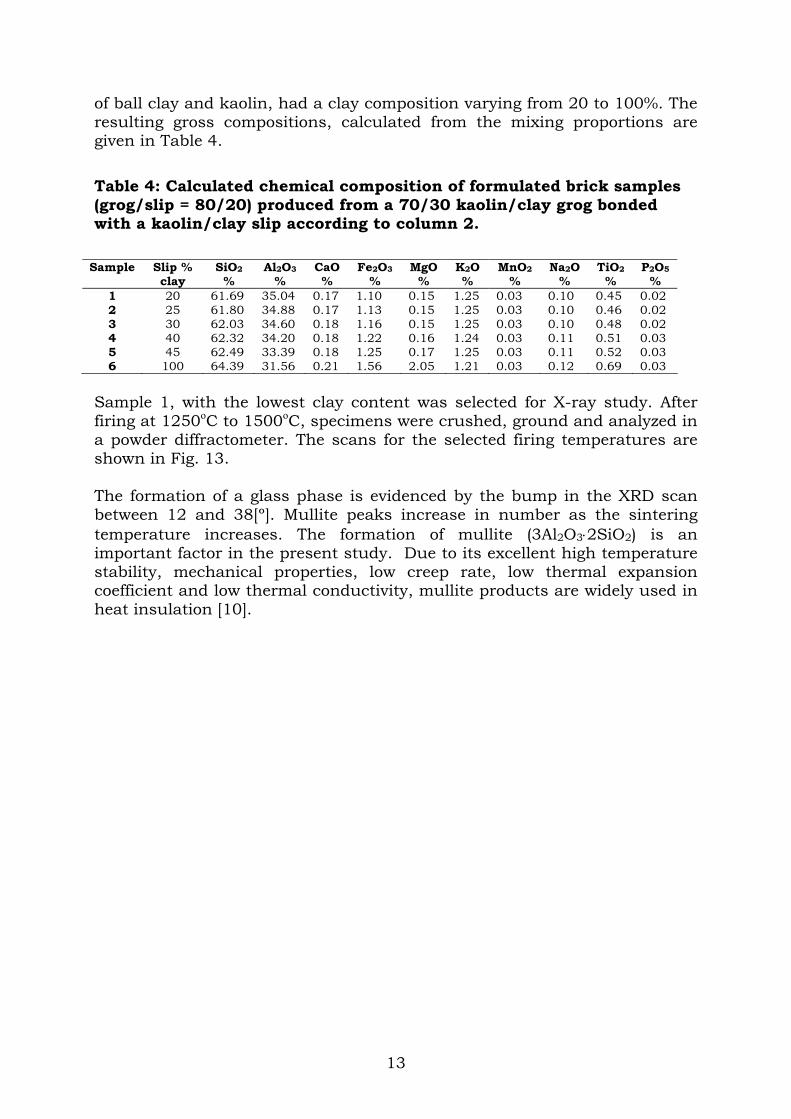
of ball clay and kaolin, had a clay composition varying from 20 to 100%. The resulting gross compositions, calculated from the mixing proportions are given in Table 4.
Table 4: Calculated chemical composition of formulated brick samples (grog/slip = 80/20) produced from a 70/30 kaolin/clay grog bonded with a kaolin/clay slip according to column 2.
Sample Slip % clay
SiO2 %
Al2O3 %
CaO %
Fe2O3 %
MgO %
K2O %
MnO2 %
Na2O %
TiO2 %
P2O5 %
1 20 61.69 35.04 0.17 1.10 0.15 1.25 0.03 0.10 0.45 0.02 2 25 61.80 34.88 0.17 1.13 0.15 1.25 0.03 0.10 0.46 0.02 3 30 62.03 34.60 0.18 1.16 0.15 1.25 0.03 0.10 0.48 0.02 4 40 62.32 34.20 0.18 1.22 0.16 1.24 0.03 0.11 0.51 0.03 5 45 62.49 33.39 0.18 1.25 0.17 1.25 0.03 0.11 0.52 0.03 6 100 64.39 31.56 0.21 1.56 2.05 1.21 0.03 0.12 0.69 0.03
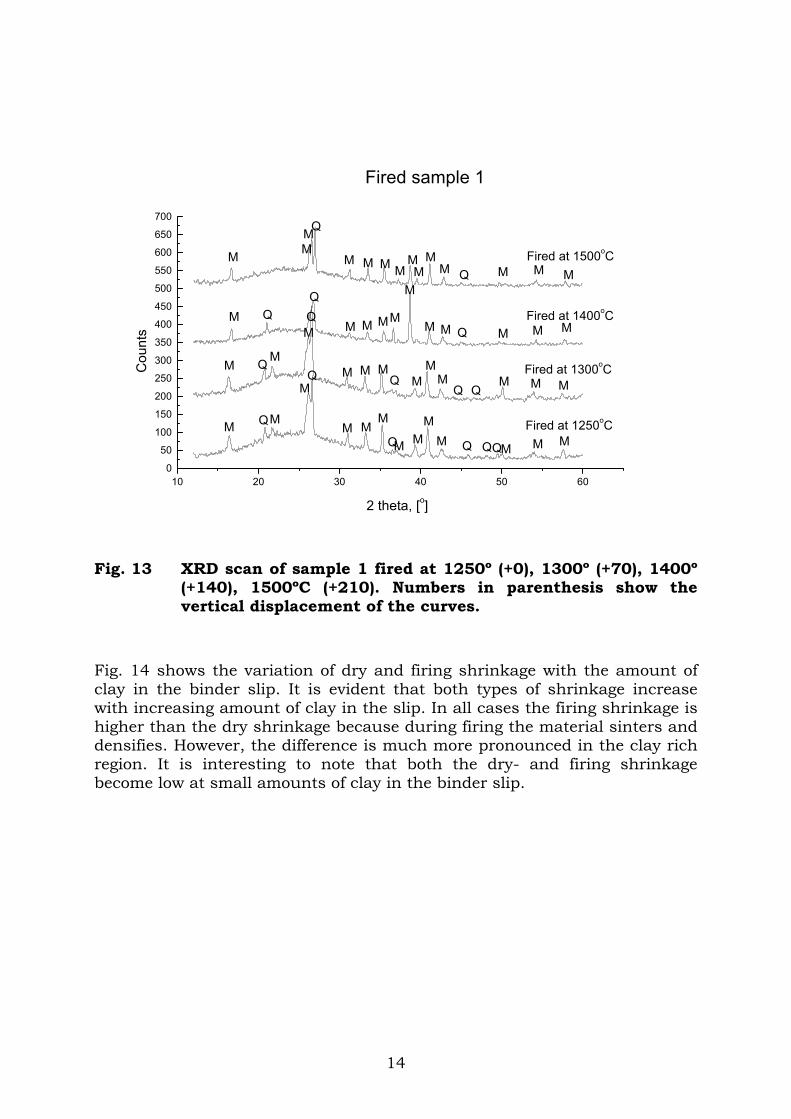
Sample 1, with the lowest clay content was selected for X-ray study. After firing at 1250oC to 1500oC, specimens were crushed, ground and analyzed in a powder diffractometer. The scans for the selected firing temperatures are shown in Fig. 13. The formation of a glass phase is evidenced by the bump in the XRD scan between 12 and 38[º]. Mullite peaks increase in number as the sintering temperature increases. The formation of mullite (3Al2O3⋅2SiO2) is an important factor in the present study. Due to its excellent high temperature stability, mechanical properties, low creep rate, low thermal expansion coefficient and low thermal conductivity, mullite products are widely used in heat insulation [10].
14
10 20 30 40 50 600
50
100
150
200
250
300
350
400
450
500
550
600
650
700
MMMMM Q
MMMM QM
MM
MMMM
MMMQ Q
M
M
MMMM
MMQ
MMM
QMM
QQM
Q
MQ
M
M
M
MQ M MQQMM
MMQ
MMM
QM
MQM
Fired at 1500oC
Fired at 1400oC
Fired at 1300oC
Fired at 1250oC
Fired sample 1
Cou
nts
2 theta, [o]
Fig. 13 XRD scan of sample 1 fired at 1250º (+0), 1300º (+70), 1400º
(+140), 1500ºC (+210). Numbers in parenthesis show the vertical displacement of the curves.
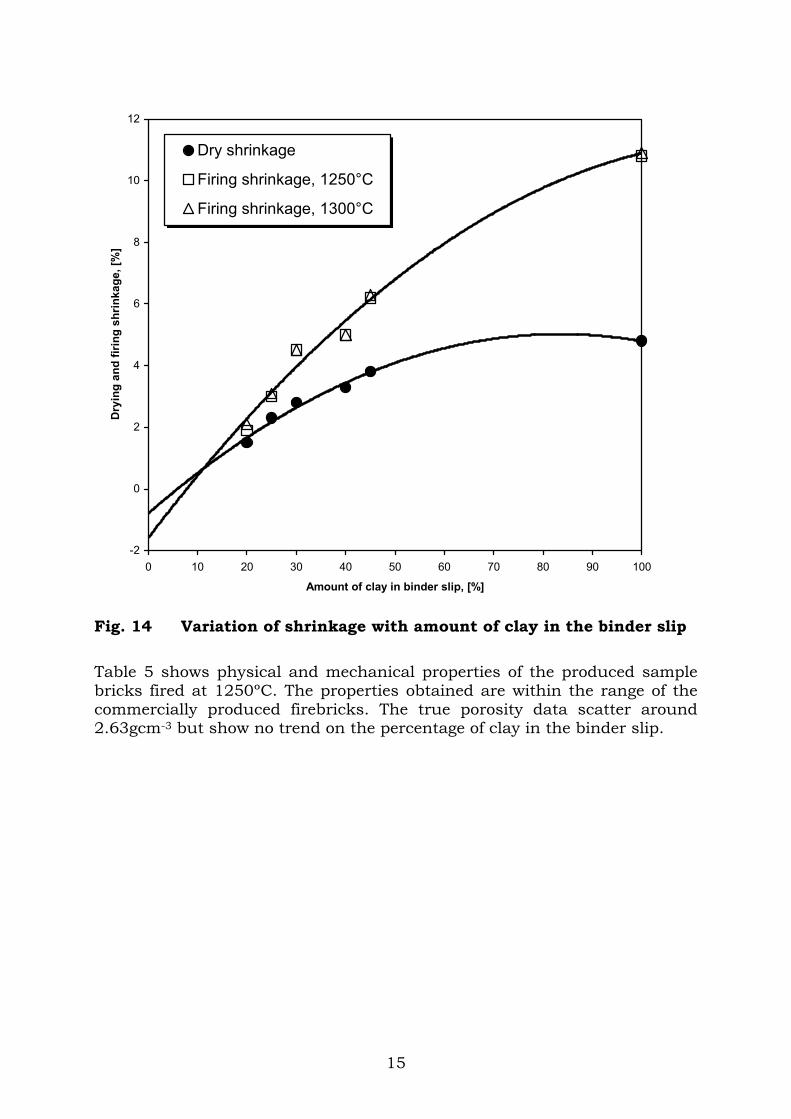
Fig. 14 shows the variation of dry and firing shrinkage with the amount of clay in the binder slip. It is evident that both types of shrinkage increase with increasing amount of clay in the slip. In all cases the firing shrinkage is higher than the dry shrinkage because during firing the material sinters and densifies. However, the difference is much more pronounced in the clay rich region. It is interesting to note that both the dry- and firing shrinkage become low at small amounts of clay in the binder slip.
15
-2
0
2
4
6
8
10
12
0 10 20 30 40 50 60 70 80 90 100
Amount of clay in binder slip, [%]
Dry
ing
and
firin
g sh
rinka
ge, [
%]
Dry shrinkage
Firing shrinkage, 1250°C
Firing shrinkage, 1300°C
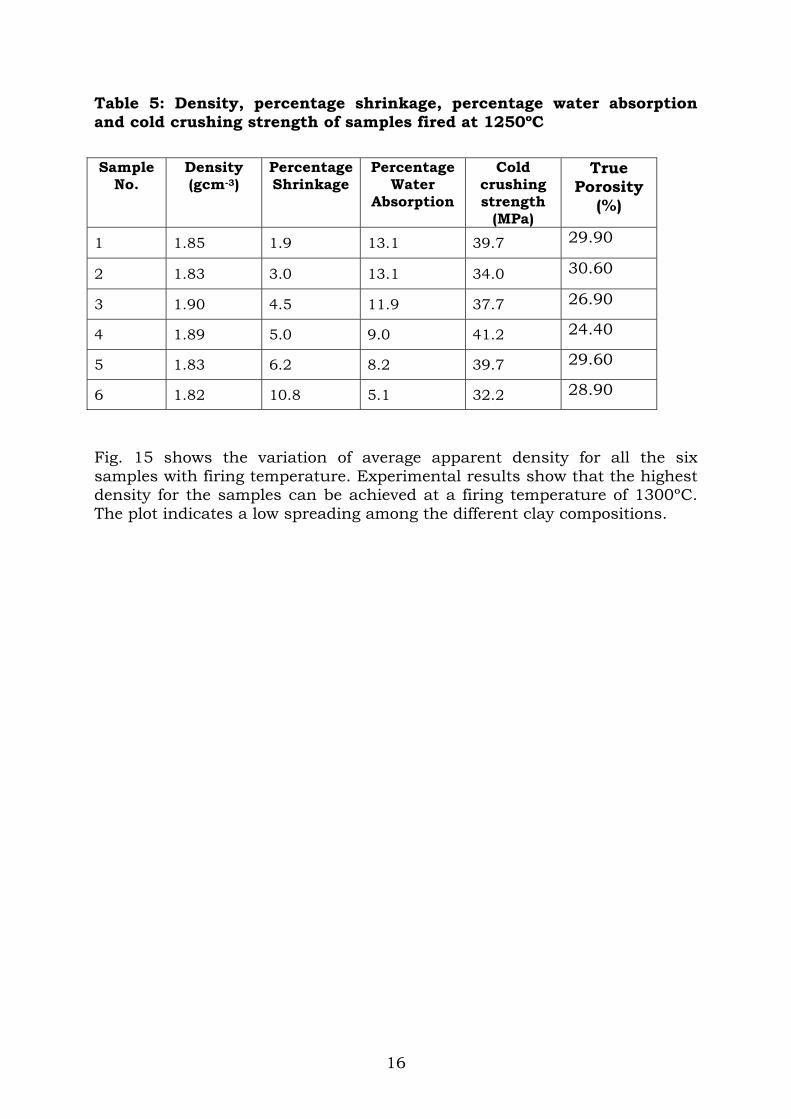
Fig. 14 Variation of shrinkage with amount of clay in the binder slip Table 5 shows physical and mechanical properties of the produced sample bricks fired at 1250ºC. The properties obtained are within the range of the commercially produced firebricks. The true porosity data scatter around 2.63gcm-3 but show no trend on the percentage of clay in the binder slip.
16
Table 5: Density, percentage shrinkage, percentage water absorption and cold crushing strength of samples fired at 1250ºC Sample
No. Density (gcm-3)
Percentage Shrinkage
Percentage Water
Absorption
Cold crushing strength
(MPa)
True Porosity
(%)
1 1.85 1.9 13.1 39.7 29.90
2 1.83 3.0 13.1 34.0 30.60
3 1.90 4.5 11.9 37.7 26.90
4 1.89 5.0 9.0 41.2 24.40
5 1.83 6.2 8.2 39.7 29.60
6 1.82 10.8 5.1 32.2 28.90
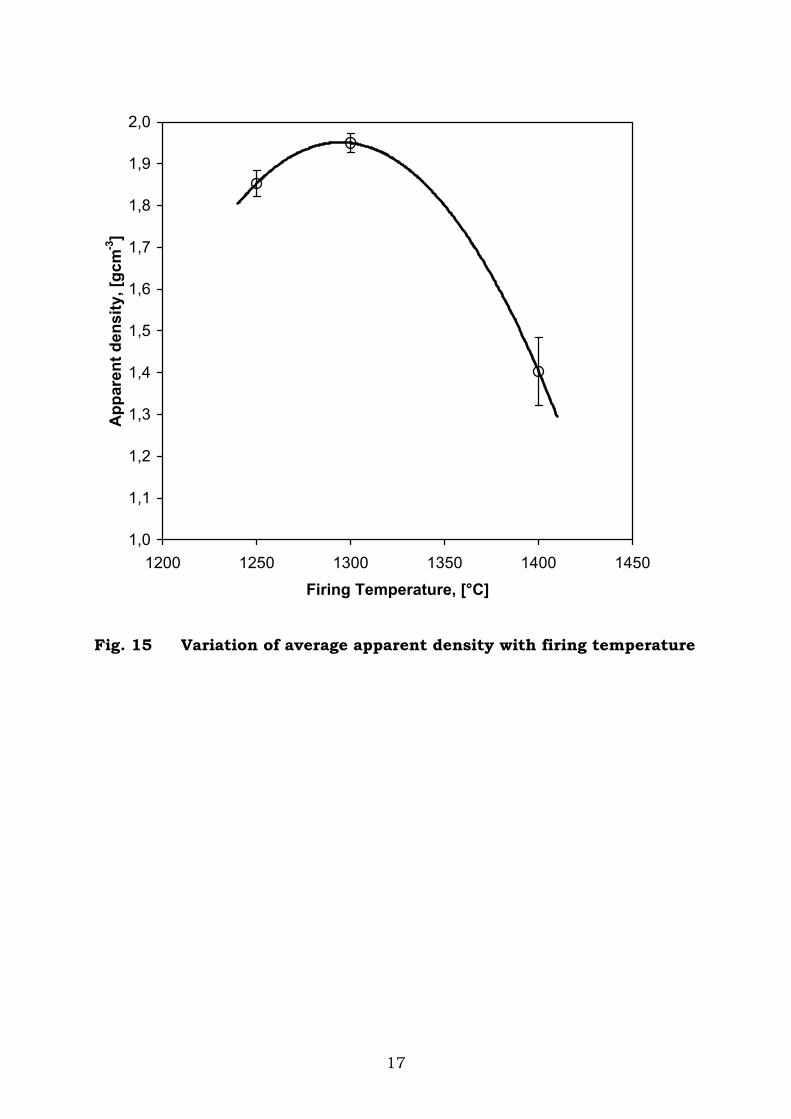
Fig. 15 shows the variation of average apparent density for all the six samples with firing temperature. Experimental results show that the highest density for the samples can be achieved at a firing temperature of 1300ºC. The plot indicates a low spreading among the different clay compositions.
17
1,0
1,1
1,2
1,3
1,4
1,5
1,6
1,7
1,8
1,9
2,0
1200 1250 1300 1350 1400 1450
Firing Temperature, [°C]
App
aren
t den
sity
, [gc
m-3
]
Fig. 15 Variation of average apparent density with firing temperature
18
4. Conclusions For understanding a ceramic material it is very crucial to characterize the mineral powders. In the present work powder characterization reveals that the Mutaka and Mutundwe minerals are highly kaolinitic and have a similar morphology of highly layered structures with pseudo-hexagonal crystals. This is common to kaolinitic crystals [2-4]. On the other hand, Mukono ball clay has high quartz content and is less layered. The kaolin minerals quality compares favourably with kaolins marketed in Europe. Processing of the minerals reduces the alumina content and increases that of silica. Processing also alters the morphology of the minerals, the kaolins layers are disoriented causing a reduction in density, particle size diameter and surface area. With the exception of surface area, the opposite happens for the Mukono ball clay due to possible agglomeration of particles on processing the raw mineral. Characterization of the mineral powders indicates their suitability for manufacture of firebricks. Formation of mullite, which is a principal compound for aluminous refractories, is evidenced in the powders with DTA tests and for the fired samples with XRD, the samples fired (1250ºC, 1300ºC, 1400ºC, 1500ºC) are dominated by mullite peaks. From the formulated sample bricks, made from the raw minerals, Mutaka kaolin and Mukono ball clay, physical and mechanical property tests results compare with those of similar commercial firebricks. Kaolin from Mutundwe has not been used in formulation of samples because currently the deposit has been depleted, hence no prospects for its exploitation.
5. Suggestions of future work A lot has been done so far, but the following work is suggested to be carried out on sintered brick samples:
• Measurement of thermal conductivity • Measurement of creep under load. • Investigate the microstructure of sintered samples using polarized
light. • Manufacturing full size bricks and testing them in industrial
environments.
19
Acknowledgements It is my pleasure to use this opportunity to express my sincere gratitude for the support, encouragement, friendship and hospitality accorded to me from individuals, institutions and organizations whose interventions have helped me accomplish this thesis. First and foremost I would like to appreciate the financial support from the Sida/SAREC- Makerere University Research Collaborative Programme under the theme, Technological Developments of the Lake Victoria Region for sponsoring all the research activities. Secondly, to my supervisor Associate Professor Stefan Jonsson, Head of Mechanical Metallurgy, Department of Materials Science and Engineering, Royal Institute of Technology (KTH), Sweden, for the guidance, friendship and relentless support. It is a privilege that I have benefited a lot from his hospitality and his responsibility to expose to various research and experimental techniques. To my co-supervisor Dr. Joseph Kadoma Byaruhanga, Senior Lecturer, Department of Mechanical Engineering, Makerere University for his academic ceaseless guidance, encouragement and career mentorship. He is like a parent constantly guiding me through sometimes troublesome processes to accomplish different tasks. It is also my pleasure to thank Prof. Mohammed Mamoun, Mohammet Taporuk and Kim Do-Kyung, Materials Chemistry, Department of Materials Science and Engineering, Royal Institute of Technology (KTH), Sweden, for all the assistance they have always rendered to me more especially in the characterization of the mineral powders. Special appreciation to the Sida/SAREC-Makerere University Research Collaborative Programme Coordinators at the Faculty of Technology, and at the School of Postgraduate Studies, Makerere University, Kampala, Uganda. The head the Mechanical Engineering department, the Dean, Faculty of Technology, Makerere University, Kampala, Uganda, the Department of Geological Survey and mines, Entebbe, Uganda, and the Ceramics Department at Uganda Industrial Research Institute (UIRI), Nakawa-Kampala. Maggie- my patient wife, my inspiration, and Daphine, Daisy and Diana-my children, -I owe them more than words can say. Am beholden to all my friends for always having an extra time left when I needed it, thank you!
20
References [1] Nyakairu, G.W.A., Koeberl, C. and Kurzweil, H. (2001). “The
Buwambo Kaolin deposit in Central Uganda: Mineralogical composition”. Geothermal Journal, 35, 245-256.
[2] Ligas, P., Uras, I., Dondi, M., and Marsigli, M. (1997).“Kaolinitic
materials from Romana (North-west Sardinia, Italy) and their ceramic properties”. Applied Clay Science, 12, pp 145-163.
[3] Murry, H.H. (2000). “Traditional and new application for kaolin,
smectite, and palygorskite: a general review”. Applied Clay Science 17 207-221.
[4] Ekosse, G. (2000). “The Makoro kaolin deposit, Southern
Botswana: Its genesis and possible industrial applications”, Applied Clay Science, 16, pp 301-320.
[5] Chen C.Y., Lan, G.S., and Tuan, W.H. (2000). “Microstructural evolution of mullite during the sintering of kaolin powder compacts”. Ceramics International 26, pp 715-720.
[6] Castelein, O., Soulestin, B., Bonnet, J.P., and Blanchart, P.
(2001). “The influence of heating rate on the behavior and mullite formation from a kaolin raw material”. Ceramics International, 27, pp 517-522.
[7] Sonuparlak, B., Sarikaya, M., and Aksay, I. (1987). “Spinel
phase formation during 980oC exothermic reaction in the Kaolinite-to-mullite reaction series.” J. Am. Ceram. Soc. 70, pp 837-842.
[8] Pask, J.A. (1988). “Phase Equilibria in the Al2O3.2SiO2 system
with emphasis on mullite”. Ceramic developments–Edited by C.C. Sorrell and B. Ben-Nissan. Materials Science Forum Volumes 34-36 (1988). Pp. 1-8. Trans Tech Publications Ltd., Switzerland.
[9] Schneider, H., Okada, K. and Pask J. (1994). “Mullite and
mullite ceramics”. John Wiley & Sons. [10] Chen, C.Y., and Tuan, W.H. (2001). “The processing of kaolin
powder compact”. Ceramics International, 27 pp 795-800.

21
APPENDIX: PAPERS (I-III)