Embed Size (px)
Citation preview

Chapters 6&7
Introduction to Macroeconomics
McGraw-Hill/Irwin v
Economic Performance?
• How much “stuff” did our economy produce this year?– How do you add electricity+grapes+doctor’s
visits+toothpaste+shoelaces+movies+….?
Economic Performance?
• How much “stuff” did our economy produce this year?– How do you add electricity+grapes+doctor’s
visits+toothpaste+shoelaces+movies+….?– What do they all have in common?
Economic Performance?
• How much “stuff” did our economy produce this year?– How do you add electricity+grapes+doctor’s
visits+toothpaste+shoelaces+movies+….?– What do they all have in common?– They can be bought/sold for $
Economic Performance?
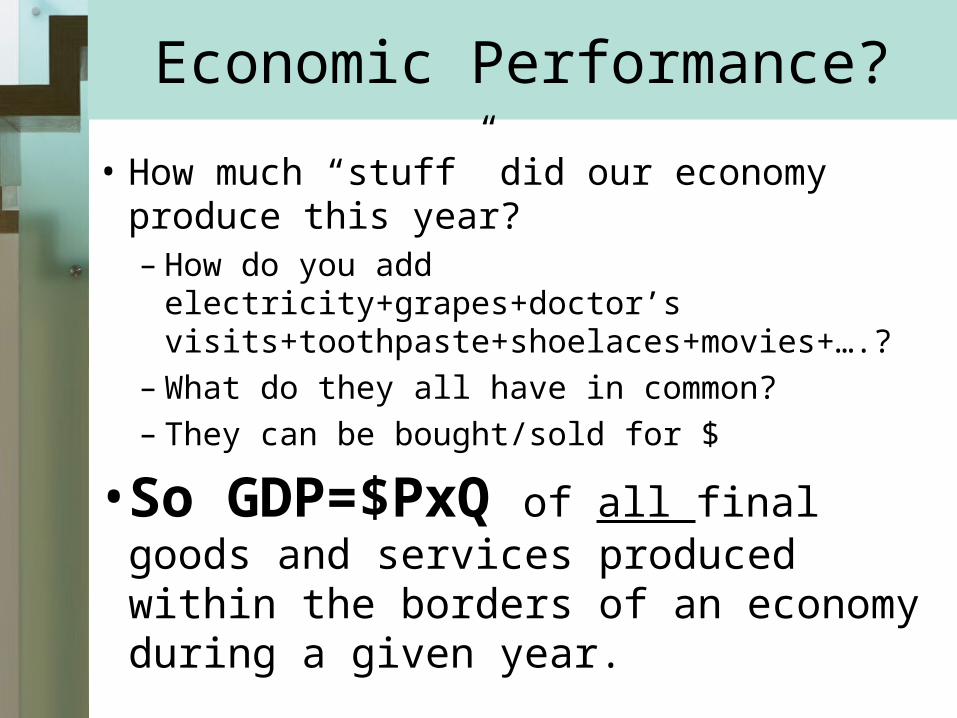
• How much “stuff” did our economy produce this year?– How do you add electricity+grapes+doctor’s
visits+toothpaste+shoelaces+movies+….?– What do they all have in common?– They can be bought/sold for $
• So GDP=$PxQ of all final goods and services produced within the borders of an economy during a given year.

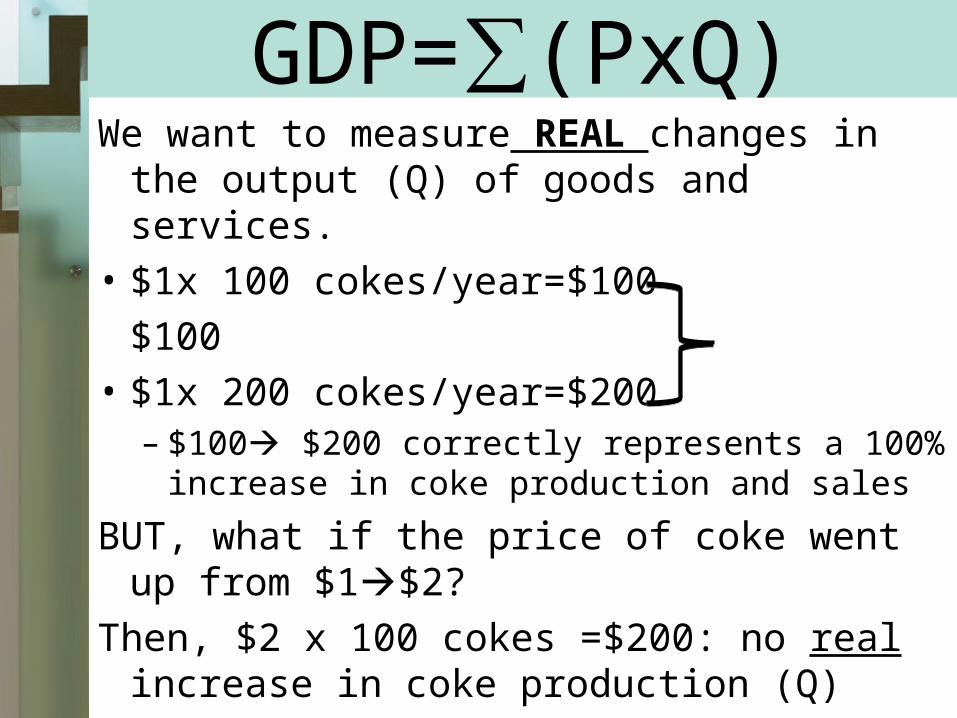
GDP=∑(PxQ)We want to measure REAL changes in the
output (Q) of goods and services.
• $1x 100 cokes/year=$100
$100
• $1x 200 cokes/year=$200– $100 $200 correctly represents a 100%
increase in coke production and sales
BUT, what if the price of coke went up from $1$2?
Then, $2 x 100 cokes =$200: no real increase in coke production (Q)
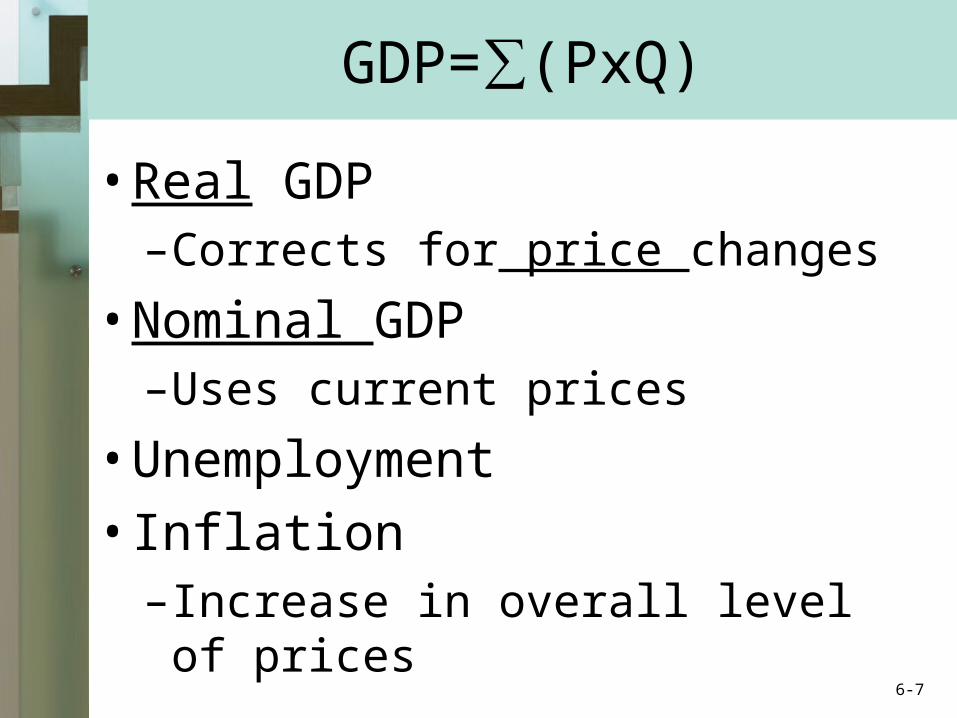
GDP=∑(PxQ)
• Real GDP–Corrects for price changes
• Nominal GDP–Uses current prices
• Unemployment
• Inflation –Increase in overall level of prices
6-7
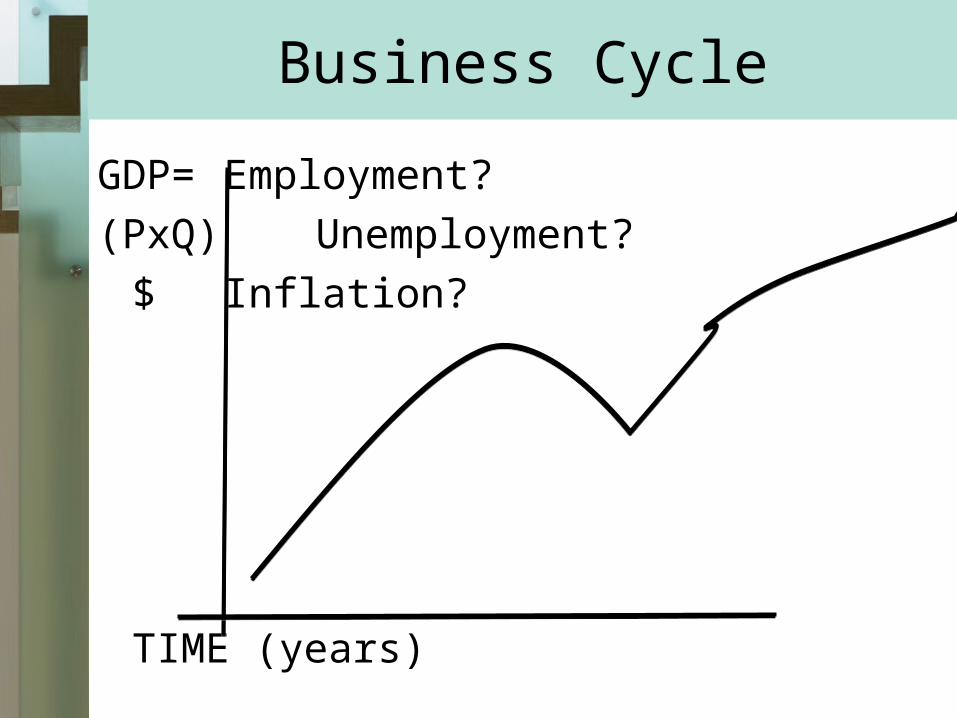
Business Cycle
GDP= Employment?
(PxQ) Unemployment?
$ Inflation?
TIME (years)
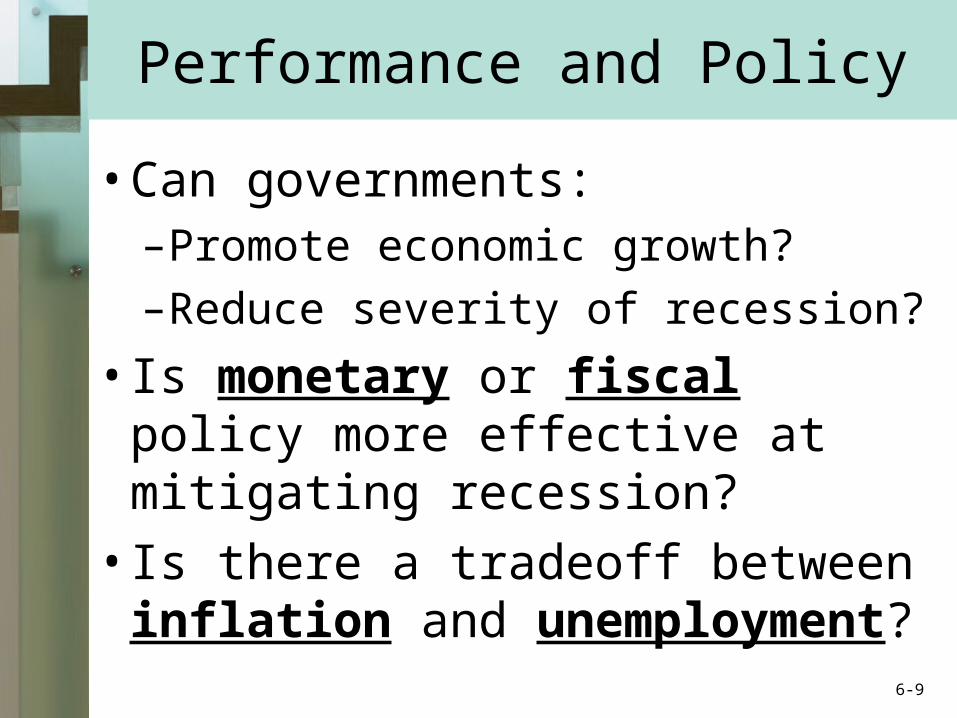
Performance and Policy
• Can governments:–Promote economic growth?
–Reduce severity of recession?
• Is monetary or fiscal policy more effective at mitigating recession?
• Is there a tradeoff between inflation and unemployment?
6-9
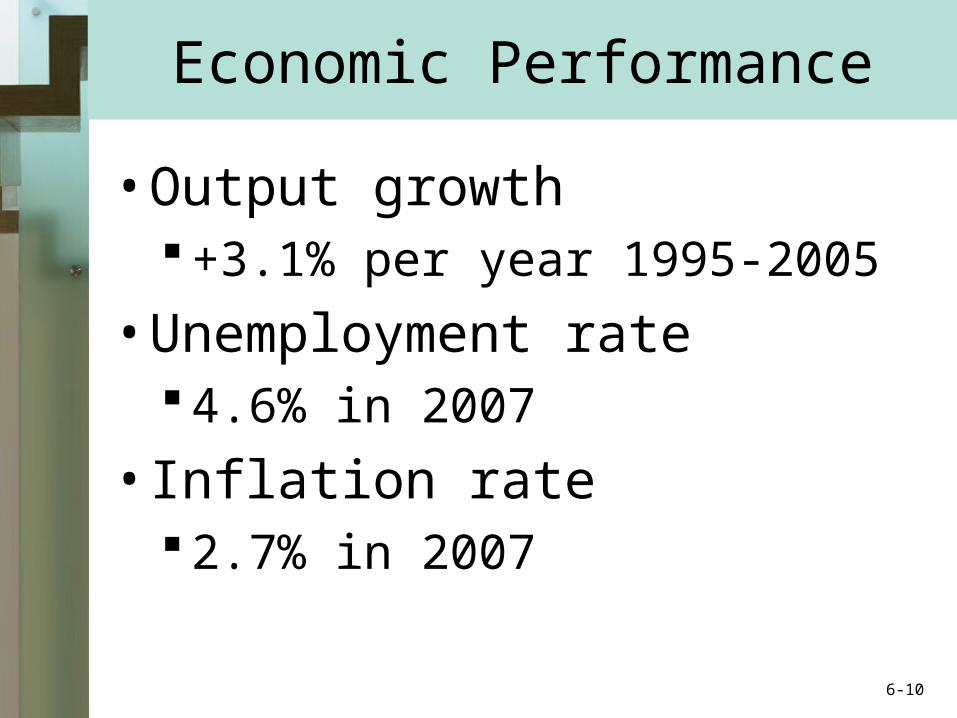
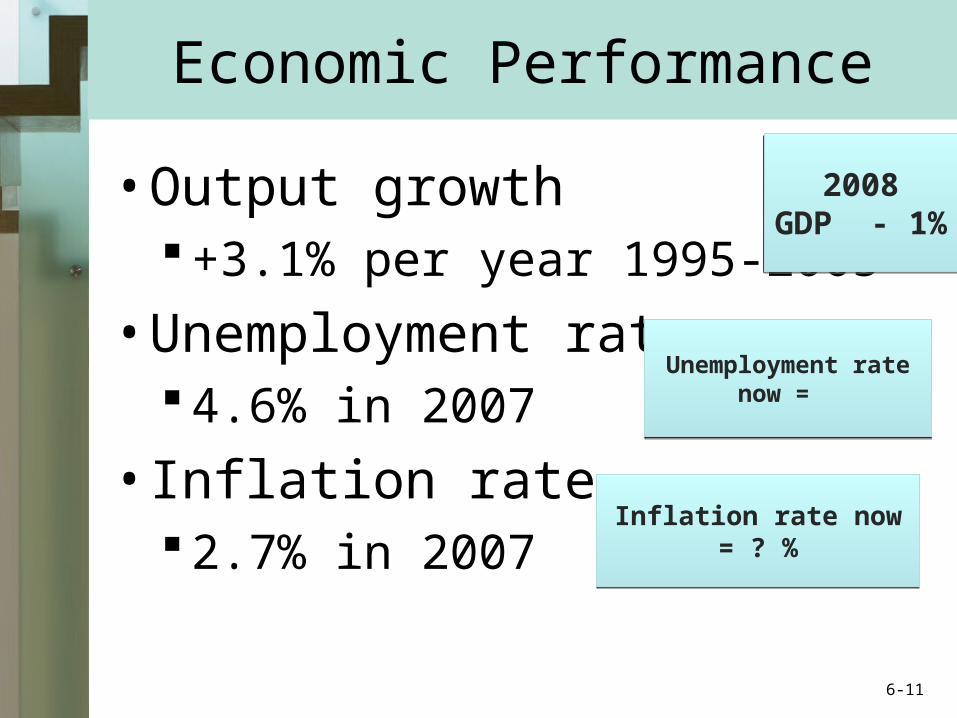
Economic Performance
• Output growth +3.1% per year 1995-2005
• Unemployment rate 4.6% in 2007
• Inflation rate 2.7% in 2007
6-10
Economic Performance
• Output growth +3.1% per year 1995-2005
• Unemployment rate 4.6% in 2007
• Inflation rate 2.7% in 2007
6-11
2008GDP - 1%
2008GDP - 1%
Unemployment rate now =
Unemployment rate now =
Inflation rate now = ? %Inflation rate now = ? %
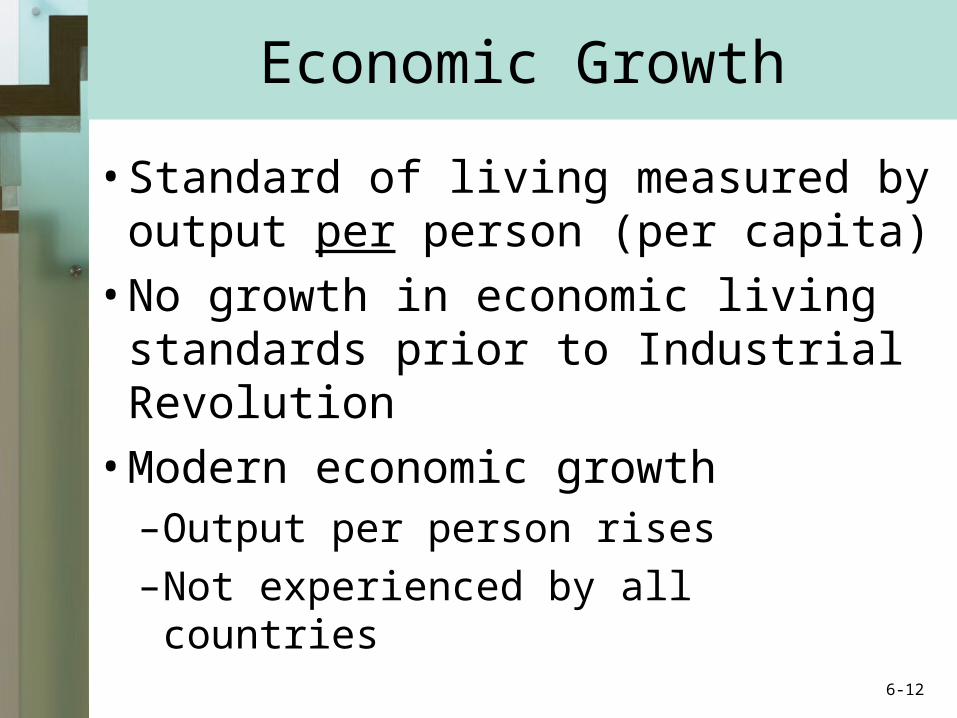
Economic Growth
• Standard of living measured by output per person (per capita)
• No growth in economic living standards prior to Industrial Revolution
• Modern economic growth–Output per person rises
–Not experienced by all countries 6-12
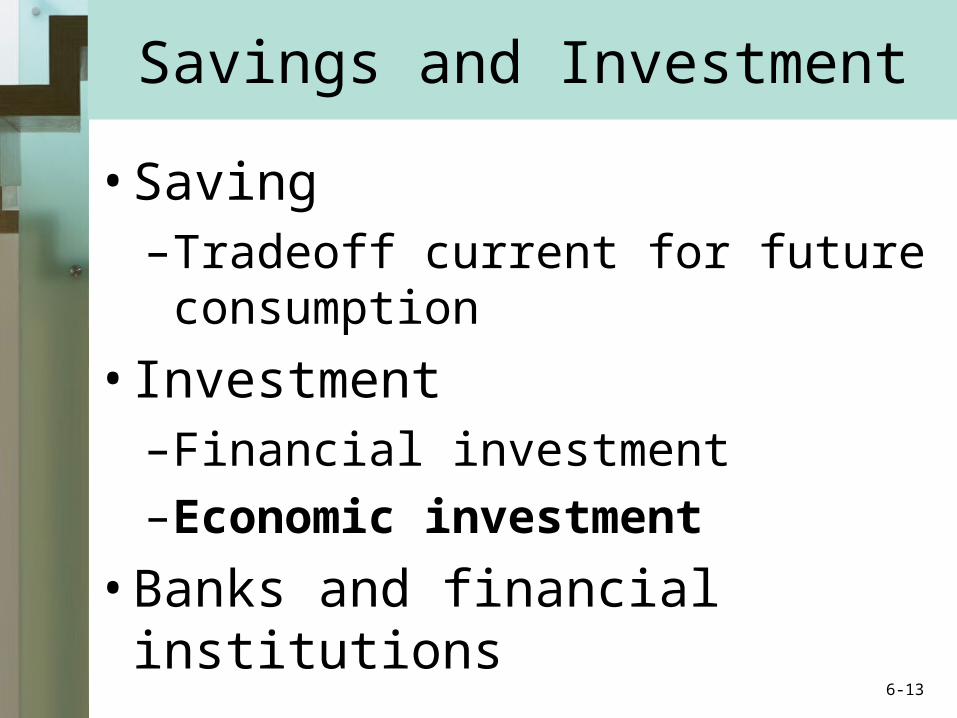
Savings and Investment
• Saving–Tradeoff current for future
consumption
• Investment–Financial investment
–Economic investment
• Banks and financial institutions6-13
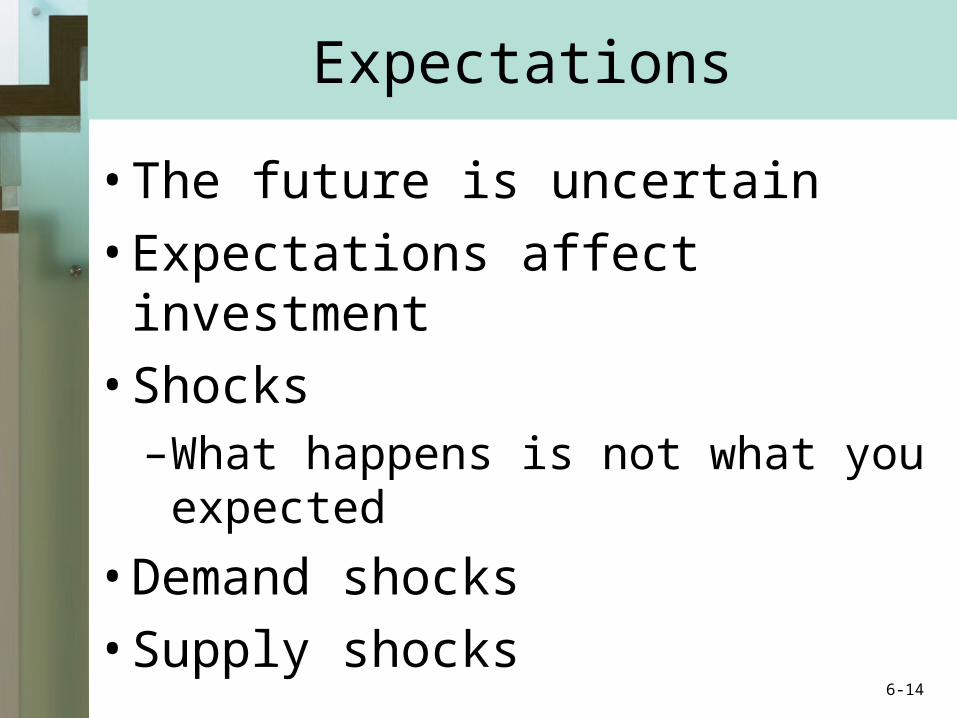
Expectations
• The future is uncertain
• Expectations affect investment
• Shocks –What happens is not what you
expected
• Demand shocks
• Supply shocks6-14
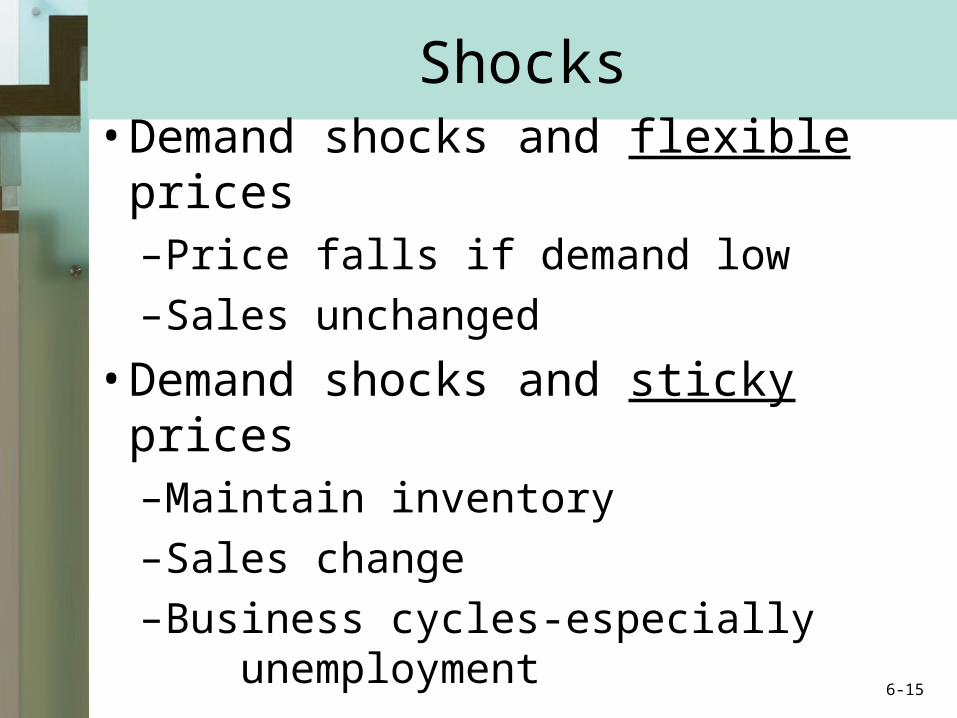
Shocks• Demand shocks and flexible prices
–Price falls if demand low–Sales unchanged
• Demand shocks and sticky prices–Maintain inventory–Sales change–Business cycles-especially
unemployment
6-15
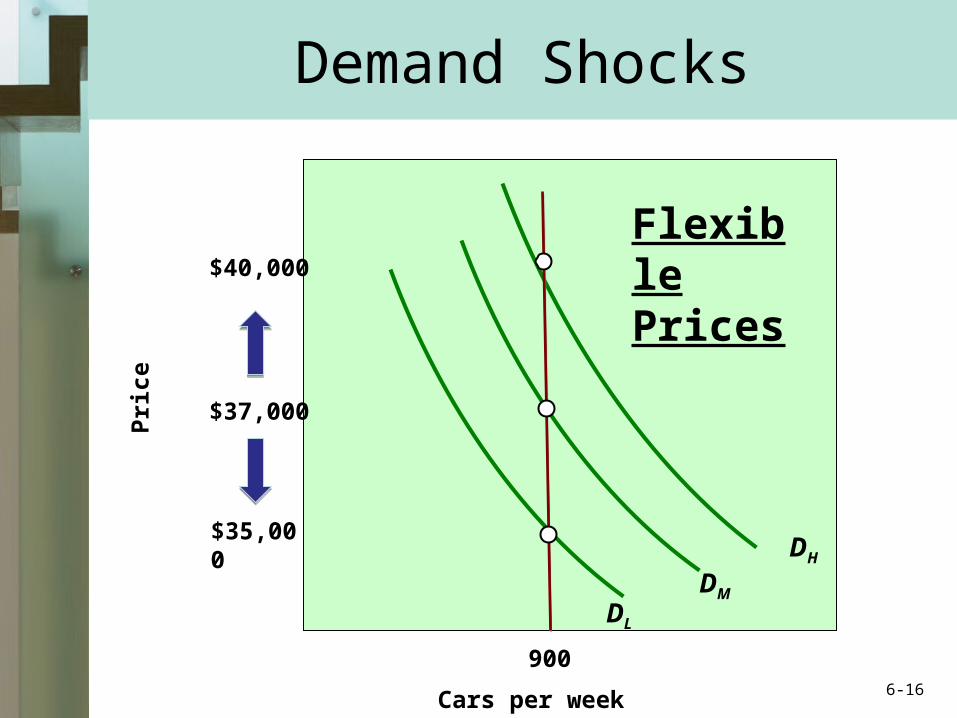
Demand Shocks
Cars per week
Pri
ce
DM
DL
DH
900
$40,000
$37,000
$35,000
Flexible Prices
6-16
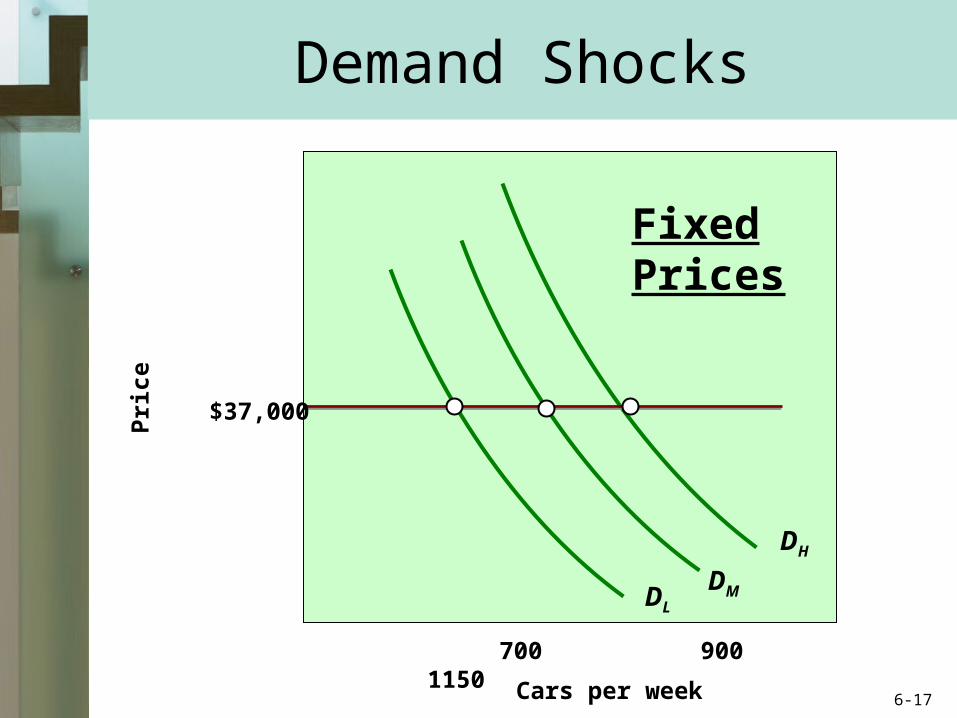
Demand Shocks
Cars per week
DMDL
DH
700 900 1150
$37,000
Fixed Prices
Pri
ce
6-17
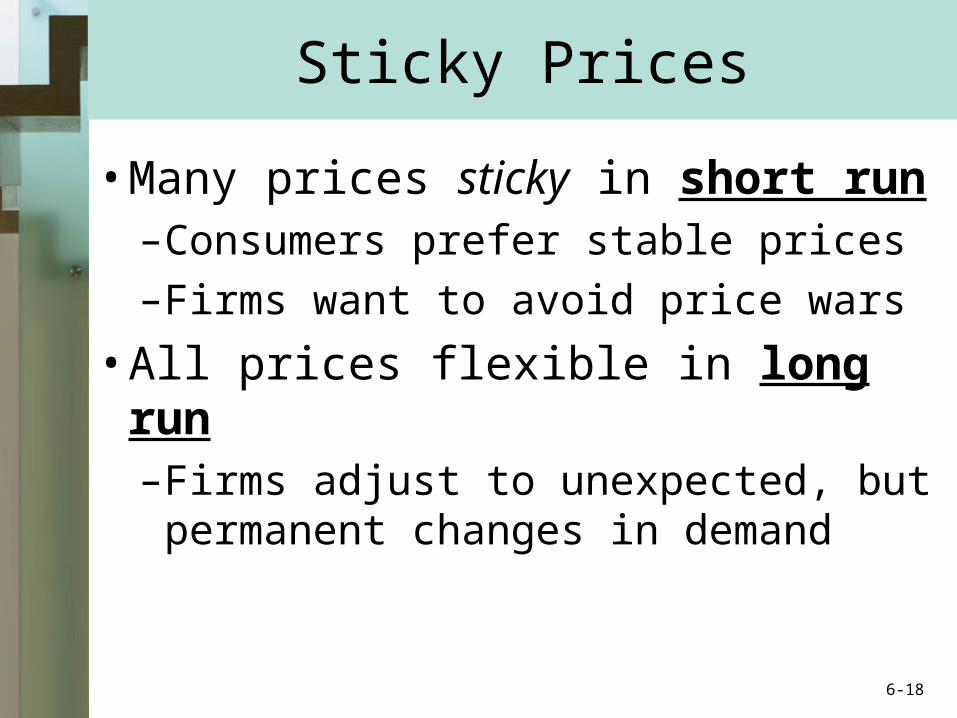
Sticky Prices
• Many prices sticky in short run–Consumers prefer stable prices
–Firms want to avoid price wars
• All prices flexible in long run–Firms adjust to unexpected, but
permanent changes in demand
6-18

Measuring Domestic Output and National Income
Chapter 7
McGraw-Hill/Irwin Copyright © 2009 by The McGraw-Hill Companies, Inc. All rights reserved.
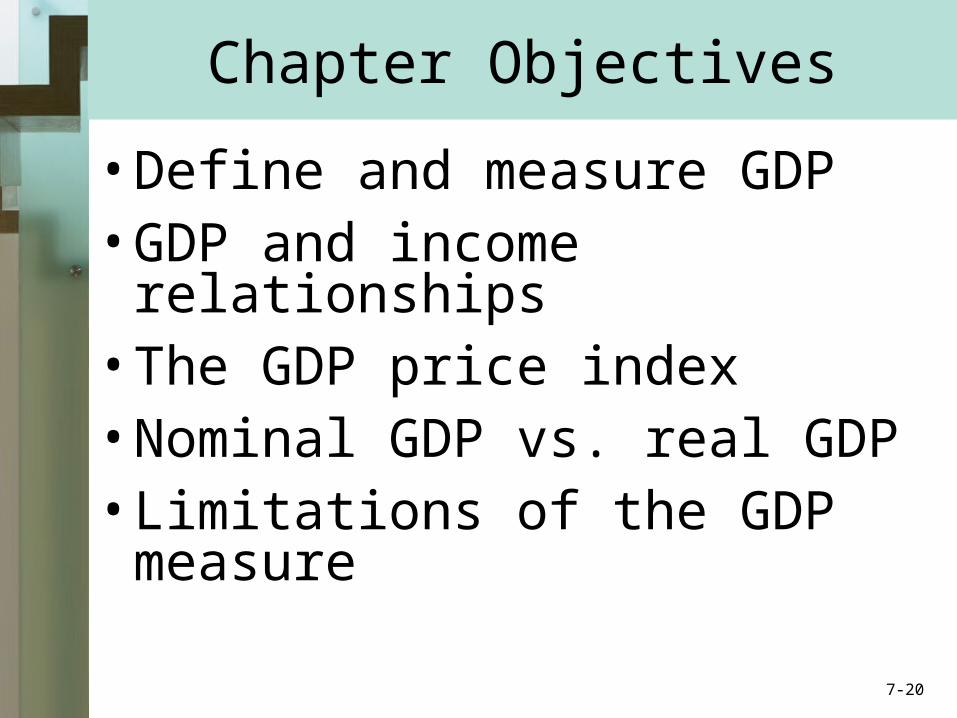
Chapter Objectives
• Define and measure GDP• GDP and income relationships• The GDP price index• Nominal GDP vs. real GDP• Limitations of the GDP measure
7-20
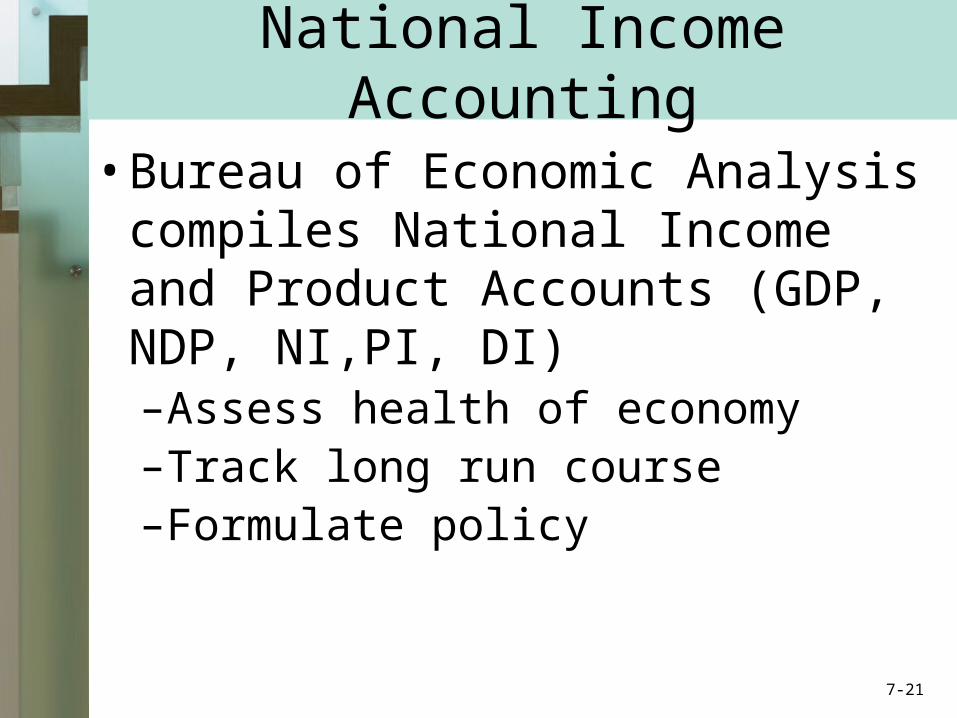
• Bureau of Economic Analysis compiles National Income and Product Accounts (GDP, NDP, NI,PI, DI)–Assess health of economy–Track long run course–Formulate policy
National Income Accounting
7-21
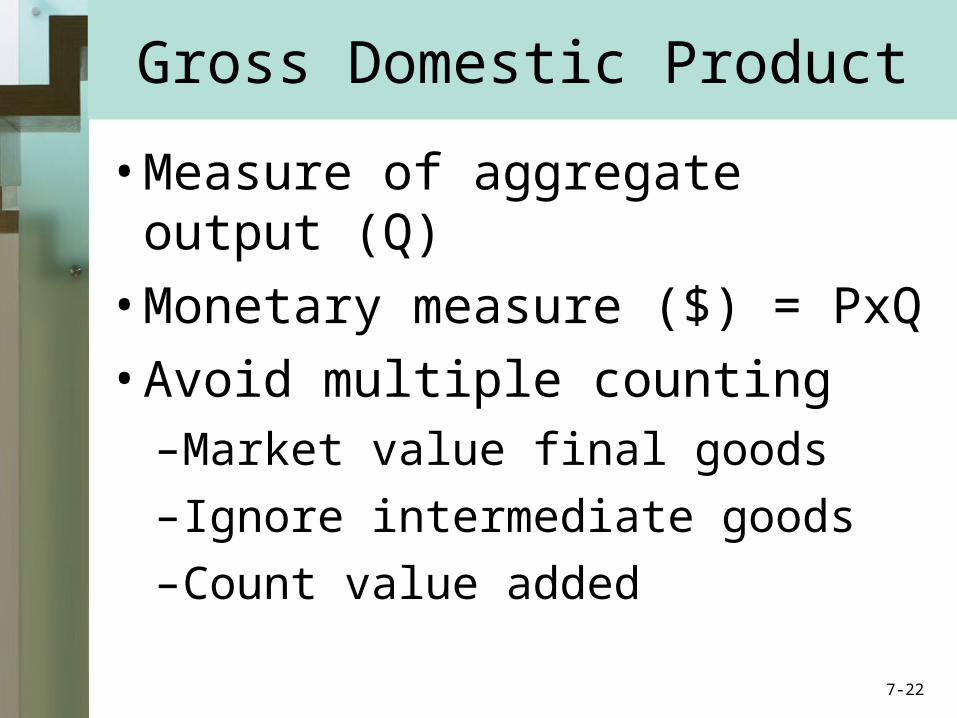
Gross Domestic Product
• Measure of aggregate output (Q)
• Monetary measure ($) = PxQ
• Avoid multiple counting–Market value final goods
–Ignore intermediate goods
–Count value added
7-22
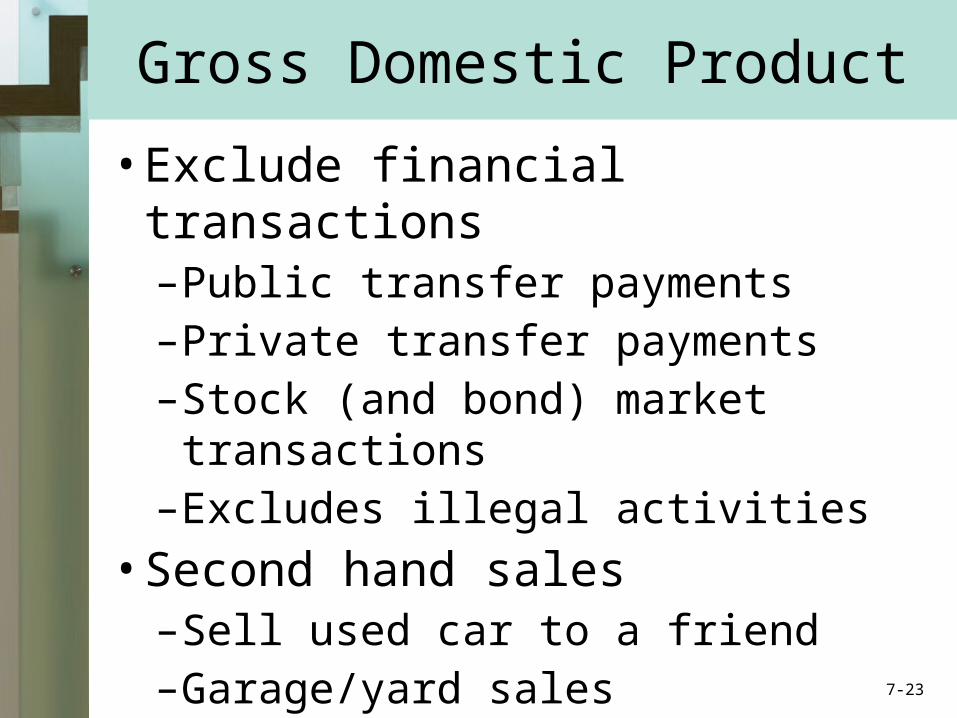
Gross Domestic Product
• Exclude financial transactions–Public transfer payments–Private transfer payments–Stock (and bond) market
transactions–Excludes illegal activities
• Second hand sales–Sell used car to a friend–Garage/yard sales 7-23
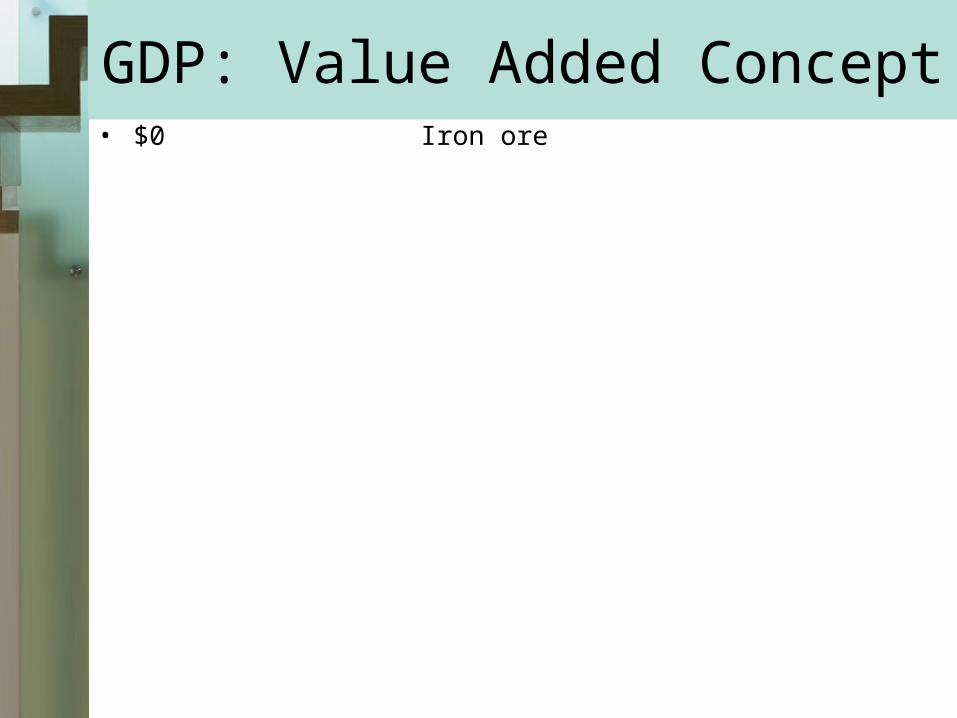
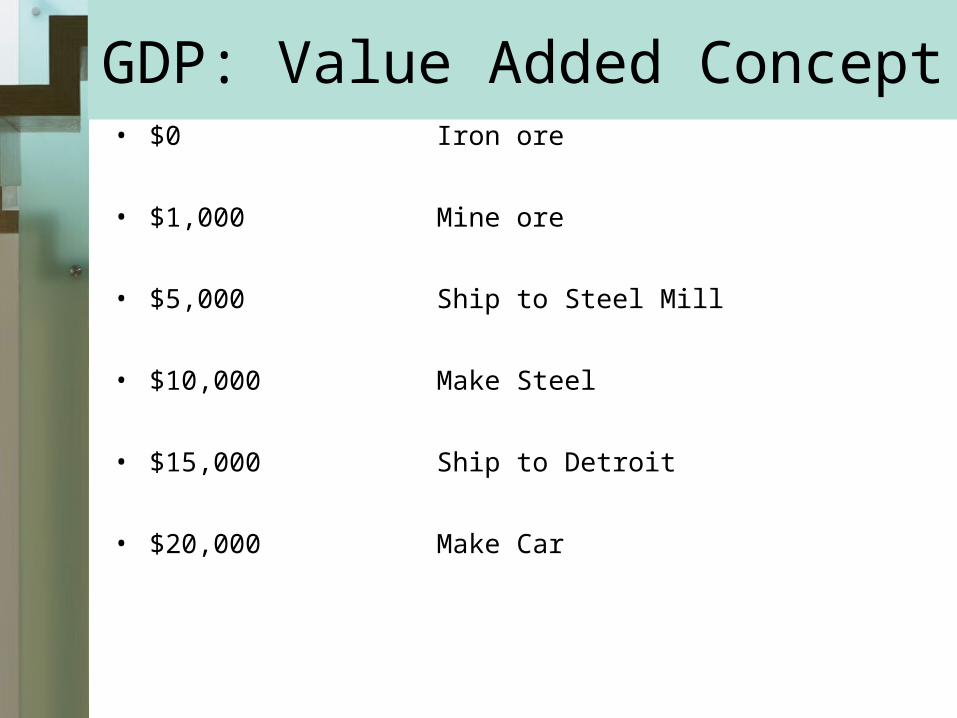
GDP: Value Added Concept• $0 Iron ore

GDP: Value Added Concept• $0 Iron ore
• $1,000 Mine ore
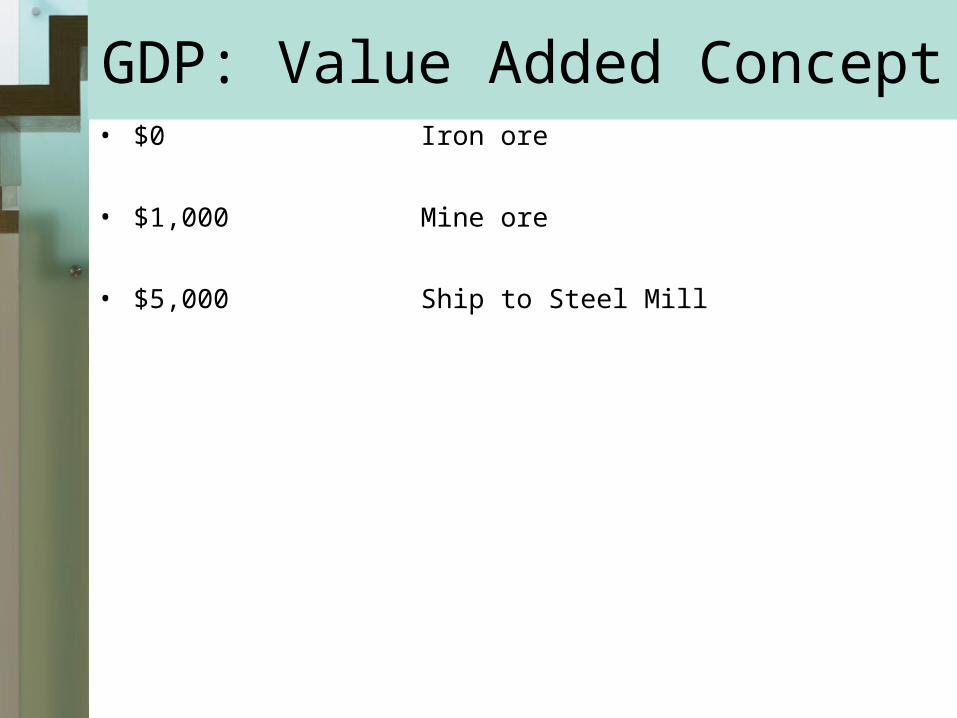
GDP: Value Added Concept• $0 Iron ore
• $1,000 Mine ore
• $5,000 Ship to Steel Mill
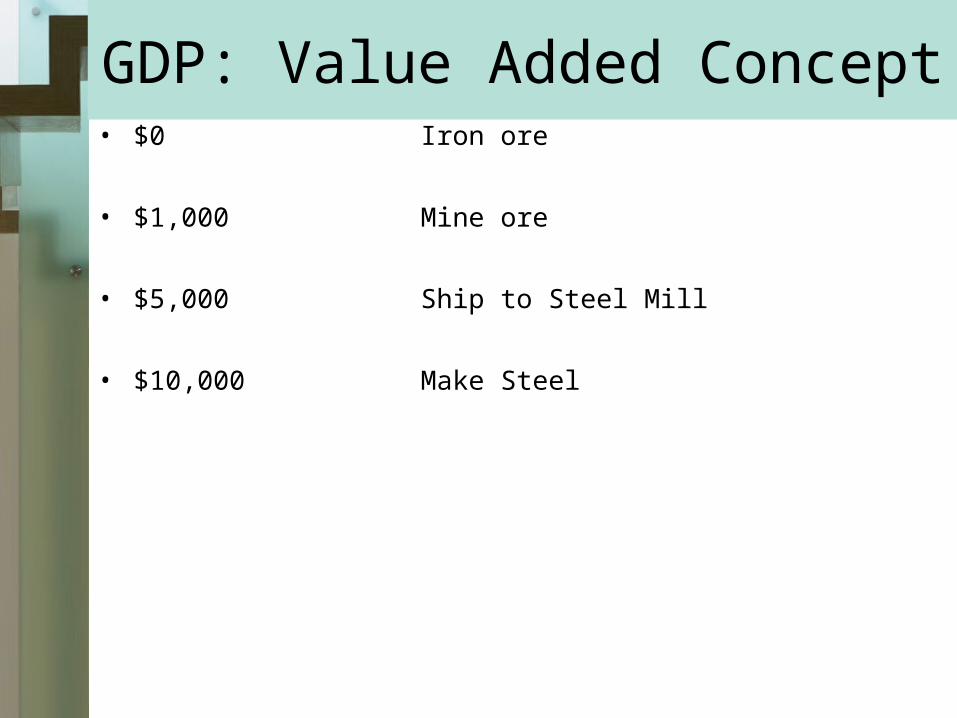
GDP: Value Added Concept• $0 Iron ore
• $1,000 Mine ore
• $5,000 Ship to Steel Mill
• $10,000 Make Steel
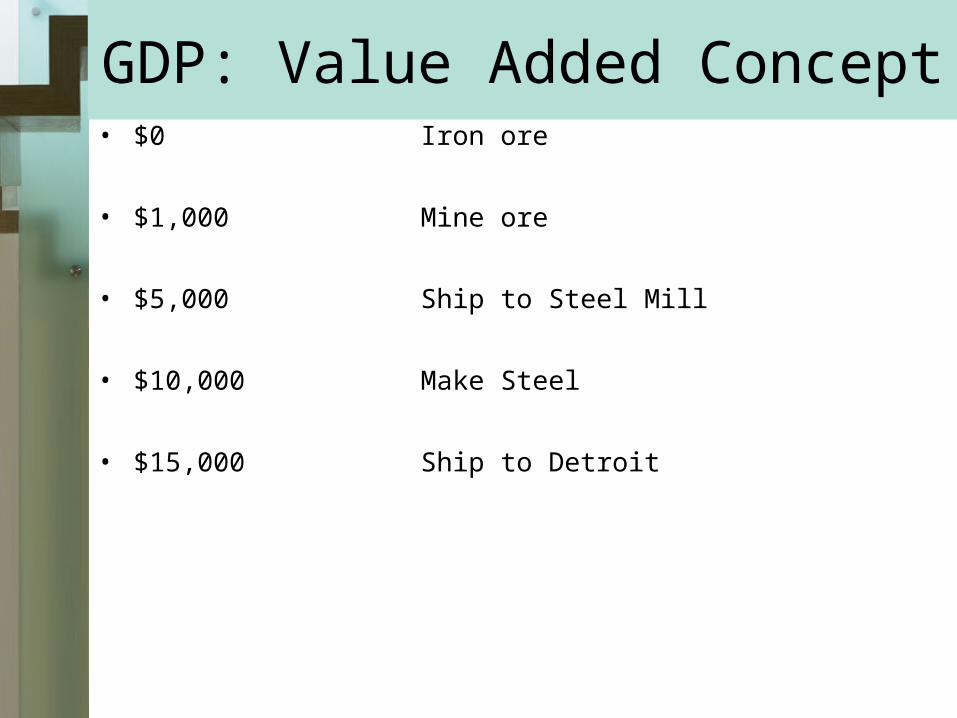
GDP: Value Added Concept• $0 Iron ore
• $1,000 Mine ore
• $5,000 Ship to Steel Mill
• $10,000 Make Steel
• $15,000 Ship to Detroit
GDP: Value Added Concept• $0 Iron ore
• $1,000 Mine ore
• $5,000 Ship to Steel Mill
• $10,000 Make Steel
• $15,000 Ship to Detroit
• $20,000 Make Car
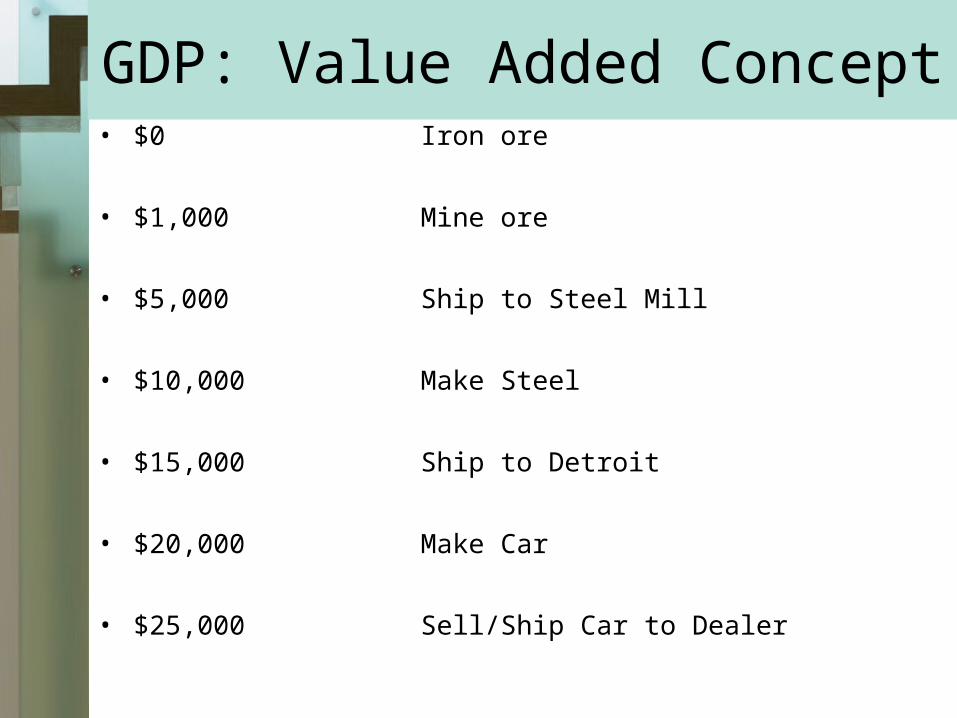
GDP: Value Added Concept• $0 Iron ore
• $1,000 Mine ore
• $5,000 Ship to Steel Mill
• $10,000 Make Steel
• $15,000 Ship to Detroit
• $20,000 Make Car
• $25,000 Sell/Ship Car to Dealer
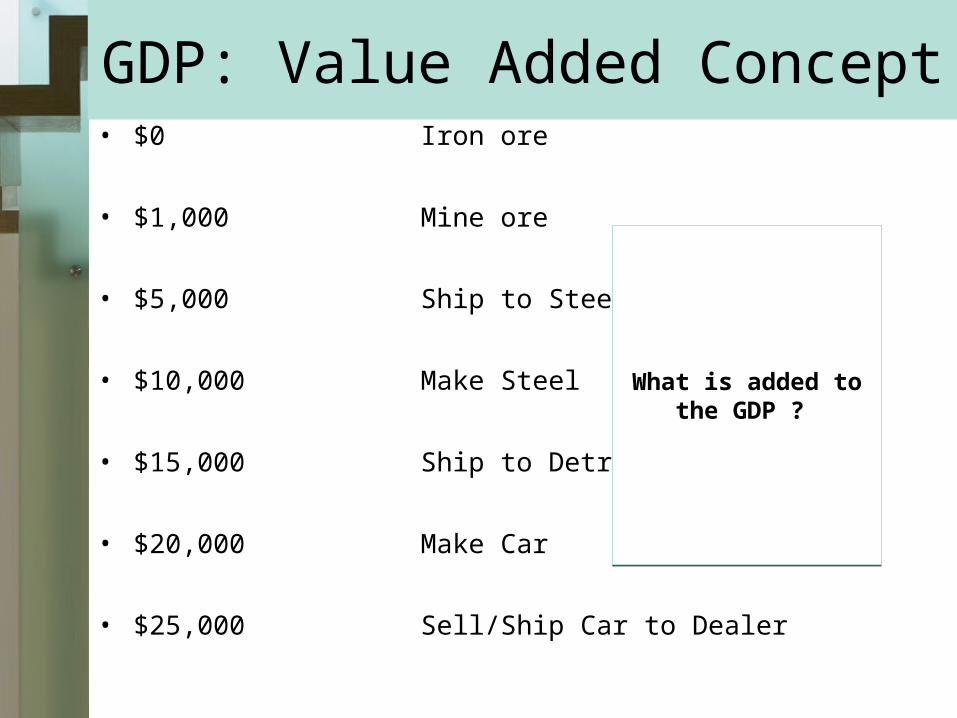
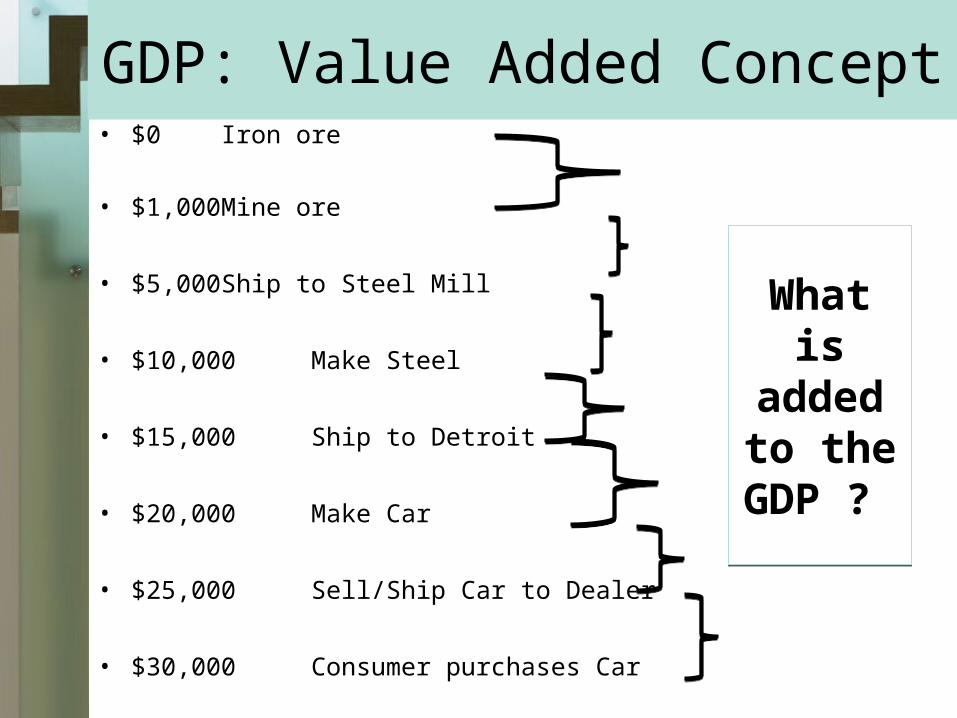
GDP: Value Added Concept• $0 Iron ore
• $1,000 Mine ore
• $5,000 Ship to Steel Mill
• $10,000 Make Steel
• $15,000 Ship to Detroit
• $20,000 Make Car
• $25,000 Sell/Ship Car to Dealer
What is added to the GDP ?
What is added to the GDP ?
GDP: Value Added Concept• $0 Iron ore
• $1,000 Mine ore
• $5,000 Ship to Steel Mill
• $10,000 Make Steel
• $15,000 Ship to Detroit
• $20,000 Make Car
• $25,000 Sell/Ship Car to Dealer
• $30,000 Consumer purchases Car
What is added to the
GDP ?
What is added to the
GDP ?
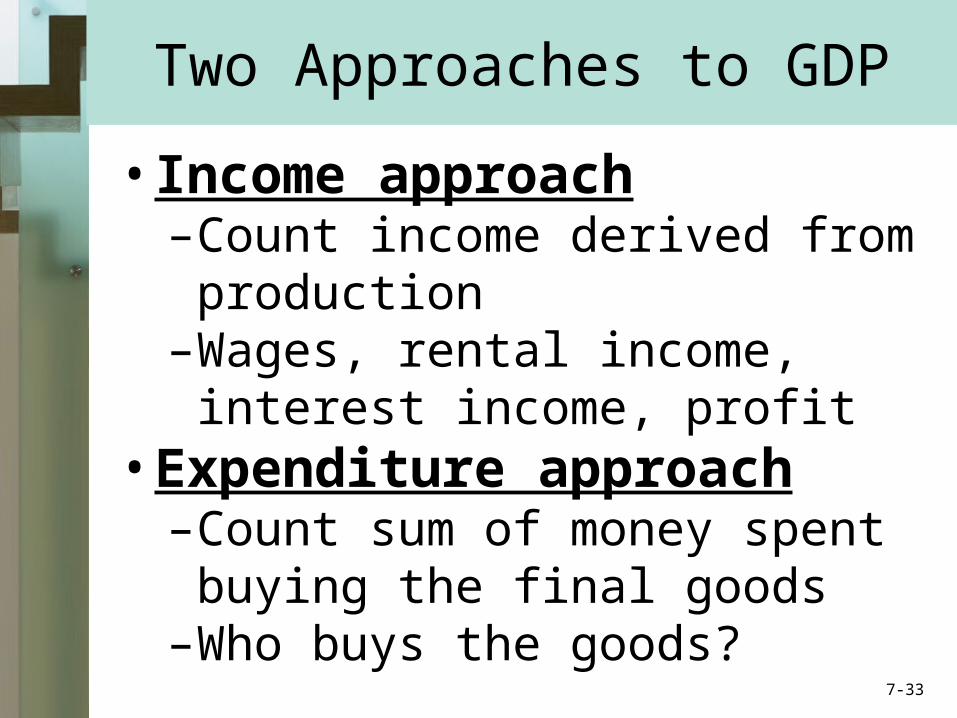
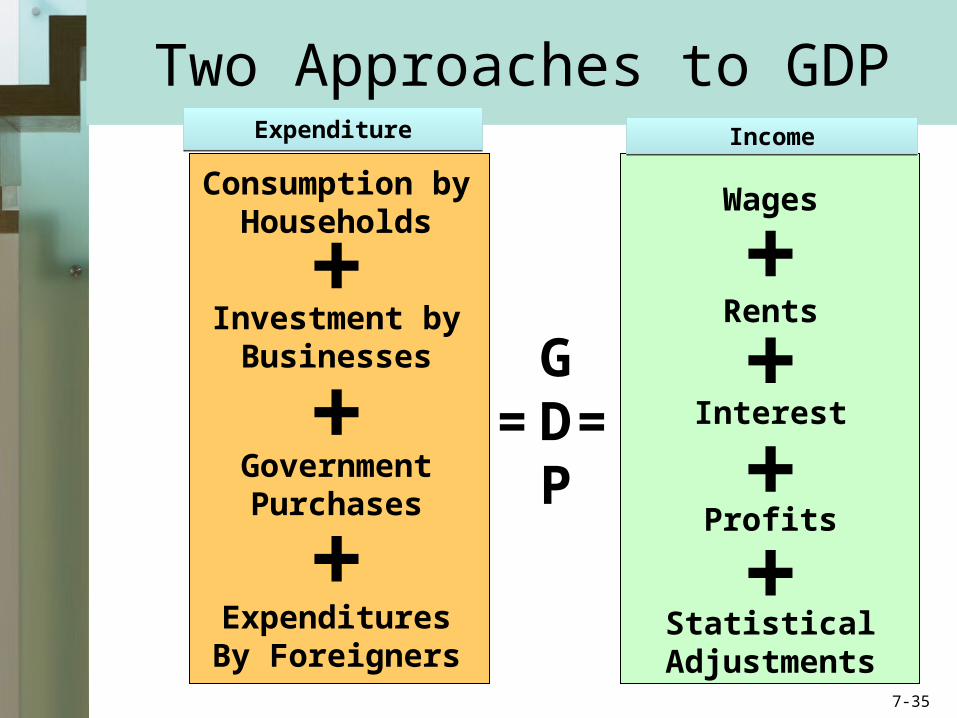
Two Approaches to GDP
• Income approach–Count income derived from
production–Wages, rental income, interest
income, profit• Expenditure approach
–Count sum of money spent buying the final goods
–Who buys the goods?7-33
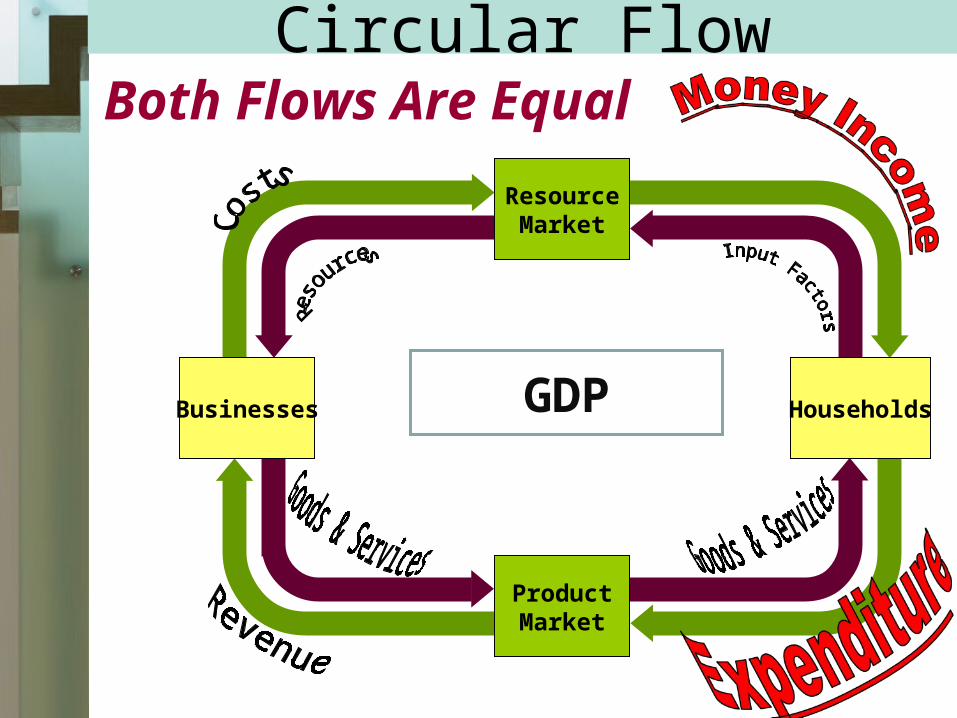
Circular Flow
ResourceMarket
ProductMarket
Businesses Households
Both Flows Are Equal
GDP
GDP
= =
+Consumption by
Households
Investment byBusinesses
GovernmentPurchases
ExpendituresBy Foreigners
+
+
+++
Wages
Rents
Interest
Profits
StatisticalAdjustments
+
Two Approaches to GDP
7-35
ExpenditureExpenditure IncomeIncome
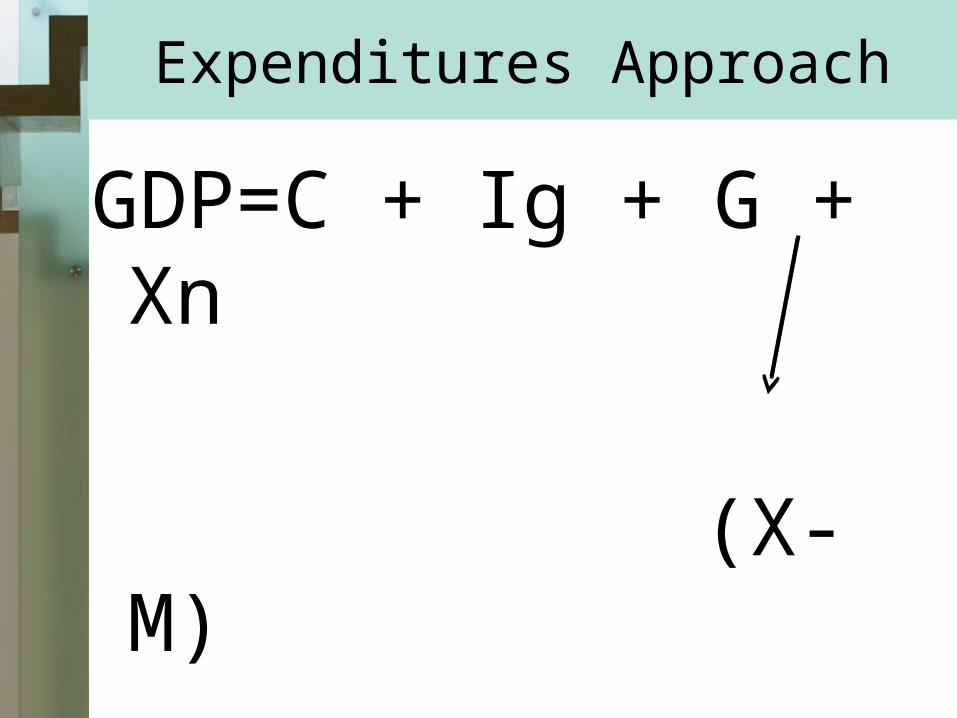
Expenditures Approach
GDP=C + Ig + G + Xn
(X-M)
Expenditure Approach
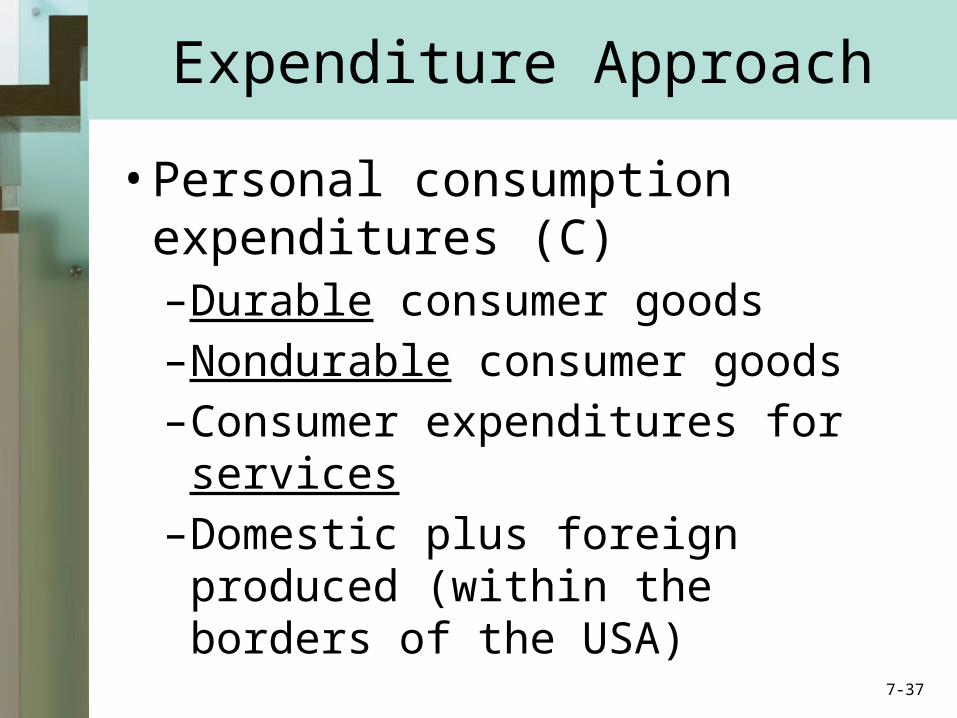
• Personal consumption expenditures (C)–Durable consumer goods–Nondurable consumer goods–Consumer expenditures for
services–Domestic plus foreign produced
(within the borders of the USA)7-37
Expenditure Approach
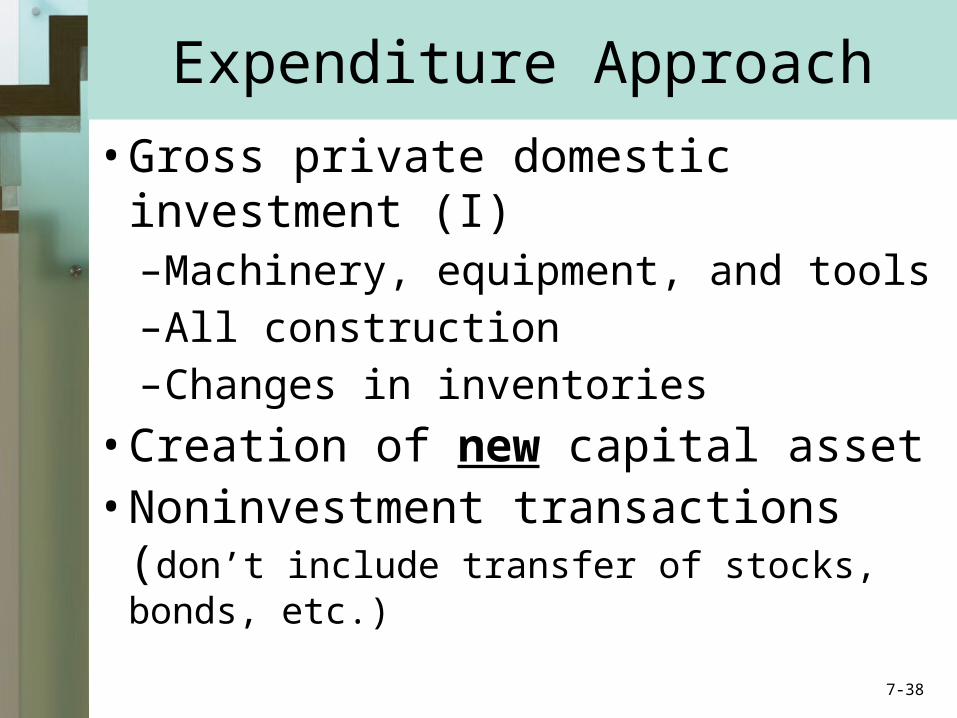
• Gross private domestic investment (I)–Machinery, equipment, and tools–All construction–Changes in inventories
• Creation of new capital asset• Noninvestment transactions (don’t
include transfer of stocks, bonds, etc.)7-38
Expenditure Approach
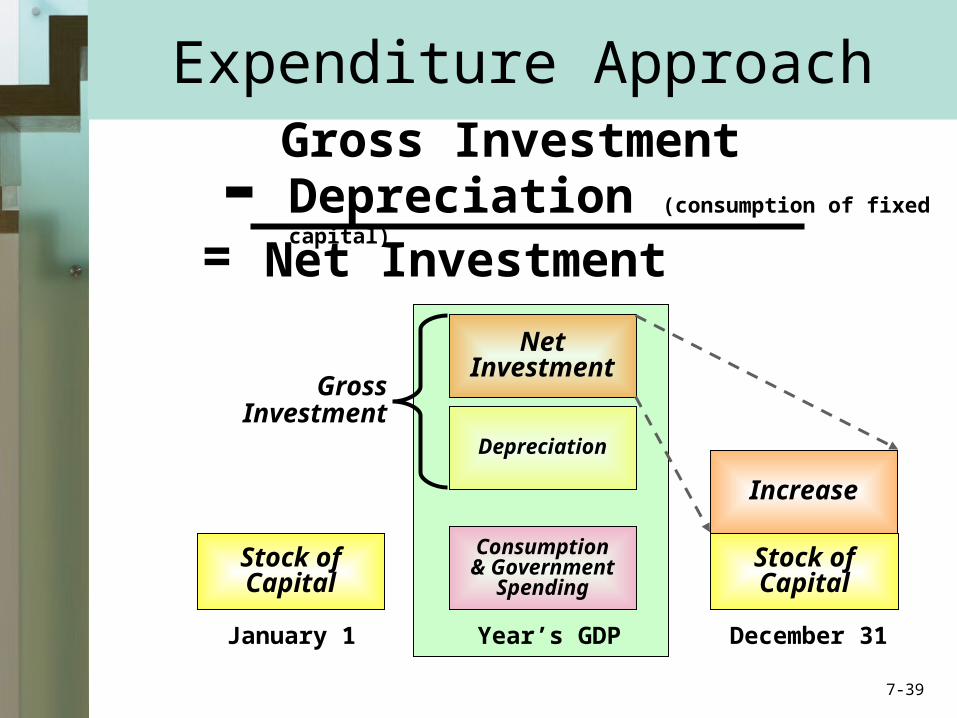
January 1 Year’s GDP December 31
Consumption& Government
Spending
Depreciation
NetInvestment
GrossInvestment
Stock ofCapital
Increase
Stock ofCapital
Gross InvestmentDepreciation (consumption of fixed capital)
Net Investment-=
7-39
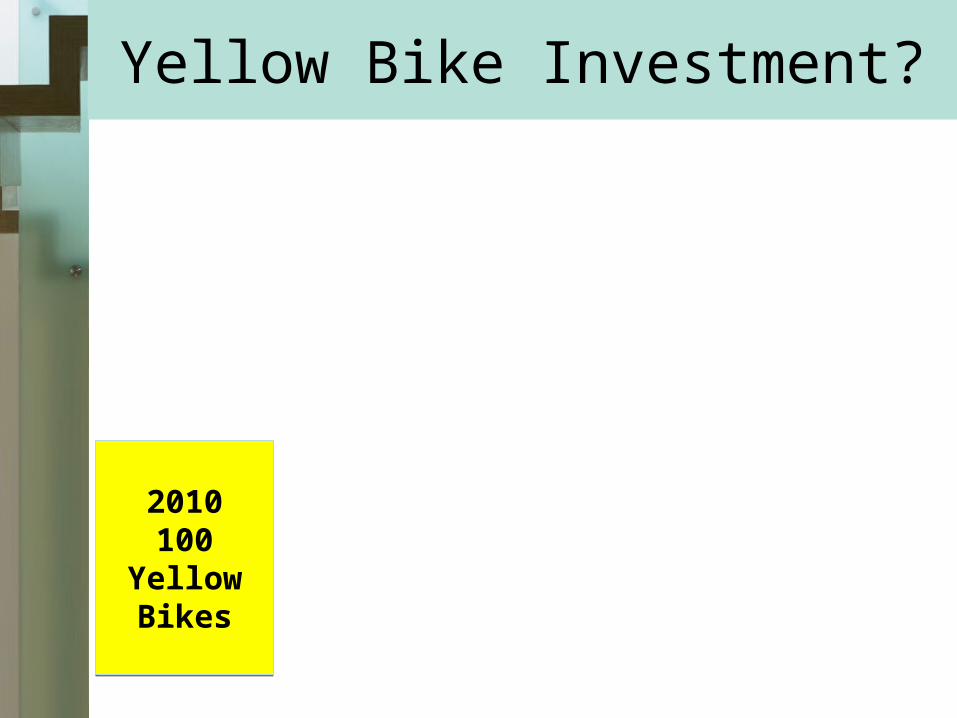
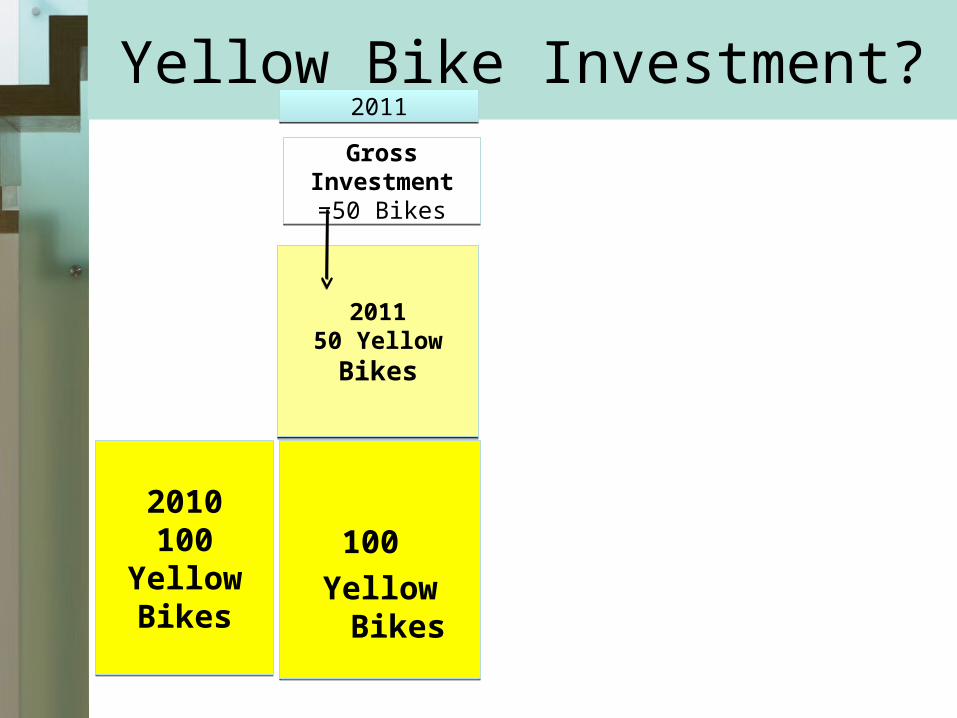
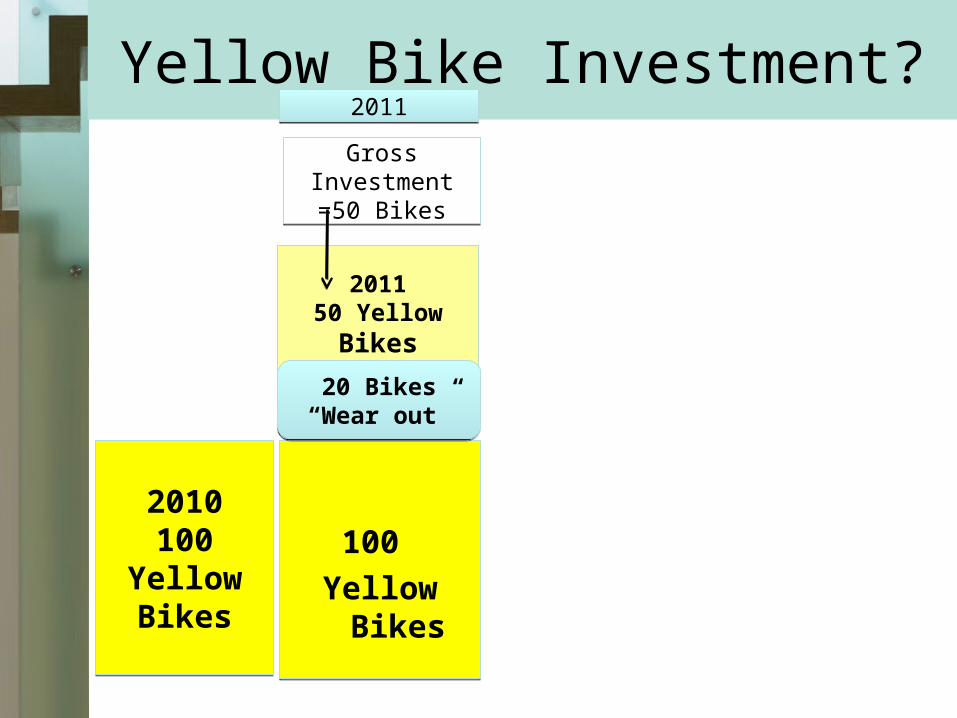
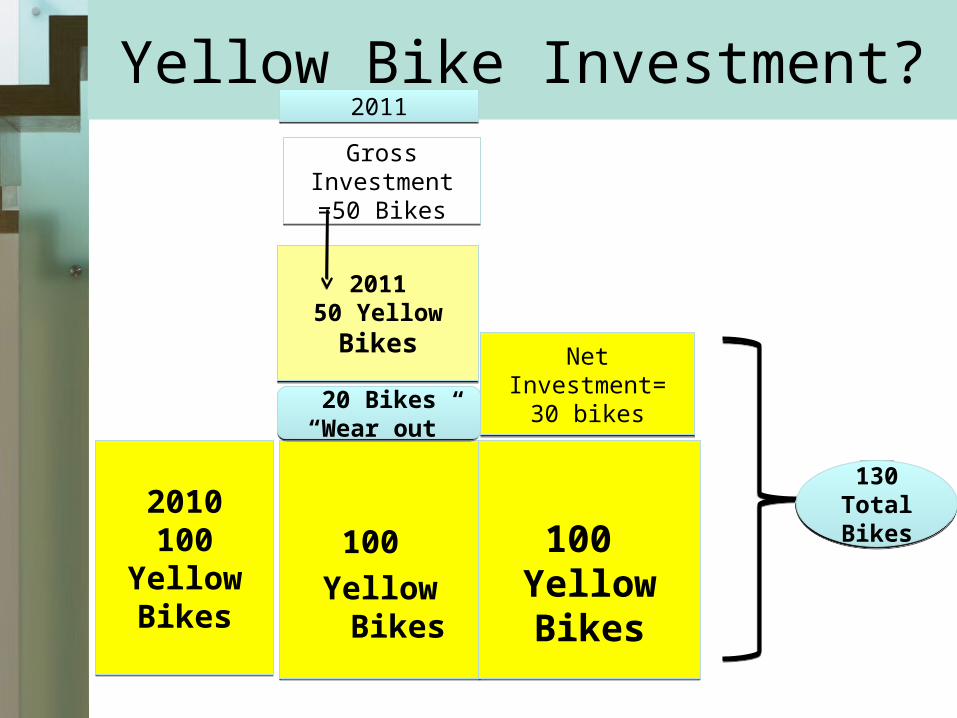
Yellow Bike Investment?
2010100
Yellow Bikes
2010100
Yellow Bikes
Yellow Bike Investment?
2010100
Yellow Bikes
2010100
Yellow Bikes
201150 Yellow
Bikes
201150 Yellow
Bikes
100
Yellow Bikes
100
Yellow Bikes
Gross Investment =50
Bikes
Gross Investment =50
Bikes
20112011
Yellow Bike Investment?
2010100
Yellow Bikes
2010100
Yellow Bikes
201150 Yellow
Bikes
201150 Yellow
Bikes
100
Yellow Bikes
100
Yellow Bikes
20 Bikes “Wear out”
20 Bikes “Wear out”
Gross Investment =50
Bikes
Gross Investment =50
Bikes
20112011
Yellow Bike Investment?
2010100
Yellow Bikes
2010100
Yellow Bikes
201150 Yellow
Bikes
201150 Yellow
Bikes
100
Yellow Bikes
100
Yellow Bikes
20 Bikes “Wear out”
20 Bikes “Wear out”
Gross Investment =50
Bikes
Gross Investment =50
Bikes
Net Investment= 30 bikes
Net Investment= 30 bikes
100 Yellow Bikes
100 Yellow Bikes
130 Total Bikes
130 Total Bikes
20112011
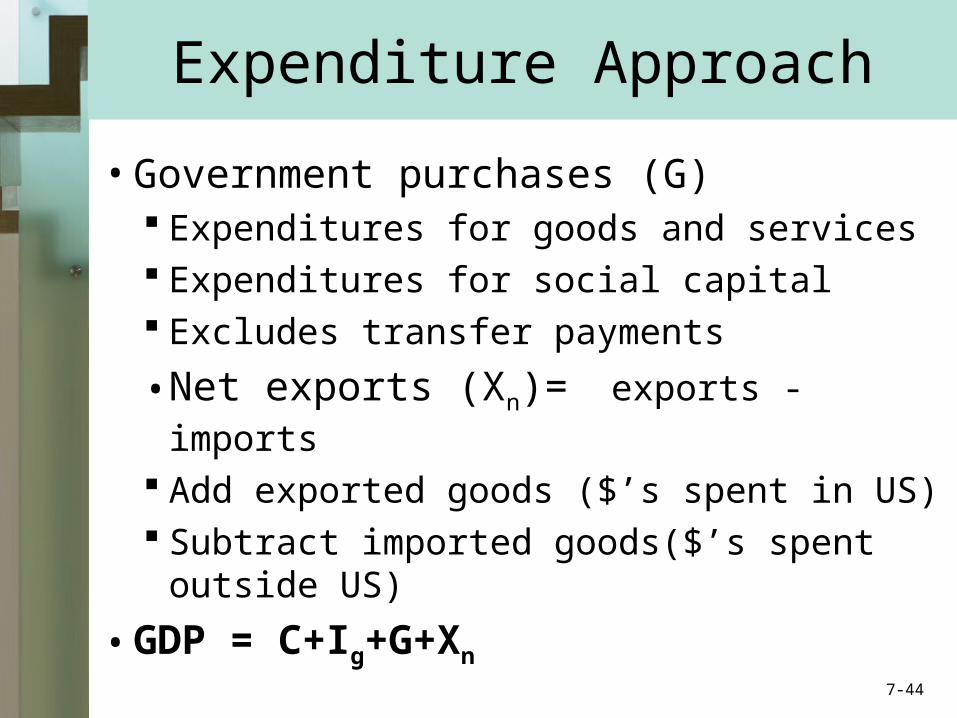
Expenditure Approach
• Government purchases (G) Expenditures for goods and services Expenditures for social capital Excludes transfer payments
• Net exports (Xn)= exports - imports
Add exported goods ($’s spent in US) Subtract imported goods($’s spent
outside US)
• GDP = C+Ig+G+Xn7-44
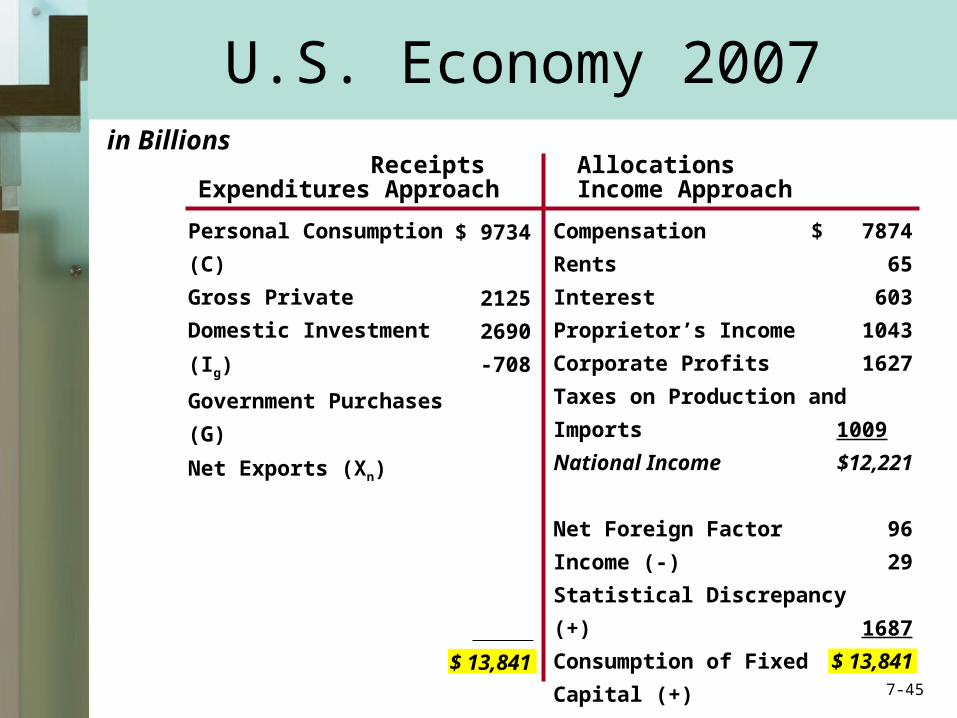
Compensation
Rents
Interest
Proprietor’s Income
Corporate Profits
Taxes on Production and
Imports
National Income
Net Foreign Factor Income (-)
Statistical Discrepancy (+)
Consumption of Fixed
Capital (+)
Gross Domestic Product
$ 7874
65
603
1043
1627
1009
$12,221
96
29
1687
$ 13,841
Personal Consumption (C)
Gross Private Domestic
Investment (Ig)
Government Purchases (G)
Net Exports (Xn)
Gross Domestic Product
in Billions ReceiptsExpenditures Approach
AllocationsIncome Approach
$ 9734
2125
2690
-708
$ 13,841
U.S. Economy 2007
7-45
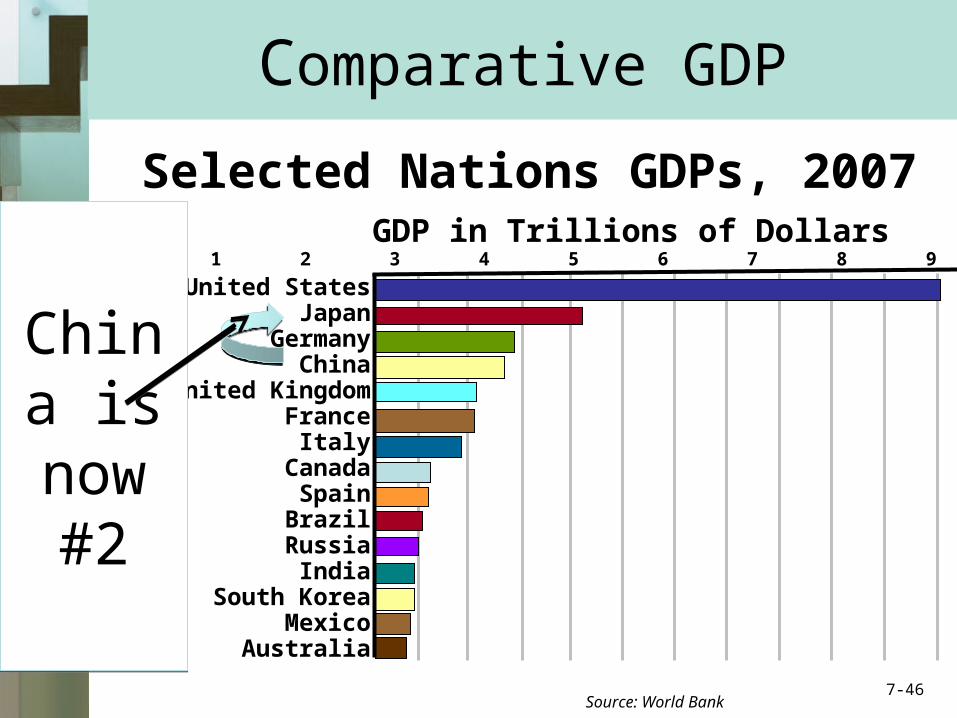
Comparative GDP
Source: World Bank
Selected Nations GDPs, 2007
United StatesJapan
GermanyChina
United KingdomFrance
ItalyCanada
SpainBrazil
RussiaIndia
South KoreaMexico
Australia
0 1 2 3 4 5 6 7 8 9 10 12 13GDP in Trillions of Dollars
7-46
China is now
#2
China is now
#2
Components of National Income
• Compensation of employees• Rents• Interest• Proprietor’s income• Corporate profits
– Corporate income taxes– Dividends– Undistributed corporate profits
–Taxes on production and imports7-47
Income Approach
• From national income to GDP– Net foreign factor income– Statistical discrepancy– Consumption of fixed capital
• Other national accounts– Net domestic product (NDP)– National income (NI)– Personal income (PI)– Disposable income (DI)– DI = C + S 7-48
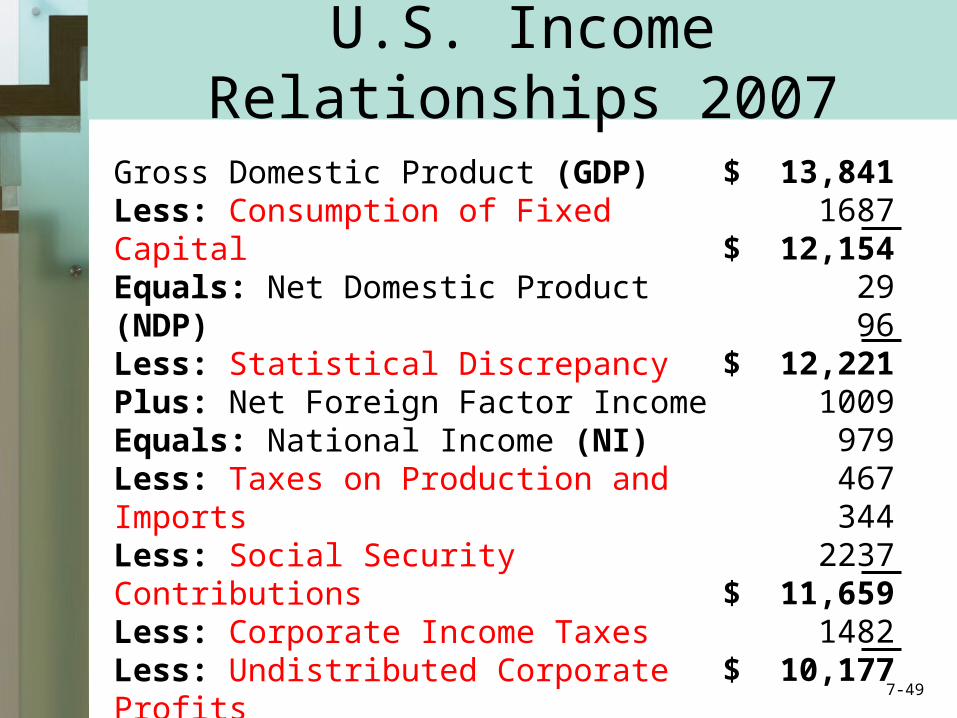
U.S. Income Relationships 2007
Gross Domestic Product (GDP)Less: Consumption of Fixed CapitalEquals: Net Domestic Product (NDP)Less: Statistical DiscrepancyPlus: Net Foreign Factor IncomeEquals: National Income (NI)Less: Taxes on Production and ImportsLess: Social Security ContributionsLess: Corporate Income TaxesLess: Undistributed Corporate ProfitsPlus: Transfer PaymentsEquals: Personal Income (PI)Less: Personal TaxesEquals: Disposable Income (DI)
$ 13,8411687
$ 12,1542996
$ 12,2211009
979467344
2237$ 11,659
1482$ 10,177
7-49

For Homework Problem #8 p. 143
GDP= C + Ig + G + (X-M)-depreciation
NDP= C + In + G + Xn-statistical discrepancy
+ net foreign factor income
NI=(comp. to employees)+(rent)+(interest)+(profit)+
(proprietor's income)+(taxes on production & imports)
+transfer payments
-social security taxes
-undistributed corporate profits
-corporate income taxes
-taxes on production and imports
PI= C + S + Tx-Tx
DI= C + S
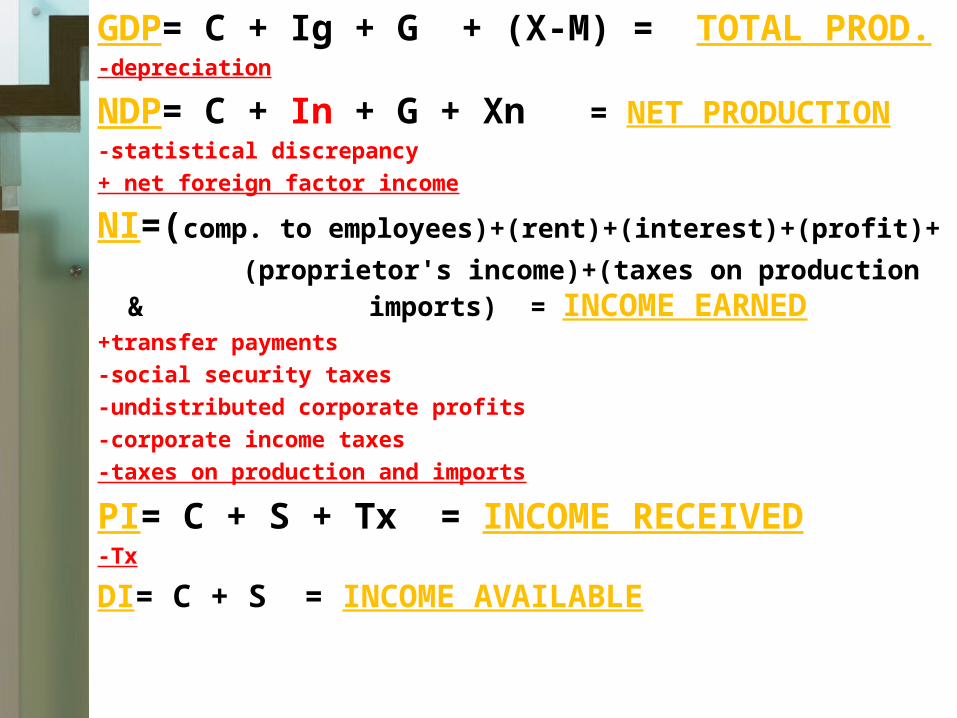
GDP= C + Ig + G + (X-M) = TOTAL PROD.-depreciation
NDP= C + In + G + Xn = NET PRODUCTION-statistical discrepancy
+ net foreign factor income
NI=(comp. to employees)+(rent)+(interest)+(profit)+
(proprietor's income)+(taxes on production & imports) = INCOME EARNED
+transfer payments
-social security taxes
-undistributed corporate profits
-corporate income taxes
-taxes on production and imports
PI= C + S + Tx = INCOME RECEIVED-Tx
DI= C + S = INCOME AVAILABLE
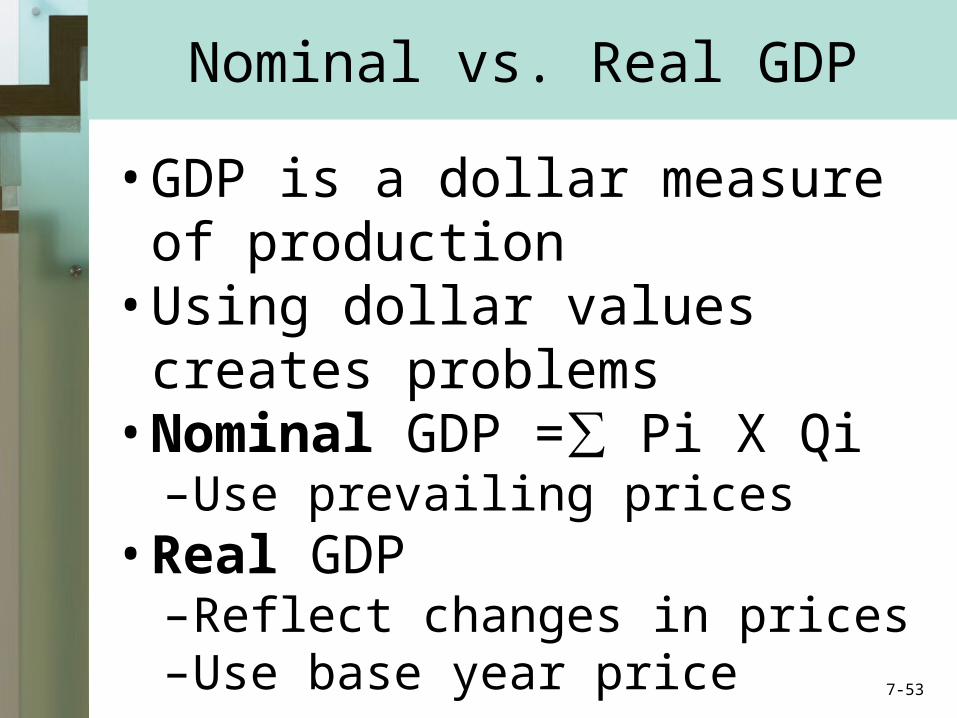
Nominal vs. Real GDP
• GDP is a dollar measure of production
• Using dollar values creates problems
• Nominal GDP =∑ Pi X Qi–Use prevailing prices
• Real GDP–Reflect changes in prices–Use base year price 7-53
GDP=∑(PxQ)We want to measure REAL changes in the
output (Q) of goods and services.
• $1x 100 cokes/year=$100
$100
• $1x 200 cokes/year=$200– $100 $200 correctly represents a 100%
increase in coke production and sales
BUT, what if the price of coke went up from $1$2?
Then, $2 x 100 cokes =$200: no real increase in coke production (Q)
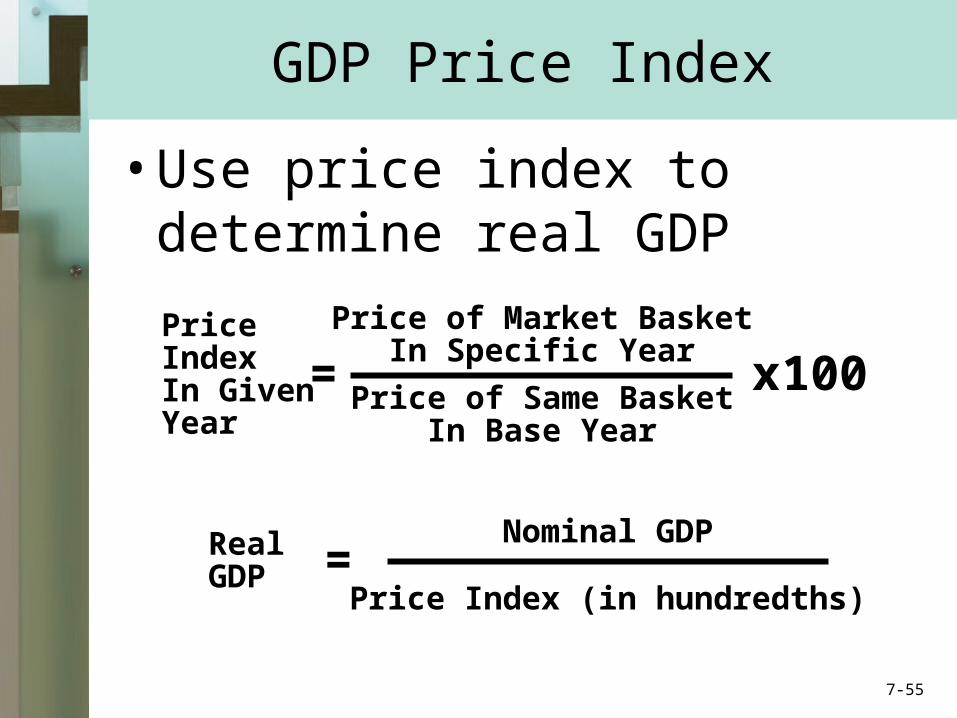
GDP Price Index
• Use price index to determine real GDP
PriceIndexIn GivenYear
= x100Price of Market Basket
In Specific Year
Price of Same BasketIn Base Year
RealGDP =
Nominal GDP
Price Index (in hundredths)
7-55
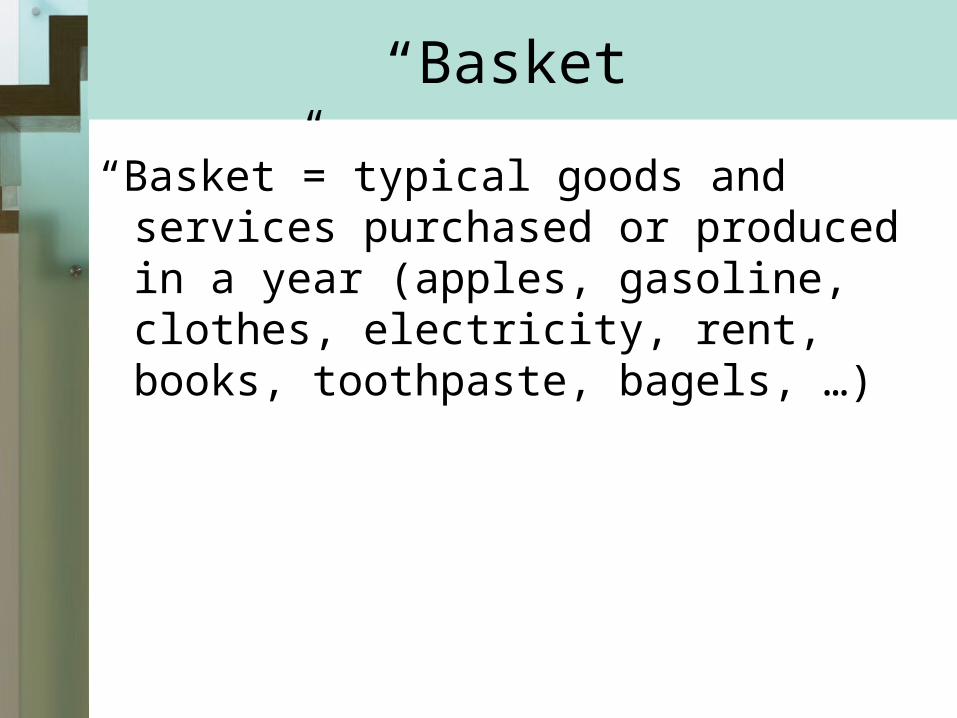
“Basket”
“Basket”= typical goods and services purchased or produced in a year (apples, gasoline, clothes, electricity, rent, books, toothpaste, bagels, …)
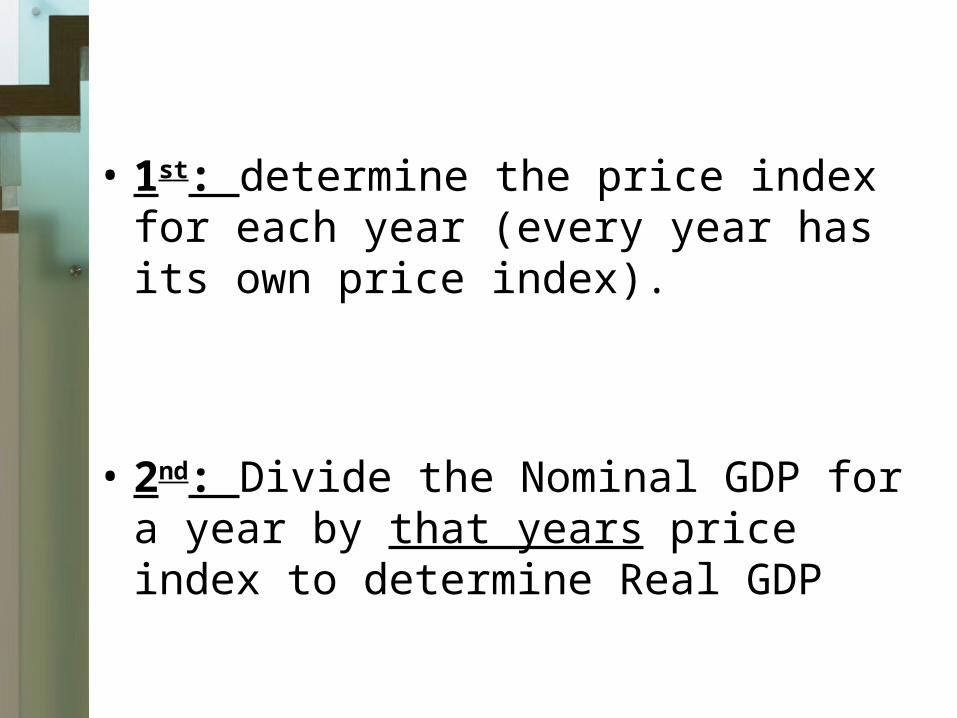
• 1st: determine the price index for each year (every year has its own price index).
• 2nd: Divide the Nominal GDP for a year by that years price index to determine Real GDP
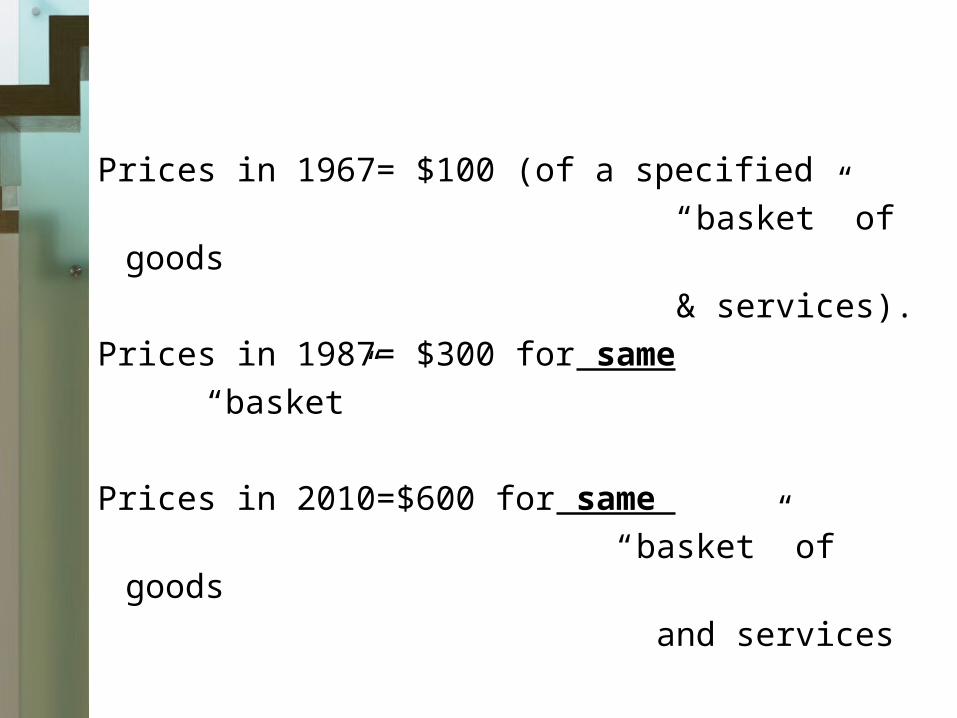
Prices in 1967= $100 (of a specified
“basket” of goods
& services).
Prices in 1987= $300 for same
“basket”
Prices in 2010=$600 for same
“basket” of goods
and services
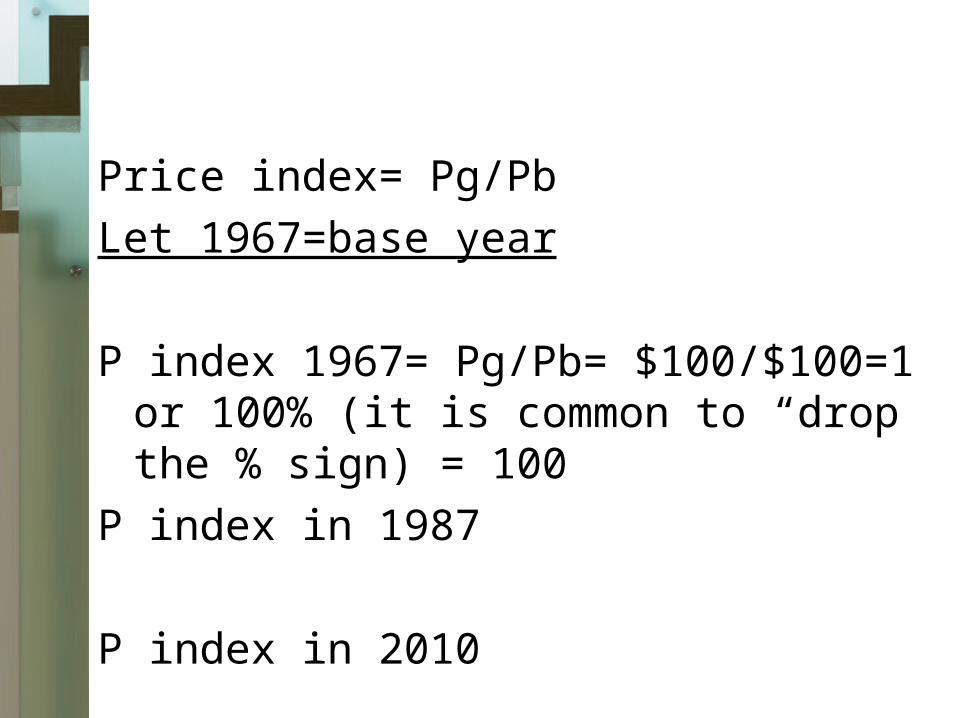
Price index= Pg/Pb
Let 1967=base year
P index 1967= Pg/Pb= $100/$100=1 or 100% (it is common to “drop the % sign) = 100
P index in 1987
P index in 2010
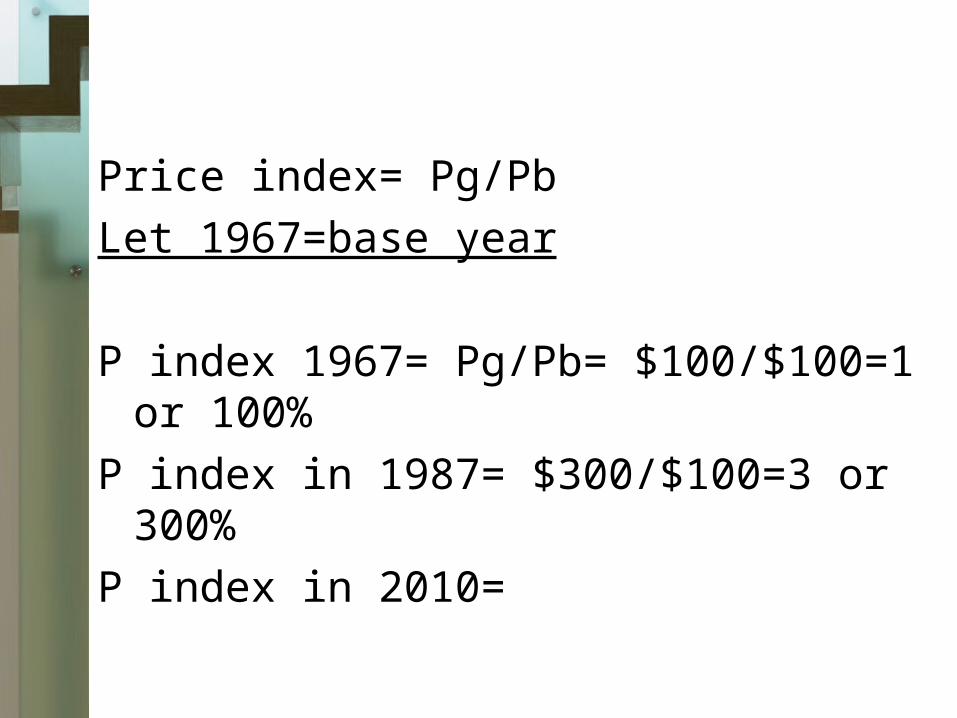
Price index= Pg/Pb
Let 1967=base year
P index 1967= Pg/Pb= $100/$100=1 or 100%
P index in 1987= $300/$100=3 or 300%
P index in 2010=
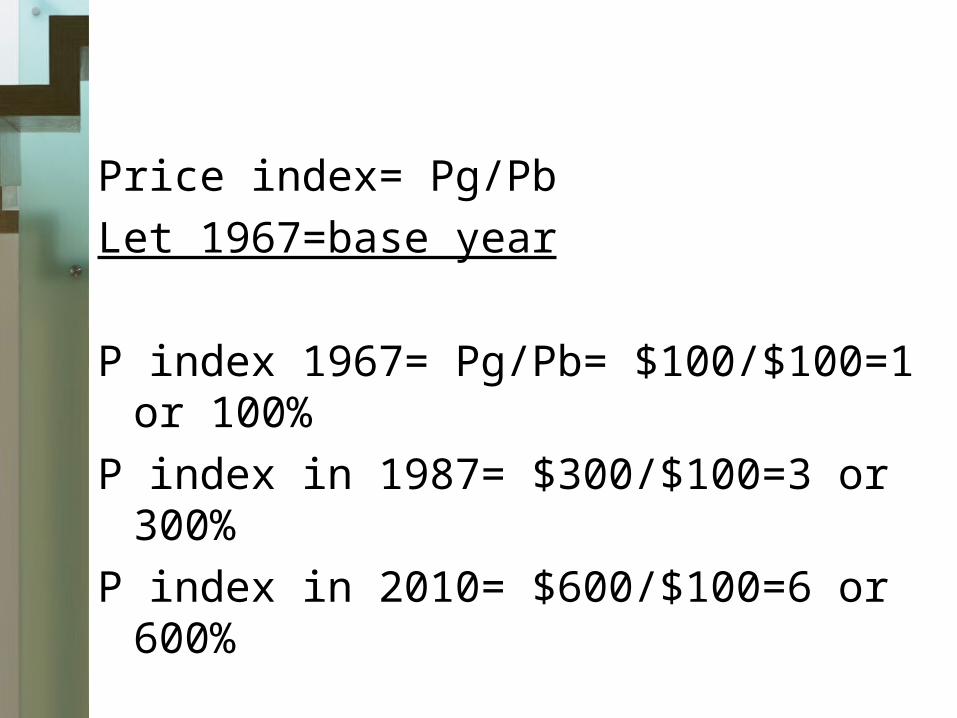
Price index= Pg/Pb
Let 1967=base year
P index 1967= Pg/Pb= $100/$100=1 or 100%
P index in 1987= $300/$100=3 or 300%
P index in 2010= $600/$100=6 or 600%
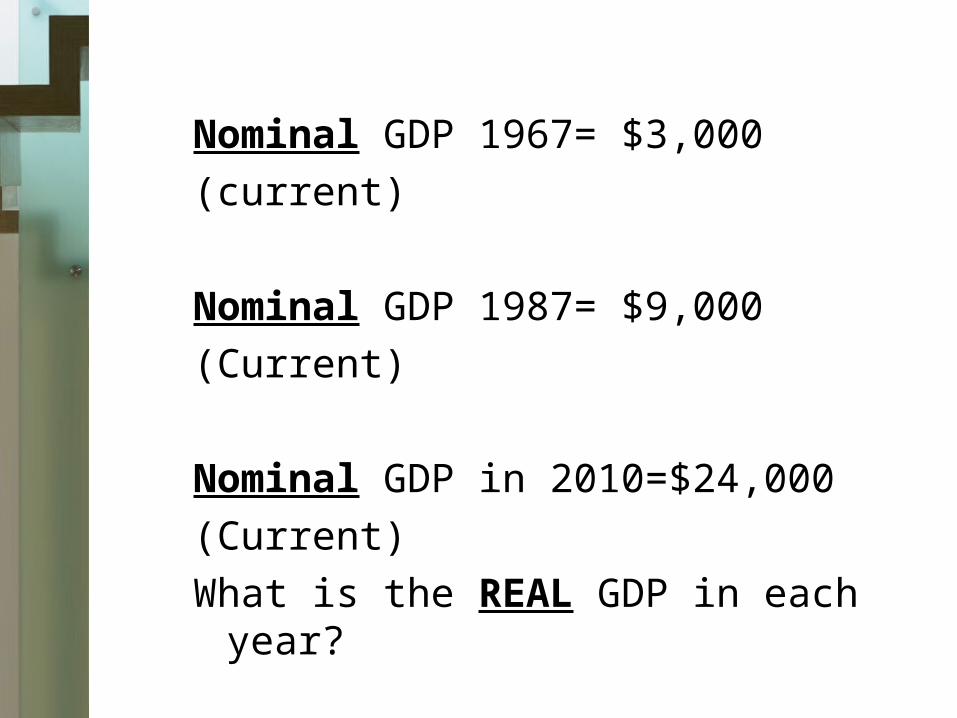
Nominal GDP 1967= $3,000
(current)
Nominal GDP 1987= $9,000
(Current)
Nominal GDP in 2010=$24,000
(Current)
What is the REAL GDP in each year?
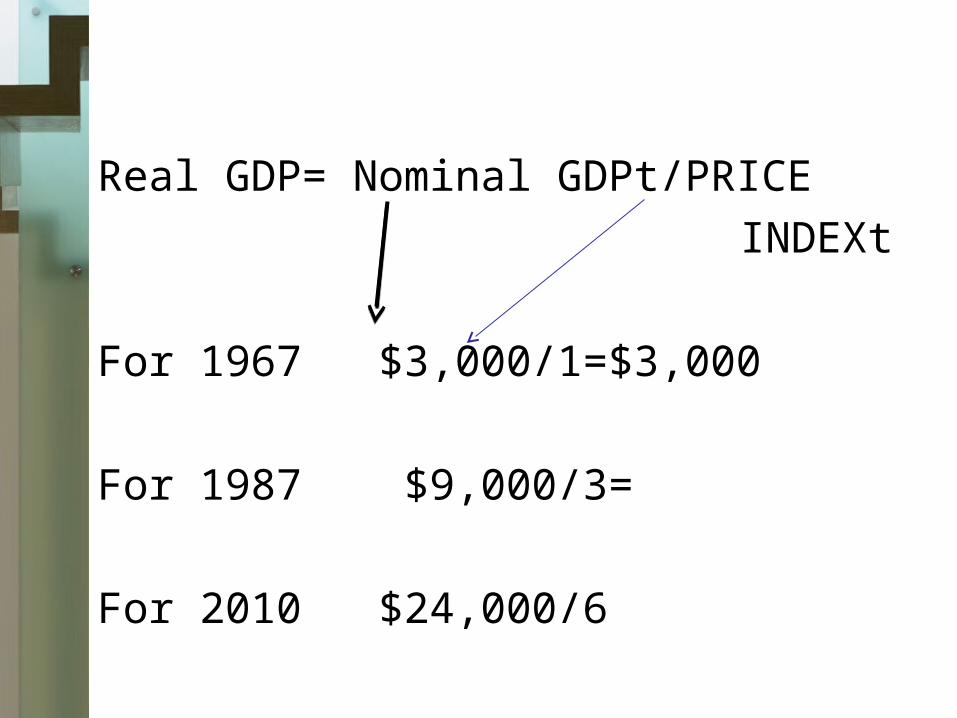
Real GDP= Nominal GDPt/PRICE
INDEXt
For 1967 $3,000/1=$3,000
For 1987 $9,000/3=
For 2010 $24,000/6
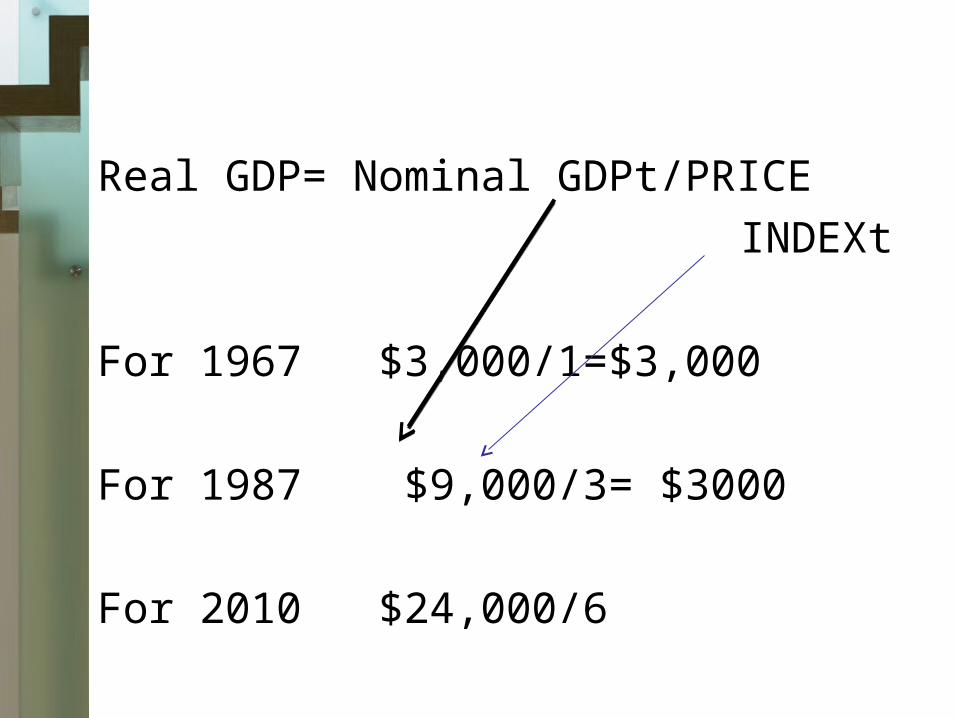
Real GDP= Nominal GDPt/PRICE
INDEXt
For 1967 $3,000/1=$3,000
For 1987 $9,000/3= $3000
For 2010 $24,000/6
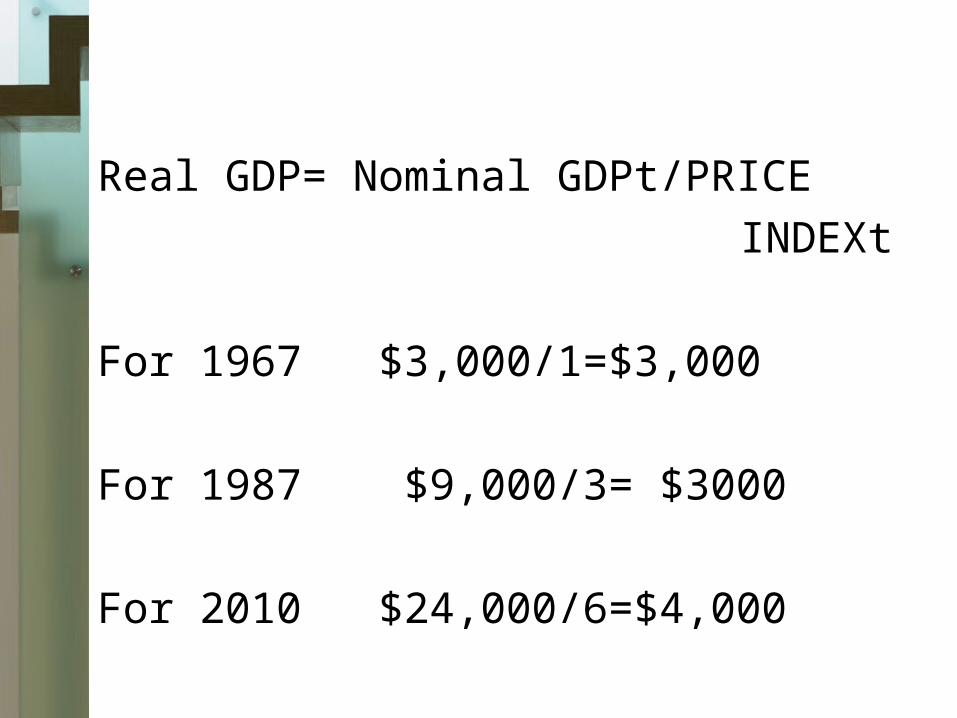
Real GDP= Nominal GDPt/PRICE
INDEXt
For 1967 $3,000/1=$3,000
For 1987 $9,000/3= $3000
For 2010 $24,000/6=$4,000
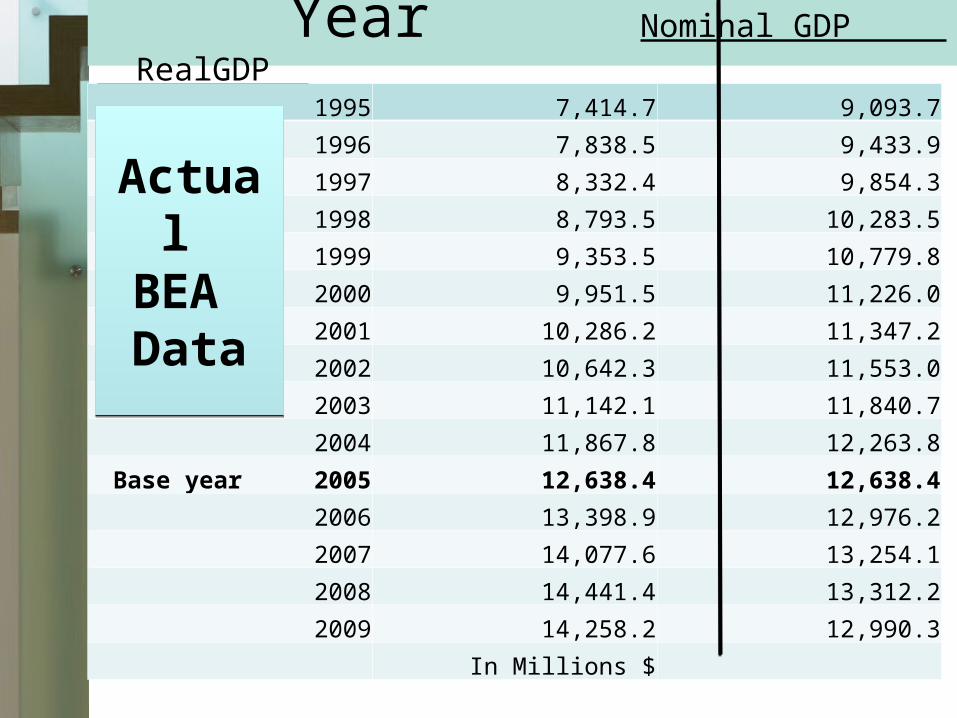
Year Nominal GDP RealGDP
1995 7,414.7 9,093.7
1996 7,838.5 9,433.9
1997 8,332.4 9,854.3
1998 8,793.5 10,283.5
1999 9,353.5 10,779.8
2000 9,951.5 11,226.0
2001 10,286.2 11,347.2
2002 10,642.3 11,553.0
2003 11,142.1 11,840.7
2004 11,867.8 12,263.8
Base year 2005 12,638.4 12,638.4
2006 13,398.9 12,976.2
2007 14,077.6 13,254.1
2008 14,441.4 13,312.2
2009 14,258.2 12,990.3
In Millions $
Actual BEA Data
Actual BEA Data
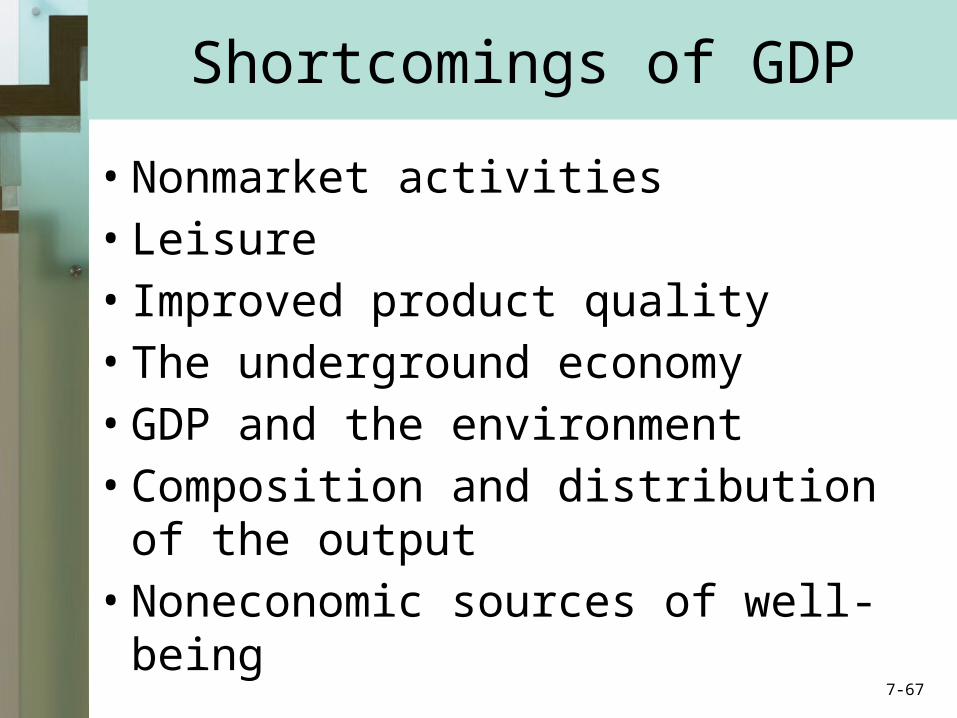
Shortcomings of GDP
• Nonmarket activities• Leisure• Improved product quality• The underground economy• GDP and the environment• Composition and distribution of the
output• Noneconomic sources of well-being
7-67
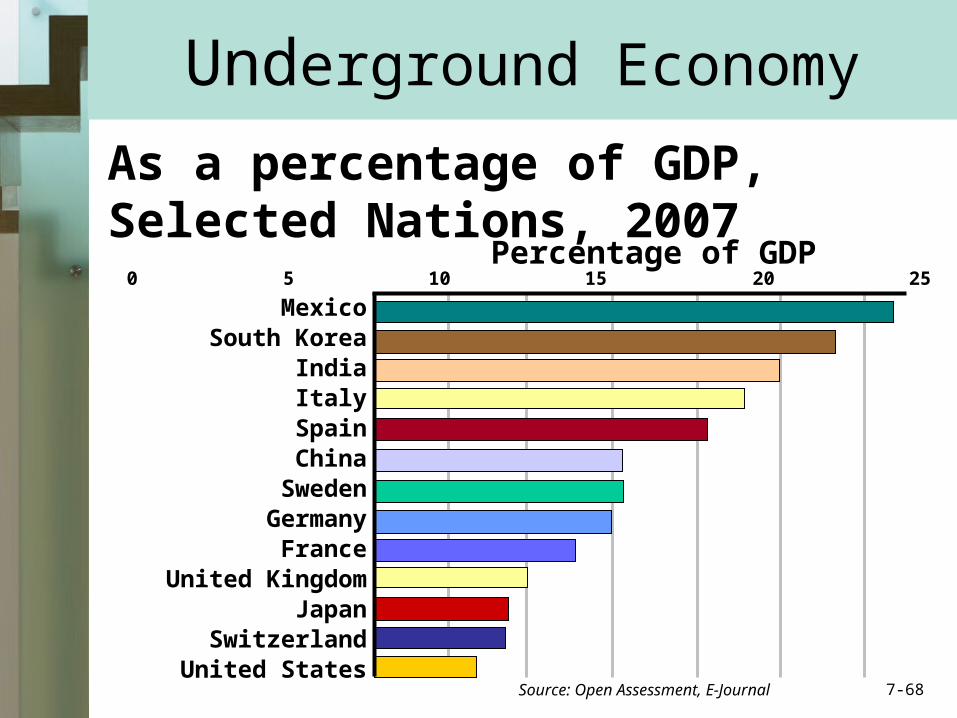
Underground Economy
Source: Open Assessment, E-Journal
As a percentage of GDP, Selected Nations, 2007
MexicoSouth Korea
IndiaItaly
SpainChina
SwedenGermany
FranceUnited Kingdom
JapanSwitzerland
United States
0 5 10 15 20 25 30 Percentage of GDP
7-68
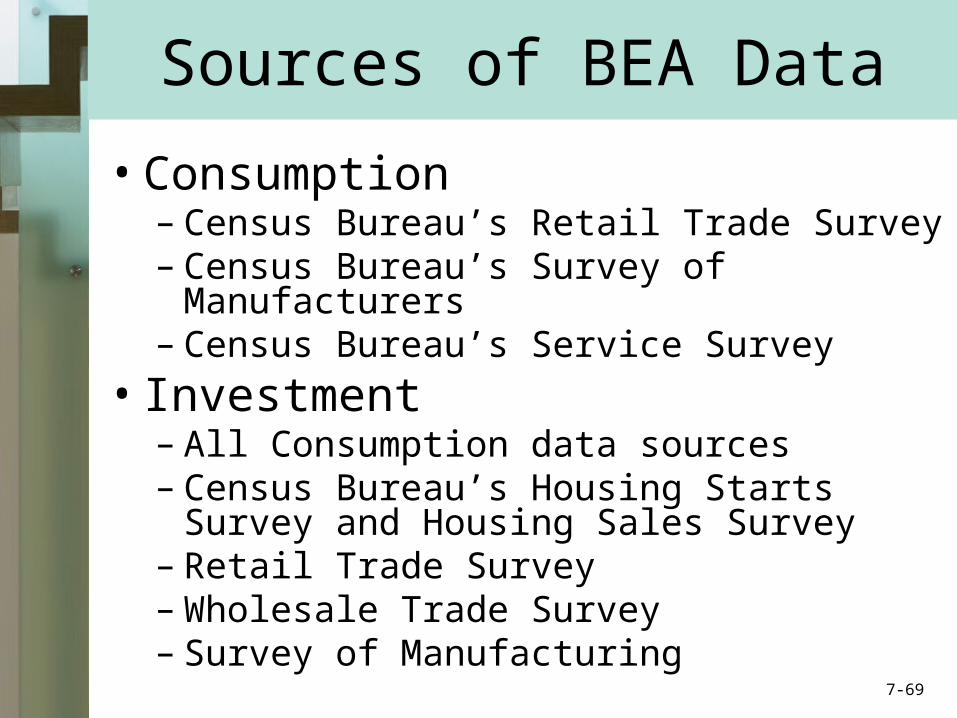
Sources of BEA Data
• Consumption– Census Bureau’s Retail Trade Survey– Census Bureau’s Survey of Manufacturers– Census Bureau’s Service Survey
• Investment– All Consumption data sources– Census Bureau’s Housing Starts Survey and
Housing Sales Survey– Retail Trade Survey– Wholesale Trade Survey– Survey of Manufacturing
7-69
• Government Purchases– Office of Personnel Management
– Construction Surveys
– Census Bureau’s Survey of Government Finance
• Net Exports– U.S. Customs Service
– BEA Surveys and Analysis
Sources of BEA Data
7-70
Key Terms
• national income accounting
• gross domestic product• intermediate goods• final goods• multiple counting• value added• expenditures approach• income approach• personal consumption
expenditures• gross and net private
domestic investment
• government purchases
• net exports • taxes on production
and imports• national income• consumption of fixed
capital• net domestic product • personal income • disposable income• nominal GDP• real GDP• price index
7-71

Next Chapter Preview…
Economic Growth
7-72