Embed Size (px)
Citation preview
i
A
TECHNICAL REPORT
ON
STUDENTS INDUSTRIAL WORK EXPERIENCE SCHEME
(SIWES)
UNDERTAKEN AT
LAGOS STATE MATERIALS TESTING LABORATORY (LSMTL),
Lagos State Public Works Corporation Complex, Ojodu-Berger ,
Lagos State, Nigeria.
COMPILED BY
OLUMAYOWA, Damilola Joshua
AGY/11/7076
SUBMITTED TO
THE DEPARTMENT OF APPLIED GEOLOGY,
SCHOOL OF EARTH AND MINERAL SCIENCES,
FEDERAL UNIVERSITY OF TECHNOLOGY, AKURE.
IN PARTIAL FULFILLMENT OF THE REQUIREMENT FOR THE AWARD OF
BACHELOR OF TECHNOLOGY (B.TECH) DEGREE IN APPLIED GEOLOGY.
JANUARY, 2016.
ii
CERTIFICATION
This is to certify that this report was written by Olumayowa, Damilola J. with matric
number AGY/11/7076 and submitted to the department of Applied Geology, School of Earth
and Mineral Sciences, Federal University of Technology, Akure in partial fulfillment of the
requirement for the award of Bachelor of Technology (B.Tech.) in Applied Geology.
____________________ ____ _____________________
Head of Department signature Date
______________________________ ___________________________
Student’s signature Date
iii
DEDICATION
This report is dedicated to the Almighty God for giving me the wisdom, knowledge,
understanding and strength needed for the successful completion of the SIWES program. To
my mother Mrs Olumayowa Esther who supported me and ensured that my SIWES program
was a success, I say a very big thank you.

iv
ACKNOWLEDGEMENT
I want to sincerely acknowledge my Industrial based supervisor and the Director of
Engineering Services LSMTL in person of Eng. A.C Apata for his fatherly guidance and the
knowledge impacted on me during the program. Also, I will like to appreciate my mother
Mrs OLumayowa for her relentless efforts towards my upbringing and all she has been to me.
Furthermore, I want to express my profound gratitude to my departmental based supervisor,
Head of Department and Lecturers and all the laboratory and field/site officers at LSMTL for
the vast role played towards ensuring that I get the necessary knowledge required for me to
be well positioned both morally and academically in life.
In conclusion, to all those that have in one way or the other contributed to my success and
achievements in life could not be over emphasized, I say a very big thank you to all.
v
ABSRACT
This report gives a concise account of the six months industrial training programme
undergone at Lagos State Materials Testing Laboratory (LSMTL). Lagos State Materials
Testing Laboratory is a unique and advance civil engineering materials testing laboratory
that meets the quality control needs in the building industry in Lagos state and Nigeria as a
whole. This report shows the sections I was attached in the company during the course of my
training period. These sections include the Concrete section, the Soil/Geotechnics section and
the Steel/Reinforcement section. Work in each section involves collection of construction
materials and carrying out various test on the materials which includes Destructive Test e.g
compressive strength test and tensile strength test Semi Destructive Test e.g coring of
structural elements or members. Non Destructive Test, Geotechnical test which can be
laboratory or in-situ test e.g Cone Penetration test(CPT), Standard Penetration Test(SPT) etc.
The six months was a period of industrial training experience in which I learnt how relevant
theoretical knowledge could be applied in reality.
vi
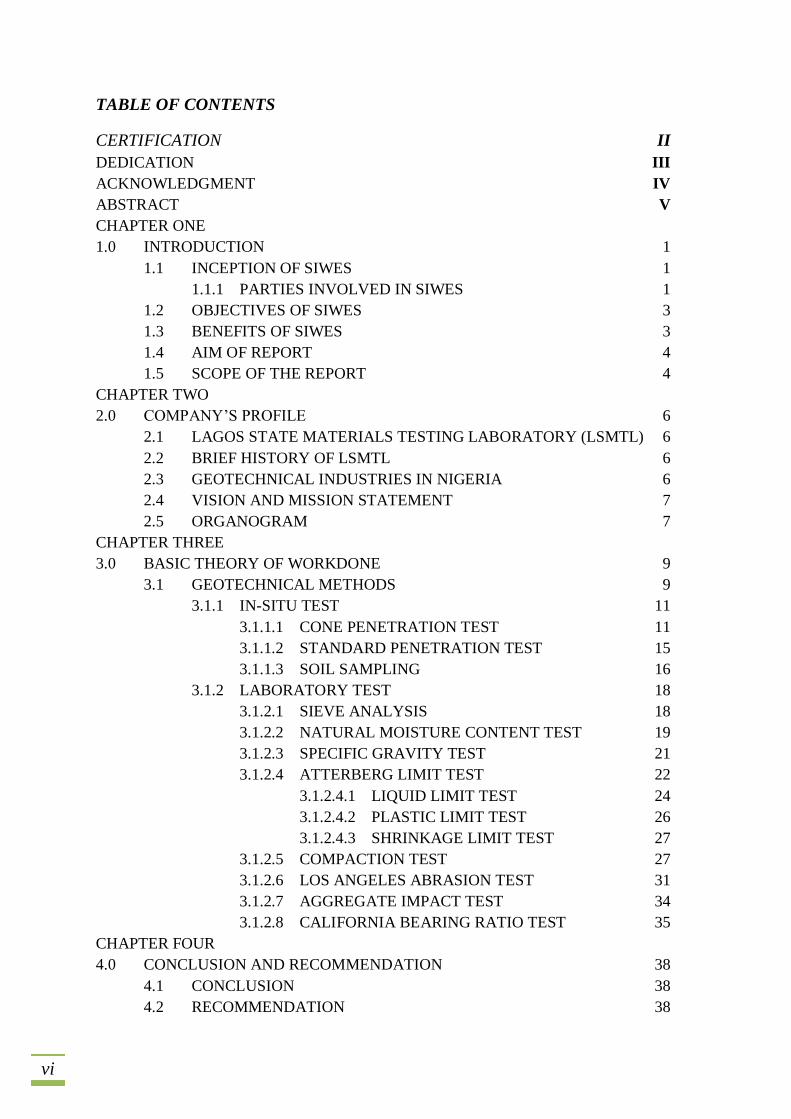
TABLE OF CONTENTS
CERTIFICATION II
DEDICATION III
ACKNOWLEDGMENT IV
ABSTRACT V
CHAPTER ONE
1.0 INTRODUCTION 1
1.1 INCEPTION OF SIWES 1
1.1.1 PARTIES INVOLVED IN SIWES 1
1.2 OBJECTIVES OF SIWES 3
1.3 BENEFITS OF SIWES 3
1.4 AIM OF REPORT 4
1.5 SCOPE OF THE REPORT 4
CHAPTER TWO
2.0 COMPANY’S PROFILE 6
2.1 LAGOS STATE MATERIALS TESTING LABORATORY (LSMTL) 6
2.2 BRIEF HISTORY OF LSMTL 6
2.3 GEOTECHNICAL INDUSTRIES IN NIGERIA 6
2.4 VISION AND MISSION STATEMENT 7
2.5 ORGANOGRAM 7
CHAPTER THREE
3.0 BASIC THEORY OF WORKDONE 9
3.1 GEOTECHNICAL METHODS 9
3.1.1 IN-SITU TEST 11
3.1.1.1 CONE PENETRATION TEST 11
3.1.1.2 STANDARD PENETRATION TEST 15
3.1.1.3 SOIL SAMPLING 16
3.1.2 LABORATORY TEST 18
3.1.2.1 SIEVE ANALYSIS 18
3.1.2.2 NATURAL MOISTURE CONTENT TEST 19
3.1.2.3 SPECIFIC GRAVITY TEST 21
3.1.2.4 ATTERBERG LIMIT TEST 22
3.1.2.4.1 LIQUID LIMIT TEST 24
3.1.2.4.2 PLASTIC LIMIT TEST 26
3.1.2.4.3 SHRINKAGE LIMIT TEST 27
3.1.2.5 COMPACTION TEST 27
3.1.2.6 LOS ANGELES ABRASION TEST 31
3.1.2.7 AGGREGATE IMPACT TEST 34
3.1.2.8 CALIFORNIA BEARING RATIO TEST 35
CHAPTER FOUR
4.0 CONCLUSION AND RECOMMENDATION 38
4.1 CONCLUSION 38
4.2 RECOMMENDATION 38

vii
REFERENCES 40
APPENDIX 41
viii
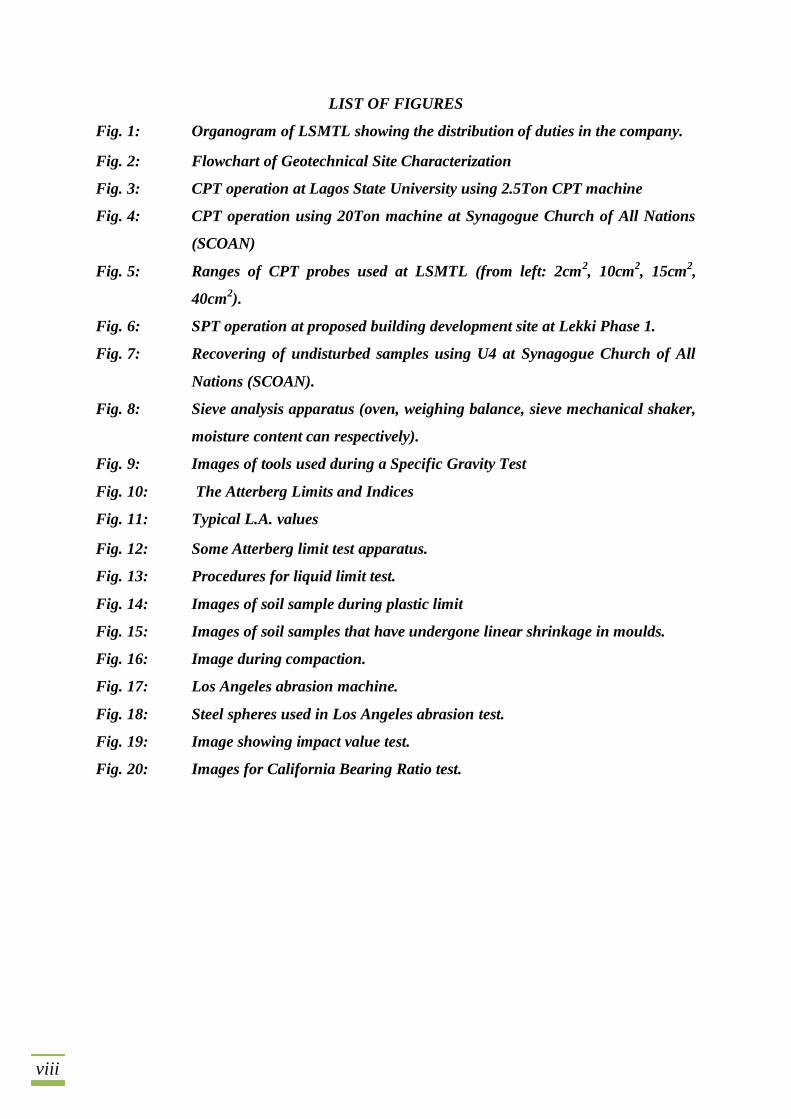
LIST OF FIGURES
Fig. 1: Organogram of LSMTL showing the distribution of duties in the company.
Fig. 2: Flowchart of Geotechnical Site Characterization
Fig. 3: CPT operation at Lagos State University using 2.5Ton CPT machine
Fig. 4: CPT operation using 20Ton machine at Synagogue Church of All Nations
(SCOAN)
Fig. 5: Ranges of CPT probes used at LSMTL (from left: 2cm2, 10cm
2, 15cm
2,
40cm2).
Fig. 6: SPT operation at proposed building development site at Lekki Phase 1.
Fig. 7: Recovering of undisturbed samples using U4 at Synagogue Church of All
Nations (SCOAN).
Fig. 8: Sieve analysis apparatus (oven, weighing balance, sieve mechanical shaker,
moisture content can respectively).
Fig. 9: Images of tools used during a Specific Gravity Test
Fig. 10: The Atterberg Limits and Indices
Fig. 11: Typical L.A. values
Fig. 12: Some Atterberg limit test apparatus.
Fig. 13: Procedures for liquid limit test.
Fig. 14: Images of soil sample during plastic limit
Fig. 15: Images of soil samples that have undergone linear shrinkage in moulds.
Fig. 16: Image during compaction.
Fig. 17: Los Angeles abrasion machine.
Fig. 18: Steel spheres used in Los Angeles abrasion test.
Fig. 19: Image showing impact value test.
Fig. 20: Images for California Bearing Ratio test.
1
CHAPTER ONE
1.0 INTRODUCTION
1.1 Inception Of Students’ Industrial Work Experience Scheme (SIWES)
The Students Industrial Work Experience Scheme (SIWES) is a skill development
programme initiated by the Industrial Training Fund (ITF), in 1973 to bridge the gap
between theory and practice among students of engineering and technology in
Institutions of Higher Learning in Nigeria. It provides for on-the-job practical
experience for students as they are exposed to work methods and techniques in
handling equipment and machinery that may not be available in their Institutions.
At inception in 1974, the Scheme started with 784 Students from 11 Institutions and
104 eligible courses. By 2008, 210,390 Students from 219 Institutions participated in
the Scheme with over 112 eligible courses.
However, the rapid growth and expansion of SIWES, has occurred against the
backdrop of successive economic crises which have affected the smooth operation
and administration of the Scheme. Most industries in Nigeria today, are operating
below installed capacity while others are completely shut down. This has impacted
negatively on the Scheme as Institutions of Higher Learning find it increasingly
difficult to secure placement for Students in industries where they could acquire the
much needed practical experience.
1.1.1 Parties Involved In The SIWES Programme
i. Educational Institutions: The Institutions are expected to prepare their students for
industrial attachment orientation programme immediately before commencement of
attachments; pay adequate and regular visits to students during attachment with a
view to providing effective supervision and guidance; and examine students’ pract ical
assignment and sign their logbooks during such visits by the Institution based
supervisor. They are also expected to submit returns of disbursement of funds in
received in respect of SIWES to the ITF, complete and return to the ITF at the end of

2
the programme evaluation form (ITF FORM 8) in respect of all students who
participated in the scheme
ii. Employers: The employers are to work out relevant industrial attachment
programmes with institutions; ensuring that attachment programme exposes students
to real life working situations; and inspect and countersign students logbooks on
weekly basis and make comments where necessary. They are to pay students
allowances and when due for every month completed and submit to the ITF monthly
returns of actual amounts disbursed, and complete the end of the programme
evaluation form (ITF FORM 8) in respect of all students who served in the
organization.
iii. Students: As for students on attachment, they are expected to keep standard logbooks
where they record all training activities and other assignments before submitting it to
the ITF for approval.
iv. National Universities Commission: - The NUC is expected to evolve minimum
practical training program for supervision of industrial attachment, vet all programme
and placement lists submitted by the Institutions before resubmitting them to the ITF
for approval.
Vision Statement: to be the foremost skills training and development organization in
Nigeria and one of the best in the world.
Mission Statement: to set and regulate training standards and offer direct training
interventions in industrial and commercial skills training and development, using a
corps of highly competent professional staff, modern techniques and technology.

3
1.2 Objectives of SIWES
Objectives of SIWES are as follows:
1. To provide opportunities for the students to be involved in the practical aspects
of their disciplines.
2. To prepare students for industrial working environments they are likely to meet
after graduation.
3. To expose students to latest developments and technological innovations in their
chosen professions.
4. To merge their acquired classroom basic theoretical knowledge with industrial
application and relevance.
5. To foster/establish entrepreneurial ability/capacity among students.
6. To expose students to life at the labour market.
7. To contribute to the nation manpower development.
8. To give room for an opportunity to learn how to write field report and acquire a
good sense of interaction among people.
9. To promote technological advancement in Nigeria.
10. To provide students with an opportunity to apply their knowledge in real work
situation there by bridging the gap between theory and actual practice.
11. To expose students to work methods and techniques in handling equipment and
machineries that may not be available in educational institutions.
12. To prepare students for the working situation they are to meet after graduation.
13. To provide an avenue for student’s in institutions of Higher learning to acquire
industrial skills and experience in their course of study.
1.3 Benefits of Student Industrial Work Experience Scheme {SIWES}
The benefits of Students’ Industrial Work Experience Scheme {SIWES} are
It gives opportunity for the student to have knowledge on the practical aspect of
his/her chosen profession.
It provides opportunity for the student to interact with the people that have more
understanding in that profession such as the junior interment and serine
professional personnel in the industry.
4
To make students learn how to manage the work environment effectively and to
increase their interactive skills with colleagues, subordinates, superiors and
clients.
To make students aware of work related problems and learn how to cope
positively in difficult situations.
To make students to be aware and familiar with the industrial set up thereby
making them to know their roles in industrial and national development process.
To get a feel of the working environment.
To establish a relatively uniform national vocation and apprenticeship training
scheme in the country.
1.4 Aim of Report
To put down in writing the record of the training experience gotten from Lagos
State Materials Testing Laboratory.
It provides an opportunity for the students to interact with junior, immediate and
senior professional staffs in the industry.
To demonstrate my development of practical and professional skills through
technique experience and application of theoretical knowledge.
To provide the practical method of performing professional function to student in
tertiary institution.
It provides the opportunity of being familiarized and exposed to the mode of
work, handling of relevant machines and equipments available in their discipline.
It’s also to train me in effective writing as a preparation for my final year project.
1.5 Scope of the Report
The objective of this report is to present, in details, the various activities carried out at
Lagos State Materials Testing Laboratory (LSMTL) from JULY 2015 to
NOVEMBER 2015. It also explains the general theoretical background knowledge
acquired about the various aspects of Geotechnical Engineering while undergoing the
SIWES programme.
It aims at summarizing and presenting the daily practical skills acquired during the
training period. The theoretical skill learned from school served as a foundation.

5
Some of the skills built upon are the conduction of different laboratory tests for
building and road construction works, in-situ test for soil, collection of concrete
samples for strength test etc. All these are written about in this report.

6
CHAPTER TWO 2.0
2.0 COMPANY’S PROFILE
2.1 Lagos State Materials Testing Laboratory (LSMTL)
LSMTL is a unique and advanced civil engineering materials testing laboratory that
meets the quality control needed in the building industry in Lagos state and Nigeria as
a whole. Over the years, they have attained a high reputation in quality service
delivery and customer satisfaction. They are known to provide concise, independent
and unbiased report in building and structural testing. Its head office is located at
Public Works Corporation (PWC) yard, Lagos-Ibadan expressway, Ojodu Berger,
Lagos state.
2.2 Brief History of LSMTL
Lagos State Materials Testing came into existence on the 16th
of October, 2007 by the
enactment of the Building and Civil Engineering (Construction) Materials Quality
Control Law, as contained in the official Gazette, No 23 of 26th of May, 2006 of the
Lagos State Government. It was formed by a team of ten (10) passionate personnel
dedicated to excellence in quality control of buildings in Nigeria. This action was
taken in order to curb the avoidable loss of lives and properties that follow frequent
incidence of building collapse and structural failures in Lagos state and Nigeria at
large.
The founding members of LSMTL include Engr. Machintosh (former distributor and
maintenance engineer of engineering equipment), Engr. A.C. Apata (former Quality
Control officer NNPC), Engr. Abisogun (former civil engineer Julius Berger), Mr. A.
Muyiwa (former Administration officer, Lagos State Transportation Management
Authority (LASTMA), just to mention but a few.
2.3 Geotechnical Industry In Nigeria
The study of geotechnical engineering is as old as the study of engineering geology
itself, which dates back to as early as the 1980’s in Nigeria. Geotechnical engineering
is the application of scientific methods and engineering principles to the acquisition,
interpretation and use of the materials of the earth’s crust for the solution of
7
engineering problems. It embraces the fields of soil and rock mechanics, civil
engineering, geology and geophysics.
Due to the recent collapse of structures all over the world, geotechnical engineering as
become more needed than before. This has pushed the boundary of research in this
field further in many nations across the world and in Nigeria.
Structural collapse occurs all over the world, but the rate of occurrence in Nigeria is
beyond bound. In 2006 alone, no fewer than thirteen of such cases were recorded in
Lagos State alone while statistics of the previous and subsequent years were not better
off either. The cost of building collapse in terms of human lives, economic waste, loss
of investment, jobs, income, etc., are of unmeasured account. This prompted the
enactment of the Building and Civil Engineering (Construction) Materials Quality
Control Law on the 26th
of May, 2006 in No 23 of the official Gazette of Lagos State
Government. Every built structure is expected to satisfy the functional objectives of
safety, serviceability and economy.
2.4 Vision and Mission Statements
The LSMTL’s vision and mission statements are inspirational, clear, memorable and
concise.
Vision Statement
To become an indisputable leader in quality control, assurance and laboratory
tests for all Building and Civil Engineering materials and structures in the nation
and Lagos state in particular.
Mission Statement
To maintain quality control and assurance for all Building and Civil Engineering
materials test and to synergize our effort towards research, development and
formulation of local standard for Building and Civil Engineering construction
industries.
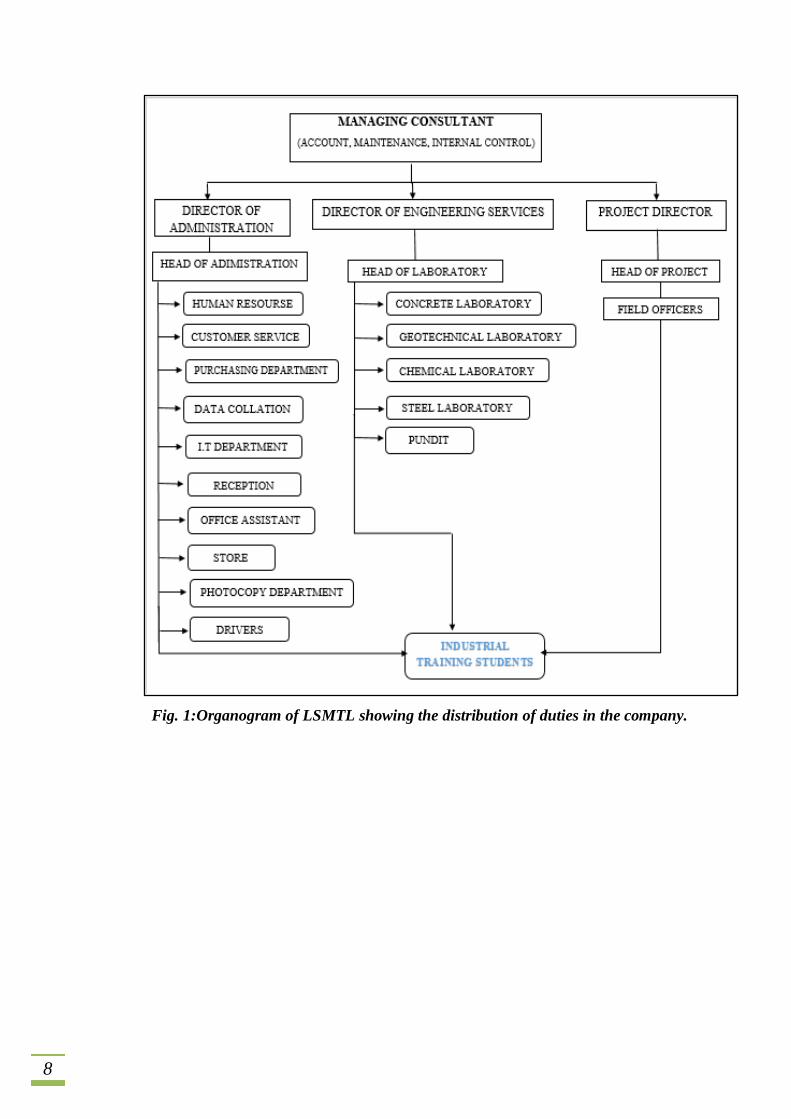
2.5 Organogram
The chart below shows the organization structure of Lagos State Materials Testing
Laboratory and highlights the administrative lines of control in the firm, the position of the
staff is illustrated in the chart also.
8
Fig. 1:Organogram of LSMTL showing the distribution of duties in the company.
9
CHAPTER THREE 3.0
3.0 BASIC THEORY OF WORK DONE
I was exposed to several geotechnical techniques, several of which I will care to
discuss in details.
Sub Soil Site Investigation
Site investigations are carried out to obtain information about subsurface conditions at
the site of proposed construction. It is generally required for engineering projects e.g.
proposed jetty, building, dams, bridges, roads, masts etc.
Subsoil investigation involves delineation of underlying soil material below existing
ground level in terms of strength, texture, structure etc. all these make up the
engineering parameters.
The following methods are generally used;
Geotechnical survey
Geophysical survey
Geotechnical site investigation involves study of soil strata, ground water
conditions to a considerable depth below the surface by means of boreholes,
in-situ and laboratory test on the materials encountered.
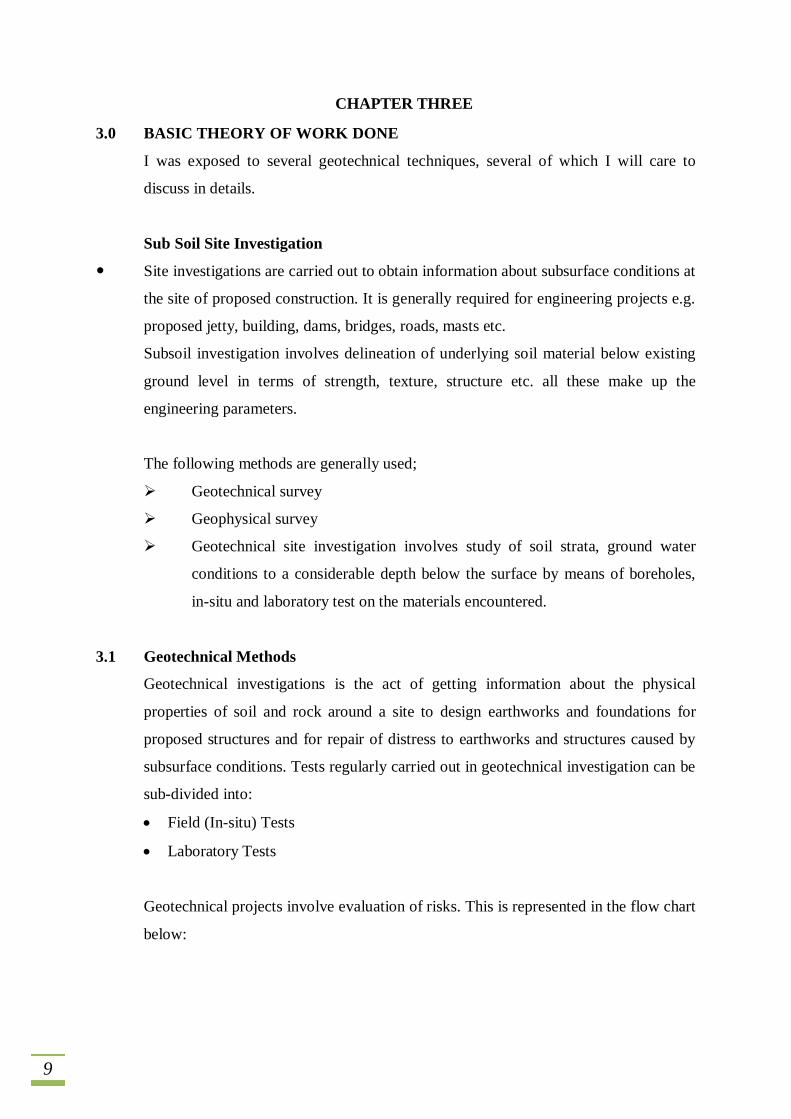
3.1 Geotechnical Methods
Geotechnical investigations is the act of getting information about the physical
properties of soil and rock around a site to design earthworks and foundations for
proposed structures and for repair of distress to earthworks and structures caused by
subsurface conditions. Tests regularly carried out in geotechnical investigation can be
sub-divided into:
Field (In-situ) Tests
Laboratory Tests
Geotechnical projects involve evaluation of risks. This is represented in the flow chart
below:
10
Fig. 2: Flowchart of Geotechnical Site Characterization
11
3.1.1 In-situ Tests
Geotechnical field tests are in-situ operations that are carried out on the site of
investigation. The following are common in-situ tests carried out during my SIWES
program.
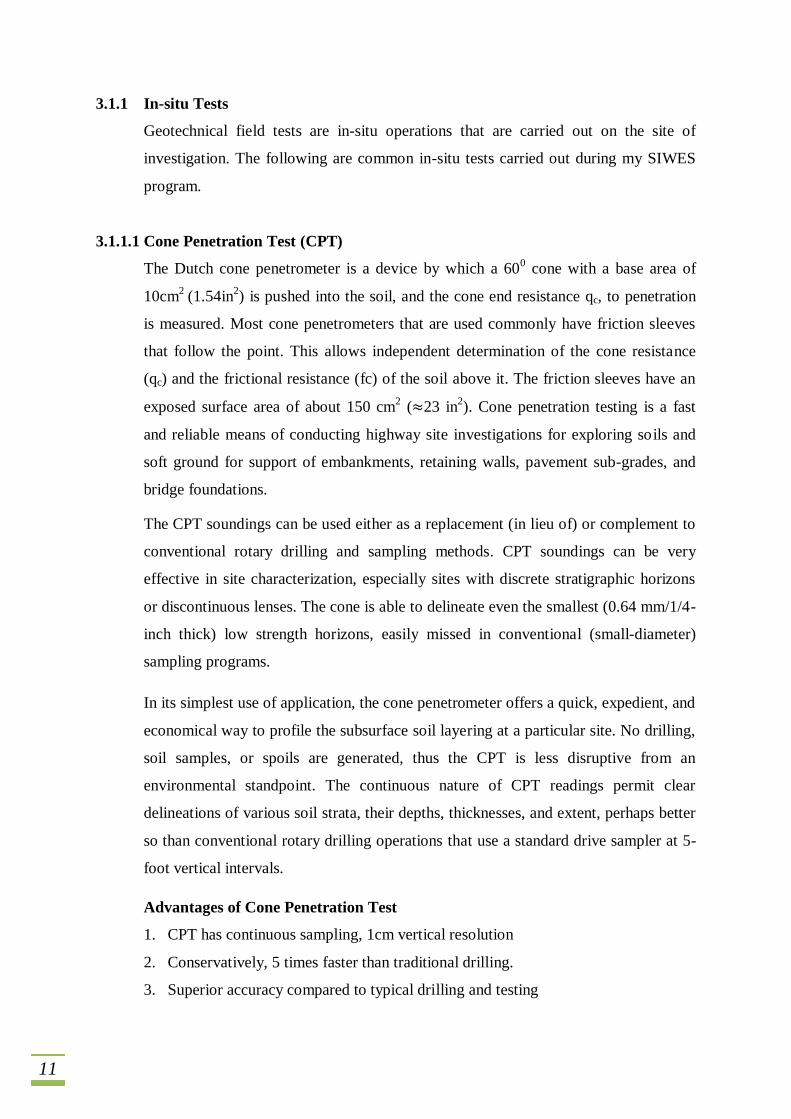
3.1.1.1 Cone Penetration Test (CPT)
The Dutch cone penetrometer is a device by which a 600 cone with a base area of
10cm2
(1.54in2) is pushed into the soil, and the cone end resistance qc, to penetration
is measured. Most cone penetrometers that are used commonly have friction sleeves
that follow the point. This allows independent determination of the cone resistance
(qc) and the frictional resistance (fc) of the soil above it. The friction sleeves have an
exposed surface area of about 150 cm2 ( 23 in
2). Cone penetration testing is a fast
and reliable means of conducting highway site investigations for exploring soils and
soft ground for support of embankments, retaining walls, pavement sub-grades, and
bridge foundations.
The CPT soundings can be used either as a replacement (in lieu of) or complement to
conventional rotary drilling and sampling methods. CPT soundings can be very
effective in site characterization, especially sites with discrete stratigraphic horizons
or discontinuous lenses. The cone is able to delineate even the smallest (0.64 mm/1/4-
inch thick) low strength horizons, easily missed in conventional (small-diameter)
sampling programs.
In its simplest use of application, the cone penetrometer offers a quick, expedient, and
economical way to profile the subsurface soil layering at a particular site. No drilling,
soil samples, or spoils are generated, thus the CPT is less disruptive from an
environmental standpoint. The continuous nature of CPT readings permit clear
delineations of various soil strata, their depths, thicknesses, and extent, perhaps better
so than conventional rotary drilling operations that use a standard drive sampler at 5-
foot vertical intervals.
Advantages of Cone Penetration Test
1. CPT has continuous sampling, 1cm vertical resolution
2. Conservatively, 5 times faster than traditional drilling.
3. Superior accuracy compared to typical drilling and testing
12
4. Predicts many design parameters normally obtained by traditional drilling and
sample testing
5. Laboratory sampling requirements are generally reduced for added cost savings.
6. Strong theoretical basis for interpretation.
Disadvantages of Cone Penetration Test
1. Relatively high capital investment
2. Requires skilled operators
3. No soil sample, during a CPT
4. Penetration can be restricted in gravel/cemented layers
Apparatus
CPT machine (2.5 Ton or 20 Ton), one metre rods and recording sheet
Procedures
1. Set up the CPT machine.
2. Attached the one metre rod to the machine.
3. Wind the handle to allow the cone head penetrate the soil.
4. Take the reading at every 0.25m till the point of refusal.
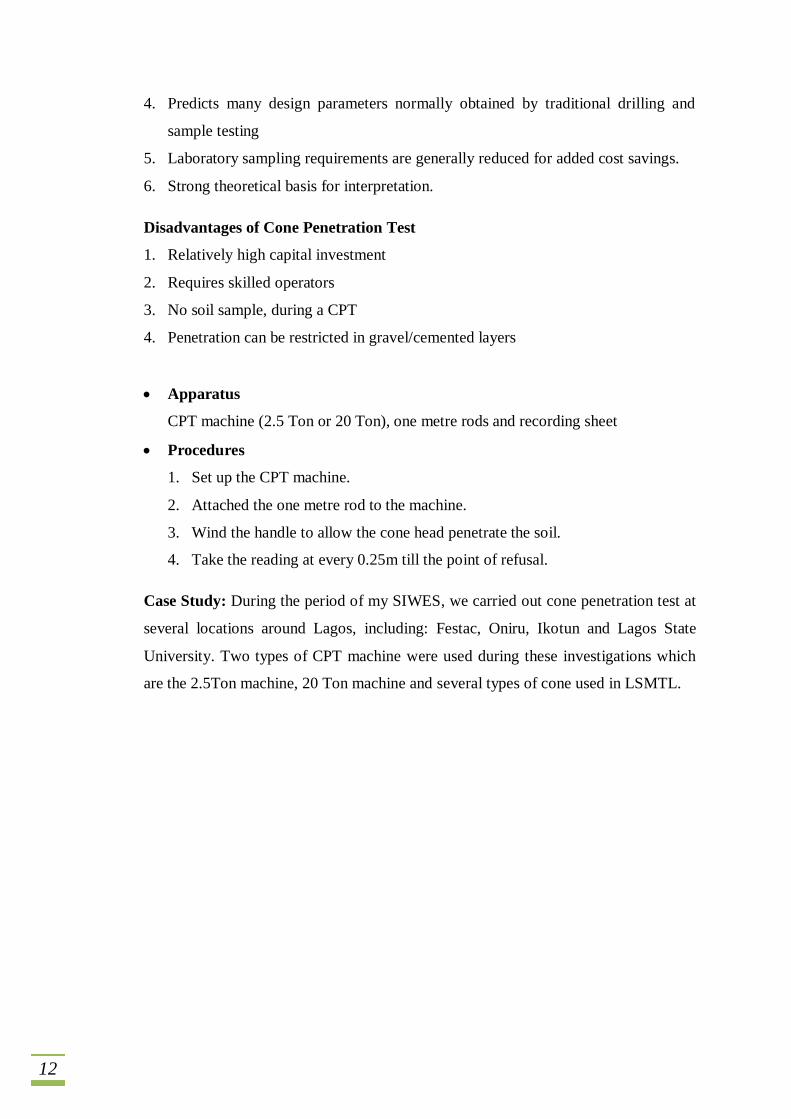
Case Study: During the period of my SIWES, we carried out cone penetration test at
several locations around Lagos, including: Festac, Oniru, Ikotun and Lagos State
University. Two types of CPT machine were used during these investigations which
are the 2.5Ton machine, 20 Ton machine and several types of cone used in LSMTL.
13
Fig. 3: CPT Operation at Lagos State University (LASU) using 2.5 Ton CPT Machine.
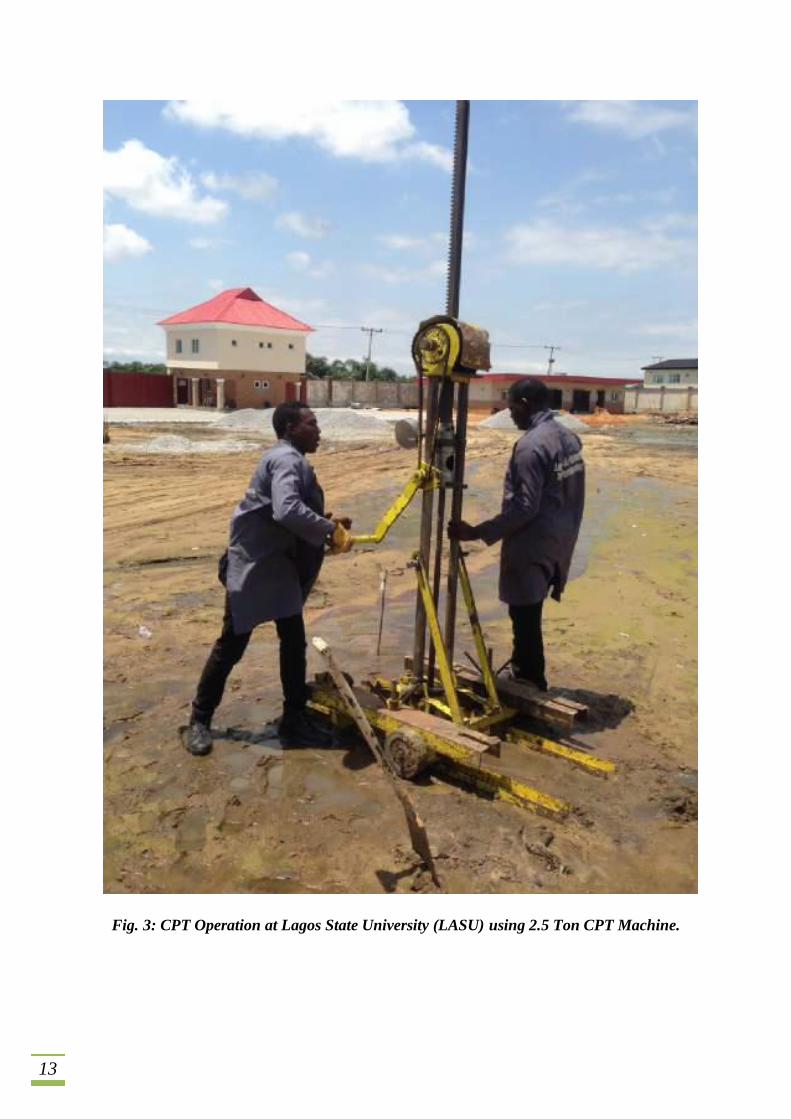
14
Fig. 4: CPT operations using the 20 Ton machine at Synagogue Church of All
Nations (SCOAN).
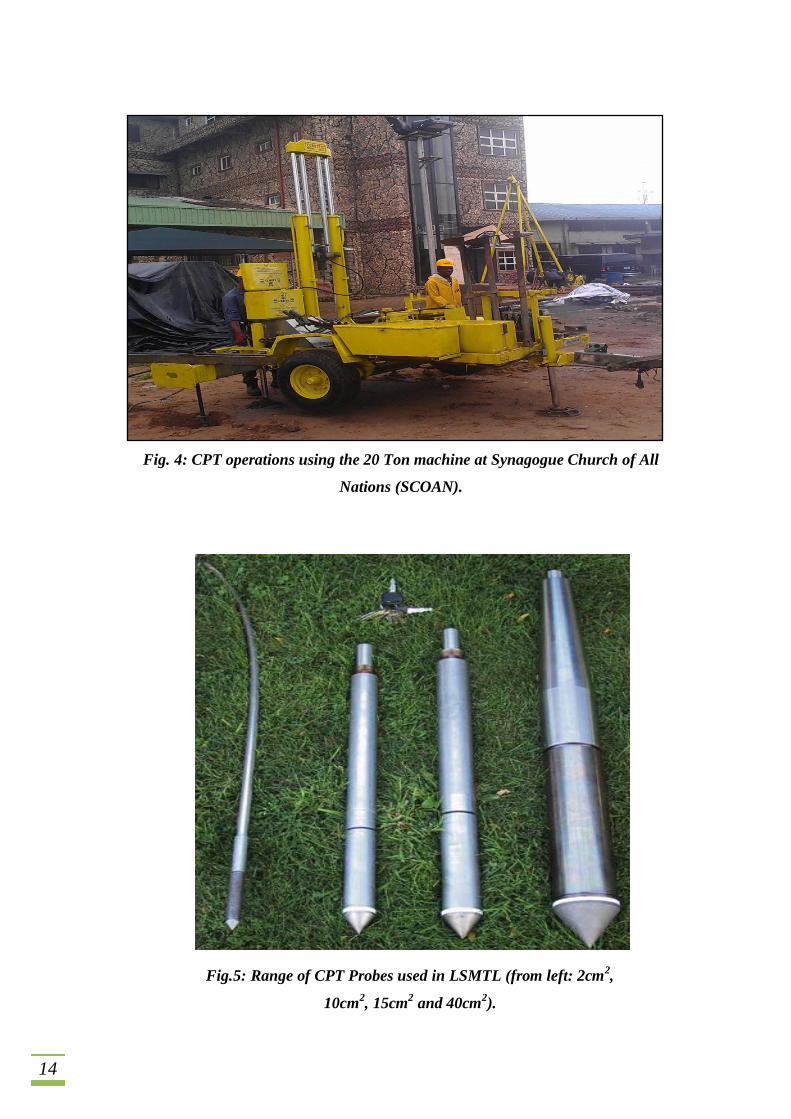
Fig.5: Range of CPT Probes used in LSMTL (from left: 2cm2,
10cm2, 15cm
2 and 40cm
2).
15
3.1.1.2 Standard Penetration Test (SPT):
The Standard Penetration Test (SPT) is a common in situ testing method used to
determine the geotechnical engineering properties of subsurface soils. It is a simple
and inexpensive test to estimate the relative density of soils and approximate shear
strength parameters. The standard penetration test (SPT) involves driving a standard
thick-walled sample tube into the ground at the bottom of a borehole by blows from a
side hammer with standard weight and falling distance. The sample tube is driven
150mm into the ground and then the number of blows needed for the tube to penetrate
each 150mm (6 in) up to a depth of 450mm (18 in) is recorded. The sum of the
number of blows required for the second and third 6 in. of penetration is reported as
SPT blow count value, commonly termed “standard penetration resistance” or N-
value. The N-value provides an indication of the relative density of the subsurface
soil, and it is used in empirical geotechnical correlation to estimate the approximate
shear strength properties of the soils. The standard penetration resistance offers a
gauge of the soil density of soils which are hard to pull up with simply a borehole
sampling approach.
It can provide useful information in very specific types of soil conditions, but not as
accurate as a Cone penetration test (CPT). The operation entails the operator counting
the number of strikes it takes to drive the sample tube 6 inches at a time. Often soil
recovery is poor and counting errors per interval may occur.
Apparatus
SPT machine, sample tube, slide hammer (140 lbs), recording sheet and pen, split
spoon sampler.
Procedures
1. Set up the SPT machine at the desired point of test
2. Place the sample tube on the ground.
3. Hit the slide hammer on the sample tube at a falling distance.
4. When the sample tube is driven 150 mm into the ground, record the number of
blows needed to penetrate that depth.
5. Record the number of blows needed to penetrate each 150mm up to a depth of
450mm.
6. Record the ‘standard penetration resistance’ (N-value) as the sum of the
number of blows required for the second and third 150mm.
16
7. The sample tube is driven up to 450mm deep, and then extracted and soil
sample is pulled from the tube.
8. The borehole is drilled deeper and the test is repeated.
Case Study: Standard Penetration Test (SPT) was carried out at several locations
during the course of my industrial training programme.
3.1.1.3 Soil Sampling
Soil sampling involves extraction of the subsoil for the purpose of laboratory testing.
There are different types of sampler used for this purpose. There are two basic types
of soil sample and it solely depends on the type of sampler used to recover it.
Disturbed samples: are samples in which the natural structure of the soils has
been partly or fully modified. Disturbed samples are obtained by thick wall
samplers or by excavation. Disturbed samples are used in tests for identification
purposes such as natural moisture content, sieve analysis, Atterberg limits, bulk
density and compaction tests.
Undisturbed samples: Undisturbed sample of cohesive soils is taken in-situ, that
is, on the natural structure of the soil with a 100mm (approximate) internal
diameter open tube piston sampler fitted with a cutting shoe. The sampler is
forced into the soil at the bottom of the borehole using the boring rods. After
taking the sample, the drive head and cutting shoe are unscrewed from the sample
tube (U4) and any slurry or disturbed soil is removed from each end. The sample
tube is sealed with wax and ends cap are screwed on. The samples are then
transported to the geotechnical laboratory for examination and testing. Tests
carried out on undisturbed samples are; Atterberg limit, Natural moisture content,
Consolidation and Tri-axial compression tests.
Soil samples can be sampled by Shelby Tube method (U4). The Shelby tube is a
thin-walled steel tube pushed into the soil to be sampled by hydraulic pressure and
spun to shear off the base. Afterwards, the sampler is pulled out and immediately
sealed and taken to the laboratory for testing. This process allows the sample to be
undisturbed as much as possible and is suitable for fine-grained soils that require
strength and consolidation tests. The Shelby tube sampling is the method often
adopted by Lagos State Materials Testing Laboratory (LSMTL), and it is often
done alongside SPT operations.
17
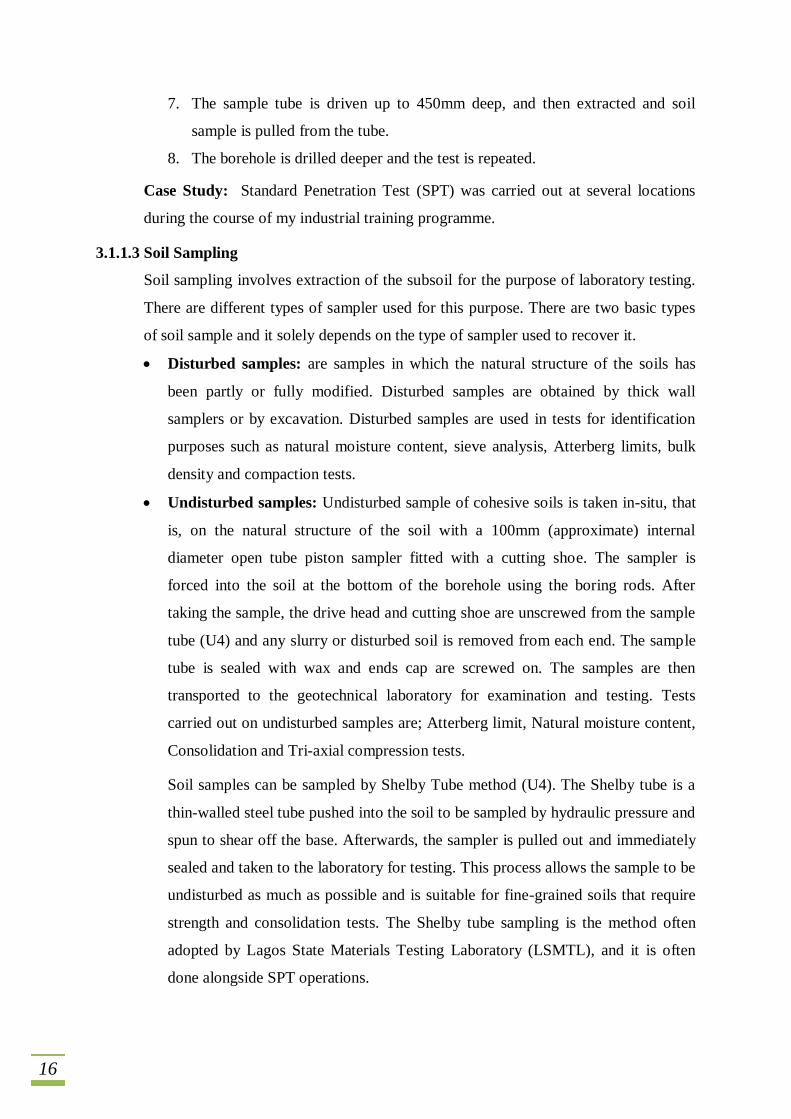
Fig. 6: SPT operation at Proposed Building Development site at Lekki Phase 1.
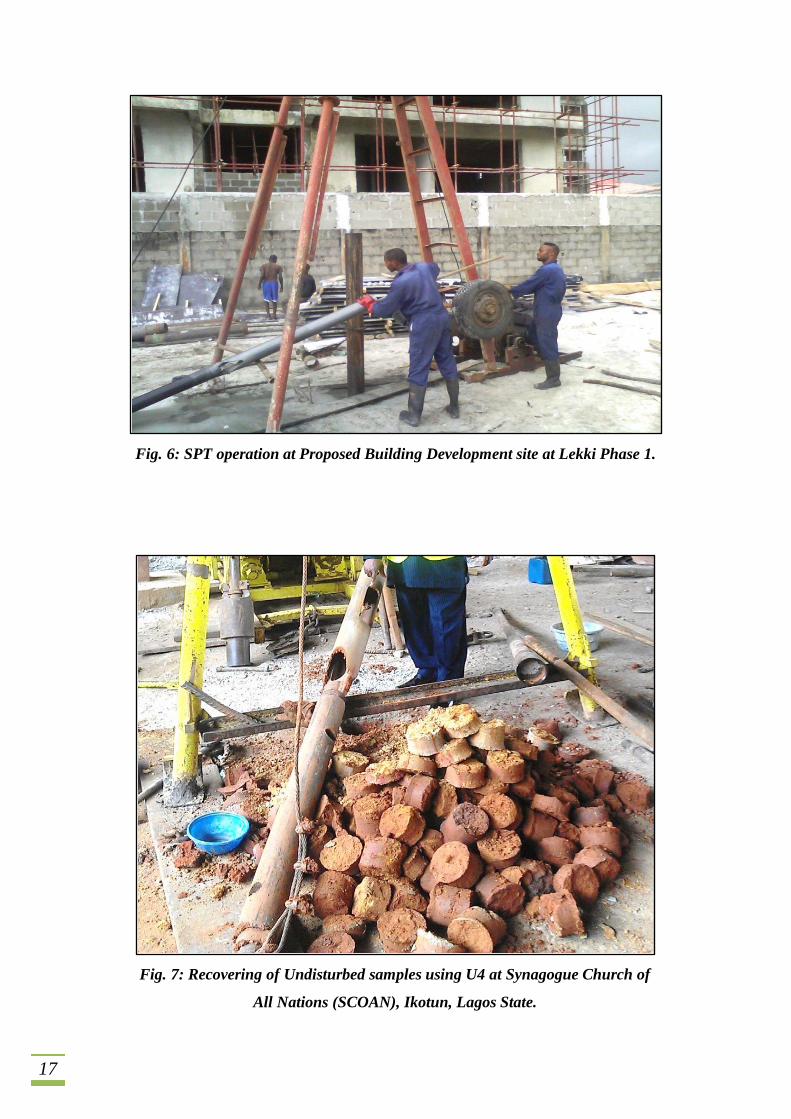
Fig. 7: Recovering of Undisturbed samples using U4 at Synagogue Church of
All Nations (SCOAN), Ikotun, Lagos State.
18
3.1.2 Laboratory Tests:
The Engineering properties of the selected samples are determined in the geotechnical
laboratory. Some of the test carried out on cohesive soils include; Atterberg limit,
Natural moisture content, Compaction, California Bearing Ratio (CBR), Specific
Gravity, etc while on non-cohesive soils include; Sieve analysis, bulk density, etc.
The following laboratory tests are carried out on selected samples recovered from
boreholes:
3.1.2.1 Sieve Analysis
The sieve analysis determines the gradation or the distribution of aggregate particles,
by size, within a given sample in order to determine compliance with design,
production control requirements, and verification specifications. The gradation data
can be used to calculate relationships between various aggregates, check compliance
with such blends, and predict trends during production by plotting gradation curves
graphically.
Since the sieve analysis test cannot guarantee accurate gradation of materials passing
the 75µm sieve, the hydrometer test is used to determine the gradations of materials
finer than 75µm. The procedure is based on the sedimentation of soil grains in water.
It is expressed by Stokes Law, which says the velocity of the soil sedimentation is
based on the soil particles shape, size, weight, and viscosity of the water. Thus, the
hydrometer analysis measures the change in specific gravity of a soil-water
suspension as soil particles settle out over time.
Apparatus
A set of fine IS Sieves of sizes - 2mm, 600µm, 425µm, 212µm and 75µm, a set of
coarse IS Sieves of sizes - 20mm, 10mm and 4.75mm, Weighing balance, with an
accuracy of 0.1% of the weight of sample, Oven with thermostatic control,
Mechanical shaker, Mortar with rubber pestle, Brushes, Trays.
Procedures
1. 60g of the oven – dried sample was weighed and transferred into a dish. 25ml
of sodium hexametaphosphate solution and 200ml of water was added to
cover the soil mixture. A mechanical mixer mixes the solution for at least 20
minutes.

19
2. The test sample is then washed through a 75µm sieve carefully using tap water
until the water is clear; this is done carefully to avoid damage to the sieve or
loss of soil by splashing material out of the sieve.
3. The residue is carefully poured into the pan using back washing and allowed
to sit for a short period of time until the top of the suspension becomes clear, I
poured off as much of the clear top water as possible, then I placed the pan
and remaining soil water suspension in the oven for drying for 24-hours. The
oven- dried residue at the end of 24-hours was weighed and transferred to the
topmost sieve. Lateral and vertical motions accompanied by a jarring action as
to keep soil moving continuously over the sieve surface for 10 minutes.
4. After this, each sieve was shaken separately over a clean tray until no more
material passes. The material retained in the tray was returned in the tray was
returned to the next smaller sieve, which is in turn shaken. The material
retained on each sieve was weighed and the amount recorded.
Some sieve analysis apparatus are shown in Fig. 7
3.1.2.2 Natural Moisture Content
The moisture content is the ratio of the amount of water to the amount of dry soil. It is
the most common way of expressing the amount of water present in a soil. It is partly
a function of the availability of water. The aim of the test is to determine the moisture
content of the natural soil as a percentage of its dryness. The moisture content is
determined in the laboratory either by oven-drying or air-drying, but it has become a
standard practice to oven dry at 105oC.
Natural Moisture Content ( ) =
(2.1)
The percentage of moisture in the soil and the degree of saturation are both of
significance in describing the soil fabric and nature of the voids which indicates the
useful behavior of the soil as it affects almost every mechanical property of the soil.
20
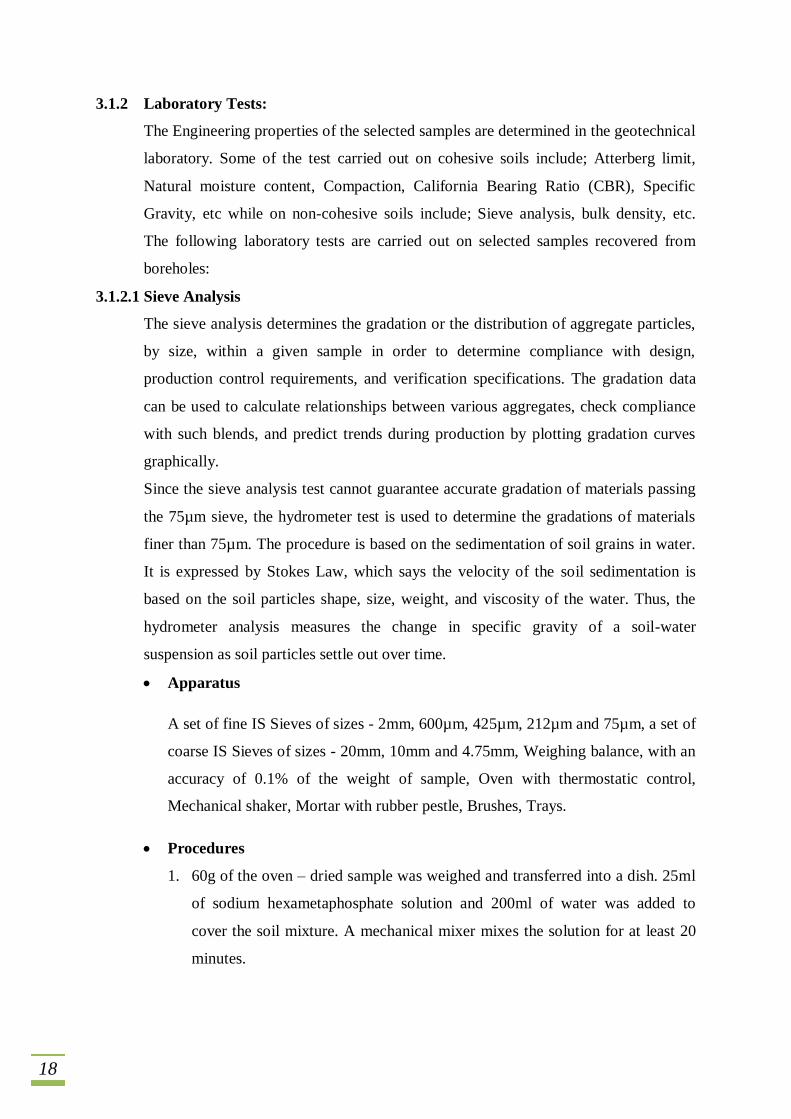
Fig. 8: Sieve Analysis Apparatus (oven, weighing
balance, sieve mechanical shaker, moisture content
can respectively).
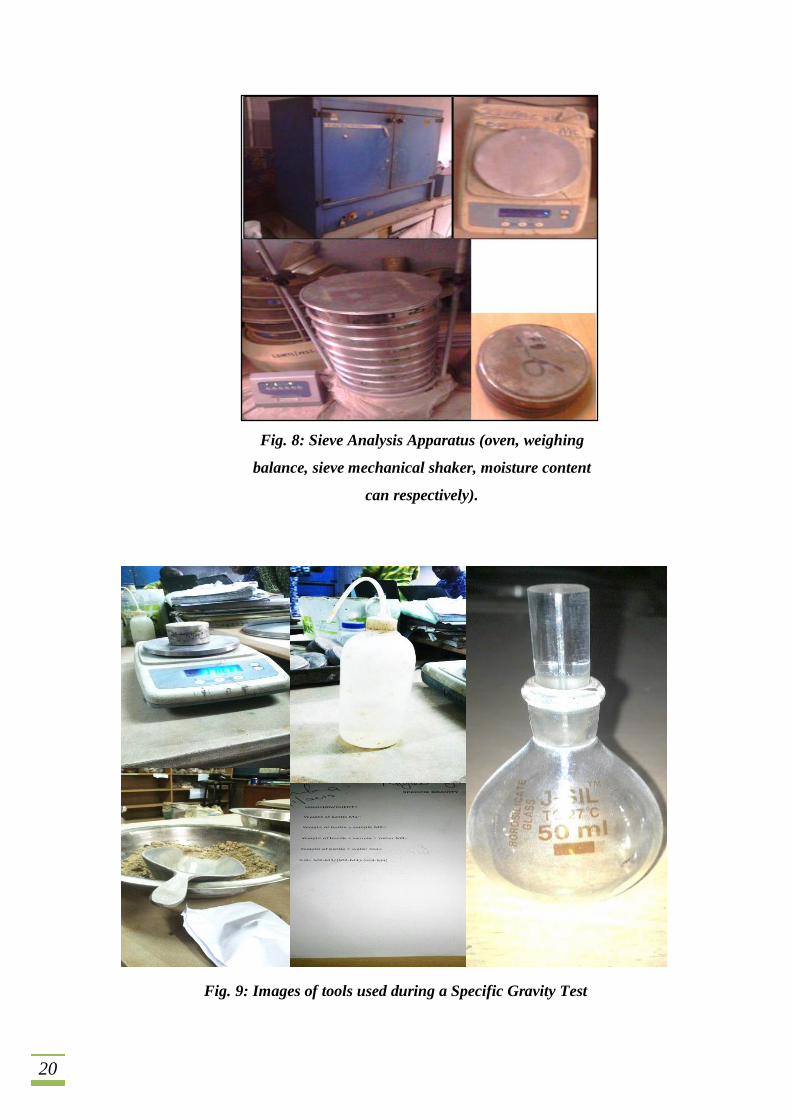
Fig. 9: Images of tools used during a Specific Gravity Test
21
Apparatus
A thermostatically controlled drying oven capable of maintaining a temperature of
105oC, moisture content tins, a balance readable accurate to 0.1g and a scoop
Procedures
1. The containers were cleaned, dried, weighed to the nearest 0.1g and recorded as
mass .
2. Samples of about 200g were crumbled, placed loosely in each of the containers
and covered with their lids.
3. The containers and their contents were weighed to the nearest 0.1g and recorded
as .
4. The lids were removed and the container and its contents were placed in the oven
and dried for about 24 hours. (The lids were not replaced when the samples were
placed in the oven).
5. After drying, the lids were replaced and the whole assemble allowed to cool.
6. The container and contents were then weighed to the nearest 0.1gand recorded
as .
7. The moisture content of the soil “w” is then computed as a percentage of the dry
soil mass.
3.1.2.3 Specific Gravity Test
The specific gravity of soils is the ratio of the weight in air of a given volume of soil
particles to the weight in air of an equal volume of distilled water at a stated
temperature usually 40oC. It is usually used in relating a weight of soil to its volume.
The relationship below is used to determine specific gravity.
–
(2.2)
Where:
= weight of density bottle;
= weight of bottle and dry soil
= weight of bottle, soil and water;
= weight of bottle when full of water only
The specific gravity is used in the computation of many laboratory tests on soils. In
22
particular, it is required in the calculation of the void ratios of soil specimen in the
determination of the moisture content of a soil by the pycnometer method.
Apparatus
Soil sample, specific gravity bottles, distilled water, weighing balance and electric
oven, Fig. 8.
Procedures
1. Oven dry the soil sample.
2. Record the weight of the empty specific gravity bottle.
3. Record the weight of soil + bottle.
4. Record the weight of water + bottle.
5. Record the weight of soil + water + bottle.
6. Rinse the specific gravity bottle.
7. Calculate the specific gravity of the soil using the appropriate formulae.
3.1.2.4 Atterberg Limits Test
The Atterberg limits are a basic measure of the nature of a fine-grained soil sample.
As water is added to a dry plastic soil, the remolded mixture will eventually have the
characteristics of a liquid. Soil samples occur in four different states depending on the
water content of the soil: solid, semi-solid, plastic and liquid.
The consistency and behaviour of each soil differs in each state and also its
engineering properties. The Atterberg limits can be used to distinguish the boundary
between each state based on their water content. It can distinguish between silt and
clay, and between different types of silt and clays. These limits were created by Albert
Atterberg and were later refined by Arthur Casagrande. The Atterberg Limits are
defined by Liquid Limit, Plastic Limits, Shrinkage Limit, and Plasticity Index. A
consistency diagram relating water content and the various Atterberg limits is shown
below
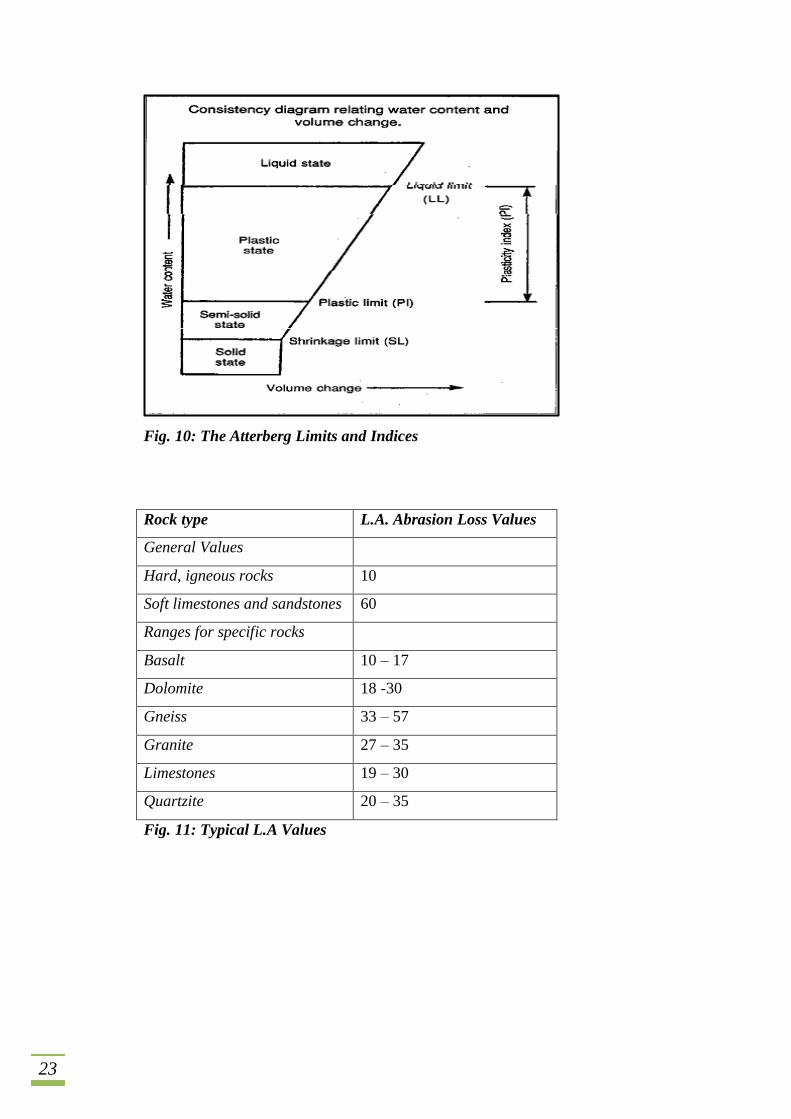
23
Fig. 10: The Atterberg Limits and Indices
Rock type L.A. Abrasion Loss Values
General Values
Hard, igneous rocks 10
Soft limestones and sandstones 60
Ranges for specific rocks
Basalt 10 – 17
Dolomite 18 -30
Gneiss 33 – 57
Granite 27 – 35
Limestones 19 – 30
Quartzite 20 – 35
Fig. 11: Typical L.A Values
24
3.1.2.4.1 Liquid Limit Test
The liquid limit (LL) is the minimum moisture content at which a soil passes from a
plastic to a liquid state. The test is made by determining, for a soil containing different
moisture contents, the number of blows of a standard cup at which two halves of a
soil cake will flow together for a distance of 1.3centimetre. A graph of the soil
moisture content is plotted against the number of blows. Hence, the moisture content
at which the plotted line crosses the 25-blow line is the liquid limit.
Apparatus
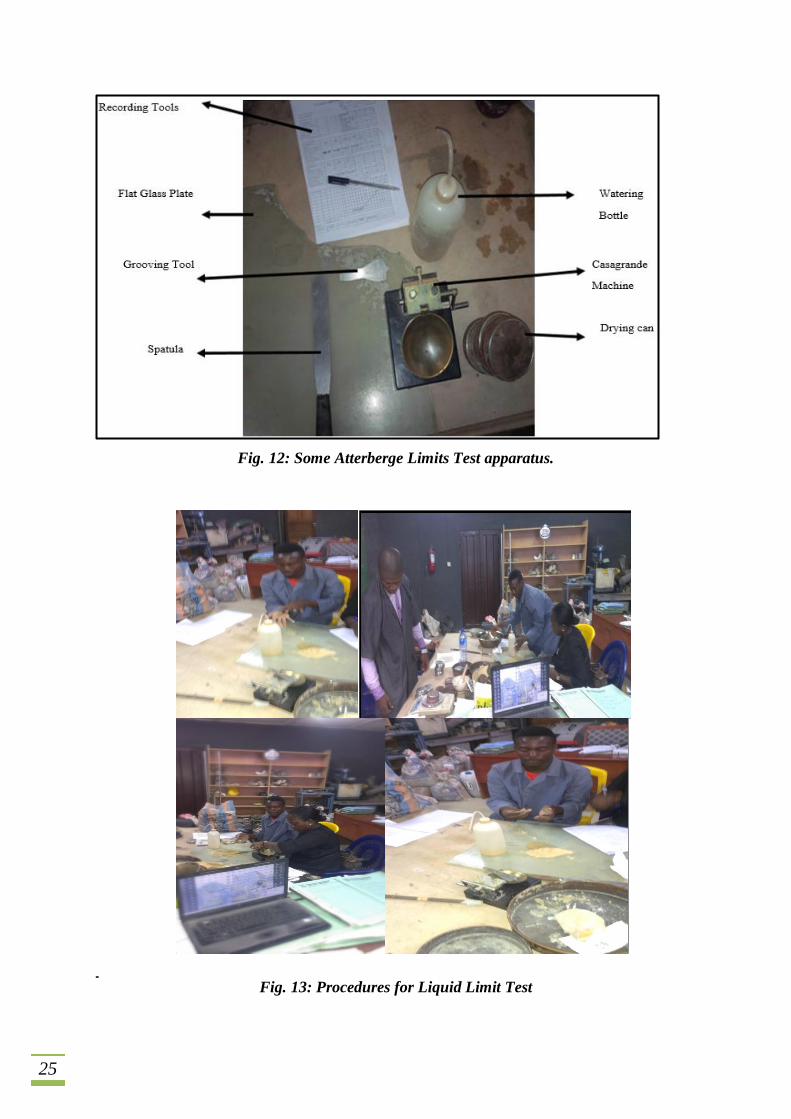
Mechanical Liquid Limit device (Casagrande machine), grooving tool, porcelain
evaporating dish, flat glass plate, spatula, palette knives, balance, oven, wash
bottle, containers and distilled water. Some as shown in Figure 2.10.
Procedures
1. Soil sample passing through 425µm sieve is taken.
2. Weigh 20g of the sample and air-dried.
3. The air-dried sample is mixed with water and kneaded until uniformity is
achieved.
4. The soil paste is placed in the Liquid Limit cup of the Casagrande machine,
and leveled off with the spatula.
5. A clean and sharp groove is cut in the middle by means of a grooving tool.
6. The crank is rotated and the number of blows required to make the halves of
the soil pat separated by groove meet for a length of about 12 mm is counted.
7. A small quantity of the soil paste is taken to determine its moisture content.
8. The entire steps are repeated at different moisture contents.
9. A graph of the soil moisture content is plotted against the number of blows.
10. The moisture content at which the plotted line crosses the 25-blow line is the
liquid limit.
25
Fig. 12: Some Atterberge Limits Test apparatus.
GGB
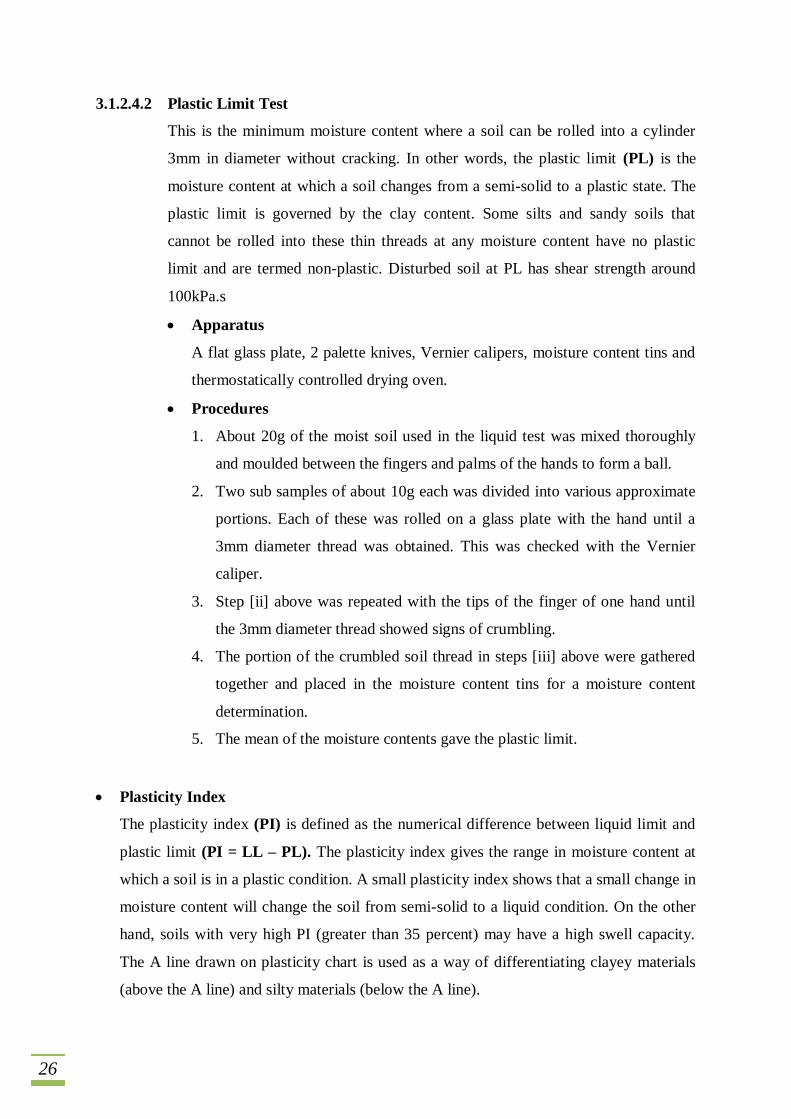
Fig. 13: Procedures for Liquid Limit Test
26
3.1.2.4.2 Plastic Limit Test
This is the minimum moisture content where a soil can be rolled into a cylinder
3mm in diameter without cracking. In other words, the plastic limit (PL) is the
moisture content at which a soil changes from a semi-solid to a plastic state. The
plastic limit is governed by the clay content. Some silts and sandy soils that
cannot be rolled into these thin threads at any moisture content have no plastic
limit and are termed non-plastic. Disturbed soil at PL has shear strength around
100kPa.s
Apparatus
A flat glass plate, 2 palette knives, Vernier calipers, moisture content tins and
thermostatically controlled drying oven.
Procedures
1. About 20g of the moist soil used in the liquid test was mixed thoroughly
and moulded between the fingers and palms of the hands to form a ball.
2. Two sub samples of about 10g each was divided into various approximate
portions. Each of these was rolled on a glass plate with the hand until a
3mm diameter thread was obtained. This was checked with the Vernier
caliper.
3. Step [ii] above was repeated with the tips of the finger of one hand until
the 3mm diameter thread showed signs of crumbling.
4. The portion of the crumbled soil thread in steps [iii] above were gathered
together and placed in the moisture content tins for a moisture content
determination.
5. The mean of the moisture contents gave the plastic limit.
Plasticity Index
The plasticity index (PI) is defined as the numerical difference between liquid limit and
plastic limit (PI = LL – PL). The plasticity index gives the range in moisture content at
which a soil is in a plastic condition. A small plasticity index shows that a small change in
moisture content will change the soil from semi-solid to a liquid condition. On the other
hand, soils with very high PI (greater than 35 percent) may have a high swell capacity.
The A line drawn on plasticity chart is used as a way of differentiating clayey materials
(above the A line) and silty materials (below the A line).
27
3.1.2.4.3 Shrinkage Limit Test
The shrinkage limit (SL) is the water content where further loss of moisture will
not result in any more volume reduction. The shrinkage limit is much less
commonly used than the plastic limits. It is the minimum water content.
Apparatus
Two palette knives, a flat glass plate, a brass mould, grease or oil, a drying
oven and a metre rule.
Procedures
1. The mould was cleaned thoroughly. A thin film of oil was applied to the
inner walls of the mould.
2. A portion of the moist sample was obtained from the liquid limit test was
placed in the mould such that it was slightly proud of the sides of the
mould. The mould was gently jarred to remove any air pockets in the
mixture and then levelled off along the top of the mould with a palette
knife.
3. The mould was placed in the drying oven at 105oC for 24 hours.
4. The linear shrinkage of the soil was calculated as a percentage of the
original of the specimen using the equation, percentage of linear
shrinkage.
3.1.2.5 Compaction Test
Soil compaction is act of mechanically increasing the density of soil. Soil compaction
of loose soil is important before construction of highway embankments, earth dams
and many other engineering structures, in order to improve their strength by
increasing their unit weight. Soil can be formed in a place or deposited by various
forces of nature, such as glaciers, wind, lakes and rivers, these are called soil forming
agent. The following are important factors in soil compaction:
1. Soil type and gradation
2. Soil moisture content
3. Compaction effort required
28
Soil Type and Gradation
Every soil behaves differently when it comes to maximum moisture content and
optimum density. Each soil type has its own unique requirements and controls both in
the field and for testing purposes. Soil types are commonly classified by grain size,
determined by passing the soil through a series of sieves to screen to separate the
different grain sizes. There are three basic soil groups:
1. Cohesive
2. Granular
3. Organic (not suitable for compaction)
Cohesive Soils
Cohesive soils have the smallest particles; they are dense and tightly bound together by
molecular attraction. They are plastic when wet and can be molded, but become very hard
when dry. There grains cannot be seen with the naked eye, and they feel greasy and
smooth when rubbed between fingers. Clay and silt are good examples of cohesive soils.
Silt has a noticeably lower cohesion than clay. However, silt is still heavily reliant on
water content.
Granular Soils
Granular soils range in particle size from 0.003” to 0.08” (sand) and 0.08” to 1.0” (fine to
medium gravel). Sand and gravel obtain maximum density in either a fully dry or
saturated state. Granular soils are known for their water-draining properties. Coarse
grains can be seen, and feels gritty when rubbed between the fingers.
Effect of Moisture on Soil
The response of soil to moisture is very important. Moisture acts as lubricant within soil
particles, sliding the particles together. Moisture content of the soil is vital to proper
compaction. Too little moisture means inadequate compaction, that is, the particles will
not be able to move past each other to achieve density. While too much moisture leaves
water-filled voids causing weak load-bearing ability.
29
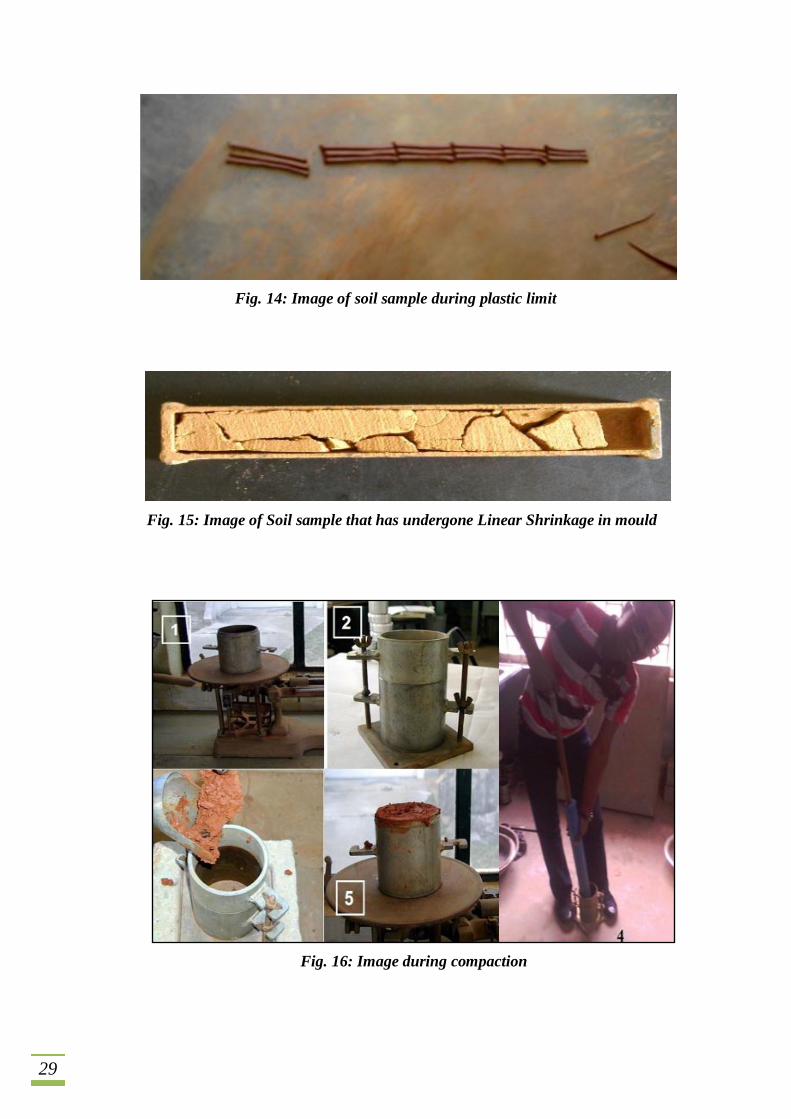
Fig. 14: Image of soil sample during plastic limit
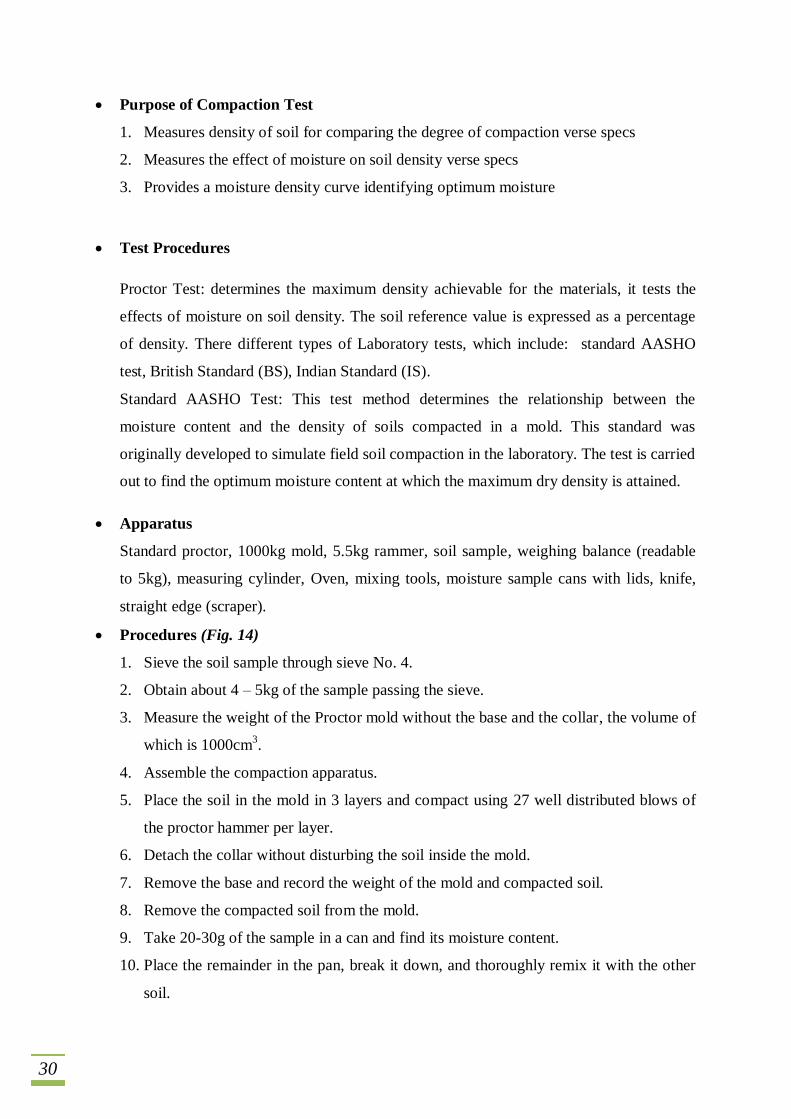
Fig. 15: Image of Soil sample that has undergone Linear Shrinkage in mould
Fig. 16: Image during compaction
30
Purpose of Compaction Test
1. Measures density of soil for comparing the degree of compaction verse specs
2. Measures the effect of moisture on soil density verse specs
3. Provides a moisture density curve identifying optimum moisture
Test Procedures
Proctor Test: determines the maximum density achievable for the materials, it tests the
effects of moisture on soil density. The soil reference value is expressed as a percentage
of density. There different types of Laboratory tests, which include: standard AASHO
test, British Standard (BS), Indian Standard (IS).
Standard AASHO Test: This test method determines the relationship between the
moisture content and the density of soils compacted in a mold. This standard was
originally developed to simulate field soil compaction in the laboratory. The test is carried
out to find the optimum moisture content at which the maximum dry density is attained.
Apparatus
Standard proctor, 1000kg mold, 5.5kg rammer, soil sample, weighing balance (readable
to 5kg), measuring cylinder, Oven, mixing tools, moisture sample cans with lids, knife,
straight edge (scraper).
Procedures (Fig. 14)
1. Sieve the soil sample through sieve No. 4.
2. Obtain about 4 – 5kg of the sample passing the sieve.
3. Measure the weight of the Proctor mold without the base and the collar, the volume of
which is 1000cm3.
4. Assemble the compaction apparatus.
5. Place the soil in the mold in 3 layers and compact using 27 well distributed blows of
the proctor hammer per layer.
6. Detach the collar without disturbing the soil inside the mold.
7. Remove the base and record the weight of the mold and compacted soil.
8. Remove the compacted soil from the mold.
9. Take 20-30g of the sample in a can and find its moisture content.
10. Place the remainder in the pan, break it down, and thoroughly remix it with the other
soil.
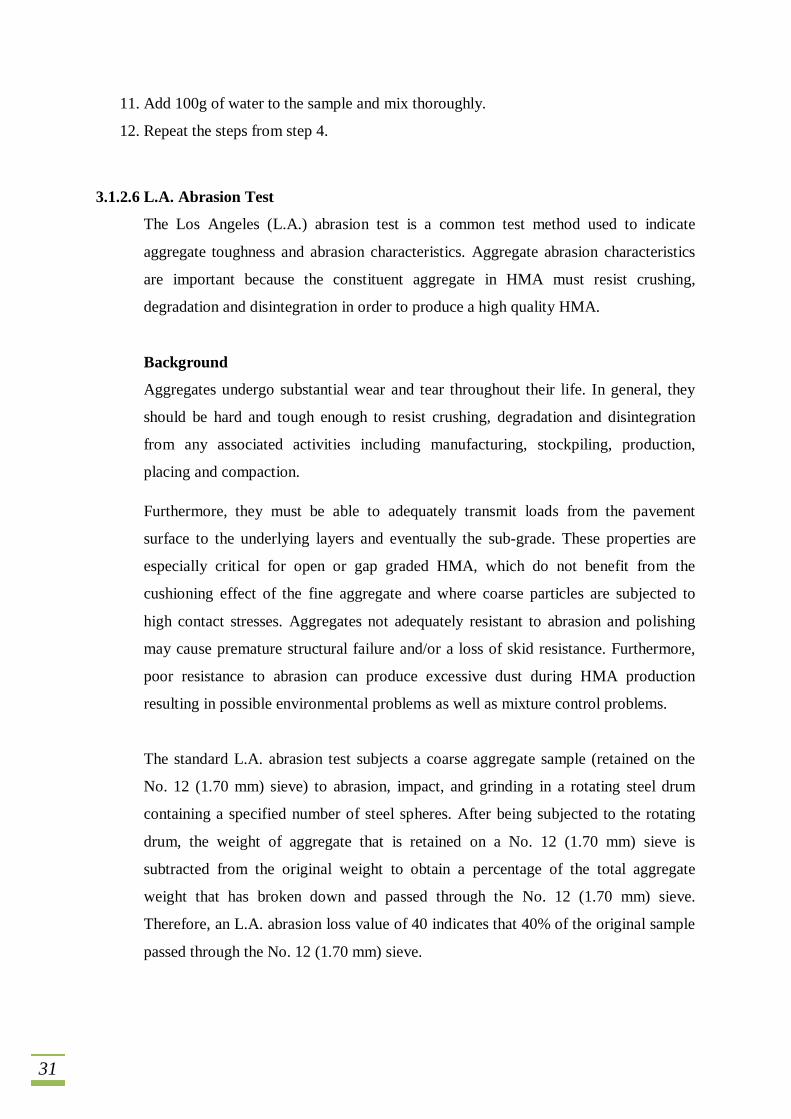
31
11. Add 100g of water to the sample and mix thoroughly.
12. Repeat the steps from step 4.
3.1.2.6 L.A. Abrasion Test
The Los Angeles (L.A.) abrasion test is a common test method used to indicate
aggregate toughness and abrasion characteristics. Aggregate abrasion characteristics
are important because the constituent aggregate in HMA must resist crushing,
degradation and disintegration in order to produce a high quality HMA.
Background
Aggregates undergo substantial wear and tear throughout their life. In general, they
should be hard and tough enough to resist crushing, degradation and disintegration
from any associated activities including manufacturing, stockpiling, production,
placing and compaction.
Furthermore, they must be able to adequately transmit loads from the pavement
surface to the underlying layers and eventually the sub-grade. These properties are
especially critical for open or gap graded HMA, which do not benefit from the
cushioning effect of the fine aggregate and where coarse particles are subjected to
high contact stresses. Aggregates not adequately resistant to abrasion and polishing
may cause premature structural failure and/or a loss of skid resistance. Furthermore,
poor resistance to abrasion can produce excessive dust during HMA production
resulting in possible environmental problems as well as mixture control problems.
The standard L.A. abrasion test subjects a coarse aggregate sample (retained on the
No. 12 (1.70 mm) sieve) to abrasion, impact, and grinding in a rotating steel drum
containing a specified number of steel spheres. After being subjected to the rotating
drum, the weight of aggregate that is retained on a No. 12 (1.70 mm) sieve is
subtracted from the original weight to obtain a percentage of the total aggregate
weight that has broken down and passed through the No. 12 (1.70 mm) sieve.
Therefore, an L.A. abrasion loss value of 40 indicates that 40% of the original sample
passed through the No. 12 (1.70 mm) sieve.

32
Fig. 17: Los Angeles abrasion machine
Figure 18: Steel spheres used in Los Angeles Abrasion Test.
33
Test Concept
The L.A. abrasion test measures the degradation of a coarse aggregate sample that is
placed in a rotating drum with steel spheres. As the drum rotates the aggregate
degrades by abrasion and impact with other aggregate particles and the steel spheres
(called the “charge”). Once the test is complete, the calculated mass of aggregate that
has broken apart to smaller sizes is expressed as a percentage of the total mass of
aggregate. Therefore, lower L.A. abrasion loss values indicate aggregate that is
tougher and more resistant to abrasion.
Test Adequacy
The L.A. Abrasion test is an empirical test; it is not directly related to field
performance of aggregates. Field observations generally do not show a good
relationship between L.A. abrasion values and field performance found that L.A.
abrasion loss was unable to predict field performance. Specifically, the test may not
be satisfactory for some types of aggregates. Some aggregates, such as slag and some
limestones, tend to have high L.A. abrasion loss but perform adequately in the field.
L.A. abrasion loss seems to be reasonable well correlated with dust formation during
handling and HMA production in that aggregates with higher L.A. abrasion loss
values typically generate more of dust.
Basic Procedure
1. Obtain the aggregate sample to be tested, and reduce the sample to adequate size.
2. Sieve the material into individual size fractions, and recombine to one of four
specified grading that most nearly represents the aggregate gradation as received.
Record the total sample mass. The total sample mass should be about 5000 g.
3. Place the sample and the specified number of steel spheres into the drum and
rotate for 500 revolutions at 30 to 33rev/min. The charge required is dependent
upon the grading used.
4. Discharge the material from the drum into a tray.
5. Sieve the finer material on 2.36mm sieve with the retained on the pan.
6. Weigh the mass of the finer particles passing through 2.36mm sieve.
7. Also weigh the mass of the coarser aggregate retained on 2.36 sieve. This gives
the final mass.

34
Parameter Measured
L.A. abrasion loss as a percentage by weight.
Loss = (
) × 100
Where:
Moriginal= original sample mass (g)
Mfinal = final sample mass (g)
3.1.2.7 Aggregate Impact Value Test
This test is done to determine the aggregate impact value of coarse aggregates. The
apparatus used for determining aggregate impact value of coarse aggregates include;
1. Impact testing machine conforming to the British Standard.
2. Sieves of sizes 12.5mm, 10mm, 2.36mm and pan.
3. A cylindrical metal measure of 75mm diameter and depth 50mm.
4. A tamping rod of 10mm circular cross section and 230mm length, rounded at one
end
5. Oven.
6. The sieve shaker.
Preparation of Samples
i. The test samples should conform to the following grading:
Passing through 12.5mm IS sieve
Retained on 10mm IS sieve.
ii. The sample should be oven-dried for 4hrs at a temperature of 100 to 110oC and
cooled.
iii. The measure should be about one-third full with the prepared aggregates and
tamped with 25 strokes of the tamping rod.
A further similar quantity of aggregates should be added and a further tamping of 25
strokes given. The measure should finally be filled to overflow, tamped 25 times and
the surplus aggregates struck off, using a tamping rod as a straight edge.
35
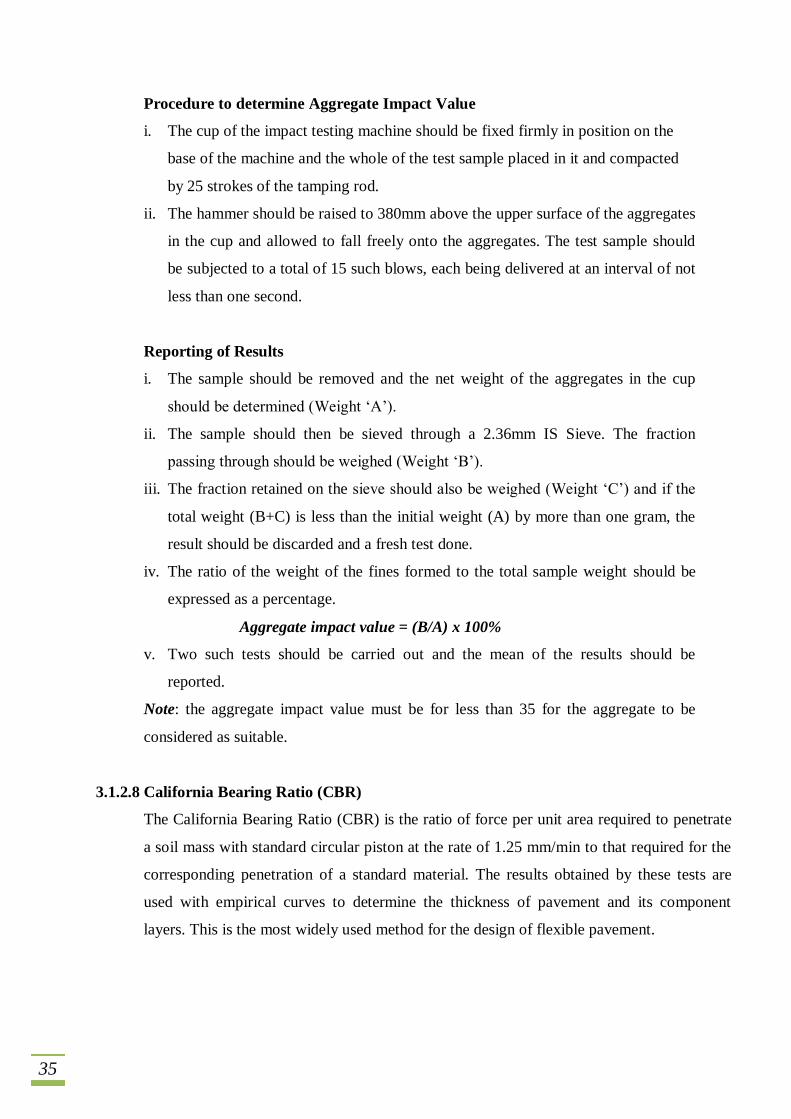
Procedure to determine Aggregate Impact Value
i. The cup of the impact testing machine should be fixed firmly in position on the
base of the machine and the whole of the test sample placed in it and compacted
by 25 strokes of the tamping rod.
ii. The hammer should be raised to 380mm above the upper surface of the aggregates
in the cup and allowed to fall freely onto the aggregates. The test sample should
be subjected to a total of 15 such blows, each being delivered at an interval of not
less than one second.
Reporting of Results
i. The sample should be removed and the net weight of the aggregates in the cup
should be determined (Weight ‘A’).
ii. The sample should then be sieved through a 2.36mm IS Sieve. The fraction
passing through should be weighed (Weight ‘B’).
iii. The fraction retained on the sieve should also be weighed (Weight ‘C’) and if the
total weight (B+C) is less than the initial weight (A) by more than one gram, the
result should be discarded and a fresh test done.
iv. The ratio of the weight of the fines formed to the total sample weight should be
expressed as a percentage.
Aggregate impact value = (B/A) x 100%
v. Two such tests should be carried out and the mean of the results should be
reported.
Note: the aggregate impact value must be for less than 35 for the aggregate to be
considered as suitable.
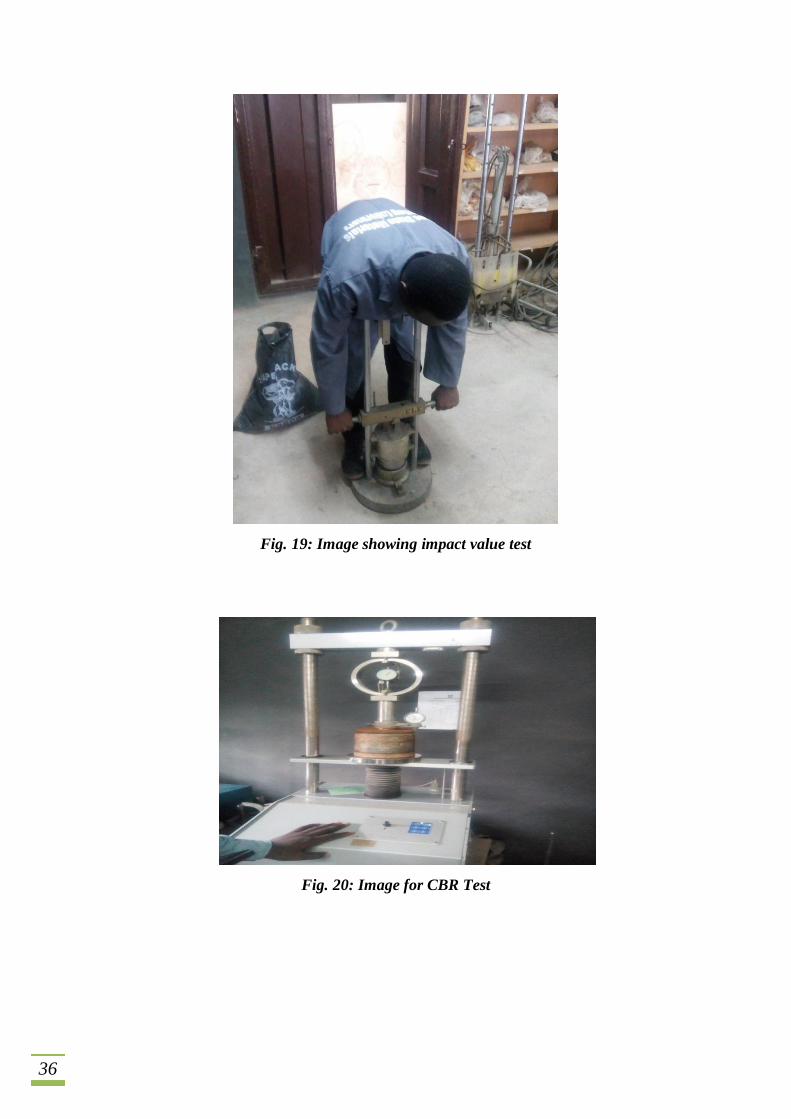
3.1.2.8 California Bearing Ratio (CBR)
The California Bearing Ratio (CBR) is the ratio of force per unit area required to penetrate
a soil mass with standard circular piston at the rate of 1.25 mm/min to that required for the
corresponding penetration of a standard material. The results obtained by these tests are
used with empirical curves to determine the thickness of pavement and its component
layers. This is the most widely used method for the design of flexible pavement.
36
Fig. 19: Image showing impact value test
Fig. 20: Image for CBR Test
37
Apparatus
Moulds 2250cm3 capacity with base plate, stay rod and wing nut confirming to
4.1, 4.3 and 4.4, collar, spacer disc, metal rammer, expansion measuring apparatus
with the adjustable stem, perforate, mixing bowl, straight edge, scales, soaking
tank, drying oven, filter paper, dishes and calibrated measuring jar.
Procedures
1. The material shall pass 19mm sieve for fine grained soils and 37.50mm sieve
for coarse materials up to 37.50mm.
2. Replace the material retained on 19mm sieve by an equal amount of material
passing 19mm sieve and retained on 4.75mm sieve.
3. Replace the material retained on 37.50mm sieve by an equal amount of
material passing 37.50mm sieve and retained on 4.75mm sieve.
4. Calculate the mass of wet soil at required moisture content is given below:
i. Volume of mould = 2250cm3
ii. Weight of dry soil (W) = 2250 x MDD.
iii.
(2.3)
Weight of water = Weight of wet soil - Weight of dry soil
= Optimum moisture content obtained from the laboratory compaction test.
5. Take oven dried soil sample of calculated weight and thoroughly mix with
water (OMC) as obtained from the above equation.
6. Record the empty weight of the mould with base plate, with extension collar
removed (m1).
7. Place the correct mass of the wet soil in to the mould in five layers.
8. Gently compact each layer with the spacer disc.
9. Place a filter paper on top of the soil followed by a 5cm displacer disc.
10. Compact the mould by pressing it in between the platens of the compression
testing machine until the top of the spacer disc comes flush with the top of the
mould.
11. Hold the load for about 30 seconds and then release.
12. Remove the mould from the compression testing machine.
13. Remove the spacer disc and weigh the mould with compacted soil (m2).
14. Replace the extension collar of the mould.
15. Prepare two more specimens in the same procedure as described above.
38
CHAPTER FOUR
4.0 CONCLUSION AND RECOMMENDATION
4.1 Conclusion
The SIWES programmed has been immensely beneficial and educative for me. It
proved to be practically oriented and exposed me to several aspects of my field and
profession as it applies in the real world. Its significance is evident in the institutions
of higher learning. The programme’s benefit serves as a taste of real life situations
pertaining to the profession of Engineering Geology.
I’ve been able to understand the use of geotechnics to evaluate by performance of the
field and laboratory test, the physical properties that would influence foundation
designs and constructions.
I have been able to develop and expose myself to the pragmatic nature of my chosen
profession with the help of this program. It has also increased my technical and
communicative skills in line with my theoretical background. The SIWES Programme
has afforded me the opportunity to meet with future situations and occurrences in my
field and expose me to ways of tackling them professionally. To this, I will humbly
say and express it graciously that the SIWES programme is immensely beneficial and
a success story in my life.
Finally, the SIWES training also revealed to me the likely challenges to be faced in
the nearest future as a geologist as well as competition in the geotechnical industry.
4.2 Recommendations
Sequel to the difficulties and challenges encountered during the period of my training
at Lagos State Materials Testing Laboratory, I hereby recommend the following:
1. Efforts should be made to invest in the activities of the Industrial Training Fund to
improve on the public awareness of the programme by the government, as it is a
laudable programme which goes a long way in developing the leaders of
tomorrow.
2. That the Industrial Training Fund (I.T.F) should play more leading roles in
providing avenues for placement of students, as it tends to be arduous task in
securing one.

39
3. That institution, through delegated representatives should improve on her efforts
to assess and advice students in their placement and choices of attachment, thus
protecting the integrity of the school.
4. That the students should be focused during the period of learning and avoid being
distracted by things that will not impact positive things to their lives.
40
REFERENCES
Engr. Ik.Obioha (M.S.E), (2012): ‘’Basic Soil Engineering Laboratory Manual’’.
Joseph E. Bowles, (1989): “Physical and Geotechnical properties of soils,” 2nd
edition.
McGraw-Hill book company, New York, Pg 136-137Vazirani, V.N., and S.P. Chandola,
(1984)
Retrieved from http:// www.byk.com/en/instruments/products/dry-coatings/abrasion
Retrieved from http:// www.theconstructor.org/building-material/determination-of-aggregate-
impact-value/1355/
Fellenius B.H, (2002); ‘Pile Capacity by Direct Cone Penetration Tests’.
T. O. Mafe, (2009), “Guide to Successful Participation in SIWES”, Eslami A.
Retrieved from http:// www.engineeringcivil.com/determine-the-specific-gravity-of-soil.html
Retrieved from http:// www.pavementinteractive.org/article/los-angeles-abrasion/
Robert W. Day (2002), “Soil Testing Manual”.
J. J. M. Powell, P.K. Robertson and T. Lunne (1997), “Cone Penetration Test in
Geotechnical Practice”
Noel Simons (2002), “Geotechnical Site Investigation”
Fu Han Chen, P.E. (2000) “Soil Engineering: Testing, Design and Remediation” CRC Press,
New York.
41
APPENDIX
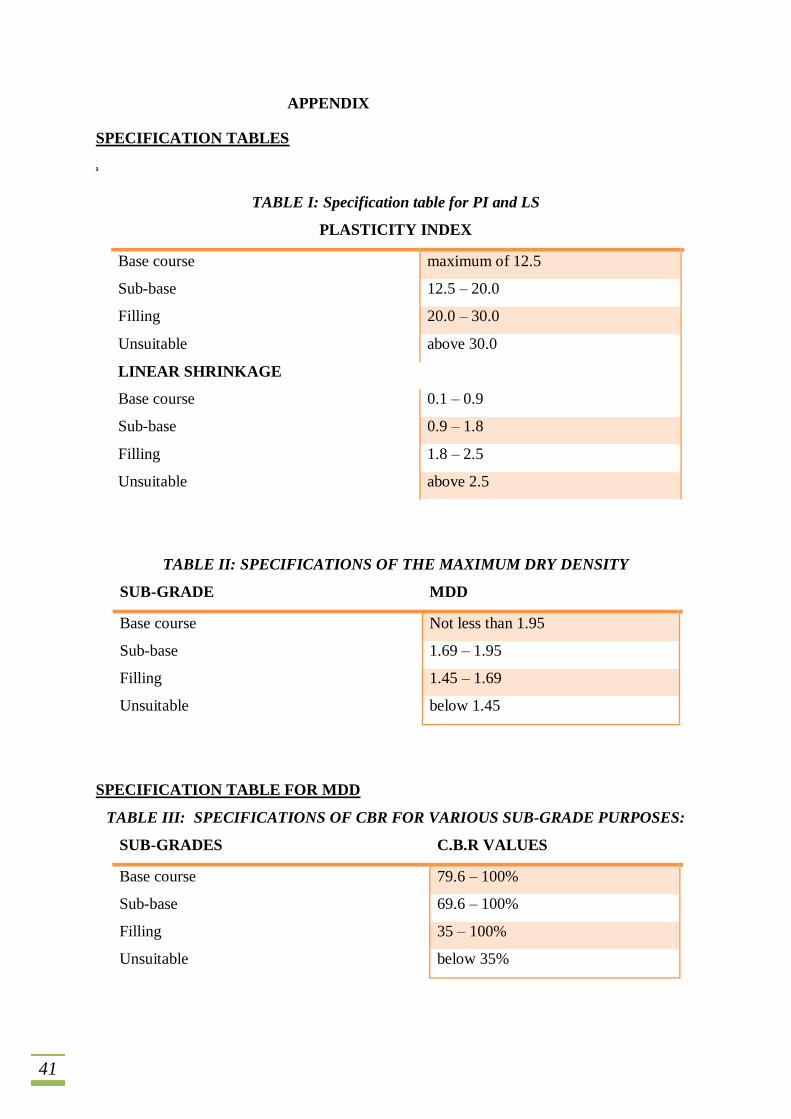
SPECIFICATION TABLES
x
TABLE I: Specification table for PI and LS
PLASTICITY INDEX
Base course maximum of 12.5
Sub-base 12.5 – 20.0
Filling 20.0 – 30.0
Unsuitable above 30.0
LINEAR SHRINKAGE
Base course 0.1 – 0.9
Sub-base 0.9 – 1.8
Filling 1.8 – 2.5
Unsuitable above 2.5
TABLE II: SPECIFICATIONS OF THE MAXIMUM DRY DENSITY
SUB-GRADE MDD
Base course Not less than 1.95
Sub-base 1.69 – 1.95
Filling 1.45 – 1.69
Unsuitable below 1.45
SPECIFICATION TABLE FOR MDD
TABLE III: SPECIFICATIONS OF CBR FOR VARIOUS SUB-GRADE PURPOSES:
SUB-GRADES C.B.R VALUES
Base course 79.6 – 100%
Sub-base 69.6 – 100%
Filling 35 – 100%
Unsuitable below 35%


![1. First Chapter BCPC [Repaired]](https://img.dokumen.tips/doc/110x75/5695d2801a28ab9b029aafc0/1-first-chapter-bcpc-repaired.jpg)