Embed Size (px)
Citation preview
37
VECTOR-BORNE DISEASESChapter II
lChikungunya Fever lDengue Fever/Dengue Haemorrhagic Fever (DF/DHF) lMalaria lJapanese Encephalitis
38
IIVECTOR-BORNE DISEASES
CHIKUNGUNYA FEVER
Chikungunya fever is an acute febrile disease caused by the chikungunya virus. The disease is characterised by fever, joint pain with or without swelling, headache, fatigue, nausea and vomiting. Some patients may develop a rash affecting the trunk and limbs. The disease is usually self-limiting. Most symptoms last for 3 -10 days although the joint pain may last for weeks to months. The main vector in Singapore is the Aedes albopictus mosquito.
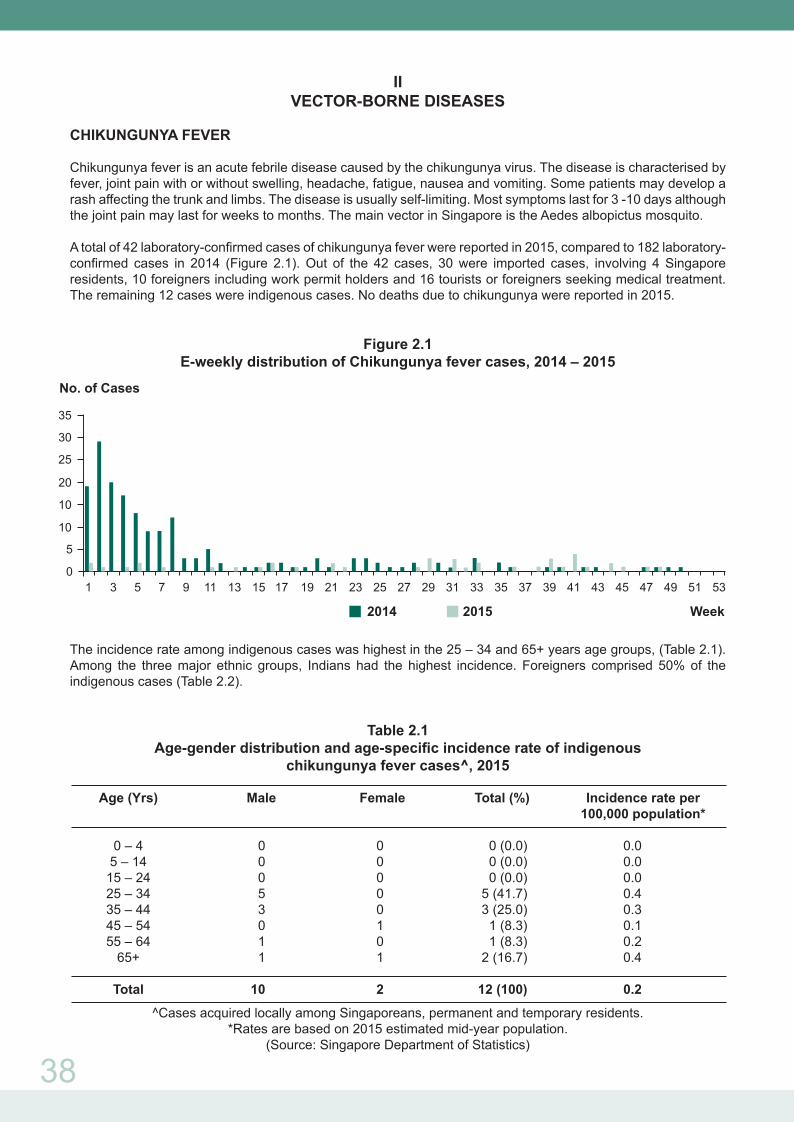
A total of 42 laboratory-confirmed cases of chikungunya fever were reported in 2015, compared to 182 laboratory-confirmed cases in 2014 (Figure 2.1). Out of the 42 cases, 30 were imported cases, involving 4 Singapore residents, 10 foreigners including work permit holders and 16 tourists or foreigners seeking medical treatment. The remaining 12 cases were indigenous cases. No deaths due to chikungunya were reported in 2015.
Figure 2.1E-weekly distribution of Chikungunya fever cases, 2014 – 2015
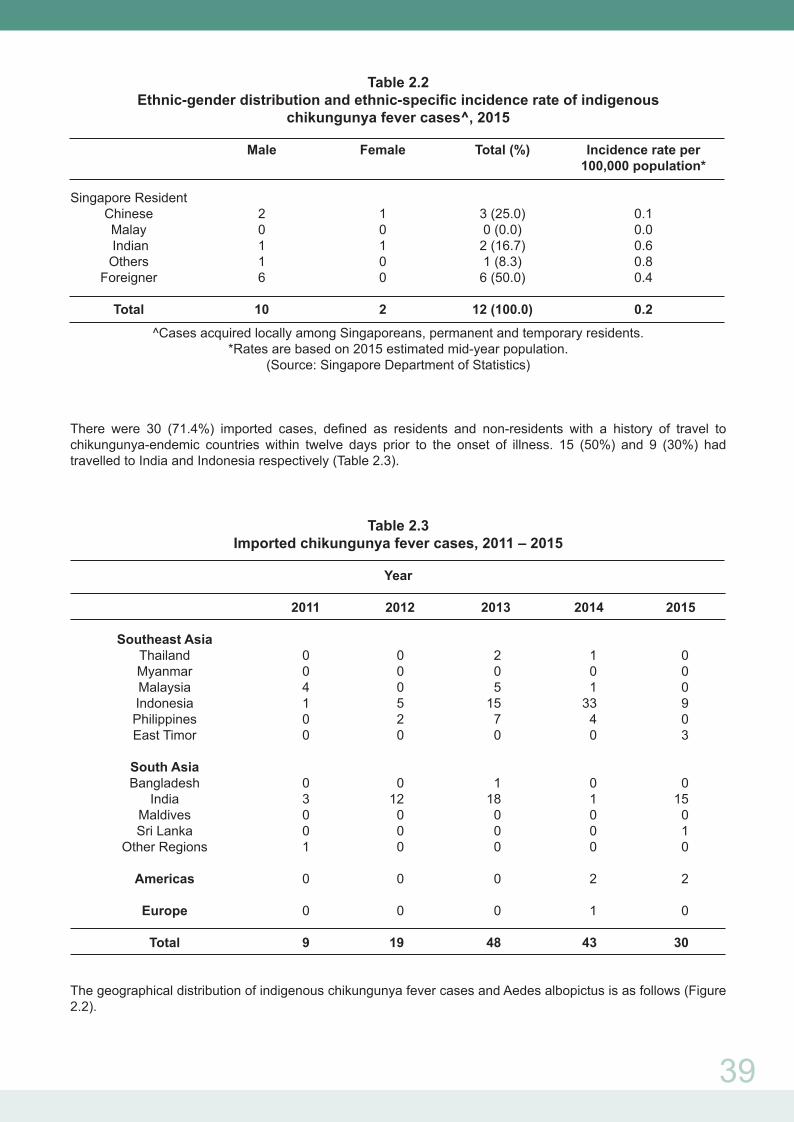
The incidence rate among indigenous cases was highest in the 25 – 34 and 65+ years age groups, (Table 2.1). Among the three major ethnic groups, Indians had the highest incidence. Foreigners comprised 50% of the indigenous cases (Table 2.2).
Table 2.1Age-gender distribution and age-specific incidence rate of indigenous
chikungunya fever cases^, 2015
Age (Yrs) Male Female Total (%) Incidence rate per 100,000 population*
0 – 4 0 0 0 (0.0) 0.0 5 – 14 0 0 0 (0.0) 0.0 15 – 24 0 0 0 (0.0) 0.0 25 – 34 5 0 5 (41.7) 0.4 35 – 44 3 0 3 (25.0) 0.3 45 – 54 0 1 1 (8.3) 0.1 55 – 64 1 0 1 (8.3) 0.2 65+ 1 1 2 (16.7) 0.4
Total 10 2 12 (100) 0.2
^Cases acquired locally among Singaporeans, permanent and temporary residents.*Rates are based on 2015 estimated mid-year population.
(Source: Singapore Department of Statistics)
1 3 5 7 9 11 13 15 17 19 21 23 25 27 29 31 33 35 37 39 41 43 45 47 49 51 530
No. of Cases
Week2014 2015
5
10
10
20
25
30
35
39
Table 2.2Ethnic-gender distribution and ethnic-specific incidence rate of indigenous
chikungunya fever cases^, 2015
Male Female Total (%) Incidence rate per 100,000 population*
Singapore Resident Chinese 2 1 3 (25.0) 0.1 Malay 0 0 0 (0.0) 0.0 Indian 1 1 2 (16.7) 0.6 Others 1 0 1 (8.3) 0.8 Foreigner 6 0 6 (50.0) 0.4
Total 10 2 12 (100.0) 0.2
^Cases acquired locally among Singaporeans, permanent and temporary residents.*Rates are based on 2015 estimated mid-year population.
(Source: Singapore Department of Statistics)
There were 30 (71.4%) imported cases, defined as residents and non-residents with a history of travel to chikungunya-endemic countries within twelve days prior to the onset of illness. 15 (50%) and 9 (30%) had travelled to India and Indonesia respectively (Table 2.3).
Table 2.3Imported chikungunya fever cases, 2011 – 2015
Year 2011 2012 2013 2014 2015 Southeast Asia Thailand 0 0 2 1 0 Myanmar 0 0 0 0 0 Malaysia 4 0 5 1 0 Indonesia 1 5 15 33 9 Philippines 0 2 7 4 0 East Timor 0 0 0 0 3 South Asia Bangladesh 0 0 1 0 0 India 3 12 18 1 15 Maldives 0 0 0 0 0 Sri Lanka 0 0 0 0 1 Other Regions 1 0 0 0 0 Americas 0 0 0 2 2 Europe 0 0 0 1 0
Total 9 19 48 43 30
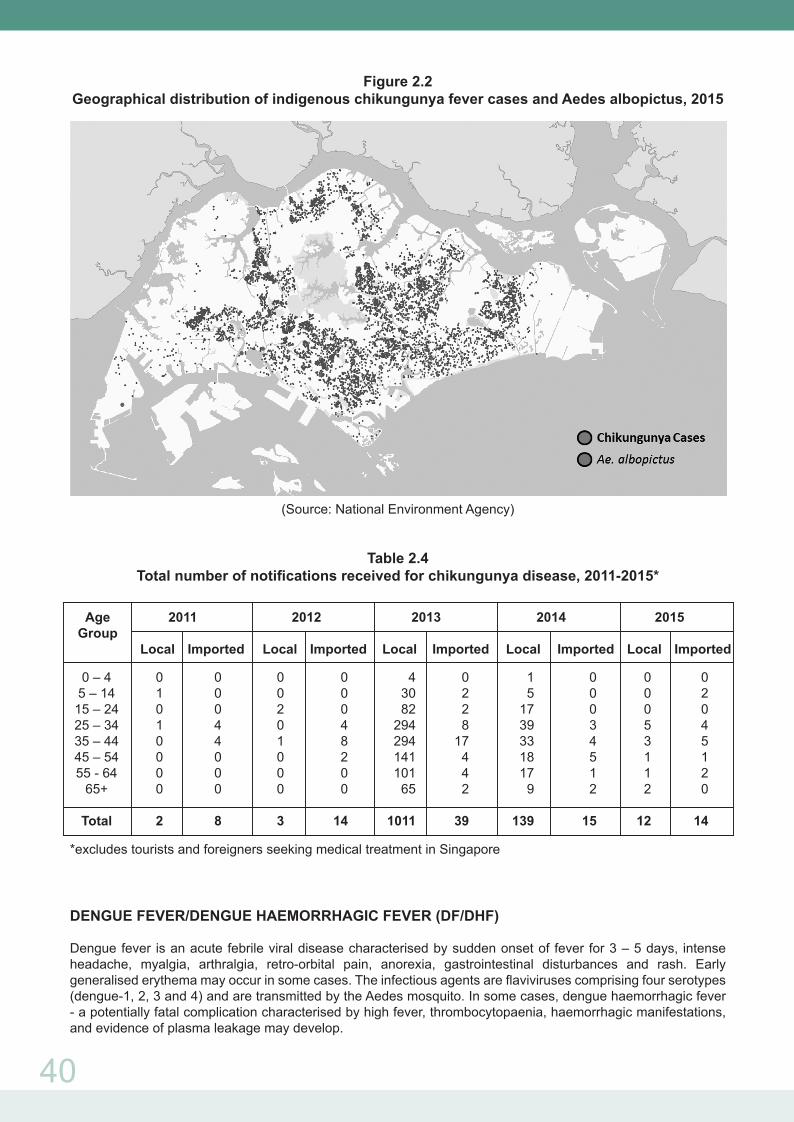
The geographical distribution of indigenous chikungunya fever cases and Aedes albopictus is as follows (Figure 2.2).
40
Figure 2.2Geographical distribution of indigenous chikungunya fever cases and Aedes albopictus, 2015
(Source: National Environment Agency)
Table 2.4Total number of notifications received for chikungunya disease, 2011-2015*
*excludes tourists and foreigners seeking medical treatment in Singapore
DENGUE FEVER/DENGUE HAEMORRHAGIC FEVER (DF/DHF)
Dengue fever is an acute febrile viral disease characterised by sudden onset of fever for 3 – 5 days, intense headache, myalgia, arthralgia, retro-orbital pain, anorexia, gastrointestinal disturbances and rash. Early generalised erythema may occur in some cases. The infectious agents are flaviviruses comprising four serotypes (dengue-1, 2, 3 and 4) and are transmitted by the Aedes mosquito. In some cases, dengue haemorrhagic fever - a potentially fatal complication characterised by high fever, thrombocytopaenia, haemorrhagic manifestations, and evidence of plasma leakage may develop.
Age 2011 2012 2013 2014 2015 Group Local Imported Local Imported Local Imported Local Imported Local Imported
0 – 4 0 0 0 0 4 0 1 0 0 0 5 – 14 1 0 0 0 30 2 5 0 0 2 15 – 24 0 0 2 0 82 2 17 0 0 0 25 – 34 1 4 0 4 294 8 39 3 5 4 35 – 44 0 4 1 8 294 17 33 4 3 5 45 – 54 0 0 0 2 141 4 18 5 1 1 55 - 64 0 0 0 0 101 4 17 1 1 2 65+ 0 0 0 0 65 2 9 2 2 0
Total 2 8 3 14 1011 39 139 15 12 14

41
A total of 11,294 laboratory confirmed cases of DF/DHF [comprising 11,282 cases of dengue fever (DF) and 12 cases of dengue haemorrhagic fever (DHF)] were reported in 2015, a decrease of about 38 percent from the 18,326 dengue fever cases reported in 2014. Out of the 11,294 cases, 438 cases were imported cases involving 182 Singapore residents and 256 foreigners including work permit holders. The remaining 10,856 cases were classified as indigenous cases.
The incidence in the beginning of 2015 was slightly high in E-weeks 1-5, but remained relatively low until E-week 25, where cases rose gradually above the mean +2SD level. Despite some occasional lows, the number of dengue cases did not decrease below the mean +1SD level (except for E-week 45) for the rest of the year. Additionally, starting in E-week 47, there was an observable upward trend till the end of 2015, with the number of dengue cases exceeding the mean +2SD level by a fair margin (Figure 2.3).
Figure 2.3E-weekly distribution of DF/DHF cases, 2014 – 2015
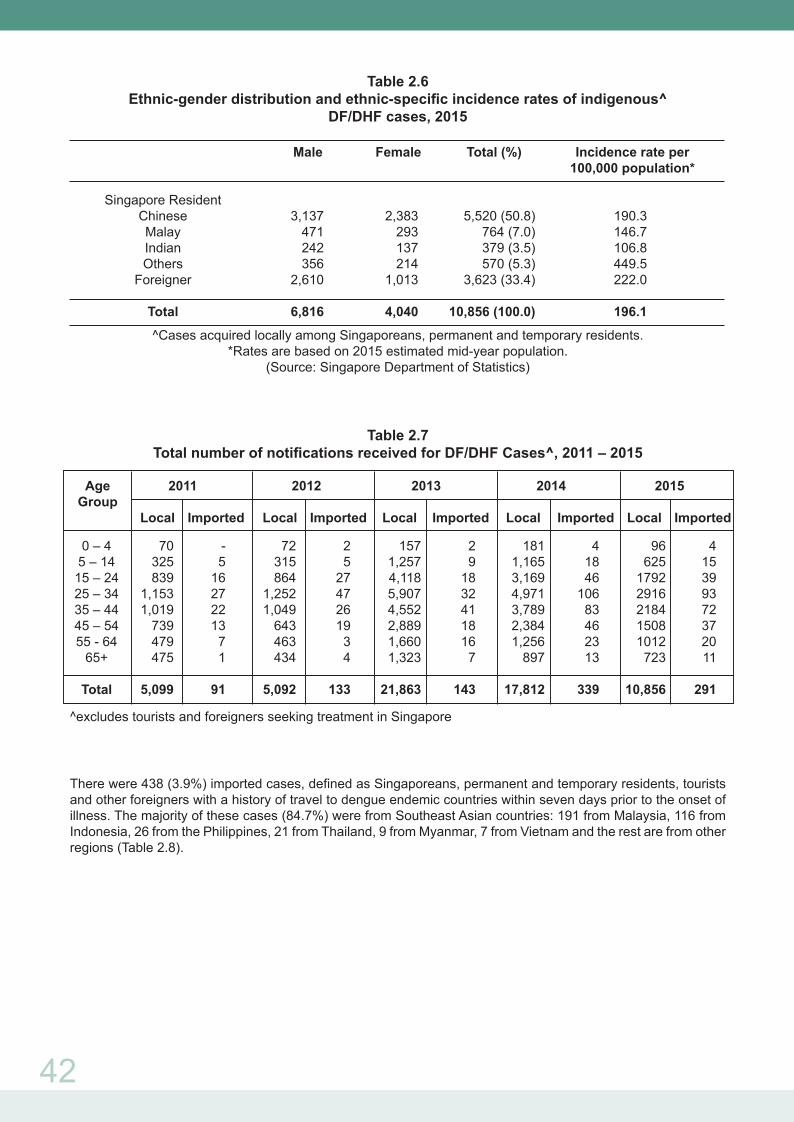
The incidence rate among indigenous cases was highest in the age group of 15-24 with a male to female ratio of 2:1 (Table 2.5). Among the three major ethnic groups, Chinese had the highest incidence rate, followed by Malays and Indians. Foreigners comprised 33.4% of the indigenous cases (Table 2.6).
Table 2.5Age-gender distribution and age-specific incidence rates of indigenous^ DF/DHF cases, 2015
Age (Yrs) Male Female Total (%) Incidence rate per 100,000 population*
0 – 4 60 36 96 (0.9) 42.1 5 – 14 375 250 625 (5.7) 132.3 15 – 24 1,175 617 1,792 (16.5) 238.4 25 – 34 1,958 958 2,916 (26.9) 232.3 35 – 44 1,404 780 2,184 (20.1) 221.2 45 – 54 909 599 1,508 (13.9) 201.7 55 - 64 551 461 1,012 (9.3) 172.5 65+ 384 339 723 (6.7) 142.8
Total 6,816 4,040 10,856 (100.0) 196.1
^Cases acquired locally among Singaporeans, permanent and temporary residents.*Rates are based on 2015 estimated mid-year population.
(Source: Singapore Department of Statistics)
1 3 5 7 9 11 13 15 17 19 21 23 25 27 29 31 33 35 37 39 41 43 45 47 49 51 530
No. of Cases
Week2014 2015
100200300400500600700800900
1000
42
Table 2.6Ethnic-gender distribution and ethnic-specific incidence rates of indigenous^
DF/DHF cases, 2015
Male Female Total (%) Incidence rate per 100,000 population* Singapore Resident Chinese 3,137 2,383 5,520 (50.8) 190.3 Malay 471 293 764 (7.0) 146.7 Indian 242 137 379 (3.5) 106.8 Others 356 214 570 (5.3) 449.5 Foreigner 2,610 1,013 3,623 (33.4) 222.0
Total 6,816 4,040 10,856 (100.0) 196.1
^Cases acquired locally among Singaporeans, permanent and temporary residents.*Rates are based on 2015 estimated mid-year population.
(Source: Singapore Department of Statistics)
Table 2.7Total number of notifications received for DF/DHF Cases^, 2011 – 2015
^excludes tourists and foreigners seeking treatment in Singapore
There were 438 (3.9%) imported cases, defined as Singaporeans, permanent and temporary residents, tourists and other foreigners with a history of travel to dengue endemic countries within seven days prior to the onset of illness. The majority of these cases (84.7%) were from Southeast Asian countries: 191 from Malaysia, 116 from Indonesia, 26 from the Philippines, 21 from Thailand, 9 from Myanmar, 7 from Vietnam and the rest are from other regions (Table 2.8).
Age 2011 2012 2013 2014 2015 Group Local Imported Local Imported Local Imported Local Imported Local Imported
0 – 4 70 - 72 2 157 2 181 4 96 4 5 – 14 325 5 315 5 1,257 9 1,165 18 625 15 15 – 24 839 16 864 27 4,118 18 3,169 46 1792 39 25 – 34 1,153 27 1,252 47 5,907 32 4,971 106 2916 93 35 – 44 1,019 22 1,049 26 4,552 41 3,789 83 2184 72 45 – 54 739 13 643 19 2,889 18 2,384 46 1508 37 55 - 64 479 7 463 3 1,660 16 1,256 23 1012 20 65+ 475 1 434 4 1,323 7 897 13 723 11
Total 5,099 91 5,092 133 21,863 143 17,812 339 10,856 291

Table 2.8 Imported DF/DHF cases, 2011 – 2015
Year
2011 2012 2013 2014 2015
Southeast Asia
Brunei 1 0 1 1 0
Cambodia 8 11 2 1 1
East Timor 2 4 1 5 0
Indonesia 110 111 116 143 116
Laos 0 0 0 1 0
Malaysia 21 39 90 214 191
Myanmar 3 1 9 8 9
Philippines 12 13 10 17 26
Thailand 15 22 21 27 21
Vietnam 9 4 6 8 7
South Asia
Bangladesh 13 5 4 6 6
China 1 3 12 9 2
India 16 32 17 39 35
Maldives 1 2 1 6 3
Nepal 0 0 0 1 0
Pakistan 2 0 1 0 1
Sri Lanka 5 4 1 6 2
Other Regions 12 12 15 22 18
Total 231 263 307 514 438
Residents in Housing & Development Board (HDB) flats, Landed Properties (including shophouses)
and Condominiums constituted 66.1%, 15.5% and 17.5% of the cases respectively. The incidence rate
of residents of landed properties houses (447.3 per 100,000) was about three times of residents in HDB
flats (151.1 per 100,000). (Table 2.9).
Table 2.9 Incidence rates of reported indigenous DF/DHF cases by housing type
for Singapore residents, 2015
Housing Type No. % Incidence rate per
100,000 population*
HDB Flats 4,779 66.1 151.1
Landed Properties (including shophouses) 1,123 15.5 447.3
Condominiums and Other Apartments 1,264 17.5 279.0
Others 67 0.9 184.8
Total 7,233 100.0 185.3
*Rates are based on 2015 estimated mid-year population. (Source: Singapore Department of Statistics)
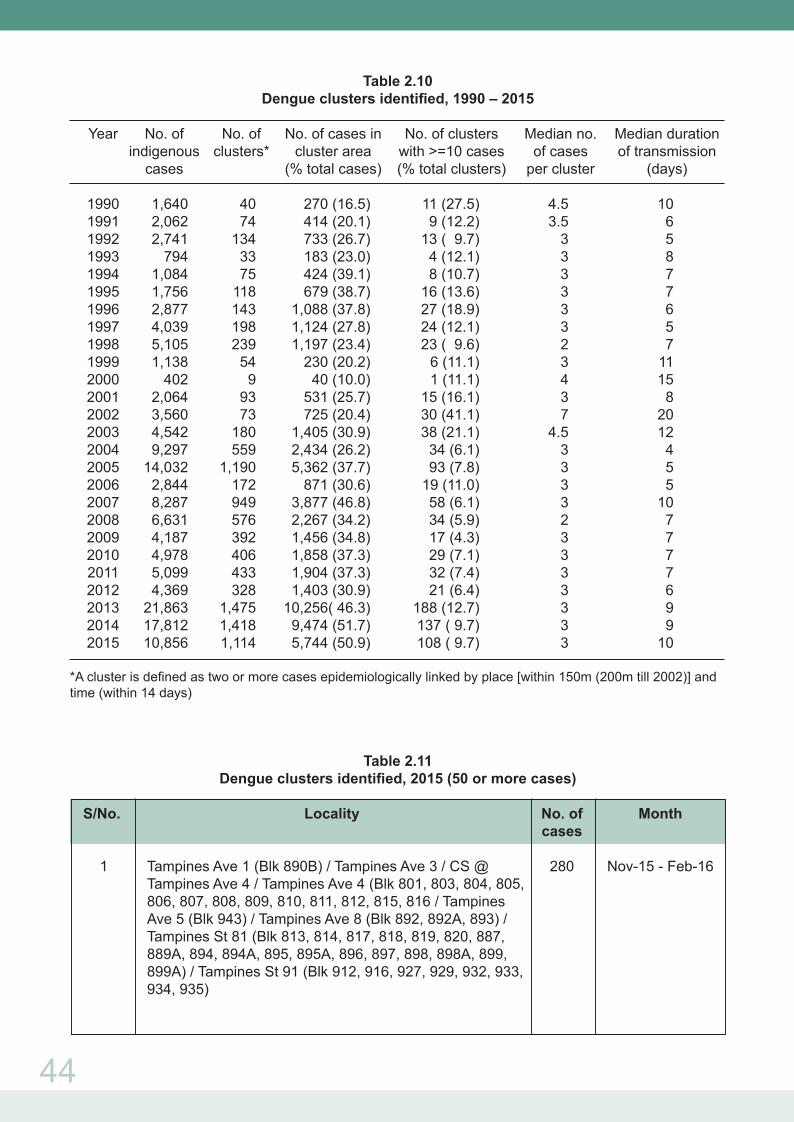
A total of 1,114 clusters involving 6,441 epidemiologically linked cases were identified in 2015, of which
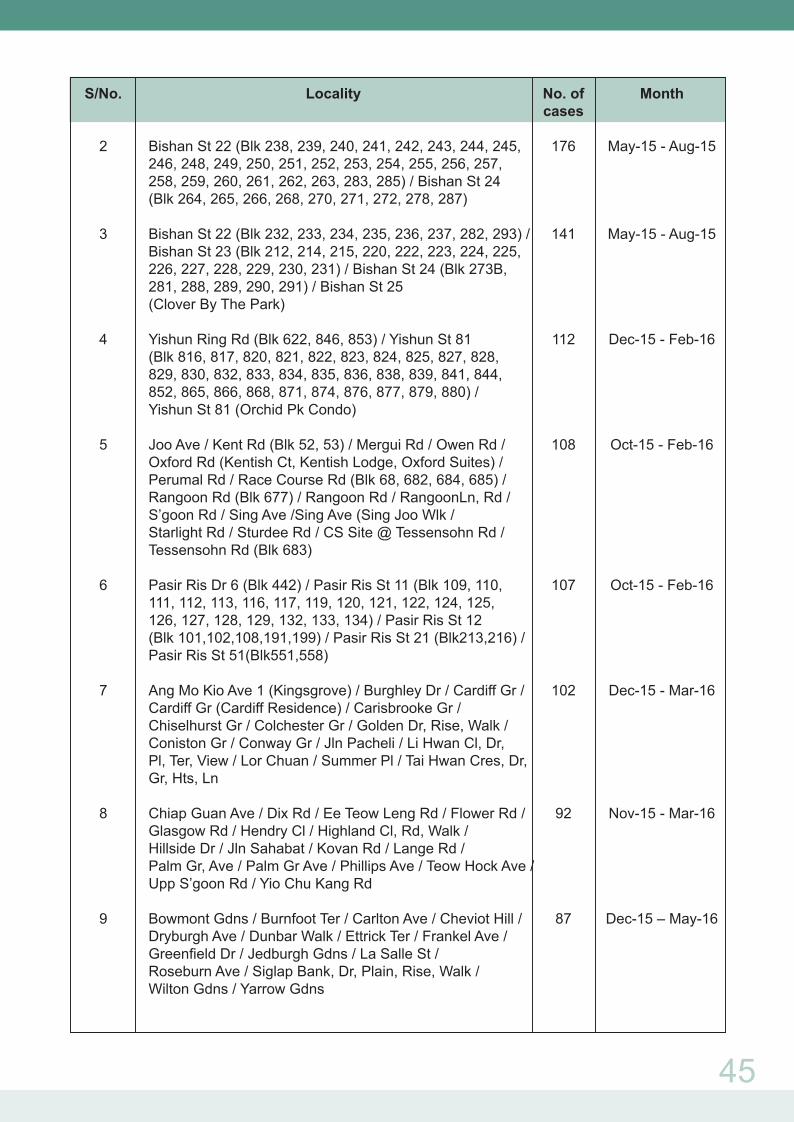
108 clusters (9.7%) had 10 or more cases. Areas with more than 50 cases are listed in Table 2.11. The
median number of cases in these 108 clusters was 17 (range 10 to 280) and the median duration of
transmission was 37 days (range 8 to 134) (Table 2.10).
43
44
Table 2.10Dengue clusters identified, 1990 – 2015
Year No. of No. of No. of cases in No. of clusters Median no. Median duration indigenous clusters* cluster area with >=10 cases of cases of transmission cases (% total cases) (% total clusters) per cluster (days)
1990 1,640 40 270 (16.5) 11 (27.5) 4.5 10 1991 2,062 74 414 (20.1) 9 (12.2) 3.5 6 1992 2,741 134 733 (26.7) 13 ( 9.7) 3 5 1993 794 33 183 (23.0) 4 (12.1) 3 8 1994 1,084 75 424 (39.1) 8 (10.7) 3 7 1995 1,756 118 679 (38.7) 16 (13.6) 3 7 1996 2,877 143 1,088 (37.8) 27 (18.9) 3 6 1997 4,039 198 1,124 (27.8) 24 (12.1) 3 5 1998 5,105 239 1,197 (23.4) 23 ( 9.6) 2 7 1999 1,138 54 230 (20.2) 6 (11.1) 3 11 2000 402 9 40 (10.0) 1 (11.1) 4 15 2001 2,064 93 531 (25.7) 15 (16.1) 3 8 2002 3,560 73 725 (20.4) 30 (41.1) 7 20 2003 4,542 180 1,405 (30.9) 38 (21.1) 4.5 12 2004 9,297 559 2,434 (26.2) 34 (6.1) 3 4 2005 14,032 1,190 5,362 (37.7) 93 (7.8) 3 5 2006 2,844 172 871 (30.6) 19 (11.0) 3 5 2007 8,287 949 3,877 (46.8) 58 (6.1) 3 10 2008 6,631 576 2,267 (34.2) 34 (5.9) 2 7 2009 4,187 392 1,456 (34.8) 17 (4.3) 3 7 2010 4,978 406 1,858 (37.3) 29 (7.1) 3 7 2011 5,099 433 1,904 (37.3) 32 (7.4) 3 7 2012 4,369 328 1,403 (30.9) 21 (6.4) 3 6 2013 21,863 1,475 10,256( 46.3) 188 (12.7) 3 9 2014 17,812 1,418 9,474 (51.7) 137 ( 9.7) 3 9 2015 10,856 1,114 5,744 (50.9) 108 ( 9.7) 3 10
*A cluster is defined as two or more cases epidemiologically linked by place [within 150m (200m till 2002)] and time (within 14 days)
Table 2.11Dengue clusters identified, 2015 (50 or more cases)
S/No. Locality No. of Month cases
1 Tampines Ave 1 (Blk 890B) / Tampines Ave 3 / CS @ 280 Nov-15 - Feb-16 Tampines Ave 4 / Tampines Ave 4 (Blk 801, 803, 804, 805, 806, 807, 808, 809, 810, 811, 812, 815, 816 / Tampines Ave 5 (Blk 943) / Tampines Ave 8 (Blk 892, 892A, 893) / Tampines St 81 (Blk 813, 814, 817, 818, 819, 820, 887, 889A, 894, 894A, 895, 895A, 896, 897, 898, 898A, 899, 899A) / Tampines St 91 (Blk 912, 916, 927, 929, 932, 933, 934, 935)
45
S/No. Locality No. of Month cases 2 Bishan St 22 (Blk 238, 239, 240, 241, 242, 243, 244, 245, 176 May-15 - Aug-15 246, 248, 249, 250, 251, 252, 253, 254, 255, 256, 257, 258, 259, 260, 261, 262, 263, 283, 285) / Bishan St 24 (Blk 264, 265, 266, 268, 270, 271, 272, 278, 287) 3 Bishan St 22 (Blk 232, 233, 234, 235, 236, 237, 282, 293) / 141 May-15 - Aug-15 Bishan St 23 (Blk 212, 214, 215, 220, 222, 223, 224, 225, 226, 227, 228, 229, 230, 231) / Bishan St 24 (Blk 273B, 281, 288, 289, 290, 291) / Bishan St 25 (Clover By The Park) 4 Yishun Ring Rd (Blk 622, 846, 853) / Yishun St 81 112 Dec-15 - Feb-16 (Blk 816, 817, 820, 821, 822, 823, 824, 825, 827, 828, 829, 830, 832, 833, 834, 835, 836, 838, 839, 841, 844, 852, 865, 866, 868, 871, 874, 876, 877, 879, 880) / Yishun St 81 (Orchid Pk Condo) 5 Joo Ave / Kent Rd (Blk 52, 53) / Mergui Rd / Owen Rd / 108 Oct-15 - Feb-16 Oxford Rd (Kentish Ct, Kentish Lodge, Oxford Suites) / Perumal Rd / Race Course Rd (Blk 68, 682, 684, 685) / Rangoon Rd (Blk 677) / Rangoon Rd / RangoonLn, Rd / S’goon Rd / Sing Ave /Sing Ave (Sing Joo Wlk / Starlight Rd / Sturdee Rd / CS Site @ Tessensohn Rd / Tessensohn Rd (Blk 683) 6 Pasir Ris Dr 6 (Blk 442) / Pasir Ris St 11 (Blk 109, 110, 107 Oct-15 - Feb-16 111, 112, 113, 116, 117, 119, 120, 121, 122, 124, 125, 126, 127, 128, 129, 132, 133, 134) / Pasir Ris St 12 (Blk 101,102,108,191,199) / Pasir Ris St 21 (Blk213,216) / Pasir Ris St 51(Blk551,558) 7 Ang Mo Kio Ave 1 (Kingsgrove) / Burghley Dr / Cardiff Gr / 102 Dec-15 - Mar-16 Cardiff Gr (Cardiff Residence) / Carisbrooke Gr / Chiselhurst Gr / Colchester Gr / Golden Dr, Rise, Walk / Coniston Gr / Conway Gr / Jln Pacheli / Li Hwan Cl, Dr, Pl, Ter, View / Lor Chuan / Summer Pl / Tai Hwan Cres, Dr, Gr, Hts, Ln
8 Chiap Guan Ave / Dix Rd / Ee Teow Leng Rd / Flower Rd / 92 Nov-15 - Mar-16 Glasgow Rd / Hendry Cl / Highland Cl, Rd, Walk / Hillside Dr / Jln Sahabat / Kovan Rd / Lange Rd / Palm Gr, Ave / Palm Gr Ave / Phillips Ave / Teow Hock Ave / Upp S’goon Rd / Yio Chu Kang Rd 9 Bowmont Gdns / Burnfoot Ter / Carlton Ave / Cheviot Hill / 87 Dec-15 – May-16 Dryburgh Ave / Dunbar Walk / Ettrick Ter / Frankel Ave / Greenfield Dr / Jedburgh Gdns / La Salle St / Roseburn Ave / Siglap Bank, Dr, Plain, Rise, Walk / Wilton Gdns / Yarrow Gdns

46
S/No. Locality No. of Month cases
10 Geylang Rd / Geylang Rd (Le Regal) / Guillemard Rd / 80 Dec-15 - Feb-16 Lor 4 Geylang (Wang Lodge) / Lor 6 Geylang (Sun flower Court) / Lor 7 Geylang (Centra Residence) / Lor 8 Geylang (Aston Lodge, Familie Mansion, Swann Court) / Lor 9 Geylang (Kim Court) /Lor 4, 6, 7, 8, 9, 11, 12, 13, 15, 17, 23 Geylang / Sims Ave 11 CS @ Pasir Ris Gr / Elias Green (Elias Green) / 73 Sep-15 - Nov-15 Pasir Ris Gr (Livia, NV Residences) 12 Lucky Cres, Gdns, Hts, View / Riviera Dr (Riviera Residences) / Sennett Cl / Upp East Coast Rd 71 Dec-15 - Feb-16 (The Summit, The Baycourt, Venezio)
13 CS @ Flora Dr / Flora Dr (Hedges Pk Condo) / Flora Rd 65 Apr-15 - Jun-15 (Edelweiss Pk Condo, Estella Gdns) / Mariam Way (Ballota Pk Condo) 14 Eastwood Dr, Green, Pl, Rd, Ter, Walk, Way / Eastwood 51 Oct-15 - Jan-16 Rd (Fairmount Condo, Laguna 88) / Jln Greja
Dengue Deaths A total of six fatal cases were reported in 2015. Of these, four fatal cases were classified as indigenous infections among local residents. The first imported case involved a British national who demised while on-board an inbound flight to Singapore. The second imported case involved an American national who was visiting Singapore from his retirement home in Malaysia, and developed symptoms the day after his arrival.
Laboratory SurveillanceAll reported cases of DF/DHF were confirmed by one or more laboratory tests; viz. anti-dengue IgM antibody, enzyme linked immunosorbent assay (ELISA), and polymerase chain reaction (PCR).
A total of 3,590 blood samples obtained from both inpatients and outpatients tested positive for dengue virus by PCR at the Singapore General Hospital Department of Pathology, Environmental Health Institute, Tan Tock Seng Hospital Department of Pathology and Laboratory Medicine, National University Hospital Laboratory, Changi General Hospital, KK Women’s and Children’s Hospital Laboratory and Khoo Teck Puat Hospital Laboratory.
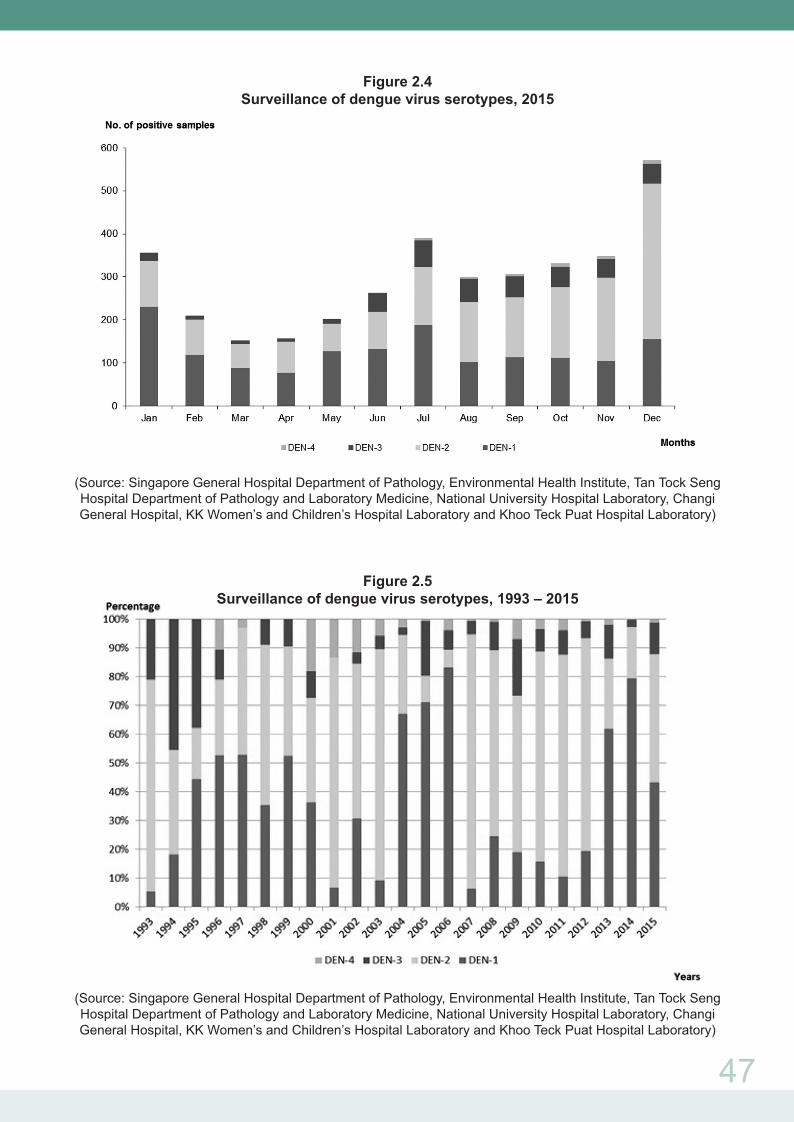
All four dengue serotypes were detected in 2015, comprising DENV-1 (43.2%), DENV-2 (44.5%), DENV-3 (11.2%) and DENV-4 (1.1%) (Figures 2.4 & 2.5).
DENV-1 was the predominant circulating serotype from 2012 to 2014. DENV-2 was found to be the predominant circulating serotype in 2015 (Figure 2.5).
47
Figure 2.4Surveillance of dengue virus serotypes, 2015
(Source: Singapore General Hospital Department of Pathology, Environmental Health Institute, Tan Tock Seng Hospital Department of Pathology and Laboratory Medicine, National University Hospital Laboratory, Changi General Hospital, KK Women’s and Children’s Hospital Laboratory and Khoo Teck Puat Hospital Laboratory)
Figure 2.5Surveillance of dengue virus serotypes, 1993 – 2015
(Source: Singapore General Hospital Department of Pathology, Environmental Health Institute, Tan Tock Seng Hospital Department of Pathology and Laboratory Medicine, National University Hospital Laboratory, Changi General Hospital, KK Women’s and Children’s Hospital Laboratory and Khoo Teck Puat Hospital Laboratory)
48
Aedes mosquito vectors surveillance and control
Suppressing the Aedes mosquito vector population is the key to dengue control in the absence of an effective vaccine. The National Environment Agency (NEA) adopts an evidence-based approach for the surveillance and control of Aedes vectors comprising of surveillance, control, community outreach & social mobilisation, enforcement and research.
Surveillance is built on the current regime of inspecting premises and ground surveys for mosquito breeding. Vector surveillance is integrated with epidemiological surveillance and laboratory-based virus surveillance, to generate risk maps that are used to guide vector control efforts, and to communicate risk to the community. This is complemented by adult mosquito sentinel surveillance using Gravitraps, which capture gravid mosquitoes. The Gravitrap-based sentinel surveillance system monitors the Aedes mosquito population in HDB housing estates at 34 locations around Singapore. Data collected from the sentinel surveillance system helps to provide insights on mosquito population and distribution, and informs operational deployment.
Source reduction is central to Singapore’s dengue vector control efforts. NEA actively engages the community to do their part to prevent mosquito breeding in their premises. Through the Inter-Agency Dengue Taskforce, NEA coordinates source reduction efforts in partnership with stakeholders in the public, private and people sectors. Since 2006, this has been augmented by Intensive Source Reduction Exercise (ISRE) that takes place at the start of the year. This systematic searching and destroying of potential breeding habitats in outdoor areas helps to reduce the vector population to a low level before the onset of the peak season for dengue transmission, which typically falls between May and October.
To control the vector population in clusters, NEA carries out search and destroy of mosquito breeding sources complemented by space spraying of insecticides to kill adult mosquitoes. Apart from surveillance, Gravitraps are also used to monitor the extent of control efforts.
Situation in 2015
A total of 11,294 cases were reported in 2015. This was 38% lower than 2014. DENV-2 was the predominant virus serotypes in 2015. Overall, 44.5% of the serotyped dengue cases were DENV-2, followed by DENV-1 (43.2%), DENV-3 (11.2%) and DENV-4 (1.1%).
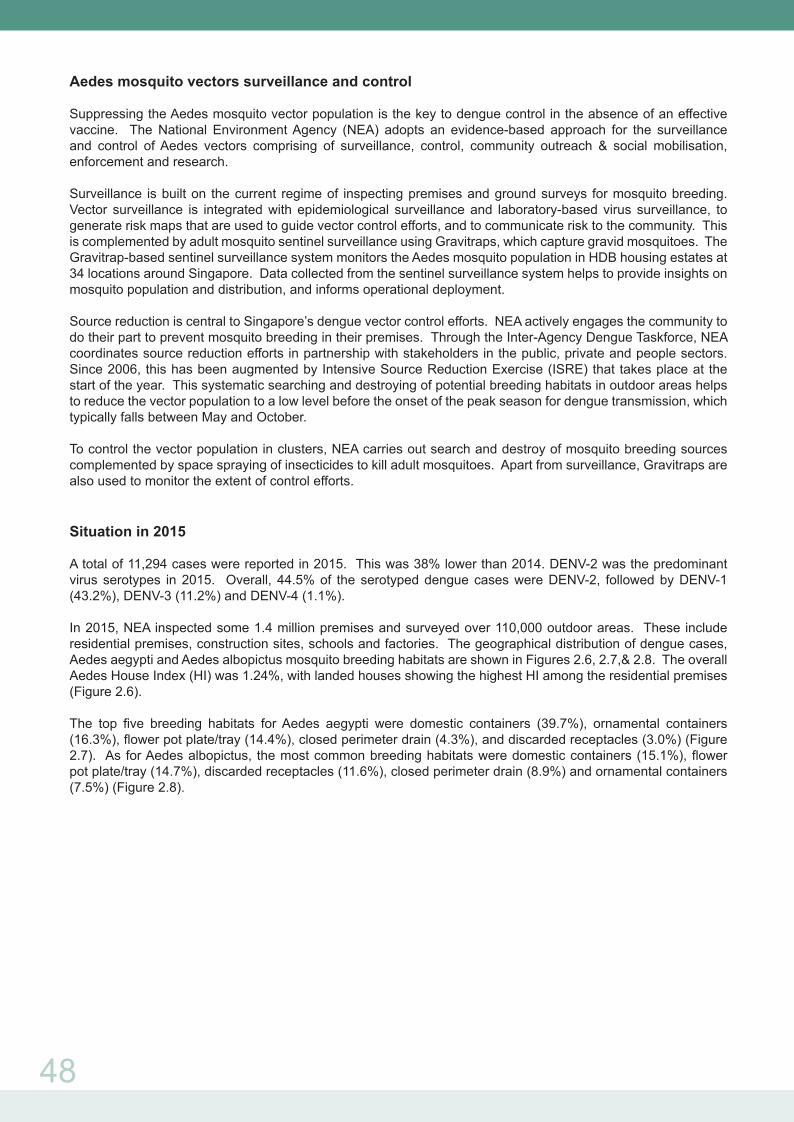
In 2015, NEA inspected some 1.4 million premises and surveyed over 110,000 outdoor areas. These include residential premises, construction sites, schools and factories. The geographical distribution of dengue cases, Aedes aegypti and Aedes albopictus mosquito breeding habitats are shown in Figures 2.6, 2.7,& 2.8. The overall Aedes House Index (HI) was 1.24%, with landed houses showing the highest HI among the residential premises (Figure 2.6).
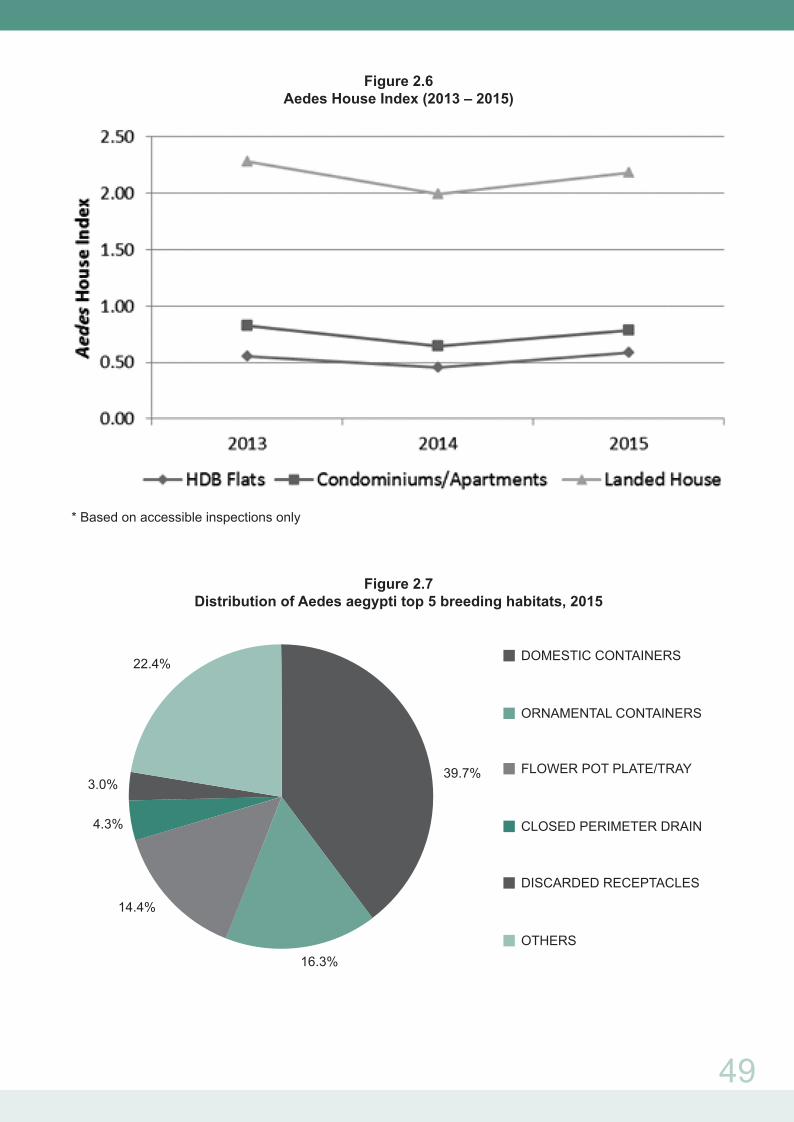
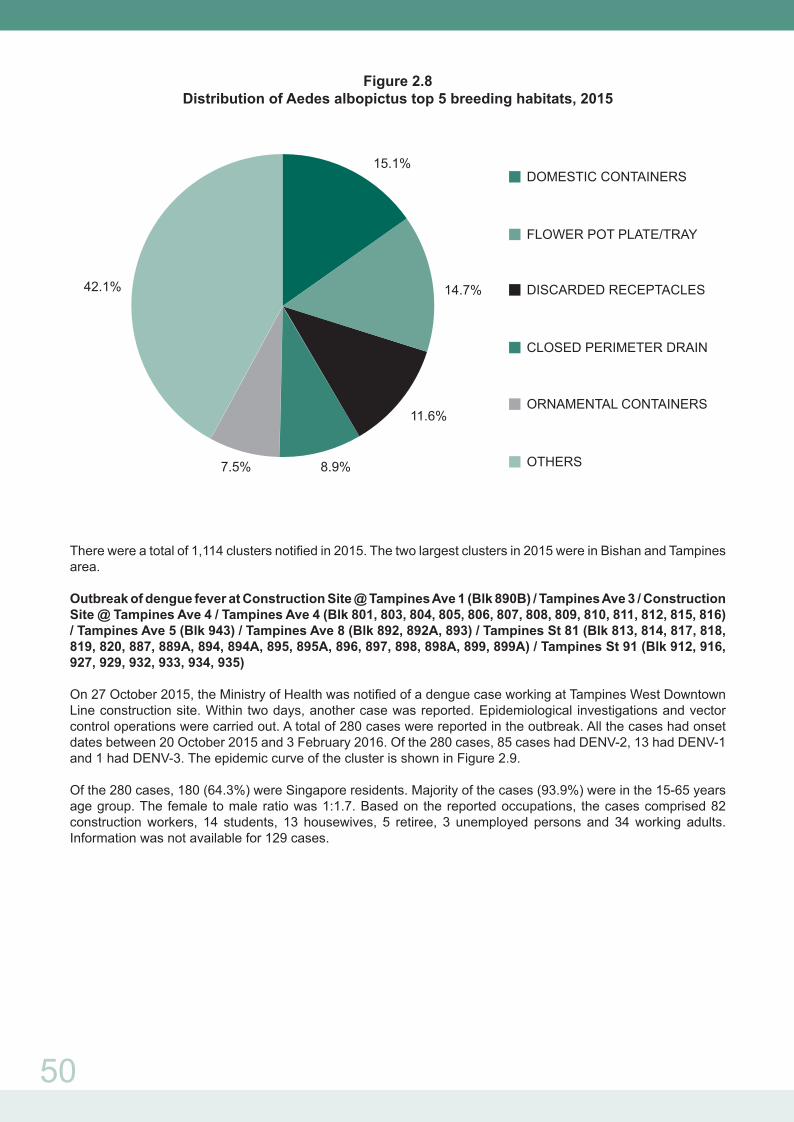
The top five breeding habitats for Aedes aegypti were domestic containers (39.7%), ornamental containers (16.3%), flower pot plate/tray (14.4%), closed perimeter drain (4.3%), and discarded receptacles (3.0%) (Figure 2.7). As for Aedes albopictus, the most common breeding habitats were domestic containers (15.1%), flower pot plate/tray (14.7%), discarded receptacles (11.6%), closed perimeter drain (8.9%) and ornamental containers (7.5%) (Figure 2.8).
49
Figure 2.6Aedes House Index (2013 – 2015)
* Based on accessible inspections only
Figure 2.7Distribution of Aedes aegypti top 5 breeding habitats, 2015
DOMESTIC CONTAINERS
ORNAMENTAL CONTAINERS
FLOWER POT PLATE/TRAY
CLOSED PERIMETER DRAIN
DISCARDED RECEPTACLES
OTHERS
22.4%
3.0%
4.3%
14.4%
16.3%
39.7%
50
Figure 2.8Distribution of Aedes albopictus top 5 breeding habitats, 2015
There were a total of 1,114 clusters notified in 2015. The two largest clusters in 2015 were in Bishan and Tampines area.
Outbreak of dengue fever at Construction Site @ Tampines Ave 1 (Blk 890B) / Tampines Ave 3 / Construction Site @ Tampines Ave 4 / Tampines Ave 4 (Blk 801, 803, 804, 805, 806, 807, 808, 809, 810, 811, 812, 815, 816) / Tampines Ave 5 (Blk 943) / Tampines Ave 8 (Blk 892, 892A, 893) / Tampines St 81 (Blk 813, 814, 817, 818, 819, 820, 887, 889A, 894, 894A, 895, 895A, 896, 897, 898, 898A, 899, 899A) / Tampines St 91 (Blk 912, 916, 927, 929, 932, 933, 934, 935)
On 27 October 2015, the Ministry of Health was notified of a dengue case working at Tampines West Downtown Line construction site. Within two days, another case was reported. Epidemiological investigations and vector control operations were carried out. A total of 280 cases were reported in the outbreak. All the cases had onset dates between 20 October 2015 and 3 February 2016. Of the 280 cases, 85 cases had DENV-2, 13 had DENV-1 and 1 had DENV-3. The epidemic curve of the cluster is shown in Figure 2.9.
Of the 280 cases, 180 (64.3%) were Singapore residents. Majority of the cases (93.9%) were in the 15-65 years age group. The female to male ratio was 1:1.7. Based on the reported occupations, the cases comprised 82 construction workers, 14 students, 13 housewives, 5 retiree, 3 unemployed persons and 34 working adults. Information was not available for 129 cases.
DOMESTIC CONTAINERS
FLOWER POT PLATE/TRAY
DISCARDED RECEPTACLES
CLOSED PERIMETER DRAIN
ORNAMENTAL CONTAINERS
OTHERS7.5%
42.1% 14.7%
11.6%
15.1%
8.9%

51
Figure 2.9
Time distribution of 280 DF/DHF cases in cluster at Tampines Ave 1 (Blk 890B) / Tampines Ave 3 / Construction Site @ Tampines Ave 4 / Tampines Ave 4 (Blk 801, 803, 804, 805, 806, 807, 808, 809, 810, 811, 812, 815, 816) / Tampines Ave 5 (Blk 943) / Tampines Ave 8 (Blk 892, 892A, 893) / Tampines St 81 (Blk 813, 814, 817, 818, 819, 820, 887, 889A, 894, 894A, 895, 895A, 896, 897, 898, 898A, 899, 899A) / Tampines St 91 (Blk 912, 916, 927, 929, 932, 933, 934, 935)
Figure 2.10 shows the geographical distribution of cases in the cluster.
Figure 2.10Geographical distribution of 280 DF/DHF cases in Tampines Ave 1 (Blk 890B) / Tampines Ave 3 / Construction Site @ Tampines Ave 4 / Tampines Ave 4 (Blk 801, 803, 804, 805, 806, 807, 808, 809, 810, 811, 812, 815, 816) / Tampines Ave 5 (Blk 943) / Tampines Ave 8 (Blk 892, 892A, 893) / Tampines St 81 (Blk 813, 814, 817, 818, 819, 820, 887, 889A, 894, 894A, 895, 895A, 896, 897, 898, 898A, 899, 899A) / Tampines St 91 (Blk 912, 916, 927, 929, 932, 933, 934, 935)
52
A total of 121 mosquito breeding habitats were detected and destroyed. 39.7% of the breeding habitats found in the cluster were domestic containers (containers and pails) and 19.8% were ornamental containers (flower vase and pots). 70.2% of the breeding habitats were detected in residential premises, with the remainder on outdoor grounds. Aedes aegypti accounted for 77.7% of the breeding.
There were six profuse breeding detected, including three roof top ground puddle (200 larvae or more per habitat), a tree hole (100 larvae), an inspection chamber (100 larvae) and a zinc cover on the rooftop (100 larvae).
Outbreak of Dengue fever at Bishan St 22 (Blk 238, 239, 240, 241, 242, 243, 244, 245, 246, 248, 249, 250, 251, 252, 253, 254, 255, 256, 257, 258, 259, 260, 261, 262, 263, 283, 285) / Bishan St 24 (Blk 264, 265, 266, 268, 270, 271, 272, 278, 287).
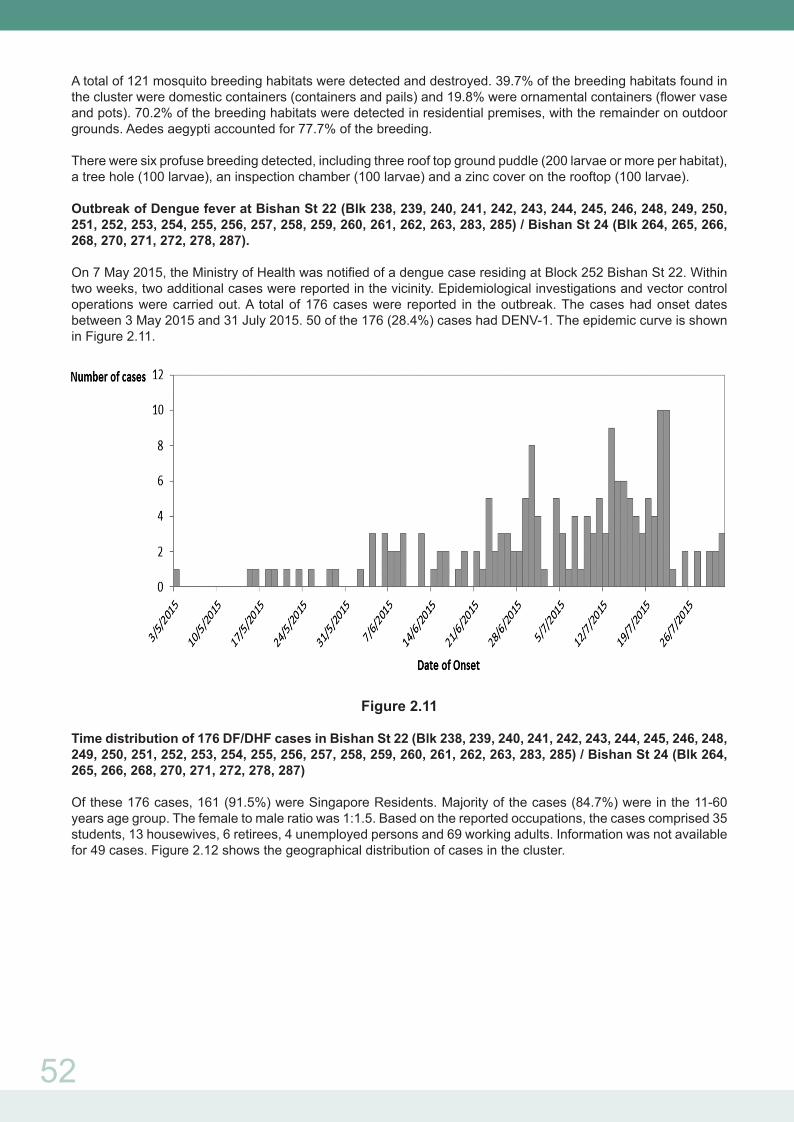
On 7 May 2015, the Ministry of Health was notified of a dengue case residing at Block 252 Bishan St 22. Within two weeks, two additional cases were reported in the vicinity. Epidemiological investigations and vector control operations were carried out. A total of 176 cases were reported in the outbreak. The cases had onset dates between 3 May 2015 and 31 July 2015. 50 of the 176 (28.4%) cases had DENV-1. The epidemic curve is shown in Figure 2.11.
Figure 2.11
Time distribution of 176 DF/DHF cases in Bishan St 22 (Blk 238, 239, 240, 241, 242, 243, 244, 245, 246, 248, 249, 250, 251, 252, 253, 254, 255, 256, 257, 258, 259, 260, 261, 262, 263, 283, 285) / Bishan St 24 (Blk 264, 265, 266, 268, 270, 271, 272, 278, 287)
Of these 176 cases, 161 (91.5%) were Singapore Residents. Majority of the cases (84.7%) were in the 11-60 years age group. The female to male ratio was 1:1.5. Based on the reported occupations, the cases comprised 35 students, 13 housewives, 6 retirees, 4 unemployed persons and 69 working adults. Information was not available for 49 cases. Figure 2.12 shows the geographical distribution of cases in the cluster.
53
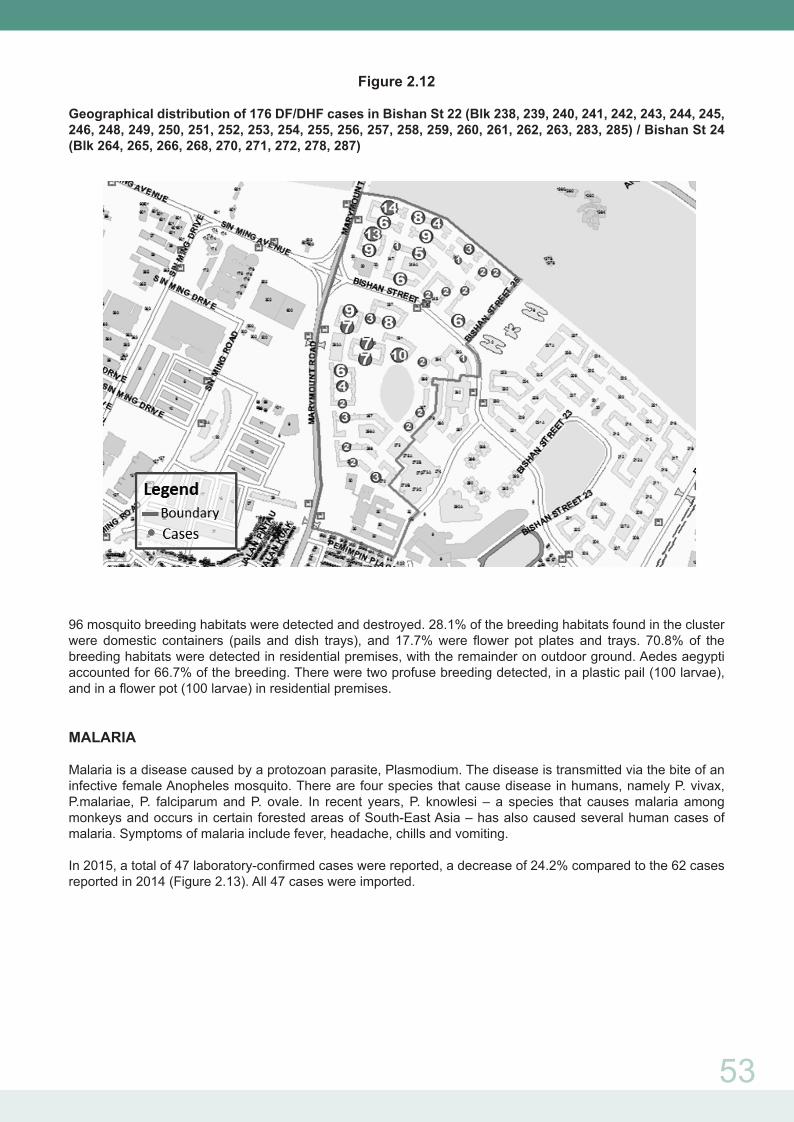
Figure 2.12
Geographical distribution of 176 DF/DHF cases in Bishan St 22 (Blk 238, 239, 240, 241, 242, 243, 244, 245, 246, 248, 249, 250, 251, 252, 253, 254, 255, 256, 257, 258, 259, 260, 261, 262, 263, 283, 285) / Bishan St 24 (Blk 264, 265, 266, 268, 270, 271, 272, 278, 287)
96 mosquito breeding habitats were detected and destroyed. 28.1% of the breeding habitats found in the cluster were domestic containers (pails and dish trays), and 17.7% were flower pot plates and trays. 70.8% of the breeding habitats were detected in residential premises, with the remainder on outdoor ground. Aedes aegypti accounted for 66.7% of the breeding. There were two profuse breeding detected, in a plastic pail (100 larvae), and in a flower pot (100 larvae) in residential premises.
MALARIA
Malaria is a disease caused by a protozoan parasite, Plasmodium. The disease is transmitted via the bite of an infective female Anopheles mosquito. There are four species that cause disease in humans, namely P. vivax, P.malariae, P. falciparum and P. ovale. In recent years, P. knowlesi – a species that causes malaria among monkeys and occurs in certain forested areas of South-East Asia – has also caused several human cases of malaria. Symptoms of malaria include fever, headache, chills and vomiting.
In 2015, a total of 47 laboratory-confirmed cases were reported, a decrease of 24.2% compared to the 62 cases reported in 2014 (Figure 2.13). All 47 cases were imported.

54
Figure 2.13E-weekly distribution of reported malaria cases, 2014-2015
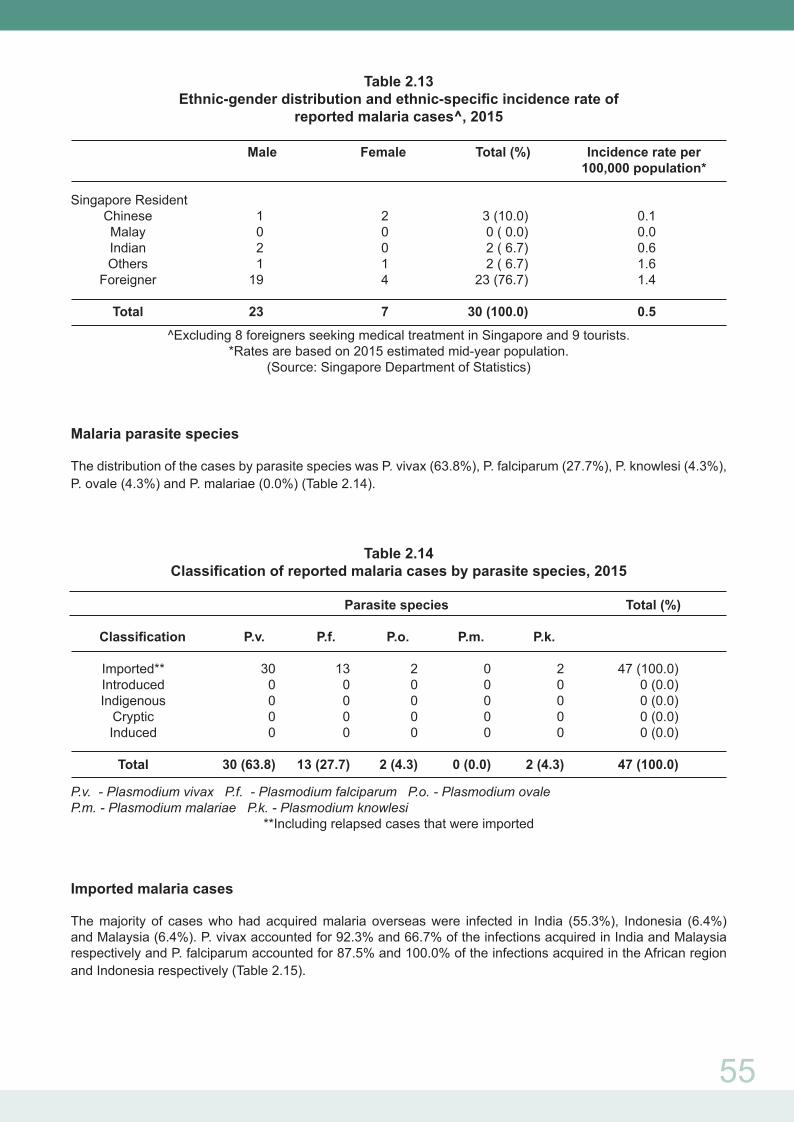
The incidence rate was highest in the 15-24 years age group, with a male to female ratio of 1.7:1 (Table 2.12). Among the three major ethnic groups, Indians had the highest incidence rate, followed by Chinese and Malay (Table 2.13).
Table 2.12Age-gender distribution and age-specific incidence rate of
reported malaria cases^, 2015
Age Male Female Total (%) Incidence rate per 100,000 population*
0 – 4 0 0 0 (0.0) 0.0 5 – 14 0 1 1 (3.3) 0.2 15 – 24 5 3 8 (26.7) 1.1 25 – 34 12 1 13 (43.3) 1.0 35 – 44 3 1 4 (13.3) 0.4 45 – 54 1 0 1 (3.3) 0.1 55 - 64 2 1 3 (10.0) 0.5 65+ 0 0 0 (0.0) 0.0
Total 23 7 30 0.5
^Excluding 8 foreigners seeking medical treatment in Singapore and 9 tourists.*Rates are based on 2015 estimated mid-year population.
(Source: Singapore Department of Statistics)
No. of Cases
1 3 5 7 9 11 13 15 17 19 21 23 25 27 29 31 33 35 37 39 41 43 45 47 49 51 53
Week2014 2015
0
1
2
3
4
5
6
7
8
55
Table 2.13Ethnic-gender distribution and ethnic-specific incidence rate of
reported malaria cases^, 2015
Male Female Total (%) Incidence rate per 100,000 population*
Singapore Resident Chinese 1 2 3 (10.0) 0.1 Malay 0 0 0 ( 0.0) 0.0 Indian 2 0 2 ( 6.7) 0.6 Others 1 1 2 ( 6.7) 1.6 Foreigner 19 4 23 (76.7) 1.4 Total 23 7 30 (100.0) 0.5
^Excluding 8 foreigners seeking medical treatment in Singapore and 9 tourists.*Rates are based on 2015 estimated mid-year population.
(Source: Singapore Department of Statistics)
Malaria parasite species
The distribution of the cases by parasite species was P. vivax (63.8%), P. falciparum (27.7%), P. knowlesi (4.3%), P. ovale (4.3%) and P. malariae (0.0%) (Table 2.14).
Table 2.14Classification of reported malaria cases by parasite species, 2015
Parasite species Total (%)
Classification P.v. P.f. P.o. P.m. P.k. Imported** 30 13 2 0 2 47 (100.0) Introduced 0 0 0 0 0 0 (0.0) Indigenous 0 0 0 0 0 0 (0.0) Cryptic 0 0 0 0 0 0 (0.0) Induced 0 0 0 0 0 0 (0.0)
Total 30 (63.8) 13 (27.7) 2 (4.3) 0 (0.0) 2 (4.3) 47 (100.0)
P.v. - Plasmodium vivax P.f. - Plasmodium falciparum P.o. - Plasmodium ovale P.m. - Plasmodium malariae P.k. - Plasmodium knowlesi
**Including relapsed cases that were imported
Imported malaria cases
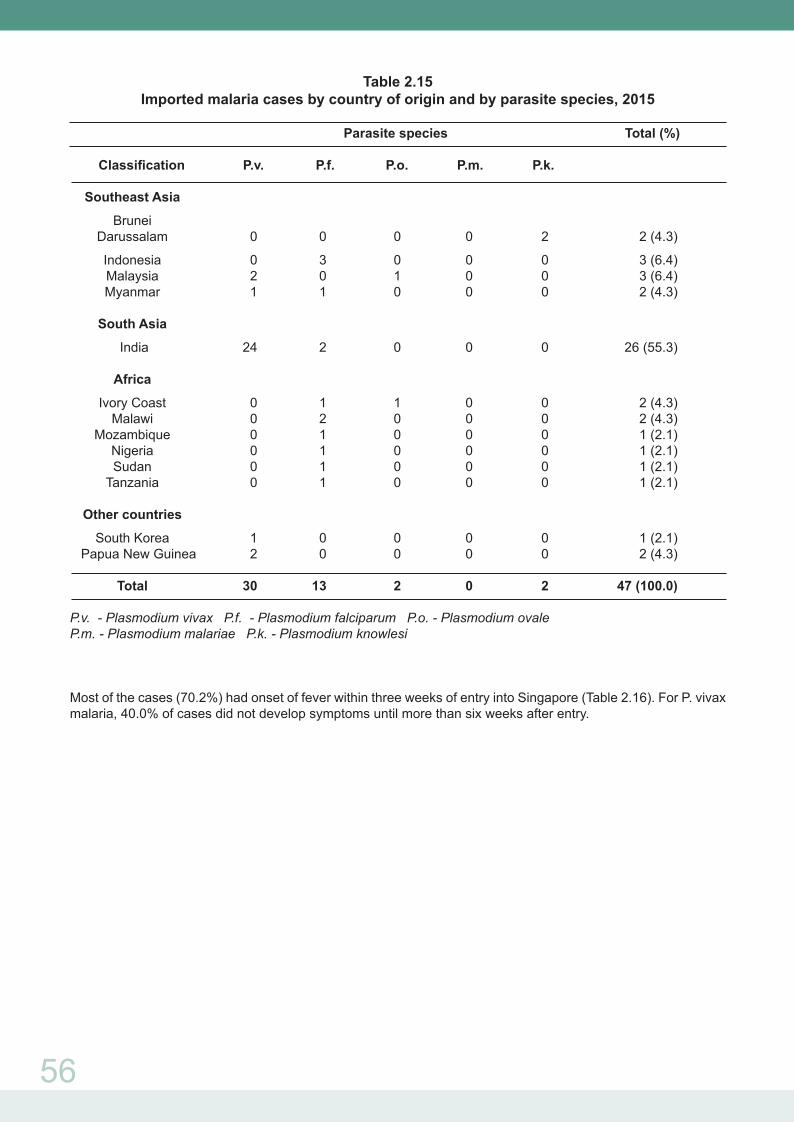
The majority of cases who had acquired malaria overseas were infected in India (55.3%), Indonesia (6.4%) and Malaysia (6.4%). P. vivax accounted for 92.3% and 66.7% of the infections acquired in India and Malaysia respectively and P. falciparum accounted for 87.5% and 100.0% of the infections acquired in the African region and Indonesia respectively (Table 2.15).
56
Table 2.15Imported malaria cases by country of origin and by parasite species, 2015
Parasite species Total (%)
Classification P.v. P.f. P.o. P.m. P.k. Southeast Asia
Brunei Darussalam 0 0 0 0 2 2 (4.3)
Indonesia 0 3 0 0 0 3 (6.4) Malaysia 2 0 1 0 0 3 (6.4) Myanmar 1 1 0 0 0 2 (4.3)
South Asia
India 24 2 0 0 0 26 (55.3) Africa
Ivory Coast 0 1 1 0 0 2 (4.3) Malawi 0 2 0 0 0 2 (4.3) Mozambique 0 1 0 0 0 1 (2.1) Nigeria 0 1 0 0 0 1 (2.1) Sudan 0 1 0 0 0 1 (2.1) Tanzania 0 1 0 0 0 1 (2.1)
Other countries
South Korea 1 0 0 0 0 1 (2.1) Papua New Guinea 2 0 0 0 0 2 (4.3)
Total 30 13 2 0 2 47 (100.0)
P.v. - Plasmodium vivax P.f. - Plasmodium falciparum P.o. - Plasmodium ovale P.m. - Plasmodium malariae P.k. - Plasmodium knowlesi
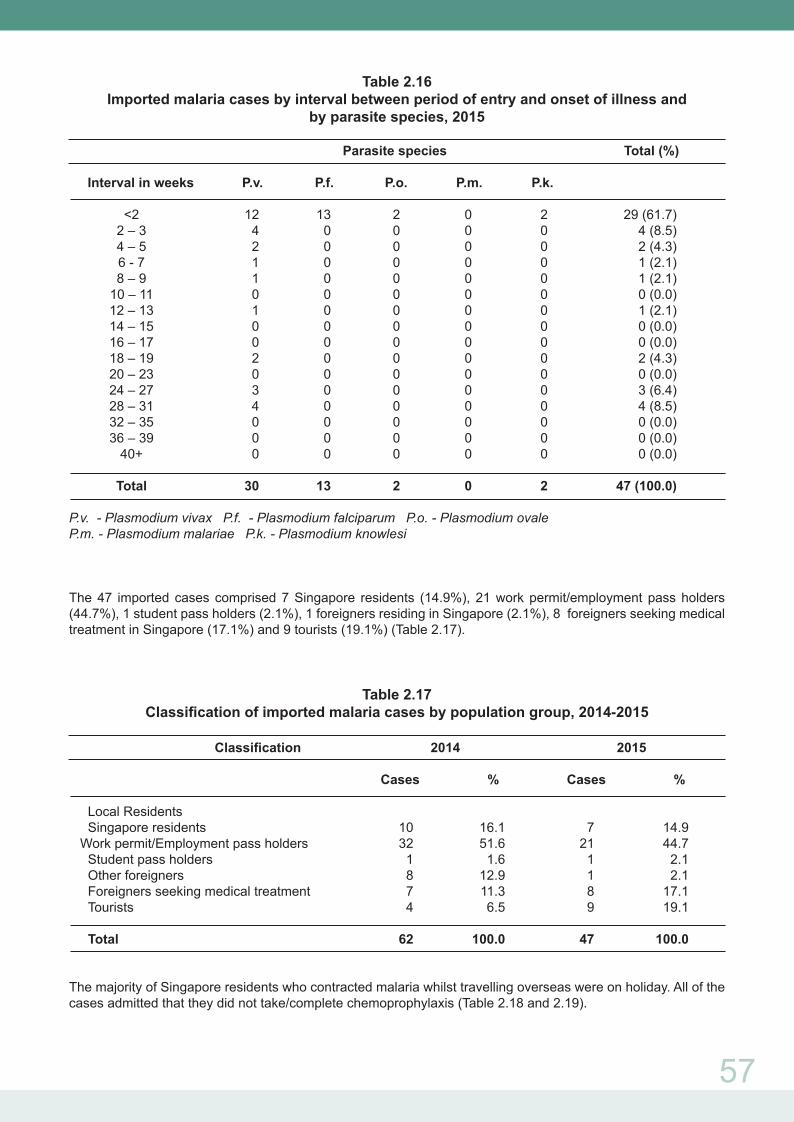
Most of the cases (70.2%) had onset of fever within three weeks of entry into Singapore (Table 2.16). For P. vivax malaria, 40.0% of cases did not develop symptoms until more than six weeks after entry.
57
Table 2.16Imported malaria cases by interval between period of entry and onset of illness and
by parasite species, 2015
Parasite species Total (%)
Interval in weeks P.v. P.f. P.o. P.m. P.k. <2 12 13 2 0 2 29 (61.7) 2 – 3 4 0 0 0 0 4 (8.5) 4 – 5 2 0 0 0 0 2 (4.3) 6 - 7 1 0 0 0 0 1 (2.1) 8 – 9 1 0 0 0 0 1 (2.1) 10 – 11 0 0 0 0 0 0 (0.0) 12 – 13 1 0 0 0 0 1 (2.1) 14 – 15 0 0 0 0 0 0 (0.0) 16 – 17 0 0 0 0 0 0 (0.0) 18 – 19 2 0 0 0 0 2 (4.3) 20 – 23 0 0 0 0 0 0 (0.0) 24 – 27 3 0 0 0 0 3 (6.4) 28 – 31 4 0 0 0 0 4 (8.5) 32 – 35 0 0 0 0 0 0 (0.0) 36 – 39 0 0 0 0 0 0 (0.0) 40+ 0 0 0 0 0 0 (0.0)
Total 30 13 2 0 2 47 (100.0)
P.v. - Plasmodium vivax P.f. - Plasmodium falciparum P.o. - Plasmodium ovale P.m. - Plasmodium malariae P.k. - Plasmodium knowlesi
The 47 imported cases comprised 7 Singapore residents (14.9%), 21 work permit/employment pass holders (44.7%), 1 student pass holders (2.1%), 1 foreigners residing in Singapore (2.1%), 8 foreigners seeking medical treatment in Singapore (17.1%) and 9 tourists (19.1%) (Table 2.17).
Table 2.17Classification of imported malaria cases by population group, 2014-2015
Classification 2014 2015
Cases % Cases %
Local Residents Singapore residents 10 16.1 7 14.9 Work permit/Employment pass holders 32 51.6 21 44.7 Student pass holders 1 1.6 1 2.1 Other foreigners 8 12.9 1 2.1 Foreigners seeking medical treatment 7 11.3 8 17.1 Tourists 4 6.5 9 19.1
Total 62 100.0 47 100.0
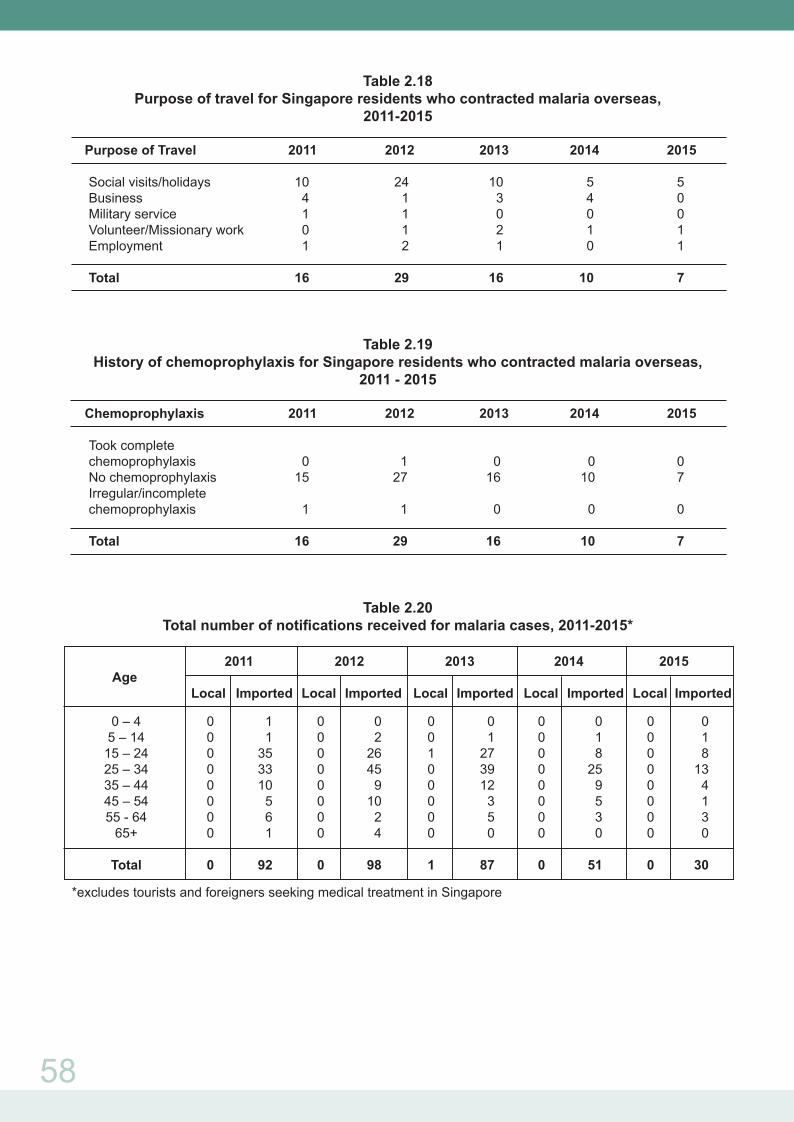
The majority of Singapore residents who contracted malaria whilst travelling overseas were on holiday. All of the cases admitted that they did not take/complete chemoprophylaxis (Table 2.18 and 2.19).
58
Table 2.18Purpose of travel for Singapore residents who contracted malaria overseas,
2011-2015
Purpose of Travel 2011 2012 2013 2014 2015 Social visits/holidays 10 24 10 5 5 Business 4 1 3 4 0 Military service 1 1 0 0 0 Volunteer/Missionary work 0 1 2 1 1 Employment 1 2 1 0 1
Total 16 29 16 10 7
Table 2.19History of chemoprophylaxis for Singapore residents who contracted malaria overseas,
2011 - 2015
Chemoprophylaxis 2011 2012 2013 2014 2015
Took complete chemoprophylaxis 0 1 0 0 0 No chemoprophylaxis 15 27 16 10 7 Irregular/incomplete chemoprophylaxis 1 1 0 0 0
Total 16 29 16 10 7
Table 2.20Total number of notifications received for malaria cases, 2011-2015*
2011 2012 2013 2014 2015 Age Local Imported Local Imported Local Imported Local Imported Local Imported
0 – 4 0 1 0 0 0 0 0 0 0 0 5 – 14 0 1 0 2 0 1 0 1 0 1 15 – 24 0 35 0 26 1 27 0 8 0 8 25 – 34 0 33 0 45 0 39 0 25 0 13 35 – 44 0 10 0 9 0 12 0 9 0 4 45 – 54 0 5 0 10 0 3 0 5 0 1 55 - 64 0 6 0 2 0 5 0 3 0 3 65+ 0 1 0 4 0 0 0 0 0 0 Total 0 92 0 98 1 87 0 51 0 30
*excludes tourists and foreigners seeking medical treatment in Singapore
59
JAPANESE ENCEPHALITIS
Japanese encephalitis is an arthropod-borne disease, characterized by sudden onset of high fever, chills, severe headache, meningismus, photophobia, nausea, abdominal pain, drowsiness and obtundation. The mode of transmission is through the bite of infective mosquitoes from the Culex tritaeniorhynchus species. The infectious agent is the Japanese encephalitis virus (a Flavivirus), which the mosquitoes acquire mainly from domestic pigs and wild birds.
There was an imported case of Japanese encephalitis reported in 2015. The case involved a 11-year-old student from the Netherlands who arrived from Indonesia for medical treatment on 30 July 2015. She was on holiday with her family in Bali. She developed fever, severe headache, vomiting, abdominal pain, confusion, behavior change and hallucinations since 26 July 2015 and was evacuated from Indonesia to Singapore. She was subsequently warded in KKH. Blood serology was positive for Japanese Encephalitis IgM and IgG antibodies.


![Chikungunya kbk.ppt [Read-Only]ocw.usu.ac.id/.../mk_itps_slide_cikungunya_fever.pdf · Course of Illness • Fever typically lasts for 2 -3 days and comes down • Fever may reoccur](https://img.dokumen.tips/doc/110x75/5cc976a288c99348378c6aa3/chikungunya-kbkppt-read-onlyocwusuacidmkitpsslidecikungunyafeverpdf.jpg)
![Dengue Fever/Severe Dengue Fever/Chikungunya Fever · Dengue fever and severe dengue (dengue hemorrhagic fever [DHF] and dengue shock syndrome [DSS]) are caused by any of four closely](https://img.dokumen.tips/doc/110x75/5e87bf3e7a86e85d3b149cd7/dengue-feversevere-dengue-feverchikungunya-dengue-fever-and-severe-dengue-dengue.jpg)