Embed Size (px)
Citation preview
161
CHAPTER FIVE
TRANSFORMATION OF THE HOUSES.
5.1 Introduction
This Chapter presents and discusses the details of the research findings as it
relates to two aspects of transformation. First is the physical transformation that has taken
place in the spatial organization and design of the buildings within the two estates,
change of use, addition and subtraction of spaces. The issues were first discussed
separately for the two concerned estates and later together to give a holistic picture of the
transformation experience generally. These analyses involved first, an identification of
the residents who had transformed, an investigation to find out the number of those who
had transformed as against those who had not, reasons why they have transformed, the
original types of building the residents occupied before transformation if any took place,
the types of physical alterations that had been made both in the interior spaces of their
individual houses and the exterior as well as even the open spaces. It also discusses
briefly some of the uses into which the transformed spaces have been put.
Second are the different processes through which transformation took place. It
begins with a description of the first forms of transformation that took place as indicated
by the individual respondents, what exactly has been done and the availability or absence
of building plans or approval documents showing the proposed development in order to
know how well the Low-Income residents have complied with the preliminary building
and planning rules/regulations . This was followed by the cost implications of their
individual kind of transformation as well as how the residents sourced for financial
empowerment with which they carried out the exercises. The construction procedures that
were employed in the execution of transformation in the estates were also discussed. The
aim of this exercise is to describe as precisely as possible and using multi-dimensional
statistical methods, the processes that were involved in housing transformation in Low-
Income housing. Other issues analyzed in this Chapter include the duration it took for the
residents to actualize their various transformations irrespective of the magnitude or type.
162
5.2 Types of Houses Originally Provided
The type of houses in this research refers to the housing typology as originally
built and allocated to the initial residents. In this regard, the type of houses and the
number of bedrooms available to the different typologies within the estates were
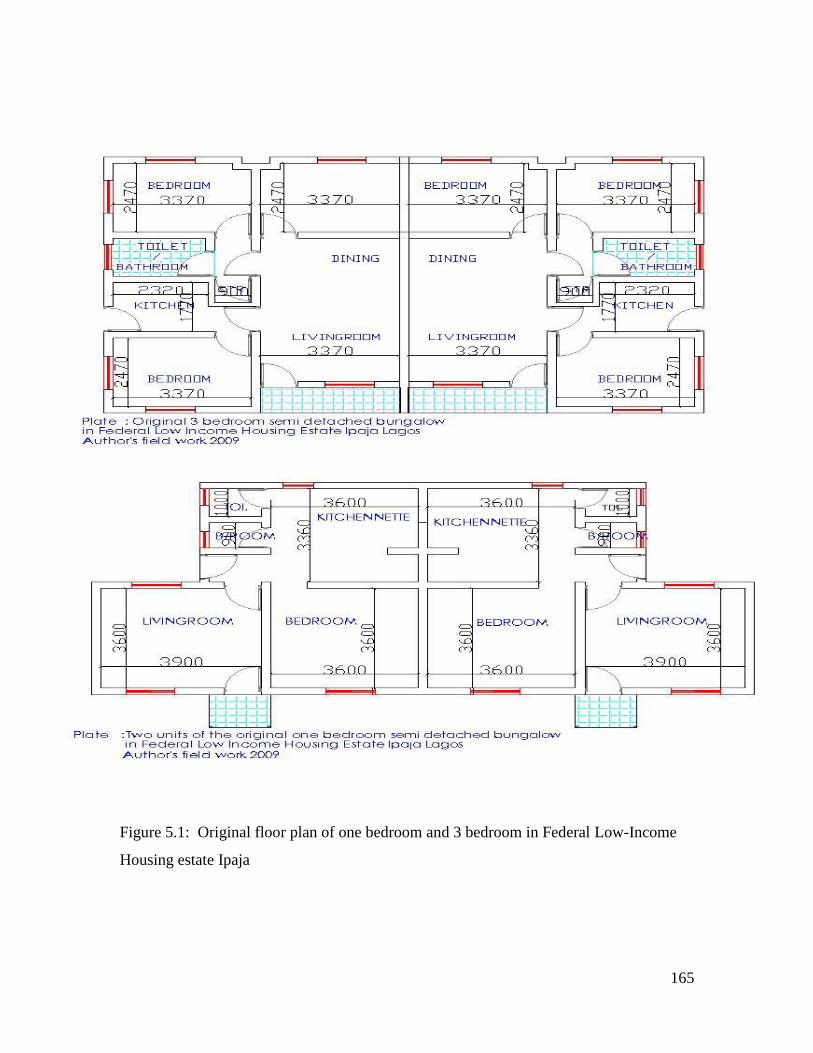
discovered to be between one (1) and three (3) bedrooms as the case may be. A one-
bedroom house consists of a single bedroom, a living room, kitchen, toilet and bathroom.
A two bedroom had two-bedroom s, a living room, kitchen, toilet and bathroom. A three -
bedroom house had 3 bedrooms, a living room, kitchen, toilet and bathroom. Lastly is a
one-bed- seater house where the only private space is a single bedroom and had a kitchen,
toilet and bathroom which is shared by other residents within a particular block of
apartments.
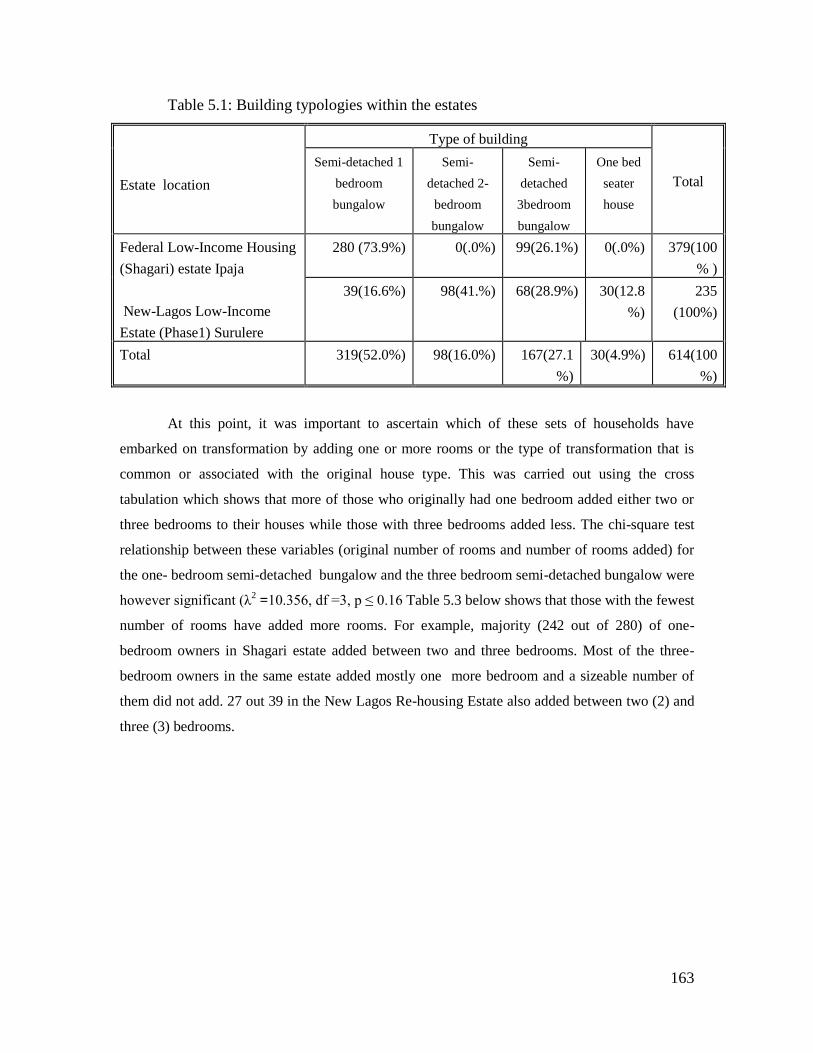
The field survey data revealed that majority (73.9%) of the respondents in the
Federal Low-Income Estates Ipaja originally had one bedroom in their houses, although
this has long changed as most of them have added several bedrooms to their houses,
while 26.1% had three bedrooms. There were no two (2) bedrooms in the entire estate
because it was meant to be part of the second phase which did not come to pass.
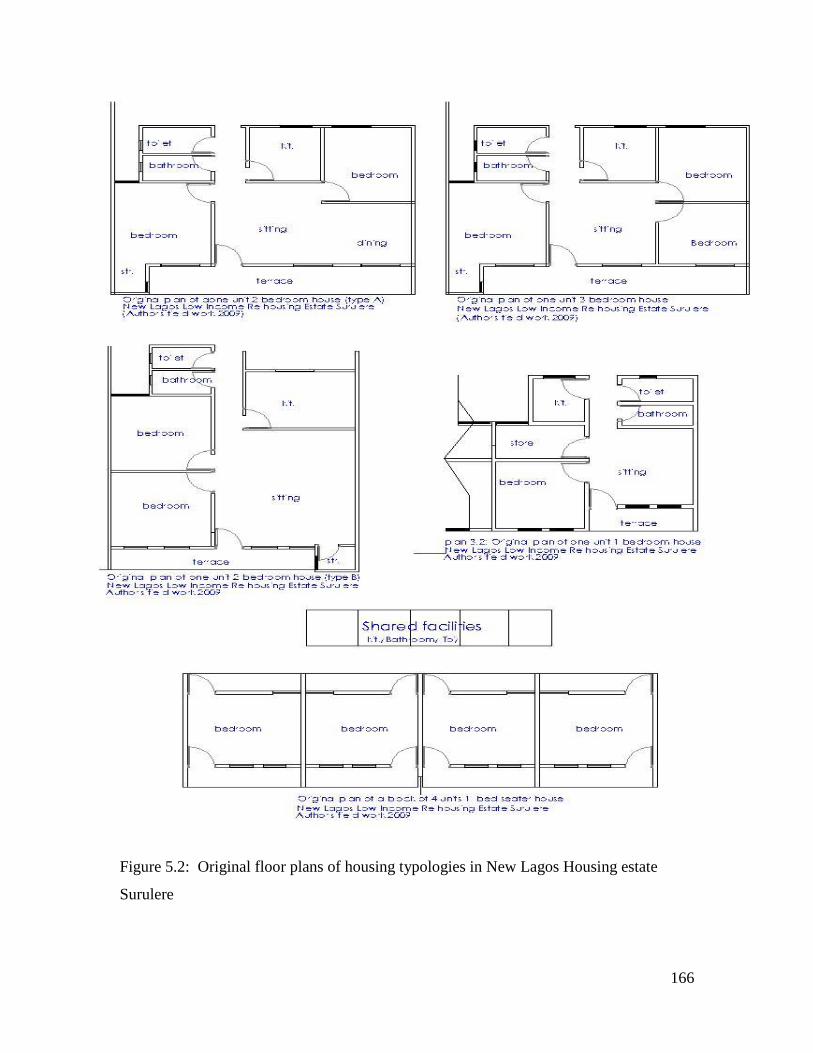
The New Lagos Low-Income Re-housing estate was observed to have four
different typology of houses within it but these were present in small numbers in almost
all the streets within the estate and also in rows of four. The number of bedrooms
available to the four different typologies within the estate range between one (1) and
three (3) as the case maybe and the field survey data revealed that 41.7% of the
respondents originally had two bedrooms in their houses, though this has changed as
most of them have added several rooms which they rented out to complete strangers for
diverse uses to their houses, 28.9% had three bedrooms while 16.6% had one bedroom.
The least percentage (12.8%) of household occupied a one bed-seater house where it is
just a single room which doubles as both living and bedroom with its bathroom and toilet
which is shared by other neighbours at a distance away.
163
Table 5.1: Building typologies within the estates
Estate location
Type of building
Total
Semi-detached 1
bedroom
bungalow
Semi-
detached 2-
bedroom
bungalow
Semi-
detached
3bedroom
bungalow
One bed
seater
house
Federal Low-Income Housing
(Shagari) estate Ipaja
New-Lagos Low-Income
Estate (Phase1) Surulere
280 (73.9%) 0(.0%) 99(26.1%) 0(.0%) 379(100
% )
39(16.6%) 98(41.%) 68(28.9%) 30(12.8
%)
235
(100%)
Total 319(52.0%) 98(16.0%) 167(27.1
%)
30(4.9%) 614(100
%)
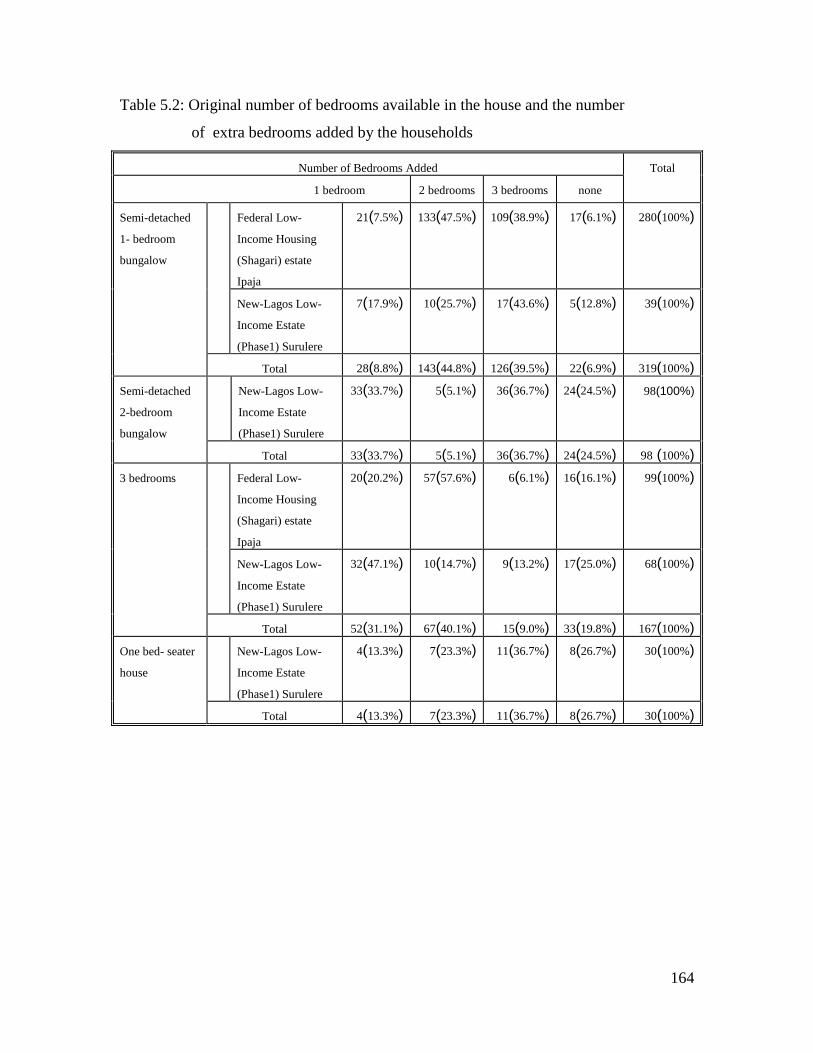
At this point, it was important to ascertain which of these sets of households have
embarked on transformation by adding one or more rooms or the type of transformation that is
common or associated with the original house type. This was carried out using the cross
tabulation which shows that more of those who originally had one bedroom added either two or
three bedrooms to their houses while those with three bedrooms added less. The chi-square test
relationship between these variables (original number of rooms and number of rooms added) for
the one- bedroom semi-detached bungalow and the three bedroom semi-detached bungalow were
however significant (λ2 =10.356, df =3, p ≤ 0.16 Table 5.3 below shows that those with the fewest
number of rooms have added more rooms. For example, majority (242 out of 280) of one-
bedroom owners in Shagari estate added between two and three bedrooms. Most of the three-
bedroom owners in the same estate added mostly one more bedroom and a sizeable number of
them did not add. 27 out 39 in the New Lagos Re-housing Estate also added between two (2) and
three (3) bedrooms.
164
Table 5.2: Original number of bedrooms available in the house and the number
of extra bedrooms added by the households
Number of Bedrooms Added Total
1 bedroom 2 bedrooms 3 bedrooms none
Semi-detached
1- bedroom
bungalow
Federal Low-
Income Housing
(Shagari) estate
Ipaja
21(7.5%) 133(47.5%) 109(38.9%) 17(6.1%) 280(100%)
New-Lagos Low-
Income Estate
(Phase1) Surulere
7(17.9%) 10(25.7%) 17(43.6%) 5(12.8%) 39(100%)
Total 28(8.8%) 143(44.8%) 126(39.5%) 22(6.9%) 319(100%)
Semi-detached
2-bedroom
bungalow
New-Lagos Low-
Income Estate
(Phase1) Surulere
33(33.7%) 5(5.1%) 36(36.7%) 24(24.5%) 98(100%)
Total 33(33.7%) 5(5.1%) 36(36.7%) 24(24.5%) 98 (100%)
3 bedrooms Federal Low-
Income Housing
(Shagari) estate
Ipaja
20(20.2%) 57(57.6%) 6(6.1%) 16(16.1%) 99(100%)
New-Lagos Low-
Income Estate
(Phase1) Surulere
32(47.1%) 10(14.7%) 9(13.2%) 17(25.0%) 68(100%)
Total 52(31.1%) 67(40.1%) 15(9.0%) 33(19.8%) 167(100%)
One bed- seater
house
New-Lagos Low-
Income Estate
(Phase1) Surulere
4(13.3%) 7(23.3%) 11(36.7%) 8(26.7%) 30(100%)
Total 4(13.3%) 7(23.3%) 11(36.7%) 8(26.7%) 30(100%)
165
Figure 5.1: Original floor plan of one bedroom and 3 bedroom in Federal Low-Income
Housing estate Ipaja
166
Figure 5.2: Original floor plans of housing typologies in New Lagos Housing estate
Surulere
167
5.3 Types of Physical Transformation
5.3.1 Addition of more Bedrooms
Available statistics from field survey shows that most people who have
transformed their houses within the estates have done so by adding one or more
bedrooms to what they had or have increased the sizes of their interior spaces to the tune
of about 80% of the land area there by reducing drastically the outdoor spaces.
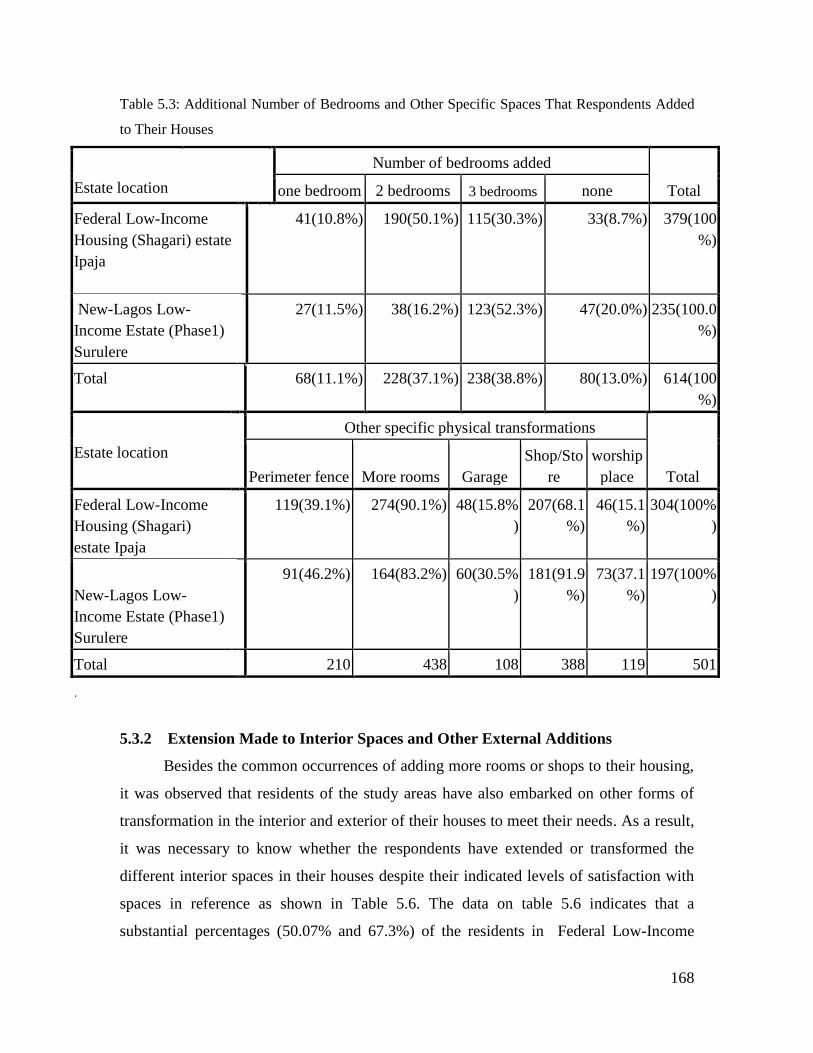
In the case of Federal Low-Income Estates Ipaja a little above half (50.1%) of
the respondents have added two (2) bedrooms to their houses, 30.3% have added as much
as three(3) bedrooms while 10.8% have added only one more bedroom while from table
5.7, it shows that in the New Lagos housing estate most of them . 52.3% of the
respondents have added as much as three more bedrooms to their houses, 16.2% have
added two bedrooms while only 11.5% have added only one more bedroom. There are
empirical statistics as shown also in Table 5.7 that there were some residents who may
have embarked on transformation by carrying out varied forms of alterations to the
original building forms like adding shops which accounts for 46.2% for perimeter
fence,30.5% garages and 91.9% who have added shops or sales outlets. all of these were
achieved either by direct attachment to the existing structures, by placing them within the
compound or as part of the perimeter boundary fence. This result also suggests that
almost all the residents have a sales outfit within or around their houses.
168
Table 5.3: Additional Number of Bedrooms and Other Specific Spaces That Respondents Added
to Their Houses
Number of bedrooms added
Total Estate location one bedroom 2 bedrooms 3 bedrooms none
Federal Low-Income
Housing (Shagari) estate
Ipaja
41(10.8%) 190(50.1%) 115(30.3%) 33(8.7%) 379(100
%)
New-Lagos Low-
Income Estate (Phase1)
Surulere
27(11.5%) 38(16.2%) 123(52.3%) 47(20.0%) 235(100.0
%)
Total 68(11.1%) 228(37.1%) 238(38.8%) 80(13.0%) 614(100
%)
Other specific physical transformations
Total
Estate location
Perimeter fence More rooms Garage
Shop/Sto
re
worship
place
Federal Low-Income
Housing (Shagari)
estate Ipaja
119(39.1%) 274(90.1%) 48(15.8%
)
207(68.1
%)
46(15.1
%)
304(100%
)
New-Lagos Low-
Income Estate (Phase1)
Surulere
91(46.2%) 164(83.2%) 60(30.5%
)
181(91.9
%)
73(37.1
%)
197(100%
)
Total 210 438 108 388 119 501
.
5.3.2 Extension Made to Interior Spaces and Other External Additions
Besides the common occurrences of adding more rooms or shops to their housing,
it was observed that residents of the study areas have also embarked on other forms of
transformation in the interior and exterior of their houses to meet their needs. As a result,
it was necessary to know whether the respondents have extended or transformed the
different interior spaces in their houses despite their indicated levels of satisfaction with
spaces in reference as shown in Table 5.6. The data on table 5.6 indicates that a
substantial percentages (50.07% and 67.3%) of the residents in Federal Low-Income
169
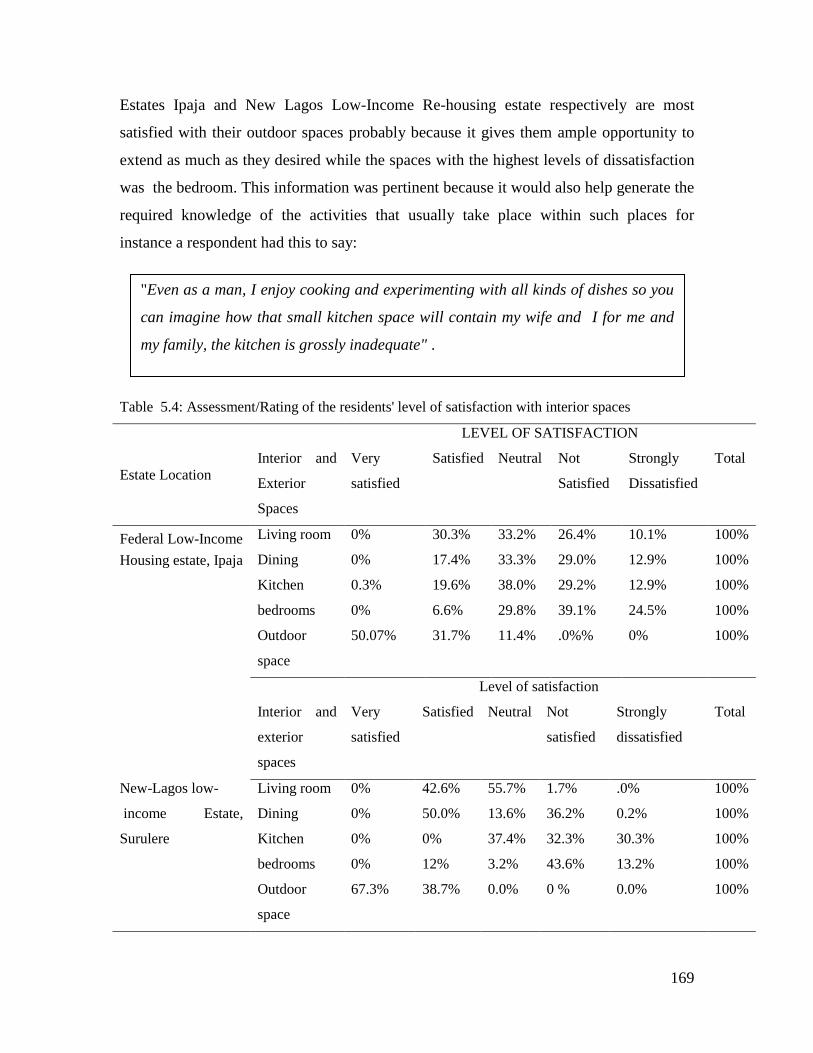
Estates Ipaja and New Lagos Low-Income Re-housing estate respectively are most
satisfied with their outdoor spaces probably because it gives them ample opportunity to
extend as much as they desired while the spaces with the highest levels of dissatisfaction
was the bedroom. This information was pertinent because it would also help generate the
required knowledge of the activities that usually take place within such places for
instance a respondent had this to say:
Table 5.4: Assessment/Rating of the residents' level of satisfaction with interior spaces
Estate Location
Interior and
Exterior
Spaces
LEVEL OF SATISFACTION
Very
satisfied
Satisfied Neutral Not
Satisfied
Strongly
Dissatisfied
Total
Federal Low-Income
Housing estate, Ipaja
Living room 0% 30.3% 33.2% 26.4% 10.1% 100%
Dining 0% 17.4% 33.3% 29.0% 12.9% 100%
Kitchen 0.3% 19.6% 38.0% 29.2% 12.9% 100%
bedrooms 0% 6.6% 29.8% 39.1% 24.5% 100%
Outdoor
space
50.07% 31.7% 11.4% .0%% 0% 100%
Interior and
exterior
spaces
Level of satisfaction
Very
satisfied
Satisfied Neutral Not
satisfied
Strongly
dissatisfied
Total
New-Lagos low-
income Estate,
Surulere
Living room 0% 42.6% 55.7% 1.7% .0% 100%
Dining 0% 50.0% 13.6% 36.2% 0.2% 100%
Kitchen 0% 0% 37.4% 32.3% 30.3% 100%
bedrooms 0% 12% 3.2% 43.6% 13.2% 100%
Outdoor
space
67.3% 38.7% 0.0% 0 % 0.0% 100%
"Even as a man, I enjoy cooking and experimenting with all kinds of dishes so you
can imagine how that small kitchen space will contain my wife and I for me and
my family, the kitchen is grossly inadequate" .
170
The results in Table 5.5 below show that in Federal Low-Income Estates Ipaja,
59.7% of residents have not added or extended their living room while 40.3% claimed to
have. The enquiry into if the respondents have extended their dining room reveals that
there exist a wide gap between the number of those who have extended their dining or
created one where it was absent initially and those who have not. The respondents who
have not transformed their dining rooms have a percentage of 69.3% while 30.7% have
extended or transformed. It must be stated here that the 69.3% who claimed not to have
transformed their dining room spaces are made up of those who did not have dinning
spaces in their houses at the initial stage and did not bother to add it, as well as those who
had and have not extended by increasing the space, while the 30.7 % also comprise of
those who had but were not satisfied and as a result decided to transform to suit
themselves as well as those who did not have but have a need for it so went ahead to
include it by carrying out transformation.
The adequacy or otherwise of the kitchen space being the "natural work place" for
the woman is mostly assessed by the women in the house. Most of the respondents who
were men noted that they may not have noticed any serious changes made to the kitchens
in their houses but agreed verbally that though their kitchen size and location may not
have been the best but their wives may have altered something to suit them.
volunteered a respondents. On this note, those who out rightly agreed to have
transformed their kitchen had 47.6% while 52.4% said there had been no transformation
done to their kitchens.
The bedroom, particularly the children’s room is one part of a house that
accommodates most of the children’s activities without necessarily affecting the other
parts of the house. It is so treated to give children a proper and secluded place to play and
do things their own way. Sometimes due to the available number of bedrooms it becomes
difficult to assign any particular room to the children but rather allow them to share
“You know the kitchen is the traditional office of the woman as a result,
my wife keeps adjusting repeatedly to suit her needs so I may not be too
precise on this issue but I know the kitchen has witnessed a lot of
changes since we moved in here”
171
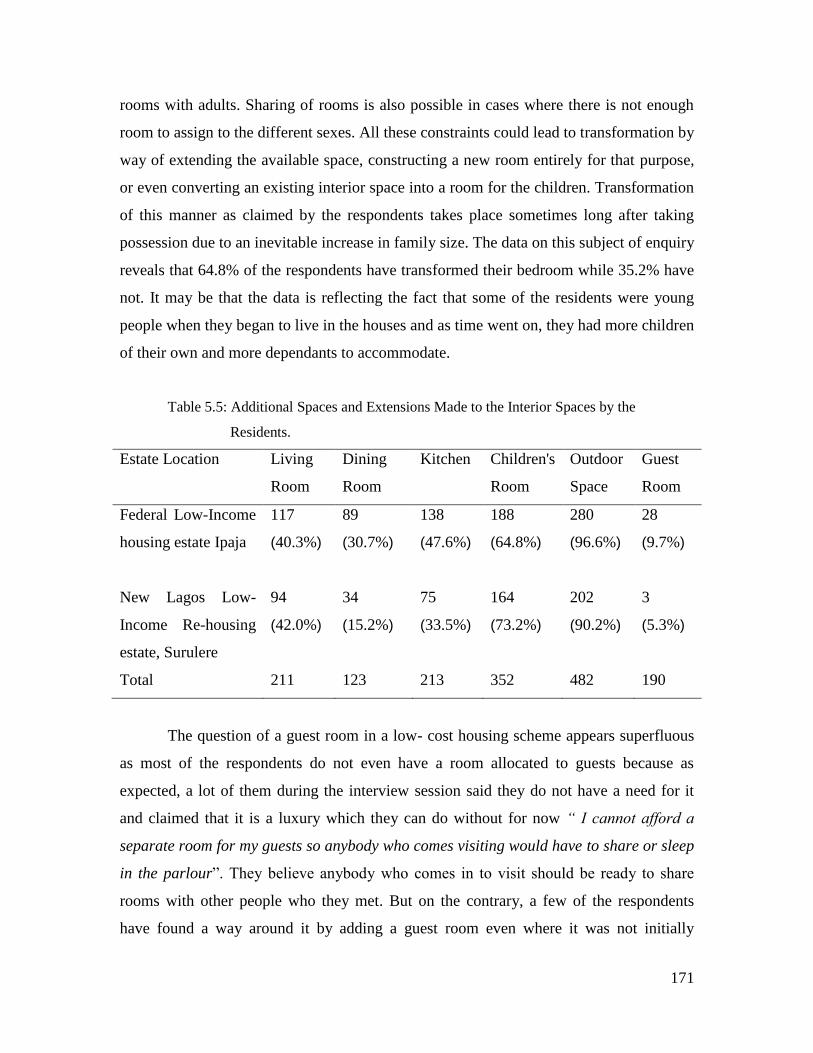
rooms with adults. Sharing of rooms is also possible in cases where there is not enough
room to assign to the different sexes. All these constraints could lead to transformation by
way of extending the available space, constructing a new room entirely for that purpose,
or even converting an existing interior space into a room for the children. Transformation
of this manner as claimed by the respondents takes place sometimes long after taking
possession due to an inevitable increase in family size. The data on this subject of enquiry
reveals that 64.8% of the respondents have transformed their bedroom while 35.2% have
not. It may be that the data is reflecting the fact that some of the residents were young
people when they began to live in the houses and as time went on, they had more children
of their own and more dependants to accommodate.
Table 5.5: Additional Spaces and Extensions Made to the Interior Spaces by the
Residents.
Estate Location Living
Room
Dining
Room
Kitchen Children's
Room
Outdoor
Space
Guest
Room
Federal Low-Income
housing estate Ipaja
117
(40.3%)
89
(30.7%)
138
(47.6%)
188
(64.8%)
280
(96.6%)
28
(9.7%)
New Lagos Low-
Income Re-housing
estate, Surulere
94
(42.0%)
34
(15.2%)
75
(33.5%)
164
(73.2%)
202
(90.2%)
3
(5.3%)
Total 211 123 213 352 482 190
The question of a guest room in a low- cost housing scheme appears superfluous
as most of the respondents do not even have a room allocated to guests because as
expected, a lot of them during the interview session said they do not have a need for it
and claimed that it is a luxury which they can do without for now “ I cannot afford a
separate room for my guests so anybody who comes visiting would have to share or sleep
in the parlour”. They believe anybody who comes in to visit should be ready to share
rooms with other people who they met. But on the contrary, a few of the respondents
have found a way around it by adding a guest room even where it was not initially
172
provided. The data figures therefore followed the same line of thought as a whole lot of
the respondents (90.3%) of the respondents have not added it to their house while only
9.7% have added a space designated as a guest room.
The case was not too different in New Lagos Low-Income re-housing estate as
data from the field show that 58% have not added or extended their living room while
42% have. An enquiry into if the respondents have extended their dining room revealed
that there exist a wide gap between the number of those who have extended their dining
and those who have not. The respondents who have not transformed have a percentage of
84.8% while 15.2% have extended or transformed. It is possible that 84.8% who claimed
not to have transformed their dining room spaces were made up of those who did not
originally have dinning spaces in their initial houses and did not bother to add it, as well
as those who had and have not extended by increasing the space, while the 15.2% also
comprised of those who had but were not satisfied and as a result decided to transform to
suit themselves as well as those who did not have but have a need for it so went ahead to
include it by carrying out transformation.
The responses obtained concerning the kitchen space was observed to be like that
of the Federal Low-Income Housing Estate Ipaja where the men were reluctant in
responding because most of them claimed not to be familiar enough with their kitchens to
be able to assess its level of adequacy. This attitude of reluctance was confirmed by a
respondent who said:
in line with this kind of attitude, those who out rightly agreed to have transformed
their kitchen were 33.5% while 66.5% said there had been no transformation done to
their kitchens.
Transformation for the purpose of having more bedrooms to lay their heads
particularly when the family size increase happened to be one of the ultimate goals of
respondents as claimed that acts of such takes place sometimes long after taking
possession of the house due to an inevitable increase in family size. The data on this
"Honestly I don't understand what happens in that kitchen because
sometimes I see them cook outside and sometimes inside. I guess the
kitchen is too tight for my family".
173
subject of enquiry reveals that 73.2% of the respondents have transformed their children'
room while 26.8% have not. The fact that multiple families occupied the houses at
inception and these families have increased in sizes may be responsible for the high
percentage of those who had transformed to accommodate rooms for their children within
this estate.
174
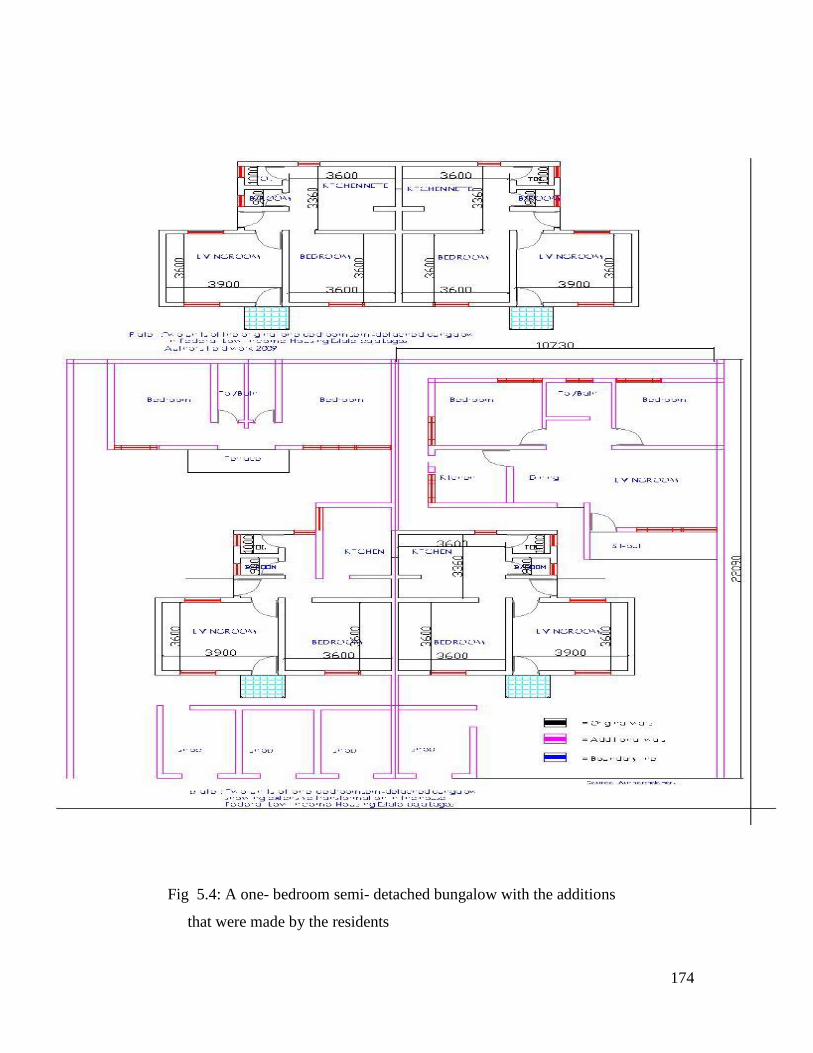
Fig 5.4: A one- bedroom semi- detached bungalow with the additions
that were made by the residents
175
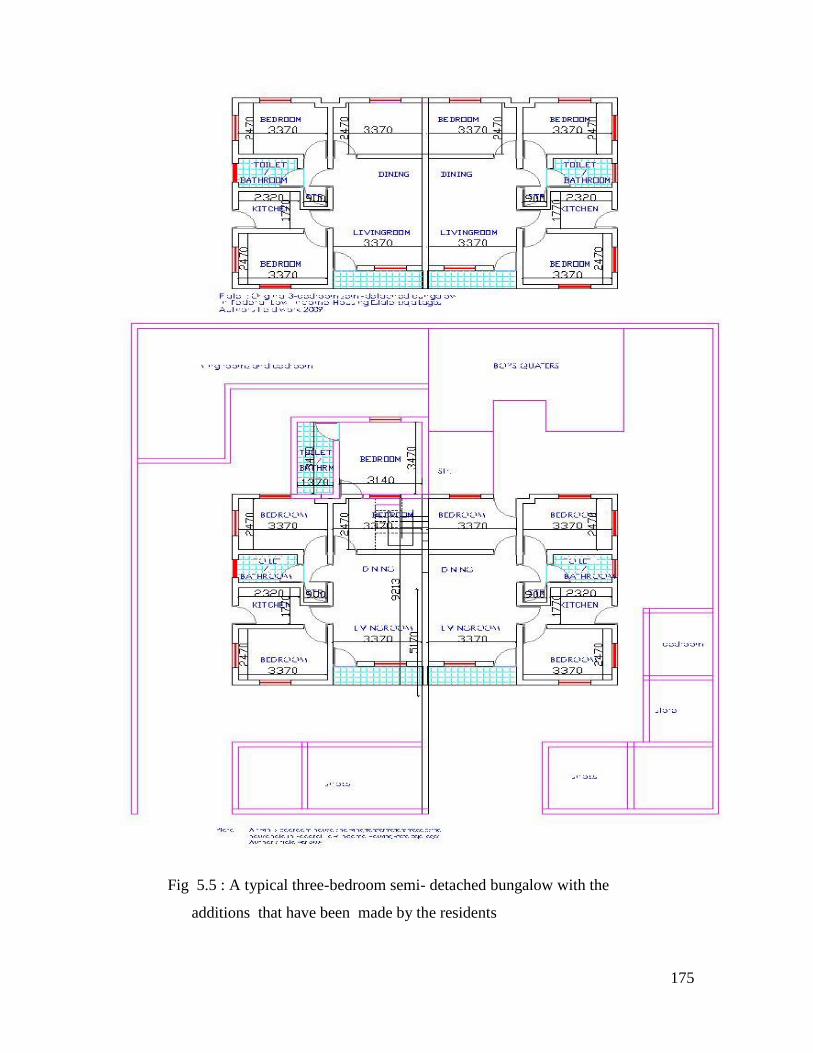
Fig 5.5 : A typical three-bedroom semi- detached bungalow with the
additions that have been made by the residents
176
There was nothing like a guest room in most of the houses as a lot of them during
the verbal interview said that such a special allocation was not necessary because they
can share bedrooms with visitors “Why do I need a special room for guests when I can
rent out an extra room if I have?. Look there is no point pretending to be rich when we
are all managing to survive" But on the contrary, a few (5.3%) of the respondents have
found a way around it by adding a guest rooms even where it was not initially provided.
while 93.7% of the respondents have not added guest rooms to their houses.
5.4 Residents Who Have Transformed
The question of whether a respondent had transformed or not was probably the
most sensitive variable in the questionnaire and even in the interview schedule but it
received emphatic responses which were readily confirmed by physical observation. A
remarkable percentage (71.50%) of the respondents from the Federal Low-Income Estate
in Ipaja agreed that they had in one way or the other transformed their houses. This figure
is sharply in contrast with only 28.50% of the respondents who had not transformed their
houses in any way. Tipple and Shahidul (1999) considered any user-initiated extension
and alteration made to the original form of a building or immediate surrounding for
whatever reason as transformation. A further breakdown of the 71.50% respondents who
transformed their houses shows that 26.12% did so for economic benefits through rent
they get from extra rooms and shops added to their houses, 34.83% transformed because
they needed to provide more and better space to accommodate their growing families,
while 10.55% did so because apart from providing more rooms to accommodate their
families, they needed to also make spaces available for worshiping and other religious
rituals, ensure privacy and security of life and properties. Engaging the chi square tests is
a revelation that the relationship between if they have transformed and the reasons given
was significant (λ2 =614.000, df = 3, p ≤ 0.03).
177
Table 5.6: The Percentage of those who have Transformed and those who have not
Residents Who Have or Not Total
Estate location yes no
Federal Low-Income Housing
(Shagari) estate Ipaja
271(71.5%) 108(28.5%) 379(100%)
New-Lagos Low-Income Estate
(Phase1) Surulere
194(82.6%) 41(17.4%) 235(100%)
Total 465(75.7%) 149(24.3%) 614(100%)
The data obtained in the New Lagos Low-Income housing estate also shows that
majority of the residents (82.55%) agreed that they had in one way or the other
transformed their housing while only 17.45% of the respondents had not transformed
their housing.
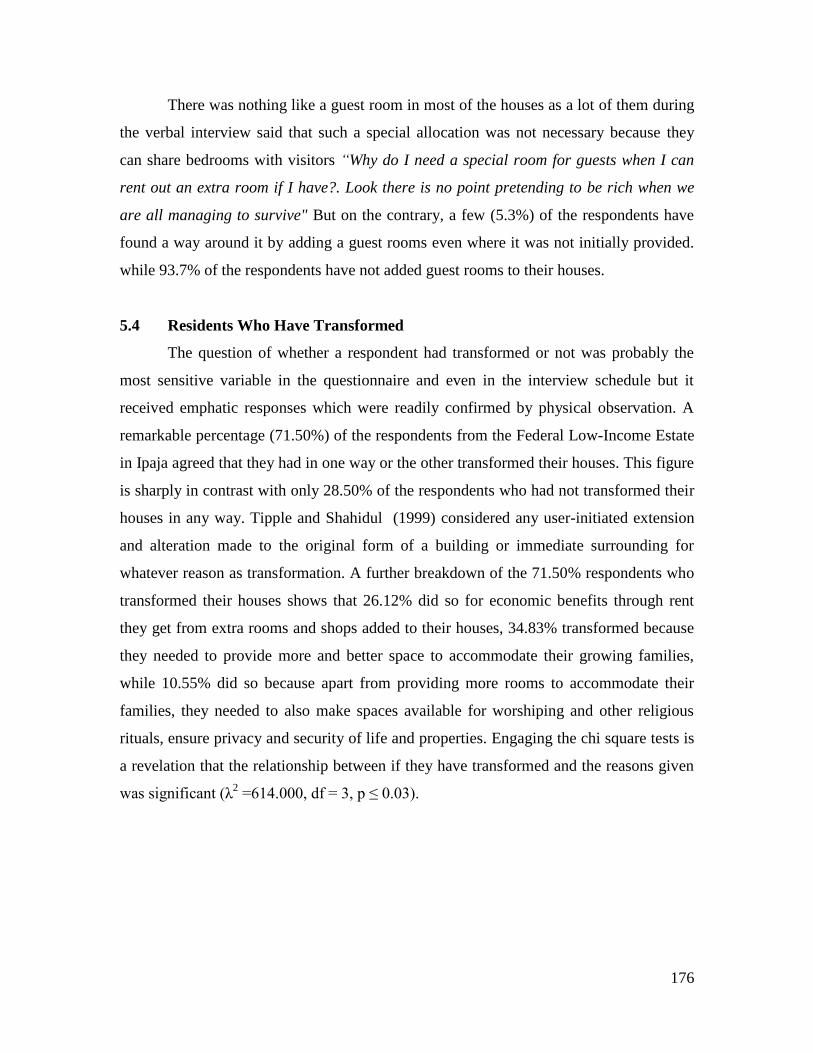
Findings from the field revealed that an average of 89% of the open space
allocated to each housing unit have been built up there by reducing the air circulation
space around the housing units.
Plate 5.1 : Present state of one of the few untransformed housing units sandwiched in
between two highly transformed ones in New Lagos Low-Income Housing
Estate
178
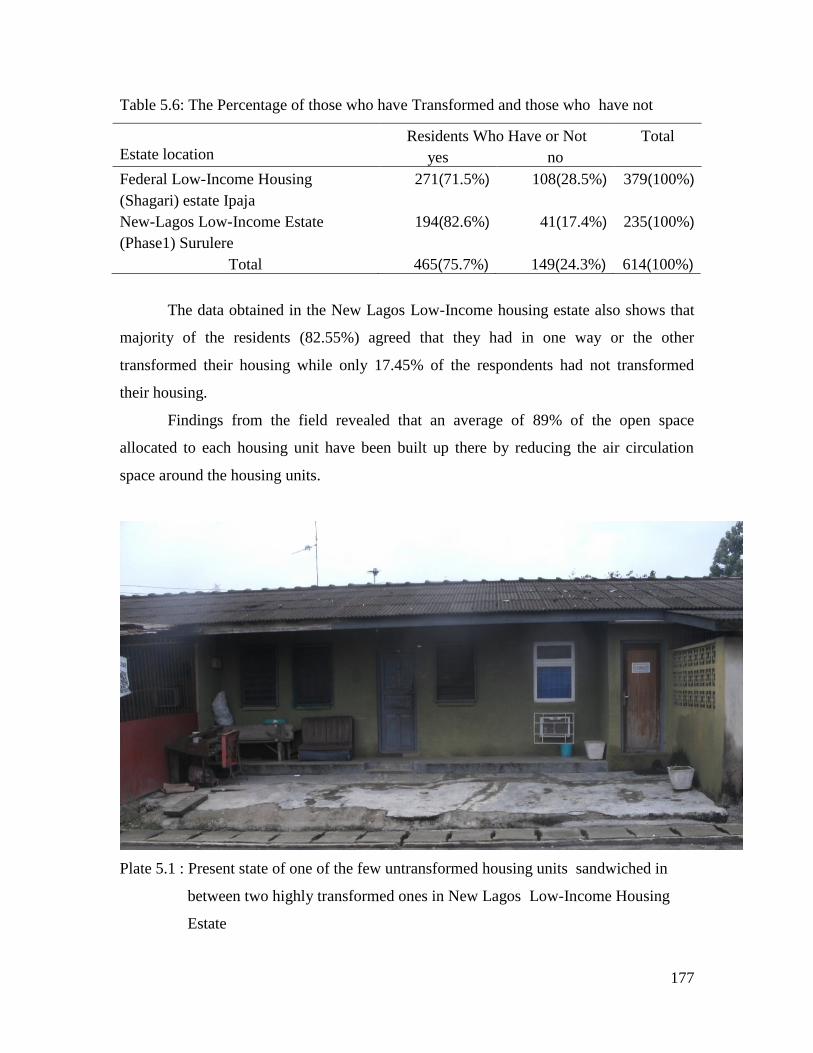
The study also examined the relationship between the tenure status of the residents and
their extent of transformation, it was evident from the chi square tests that there exist a
significant relationship with (λ2 =183.742
a, df = 4, p ≤ 0.00). The cross tabulation result
on Table 5.7 shows that most of those who have transformed are owner occupiers while
the least number of those that have transformed are the free- housers. Going through the
details of the present situation of the estates in terms of the extent of transformation,
indications are that majority of those who have dared to embark on all forms of
transformation for various reasons are those who are owner occupiers while the rental
tenants are cautious of how they handle the houses because they are just tenants whose
tenure and control is limited and defined. An interviewee who happens to be a non paying
resident buttressed this point by saying “You know, this is not my house, I am being
housed free of charge. I cannot afford to rent a house like this. So where do I get the
money to transform someone else’s houses”?
Table 5.7: Tenure status and The Act of Transformation
Residents Who Have or
Not
Total
Tenure
Status(Occupancy)
Yes No
Privately rented
Count / % within tenure
status
88 (42.9%) 117
(57.1%)
205(100%)
Owner occupied
Count/% Within tenure
status
293
(90.2%)
32(9.8%) 325(100%)
Inherited
Count/ % Within tenure
status
57(100%) 0(.0%) 57(100%)
Free houser Count / % within tenure
status
0(.0) 2(100%) 2(100%)
Multiple
ownership Count / % within tenure
status
25(100%) 0(.0%) 25(100%)
Total Count/% within tenure
status
465(75.7%) 149(24.3%) 614(100%)
179
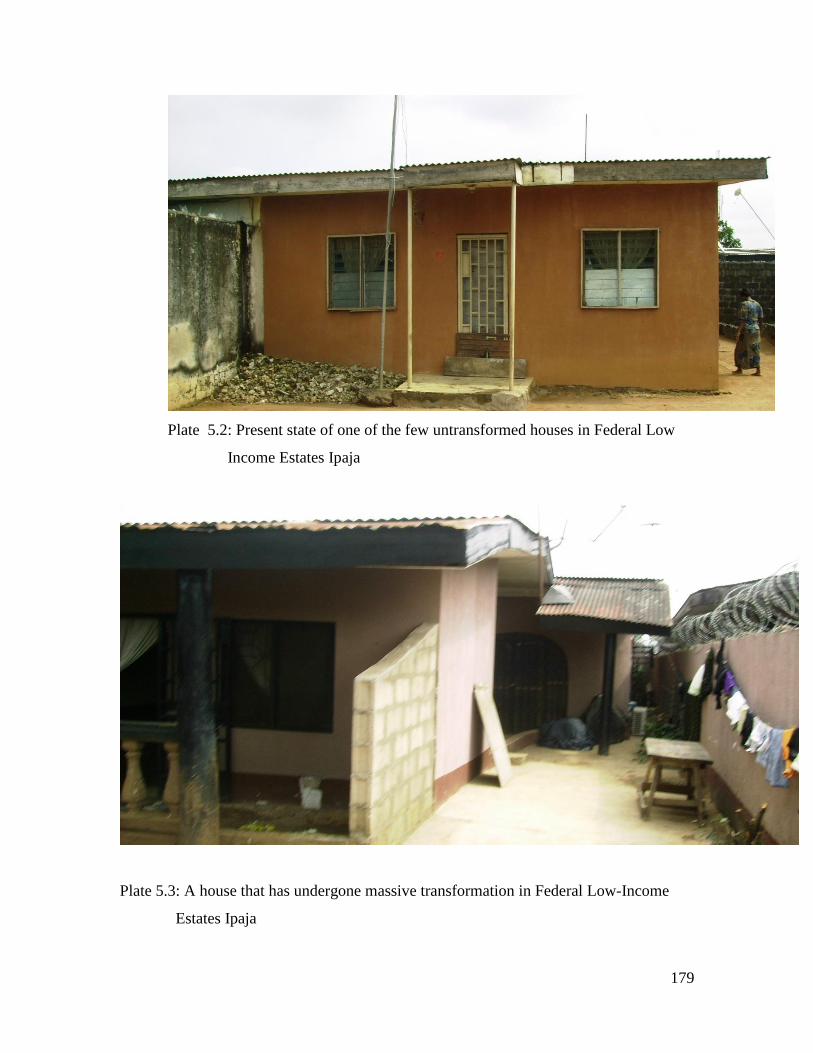
Plate 5.2: Present state of one of the few untransformed houses in Federal Low
Income Estates Ipaja
Plate 5.3: A house that has undergone massive transformation in Federal Low-Income
Estates Ipaja
180
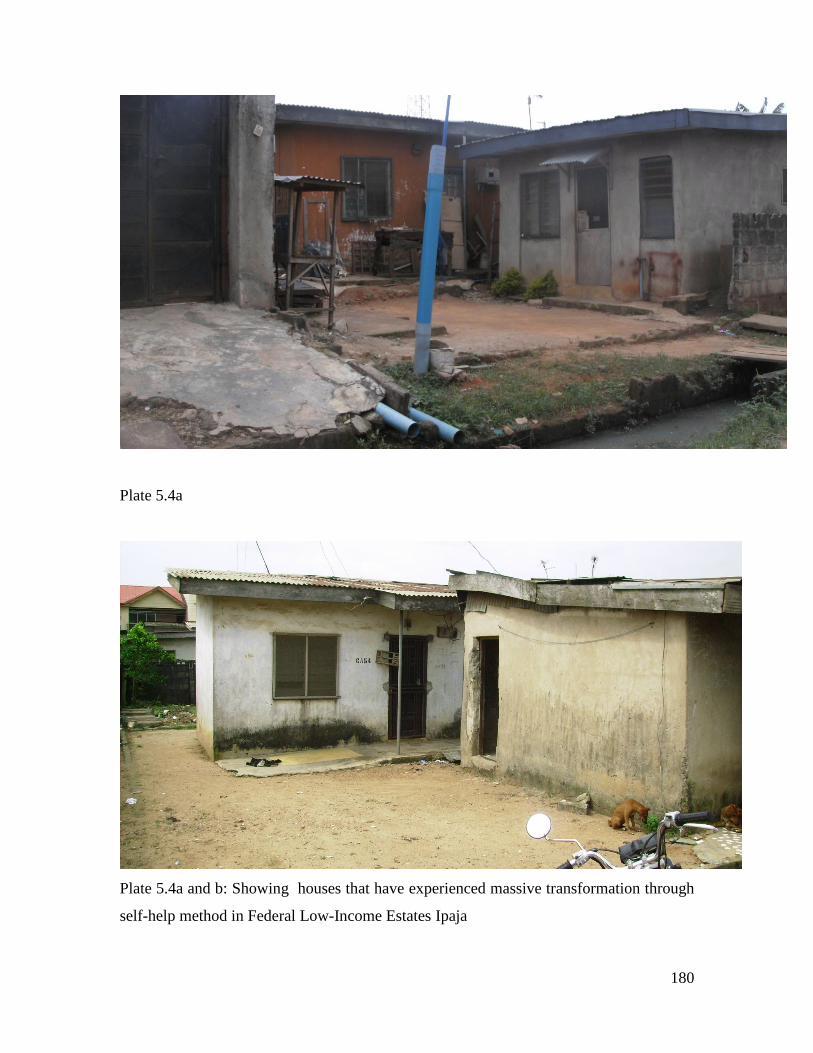
Plate 5.4a
Plate 5.4a and b: Showing houses that have experienced massive transformation through
self-help method in Federal Low-Income Estates Ipaja
181
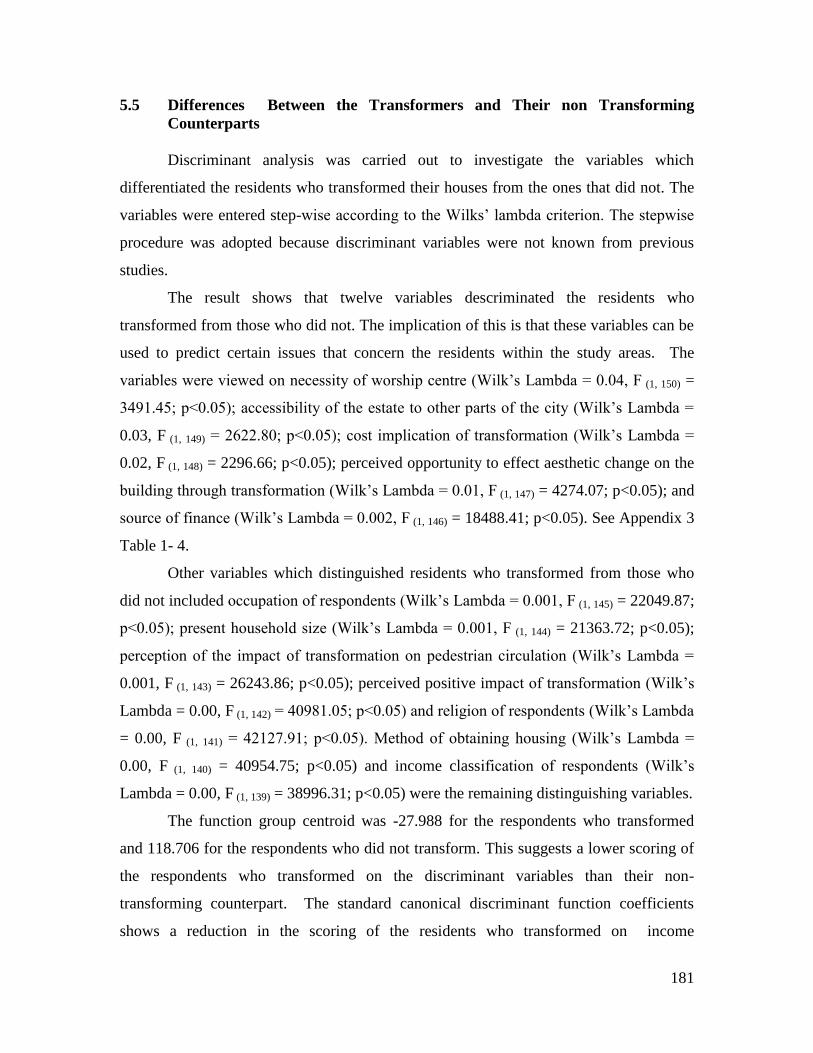
5.5 Differences Between the Transformers and Their non Transforming
Counterparts
Discriminant analysis was carried out to investigate the variables which
differentiated the residents who transformed their houses from the ones that did not. The
variables were entered step-wise according to the Wilks’ lambda criterion. The stepwise
procedure was adopted because discriminant variables were not known from previous
studies.
The result shows that twelve variables descriminated the residents who
transformed from those who did not. The implication of this is that these variables can be
used to predict certain issues that concern the residents within the study areas. The
variables were viewed on necessity of worship centre (Wilk’s Lambda = 0.04, F (1, 150) =
3491.45; p<0.05); accessibility of the estate to other parts of the city (Wilk’s Lambda =
0.03, F (1, 149) = 2622.80; p<0.05); cost implication of transformation (Wilk’s Lambda =
0.02, F (1, 148) = 2296.66; p<0.05); perceived opportunity to effect aesthetic change on the
building through transformation (Wilk’s Lambda = 0.01, F (1, 147) = 4274.07; p<0.05); and
source of finance (Wilk’s Lambda = 0.002, F (1, 146) = 18488.41; p<0.05). See Appendix 3
Table 1- 4.
Other variables which distinguished residents who transformed from those who
did not included occupation of respondents (Wilk’s Lambda = 0.001, F (1, 145) = 22049.87;
p<0.05); present household size (Wilk’s Lambda = 0.001, F (1, 144) = 21363.72; p<0.05);
perception of the impact of transformation on pedestrian circulation (Wilk’s Lambda =
0.001, F (1, 143) = 26243.86; p<0.05); perceived positive impact of transformation (Wilk’s
Lambda = 0.00, F (1, 142) = 40981.05; p<0.05) and religion of respondents (Wilk’s Lambda
= 0.00, F (1, 141) = 42127.91; p<0.05). Method of obtaining housing (Wilk’s Lambda =
0.00, F (1, 140) = 40954.75; p<0.05) and income classification of respondents (Wilk’s
Lambda = 0.00, F (1, 139) = 38996.31; p<0.05) were the remaining distinguishing variables.
The function group centroid was -27.988 for the respondents who transformed
and 118.706 for the respondents who did not transform. This suggests a lower scoring of
the respondents who transformed on the discriminant variables than their non-
transforming counterpart. The standard canonical discriminant function coefficients
shows a reduction in the scoring of the residents who transformed on income
182
classification, method of obtaining housing, cost implication of transformation, necessity
of worship centre and belief in the aesthetic gain of transformation. The coefficients
however showed an increase in the scoring of the residents that transformed on
household size, source of finance, occupation, religion, perception of the impact of
transformation and accessibility. The data showed that the respondents who transformed
had lower income, and obtaining the fund for their houses mostly from personal savings
and mortgage institutions, as against their transforming counterpart who got the houses as
part of their inheritances or got the funds by local borrowing.
In terms of perception, more of the residents who transformed perceived that a
worship centre was necessary in an estate like theirs but the reverse was the case with
reference to aesthetics where very few of the respondent who had transformed agreed that
in actual fact, achieving aesthetics was one benefit they derived from transformation. and
also that aesthetic changes was one of the gains that can be achieved through
transformation.
The transforming residents also appeared not to be more satisfied with the
accessibility of their estate to other parts of the city as they believe that the estates were
very accessible while the non-transforming residents believe that their estates are slightly
accessible. The realization that the estates have now become very accessible perhaps
have triggered the magnitude of transformation that have taken place. For this group of
residents, the cost of transformation may not be a hindrance to them as they could harness
resources from several quarters to effect transformation. The adoption of social capital
whereby communal networking is put together to actualize a project might come handy.
The occupation of the resident was a vital variable which differentiated the
transformers from their non-transforming counterpart as the residents who have
transformed were mostly self -employed, artisans or retired. while those who had not
transformed were predominantly civil servants. This means that the kinds of job the
residents do could also help to determine if they will likely take to transformation
because with a job closely related to any aspect of construction, it would be easier to
tinker around transformation and for such residents, the process of transformation can be
quite calculated, systematic and dramatic. engaging co-residents, friends or relatives in
relevant fields can be an effective of effecting a desired transformation. Specifically
183
therefore, with the occupation of residents, one can predict accurately which resident is
most likely to transform his house.
The non-transforming residents were also mostly Christians with present
household sizes less than 5, while those who transformed were mostly from other
religions with larger household sizes. this was also evident in a situation where non-
Christian residents appeared to be more comfortable with the developments and
sometimes from polygamous homes.
In addition, it was ironical to observe that more of the residents who transformed
their houses believed that the impact of transformation is negative despite their being
involved in the act while the non-transformers believed otherwise.
Appendix 3 Table 4. shows that 75.2% of the original grouped cases were correctly
classified using the function generated through the discriminant analysis. When cross-
validated, 99.3% of those who did not transform were correctly classified, while 86.1%
of those who transformed were so classified, giving an overall average of 89.3% of
respondents correctly classified. See Appendix 3 table 1- 4.
5.6 First Forms of Transformation Embarked Upon by Respondents
It is expected that transformation process of any sort must have started at a point
depending on what was of most priority to the household. The Low-Income group may
require some things that were not provided in the initial plan of the house and as such,
this could have led to the urgency or otherwise with which most of them embarked on
transformation to help themselves provide for what they regarded was a necessity to
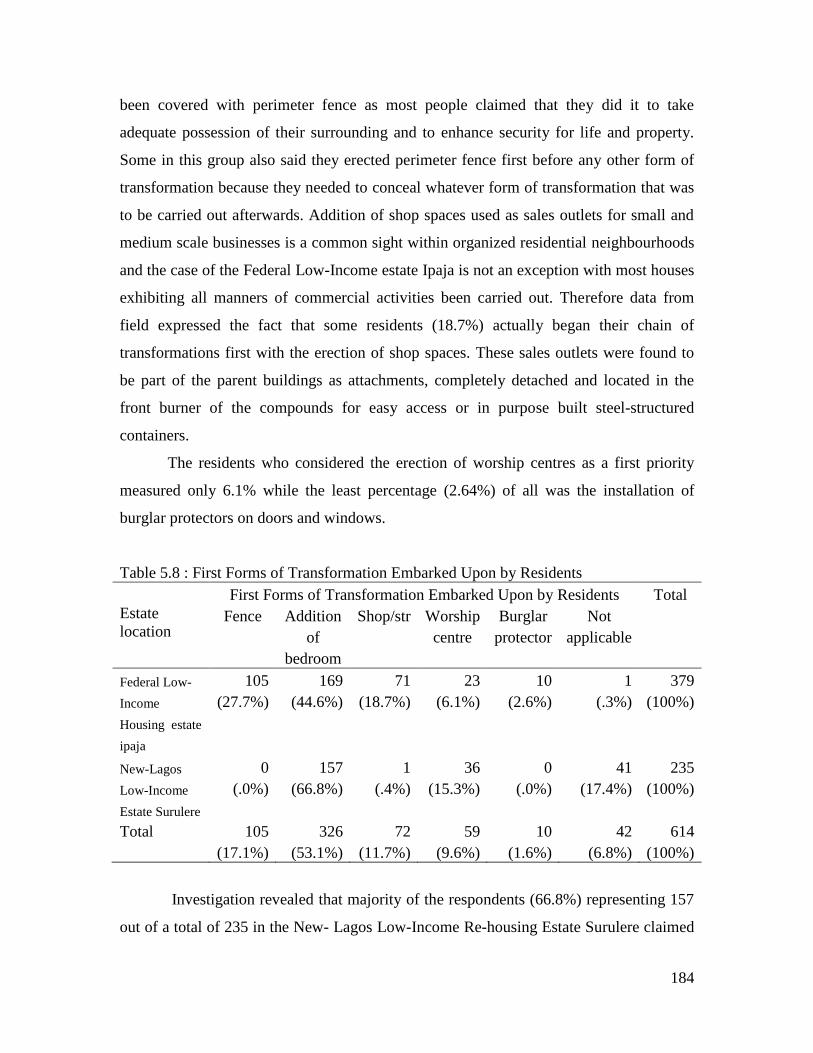
survive. Investigation as shown on table 5.8 reveals that, 169 respondents (44.6%) from a
sample size of 379 from Federal Low-Income Housing Estate Ipaja claimed to have
embarked on the construction or addition of more bedrooms before any other form of
transformation. This they claimed was to make available more rooms for their own use
and also for letting out.
The erection of perimeter fence within these estates came next with 27.7% from
105 respondents indicating that this was the first form of transformation. It is evident
even from the physical observation carried out within the estate that, most houses have
184
been covered with perimeter fence as most people claimed that they did it to take
adequate possession of their surrounding and to enhance security for life and property.
Some in this group also said they erected perimeter fence first before any other form of
transformation because they needed to conceal whatever form of transformation that was
to be carried out afterwards. Addition of shop spaces used as sales outlets for small and
medium scale businesses is a common sight within organized residential neighbourhoods
and the case of the Federal Low-Income estate Ipaja is not an exception with most houses
exhibiting all manners of commercial activities been carried out. Therefore data from
field expressed the fact that some residents (18.7%) actually began their chain of
transformations first with the erection of shop spaces. These sales outlets were found to
be part of the parent buildings as attachments, completely detached and located in the
front burner of the compounds for easy access or in purpose built steel-structured
containers.
The residents who considered the erection of worship centres as a first priority
measured only 6.1% while the least percentage (2.64%) of all was the installation of
burglar protectors on doors and windows.
Table 5.8 : First Forms of Transformation Embarked Upon by Residents
First Forms of Transformation Embarked Upon by Residents Total
Estate
location Fence Addition
of
bedroom
Shop/str Worship
centre
Burglar
protector
Not
applicable
Federal Low-
Income
Housing estate
ipaja
105
(27.7%)
169
(44.6%)
71
(18.7%)
23
(6.1%)
10
(2.6%)
1
(.3%)
379
(100%)
New-Lagos
Low-Income
Estate Surulere
0
(.0%)
157
(66.8%)
1
(.4%)
36
(15.3%)
0
(.0%)
41
(17.4%)
235
(100%)
Total 105
(17.1%)
326
(53.1%)
72
(11.7%)
59
(9.6%)
10
(1.6%)
42
(6.8%)
614
(100%)
Investigation revealed that majority of the respondents (66.8%) representing 157
out of a total of 235 in the New- Lagos Low-Income Re-housing Estate Surulere claimed
185
to have embarked on construction of additional bedrooms before any other
transformation. This probably was not only to serve their immediate families but served
as avenues to make money through rents. Despite the fact that addition of more bedrooms
ranked first on their priority list, most of the respondents were quick to confirm that it
was not done immediately they moved in. This was confirmed from some statements
made by aged residents who said:
and
Places of worship like mosques and churches of different denominations were
commonly found within the supposed residential neighbourhood to the extent that 15.3%
of the respondents claimed that their first form of transformation was to convert a portion
of their houses into prayer rooms. A Muslim respondent was quick to emphasize the
importance of a personal praying area in his house when he said:
It was observed that in this particular estate, none of the respondents indicated
that perimeter fence, shops/store, or any of the other options was the first form of
transformation embarked upon as they claimed they were never a priority. When asked if
they were not interested in securing and taking full possession of their surrounding a
respondent said:
"For close to ten years after we moved in, this estate remained intact and
life was easier then until outsiders began to live amongst us".
"There was really no need to transform initially because in fairness to the
colonial masters, some of the houses were at that time, too large for only
one family such that multiple families had to share. But because these
families inevitably increased in sizes, transformation became a ready
option. Moreover, when this neighbourhood became increasingly
commercialized, the demand for rooms to rent also led to a great deal of
transformation".
"I cannot compromise my religious obligation of praying five times a day
and also encouraging others to do same. When we moved into this estate,
the closest mosque to my house was a long walk from here so I constructed
this small mosque which has now become this big and serves a large group
of Muslim faithfuls".
186
Installation of burglar proof on doors and window was never a priority as none of
the respondents answered in the affirmative.
5.7 Availability of Building Plan and Acquisition of Necessary Approval
The plan of a house or building is that document that shows the details of a
proposed development taking into consideration all necessary building regulations
guiding against unlawful physical development. It shows the different approvable
standards and their level of compliance to merit an approval to carry out the construction
work. It is expected that with the laid down rules and regulations for approval, every
intended construction work whether fresh, modification, alteration or transformation
within these estates must pass through appropriate channels domiciled at the town
planning offices in designated over seeing agencies. In the course of study it was
discovered that there has been several additions/transformation made to the original plans
and even encroachment into open spaces. This development spurred the researcher to ask
the respondents particularly those who have transformed if they have building plans for
their new additions and the data obtained from the Federal Low-Income Housing Estate
Ipaja revealed that less than half (29.3%) of the residents actually have building plans
while above half (44.1%) of them claimed not to have anything of such.
"There was no threat as to the limits of my external space because everybody
was adequately aware of what belongs to who and as for security, there was
no scare of armed robbers coming to attack us then".
187
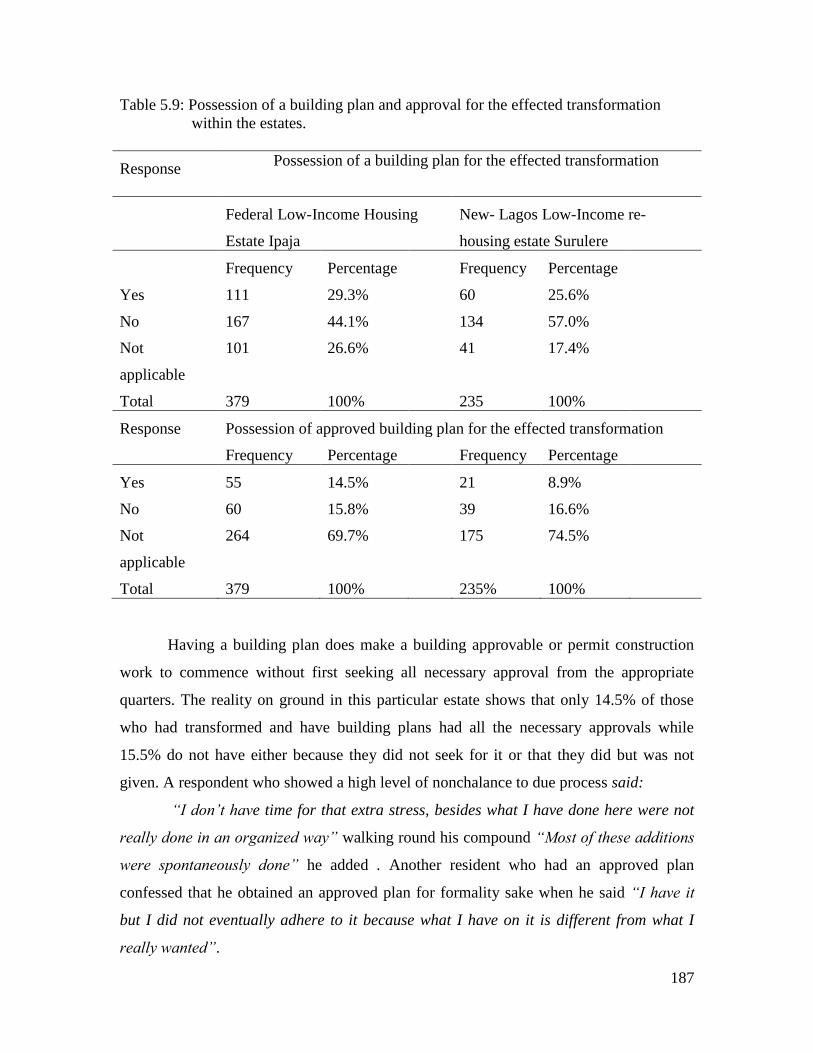
Table 5.9: Possession of a building plan and approval for the effected transformation
within the estates.
Response Possession of a building plan for the effected transformation
Federal Low-Income Housing
Estate Ipaja
New- Lagos Low-Income re-
housing estate Surulere
Frequency Percentage Frequency Percentage
Yes 111 29.3% 60 25.6%
No 167 44.1% 134 57.0%
Not
applicable
101 26.6% 41 17.4%
Total 379 100% 235 100%
Response
Possession of approved building plan for the effected transformation
Frequency Percentage Frequency Percentage
Yes 55 14.5% 21 8.9%
No 60 15.8% 39 16.6%
Not
applicable
264 69.7% 175 74.5%
Total 379 100% 235% 100%
Having a building plan does make a building approvable or permit construction
work to commence without first seeking all necessary approval from the appropriate
quarters. The reality on ground in this particular estate shows that only 14.5% of those
who had transformed and have building plans had all the necessary approvals while
15.5% do not have either because they did not seek for it or that they did but was not
given. A respondent who showed a high level of nonchalance to due process said:
“I don’t have time for that extra stress, besides what I have done here were not
really done in an organized way” walking round his compound “Most of these additions
were spontaneously done” he added . Another resident who had an approved plan
confessed that he obtained an approved plan for formality sake when he said “I have it
but I did not eventually adhere to it because what I have on it is different from what I
really wanted”.
188
As for the New- Lagos Low-Income re-housing estate Surulere, the data obtained
revealed that 57.0% of the respondents had no plan for their additions while 25.5% did
not. In considering how many of these people with building plans had them approved by
the appropriate authorities, it was discovered that less than half (8.9%)of them were
approved. The non-compliance with building rules and regulation was hinged on the
stressful nature of the process due to official bureaucracies when a respondent said,
This development might be the reason why there is quite a number of illegal and
substandard structures with little or no consideration for ventilation as well as the
indiscriminate encroachment on any available free space.
It was also observed that it has become an inevitable experience for most people
who embarked on any form of construction work whether approved or not to have
encountered hitches in one form or another sometimes from officials who represent
recognized government agencies, representatives of residents' association who monitor
developments within neighbourhoods or jobless youths, miscreants and local thugs
popularly referred to as area boys who just take laws into their hands as well some self
acclaimed "Ömo-oniles". These hitches which sometimes are embarrassing and violent
in nature form part of a long lasting experience these people tend never to forget in a
hurry due to the impression they leave behind. Investigations on site revealed that even
though some people expect disturbances along the line especially those who have not
obtained the necessary approvals but the magnitude is usually greater than expected.
Responses from the study shows (see Table 5.9) that harassment from
Government officials and eventual stoppage of work due to non compliance or non-
approval of such projects came tops (19.5 %), on the chart of challenges the transformers
encountered while working. This figure was closely followed by 17.7% for those who
claimed they were disturbed endlessly by miscreants popularly known as area boys who
"Initially there was no serious monitoring by the authorities until Lagos
State Government took over and made things even worse for the masses.
Even with their problems, the economy still forced people to do all kinds
of things not minding the consequences.
189
pounce on the house owners and artisans violently to make arbitrary and unrealistic
demands. A resident who experienced an attack from this group of people had this to say,
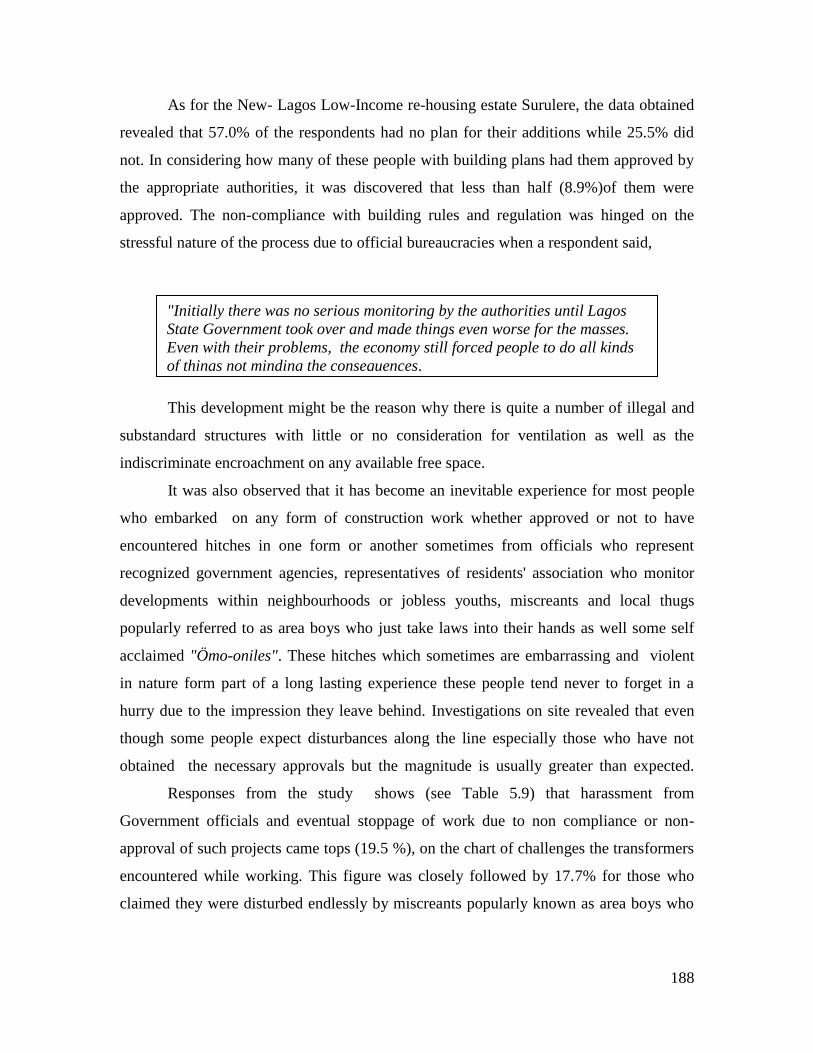
Table 5.10: The challenges encountered by residents who have transformed
Problem encountered before and during the process of transformation Total Estate location
Area
boys
and
thugs
Harassment
from
officials
Lack of
sufficient
fund/finance
Lack of sufficient
fund/finance/area
boys
None Not
applicable
Federal Low-
Income Housing
(Shagari) estate
Ipaja
67
(17.7%)
74
(19.5%)
42
(11.1%)
20
(5.3%)
72
(19.0%)
104
(27.4%)
379
(100%)
New-Lagos Low-
Income Estate
(Phase1)Surulere
30
(12.8%)
89
(37.9%)
2
(.9%)
0
(.0%)
71
(30.2%)
43
(18.3%)
235
(100%)
Total 97
(15.8%)
163
(26.5%)
44
(7.2%)
20
(3.3%)
143
(23.3%)
147
(23.9%)
614
(100%)
Other forms of problem highlighted included that of inadequate funds (11.1%)
which in some cases led to complete stoppage of work or slowed down the pace of work
while for some residents (5.3%), it was a double edged challenge as the issue of lack of
fund was further compounded by the incessant harassments received from this same area
boys. All these chronicled, in brief, the numerous problems those who embark on
construction works even with necessary approvals obtained encountered in the process.
But as observed, these experiences have not improved the situation of indiscriminate
illegal construction in the neighbourhoods. Just a few (19.0%) of the residents have not
had any challenge while embarking on transformation.
"Those people can be very violent so I prefer to avoid them as much as
possible. I ensure that my transformation is approved but then my last
experience with them was quite painful because despite obtaining the
necessary approval, they still came and unleashed terror on my workers,
injured two of them and still insisted I gave them money. Of course work had
to stop for a while".
190
The situation was not much different in the New- Lagos Low-Income re-housing
estate Surulere as responses from the study shows that harassment from government
officials and eventual stoppage of work due to non approval of such projects also led the
table of challenges with 37.9%.This figure was distantly followed 12.8% for those who
claimed they were disturbed endlessly by miscreants popularly known as area boys.
Other form of problems highlighted included that of inadequate funds (0.85%) which in
some cases led to a complete stoppage of work or slowed down the pace of work while
for some people (30.21%),none of these issues was a challenge.
Even with these experiences, the situation has improved as the rate at which
residents in this Low-Income housing estates embark on indiscriminate and illegal
construction remains on the increase because the demand for houses and more room to
rent is unimaginable.
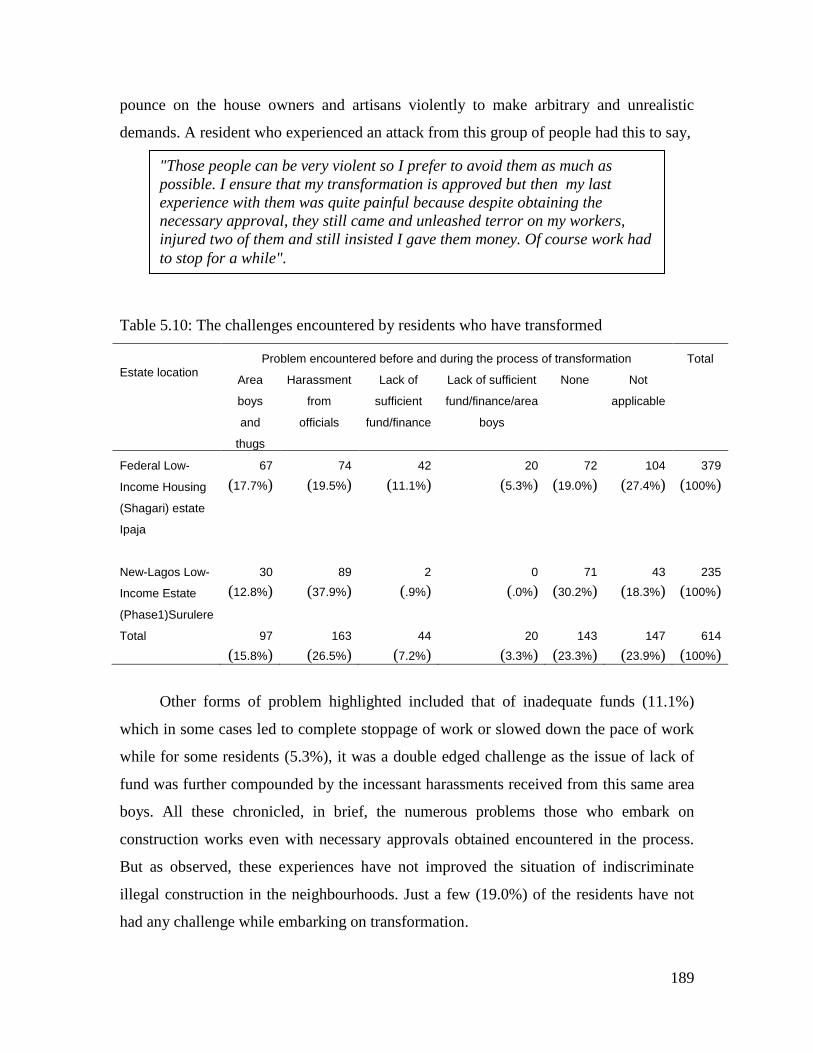
5.8 Cost Implications of the Transformation
The cost of carrying out transformation for each family differs according to the
taste, type and the magnitude of transformation. According to the respondents, it may be
difficult to actually put together the exact amount of money spent on the transformation
because in most cases, the exercises are carried out in piece meal manner because
according to most of the respondents cash flow is not usually constant. This information
was volunteered when a respondent said “I have started this for a long time now, but it
has not been completed up till now due to lack of money . Moreover, I am not in a
hurry”.
A fairly rough idea of how much transformers spent was given in ranges to enable
one present a detailed information on the cost implication of the transformation residents
may have embarked on mainly through their own efforts and at no expense to the
Government. Almost half (45.6%) of the respondents in the Federal Low-Income
Housing Estate Ipaja agreed that they spent between N251,000 and N500,000 on the
projects. Those who spent less that N250,000 accounted for a lower percentage of 20.3%
and almost an equal number (20.1%) of the residents said they spent above N1,000,000
on their transformation exercises. Considerably smaller percentages ( 6.3% and 1.1%) of
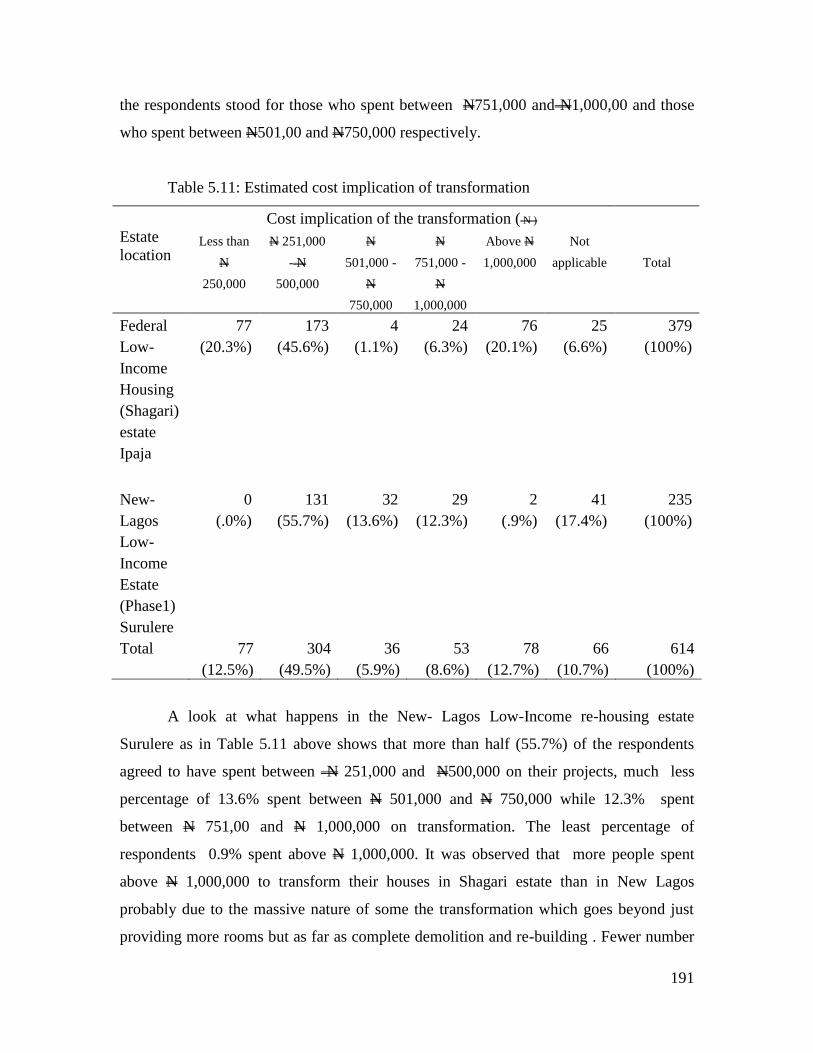
191
the respondents stood for those who spent between N751,000 and N1,000,00 and those
who spent between N501,00 and N750,000 respectively.
Table 5.11: Estimated cost implication of transformation
Cost implication of the transformation ( N )
Total
Estate
location Less than
N
250,000
N 251,000
- N
500,000
N
501,000 -
N
750,000
N
751,000 -
N
1,000,000
Above N
1,000,000
Not
applicable
Federal
Low-
Income
Housing
(Shagari)
estate
Ipaja
77
(20.3%)
173
(45.6%)
4
(1.1%)
24
(6.3%)
76
(20.1%)
25
(6.6%)
379
(100%)
New-
Lagos
Low-
Income
Estate
(Phase1)
Surulere
0
(.0%)
131
(55.7%)
32
(13.6%)
29
(12.3%)
2
(.9%)
41
(17.4%)
235
(100%)
Total 77
(12.5%)
304
(49.5%)
36
(5.9%)
53
(8.6%)
78
(12.7%)
66
(10.7%)
614
(100%)
A look at what happens in the New- Lagos Low-Income re-housing estate
Surulere as in Table 5.11 above shows that more than half (55.7%) of the respondents
agreed to have spent between N 251,000 and N500,000 on their projects, much less
percentage of 13.6% spent between N 501,000 and N 750,000 while 12.3% spent
between N 751,00 and N 1,000,000 on transformation. The least percentage of
respondents 0.9% spent above N 1,000,000. It was observed that more people spent
above N 1,000,000 to transform their houses in Shagari estate than in New Lagos
probably due to the massive nature of some the transformation which goes beyond just
providing more rooms but as far as complete demolition and re-building . Fewer number
192
of people spent more money to execute transformation within the estate while generally,
one was able to note that the present residents of the estates actually spent so much
money in their different capacities to accomplish ventures of such.
5.8 Sources of finance for the transformation
The source of finance for the execution of transformation by the Low-Income
earner is multifaceted as they tend to put in all manner of efforts together to accomplish
their aim. It is interesting to find out the many ways and processes the Low-Income
earner go through in sourcing for funds but the out-come of this variable will even further
broaden the understanding of the nature of the present residents of the estates in terms of
their economic status. One of these efforts is through their personal savings accrued from
the jobs they do. The Low-Income group consist of people who are predominantly
artisans and who in most cases are self employed. The result of multiple response from
the Federal Low-Income Housing Estate Ipaja shows that, majority of 75.1% of the
respondents sourced for fund through personal savings while lending of money from
cooperative societies to finance transformation was an option which did not receive much
consideration as only 30.9% of the respondents patronized them for sponsorship.
Assistance from commercial banks to fund transformation bids by the residents was quite
minimal as only 13.3% benefited from that source while a significant percentage (86.7%)
did not get assistance from any commercial bank. It is not impossible that because the
commercial banks may not be willing to sponsor such developments, most of the
residents did not bother to apply to them for assistance.
Mortgage banks whose fundamental responsibility is to make funds readily
available for to finance the execution of home acquisition projects regardless of the scale
have not rendered any form of assistance to virtually all the respondents as the available
data shows than none of the respondents obtained any form of financial assistance form
mortgage banks.
The last option to be considered for possible means of actualizing transformation
was that of Developers who rendered assistance to people to build their houses or carry
out projects which are beyond their financial capabilities. Developers as they are called,
are unrefined small scale building contractors who engage in construction works on
193
behalf of an individual, family or group of persons by reaching agreement on certain
convenient terms and conditions regarding implementation, finance and management of
the properties involved. They are always willing to come to the aid of those who are
financially inadequate particularly the Low-Income earners. But in spite of their
willingness to render their services to the people, only 9.1% of the respondents according
to the results in Table 5.12 benefited from their services leaving out a huge percentage
(91.5%) who sourced for funds through other means.
Table 5.12: Source of funds to finance transformation
Sources of fund
Total
Estate location Personal/
ndividual savings Cooperative
Commercial
banks
Developer
Federal Low-Income
Housing (Shagari)
New-Lagos Low-
Income Estate
(Phase1)
265(75.1%) 109(30.9%) 47(13.3%) 32(9.1%) 353()
164(100.0%) 0(.0%) 0(.0%) 0(.0%) 164()
Total 429 109 47 32 517
The Table also shows that virtually all the resident in the New Lagos re-housing
estate were favorably disposed to sourcing for fund through personal efforts which to
some of them guarantees them peace of mind as confirmed when in expressing how
peaceful it is for his family not to be indebted to any one a respondent had this to say:
Another respondent also believed that they could not seek for fund from corporate
bodies primarily due to their background and the disorganized nature of their projects
when pointing at some badly positioned attached bedrooms to the rear end of his house
he said "Look, tell me who will borrow me money to construct structures like these?.
"I usually gathered all the family earnies on a monthly basis so we gradually
paid up and we were never bothered by inflation of any sort nor were we
worried by interest to be paid".
194
5.9 Method of execution of transformation
The built environment is inundated with several methods of construction
techniques ranging from self-help method to the use of advanced construction techniques.
The Low-Income group in the society as expected may be limited to methods which they
can conveniently afford particularly in terms of finance. Sometimes, time is not a
yardstick as they tend to carryout transformation at their own pace and as dictated by the
inflow of the required cash and material resources. A knowledge of the methods adopted
by the resident to effect transformation will enlarge the understanding of step by step
stages that were involved in turning the estates to what it is today. The direct labor
system of execution had the highest patronage of 46.7% in the Federal Low-Income
Housing Estate Ipaja. This practice involves the direct engagement of the different
artisans and work men separately under completely different agreements with all geared
towards achieving the same end result. This was followed by those (16.6%) who carried
out their transformation by engaging the services of contractors. This arrangement may
cost more but as a respondent puts it:
''It takes away every burden from the house owner and ensures a smooth and tidy
execution of the project but one must have the money to pay". Self-help system which
played a vital role in helping to actualize transformation in this estate, is one by which
individuals personally assemble required materials together and also execute the
construction themselves. This may not be uncommon in a situation where most of the
Low-Income earners are tradesmen trained on one or more hand works and most often
one finds out that an individual becomes knowledgeable in several skills. while most of
the respondents who engaged other methods of execution, a small group (8.7%) busied
themselves with the "do it yourself method" of self help.

195
Table 5.13: Method Adopted in the Execution of Transformation
Estate location
Method of execution of transformation Total
Self help or
built
directly by
self
Use of
contractor
Direct
labour by
separate
tradesmen
Not
applicable
Federal Low-Income
Housing (Shagar)i estate
ipaja
New-Lagos Low-Income
Estate (Phase1) Surulere
33
(8.7%)
63
(16.6%)
177
(46.7%)
106
(28.0%)
379
(100%)
88
(37.4%)
30
(12.8%)
117
(49.8%)
0
(.0%)
235
(100%)
Total 121
(19.7%)
93
(15.1%)
294
(47.9%)
106
(17.3%)
614
(100%)
The same pattern of distribution seems also to play itself out in the New Lagos re-
housing estate where the largest percentage (49.8%) engaged the direct labour system.
This system appeared to be more convenient for them as expressed by a resident in this
category who said:
"I preferred the direct labour option because I had all the time to personally
supervise my work so there was no need to do otherwise". But more of them (37.4%)
within this estate were more inclined to the self-help system because according to a
resident who said:
A few of the respondents (12.8%) engaged contractors to assist transform their
houses. The outcome from Table 5.13 shows that the highest number of self employed
adopted the direct labour option through the use of separate tradesmen. The Table also
indicates that the highest number of patronage the self- help system received was from
"Most of us who were resettled here in those days had one hand work or the
other. For instance I trained as a carpenter, my neighbour who is now late was a
welder while that old man opposite was a very good bricklayer. We were
engaging ourselves where necessary to reduce cost. In fact that was how all
these were accomplished".
196
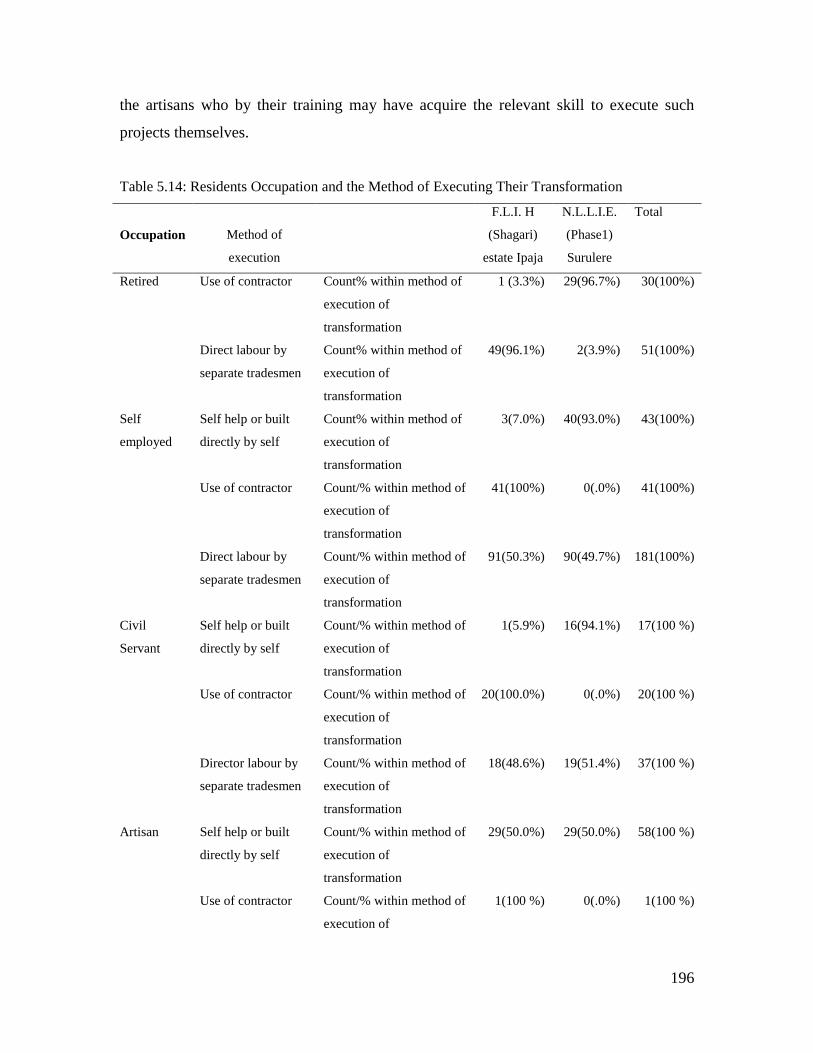
the artisans who by their training may have acquire the relevant skill to execute such
projects themselves.
Table 5.14: Residents Occupation and the Method of Executing Their Transformation
Occupation
Method of
execution
F.L.I. H
(Shagari)
estate Ipaja
N.L.L.I.E.
(Phase1)
Surulere
Total
Retired Use of contractor Count% within method of
execution of
transformation
1 (3.3%) 29(96.7%) 30(100%)
Direct labour by
separate tradesmen
Count% within method of
execution of
transformation
49(96.1%) 2(3.9%) 51(100%)
Self
employed
Self help or built
directly by self
Count% within method of
execution of
transformation
3(7.0%) 40(93.0%) 43(100%)
Use of contractor Count/% within method of
execution of
transformation
41(100%) 0(.0%) 41(100%)
Direct labour by
separate tradesmen
Count/% within method of
execution of
transformation
91(50.3%) 90(49.7%) 181(100%)
Civil
Servant
Self help or built
directly by self
Count/% within method of
execution of
transformation
1(5.9%) 16(94.1%) 17(100 %)
Use of contractor Count/% within method of
execution of
transformation
20(100.0%) 0(.0%) 20(100 %)
Director labour by
separate tradesmen
Count/% within method of
execution of
transformation
18(48.6%) 19(51.4%) 37(100 %)
Artisan Self help or built
directly by self
Count/% within method of
execution of
transformation
29(50.0%) 29(50.0%) 58(100 %)
Use of contractor Count/% within method of
execution of
1(100 %) 0(.0%) 1(100 %)
197
transformation
Direct labour by
separate tradesmen
Count/% within method of
execution of
transformation
17(94.4%) 1(5.6%) 18(100 %)
Others Self help or built
directly by self
Count/% within method of
execution of
transformation
0(.0%) 3(100%) 3(100 %)
Use of contractor Count/% within method of
execution of
transformation
0(.0%) 1(100 %) 1(100 %)
Direct labour by
separate tradesmen
Count/% within method of
execution of
transformation
1(16.7%) 5(83.3%) 6(100 %)
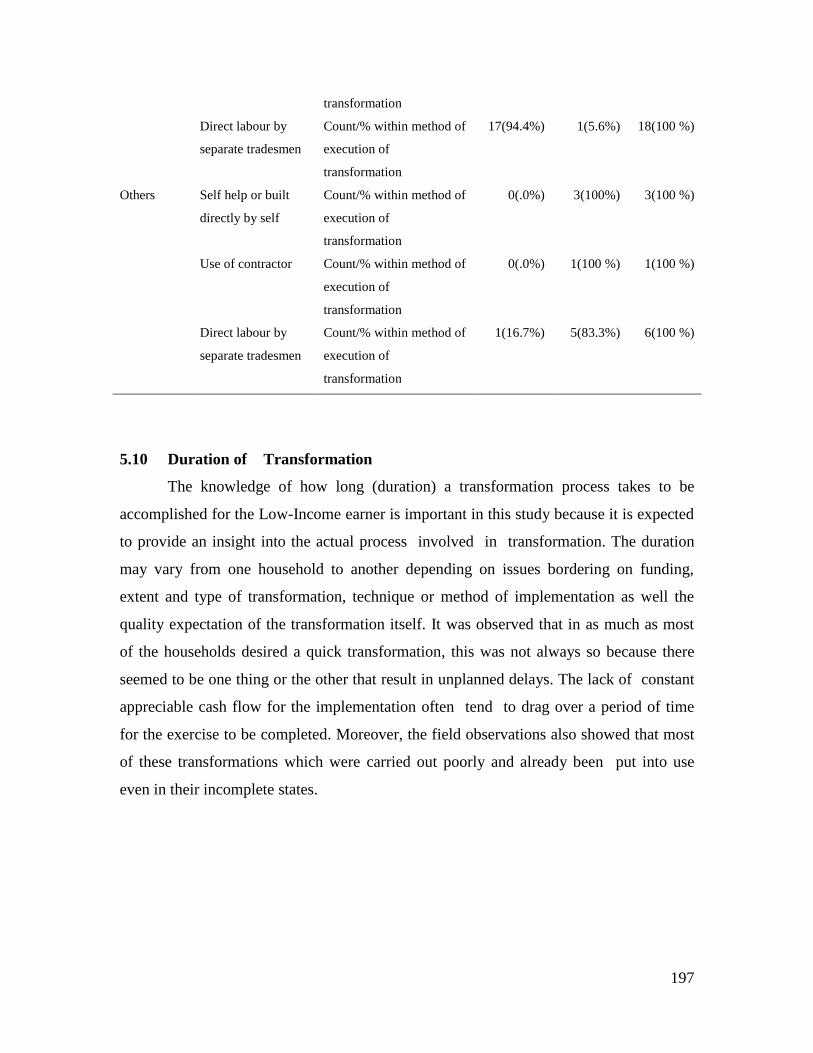
5.10 Duration of Transformation
The knowledge of how long (duration) a transformation process takes to be
accomplished for the Low-Income earner is important in this study because it is expected
to provide an insight into the actual process involved in transformation. The duration
may vary from one household to another depending on issues bordering on funding,
extent and type of transformation, technique or method of implementation as well the
quality expectation of the transformation itself. It was observed that in as much as most
of the households desired a quick transformation, this was not always so because there
seemed to be one thing or the other that result in unplanned delays. The lack of constant
appreciable cash flow for the implementation often tend to drag over a period of time
for the exercise to be completed. Moreover, the field observations also showed that most
of these transformations which were carried out poorly and already been put into use
even in their incomplete states.
198
Table 5.15: Duration of transformation
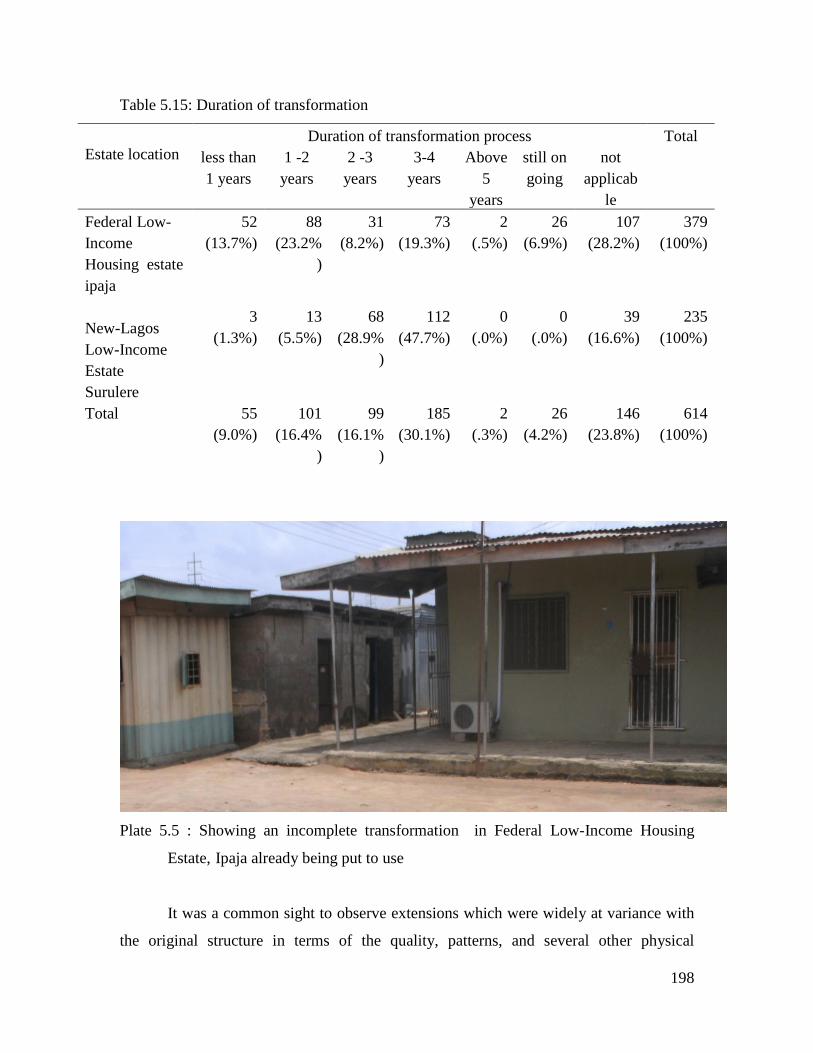
Plate 5.5 : Showing an incomplete transformation in Federal Low-Income Housing
Estate, Ipaja already being put to use
It was a common sight to observe extensions which were widely at variance with
the original structure in terms of the quality, patterns, and several other physical
Duration of transformation process Total
Estate location less than
1 years
1 -2
years
2 -3
years
3-4
years
Above
5
years
still on
going
not
applicab
le
Federal Low-
Income
Housing estate
ipaja
New-Lagos
Low-Income
Estate
Surulere
52
(13.7%)
88
(23.2%
)
31
(8.2%)
73
(19.3%)
2
(.5%)
26
(6.9%)
107
(28.2%)
379
(100%)
3
(1.3%)
13
(5.5%)
68
(28.9%
)
112
(47.7%)
0
(.0%)
0
(.0%)
39
(16.6%)
235
(100%)
Total 55
(9.0%)
101
(16.4%
)
99
(16.1%
)
185
(30.1%)
2
(.3%)
26
(4.2%)
146
(23.8%)
614
(100%)
199
attributes. The results from Federal Low-Income Housing Estate Ipaja as shown on table
34 further buttresses these realities on ground with 23.2% of the respondents spent
between 1 and 2 years to transform their houses, and for a duration of between 3 and 4
years, it was 19.3% of the respondents. Only 13.72% completed their transformation in
less than one (1) year while lower percentages like 8.18%, 6.86% and 0.53% stood for
those who spent between two and three (2 and 3) years, those who still have their
transformation ongoing but may have begun utilizing them and finally those who claimed
to have spent well over five (5) years in the process respectively. The interview sessions
revealed that though the Low-Income earners usually have a pressing urge to transform
for various reasons, the thought process and planning takes a long time to manifest and
this sometimes makes it look like an endless process. A resident had this to say:
More of the residents of the New- Lagos Low-Income Re-housing Estate Surulere, spent
longer time transforming their houses as 47.7% of them spent between three and four (3-
4) years, 28.9% spent between two and three (2-3) years. From observation, there seem
not to be any ongoing or incomplete transformation within the estate but more of badly
executed works. The level of congestion was more pronounced in this estate as virtually
all the backyard spaces had been fully built up with little or no consideration for adequate
ventilation.
5.11 Chapter Summary
This Chapter discusses the exact magnitude of transformation within the study
areas which revealed that a huge 74% of the residents irrespective of their income class
had actually effected one form of transformation or the other even as most of them
believed the practice is bad for the wellbeing of the residents and neighbourhood.
Amongst the few who had not transformed their houses were some residents who
still hoped that a time would come when they would have the opportunity to effect their
desired forms of transformation while some others believed that it was not necessary to
“I thought of erecting this fence and building these shops to let out
over a long time but the money was just not there until an in-law of
mine assisted me with some funds to start off. As you can see it will
soon be completed but it’s been two years now”.
200
transform their houses and for that reason had continued to subdue the urge to carry out
transformation despite the fact that a good number of their co-residents had done same.
The specific number of bedrooms and types of housing units allocated to
individual household in the study areas at inception as well as the types presently
available were analyzed. The result showed that there existed a direct relationship
between the types of houses or the number of bedrooms available to a household and the
forms of transformation carried out by the residents.
It was also discovered that the forms of transformations prevalent in these Low-
Income housing estates were mostly related to economic and social needs. These ranged
from enlargement of some interior spaces like the kitchens and living rooms which were
thought to be inadequate in size to perform their functions properly, addition of more
bedrooms for commercial and personal uses, shops used as sales outlets for the residents,
to the conversion of existing interior spaces into offices. More conspicuous was the
outright conversion of some of the residential houses into schools, churches, health
facilities, small and medium scale industries.
The residents' level of satisfaction with the overall features of their houses and the
environment was not encouraging and could have been responsible for most of their
actions. The result showed that almost all of those who had transformed their houses had
the addition of more bedrooms as their first forms of transformation while majority did
not have approved building plans or an authorization from the relevant agencies to
carryout transformation, a situation which may have been responsible for the general
poor quality of work.
It was also observed that the cost implications for most of the transformation was
quite enormous considering the fact that the estates were originally meant for the Low-
Income earners. The source of fund for majority of the respondent was largely through
personal savings because most of them claimed not to have taken loan from the banks.
The method of construction was mostly through direct labour which involved the use of
different trade’s men. The time spent in carrying out transformation was grossly varied
depending on issues such as funding, extent and type of transformation, technique or
method of implementation as well the quality expectation of the transformation itself.


![Chapter 7 Quantum Theory and the Electronic Structure … Five.pdf · July 19, 2009 [PROBLEM SET FROM R. CHANG TEST BANK] Page 1 Chapter 7 Quantum Theory and the Electronic Structure](https://img.dokumen.tips/doc/110x75/5b6a0e687f8b9a422e8ba07c/chapter-7-quantum-theory-and-the-electronic-structure-fivepdf-july-19-2009.jpg)