Embed Size (px)
Citation preview

page133
chapterNINEcosts of chronic kidney diseaseIs it so small a thing
To have enjoy’d the sun,
To have lived light in the spring,
To have loved, to have thought, to have done…
Matthew Arnold, “From the Hymn of Empedocles”
2010 usrds annual data report
volumeoneckdpage134
costs of chronic kidney disease9introduction
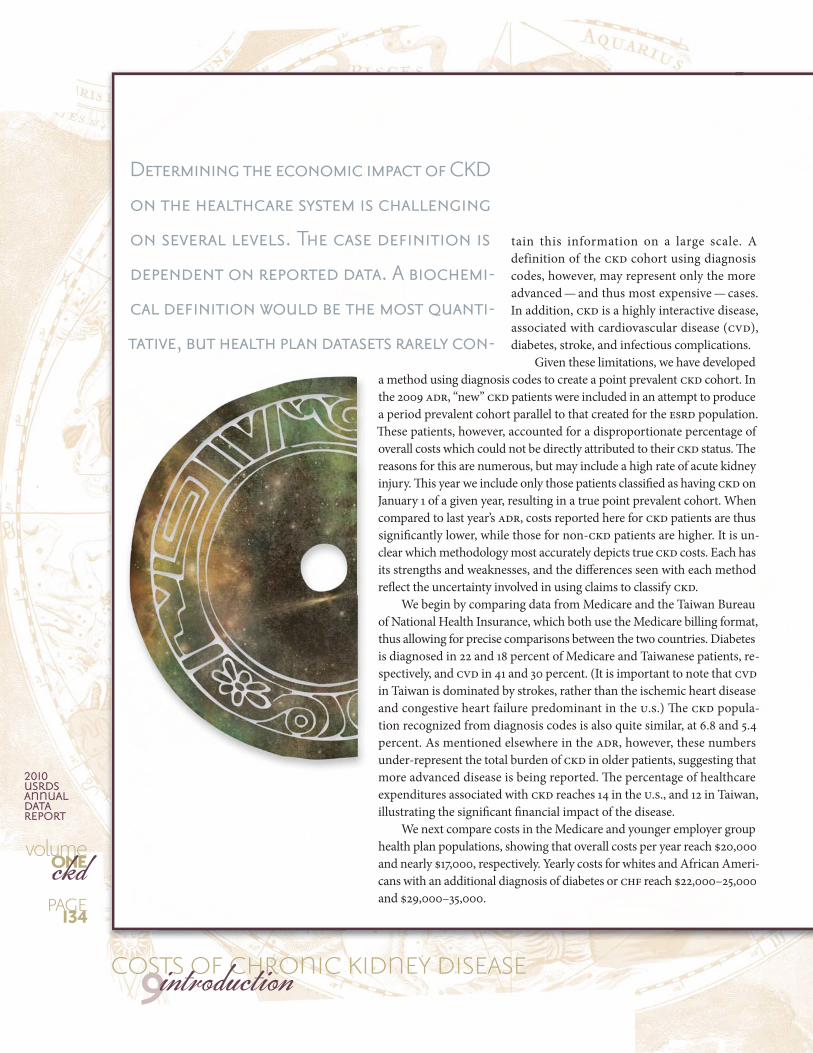
tain this information on a large scale. A definition of the CKD cohort using diagnosis codes, however, may represent only the more advanced — and thus most expensive — cases. In addition, CKD is a highly interactive disease, associated with cardiovascular disease (CVD), diabetes, stroke, and infectious complications.
Given these limitations, we have developed a method using diagnosis codes to create a point prevalent CKD cohort. In the 2009 ADR, “new” CKD patients were included in an attempt to produce a period prevalent cohort parallel to that created for the ESRD population. These patients, however, accounted for a disproportionate percentage of overall costs which could not be directly attributed to their CKD status. The reasons for this are numerous, but may include a high rate of acute kidney injury. This year we include only those patients classified as having CKD on January 1 of a given year, resulting in a true point prevalent cohort. When compared to last year’s ADR, costs reported here for CKD patients are thus significantly lower, while those for non-CKD patients are higher. It is un-clear which methodology most accurately depicts true CKD costs. Each has its strengths and weaknesses, and the differences seen with each method reflect the uncertainty involved in using claims to classify CKD.
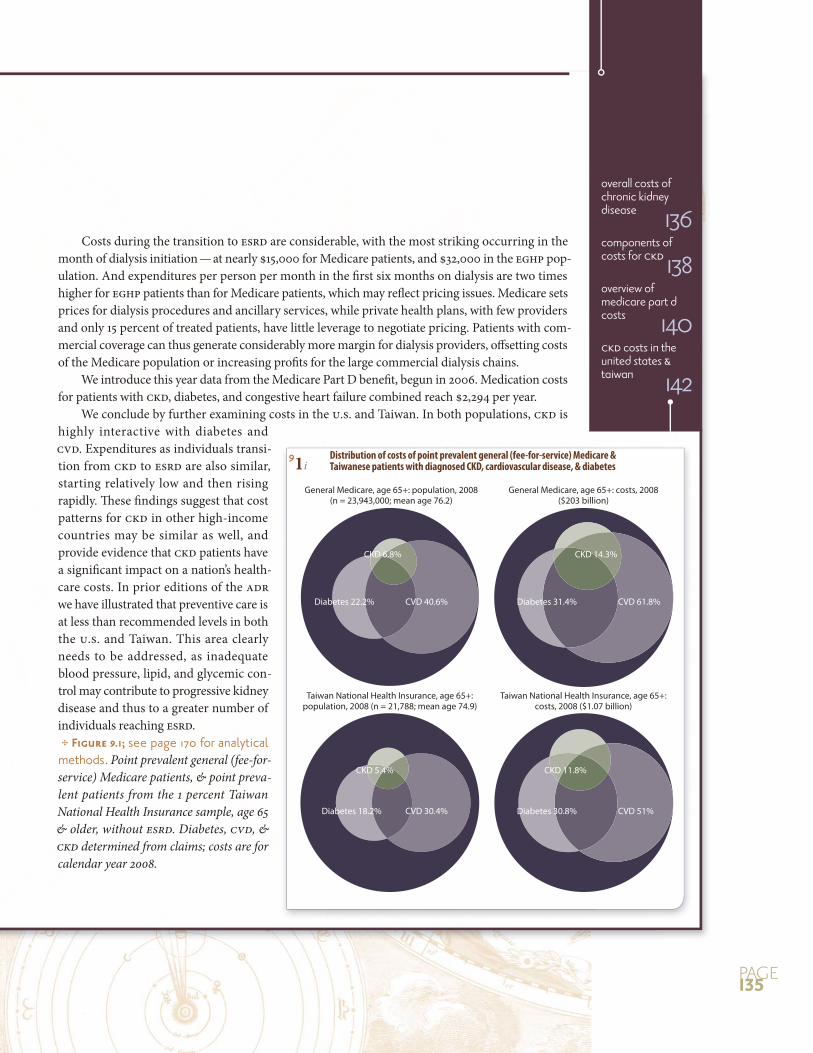
We begin by comparing data from Medicare and the Taiwan Bureau of National Health Insurance, which both use the Medicare billing format, thus allowing for precise comparisons between the two countries. Diabetes is diagnosed in 22 and 18 percent of Medicare and Taiwanese patients, re-spectively, and CVD in 41 and 30 percent. (It is important to note that CVD in Taiwan is dominated by strokes, rather than the ischemic heart disease and congestive heart failure predominant in the U.S.) The CKD popula-tion recognized from diagnosis codes is also quite similar, at 6.8 and 5.4 percent. As mentioned elsewhere in the ADR, however, these numbers under-represent the total burden of CKD in older patients, suggesting that more advanced disease is being reported. The percentage of healthcare expenditures associated with CKD reaches 14 in the U.S., and 12 in Taiwan, illustrating the significant financial impact of the disease.
We next compare costs in the Medicare and younger employer group health plan populations, showing that overall costs per year reach $20,000 and nearly $17,000, respectively. Yearly costs for whites and African Ameri-cans with an additional diagnosis of diabetes or CHF reach $22,000–25,000 and $29,000–35,000.
Determining the economic impact of CKD
on the healthcare system is challenging
on several levels. The case definition is
dependent on reported data. A biochemi-
-
tative, but health plan datasets rarely con-
Costs during the transition to ESRD are considerable, with the most striking occurring in the month of dialysis initiation — at nearly $15,000 for Medicare patients, and $32,000 in the EGHP pop-ulation. And expenditures per person per month in the first six months on dialysis are two times higher for EGHP patients than for Medicare patients, which may reflect pricing issues. Medicare sets prices for dialysis procedures and ancillary services, while private health plans, with few providers and only 15 percent of treated patients, have little leverage to negotiate pricing. Patients with com-mercial coverage can thus generate considerably more margin for dialysis providers, offsetting costs of the Medicare population or increasing profits for the large commercial dialysis chains.
We introduce this year data from the Medicare Part D benefit, begun in 2006. Medication costs for patients with CKD, diabetes, and congestive heart failure combined reach $2,294 per year.
We conclude by further examining costs in the U.S. and Taiwan. In both populations, CKD is highly interactive with diabetes and CVD. Expenditures as individuals transi-tion from CKD to ESRD are also similar, starting relatively low and then rising rapidly. These findings suggest that cost patterns for CKD in other high-income countries may be similar as well, and provide evidence that CKD patients have a significant impact on a nation’s health-care costs. In prior editions of the ADR we have illustrated that preventive care is at less than recommended levels in both the U.S. and Taiwan. This area clearly needs to be addressed, as inadequate blood pressure, lipid, and glycemic con-trol may contribute to progressive kidney disease and thus to a greater number of individuals reaching ESRD. see page 170 for analytical methods. Point prevalent general (fee-for-service) Medicare patients, & point preva-lent patients from the 1 percent Taiwan National Health Insurance sample, age 65 & older, without ESRD. Diabetes, CVD, & CKD determined from claims; costs are for calendar year 2008.
General Medicare, age 65+: population, 2008(n = 23,943,000; mean age 76.2)
General Medicare, age 65+: costs, 2008($203 billion)
Taiwan National Health Insurance, age 65+: population, 2008 (n = 21,788; mean age 74.9)
Taiwan National Health Insurance, age 65+: costs, 2008 ($1.07 billion)
Diabetes 22.2%
CKD 6.8%
CVD 40.6% Diabetes 31.4%
CKD 14.3%
CVD 61.8%
Diabetes 18.2%
CKD 5.4%
CVD 30.4% Diabetes 30.8%
CKD 11.8%
CVD 51%
page135
91i Distribution of costs of point prevalent general (fee-for-service) Medicare & Taiwanese patients with diagnosed CKD, cardiovascular disease, & diabetes
overall costs of chronic kidney disease 136components of costs for ckd 138overview of medicare part d costs 140ckd costs in the united states & taiwan 142
0
5
10
15
20
25
20072008
Medicare (65+)
All CKD 585.1-2 585.3-5 585.9/other
PPPY
cos
ts ($
, in
thou
sand
s)0
5
10
15
20
25MarketScan (50-64)
0
10
20
30White
All CKD 585.1-2 585.3-5 585.9/other0
10
20
30African American
PPPY
cos
ts ($
, in
thou
sand
s)
20072008
0
10
20
30
40
All CKD 585.1-2 585.3-5 585.9/other0
10
20
30
40
White
African American
PPPY
cos
ts ($
, in
thou
sand
s)
20072008
2010 usrds annual data report
volumeoneckdpage136
9costs of chronic kidney diseaseoverall costs of chronic kidney disease
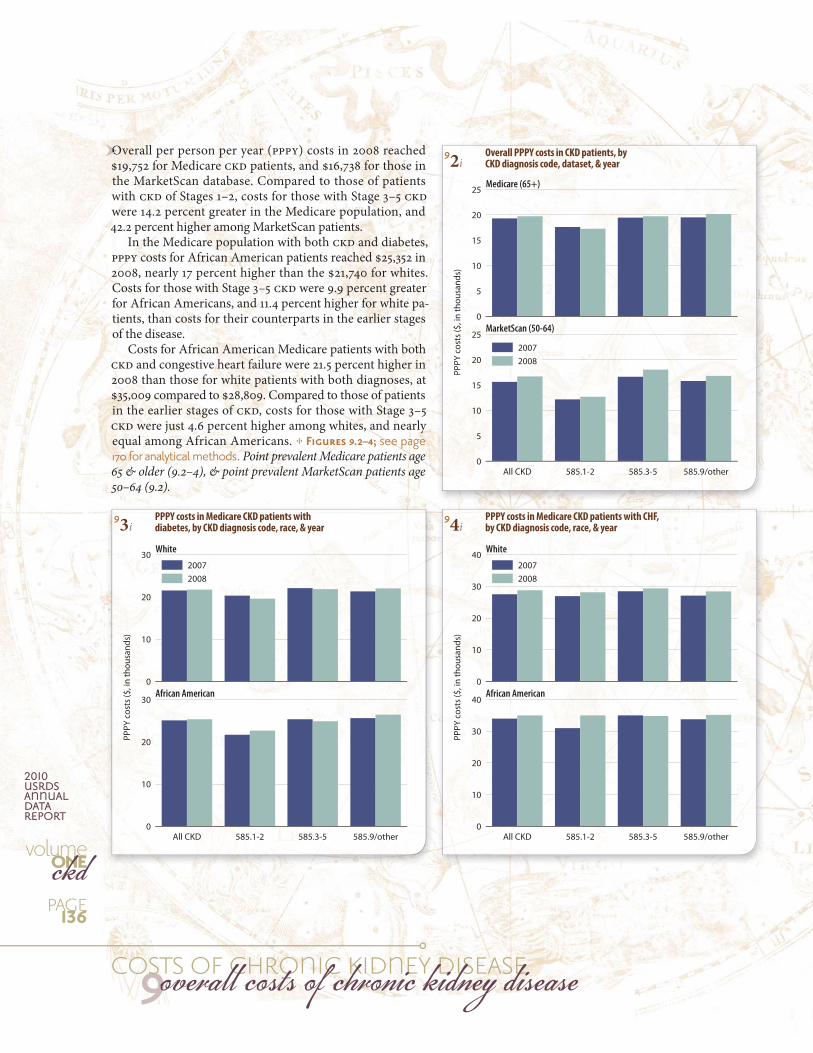
92i Overall PPPY costs in CKD patients, by CKD diagnosis code, dataset, & year
93i PPPY costs in Medicare CKD patients with diabetes, by CKD diagnosis code, race, & year
94i PPPY costs in Medicare CKD patients with CHF, by CKD diagnosis code, race, & year
Overall per person per year (PPPY) costs in 2008 reached $19,752 for Medicare CKD patients, and $16,738 for those in the MarketScan database. Compared to those of patients with CKD of Stages 1–2, costs for those with Stage 3–5 CKD were 14.2 percent greater in the Medicare population, and 42.2 percent higher among MarketScan patients.
In the Medicare population with both CKD and diabetes, PPPY costs for African American patients reached $25,352 in 2008, nearly 17 percent higher than the $21,740 for whites. Costs for those with Stage 3–5 CKD were 9.9 percent greater for African Americans, and 11.4 percent higher for white pa-tients, than costs for their counterparts in the earlier stages of the disease.
Costs for African American Medicare patients with both CKD and congestive heart failure were 21.5 percent higher in 2008 than those for white patients with both diagnoses, at $35,009 compared to $28,809. Compared to those of patients in the earlier stages of CKD, costs for those with Stage 3–5 CKD were just 4.6 percent higher among whites, and nearly equal among African Americans. see page 170 for analytical methods. Point prevalent Medicare patients age 65 & older (9.2–4), & point prevalent MarketScan patients age 50–64 (9.2).
OOOOOOOOOOOOOOOOOO
Months pre- & post-initiation-6 -5 -4 -3 -2 -1 1 2 3 4 5 6
0
5
10
15
20
25
Medicare (age 67+)
MarketScan (age <65)
PPPM
exp
endi
ture
s ($
, in
1,00
0s)
Months pre- & post-initiation-6 -5 -4 -3 -2 -1 1 2 3 4 5 6
0
1
2
3
Medicare (age 67+)
MarketScan (age <65)
PPPM
exp
endi
ture
s ($
, in
1,00
0s)
Months pre- & post-initiation-6 -5 -4 -3 -2 -1 1 2 3 4 5 6
0
5
10
15
20
25
30
35
Medicare (age 67+)
MarketScan (age <65)
PPPM
exp
endi
ture
s ($
, in
1,00
0s)
Months pre- & post-initiation-6 -5 -4 -3 -2 -1 1 2 3 4 5 6
0
2
4
6
8
Medicare (age 67+)
MarketScan (age <65)
PPPM
exp
endi
ture
s ($
, in
1,00
0s)
pppm expenditures during the transition to esrd
page137
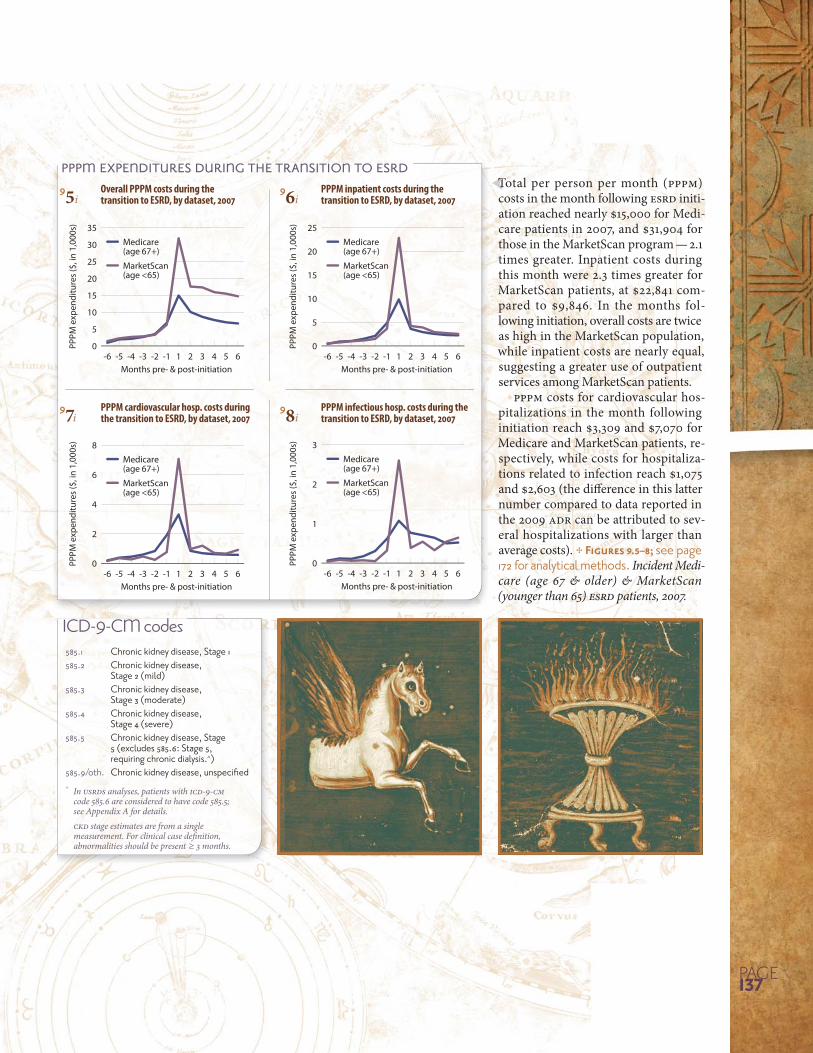
95i Overall PPPM costs during the transition to ESRD, by dataset, 2007
97i PPPM cardiovascular hosp. costs during the transition to ESRD, by dataset, 2007
96i PPPM inpatient costs during the transition to ESRD, by dataset, 2007
98i PPPM infectious hosp. costs during the transition to ESRD, by dataset, 2007
Total per person per month (PPPM) costs in the month following ESRD initi-ation reached nearly $15,000 for Medi-care patients in 2007, and $31,904 for those in the MarketScan program — 2.1 times greater. Inpatient costs during this month were 2.3 times greater for MarketScan patients, at $22,841 com-pared to $9,846. In the months fol-lowing initiation, overall costs are twice as high in the MarketScan population, while inpatient costs are nearly equal, suggesting a greater use of outpatient services among MarketScan patients.
PPPM costs for cardiovascular hos-pitalizations in the month following initiation reach $3,309 and $7,070 for Medicare and MarketScan patients, re-spectively, while costs for hospitaliza-tions related to infection reach $1,075 and $2,603 (the difference in this latter number compared to data reported in the 2009 ADR can be attributed to sev-eral hospitalizations with larger than average costs). see page 172 for analytical methods. Incident Medi-care (age 67 & older) & MarketScan (younger than 65) ESRD patients, 2007.
TTTTTTTTTTTTTTTTT
ICD-9-CM codes585.1 Chronic kidney disease, Stage 1585.2 Chronic kidney disease,
Stage 2 (mild)585.3 Chronic kidney disease,
Stage 3 (moderate)585.4 Chronic kidney disease,
Stage 4 (severe)585.5 Chronic kidney disease, Stage
5 (excludes 585.6: Stage 5, requiring chronic dialysis.^)
585.9/oth. ^ In USRDS analyses, patients with ICD-9-CM
code 585.6 are considered to have code 585.5; see Appendix A for details.
CKD stage estimates are from a single measurement. For clinical case defi nition, abnormalities should be present ≥ 3 months.
2010 usrds annual data report
volumeoneckdpage
9costs of chronic kidney diseasecomponents of costs for ckd
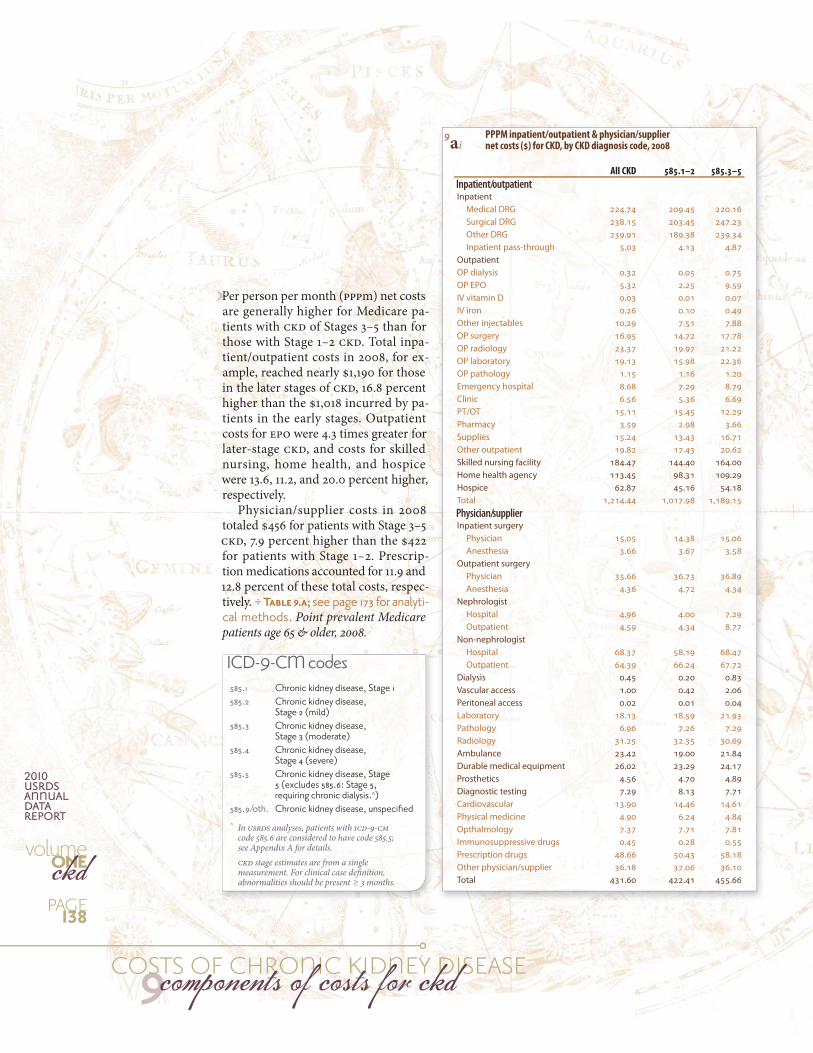
9ai PPPM inpatient/outpatient & physician/supplier net costs ($) for CKD, by CKD diagnosis code, 2008
All CKD 585.1–2 585.3–5
Inpatient/outpatientInpatient Medical DRG 224.74 209.45 220.16 Surgical DRG 238.15 203.45 247.23 Other DRG 239.91 189.38 239.34 Inpatient pass-through 5.03 4.13 4.87OutpatientOP dialysis 0.32 0.05 0.75OP EPO 5.32 2.25 9.59IV vitamin D 0.03 0.01 0.07IV iron 0.26 0.10 0.49Other injectables 10.29 7.51 7.88OP surgery 16.95 14.72 17.78OP radiology 23.37 19.97 21.22OP laboratory 19.13 15.98 22.36OP pathology 1.15 1.16 1.20Emergency hospital 8.68 7.29 8.79Clinic 6.56 5.36 6.69PT/OT 15.11 15.45 12.29Pharmacy 3.59 2.98 3.66Supplies 15.24 13.43 16.71Other outpatient 19.82 17.43 20.62Skilled nursing facility 184.47 144.40 164.00Home health agency 113.45 98.31 109.29Hospice 62.87 45.16 54.18Total 1,214.44 1,017.98 1,189.15Physician/supplierInpatient surgery Physician 15.05 14.38 15.06 Anesthesia 3.66 3.67 3.58Outpatient surgery Physician 35.66 36.73 36.89 Anesthesia 4.36 4.72 4.34Nephrologist Hospital 4.96 4.00 7.29 Outpatient 4.59 4.34 8.77Non-nephrologist Hospital 68.37 58.19 68.47 Outpatient 64.39 66.24 67.72Dialysis 0.45 0.20 0.83Vascular access 1.00 0.42 2.06Peritoneal access 0.02 0.01 0.04Laboratory 18.13 18.59 21.93Pathology 6.96 7.26 7.29Radiology 31.25 32.35 30.69Ambulance 23.42 19.00 21.84Durable medical equipment 26.02 23.29 24.17Prosthetics 4.56 4.70 4.89Diagnostic testing 7.29 8.13 7.71Cardiovascular 13.90 14.46 14.61Physical medicine 4.90 6.24 4.84Opthalmology 7.37 7.71 7.81Immunosuppressive drugs 0.45 0.28 0.55Prescription drugs 48.66 50.43 58.18Other physician/supplier 36.18 37.06 36.10Total 431.60 422.41 455.66
ICD-9-CM codes585.1 Chronic kidney disease, Stage 1585.2 Chronic kidney disease,
Stage 2 (mild)585.3 Chronic kidney disease,
Stage 3 (moderate)585.4 Chronic kidney disease,
Stage 4 (severe)585.5 Chronic kidney disease, Stage
5 (excludes 585.6: Stage 5, requiring chronic dialysis.^)
585.9/oth. ^ In USRDS analyses, patients with ICD-9-CM
code 585.6 are considered to have code 585.5; see Appendix A for details.
CKD stage estimates are from a single measurement. For clinical case defi nition, abnormalities should be present ≥ 3 months.
Per person per month (PPPm) net costs are generally higher for Medicare pa-tients with CKD of Stages 3–5 than for those with Stage 1–2 CKD. Total inpa-tient/outpatient costs in 2008, for ex-ample, reached nearly $1,190 for those in the later stages of CKD, 16.8 percent higher than the $1,018 incurred by pa-tients in the early stages. Outpatient costs for EPO were 4.3 times greater for later-stage CKD, and costs for skilled nursing, home health, and hospice were 13.6, 11.2, and 20.0 percent higher, respectively.
Physician/supplier costs in 2008 totaled $456 for patients with Stage 3–5 CKD, 7.9 percent higher than the $422 for patients with Stage 1–2. Prescrip-tion medications accounted for 11.9 and 12.8 percent of these total costs, respec-tively. see page 173 for analyti-cal methods. Point prevalent Medicare patients age 65 & older, 2008.
PP
All Medicare All CKD CKD + DM CKD + DM + CHFNo CKD/DM/CHF CKD only CKD + CHF
PPPY
cos
ts ($
, in
thou
sand
s)
0.0
0.5
1.0
1.5
2.0
2.5
2006 2007
PPPY
cos
ts ($
, in
thou
sand
s)
0.0
0.5
1.0
1.5
2.0
2.5
2006 2007
All Medicare All CKD CKD + DM CKD + DM + CHFNo CKD/DM/CHF CKD only CKD + CHF
PPPY
cos
ts ($
, in
thou
sand
s)
0.0
0.5
1.0
1.5
2.0
2.5
2006 2007
All Medicare All CKD CKD + DM CKD + DM + CHFNo CKD/DM/CHF CKD only CKD + CHF
page
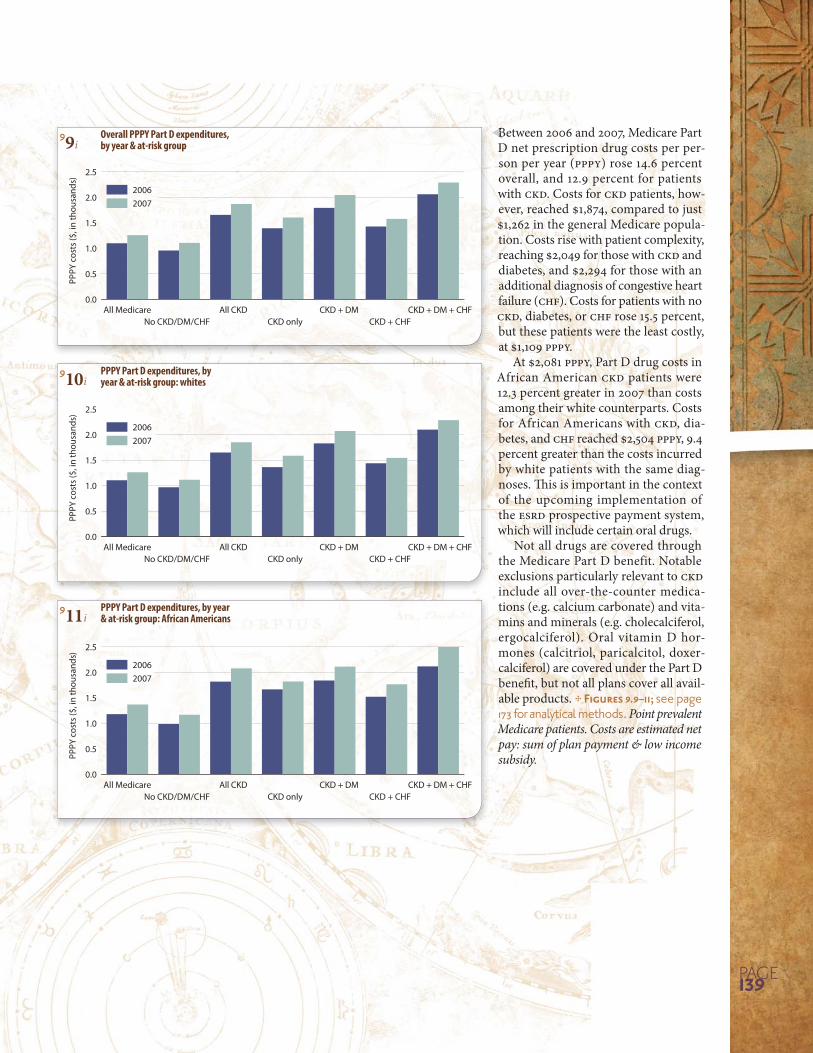
99i Overall PPPY Part D expenditures, by year & at-risk group
910i PPPY Part D expenditures, by year & at-risk group: whites
911i PPPY Part D expenditures, by year & at-risk group: African Americans
Between 2006 and 2007, Medicare Part D net prescription drug costs per per-son per year (PPPY) rose 14.6 percent overall, and 12.9 percent for patients with CKD. Costs for CKD patients, how-ever, reached $1,874, compared to just $1,262 in the general Medicare popula-tion. Costs rise with patient complexity, reaching $2,049 for those with CKD and diabetes, and $2,294 for those with an additional diagnosis of congestive heart failure (CHF). Costs for patients with no CKD, diabetes, or CHF rose 15.5 percent, but these patients were the least costly, at $1,109 PPPY.
At $2,081 PPPY, Part D drug costs in African American CKD patients were 12.3 percent greater in 2007 than costs among their white counterparts. Costs for African Americans with CKD, dia-betes, and CHF reached $2,504 PPPY, 9.4 percent greater than the costs incurred by white patients with the same diag-noses. This is important in the context of the upcoming implementation of the ESRD prospective payment system, which will include certain oral drugs.
Not all drugs are covered through the Medicare Part D benefit. Notable exclusions particularly relevant to CKD include all over-the-counter medica-tions (e.g. calcium carbonate) and vita-mins and minerals (e.g. cholecalciferol, ergocalciferol). Oral vitamin D hor-mones (calcitriol, paricalcitol, doxer-calciferol) are covered under the Part D benefit, but not all plans cover all avail-able products. see page 173 for analytical methods. Point prevalent Medicare patients. Costs are estimated net pay: sum of plan payment & low income subsidy.
BB
2006 2007
Bars
: CKD
’s %
of M
edic
are
0
1
2
3
4
5
6
0
10
20
30
40
50
60Li
nes:
Expe
nditu
res
($, i
n bi
llion
s)Total Part D Medicare
Total Part D CKD
2010 usrds annual data report
volumeoneckdpage140
9costs of chronic kidney diseaseoverview of medicare part d costs
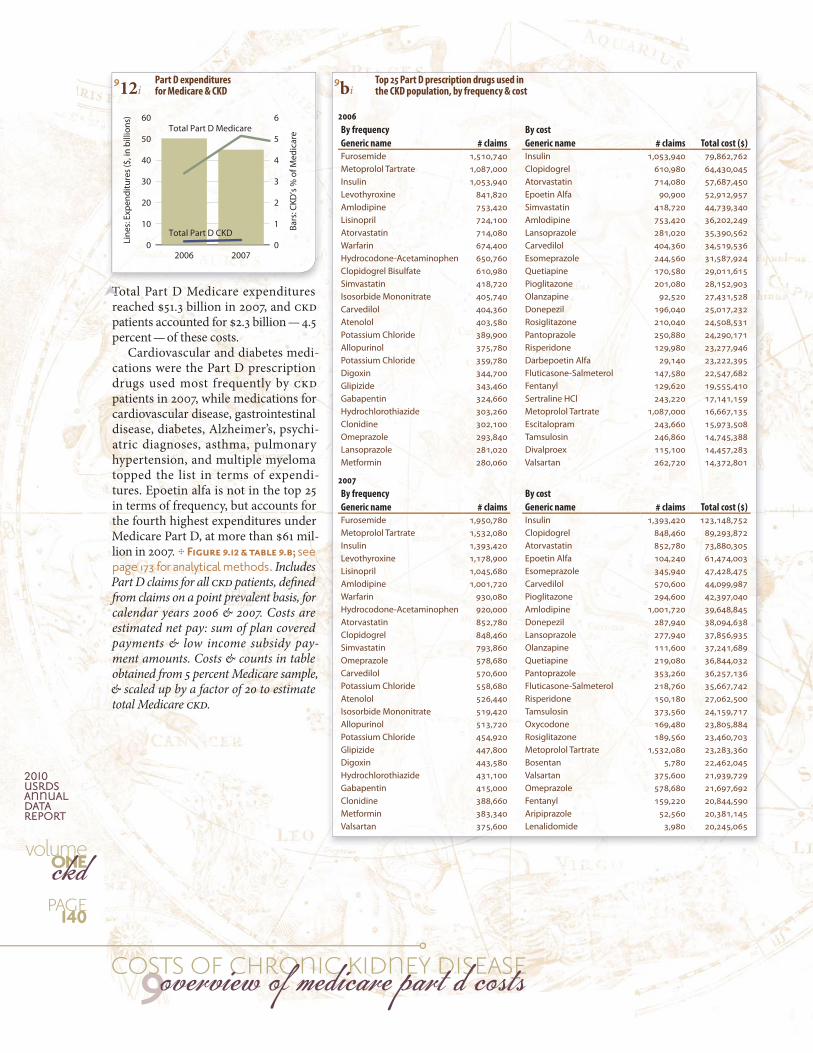
912i Part D expenditures for Medicare & CKD
9bi Top 25 Part D prescription drugs used in the CKD population, by frequency & cost
2006
By frequency By cost
Generic name # claims Generic name # claims Total cost ($)
Furosemide 1,510,740 Insulin 1,053,940 79,862,762Metoprolol Tartrate 1,087,000 Clopidogrel 610,980 64,430,045Insulin 1,053,940 Atorvastatin 714,080 57,687,450Levothyroxine 841,820 Epoetin Alfa 90,900 52,912,957Amlodipine 753,420 Simvastatin 418,720 44,739,340Lisinopril 724,100 Amlodipine 753,420 36,202,249Atorvastatin 714,080 Lansoprazole 281,020 35,390,562Warfarin 674,400 Carvedilol 404,360 34,519,536Hydrocodone-Acetaminophen 650,760 Esomeprazole 244,560 31,587,924Clopidogrel Bisulfate 610,980 Quetiapine 170,580 29,011,615Simvastatin 418,720 Pioglitazone 201,080 28,152,903Isosorbide Mononitrate 405,740 Olanzapine 92,520 27,431,528Carvedilol 404,360 Donepezil 196,040 25,017,232Atenolol 403,580 Rosiglitazone 210,040 24,508,531Potassium Chloride 389,900 Pantoprazole 250,880 24,290,171Allopurinol 375,780 Risperidone 129,980 23,277,946Potassium Chloride 359,780 Darbepoetin Alfa 29,140 23,222,395Digoxin 344,700 Fluticasone-Salmeterol 147,580 22,547,682Glipizide 343,460 Fentanyl 129,620 19,555,410Gabapentin 324,660 Sertraline HCl 243,220 17,141,159Hydrochlorothiazide 303,260 Metoprolol Tartrate 1,087,000 16,667,135Clonidine 302,100 Escitalopram 243,660 15,973,508Omeprazole 293,840 Tamsulosin 246,860 14,745,388Lansoprazole 281,020 Divalproex 115,100 14,457,283Metformin 280,060 Valsartan 262,720 14,372,801
2007
By frequency By cost
Generic name # claims Generic name # claims Total cost ($)
Furosemide 1,950,780 Insulin 1,393,420 123,148,752Metoprolol Tartrate 1,532,080 Clopidogrel 848,460 89,293,872Insulin 1,393,420 Atorvastatin 852,780 73,880,305Levothyroxine 1,178,900 Epoetin Alfa 104,240 61,474,003Lisinopril 1,045,680 Esomeprazole 345,940 47,428,475Amlodipine 1,001,720 Carvedilol 570,600 44,099,987Warfarin 930,080 Pioglitazone 294,600 42,397,040Hydrocodone-Acetaminophen 920,000 Amlodipine 1,001,720 39,648,845Atorvastatin 852,780 Donepezil 287,940 38,094,638Clopidogrel 848,460 Lansoprazole 277,940 37,856,935Simvastatin 793,860 Olanzapine 111,600 37,241,689Omeprazole 578,680 Quetiapine 219,080 36,844,032Carvedilol 570,600 Pantoprazole 353,260 36,257,136Potassium Chloride 558,680 Fluticasone-Salmeterol 218,760 35,667,742Atenolol 526,440 Risperidone 150,180 27,062,500Isosorbide Mononitrate 519,420 Tamsulosin 373,560 24,159,717Allopurinol 513,720 Oxycodone 169,480 23,805,884Potassium Chloride 454,920 Rosiglitazone 189,560 23,460,703Glipizide 447,800 Metoprolol Tartrate 1,532,080 23,283,360Digoxin 443,580 Bosentan 5,780 22,462,045Hydrochlorothiazide 431,100 Valsartan 375,600 21,939,729Gabapentin 415,000 Omeprazole 578,680 21,697,692Clonidine 388,660 Fentanyl 159,220 20,844,590Metformin 383,340 Aripiprazole 52,560 20,381,145Valsartan 375,600 Lenalidomide 3,980 20,245,065
Total Part D Medicare expenditures reached $51.3 billion in 2007, and CKD patients accounted for $2.3 billion — 4.5 percent — of these costs.
Cardiovascular and diabetes medi-cations were the Part D prescription drugs used most frequently by CKD patients in 2007, while medications for cardiovascular disease, gastrointestinal disease, diabetes, Alzheimer’s, psychi-atric diagnoses, asthma, pulmonary hypertension, and multiple myeloma topped the list in terms of expendi-tures. Epoetin alfa is not in the top 25 in terms of frequency, but accounts for the fourth highest expenditures under Medicare Part D, at more than $61 mil-lion in 2007. see page 173 for analytical methods. Includes Part D claims for all CKD patients, defined from claims on a point prevalent basis, for calendar years 2006 & 2007. Costs are estimated net pay: sum of plan covered payments & low income subsidy pay-ment amounts. Costs & counts in table obtained from 5 percent Medicare sample, & scaled up by a factor of 20 to estimate total Medicare CKD.
TT
20-44 45-64 65-74 75+
PPPM
exp
endi
ture
s (in
dol
lars
)
0
2
4
6
8
10
12
ACEIs/ARBs/renin inhibitors Beta blockers NDP-CCBs DP-CCBs
Age
Race
White Af Am Other0
2
4
6
8
10
12
20-44 45-64 65-74 75+0
5
10
15
20
Statins Fibrates Bile acidsequestrants
Cholesterol absorption inhib.
All others
White Af Am Other0
5
10
15
20PP
PM e
xpen
ditu
res (
in d
olla
rs)
Age
Race
20-44 45-64 65-74 75+0.0
0.2
0.4
0.6
0.8
1.0
DoxercalciferolParicalcitolCalcitriol
White Af Am Other0.0
0.2
0.4
0.6
0.8
1.0
PPPM
exp
endi
ture
s (in
dol
lars
)
Age
Race
20-44 45-64 65-74 75+0
10
20
30
40
Insulin Sulfonylureas Metformin TZDs
White Af Am Other0
10
20
30
40
PPPM
exp
endi
ture
s (in
dol
lars
)
Age
Race
20-44 45-64 65-74 75+0
1
2
3
4
Any Loop Thiazide Potassium-sparing
White Af Am Other0
1
2
3
4
PPPM
exp
endi
ture
s (in
dol
lars
)
Age
Race
page141
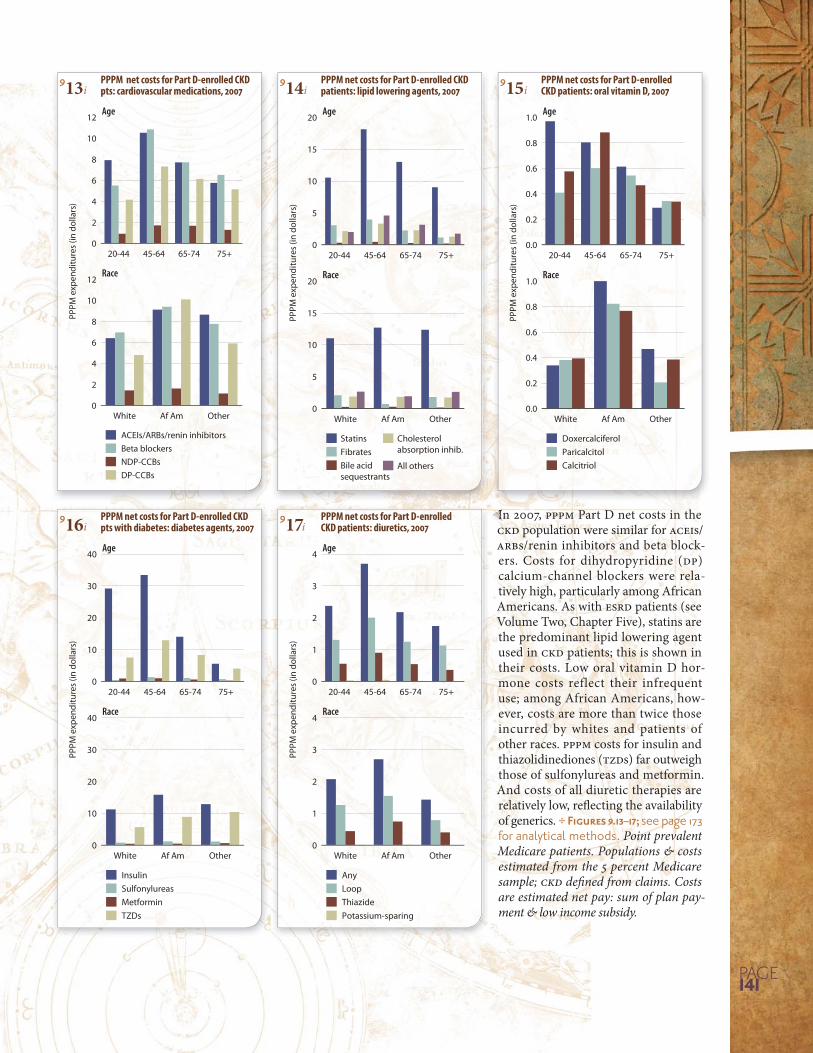
913i PPPM net costs for Part D-enrolled CKD pts: cardiovascular medications, 2007
914i PPPM net costs for Part D-enrolled CKD patients: lipid lowering agents, 2007
915i PPPM net costs for Part D-enrolled CKD patients: oral vitamin D, 2007
916i PPPM net costs for Part D-enrolled CKD pts with diabetes: diabetes agents, 2007
917i PPPM net costs for Part D-enrolled CKD patients: diuretics, 2007
In 2007, PPPM Part D net costs in the CKD population were similar for ACEIs/ARBs/renin inhibitors and beta block-ers. Costs for dihydropyridine (DP) calcium-channel blockers were rela-tively high, particularly among African Americans. As with ESRD patients (see Volume Two, Chapter Five), statins are the predominant lipid lowering agent used in CKD patients; this is shown in their costs. Low oral vitamin D hor-mone costs reflect their infrequent use; among African Americans, how-ever, costs are more than twice those incurred by whites and patients of other races. PPPM costs for insulin and thiazolidinediones (TZDs) far outweigh those of sulfonylureas and metformin. And costs of all diuretic therapies are relatively low, reflecting the availability of generics. see page 173 for analytical methods. Point prevalent Medicare patients. Populations & costs estimated from the 5 percent Medicare sample; CKD defined from claims. Costs are estimated net pay: sum of plan pay-ment & low income subsidy.
IIIInInIIIIIIIIIIIIIII
93 95 97 99 01 03 05 07
Bars
: CKD
’s pe
rcen
t of p
rogr
am
0
4
8
12
16
0
50
100
150
200
Line
s: Ex
pend
iture
s ($,
in b
illio
ns)
Total Medicare
CKD
01 02 03 04 05 06 07 08
Bars
: CKD
’s pe
rcen
t of p
rogr
am
0
3
6
9
12
0
300
600
900
1,200
Line
s: E
xpen
ditu
res
(NT$
, in
mill
ions
)
Total NHl
CKD
Medicare (65+) Taiwan (65+)
93 95 97 99 01 03 05 07
Bars
: CKD
/DM
% o
f pro
gram
0
6
12
18
24
0
20
40
60
80
Total Medicare DM
CKD+DM
01 02 03 04 05 06 07 08
Bars
: CKD
/DM
% o
f pro
gram
0
6
12
18
24
0
100
200
300
400
Line
s: E
xpen
ditu
res
(NT$
, in
mill
ions
)
Tota NHl DM
CKD+DM
Line
s: Ex
pend
iture
s ($,
in b
illio
ns) Medicare (65+) Taiwan (65+)
93 95 97 99 01 03 05 07
Bars
: CKD
/CVD
% o
f pro
gram
0
4
8
12
16
20
0
25
50
75
100
125Total Medicare CVD
CKD+ CVD
01 02 03 04 05 06 07 08
Bars
: CKD
/CVD
% o
f pro
gram
0
4
8
12
16
0
150
300
450
600
Line
s: E
xpen
ditu
res
(NT$
, in
mill
ions
)
Total NHI CVD
CKD+ CVD
Line
s: Ex
pend
iture
s ($,
in b
illio
ns) Medicare (65+) Taiwan (65+)
2010 usrds annual data report
volumeoneckdpage
9costs of chronic kidney diseaseckd costs in the united states & taiwan
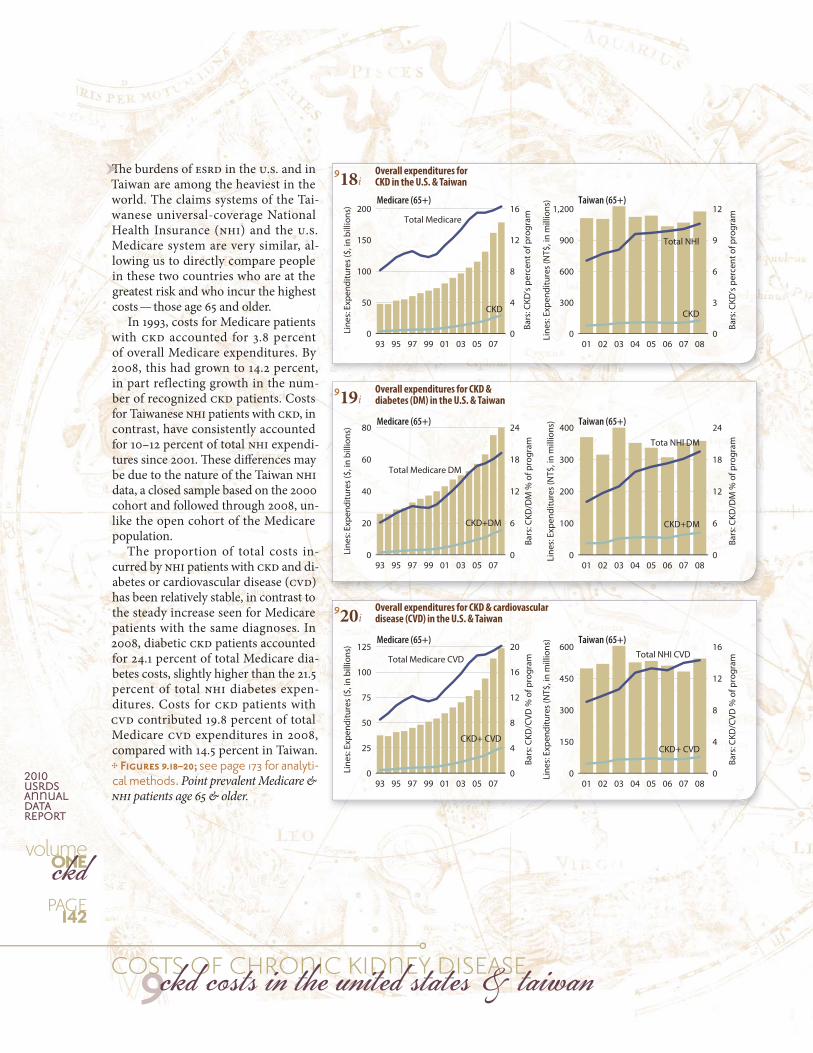
918i Overall expenditures for CKD in the U.S. & Taiwan
920i Overall expenditures for CKD & cardiovascular disease (CVD) in the U.S. & Taiwan
919i Overall expenditures for CKD & diabetes (DM) in the U.S. & Taiwan
The burdens of ESRD in the U.S. and in Taiwan are among the heaviest in the world. The claims systems of the Tai-wanese universal-coverage National Health Insurance (NHI) and the U.S. Medicare system are very similar, al-lowing us to directly compare people in these two countries who are at the greatest risk and who incur the highest costs — those age 65 and older.
In 1993, costs for Medicare patients with CKD accounted for 3.8 percent of overall Medicare expenditures. By 2008, this had grown to 14.2 percent, in part reflecting growth in the num-ber of recognized CKD patients. Costs for Taiwanese NHI patients with CKD, in contrast, have consistently accounted for 10–12 percent of total NHI expendi-tures since 2001. These differences may be due to the nature of the Taiwan NHI data, a closed sample based on the 2000 cohort and followed through 2008, un-like the open cohort of the Medicare population.
The proportion of total costs in-curred by NHI patients with CKD and di-abetes or cardiovascular disease (CVD) has been relatively stable, in contrast to the steady increase seen for Medicare patients with the same diagnoses. In 2008, diabetic CKD patients accounted for 24.1 percent of total Medicare dia-betes costs, slightly higher than the 21.5 percent of total NHI diabetes expen-ditures. Costs for CKD patients with CVD contributed 19.8 percent of total Medicare CVD expenditures in 2008, compared with 14.5 percent in Taiwan.
see page 173 for analyti-cal methods. Point prevalent Medicare & NHI patients age 65 & older.
ThThThThThThThThThThThThThThThThThThThThTh
93 95 97 99 01 03 05 07 0.0
0.5
1.0
1.5
2.0
2.5
01 02 03 04 05 06 07 08 0
3
6
9
12
15
NDM/NCVD
CKD+DM
CKD+CVD
CKD+DM+CVD
All
PPPM
exp
endi
ture
s ($
, in
1,00
0s)
PPPM
exp
endi
ture
s (N
T$, i
n 1,
000s
)Medicare (65+) Taiwan (65+)
Months pre- & post-initiation-6 -5 -4 -3 -2 -1 1 2 3 4 5 6
PPPM
exp
endi
ture
s ($,
in 1
,000
s)
0
10
20
30
40
Medicare (67+)MarketScan(<65)
-6 -5 -4 -3 -2 -1 1 2 3 4 5 6
PPPM
exp
endi
ture
s (N
T$, i
n 1,
000s
)
0
30
60
90
120
<65 ≥65
Medicare & MarketScan, 2007 Taiwan NHI, 2000-2008
-6 -5 -4 -3 -2 -1 1 2 3 4 5 60
6
12
18
24
-6 -5 -4 -3 -2 -1 1 2 3 4 5 60
20
40
60
80
Months pre- & post-initiation
PPPM
exp
endi
ture
s ($,
in 1
,000
s)
Medicare (67+)MarketScan(<65)
PPPM
exp
endi
ture
s (N
T$, i
n 1,
000s
)
<65 ≥65
Medicare & MarketScan, 2007 Taiwan NHI, 2000-2008
page143
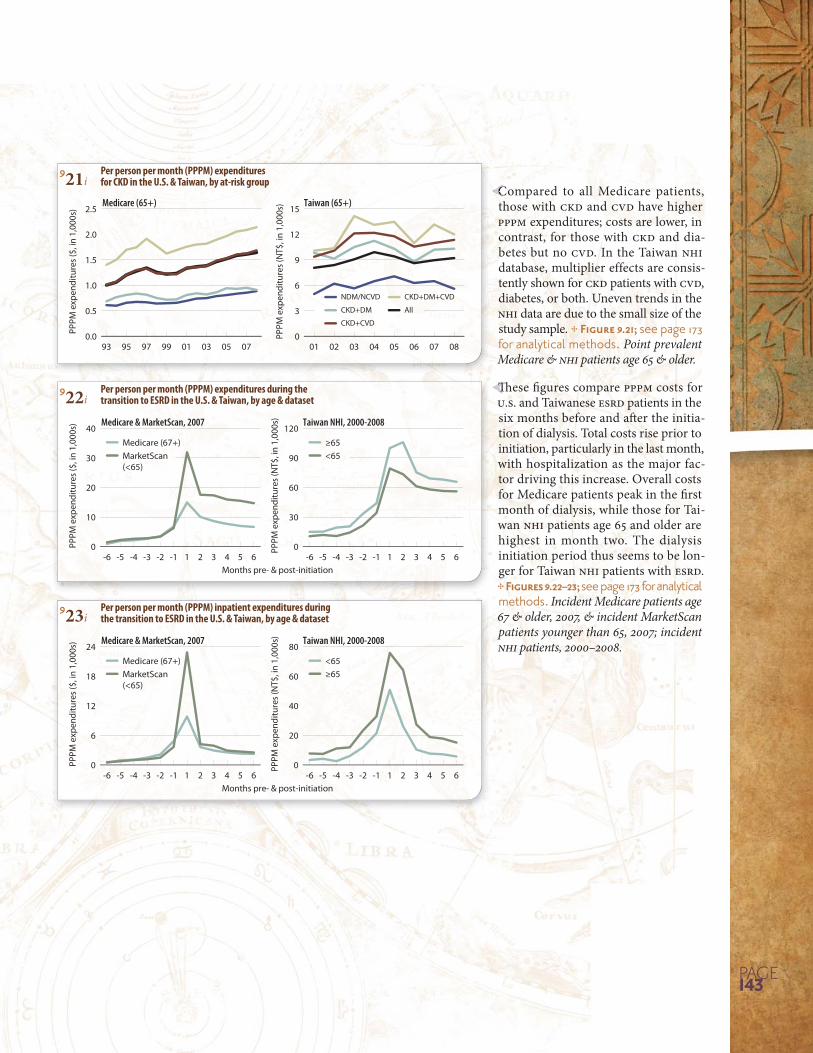
921i Per person per month (PPPM) expenditures for CKD in the U.S. & Taiwan, by at-risk group
923i Per person per month (PPPM) inpatient expenditures during the transition to ESRD in the U.S. & Taiwan, by age & dataset
922i Per person per month (PPPM) expenditures during the transition to ESRD in the U.S. & Taiwan, by age & dataset
Compared to all Medicare patients, those with CKD and CVD have higher PPPM expenditures; costs are lower, in contrast, for those with CKD and dia-betes but no CVD. In the Taiwan NHI database, multiplier effects are consis-tently shown for CKD patients with CVD, diabetes, or both. Uneven trends in the NHI data are due to the small size of the study sample. see page 173 for analytical methods. Point prevalent Medicare & NHI patients age 65 & older.
CC
These figures compare PPPM costs for U.S. and Taiwanese ESRD patients in the six months before and after the initia-tion of dialysis. Total costs rise prior to initiation, particularly in the last month, with hospitalization as the major fac-tor driving this increase. Overall costs for Medicare patients peak in the first month of dialysis, while those for Tai-wan NHI patients age 65 and older are highest in month two. The dialysis initiation period thus seems to be lon-ger for Taiwan NHI patients with ESRD.
see page 173 for analytical methods. Incident Medicare patients age 67 & older, 2007, & incident MarketScan patients younger than 65, 2007; incident NHI patients, 2000–2008.
ThTh