Embed Size (px)
Citation preview

89
CHAPTER 4
PERFORMANCE ANALYSIS OF THE ALAMOUTI STBC
BASED DS-CDMA SYSTEM
4.1 INTRODUCTION
This chapter investigates a technique, which uses antenna diversity
to achieve full transmit diversity, using an arbitrary number of transmit
antennas for secure communications, and to improve the system performance
by mitigating interference. The work is focussed on the performance of DS-
CDMA systems over the Rayleigh, Rician and AWGN fading channels, in the
case of the channel being known at the receiver. The diversity scheme used in
the analysis is the Alamouti STBC scheme. Using analytical and simulation
approach, we have shown that the STBC CDMA system has increased
performance in cellular networks. We also compared the performance of this
system with that of the typical DS-CDMA system, and shown that the STBC
and multiple transmit antennas for the DS-CDMA system, provide
performance gains without any need of extra processing. The evaluation and
comparison of the performances of the DS-CDMA system in the AWGN,
Rician and the Rayleigh fading channels are provided.
In this chapter, fading channel STBC DS-CDMA system has been
implemented and analyzed. And the analysis is made under two conditions,
by assuming (i) Two transmit and One receiving antenna and (ii) Two
transmit and two receiving antennas. Both the schemes in the AWGN,
Rayleigh and Rician fading channels have been analyzed. Using the analytical
90
and
sim
ulat
ion
appr
oach
, it i
s sh
own
that
the
latte
r cas
e is
adv
anta
geou
s ov
er
the
tradi
tiona
l C
DM
A s
yste
m, i
nclu
ding
bet
ter
BER
per
form
ance
and
low
er
com
plex
ity. I
t has
bee
n ob
serv
ed th
at th
e B
ER p
erfo
rman
ce o
f th
e sy
stem
is
impr
oved
with
ant
enna
div
ersi
ty sc
hem
es.
The
sim
ulat
ion
resu
lts s
how
tha
t th
e B
ER p
erfo
rman
ce i
s be
tter,
usin
g th
e A
lam
outi
sche
me
unde
r the
AW
GN
and
Ric
ian
chan
nel,
whe
reas
it
is w
orse
und
er t
he R
ayle
igh
fadi
ng c
hann
el.
In g
ener
al,
the
BPS
K s
chem
e
shou
ld h
ave
the
leas
t prio
rity
com
pare
d to
the
othe
r map
ping
sch
emes
, whi
le
cons
ider
ing
spec
tral
effic
ienc
y, b
andw
idth
and
bit
rate
sup
port.
Bec
ause
, if
one
bit i
s tra
nsm
itted
per
sym
bol,
as w
ith B
PSK
, the
n th
e sy
mbo
l rat
e w
ould
be th
e sa
me
as th
e bi
t rat
e. If
two
bits
are
tran
smitt
ed p
er sy
mbo
l, as
in Q
PSK
,
then
the
sym
bol r
ate
wou
ld b
e ha
lf of
the
bit r
ate.
The
Cha
nnel
s pe
rfor
m in
the
follo
win
g or
der,
in te
rms
of th
e be
st (l
ess
SNR
req
uire
men
t) to
the
wor
st
(mor
e SN
R r
equi
rem
ent)
to m
aint
ain
the
requ
ired
BER
: AW
GN
, Ric
ian
and
Ray
leig
h.
4.2
AL
AM
OU
TI
ST
BC
SC
HE
ME
4.2.
1 Sp
ace
Tim
e M
ultiu
ser
CD
MA
Sys
tem
The
STB
C i
s an
eff
ectiv
e tra
nsm
it di
vers
ity t
echn
ique
, us
ed t
o
trans
mit
sym
bols
fro
m m
ultip
le a
nten
nas,
whi
ch e
nsur
es t
hat
trans
mis
sion
from
var
ious
ant
enna
s is
orth
ogon
al,
as h
as b
een
depi
cted
by
Taro
kh e
t al
(199
9) a
nd B
logh
& H
anzo
(20
02).
Wire
less
tra
nsm
issi
on w
ith a
hig
h da
ta
rate
, as
wel
l as
dive
rsity
and
cod
ing
gain
, is
quite
ach
ieva
ble
usin
g th
e ST
BC
,
whi
ch c
omba
ts f
adin
g in
wire
less
com
mun
icat
ions
. Th
e ST
BC
is
a hi
ghly
effic
ient
app
roac
h to
sig
nalin
g w
ithin
wire
less
com
mun
icat
ion,
that
take
s th
e
adva
ntag
e of
the
spat
ial d
imen
sion
by
trans
mitt
ing
a nu
mbe
r of d
ata
stre
ams,
usin
g m
ultip
le c
o-lo
cate
d an
tenn
as a
s ha
s be
en re
porte
d by
Gol
dsm
ith (2
001)
.
91
The
mai
n fe
atur
e of
the
STB
C i
s th
e pr
ovis
ion
of f
ull
dive
rsity
with
a v
ery
sim
ple,
yet
eff
ectiv
e en
codi
ng a
nd d
ecod
ing
mec
hani
sms.
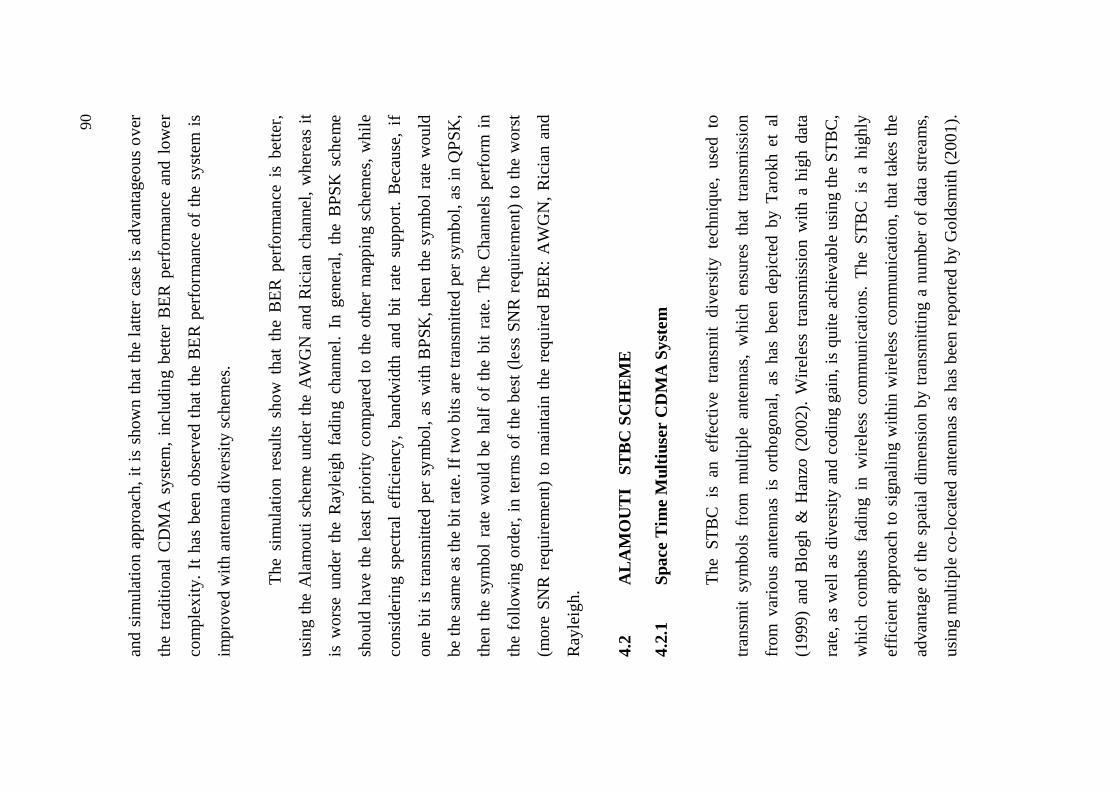
Her
e, S
ij is
the
mod
ulat
ed s
ymbo
l to
be tr
ansm
itted
fro
m a
nten
na j
in ti
me-
slot
i. T
here
sho
uld
be T
time-
slot
s, nT
num
ber
of tr
ansm
it an
tenn
as,
and
nR n
umbe
r ofr
ecei
ve a
nten
nas.
This
blo
ck is
usu
ally
con
side
red
to b
e of
leng
th T
. We
cons
ider
two
dive
rsity
sche
mes
for o
ur a
naly
ses:
1. S
chem
e-I:
two
trans
mit
ante
nnas
, one
rece
ive
ante
nna
2. S
chem
e-II
: tw
o tra
nsm
it an
tenn
as, t
wo
rece
ive
ante
nnas
4.2.
2 Sc
hem
e-I:
Tw
o tr
ansm
it an
tenn
as, o
ne r
ecei
ve a
nten
na
Fi
gure
4.1
show
s th
e ba
sic
two-
bran
ch t
rans
mit
Ala
mou
ti sc
hem
e,
with
onl
y on
e an
tenn
a at
the
rece
iver
. Thi
s pa
rticu
larly
sim
ple
and
prev
alen
t
sche
me,
with
tw
o tra
nsm
it an
tenn
as a
nd o
ne r
ecei
ve a
nten
na,
uses
sim
ple
codi
ng,
whi
ch i
s th
e on
ly S
TBC
tha
t ca
n ac
hiev
e its
ful
l di
vers
ity g
ain,
with
out
any
chan
ge
in
the
data
ra
te.
As
per
Ala
mou
ti’s
sche
me,
th
e
trans
mitt
er s
ends
out
dat
a in
gro
ups
of tw
o bi
ts. T
he s
chem
e m
ay b
e an
alyz
ed
by th
e fo
llow
ing
thre
e fu
nctio
ns, t
hat h
ave
been
illu
stra
ted
by F
ettw
eis
et a
l

92
Figure 4.1 Two-branch transmit Alamouti scheme
4.2.2.1 The Encoding and Transmission Sequence
At a given symbol period, two signals, transmitted from two
antennas, antenna zero and antenna one, are denoted by and
simultaneously. During the next symbol period, signal ( ) is transmitted
from antenna zero, and signal is transmitted from antenna one, where
stands for a complex conjugate operation. The encoding is done in space and
time (and hence, space-time coding). The assumption made for this scheme is
that, the channel state remains fairly constant over the transmission of two
consecutive symbols as has been reported by Alamouti (1999) & Antony et al
(2004). It can be clearly understood from Table 4.1.
1s0s
93
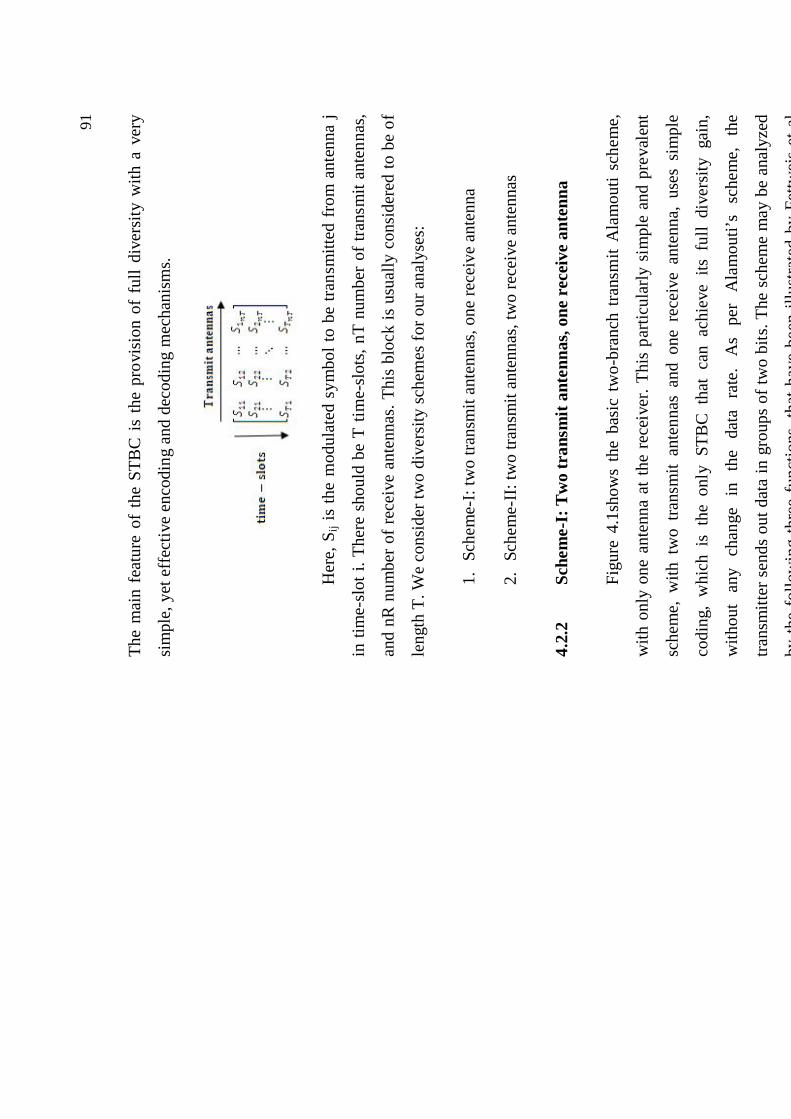
Table 4.1 Transmission sequence in two-branch transmit Alamouti
scheme
Antenna 0 Antenna 1
t s s
t+T - s* s *
Assuming that fading is constant across two consecutive symbols,
the channel at time t, may be modeled as
( ) ( + ) = (4.1)
( ) ( + ) = (4.2)
where, T is the symbol duration.
The received signals, and at time T and t + T respectively, can
be expressed as
= ( ) + (4.3)
= ( + ) + (4.4)
where, and are complex random variables representing the receiver
noise and interference.
4.2.2.2 The Combining Scheme
The combiner builds the following two combined signals that are
sent to the maximum likelihood detector

94
( + ) (4.5)
( + ) (4.6)
4.2.2.3 The Maximum Likelihood Decision Rule
The combined signals obtained above are sent to the ML detector,
in order to obtain the symbol decision. In the case of PSK or BPSK, the
detection rule can be expressed as follows: d2(s0, si ) d2(s0, sk ), where i k
=> choose symbol si . It is interesting to note that the signals at the output of
the combiner are equivalent to the signals obtained in the two-branch MRRC,
as depicted in Figure 4.1. That is the reason why it is affirmed, that the
Alamouti scheme with two-branch transmit diversity is equal to the two-
branch MRRC, in terms of the diversity order. A slight difference is that the
noise components are rotated; however, this fact does not affect the SNR.
4.2.3 Two-branch transmit with M receivers
Under some circumstances, when the air channel presents bad
characteristics, or when it is possible to implement more than one antenna at
the receiver, the use of a higher order of diversity could be interesting. The
order that we would get in a system with two-transmit antennas and N receive
antennas is 2N. In this section, a detailed view of the two-transmit and two
receive antennas is given, with the aim of simplicity, but the generalization
can easily be done in the case of using any number of antennas. Figure 4.2
shows the scheme in this particular case.
4.2.3.1 The Encoding and Transmission Sequence
The encoding and transmission sequence for this configuration is
identical to the case discussed in Section 4.1.2.1. The channel at time t can be
modeled by complex multiplicative distortions, ( ), ( ), ( ), ( ),

95
between transmit antenna zero and receive antenna zero, transmit antenna one
and receive antenna zero, transmit antenna zero and receive antenna one,
transmit antenna one and receive antenna one, respectively.
Table 4.2 shows the signal notation for each antenna in each
symbol time.
Table 4.2 Notation of received signals at the receive antennas
Antenna 0 Antenna 1
Receiving antenna 0 h0 h2
Receiving antenna 1 h1 h3
Figure 4.2 Two-branch transmit with two receive antennas scheme
96
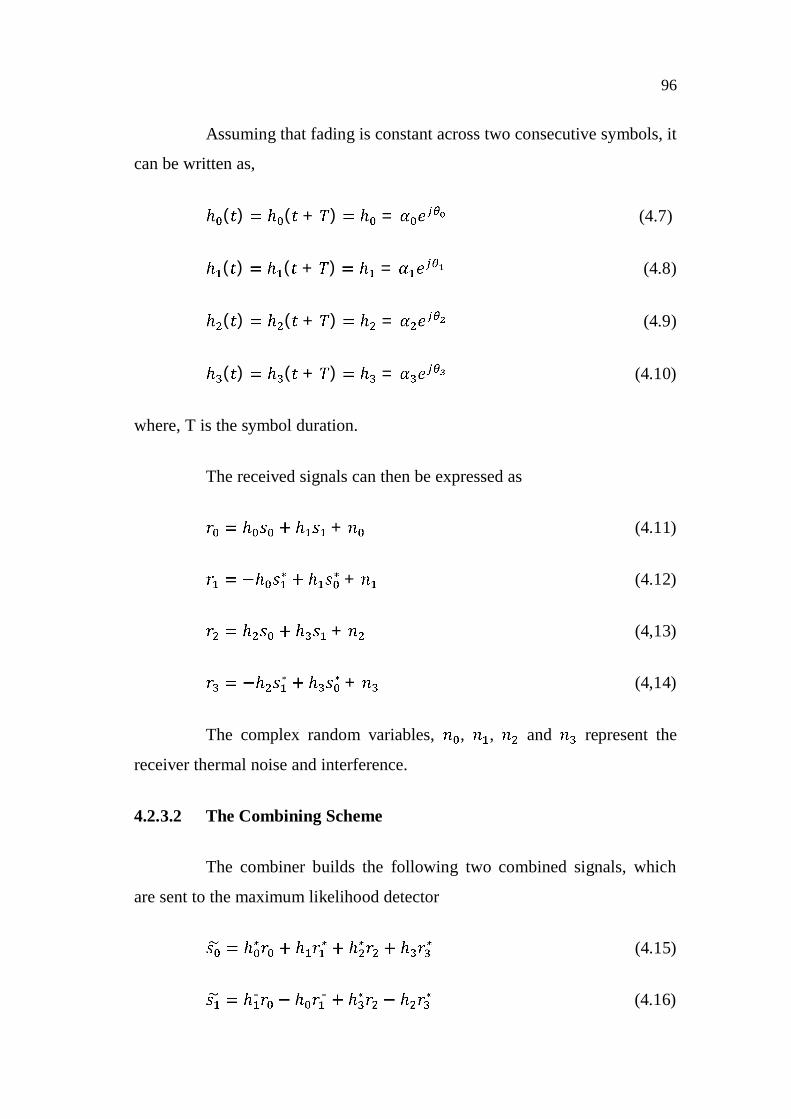
Assuming that fading is constant across two consecutive symbols, it
can be written as,
( ) ( + ) = (4.7)
( ) ( + ) = (4.8)
( ) ( + ) = (4.9)
( ) ( + ) = (4.10)
where, T is the symbol duration.
The received signals can then be expressed as
+ (4.11)
+ (4.12)
+ (4,13)
+ (4,14)
The complex random variables, , , and represent the
receiver thermal noise and interference.
4.2.3.2 The Combining Scheme
The combiner builds the following two combined signals, which
are sent to the maximum likelihood detector
(4.15)
(4.16)
97
The combined signals seen above are equal to those obtained using
a four-branch MRRC. Hence, the diversity order obtained with the two
schemes is the same. Another property is that the combined signals of the
receive antennas are simply the addition of the combined signals from each
receive antenna, so it is possible to implement a combiner for each antenna
and then simply sum the output of each combiner.
4.3 CHANNEL MODEL
The Channel is a physical medium between the transmitter and
receiver. This channel results in the random delay or random phase shift of
the original signal. The AWGN channel model has been explained in the last
chapter. The Rayleigh and Rician fading channels can be modeled as follows:
4.3.1 Fading in Communication Channels
In wireless communication systems, the radio frequency signal
propagates from the transmitter to the receiver via multiple different paths,
due to reflectors existing in the wireless channel and the obstacles. These
multipaths are caused by the mechanisms of diffraction, reflection and
scattering from structures, buildings and other obstacles existing in the
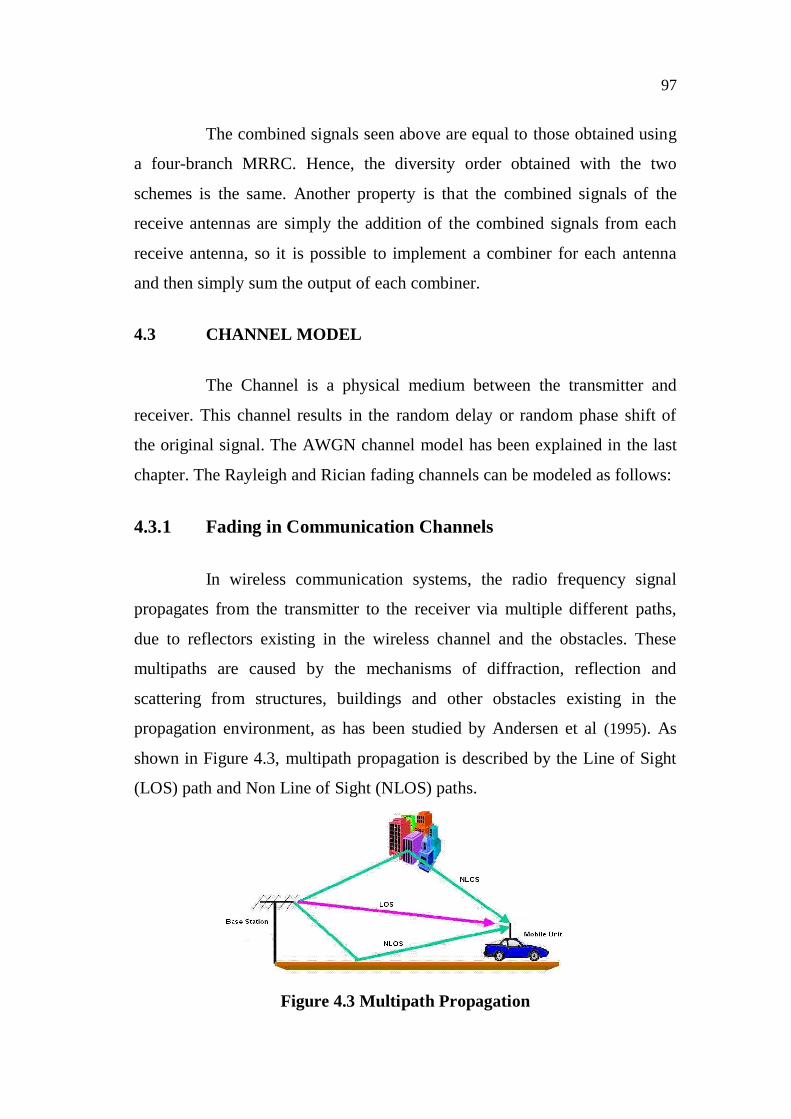
propagation environment, as has been studied by Andersen et al (1995). As
shown in Figure 4.3, multipath propagation is described by the Line of Sight
(LOS) path and Non Line of Sight (NLOS) paths.
Figure 4.3 Multipath Propagation
98
When the mobile unit is considered far from the base station, there
is no LOS signal path, and reception occurs mainly from the indirect signal
paths. These multiple paths have different propagation lengths, and thus will
cause time delay, amplitude and phase fluctuations in the received signal. And
hence, the multipath propagation effect can be mainly described in terms of
delay spread and fading, as reported by Sklar (1997).
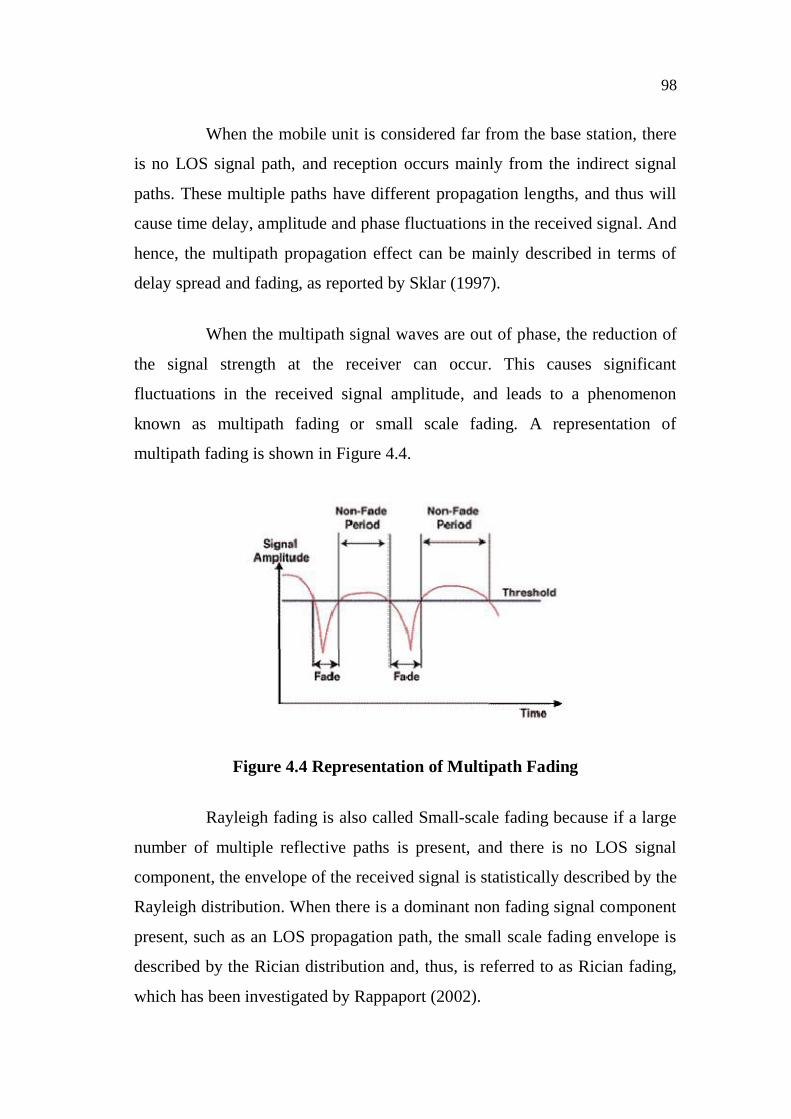
When the multipath signal waves are out of phase, the reduction of
the signal strength at the receiver can occur. This causes significant
fluctuations in the received signal amplitude, and leads to a phenomenon
known as multipath fading or small scale fading. A representation of
multipath fading is shown in Figure 4.4.
Figure 4.4 Representation of Multipath Fading
Rayleigh fading is also called Small-scale fading because if a large
number of multiple reflective paths is present, and there is no LOS signal
component, the envelope of the received signal is statistically described by the
Rayleigh distribution. When there is a dominant non fading signal component
present, such as an LOS propagation path, the small scale fading envelope is
described by the Rician distribution and, thus, is referred to as Rician fading,
which has been investigated by Rappaport (2002).
99
When the mobile unit is moving, there is a shift in the frequency of
the transmitted signal along each signal path, due to its velocity. This
phenomenon is known as the Doppler shift. Signals traveling through
different paths can have different Doppler shifts, corresponding to the
different rates of change in phase. The difference in the Doppler shifts
between different signal components contributing to a single fading signal
component, is known as the Doppler spread. Channels with a large Doppler
spread have signal components, that are each changing independently in
phase over time, as has been pointed out by Tse & Viswanath (2005). If the
Doppler spread is significant, relative to the bandwidth of the transmitted
signal, the received signal will undergo fast fading. On the other hand, if the
Doppler spread of the channel is much lesser than the bandwidth of the
baseband signal, the signal undergoes slow fading, as has been reported by
Shankar (2002). So, the terms slow and fast fading refer to the rate, at which
the magnitude and phase change imposed by the channel on the signal,
change. Because multiple reflections of the transmitted signal may arrive at
the receiver at different times, this can result in inter-symbol interference (ISI)
due to the crashing of bits into one another. This time dispersion of the
channel is called multipath delay spread, and is an important parameter to
assess the performance capabilities of wireless communication systems, as
has been stated by Manninen & Lempiainen (2002).
4.3.2 Modeling of Rayleigh Fading
As stated previously, Rayleigh fading results from the multiple Non
Line of Sight paths of the signal propagating from the transmitter to the
receiver. If the transmitted signal s(t) is assumed to be an unmodulated
carrier, then it can be written as:
( ) = cos (2 ) (4.17)

100
where, fc is the carrier frequency of the radio signal.
The received signal, after propagation over N scattered and
reflected paths, can be considered as the sum of N components with random
amplitude and phase for each component. Thus, when the receiving station is
assumed to be stationary, the received signal r(t) can be written as
( ) = cos (2 + ) (4.18)
where, ai is a random variable corresponding to the amplitude of the ith signal
component, and i is another uniformly distributed random variable,
corresponding to the phase angle of the ith signal component.
Using the trigonometric identity:
cos( + ) = cos .cos sin .sin (4.19)
equation (4.18) can be re-written in the form:
( ) = cos(2 ) . (2 ) . (4.20)
Equation (4.20) can be expressed as
r(t) =X.cos(2 ) -Y.sin(2 ) (4.21)
where,
= (4.22)
= (4.23)
X and Y can be considered as two identical and independent
Gaussian random variables when N tends to a large value. Equation (4.25)
represents the received Radio frequency signal, when the receiver is assumed
to be stationary. If the mobile unit is moving at a speed of v meters/second

101
relative to the base station, the received signal will acquire a frequency
Doppler shift. The maximum Doppler shift is given by
= (4.24)
The instantaneous frequency Doppler shift is dependent on
the angle of arrival of the incoming signal path component, as shown in
Figure 4.5.
Figure 4.5 A Mobile Unit Moving at Speed v
The instantaneous value of the Doppler shift fdi can be expressed as:
= (4.25)
where i is the angle of arrival for the ith path signal component.
On the other hand, the instantaneous frequency of the received RF
signal becomes:
= + cos (4.26)
Accordingly, the received signal can be expressed in the form:
( ) = cos (2 ( + ) + ) (4.27)
Equation (4.27) can alternatively be written in another form, using
the trigonometric identity (4.19):
102
( ) = cos (2 ). cos(2 + ) (2 ) . (2 + )
(4.28)
The received signal can also be formulated as:
( ) = cos(2 ) . ( ) sin(2 ) . ( ) (4.29)
where:
( ) = cos (2 + ) (4.30)
( ) = (2 + ) (4.31)
and = .
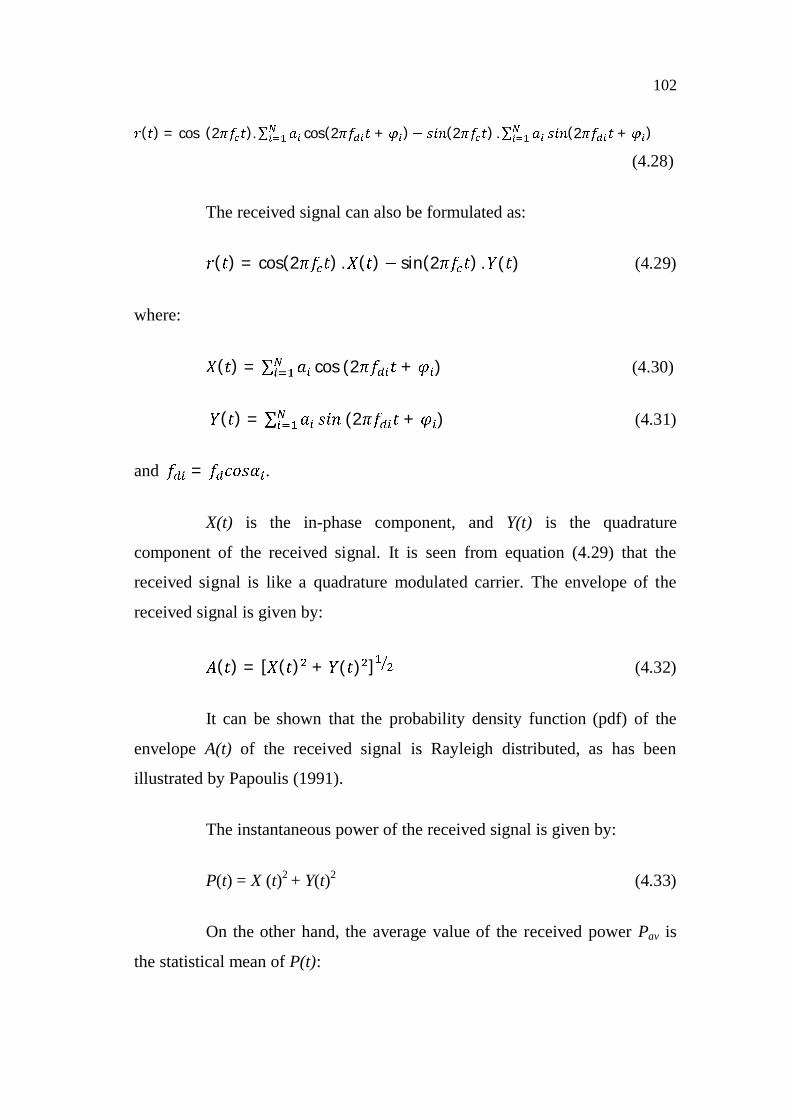
X(t) is the in-phase component, and Y(t) is the quadrature
component of the received signal. It is seen from equation (4.29) that the
received signal is like a quadrature modulated carrier. The envelope of the
received signal is given by:
( ) = [ ( ) + ( ) ] (4.32)
It can be shown that the probability density function (pdf) of the
envelope A(t) of the received signal is Rayleigh distributed, as has been
illustrated by Papoulis (1991).
The instantaneous power of the received signal is given by:
P(t) = X (t)2 + Y(t)2 (4.33)
On the other hand, the average value of the received power Pav is
the statistical mean of P(t):

103
Pav = mean[P(t)] = P(t) (4.34)
At the receiver side, the in-phase and quadrature components X(t)
and Y(t) can be obtained by demodulating the received signal r(t).
4.3.3 Modeling of Rician Fading
When the received signal consists of multiple reflective paths, plus
a significant LOS component, the received signal is said to be a Rician faded
signal, because the probability density function of the RF signal's envelope
follows Rician distribution, as has been illustrated by Couch (2001). The
received RF signal in this case can be written as:
( ) = . cos(2 ( + ) ) + cos(2 ( + ) + ) (4.35)
where KLOS -amplitude of the direct (LOS) component,
fd - frequency Doppler shift in the LOS path,
and fdi - frequency Doppler shift along the ith NLOS path signal component.
In terms of the in-phase and quadrature components, the received signal can be written as:
( ) = . cos(2 ( + ) ) + cos(2 ) . ( ) + sin(2 ) . ( ) (4.36)
where X(t) and Y(t) are the equations given by (4.30) and (4.31) respectively.
4.4 SYSTEM MODEL AND DESCRIPTION
Figure 4.6 presents the block diagram of the Alamouti STBC based
DS-CDMA communication system, with antenna diversity. The system model
can be explained as follows:
104
4.4.1 Transmitter Part
At the transmitter, the data generated from a random source,
consists of a series of ones and zeros. The Modulation process is used to
convert the data input bits into a symbol vector. The QPSK scheme is used to
map the bits to symbols. Then, these PSK symbols are the input to the STBC
encoder.
Modulation techniques are expected to have three positive
properties:
a. Good Bit Error Rate Performance
Modulation schemes should be able to achieve a low bit error rate
in the presence of fading, Doppler spread, interference and thermal noise.
b. Power Efficiency
Power limitation is one of the crucial design challenges in portable
and mobile applications. Power efficiency can be increased by using Non-
linear amplifiers. However, non-linearity may degrade the BER performance
of some modulation techniques. Constant envelope modulation techniques are
used to prevent the regeneration of the spectral side lobes during nonlinear
amplification
c. Spectral Efficiency
The power spectral density of the modulated signals should have a
narrow main lobe and fast roll-off of the side lobes. Spectral efficiency is
measured in units of bits/sec/Hz. The Walsh Hadamard codes are used for
spreading and despreading the modulated sequence. The spreading factors of
4,8 and 16 are used for spreading.

105
Figure 4.6 Block Diagram for the simulated Alamouti STBC based
CDMA system
The application of the STBC in the DS-CDMA multi-user
communication system is considered, and presented the simulation results for
the performance of DS-CDMA channels with STBC.
Figure 4.6 shows the transmitter and receiver models with two
transmit antennas at the base station and one receive antenna at the remote
unit, and two transmit antenna and two receive antennas at the receiver. In our
simulations, the output of each STBC was spread by the Walsh Hadamard
code of length 64. The spread signals from different users for the same
transmit antenna were summed up, before they were transmitted from
antennas 1 and 2 at the base station, respectively. A matched filter is used to
decorrelate the received signal. The output of the matched filter is fed to the
STBC decoder.
106
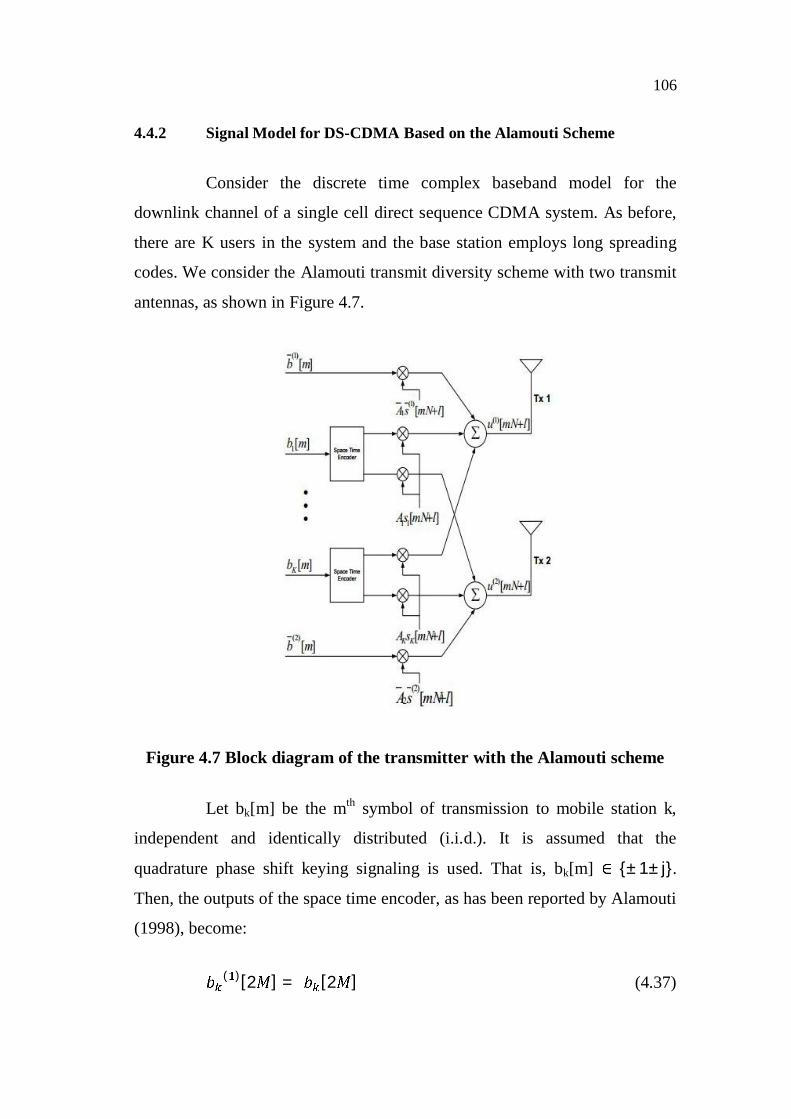
4.4.2 Signal Model for DS-CDMA Based on the Alamouti Scheme
Consider the discrete time complex baseband model for the
downlink channel of a single cell direct sequence CDMA system. As before,
there are K users in the system and the base station employs long spreading
codes. We consider the Alamouti transmit diversity scheme with two transmit
antennas, as shown in Figure 4.7.
Figure 4.7 Block diagram of the transmitter with the Alamouti scheme
Let bk[m] be the mth symbol of transmission to mobile station k,
independent and identically distributed (i.i.d.). It is assumed that the
quadrature phase shift keying signaling is used. That is, bk[m] {±1±j}.
Then, the outputs of the space time encoder, as has been reported by Alamouti
(1998), become:
( )[2 ] = [2 ] (4.37)

107
( )[2 + 1] = [2 + 1] (4.38)
( )[2 ] = [2 + 1] (4.39)
( )[2 + 1] = [2 + 1] (4.40)
where ( )[ ] is the data symbol from the transmit antenna i to the kth user.
From the Figure 4.7, it is observed that the same user spreading
sequence is used for the data symbol ( )[ ]. That is,
[ + ] = ( )[ + ] i=1, 2 (4.41)
[ + ] is the kth user long spreading sequence.
It is also assumed that the long spreading sequence is normalized
as | [ + ]| = .
For coherent combining and channel estimation at the receiver, two
different orthogonal pilot spreading sequences ( ( )[ ], = 1,2), with
different pilot symbols ( )[ ], = 1,2) can be transmitted through two
transmit antennas.
Assume that the complex channel attenuations associated with each
pair of transmit and receive antennas are time-invariant. Then, the received
signal at the jth receive antenna can be written as:
( )[ + ] = [ ] ( )[ + ] + ( )[ + ] (4.42)
where,
( )[ + ] = ( ) [ + ] + ( )[ + ]

108
( )[ + ] = ( )[ ] [ + ]
( )[ + ] = ( )[ ] ( )[ + ]
In the vector notation, J ×1 received signal vector can be written as:
[ ] = ( )[ ] + [ ] (4.43)
where the channel matrix Hi, the received signal vector r[n], the transmitted
signal vector u(i)[n], and the noise vector n[n] are given by
= , = 12, … … , (4.44)
where,
= ( [0] [1] … … . [ 1])
Furthermore,
[ ] = ( ( )[ ] … … ( )[ ] ) (4.45)
( )[ ] = ( ( )[ ] … … . ( )[ + 1])
[ ] = ( ( )[ ] … . ( )[ ])
where, ( )[ ] is the received signal at receive antenna J, and ( )[ ] is the
baseband transmission signal from transmit antenna i.
4.5 RESULTS AND DISCUSSION
The aim of this chapter is to review the performance of the DS-
CDMA system, using two different diversity schemes. For this, some
assumptions are made. The first assumption is that the total power transmitted
109
by the two antennas in the Alamouti scheme, is equal to the power that the
unique antenna in the MRRC scheme would transmit. Another assumption is
that fading along all the paths between the transmit and receive antennas is
mutually uncorrelated, and follows a Rayleigh distribution. Moreover, it is
supposed that the average power received in every single receive antenna is
the same, and that the receiver has a perfect knowledge of the channel.
4.5.1 Performance of Alamouti STBC (2 Tx & 1 Rx) based DS-
CDMA system over Rayleigh channel
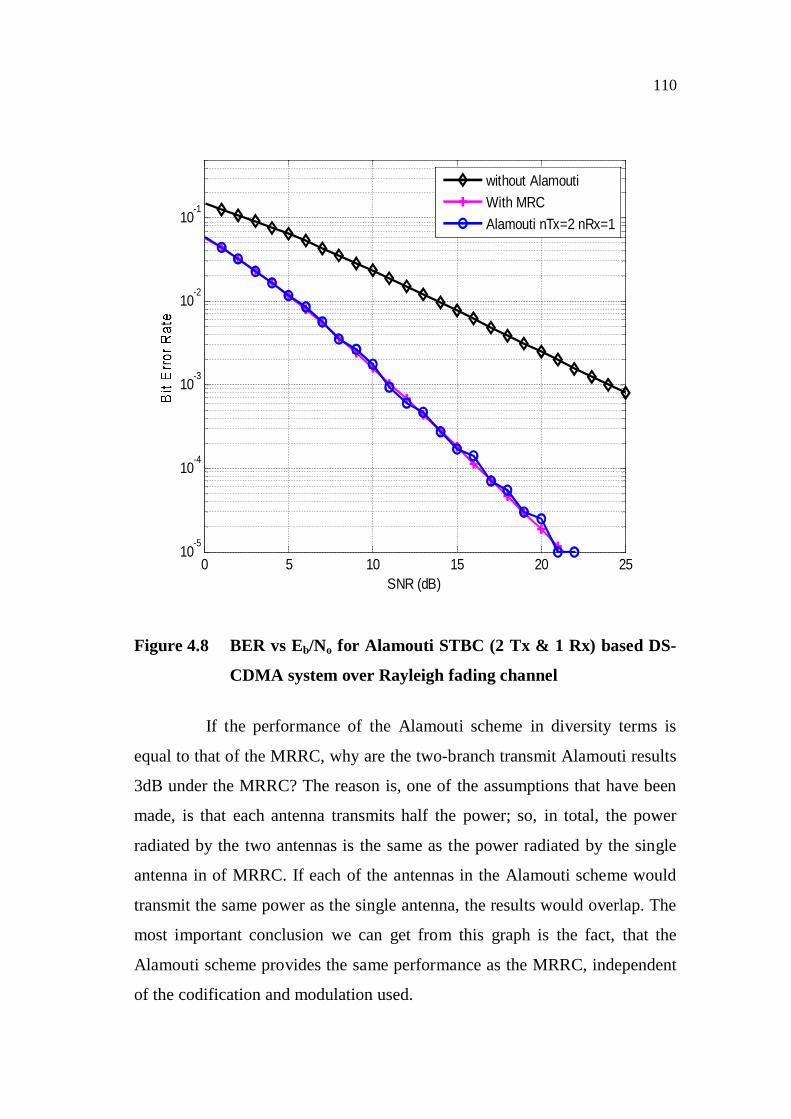
Figure 4.8 shows the BER performance for the coded DS-CDMA
system using Alamouti’s STBC technique (nTx=2 & nRx=1) in the Rayleigh
fading condition. It is assumed that the receiver has a perfect knowledge of
the channel condition. It is clear that Alamouti’s STBC technique using two
transmitting antennas and one receiving antenna for the CDMA system, is the
same as that of the system which uses the Maximum ratio Combiner, using
two transmitting antennas and one receiving antenna. And both the schemes
are better than the typical DS-CDMA system.
It is also observed that transmit diversity has a 13 dB advantage at
BER of 10-3, when compared to the system without transmit diversity. If the
transmitted and received power for these two cases is the same, then the
performance would be identical. At a BER of 0.01, there is a 9 dB
improvement in the SNR obtained, as compared to that without Alamouti
diversity.
110
Figure 4.8 BER vs Eb/No for Alamouti STBC (2 Tx & 1 Rx) based DS-
CDMA system over Rayleigh fading channel
If the performance of the Alamouti scheme in diversity terms is
equal to that of the MRRC, why are the two-branch transmit Alamouti results
3dB under the MRRC? The reason is, one of the assumptions that have been
made, is that each antenna transmits half the power; so, in total, the power
radiated by the two antennas is the same as the power radiated by the single
antenna in of MRRC. If each of the antennas in the Alamouti scheme would
transmit the same power as the single antenna, the results would overlap. The
most important conclusion we can get from this graph is the fact, that the
Alamouti scheme provides the same performance as the MRRC, independent
of the codification and modulation used.
0 5 10 15 20 2510
-5
10-4
10-3
10-2
10-1
SNR (dB)
without AlamoutiWith MRCAlamouti nTx=2 nRx=1

111
4.5.2 Performance of Alamouti STBC (2 Tx & 1 Rx) based DS-
CDMA system over Rician fading channel
Figure 4.9 presents a comparison of the performance of the typical
DS- CDMA system, the system using Maximal Ratio Combiner technique
and the CDMA system implementing Alamouti’s STBC technique.
Figure 4.9 BER vs Eb/No for Alamouti STBC (2 Tx & 1 Rx) based DS-
CDMA system over Rician channel
When Alamouti’s STBC technique is used for the CDMA system,
in the Rician fading channel, the performance drastically improves by around
8 dB at BER of 10-5 due to the presence of LOS component (direct path). This
0 5 10 15 20 2510-5
10-4
10-3
10-2
10-1
SNR (dB)
without AlamoutiWith MRCAlamouti nTx=2 nRx=1
112
means, that it will require less power to transmit for same BER for CDMA
system using Alamouti’s STBC technique. It can be explained alternatively,
that transmitting signals at the same power will give a better BER for the
CDMA system with Alamouti’s STBC technique, than for the typical CDMA
system. It is evident that Eb/N0 is decreased for the CDMA system, when
Alamouti’s scheme is used. The capacity of any system is inversely
proportional to Eb/N0, which indicates that the capacity increases while using
Alamouti’s scheme.
4.5.3 Performance of Alamouti STBC (2 Tx & 2 Rx) based DS-
CDMA system over Rayleigh fading channel
Figure 4.10 shows the BER performance for the coded DS-CDMA
system, using Alamouti’s STBC technique (nTx=2 & nRx=2) in Rayleigh
fading condition. Here, the BER plots are shown for both systems, with and
without the antenna diversity scheme. The BER of 10-3 is obtained for 3dB,
while considering Alamouti’s STBC technique (nTx=2 & nRx=2), whereas
the same BER is obtained for 11 dB with the MRC technique. And hence, an
8 dB improvement in SNR is obtained. While comparing it without the
Alamouti technique, a 21 dB SNR improvement is obtained, because at 24
dB, the BER of 10-3 is obtained.
The BER performance of the simulation result without the diversity
scheme is worse than that with the diversity scheme, and the BER
performance is improved dramatically in low SNR, but not in high SNR. In
low SNR, white Gaussian noise dominates the BER, which can be improved
by enhancing the SNR; but in high SNR, the error due to phase estimation
dominates the BER, which cannot be improved by simply enhancing the
SNR.

113
Figure 4.10 BER vs Eb/No for Alamouti STBC (2 Tx & 2 Rx) based DS-
CDMA system over Rayleigh fading channel
4.5.4 Performance of Alamouti STBC (2 Tx & 2 Rx) based DS-
CDMA system over Rician fading channel
Figure 4.11 shows the simulated performance of the Alamouti
STBC technique (nTx=2 & nRx=2) in Rician fading channel. It shows the
performance from 0 dB to 25 dB where upto105 bits are transmitted. The BER
of 10-3 is obtained for 2.5 dB, while considering Alamouti’s STBC technique
(nTx=2 & nRx=2), whereas the same BER is obtained for 11 dB with the
MRC technique. And hence, 8.5 dB improvement in SNR is obtained. While
comparing it without the Alamouti technique, 21.5 dB SNR improvement is
obtained, because at 24 dB, the BER of 10-3 is obtained.
0 5 10 15 20 2510-5
10-4
10-3
10-2
10-1
SNR (dB)
without AlamoutiWith MRCAlamouti nTx=2 nRx=2

114
Figure 4.11 BER vs Eb/No for Alamouti STBC (2 Tx & 2 Rx) based DS-
CDMA system over Rician fading channel
Table 4.3 shows that, in the presence of Rayleigh fading channel,
the BER of 0.0016 is achieved for the SNR value of 10 dB, using the
Alamouti STBC (nTx=2 & nRx=1) encoding, whereas the BER of 0.0014 is
achieved for the SNR value of 6 dB, using the same encoding technique in the
presence of AWGN and Rician channel. Thus, a lower BER is obtained when
Alamouti encoding is used.
0 5 10 15 20 2510
-5
10-4
10-3
10-2
10-1
SNR (dB)
without AlamoutiWith MRCAlamouti nTx=2 nRx=2

115
Table 4.3 BER values of STBC DS-CDMA system for the above two
schemes upto SNR values of 10 dB
SNR(dB)
nTx=2 & nRx=1 nTx=2 & nRx=2
Rayleigh fading
channel
Rician fading
channel
Rayleigh fading
channel
Rician fading
channel
0 0.0581 0.0352 0.0055 0.0043
1 0.0440 0.0235 0.0033 0.0024
2 0.0328 0.0145 0.0018 0.0013
3 0.0239 0.0086 0.0010 0.0007
4 0.0169 0.0049 0.0005 0.0004
5 0.0118 0.0027 0.0003 0.0002
6 0.0081 0.0014 0.0001 0.00009
7 0.0055 0.0007 0.00008 0.00007
8 0.0037 0.0004 0.00006 0.00005
9 0.0025 0.0002 0.000032 0.00002
10 0.0016 0.0001 0.000014 0.0000098
Also from Table 4.3, in the presence of Rayleigh fading channel,
the BER of 0.0003 is achieved for the SNR value of 5 dB using Alamouti’s
STBC (nTx=2 & nRx=2) technique, whereas for the SNR of 4 dB in the
presence of Rician fading channel, the BER value is .0004.
In the presence of Rayleigh channel, the BER of 0.001 is achieved for the
SNR value of 3 dB using Alamouti’s STBC, whereas for the SNR of 2 dB in
the presence of Rician channel, the BER value is .0013. Hence 1 dB
improvement in the SNR is obtained when compared to the Rayleigh channel
due to the presence of line of sight component in Rician fading channel.

116
4.5.5 Performance comparison of extended Alamouti STBC based
DS-CDMA system over Rician fading channel
Figure 4.12 shows the BER performance for the coded DS-CDMA
system, using multiple antennas of Alamouti’s STBC technique in AWGN
and Rician fading condition. Here, the BER plots are shown for three different
cases, with various number of receiving antenna diversity. The BER of 10-4 is
obtained for 6 dB, while considering Alamouti’s STBC technique (nTx=2 &
nRx=2), whereas the same BER is obtained for 2 dB and 1 dB for (nTx=2 &
nRx=4) and (nTx=2 & nRx=6) respectively. And hence, 4 dB to 5 dB
improvement in SNR is obtained. While comparing it without the Alamouti
technique, 18 dB SNR improvements is obtained, because at 24 dB, the BER
of 10-3 is obtained.
Figure 4.12 BER vs Eb/No comparison of extended Alamouti STBC
based DS-CDMA system over AWGN and Rician channel
0 1 2 3 4 5 6 7 8 9 1010-6
10-5
10-4
10-3
10-2
SNR(dB)
Alamouti based DS-CDMA nTx=2 nRx=2Alamouti based DS-CDMA nTx=2 nRx=4Alamouti based DS-CDMA nTx=2 nRx=6
117
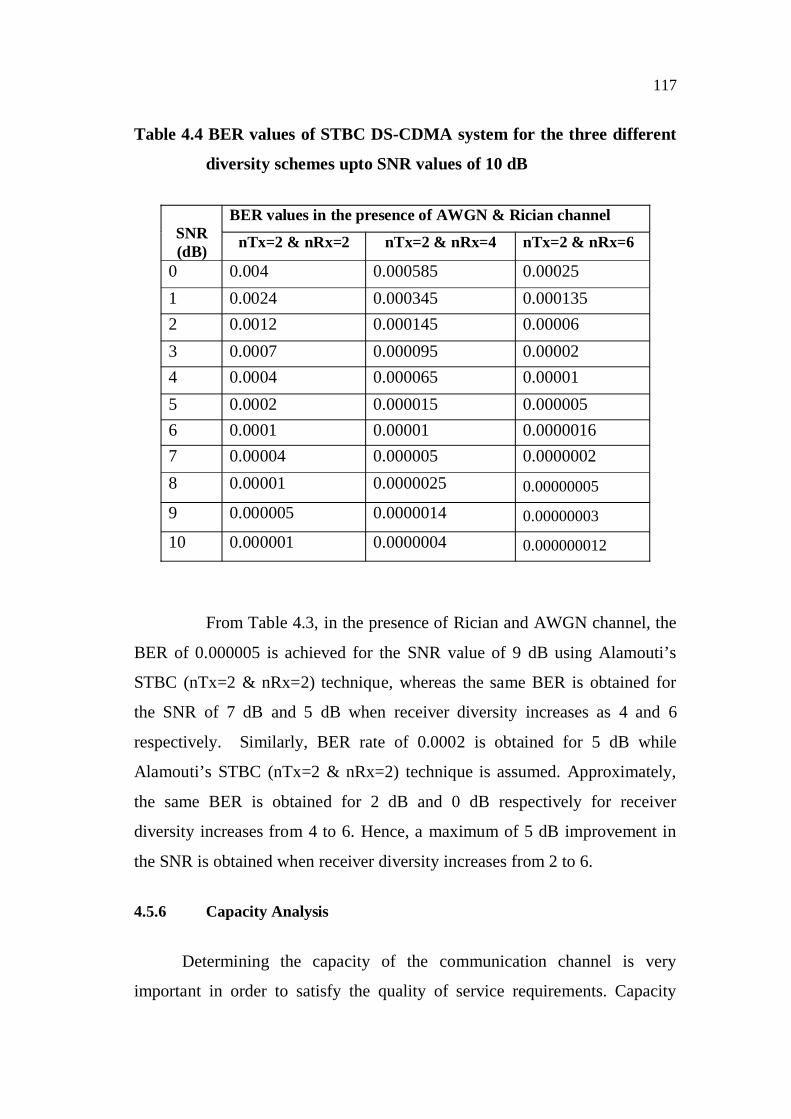
Table 4.4 BER values of STBC DS-CDMA system for the three different
diversity schemes upto SNR values of 10 dB
SNR(dB)
BER values in the presence of AWGN & Rician channel
nTx=2 & nRx=2 nTx=2 & nRx=4 nTx=2 & nRx=6
0 0.004 0.000585 0.000251 0.0024 0.000345 0.0001352 0.0012 0.000145 0.000063 0.0007 0.000095 0.000024 0.0004 0.000065 0.000015 0.0002 0.000015 0.0000056 0.0001 0.00001 0.00000167 0.00004 0.000005 0.00000028 0.00001 0.0000025 0.00000005
9 0.000005 0.0000014 0.00000003
10 0.000001 0.0000004 0.000000012
From Table 4.3, in the presence of Rician and AWGN channel, the
BER of 0.000005 is achieved for the SNR value of 9 dB using Alamouti’s
STBC (nTx=2 & nRx=2) technique, whereas the same BER is obtained for
the SNR of 7 dB and 5 dB when receiver diversity increases as 4 and 6
respectively. Similarly, BER rate of 0.0002 is obtained for 5 dB while
Alamouti’s STBC (nTx=2 & nRx=2) technique is assumed. Approximately,
the same BER is obtained for 2 dB and 0 dB respectively for receiver
diversity increases from 4 to 6. Hence, a maximum of 5 dB improvement in
the SNR is obtained when receiver diversity increases from 2 to 6.
4.5.6 Capacity Analysis
Determining the capacity of the communication channel is very
important in order to satisfy the quality of service requirements. Capacity

118
determines the maximum limit of data that can be transmitted over the
channel. ‘‘Shannon defined capacity as the mutual information maximized
over all possible input distributions’’.
The main theoretical aspect of MIMO is one of channel capacity. The
Shanon’s capacity theorem for a simple RF channel is:
= (1 + ) (4.46)
where C= capacity (bits/s), B=bandwidth (Hz), N= signal to noise ratio.
The above capacity equation is widely used and refers to a system with
one transmitter and one receiver (with possibly added diversity, but ultimately
combined into one receiver); now we consider a system of N × M
antennas: N transmitters, and M receivers.
The H-matrix is a matrix [Hij] defines complex throughput correlation
parameters (with amplitude and phase) from each transmit antenna i to each
receive antenna j. The new capacity equation for MIMO systems is
= 1 + ( ) (4.47)
where n is the number of independent transmit/receive channels (which
is no greater than min(N,M)), and reflects the number of sufficiently
uncorrelated paths, Si are the signal power in channel i, N- the noise power,
and i2(H) are singular values of the H matrix.

119
Figure 4.13 MIMO capacity: capacity curves versus average SNR at receiver;
M = MR=MT
Figure 4.13 shows the performance of the MIMO system in which
SNR and Capacity are considered. In the above figure four different numbers
of receiving antennas are considered. Figure 4.13 shows that as the SNR
increases the capacity also increase, so at 20 dB SNR the capacity for nTx=
nRx = 6 is 35 bits/s/Hz. Figure 4.13 implies that the Shannon channel
capacity for the higher SNR is higher than the case of low values of SNR,
which means that the system operating in higher SNR has more ability to
admit new users without any disconnection in the service for the old users.
The channel capacity difference between the five cases becomes larger after a
12 dB SNR, the Figure 4.13 also shows that at a lower SNR values the five
curves is relatively close to each other.
When the Alamouti based CDMA system is compared with the work
reported by Ahlen (2002), 4G IP based wireless systems, the spectral
2 4 6 8 10 12 14 16 18 200
5
10
15
20
25
30
35
SNR(dB)
MIMO Capacity
Shannon CapacityMIMO, nTx=nRx=2MIMO, nTx=nRx=4MIMO, nTx=nRx=5MIMO, nTx=nRx=6

120
efficiency difference for single user is 4.8 bps/Hz is obtained. So as the
number of user increases, the spectral efficiency also increases
correspondingly. And also when compared with the capacity of wireless
system, there is a gradual increase in spectral efficiency at each and every
points of SNR value.
4.6 CONCLUSION
In this chapter, the STBC DS-CDMA system has been
implemented and analyzed. Using the analytical and simulation approach, it
has been shown that using the STBC in the DS-CDMA system is
advantageous over the traditional CDMA system, including a better BER
performance and lower complexity. Both the schemes in AWGN channel,
Rayleigh Fading channel and Rician Fading channel have been analyzed. The
Alamouti scheme has been used as the antennal diversity. It has been
observed that the BER performance of the system is improved with antenna
diversity schemes.
The simulation results show that the BER performance is better,
using the Alamouti scheme under the Rician fading channel, whereas it is
worse under Rayleigh fading channel. The channels perform in the following
order, in terms of the best (less SNR requirement) to the worst (more SNR
requirement) to maintain the required BER: AWGN, Rician and Rayleigh.
The main conclusions of this chapter are as follows:
1. With two transmit antennas and one receive antenna, the Alamouti technique is comparable to the MRRC, with two receive antennas and one transmit antenna, in terms of diversity.

121
2. Using the receive diversity results in larger performance gain than using additional transmit antennas.
3. When there is a strong line-of-sight component available, signal fading is negligible and space-time coding will not provide any performance gain.
4. A 3 dB of disadvantage from the BER performance in comparison with the MRRC, is obtained. That is because each antenna transmits half the power in order to maintain the total radiated power.
5. Generalisation can be done by adding more receive antennas. In this case, the diversity order reaches up to 2N.
6. Low computation complexity, similar to MRRC.
7. Soft fail advantages, and multiple transmission branches assure communication, when one of them is disrupted.


![A Novel Differential Modulation Scheme Using Full-Rate ...was derived from STBC Alamouti [5]. In [3], Ganesan . et al. also proposed a DM technique for 4×4 MIMO. This proposed technique](https://img.dokumen.tips/doc/110x75/5ff87b1a5b15b56e940e9eb1/a-novel-differential-modulation-scheme-using-full-rate-was-derived-from-stbc.jpg)