Embed Size (px)
Citation preview
Chapter 4 Notes
Graphing Linear Equations and Functions
4.1 Coordinates and Scatter Plots
Objectives:-Plot points in a coordinate plane-Draw scatter plots and make predictions about the data
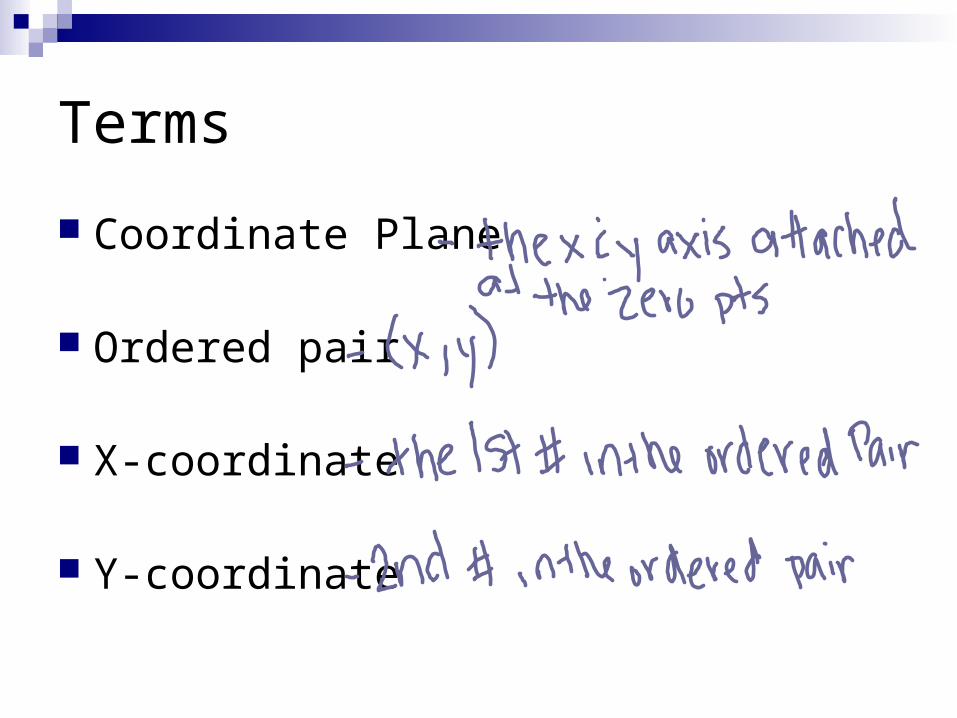
Terms
Coordinate Plane
Ordered pair
X-coordinate
Y-coordinate
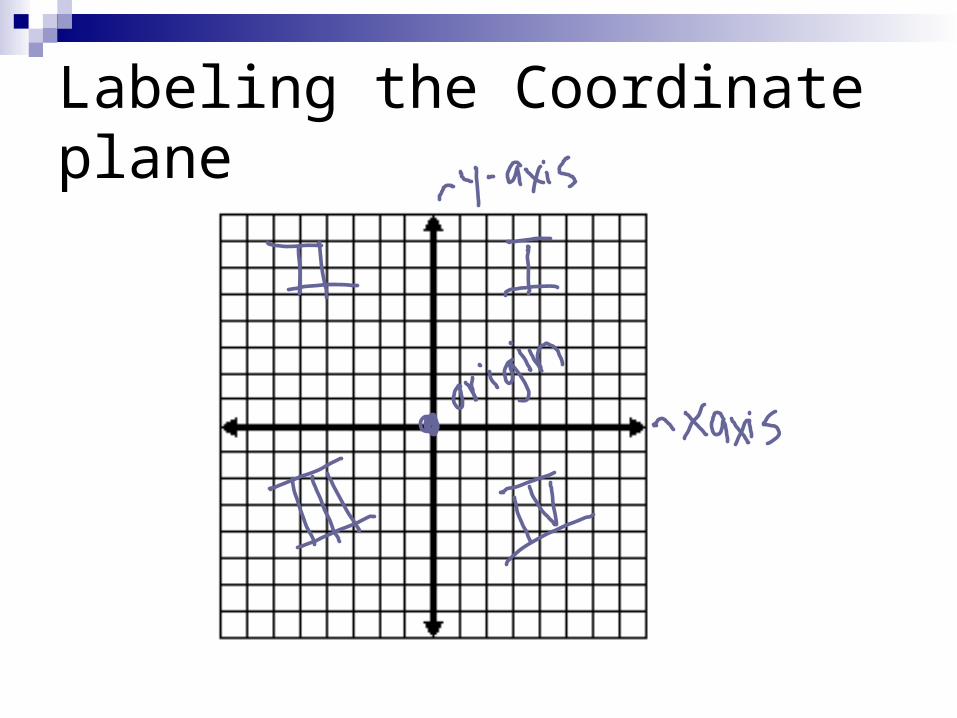
Labeling the Coordinate plane
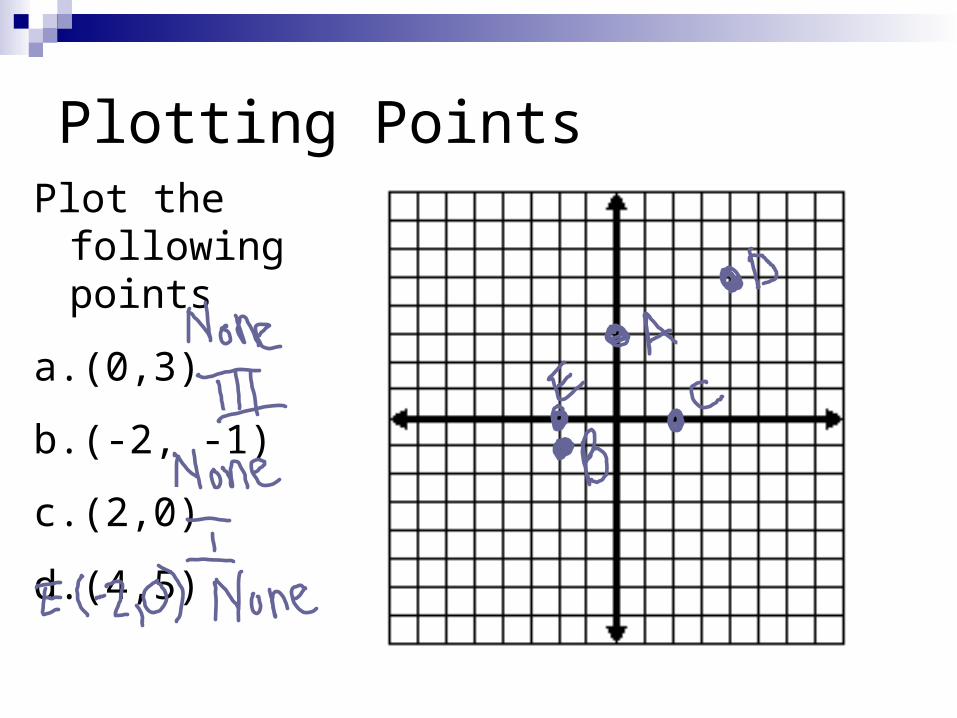
Plotting PointsPlot the following
points
a.(0,3)
b.(-2, -1)
c. (2,0)
d.(4,5)
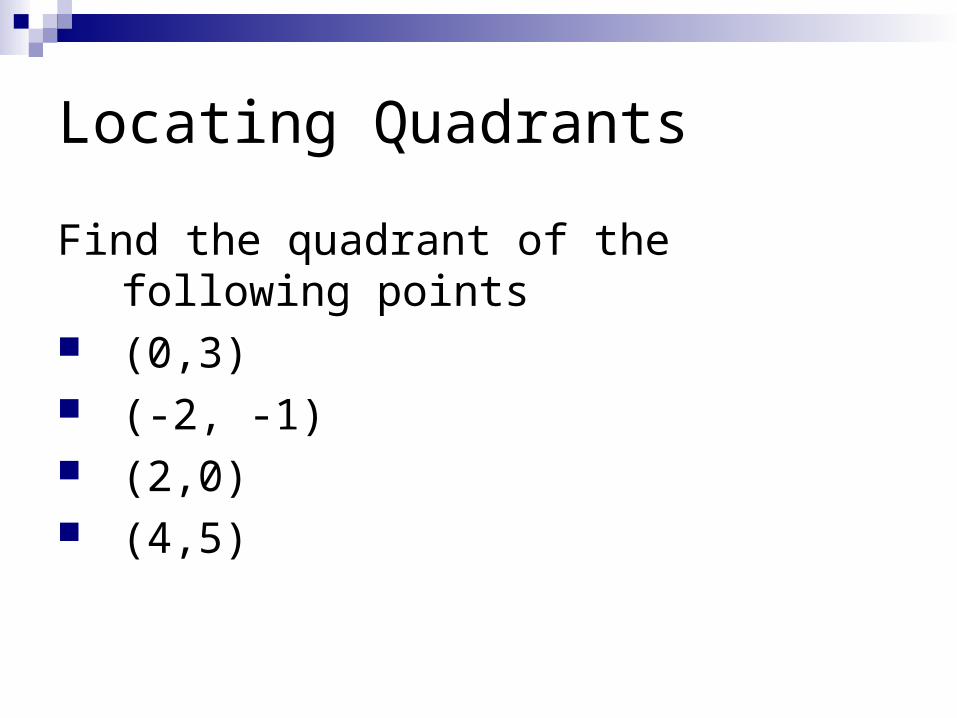
Locating Quadrants
Find the quadrant of the following points (0,3) (-2, -1) (2,0) (4,5)
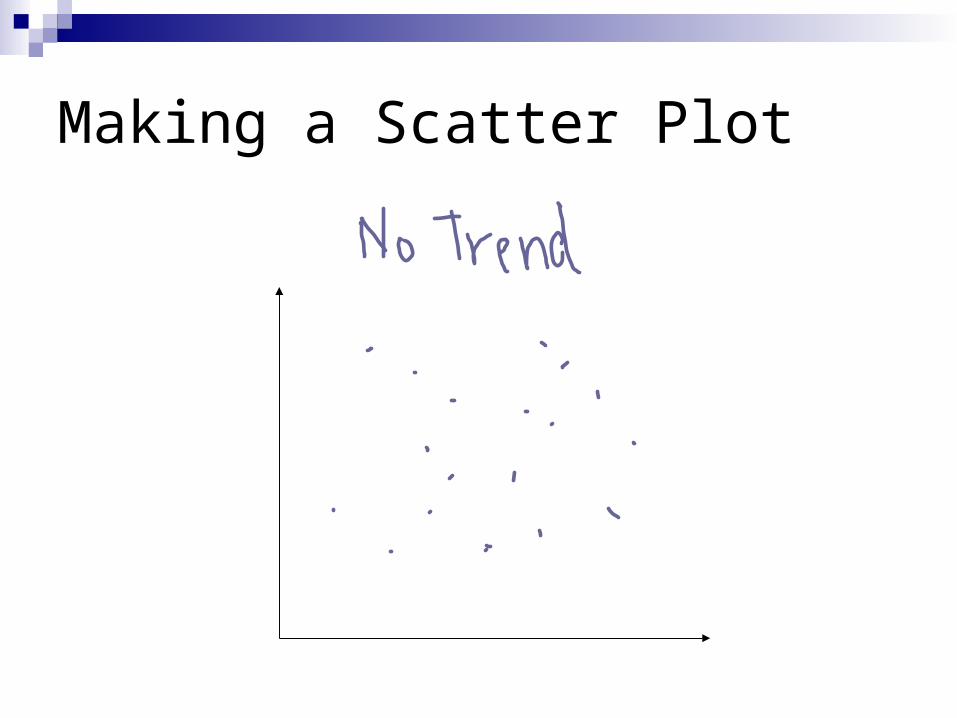
Making a Scatter Plot
4.2 Graphing Linear Equations Part1
Objectives:
-Make a list of values for a given equation
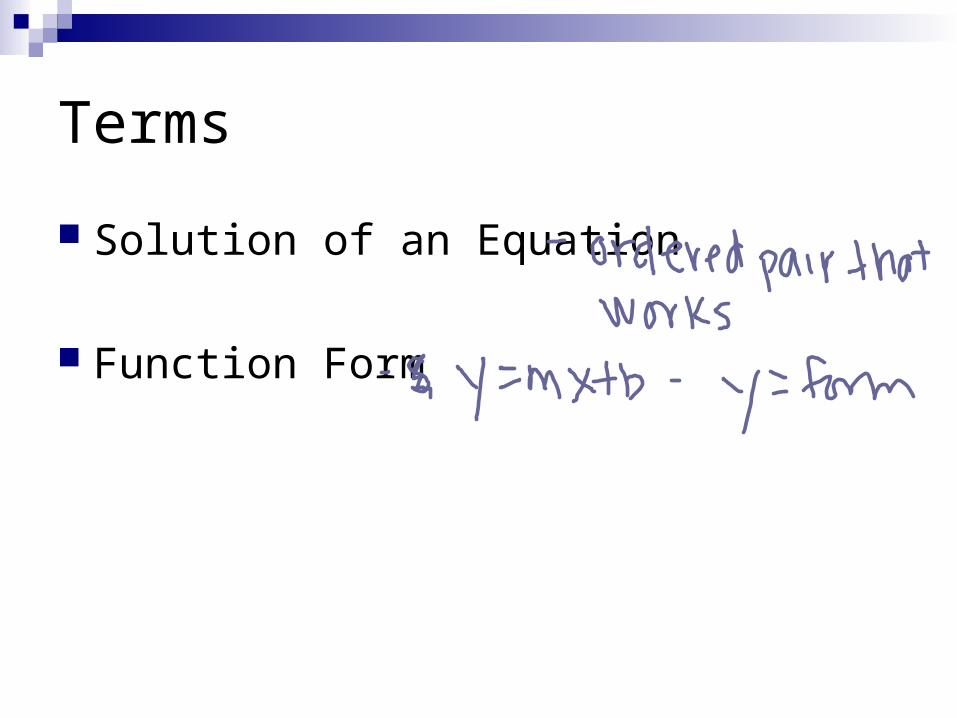
Terms
Solution of an Equation
Function Form

Function Form
Rewrite the equations in function form (y=mx+b)
-3x + y = 12
2x + 3y = 6
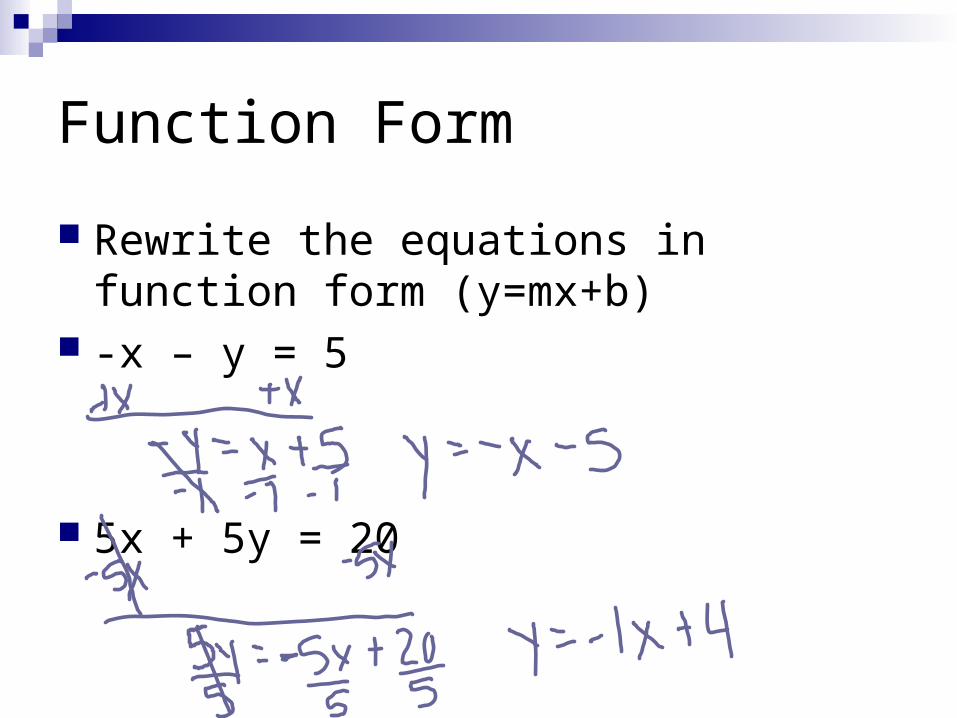
Function Form
Rewrite the equations in function form (y=mx+b)
-x – y = 5
5x + 5y = 20
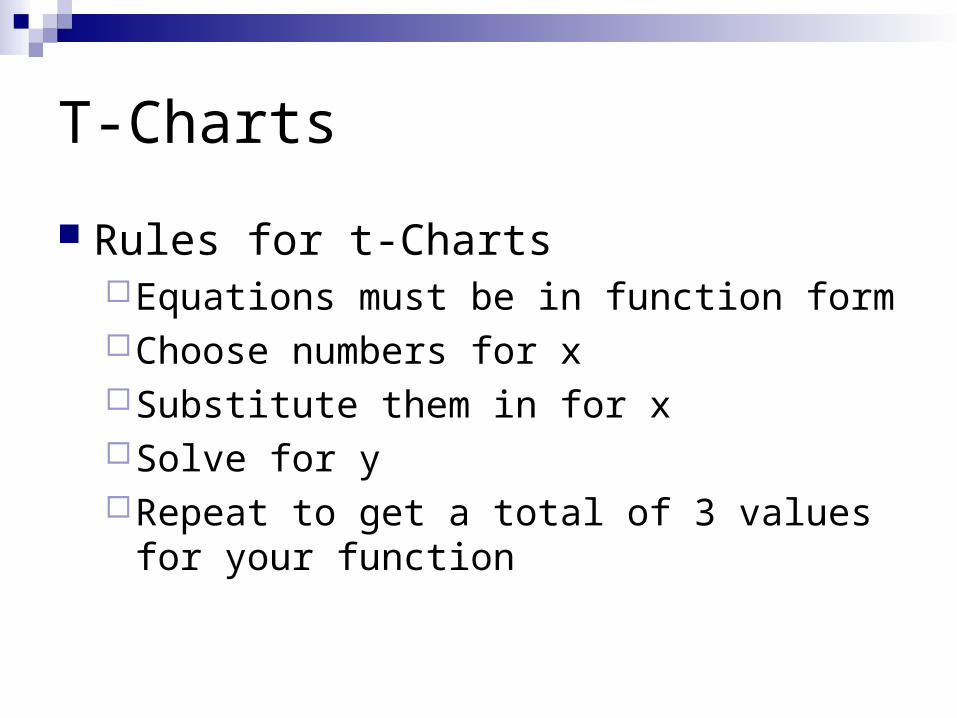
T-Charts
Rules for t-ChartsEquations must be in function formChoose numbers for xSubstitute them in for xSolve for yRepeat to get a total of 3 values for your
function

T-Charts
Make a table of values(T-Chart) for each function
Y = -2x – 6 y = 3(6x – 1)
X Y YX
T-Charts
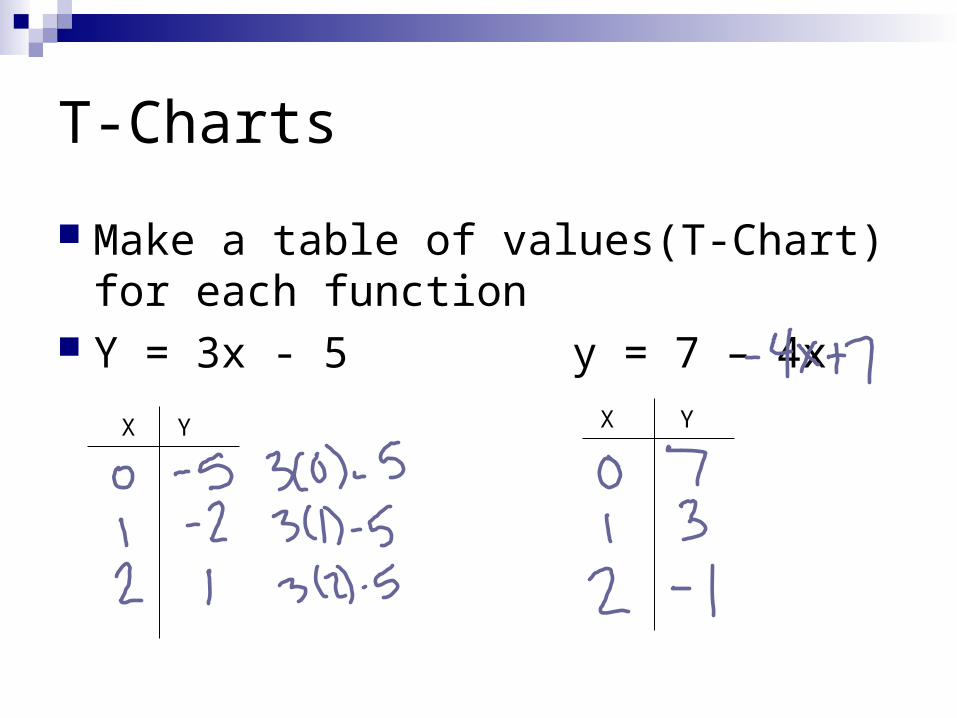
Make a table of values(T-Chart) for each function
Y = 3x - 5 y = 7 – 4x
X Y YX
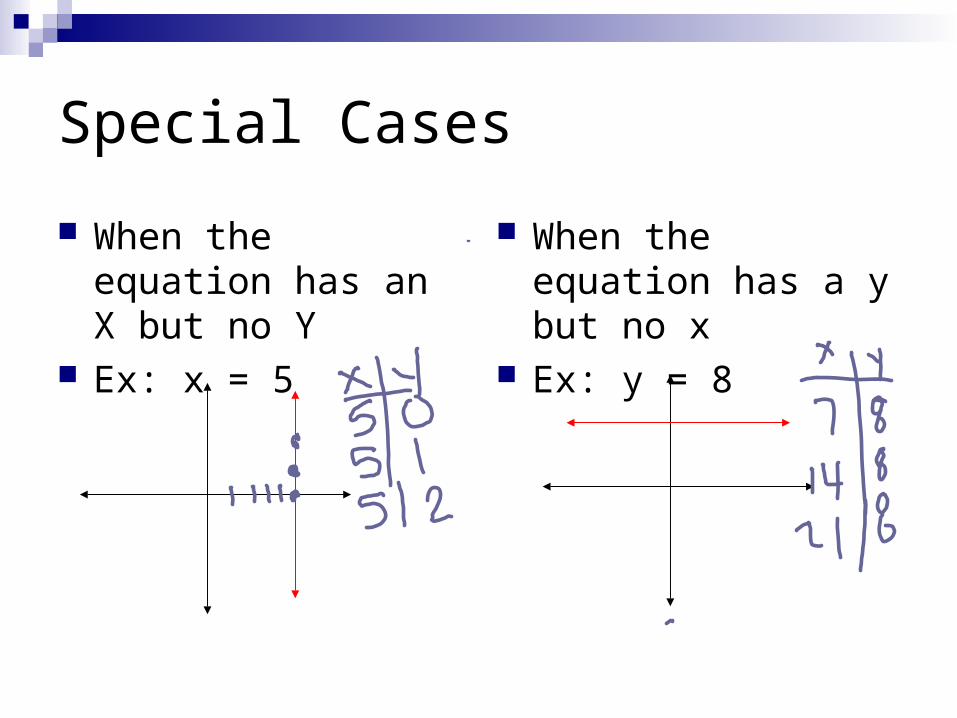
Special Cases
When the equation has an X but no Y
Ex: x = 5
When the equation has a y but no x
Ex: y = 8
4.2 Graphing Linear Equations Part2
Objectives:
-Graph linear equations and make t- charts
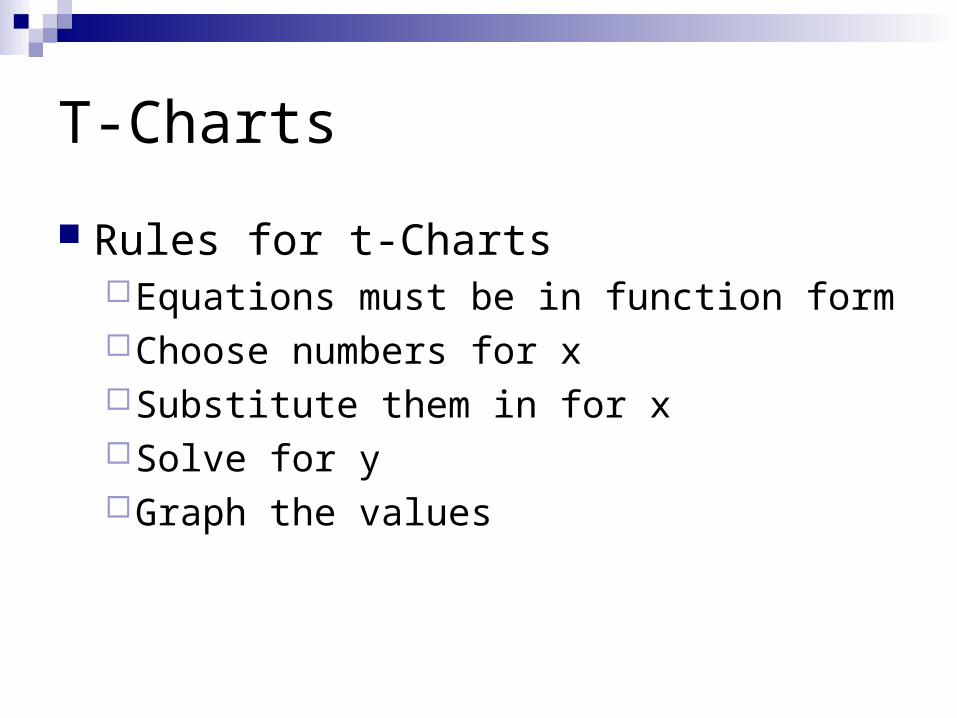
T-Charts
Rules for t-ChartsEquations must be in function formChoose numbers for xSubstitute them in for xSolve for yGraph the values
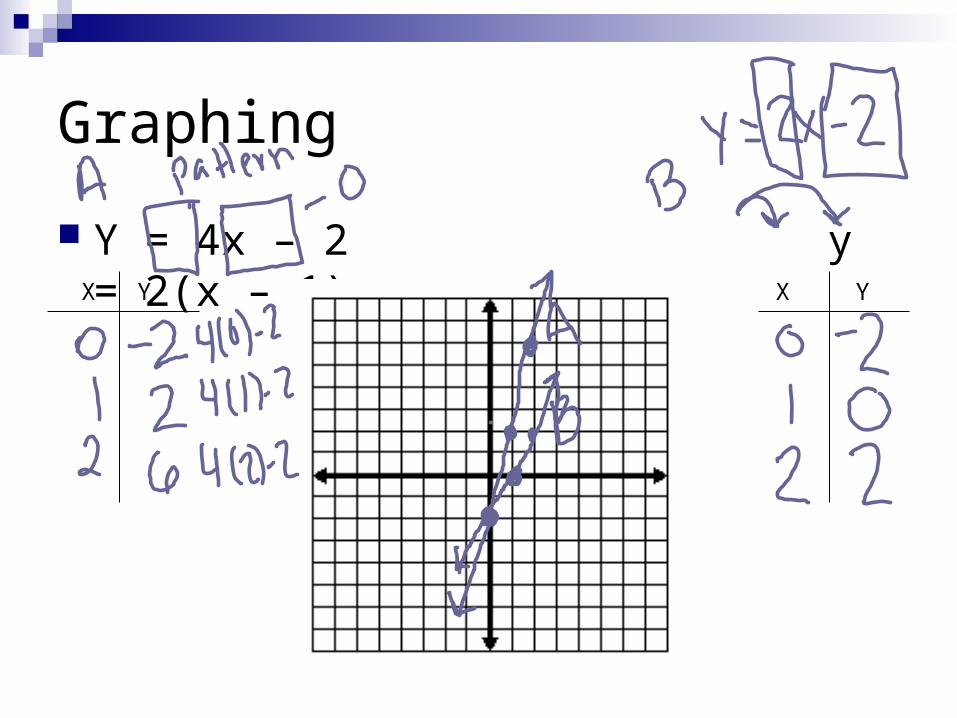
Graphing
Y = 4x – 2 y = 2(x – 1)X Y YX
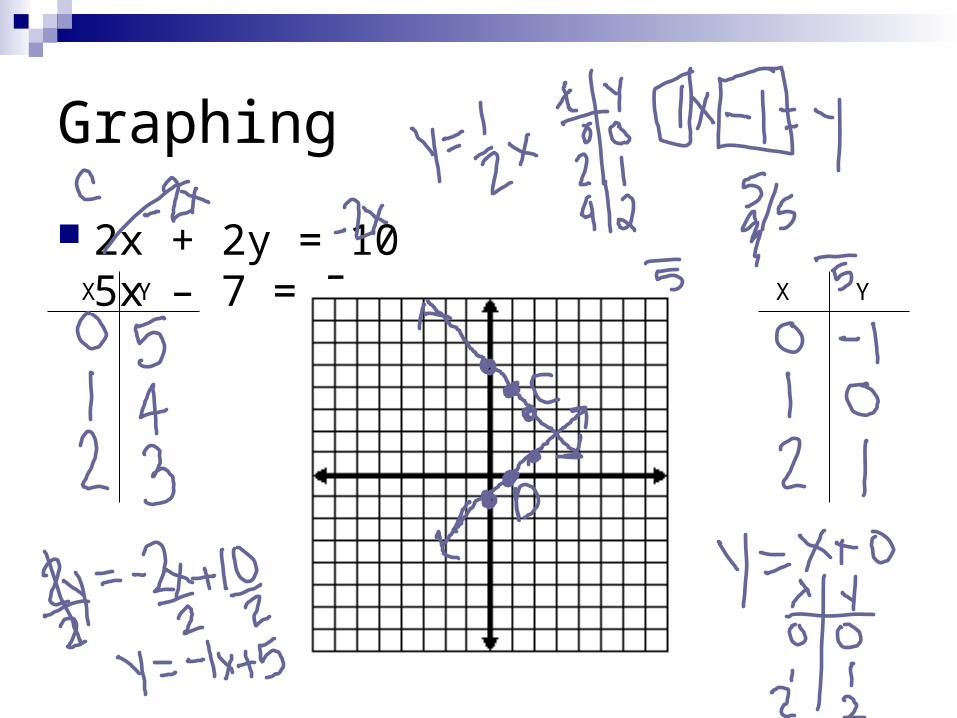
Graphing
2x + 2y = 10 5x – 7 = 5yX Y YX
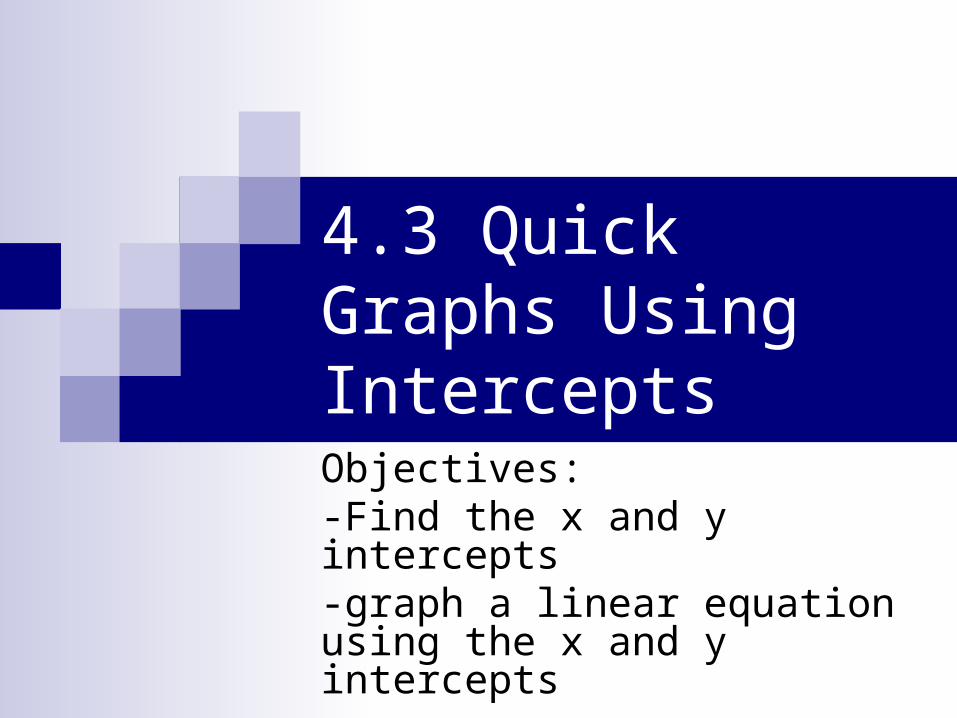
4.3 Quick Graphs Using Intercepts
Objectives:-Find the x and y intercepts-graph a linear equation using the x and y intercepts
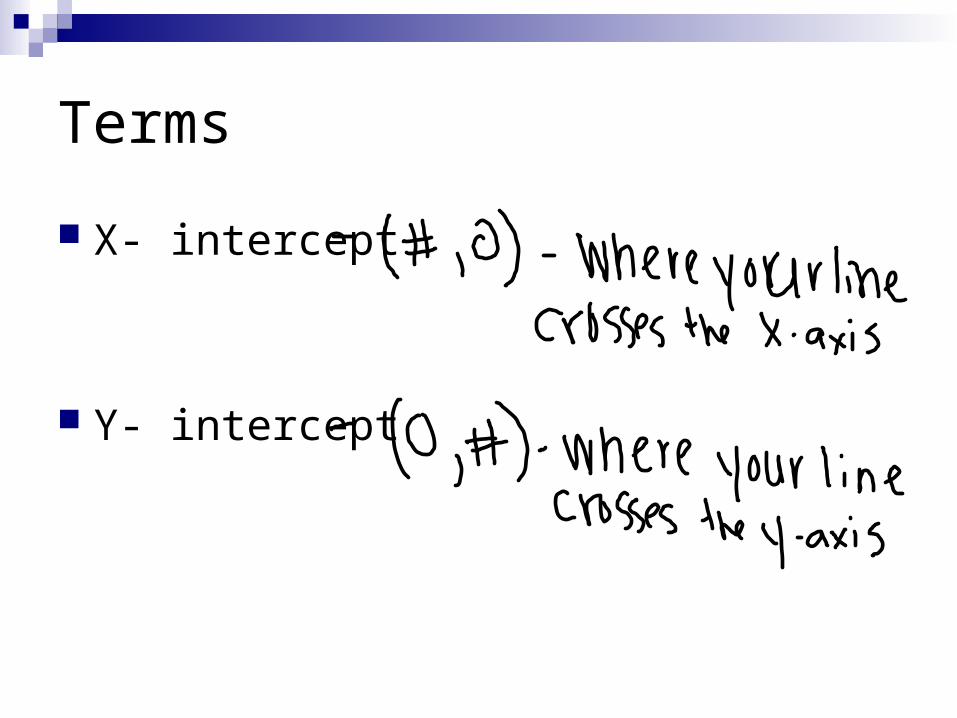
Terms
X- intercept
Y- intercept
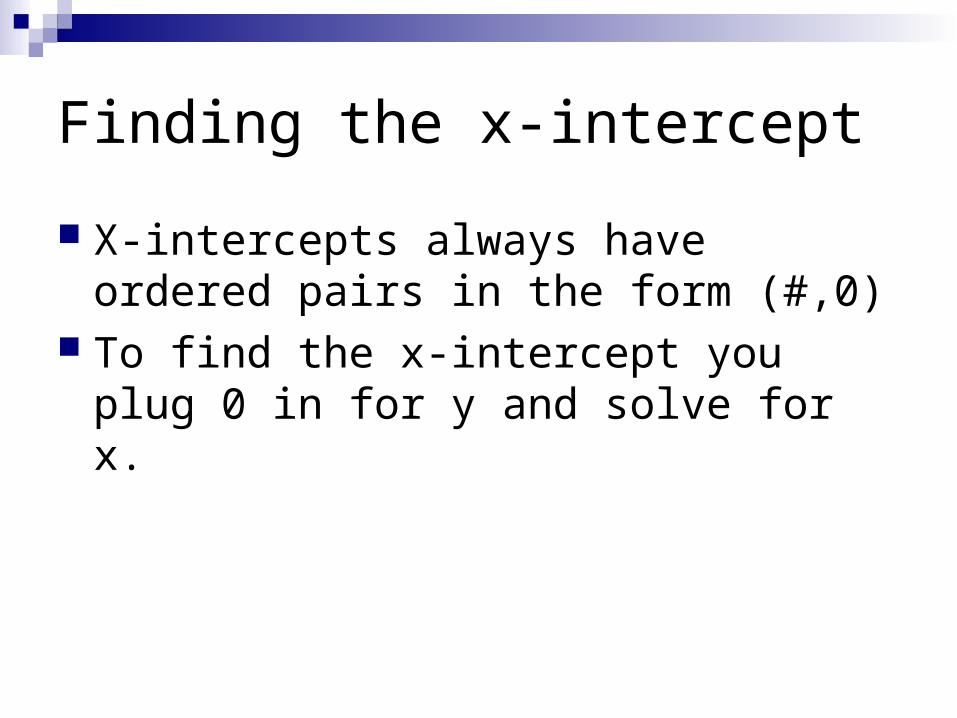
Finding the x-intercept
X-intercepts always have ordered pairs in the form (#,0)
To find the x-intercept you plug 0 in for y and solve for x.
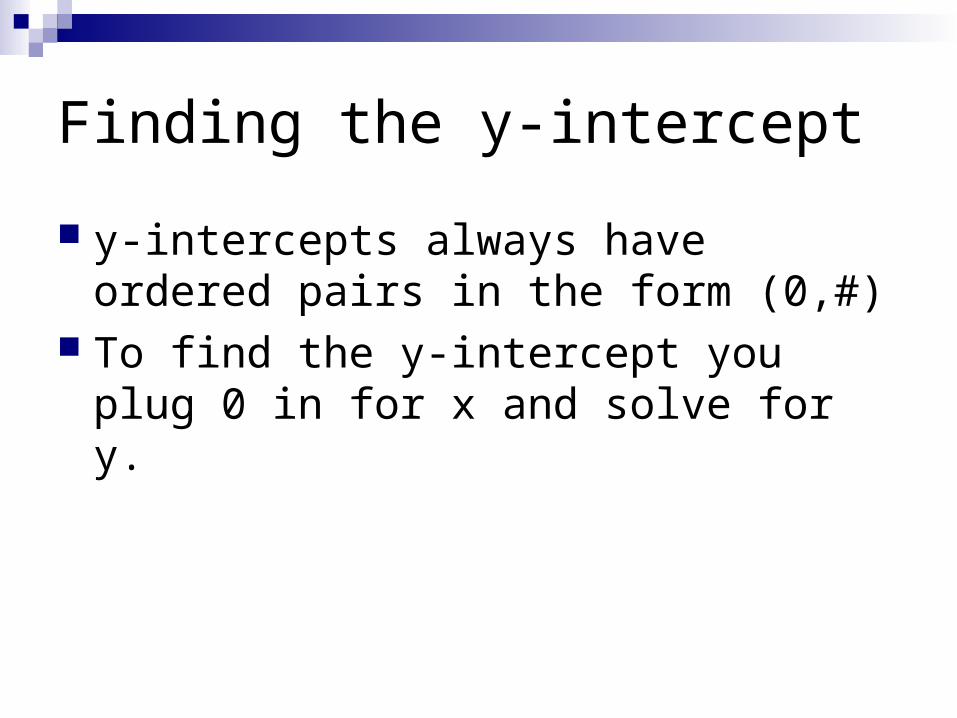
Finding the y-intercept
y-intercepts always have ordered pairs in the form (0,#)
To find the y-intercept you plug 0 in for x and solve for y.
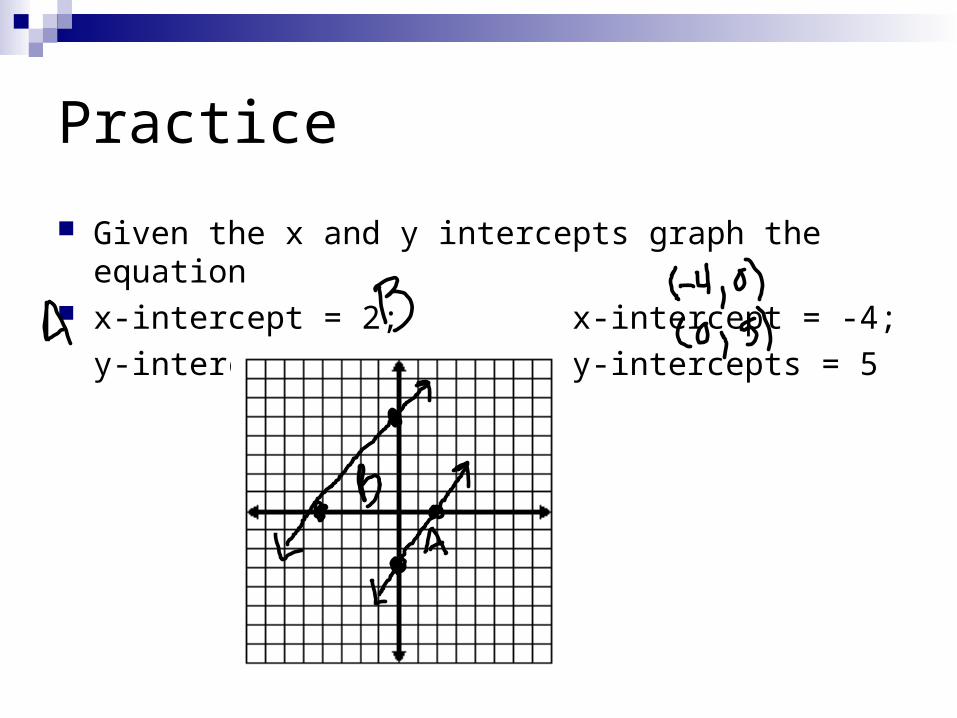
Practice
Given the x and y intercepts graph the equation x-intercept = 2; x-intercept = -4;
y-intercepts = -3 y-intercepts = 5
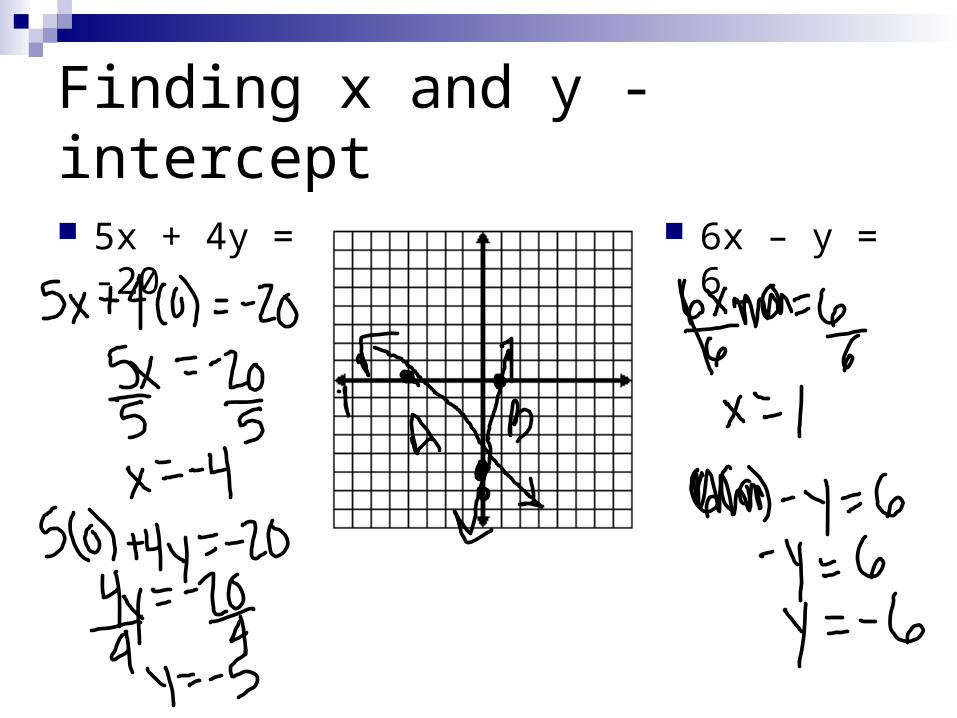
Finding x and y -intercept
5x + 4y = -20
6x – y = 6
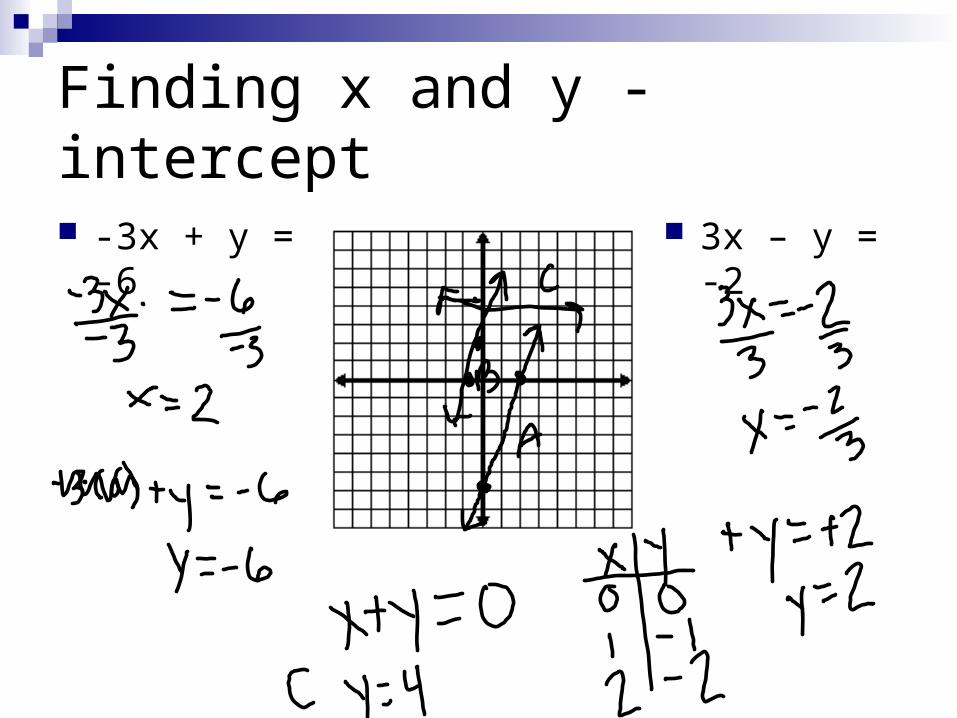
Finding x and y -intercept
-3x + y = -6
3x – y = -2

4.4 Slope
Objectives:
-Find the slope of a line given 2 pts

Terms
Slope
Rate of change

Finding Slope form a Graph
A
B
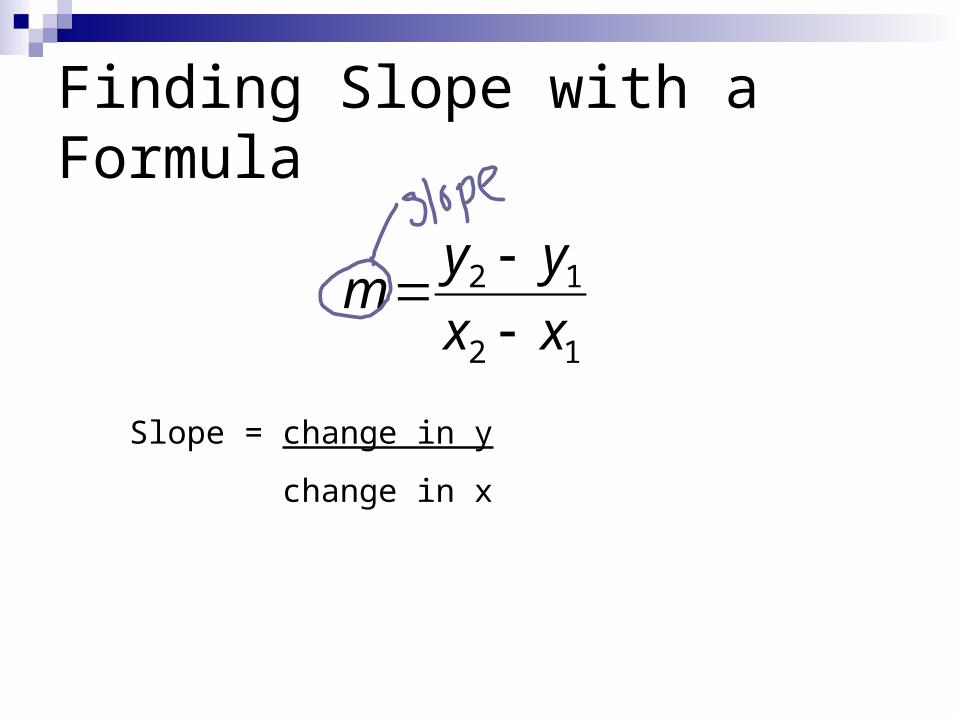
Finding Slope with a Formula
my y
x x
2 1
2 1
Slope = change in y
change in x
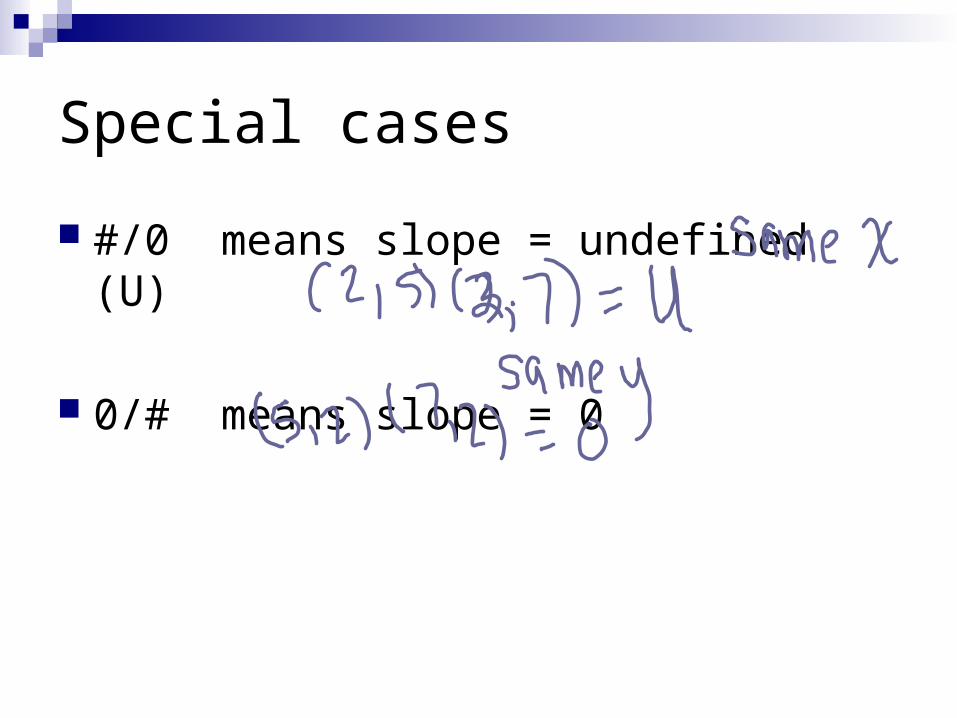
Special cases
#/0 means slope = undefined (U)
0/# means slope = 0
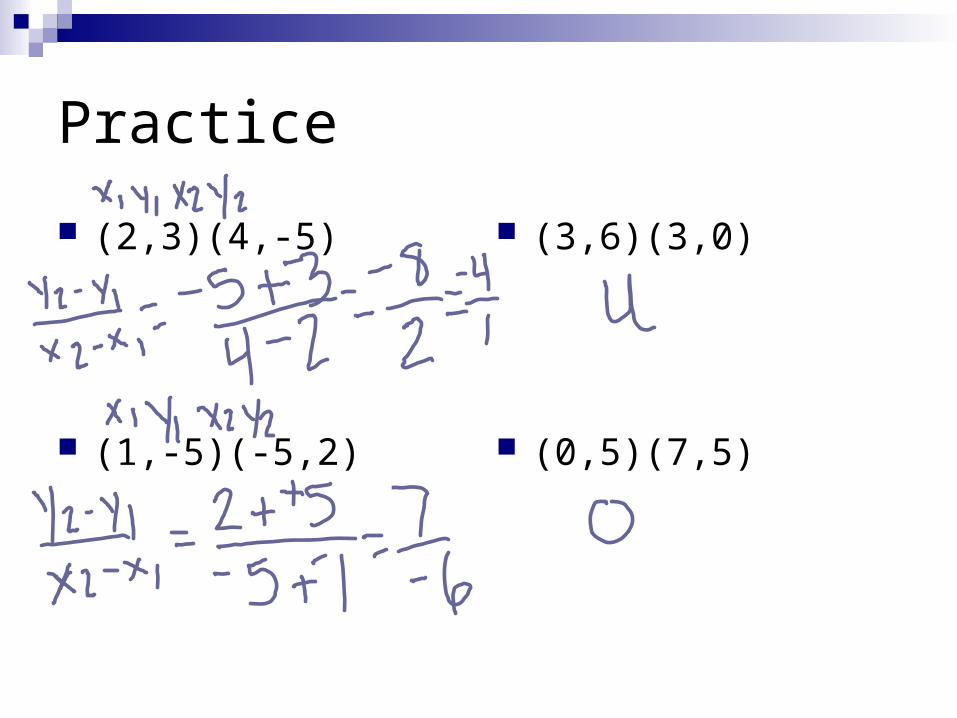
Practice
(2,3)(4,-5)
(1,-5)(-5,2)
(3,6)(3,0)
(0,5)(7,5)
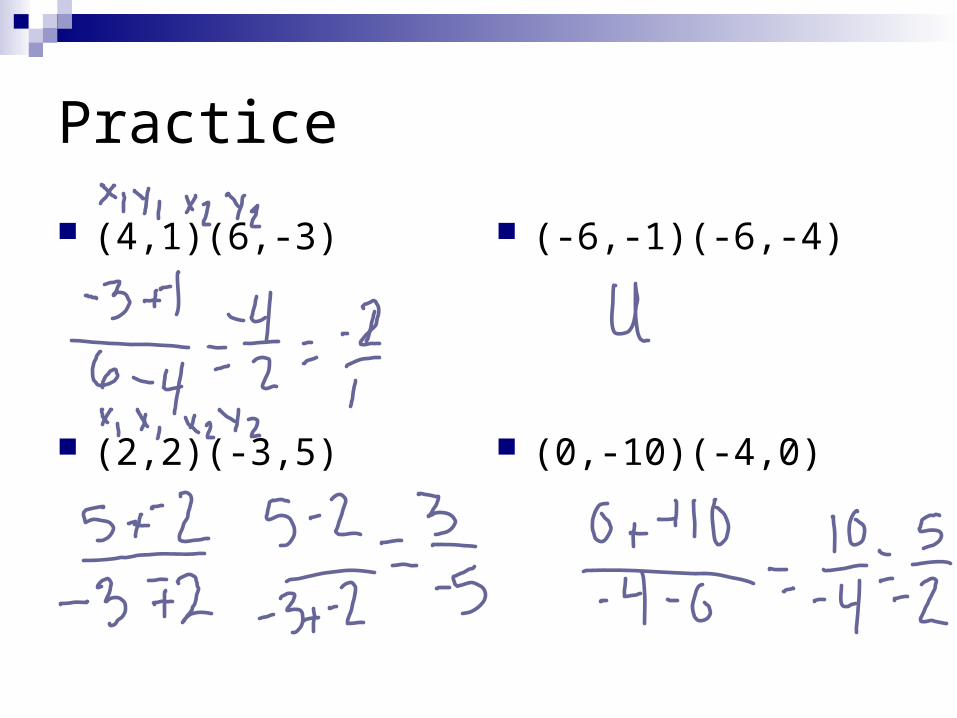
Practice
(4,1)(6,-3)
(2,2)(-3,5)
(-6,-1)(-6,-4)
(0,-10)(-4,0)

White Board Practice
One person from each row get white boards and accessories
4.6 Quick Graphs Using Slope Intercept
Objectives:
-Graph a linear equation in slope intercept form
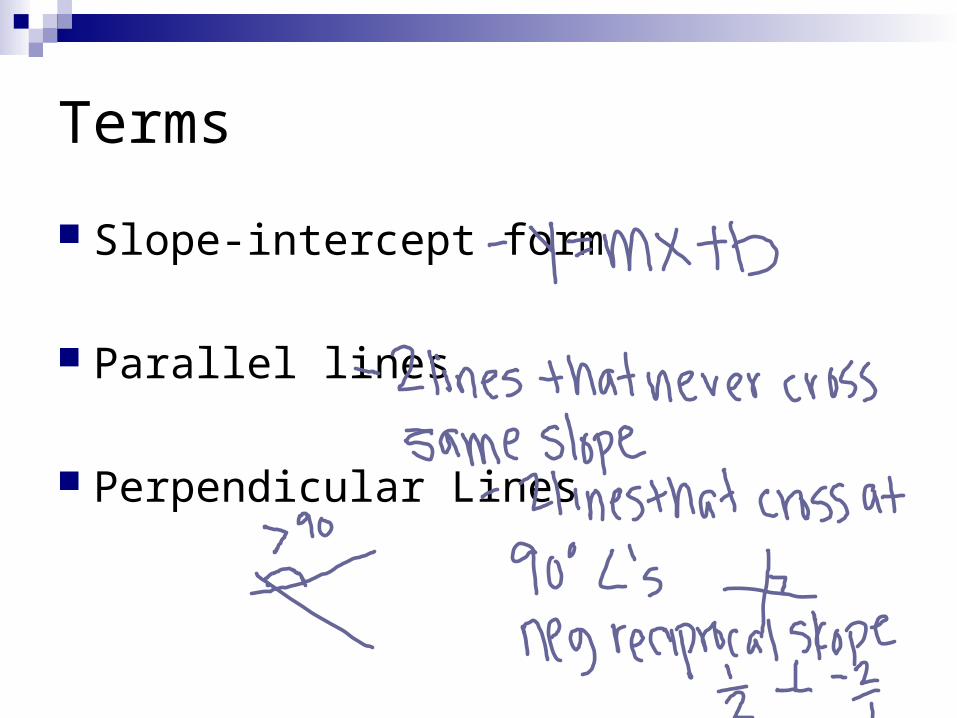
Terms
Slope-intercept form
Parallel lines
Perpendicular Lines
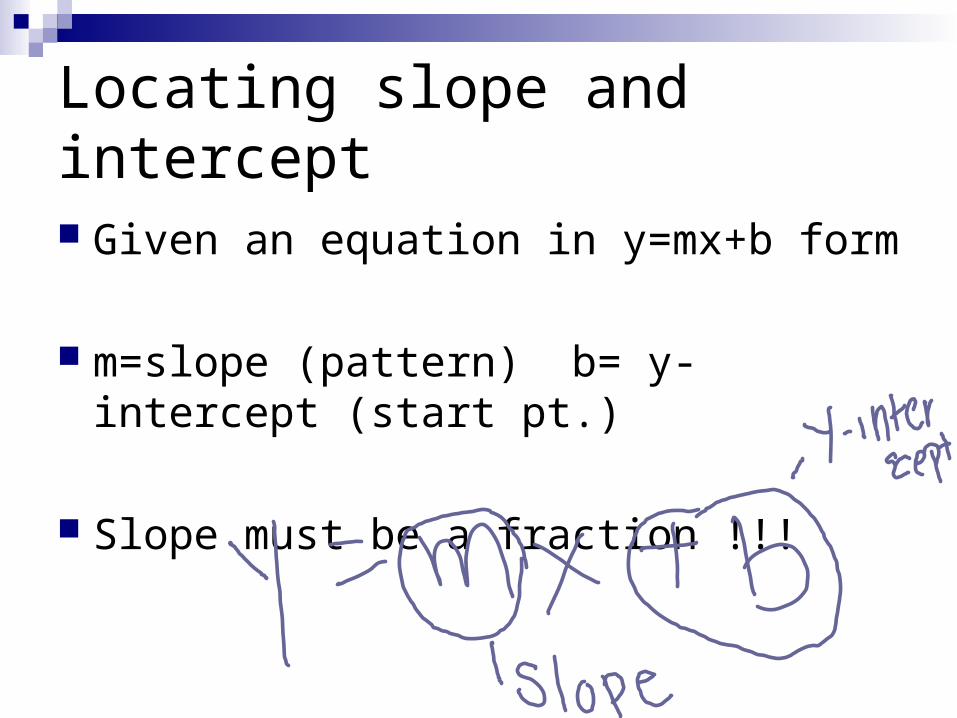
Locating slope and intercept
Given an equation in y=mx+b form
m=slope (pattern) b= y-intercept (start pt.)
Slope must be a fraction !!!
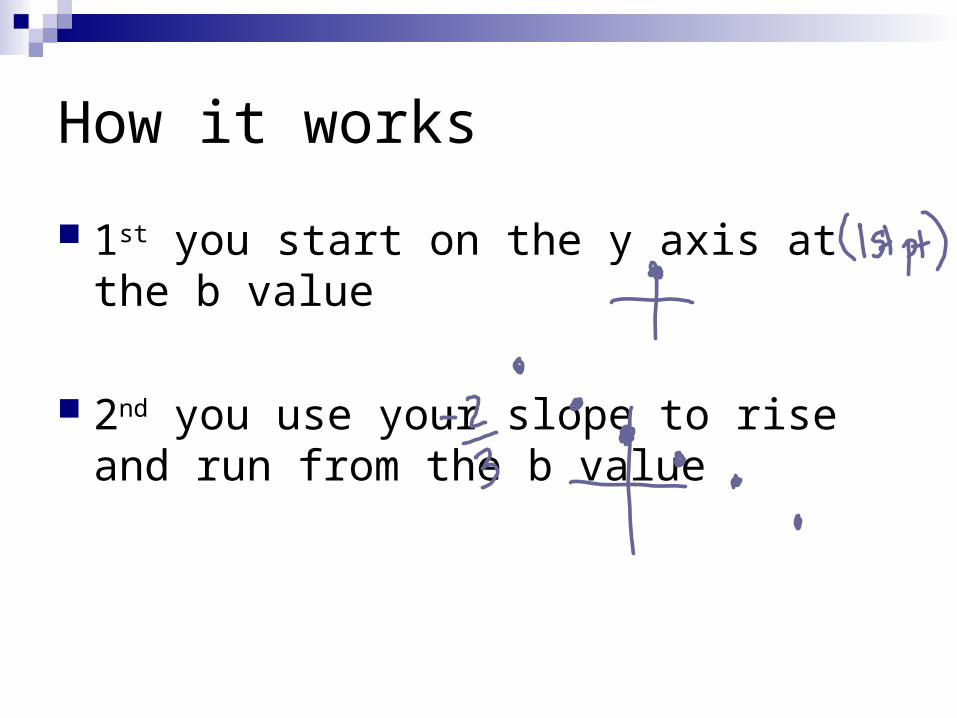
How it works
1st you start on the y axis at the b value
2nd you use your slope to rise and run from the b value

Practice
Graph each of the following and tell the slope and intercept
Y = 2x – 3
Y= -3x – 2
Y= ½ x + 5

Practice
Graph each of the following and tell the slope and intercept
Y= 2/3x – 1
Y= 2x
2y + 3x = 6