Embed Size (px)
Citation preview
Chapter 3
The Interstellar Medium
3.1 An Introduction to the Interstellar Medium
The interstellar medium (ISM) of a galaxy consists of the gas and dust distributedbetween the stars. The mass in the gas is much larger than that in dust, with the massof dust in the disc of our Galaxy ' 0.1 of the mass of gas. Generally, the interstellarmedium amounts to only a small fraction of a galaxy’s luminous mass, but this fractionis strongly correlated with the galaxy’s morphological type. This fraction is ' 0 % foran elliptical galaxy, 1–25 % for a spiral (the figure varies smoothly from type Sa toSd), and 15–50 % for an irregular galaxy.
The interstellar gas is very diffuse: in the plane of our Galaxy, where the Galacticgas is at its densest, the particle number density is ' 103 to 109 atomic nuclei m−3.Some of this gas is in the form of single neutral atoms, some is in the form of simplemolecules, some exists as ions. Whether gas is found as atoms, molecules or ionsdepends on its temperature, density and the presence of radiation fields, primarily thepresence of ultraviolet radiation from nearby stars. Note that the density of the gas isusually expressed as the number of atoms, ions and molecules per unit volume; herethey will be expressed in S.I. units of m−3, but textbooks, reviews and research papersstill often use cm−3 (with 1 cm−3 ≡ 106 m−3, of course).
The interstellar medium in a galaxy is a mixture of gas remaining from the forma-tion of the galaxy, gas ejected by stars, and gas accreted from outside (such as infallingdiffuse gas or the interstellar medium of other galaxies that have been accreted). TheISM is very important to the evolution of a galaxy, primarily because it forms stars indenser regions. It is important observationally. It enables us, for example, to observethe dynamics of the gas, such as rotation curves, because spectroscopic emission linesfrom the gas are prominent.
The chemical composition is about 90 % hydrogen, 9% helium plus a trace ofheavy elements (expressed by numbers of nuclei). The heavy elements in the gas canbe depleted into dust grains. Dust consists preferentially of particles of heavy elements.
Individual clouds of gas and dust are given the generic term nebulae. However,the interstellar gas is found to have a diverse range of physical conditions, having verydifferent temperatures, densities and ionisation states. There are several distinct typesof nebula, as is described below.
The pressure, density and temperature of the gas in the interstellar medium aredescribed accurately by the ideal gas law. This law, also known as the perfect gas law,can be expressed in a few different forms. Some of these will be very familiar to you,
61
but it is worth writing down the various forms at this stage to avoid confusion. For avolume V of gas of pressure P and absolute temperature T we have
PV = Np kBT = Nmole RT
where Np is the number of particles (atoms/molecules/ions) in the volume, Nmole isthe number of moles in the volume, k
Bis the Boltzmann constant (k
B= 1.381 ×
10−23 J K−1), R is the gas constant (R = 8.314 J mol−1 K−1). (Absolute temperaturemeans temperature measured relative to absolute zero. So temperatures expressed inKelvin, K, are on an absolute scale, while those expressed in degrees Celsius, ◦C, arenot.) Working instead in terms of the number density n of particles at a point in agas, and the density ρ, we have
P = n kBT =
kBρ T
mp=
kB
mAMU
ρ T
µ= R ρ T
µ
where mp is the mean mass of the particles, µ is the mean molecular mass and mAMU
is the mass corresponding to one atomic mass unit (note that R ≡ kB/m
AMU.) These
equations are all forms of the ideal gas law, but P = nkBT is the form most often
encountered when discussing the interstellar medium.
3.2 Background to the Spectroscopy of Interstellar
Gas
The gas in the interstellar medium readily emits detectable radiation and can be stud-ied relatively easily. The gas is of very low density compared to conditions on theEarth, even compared to many vacuums created in laboratories. Therefore spectrallines are observed from the interstellar gas that are not normally observed in thelaboratory. These are referred to as forbidden lines, whereas those that are readilyobserved under laboratory conditions are called permitted lines. Under laboratoryconditions, spectral lines with low transition probabilities are ‘forbidden’ because theexcited states get collisionally de-excited before they can radiate. In the ISM, colli-sional times are typically much longer than the lifetimes of those excited states thatonly have forbidden transitions. So forbidden lines are observable from the ISM, andin fact they can dominate the spectrum.
Astronomy uses a particular notation to denote the atoms and ions that is seldomencountered in other sciences. Atoms and ions are written with symbols such as H I,H II, He I and He II. In this notation, I denotes a neutral atom, II denotes a singlyionised positively charged ion, III denotes a doubly ionised positive ion, etc. So, H I
is H0, H II is H+, He I is He0, He II is He+, He III is He2+, Li I is Li0, etc. A negativelycharged ion, such as H−, is indicated only as H−, although few of these are encounteredin astrophysics. Square brackets around the species responsible for a spectral lineindicates a forbidden line, for example [O II].
3.3 Cold Gas: the 21 cm Line of Neutral Hydrogen
Cold gas emits only in the radio and the microwave region, because collisions betweenatoms and the radiation field (e.g. from stars) are too weak to excite the electrons toenergy levels that can produce optical emission.
62
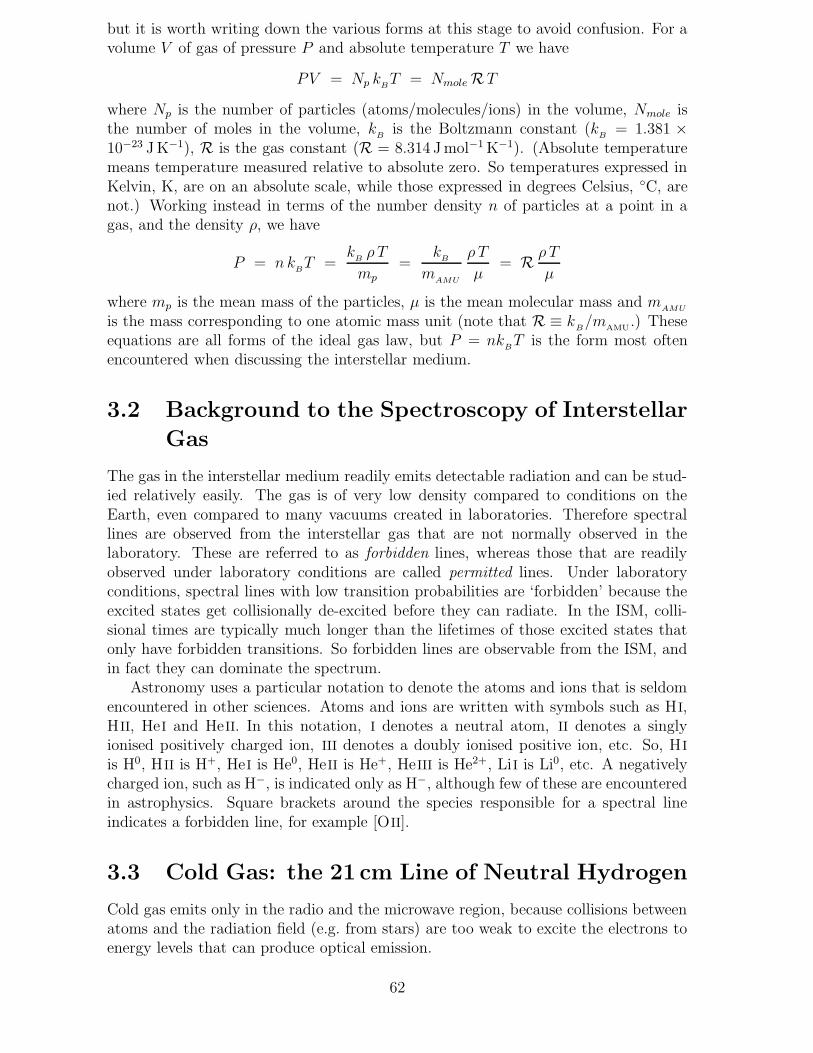
The most important ISM line from cold gas is the 21 cm line of atomic hydrogen(H I). It comes from the hyperfine splitting of the ground state of the hydrogen atom(split because of the coupling of the nuclear and electron spins). Note that this involveshydrogen atoms, not molecules and not ions. The energy difference between the twostates is ∆E = 9.4×10⁻²⁵ J = 5.9×10⁻⁶ eV. This produces emission with a rest wave-length λ0 = hc/∆E = 21.1061 cm and a rest frequency ν0 = ∆E/h = 1420.41 MHz.This is an emission spectral line at radio wavelengths. In this process, hydrogen atomsare excited into the upper state through collisions (collisional excitation), but thesecollisions occur relatively infrequently in the low densities encountered in the cold in-terstellar medium. The transition probability is A = 2.87 × 10⁻¹⁵ s−1. The lifetimeof an excited state is ' 1/A = 11 million years. However, the time between collisionsis actually much shorter than this, and collisional de-excitation occurs before mostatoms can decay spontaneously. This is followed later by other collisions, and there-fore collisional excitation. This means that a proportion of the hydrogen atoms willbe in the excited state at any time. Although the transition probability is very low,there is so much atomic hydrogen in the interstellar medium that sufficient 21cm radioemission occurs for it to be detectable.
The 21cm spin flip transition itself cannot be observed in a laboratory because ofthe extremely low transition probabilities, but the split ground state shows up in thelaboratory through of the hyperfine splitting of the Lyman lines in the ultraviolet. Inthe ISM, the 21cm line is observed primarily in emission, but can also be observed inabsorption against a background radio continuum source.
H I observations have many uses. One critically important application is to measurethe orbital motions of gas to determine rotation curves in our own Galaxy and in othergalaxies. H I observations can map the distribution of gas in and around galaxies.
3.4 Cold Gas: Molecules
Molecular hydrogen (H2) is very difficult to detect directly. It has no radio lines(including millimetre and submillimetre wavelength radiation), which is unfortunate,since it prevents the coldest and densest parts of the ISM being observed directly.There is H2 band absorption in the far ultraviolet, but this can only be observed fromabove the Earth’s atmosphere.
63
What saves the situation somewhat is that other molecules (molecules other thanH2) do emit in the radio/microwave region. Molecular energy transitions can be due tochanges in the electron energy levels, and also to changes in vibrational and rotationalenergies of the molecules. All three types of energy are quantised. Transitions betweenthe electron states are in general the most energetic, and can produce spectral linesin the optical, ultraviolet and infrared. Transitions between the vibrational states canproduce lines in the infrared. Transitions between the rotational states are in generalthe least energetic and produce lines in the radio/microwave region.
CO has strong lines at 1.3 mm and 2.6 mm from transitions between rotationalstates. CO is particularly useful as a tracer of H2 molecules on the assumption thatthe densities of the two are proportional. Mapping CO density is therefore used todetermine the distribution of cold gas in the ISM.
Cold, dense molecular gas is concentrated into clouds. These are relatively small insize (' 2−40 pc across). Temperatures are T ∼ 10 K and densities ∼ 108 to 1011 m−3.Molecular clouds fill only a very small volume of the ISM but contain substantial mass.Regions of gas in molecular clouds can experience collapse under their own gravitationto form stars. The newly formed hot stars in turn irradiate the gas with ultravioletlight, ionising and heating the gas.
Giant molecular clouds are larger regions of cold, molecular gas. Their masses arelarge enough (up to 106 M�) that they can have perturbing gravitational effects onstars in the disc of the Galaxy. Within our Galaxy they are mostly found in the spiralarms.
3.5 Hot Gas: HII Regions
Hot gas is readily observed in the optical region of the spectrum. Gas that is largelyionised produces emission lines from electronic transitions when ions and some atomsrevert to lower energy states. The gas is therefore observed as nebulae.
An important kind of object is H II regions, which are regions of partially ionisedhydrogen surrounding very hot young stars of O or B spectral types. Hot stars producea large flux of ultraviolet photons, and any Lyman continuum photons (i.e. photonswith wavelengths λ < 912 A) will photoionise hydrogen producing a region of H+,i.e. H II ions. These wavelengths correspond to energies > 13.6 eV, the ionisationenergy from the ground state of hydrogen. The ionised hydrogen then recombineswith electrons to form neutral atoms. But the hydrogen does not have to recombineinto the ground state; it can recombine into an excited state and then radiatively decayafter that. Electrons will cascade down energy levels, emitting photons as they do, ina process known as radiative decay.
This process produces a huge variety of observable emission lines and continua inthe ultraviolet, optical, infrared and radio parts of the spectrum. Free-bound transi-tions (involving free electrons combining with ions to become bound in atoms) producecontinuum radiation. Bound-bound transitions (involving electrons inside an atommoving to a different energy level in the same atom) produce spectral lines.
Transitions in hydrogen atoms down to the first excited level (n = 2) produceBalmer lines, which lie in the optical. These are prominent in nebulae. Transitionsdown to the ground (n = 1) state produce Lyman lines in the ultraviolet. In eachseries, the individual lines are labelled α, β, γ, δ, ..., in order of decreasing wavelength.The transitions from n to n − 1 levels are the strongest. Therefore the α line of any
64

series is the strongest.
Lyman series lines of hydrogen are: Balmer series lines of hydrogen are:Lyα λ = 1216 A (in ultraviolet) Hα λ = 6563 A (in optical)Lyβ 1026 A ( ” ) Hβ 4861 A ( ” )Lyγ 973 A ( ” ) Hγ 4340 A ( ” )
Hδ 4102 A ( ” )Hε 3970 A ( ” )
Atoms in H II regions can also be collisionally excited. Atomic hydrogen has nolevels accessible at collision energies characteristic of H II regions (T ∼ 104 K) but N II,O II, S II, O III, Ne III all do. The [O III] lines at 4959A and 5007A are particularlyprominent. Some of the most prominent lines in the optical spectra of H II regions,other than the hydrogen lines listed above, are the following lines produced by oxygen,neon, helium and nitrogen:
[O II] 3727 A He I 5876 A[Ne III] 3869 A [N II] 6548 A[O III] 4959 A [N II] 6584 A[O III] 5007 A
Figure 3.1: The Orion Nebula, M42. This is the most famous example of a H II region.The gas fluoresces because of the ultra-violet radiation from hot, young stars recentlyformed in a dense region of gas. [Hubble Space Telescope image produced by NASA,ESA, M. Robberto (Space Telescope Science Institute/ESA) and the Hubble SpaceTelescope Orion Treasury Project Team.]
65

The optical spectrum ofthe Orion Nebula. Thespectrum shows verystrong emission linesfrom species such as H I,[O II] and [O III].
Colour optical images of H II regions of the kind used in popular astronomy booksshow strong red and green colours: the red is produced mainly by the Hα line, whilethe green is produced by [O III] and Hβ. H II regions are seen prominently in imagesof spiral and irregular galaxies. Their emission lines dominate the spectra of late-typegalaxies and are valuable for use in measuring redshifts.
The photoionisation and recombination process in H II regions and planetary nebu-lae produces, by a convenient accident, one Balmer photon for each Lyman continuumphoton from the hot star, so the ultraviolet flux from the star can be measured byobserving an optical spectrum of the H II region surrounding the hot star. The reasonis basically that the gas is opaque to Lyman photons and transparent to other pho-tons, since almost all the H atoms are in the ground state. A Lymancontinuum photoninitially from the star will get absorbed by a hydrogen atom, producing a free electron.This electron will then be captured into some bound state. If it gets captured to theground state we are back where we started (with a ground state atom and a Lymancontinuum photon), so consider the case where the electron is captured to some n > 1state. Such a capture releases a free-bound continuum photon which then escapes,and leaves an excited state which wants to decay to n = 1. If it decays to n = 1bypassing n = 2, it will just produce a Lyman photon which will almost certainlyget absorbed again. Only if it decays to some n > 1 will a photon escape. In otherwords, if the decay bypasses n = 2 it almost always gets another chance to decay ton = 2 and produce a Balmer photon that escapes. The Lyα photons produced by thefinal decay from n = 2 to n = 1 random-walk through the gas as they get absorbedand re-emitted again and again. The total Balmer photon flux thus equals the Lymancontinuum photon flux. One can then place the source star in an optical-ultravioletcolour–magnitude diagram, and determine a colour temperature which is called theZanstra temperature in this context.
H II regions and planetary nebulae also produce thermal continuum radiation. Theprocess that produces this is free-free emission: free electrons in the H II can interactwith protons without recombination, and the acceleration of the electrons in this pro-cess produces radiation. (Electrons can interact with other electrons in similar fashion
66

as well, but this produces no radiation because the net electric dipole moment doesnot change.) The resulting spectrum is not blackbody because the gas is transparentto free-free photons: there is no redistribution of the energy of the free-free photons.In fact the spectrum is quite flat at radio frequencies – this is the same thing as sayingthat the time scale for free-free encounters is � 1/ν for radio frequency ν.
Detailed analyses of the relative strengths of the emission lines from H II regionscan provide measurements of the temperatures, densities and chemical composition ofthe interstellar gas. This is possible for nebulae in our Galaxy and for emission linesin other galaxies. Measuring the chemical compositions of gas in galaxies is importantin understanding how the abundances of chemical elements vary from one place in theUniverse to another.
3.6 Hot Gas: Planetary Nebulae
A planetary nebula is like a compact H II region, except that it surrounds the exposedcore of a hot, highly evolved star rather than a hot young star. The gas is ejected fromthe star through mass loss over time. Ultraviolet photons from the star ionise the gasin manner similar to H II regions, and the gas emits photons like a H II region. Emissionprocesses are similar to H II regions, but the density, temperature and ionisation stateof the gas around a planetary nebula can be somewhat different to a H II region.
Planetary nebulae are relatively luminous and have prominent emission lines. Assuch they can be observed in other galaxies and can be detected at greater distancesthan many individual ordinary stars. They can be used to trace the distribution andkinematics of stars in other galaxies.
Figure 3.2: Examples of planetary nebulae: the Ring Nebula (M57), left, and theHelix Nebula, right. Gas has been ejected from a hot, evolved star and the ultravioletradiation from the star ionises the gas. [Images from the Hubble Space Telescope.Ring Nebula: produced by the Hubble Heritage Team (AURA/STScI/NASA). HelixNebula: produced by NASA, NOAO, ESA, the Hubble Helix Nebula Team, M. Meixner(STScI), and T.A. Rector (NRAO).]
67
3.7 Hot Gas: Supernova Remnants
Supernovae eject material at very high velocities into the interstellar medium. Thisgas shocks, heats and disrupts the ISM. Low density components of the ISM can besignificantly affected, but dense molecular clouds are less strongly affected. Hot gasfrom supernovae can even be ejected out of the Galactic disc into the halo of theGalaxy. Supernova remnants have strong line emission. They expand into and mixwith the ISM.
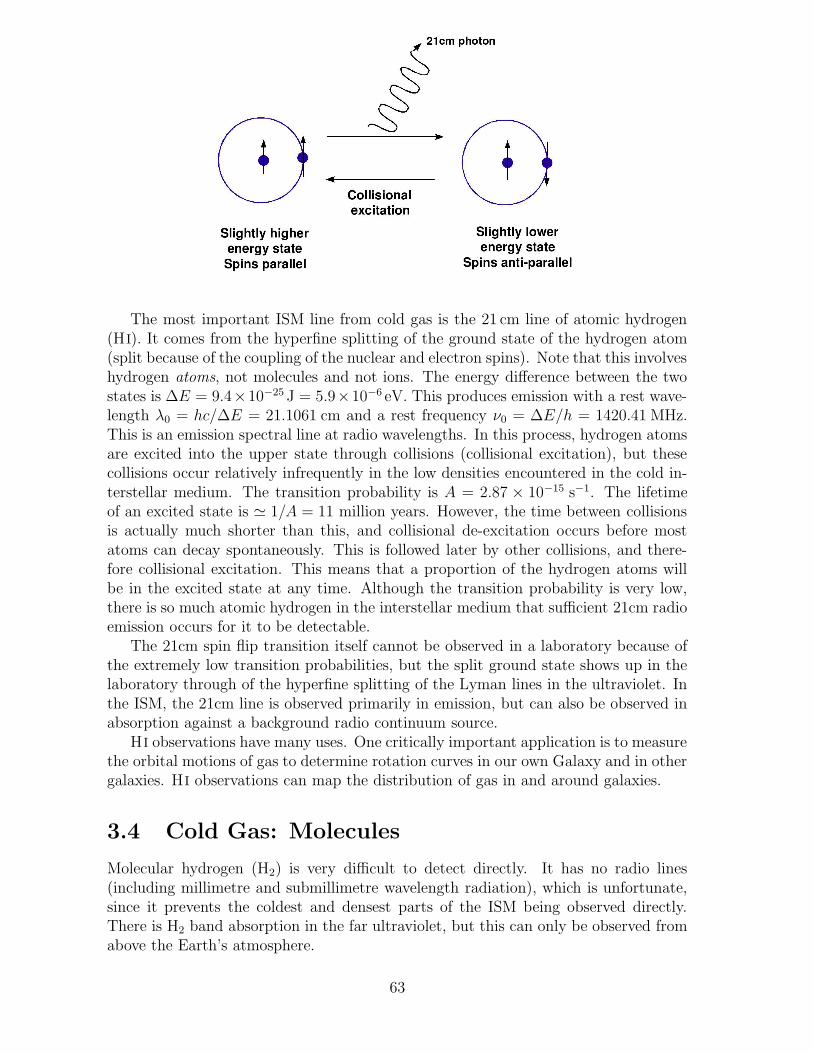
Figure 3.3: Examples of supernova remnants: the Crab Nebula (M1), left, and part ofthe Veil Nebula, right. The Crab Nebula is a very young supernova remnant, producedby a supernova observed in the year 1054. The Veil Nebula is an older example. [TheCrab Nebula image is from the Hubble Space Telescope: it was produced by NASA,ESA, J. Hester and A. Loll (Arizona State University). The Veil Nebula image is fromthe 0.9m Burrell Schmidt Telescope at Kitt Peak National Observatory, Arizona: itwas provided by NOAO/AURA/NSF.]
3.8 Hot Gas: Masers
In the highest density H II regions (∼ 1014 m−3), either very near a young star, orin a planetary-nebula-like system near an evolved star, population inversion betweencertain states becomes possible. The overpopulated excited state then decays by stim-ulated emission, i.e., it becomes a maser. An artificial maser or laser uses a cavitywith reflecting walls to mimic an enormous system, but in an astrophysical maser theenormous system is available for free; so an astrophysical maser is not directed per-pendicular to some mirrors but shines in all directions. But as in an artificial maser,the emission is coherent (hence polarised), with very narrow lines and high intensity.Masers from OH and H2O are known. Their high intensity and relatively small sizemakes masers very useful as kinematic tracers.
68
3.9 Hot Gas: Synchrotron Radiation
Finally, we’ll just briefly mention synchrotron radiation. It is a broad-band non-thermal radiation emitted by electrons gyrating relativistically in a magnetic field,and can be observed in both optical and radio. The photons are emitted in theinstantaneous direction of electron motion and polarised perpendicular to the magneticfield. The really spectacular sources of synchrotron emission are systems with jets(young stellar objects with bipolar outflows, or active galactic nuclei). It is synchrotronemission that lights up the great lobes of radio galaxies.
3.10 Absorption-Line Spectra from the Interstellar
Gas
If interstellar gas is seen in front of a continuum background light source, light fromthe source is found to be absorbed at particular wavelengths. A number of interstellarlines and molecular bands are seen in absorption. This process requires a relativelybright background source in practice.
The molecular absorption can be very complex. Electron transitions in the mole-cules do not produce single strong spectral lines, but a set of bands. This is becauseof the effect of the various vibrational and rotational energy states of the molecules inthe gas, combined with the stronger electronic transitions.
Some of the interstellar absorption features are not well understood. One particularproblem is the diffuse interstellar bands in the infrared. These are probably caused bycarbon molecules, possibly by polycyclic aromatic hydrocarbons (PAHs).
An interesting example of the importance of interstellar absorption lines concernsmeasurements of the temperatures of cold interstellar CN molecules. Like most het-eronuclear molecules, CN has rotational modes which produce radio lines. The radiolines can be observed directly, but more interesting are the optical lines that have beensplit because of these rotational modes. Observations of cold CN against backgroundstars reveal, through the relative widths of the split optical lines, the relative popula-tions of the rotational modes, and hence the temperature of the CN. The temperatureturns out to be 2.7 K, i.e., these cold clouds are in thermal equilibrium with the mi-crowave background. The temperature of interstellar space was first estimated to be' 3 K in 1941, well before the Big Bang predictions of 1948 and later, but nobodymade the connection at the time.
3.11 The Components of the Interstellar Medium
It is sometimes convenient to divide the diffuse gas in the interstellar medium intodistinct components, also called phases:
• the cold neutral medium – consisting of neutral hydrogen (H I) and molecules attemperatures T ∼ 10 − 100 K and relatively high densities;
• the warm neutral medium – consisting of H I but at temperatures T ∼ 103−104 Kof lower densities;
• the warm ionised medium – consisting of ionised gas (H II) at temperatures T ∼104 K of lower densities;
69
• the hot ionised medium – consisting of ionised gas (H II) at very high tempera-tures T ∼ 105 − 106 K but very low densities.
(Note that sometimes only three phases are considered, with the warm neutral mediumand the warm ionised medium lumped together as warm gas.)
These phases are pressure-confined and are stable in the long term. Ionisation bysupernova remnants is an important mechanism in producing the hot ionised medium.The cold neutral medium makes up a significant fraction ∼ 50% of the ISM’s mass,but occupies only a very small fraction by volume. Some other individual structuresin the ISM, such as supernova remnants, planetary nebulae, H II regions and giantmolecular clouds, are not included in these phases because they are not in pressureequilibrium with these phases.
3.12 Interstellar Dust
Interstellar dust consists of particles of silicates or carbon compounds. They arerelatively small, but have a broad range in size. The largest are ' 0.5 µm in size (i.e.' 5 × 10⁻⁷ m) with ∼ 104 atoms, but some appear to have . 102 atoms and thus arenot significantly different from large molecules.
Dust has a profound observational effect – it absorbs and scatters light. Dustdiminishes the light of background sources, a process known as interstellar extinction.Examples of this are dark nebulae, and the zone of avoidance for galaxies at lowgalactic latitudes.
Consider light of wavelength λ with a specific intensity Iλ passing through interstel-lar space. (Specific intensity of light here means the energy transmitted in a directionper unit time through unit area perpendicular to that direction into unit solid angleper unit interval in wavelength.) If the light passes through an element of length inthe interstellar medium, it will experience a change dIλ in the intensity Iλ due toabsorption and scattering by dust. This is related to the change dτλ in the opticaldepth τλ at the wavelength λ that the light experiences along its journey by
dIλIλ
= − dτλ . (3.1)
(Note that dIλ is negative because the intensity is reduced by the absorption.) Inte-grating over the line of sight from a light source to an observer, the observed intensityis
Iλ = Iλ 0 e − τλ , (3.2)
where Iλ 0 is the light intensity at the source and τλ is the total optical depth alongthe line of sight.
This can be related to the loss of light in magnitudes. The magnitude m in somephotometric band is related to the flux F in that band by m = C − 2.5 log10(F ),where C is a calibration constant. So, the change in magnitude caused by an opticaldepth τ in the band is A = − 2.5 log10(e
−τ ) = + 1.086 τ. The observed magnitude mis related to the intrinsic magnitude m0 by
m = m0 + A, (3.3)
where A is the extinction in magnitudes (the intrinsic magnitude m0 is the magnitudethat the star would have if there were no interstellar extinction). A depends on the
70
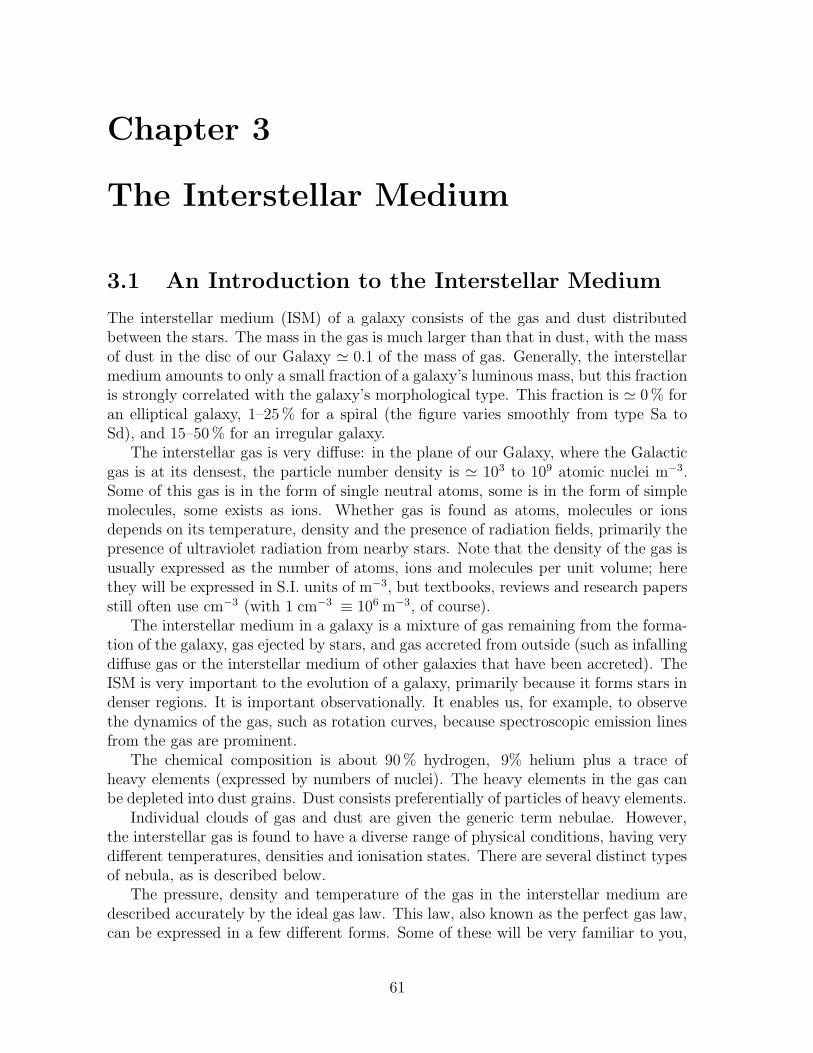
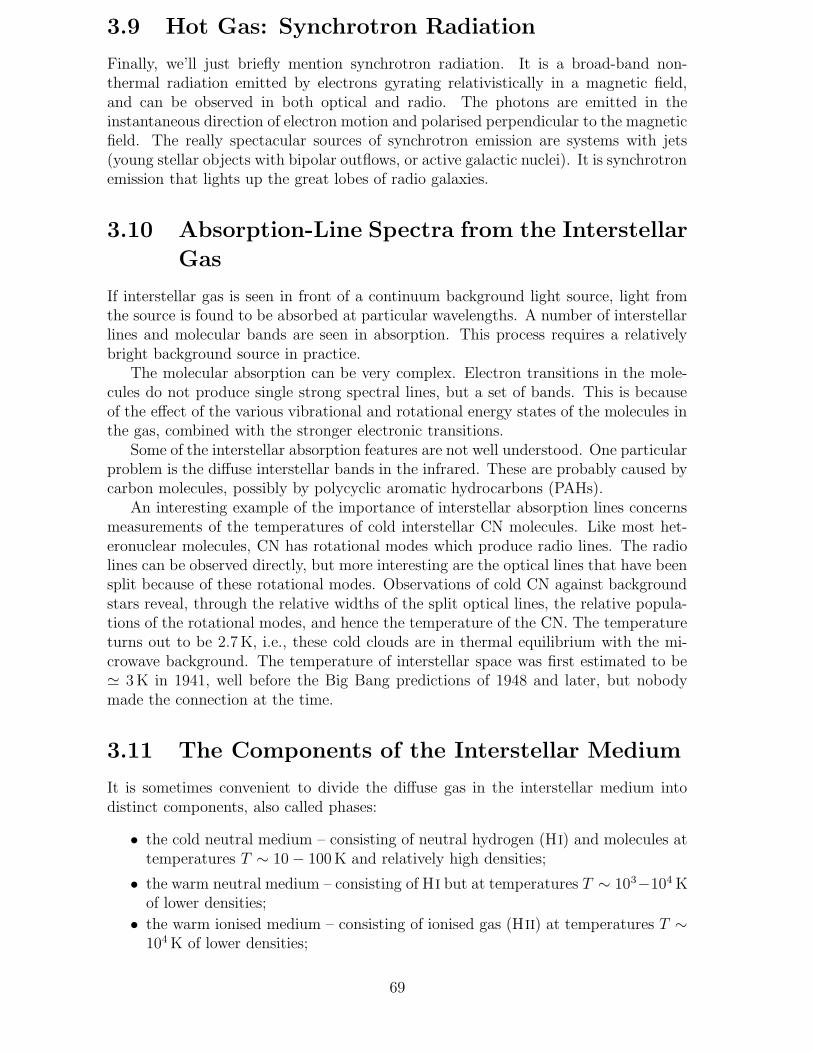
The interstellar extinctionlaw. The extinction causedby dust is plotted againstwavelength and extends fromthe ultraviolet through to thenear-infrared.[Based on data from Savage& Mathis, Ann. Rev. As-tron. Astrophys., 1979.]
photometric band. For example, for the V (visual) band (corresponding to yellow-greencolours and centred at 5500 A), V = V0 + AV , while for the B (blue) band (centredat 4400 A), B = B0 + AB. For sight lines through the Galaxy at the Galactic poles,AV ' 0.00 to 0.05 mag, while at intermediate galactic latitudes, AV ' 0.05 to 0.2 mag.However, in the Galactic plane, the extinction can be many magnitudes, and towardsthe Galactic Centre it is AV � 20 mag.
Aλ is a strong function of wavelength and it scales as Aλ ∼ 1/λ (but not as strong asthe ∼ 1/λ4 relation of the Rayleigh law). There is therefore much stronger absorptionin the blue than in the red. This produces an interstellar reddening by dust: aslight consisting of a range of wavelengths passes through the interstellar medium, it isreddened by the selective loss of short wavelength light compared to long wavelengths.Colour indices are reddened, e.g. B − V is reddened so that the observed value is(B − V ) = (B − V )0 + EB−V , where (B − V )0 is the intrinsic values (what wouldbe observed in the absence of reddening) and EB−V is known the colour excess. Thecolour excess measures how reddened a source is. The colour excess is therefore thedifference in the extinctions in the two magnitudes, e.g. EB−V = AB − AV . If theintrinsic colour can be predicted, i.e. we can predict (B − V )0 (e.g. from a spectrum),it is possible to calculate EB−V from EB−V = (B − V ) − (B − V )0. EB−V data canthen be used to map the dust distribution in space. It is found from observations thatthe extinction in the V band AV ' 3.1EB−V . Extinction gets less severe for λ & 1µmas the wavelength gets much longer than the grains. Grains are transparent to X-rays.
The extinction becomes very strong for long sight lines through the disc of theGalaxy. The Galactic Centre is completely opaque to optical observations. There issome patchiness in the distribution of the dust. A few areas of lower dust extinctiontowards the bulge of our Galaxy, such as Baade’s Window, enable the stars in thebulge to be studied.
We can model the extinction caused by dust in the Galaxy to predict how theextinction in magnitudes towards distant galaxies will depend on their galactic latitude
71

b. The optical depth caused by dust extinction when light of wavelength λ travels ashort distance ds through the interstellar medium is given by dτλ = κλ ρd ds, where ρd
is the density of dust at that point in space and κλ is the mass extinction coefficient atthat point for the wavelength λ. Observations of star numbers show that their numberdensity declines exponentially with distance from the Galactic plane. We shall adopta similar behaviour for the density of dust, and therefore assume that the density ofdust varies with distance z above the Galactic plane as ρd(z) = ρd0 e−|z|/h, where ρd0
and h are constants.
The optical depth when travelling a distance ds along the line of sight at galacticlatitude b is dτλ = κλ ρd(z) ds = κλ ρd(z) dz/ sin |b| where z is the distance north ofthe Galactic plane. Integrating along the line of sight,
∫ τλ
0
dτ ′λ =
∫ ∞
0
κλ ρd(z) dz
sin |b| =
∫ ∞
0
κλ ρd0 e−|z|/h
sin |b| dz =κλ ρd0
sin |b|
∫ ∞
0
e−|z|/h dz
assuming that the opacity κλ does not vary with distance from the Galactic plane.Therefore,
τλ =κλ ρd0 h
sin |b| = κλ ρd0 h cosec|b| . (3.4)
Since the extinction in magnitudes is Aλ = 1.086τλ, we get
Aλ = 1.086 κλ ρd0 h cosec|b| . (3.5)
Therefore the extinction in magnitudes towards an extragalactic object is predicted tovary with galactic latitude b as Aλ ∝ cosec|b| in this particular model. By coincidence,the same cosec|b| dependence of Aλ on galactic latitude b is obtained using a simplisticmodel in which the dust is found in a slab of uniform density centred around theGalactic plane.
3.13 Interstellar Dust: Polarisation by Dust
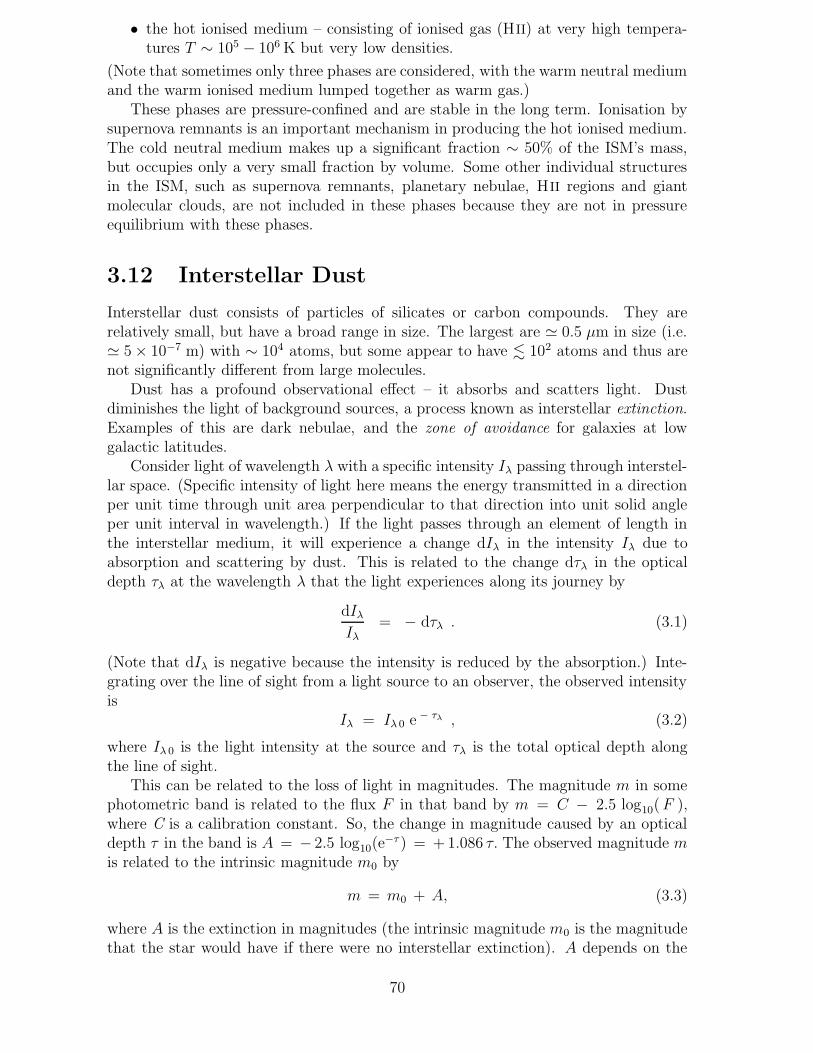
However, extinction by dust does one very useful thing for optical astronomers. Dustgrains are not spherical and tend to have some elongation. Spinning dust grains tend
72
to align with their long axes perpendicular to the local magnetic field. They thuspreferentially block light perpendicular to the magnetic field: extinction producespolarised light. The observed polarisation will tend to be parallel to the magnetic field.Hence polarisation measurements of starlight reveal the direction of the magnetic field(or at least the sky-projection of the direction).
Dust also reflects light, with some polarisation. This is observable as reflectionnebulae, where faint diffuse starlight can be seen reflected by dust.
3.14 Interstellar Dust: Radiation by Dust
Light absorbed by dust will be reradiated as a black-body spectrum (or close to ablack-body spectrum). The Wien displacement law states that the maximum of thePlanck function Bλ over wavelength of a black-body at a temperature T is found at awavelength
λmax =2.898 × 10⁻³
TK m . (3.6)
This predicts that the peak of the black-body spectrum from dust at a temperatureof T = 10 K will be at a wavelength λmax = 290 µm, from dust at T = 100 K will beat a wavelength λmax = 29 µm, and for T = 1000 K will be at λmax = 2.9 µm.
The radiation emitted by dust will be found in the infrared, mostly in the mid-infrared, given the expected temperatures of dust. This can be observed, for exampleusing observations from space (such as those made by the IRAS and Spitzer satellites),as diffuse emission superimposed on a reflected starlight spectrum. However, theassociated temperature of the black-body is surprisingly high – T ∼ 103 K – which ismuch hotter than most of the dust. The interpretation of this is that some dust grainsare so small (< 100 atoms) that a single ultraviolet photon packs enough energy toheat them to ∼ 103 K, after which these ‘stochastically heated’ grains cool again byradiating, mostly in the infrared. This process may be part of the explanation forthe correlation between infrared and radio continuum luminosities of galaxies (e.g., at0.1mm and 6 cm), which seems to be independent of galaxy type. The idea is thatultraviolet photons from the formation of massive stars cause stochastic heating ofdust grains, which then reradiate them to give the infrared luminosity. The supernovaeresulting from the same stellar populations produce relativistic electrons which producethe radio continuum as synchrotron emission.
73

Figure 3.4: A region within M16, The Eagle Nebula. This famous Hubble SpaceTelescope image shows detail within a H II region. The blue-green colour from themostly ionised gas is caused by the light of [OIII] and Hβ emission lines from neutralhydrogen atoms. The gas is being ionised by ultraviolet radiation from hot, youngstars off the top of the picture. The dark pillars, in contrast, are regions of cold, densemolecular hydrogen gas in which star formation is occurring. They are dark becausethe cold molecules emit virtually no light and because of the absorption of light bydust mixed with the gas. The ultraviolet radiation is ‘burning’ away the surface ofthe cold gas by photoionisation. [Hubble Space Telescope image produced by NASA,ESA, STScI, J. Hester and P. Scowen (Arizona State University).]
3.15 Star formation
Stars form by the collapse of dense regions of the interstellar medium under their owngravity. This occurs in the cores of molecular clouds, where the gas is cold (∼ 10 K)and densities can exceed 1010 molecules m−3.
A region of cold gas will collapse when its gravitational self-attraction is greaterthan the hydrostatic pressure support. This gravitational instability is often describedby the Jeans length and Jeans mass. For gas of uniform density ρ, the Jeans lengthλJ is the diameter of a region of the gas that is just large enough for the gravitationalforce to exceed the pressure support. It is given by
λJ = cs
√
π
Gρ, (3.7)
where cs is the speed of sound in the gas and G is the constant of gravitation. TheJeans mass is the mass of a region that has a diameter equal to the Jeans length andis therefore
MJ =
(
4
3π(λJ/2)3
)
ρ =π
6ρ λ 3
J . (3.8)
74

The time taken for a region of cold gas to collapse to form a star will depend onthe extent that gas pressure slows the collapse. A limit on the time taken can befound from the free-fall collapse time Tff , which is the time taken for a static cloudto collapse under its own gravity in the absence of gas pressure. The free-fall collapsetime for a spherically symmetric distribution of mass with a total mass M and initialradius R to collapse from rest is
Tff = π
√
R3
8GM=
√
3π
32
1
Gρ, (3.9)
where ρ is the mean density before the collapse starts.Star formation can be self-propagating. Stars will form, heat up and ionise the
cold molecular gas, with the resulting outwards flow of gas compressing gas ahead ofit. This compression causes instabilities that result in local collapse to form new stars.The enhanced density in the spiral arms of our Galaxy and of other spiral galaxiesmeans that star formation occurs preferentially in the arms.
75