Embed Size (px)
Citation preview
Chapter 3
Project Management Details
• Tracking Project Progress
• Project Estimation
• Project Risk Analysis
• Project Organization
• RUP Project Management Workflow
Chapter 3
Tracking project progress
• Do you understand customer problem and needs?
• Can you design a system to solve customer problem or satisfy customer needs?
• How long will it take you to develop the system?
• How much will it cost to develop the system?
Chapter 3
Project deliverables
• Documents
• Demonstrations of function
• Demonstrations of subsystems
• Demonstrations of accuracy
• Demonstrations of reliability, performance or security
Chapter 3
Milestones and activities• Activity: takes place over a period of time
• Milestone: completion of an activity -- a particular point in time
• Precursor: event or set of events that must occur in order for an activity to start
• Duration: length of time needed to complete an activity
• Due date: date by which an activity must be completed
Chapter 3
Slack or float time
Slack time = available time - real time
= latest start time - earliest start time
Chapter 3
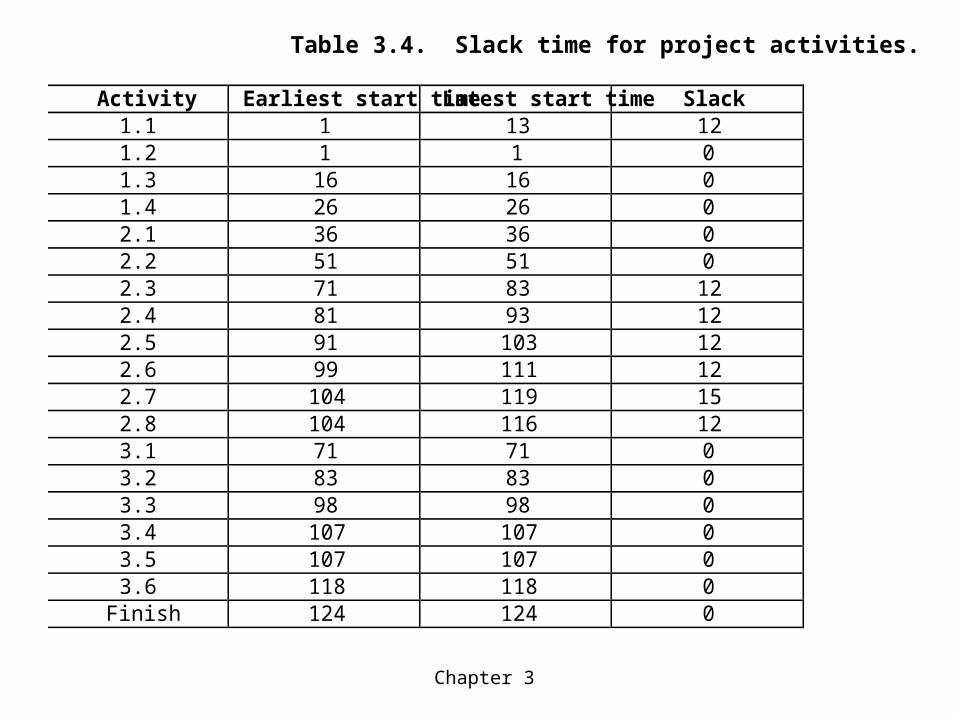
Table 3.4. Slack time for project activities.
Activity Earliest start time Latest start time Slack1.1 1 13 121.2 1 1 01.3 16 16 01.4 26 26 02.1 36 36 02.2 51 51 02.3 71 83 122.4 81 93 122.5 91 103 122.6 99 111 122.7 104 119 152.8 104 116 123.1 71 71 03.2 83 83 03.3 98 98 03.4 107 107 03.5 107 107 03.6 118 118 0
Finish 124 124 0
Chapter 3
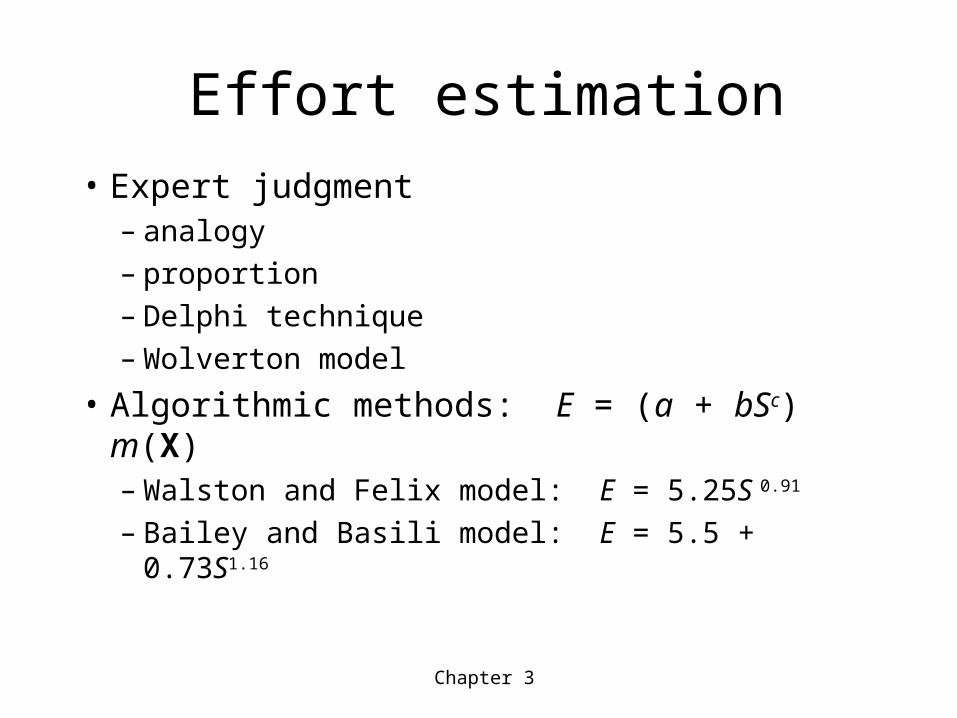
Effort estimation
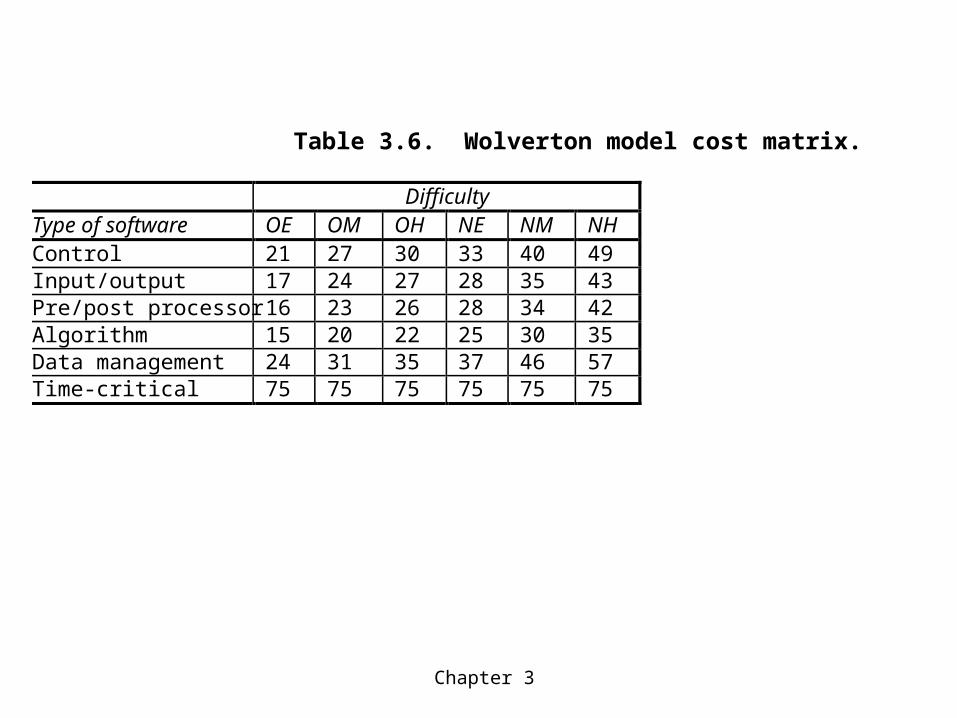
• Expert judgment– analogy– proportion– Delphi technique– Wolverton model
• Algorithmic methods: E = (a + bSc) m(X)– Walston and Felix model: E = 5.25S 0.91
– Bailey and Basili model: E = 5.5 + 0.73S1.16
Chapter 3
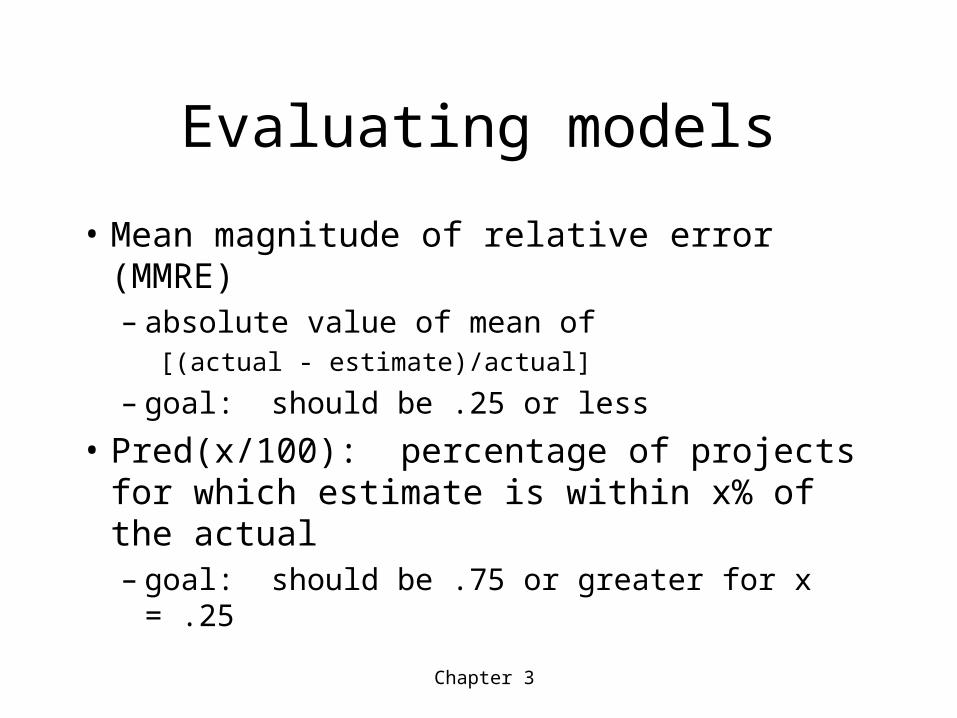
Evaluating models
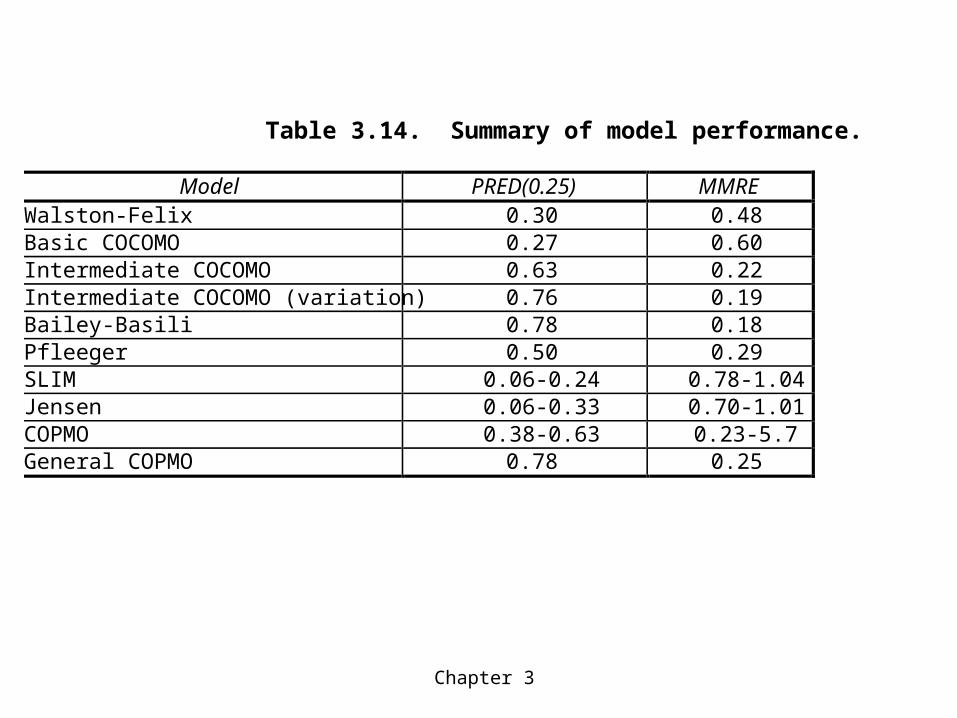
• Mean magnitude of relative error (MMRE)– absolute value of mean of
[(actual - estimate)/actual]
– goal: should be .25 or less
• Pred(x/100): percentage of projects for which estimate is within x% of the actual– goal: should be .75 or greater for x = .25
Chapter 3
Table 3.14. Summary of model performance.
Model PRED(0.25) MMREWalston-Felix 0.30 0.48Basic COCOMO 0.27 0.60Intermediate COCOMO 0.63 0.22Intermediate COCOMO (variation) 0.76 0.19Bailey-Basili 0.78 0.18Pfleeger 0.50 0.29SLIM 0.06-0.24 0.78-1.04Jensen 0.06-0.33 0.70-1.01COPMO 0.38-0.63 0.23-5.7General COPMO 0.78 0.25
Chapter 3
Table 3.6. Wolverton model cost matrix.
DifficultyType of software OE OM OH NE NM NHControl 21 27 30 33 40 49Input/output 17 24 27 28 35 43Pre/post processor 16 23 26 28 34 42Algorithm 15 20 22 25 30 35Data management 24 31 35 37 46 57Time-critical 75 75 75 75 75 75
Chapter 3
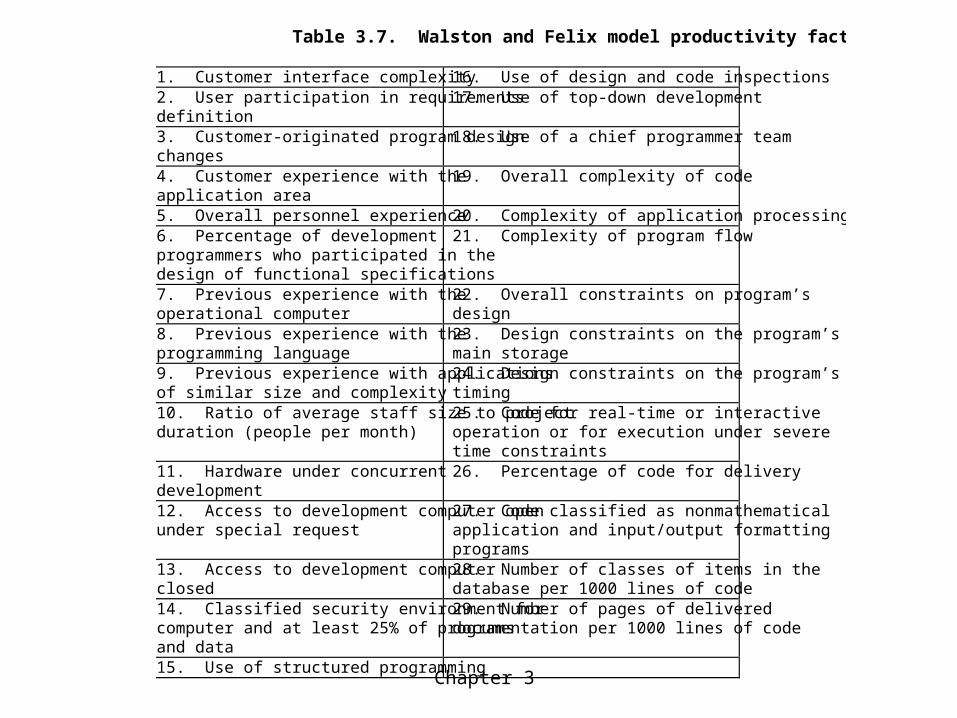
Table 3.7. Walston and Felix model productivity factors.
1. Customer interface complexity 16. Use of design and code inspections2. User participation in requirementsdefinition
17. Use of top-down development
3. Customer-originated program designchanges
18. Use of a chief programmer team
4. Customer experience with theapplication area
19. Overall complexity of code
5. Overall personnel experience 20. Complexity of application processing6. Percentage of developmentprogrammers who participated in thedesign of functional specifications
21. Complexity of program flow
7. Previous experience with theoperational computer
22. Overall constraints on program’sdesign
8. Previous experience with theprogramming language
23. Design constraints on the program’smain storage
9. Previous experience with applicationsof similar size and complexity
24. Design constraints on the program’stiming
10. Ratio of average staff size to projectduration (people per month)
25. Code for real-time or interactiveoperation or for execution under severetime constraints
11. Hardware under concurrentdevelopment
26. Percentage of code for delivery
12. Access to development computer openunder special request
27. Code classified as nonmathematicalapplication and input/output formattingprograms
13. Access to development computerclosed
28. Number of classes of items in thedatabase per 1000 lines of code
14. Classified security environment forcomputer and at least 25% of programsand data
29. Number of pages of delivereddocumentation per 1000 lines of code
15. Use of structured programming
Chapter 3
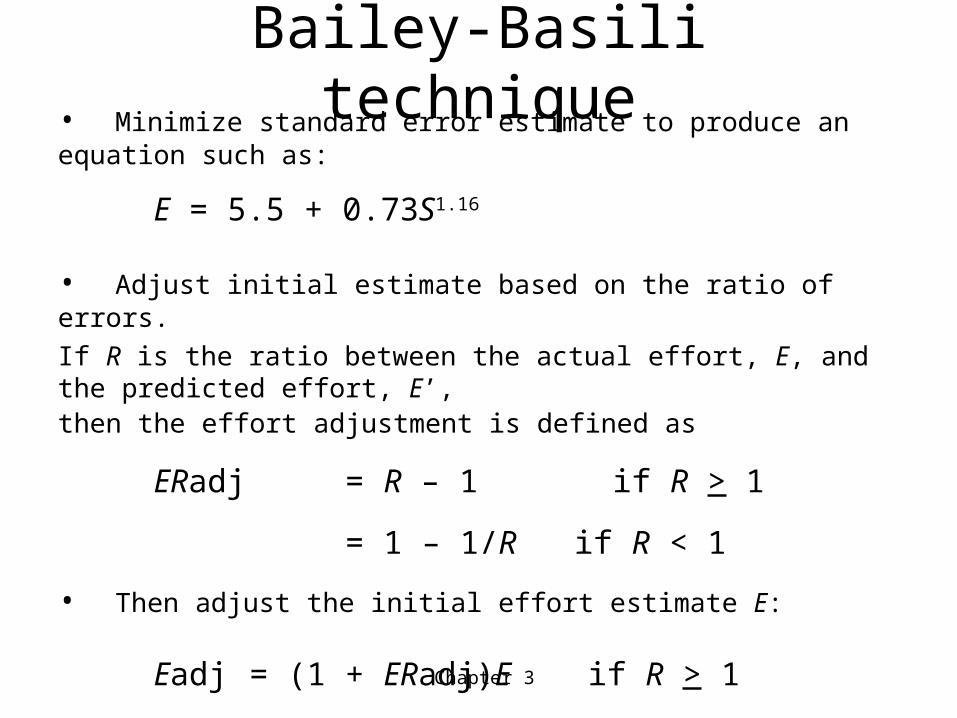
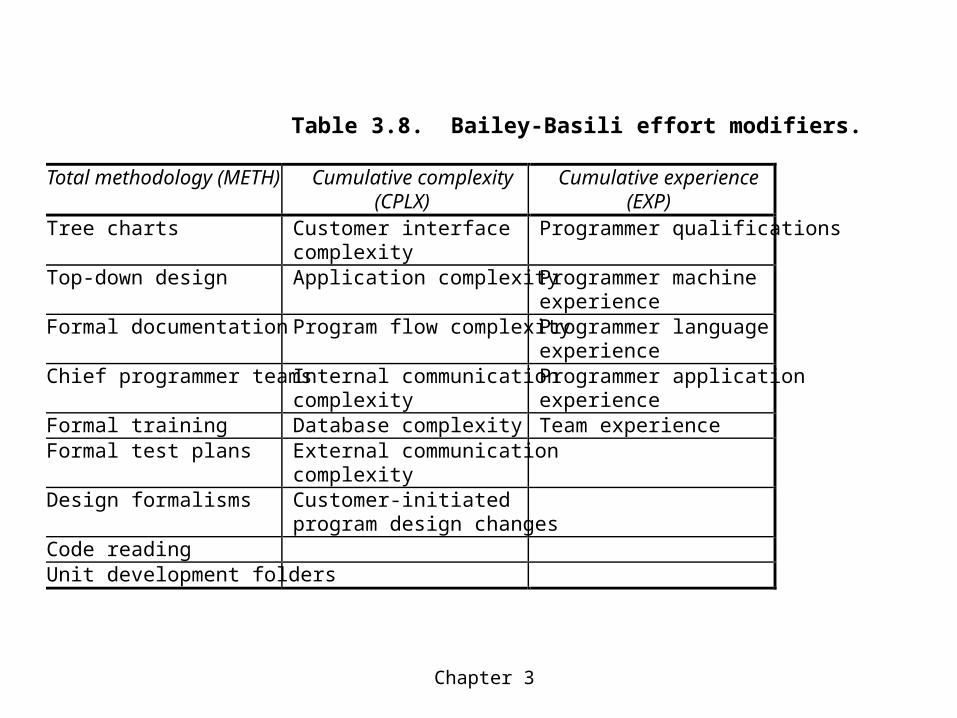
Bailey-Basili technique• Minimize standard error estimate to produce an equation such as:
E = 5.5 + 0.73S1.16
• Adjust initial estimate based on the ratio of errors.
If R is the ratio between the actual effort, E, and the predicted effort, E’, then the effort adjustment is defined as
ERadj = R – 1 if R > 1
= 1 – 1/R if R < 1
• Then adjust the initial effort estimate E:
Eadj = (1 + ERadj)E if R > 1
= E/(1 + ERadj) if R < 1
Chapter 3
Table 3.8. Bailey-Basili effort modifiers.
Total methodology (METH) Cumulative complexity(CPLX)
Cumulative experience(EXP)
Tree charts Customer interfacecomplexity
Programmer qualifications
Top-down design Application complexity Programmer machineexperience
Formal documentation Program flow complexity Programmer languageexperience
Chief programmer teams Internal communicationcomplexity
Programmer applicationexperience
Formal training Database complexity Team experienceFormal test plans External communication
complexityDesign formalisms Customer-initiated
program design changesCode readingUnit development folders
Chapter 3
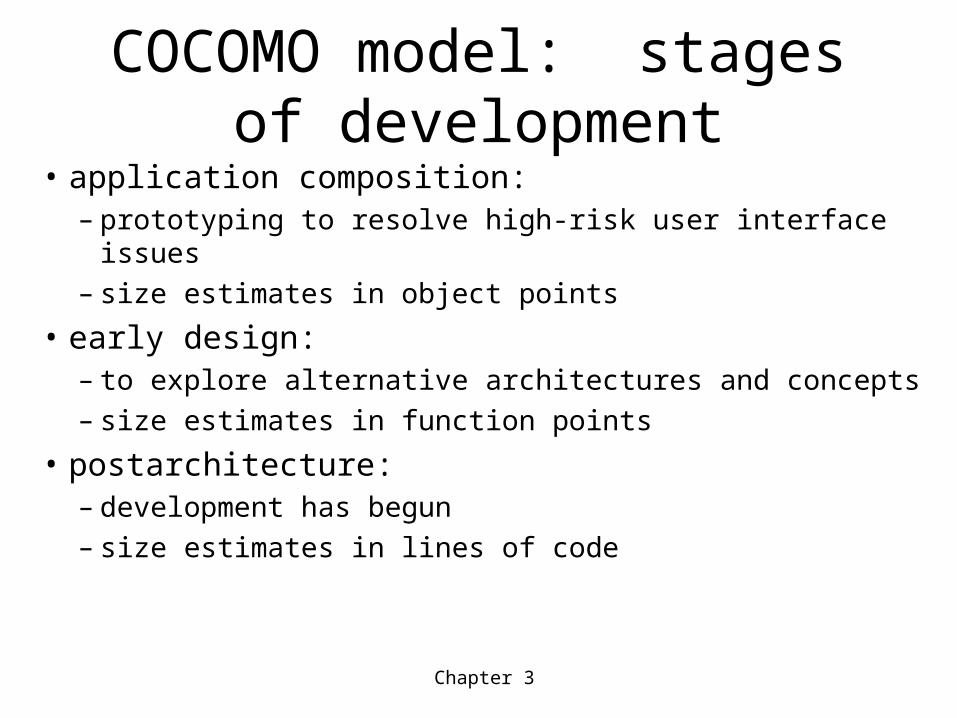
COCOMO model: stages of development
• application composition: – prototyping to resolve high-risk user interface issues– size estimates in object points
• early design: – to explore alternative architectures and concepts– size estimates in function points
• postarchitecture:– development has begun– size estimates in lines of code
Chapter 3
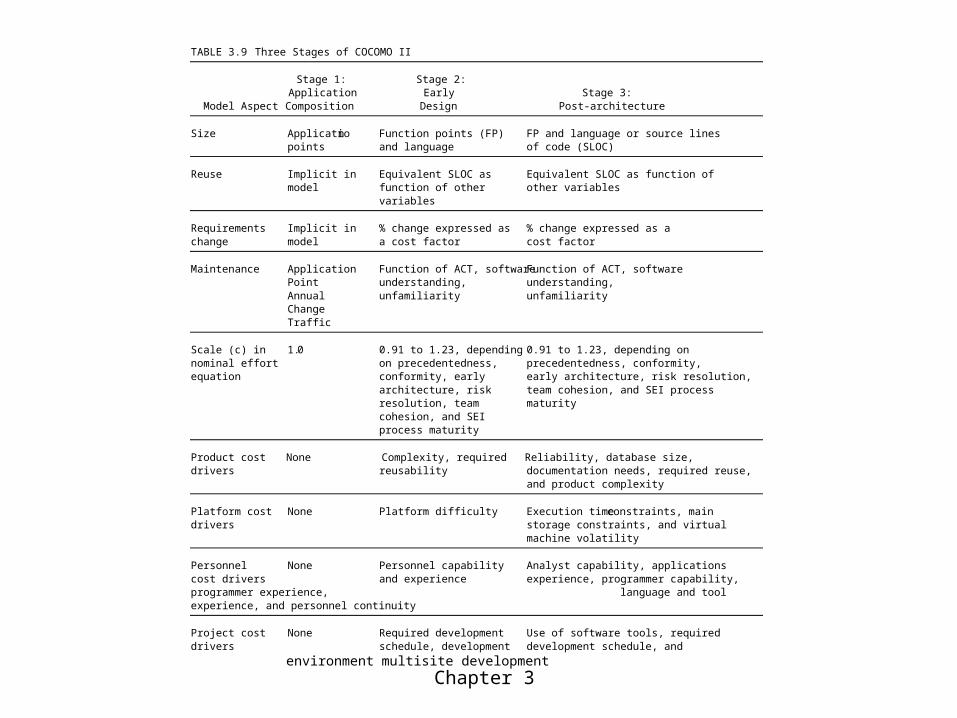
TABLE 3.9 Three Stages of COCOMO II
Stage 1: Stage 2:Application Early Stage 3:
Model Aspect Composition Design Post-architecture
Size Application Function points (FP) FP and language or source linespoints and language of code (SLOC)
Reuse Implicit in Equivalent SLOC as Equivalent SLOC as function ofmodel function of other other variables
variables
Requirements Implicit in % change expressed as % change expressed as achange model a cost factor cost factor
Maintenance Application Function of ACT, software Function of ACT, softwarePoint understanding, understanding,Annual unfamiliarity unfamiliarityChangeTraffic
Scale (c) in 1.0 0.91 to 1.23, depending 0.91 to 1.23, depending onnominal effort on precedentedness, precedentedness, conformity,equation conformity, early early architecture, risk resolution,
architecture, risk team cohesion, and SEI processresolution, team maturitycohesion, and SEIprocess maturity
Product cost None Complexity, required Reliability, database size,drivers reusability documentation needs, required reuse,
and product complexity
Platform cost None Platform difficulty Execution time constraints, maindrivers storage constraints, and virtual
machine volatility
Personnel None Personnel capability Analyst capability, applicationscost drivers and experience experience, programmer capability,programmer experience, language and toolexperience, and personnel continuity
Project cost None Required development Use of software tools, requireddrivers schedule, development development schedule, and
environment multisite development
Chapter 3
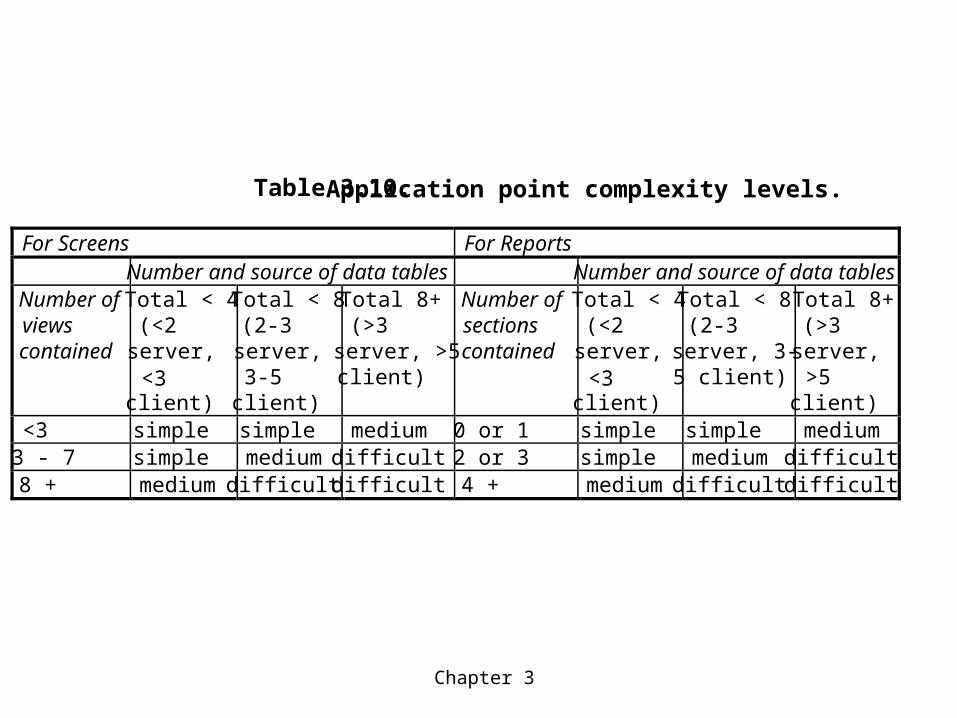
Table 3.10. Application point complexity levels.
For Screens For ReportsNumber and source of data tables Number and source of data tables
Number ofviewscontained
Total < 4(<2server,<3client)
Total < 8(2-3server,3-5client)
Total 8+(>3server, >5client)
Number ofsectionscontained
Total < 4(<2server,<3client)
Total < 8(2-3server, 3-5 client)
Total 8+(>3server,>5client)
<3 simple simple medium 0 or 1 simple simple medium3 - 7 simple medium difficult 2 or 3 simple medium difficult8 + medium difficult difficult 4 + medium difficult difficult
Chapter 3
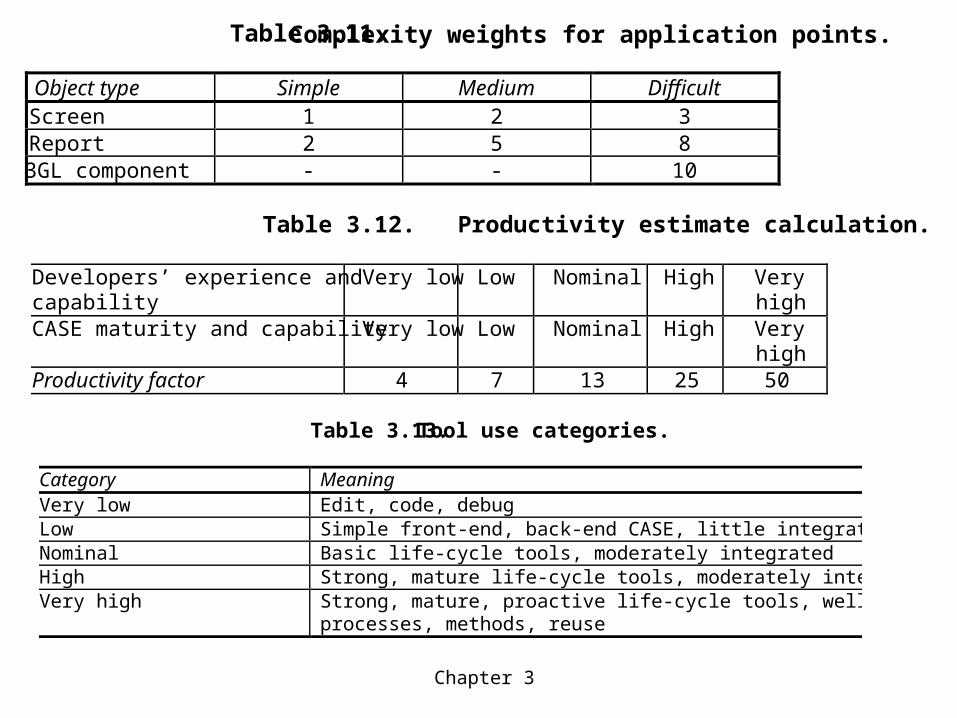
Table 3.11. Complexity weights for application points.
Object type Simple Medium DifficultScreen 1 2 3Report 2 5 83GL component - - 10
Table 3.12. Productivity estimate calculation.
Developers’ experience andcapability
Very low Low Nominal High Veryhigh
CASE maturity and capability Very low Low Nominal High Veryhigh
Productivity factor 4 7 13 25 50
Table 3.13. Tool use categories.
Category MeaningVery low Edit, code, debugLow Simple front-end, back-end CASE, little integrationNominal Basic life-cycle tools, moderately integratedHigh Strong, mature life-cycle tools, moderately integratedVery high Strong, mature, proactive life-cycle tools, well-integrated with
processes, methods, reuse
Chapter 3
Machine learning techniques
• Example: case-based reasoning– user identifies new problem as a case– system retrieves similar cases from repository– system reuses knowledge from previous cases– system suggests solution for new case
• Example: neural network– cause-effect network “trained” with data from
past history
Chapter 3
Project Estimation Links
• http://sunset.usc.edu/research/COCOMOII/index.html
• http://www.starbase.com/products/tools.asp?ID=1900
• http://www-cs.etsu-tn.edu/softeng/
• http://www.construx.com/estimate/home.htm
• http://dec.bournemouth.ac.uk/ESERG/ANGEL/
• http://risex.insead.fr/rise/index.htm
• http://www.brunel.ac.uk/~csstmmh2/exe11.html
• http://www.softengprod.com/
• http://www.itworld.com/Career/2019/ITW-estimation-020901/
• http://www.ifi.uio.no/~best/
Chapter 3
Risk management requirements
• Risk impact: the loss associated with the event
• Risk probability: the likelihood that the event will occur
• Risk control: the degree to which we can change the outcome
Risk exposure = (risk probability) x (risk impact)
Chapter 3
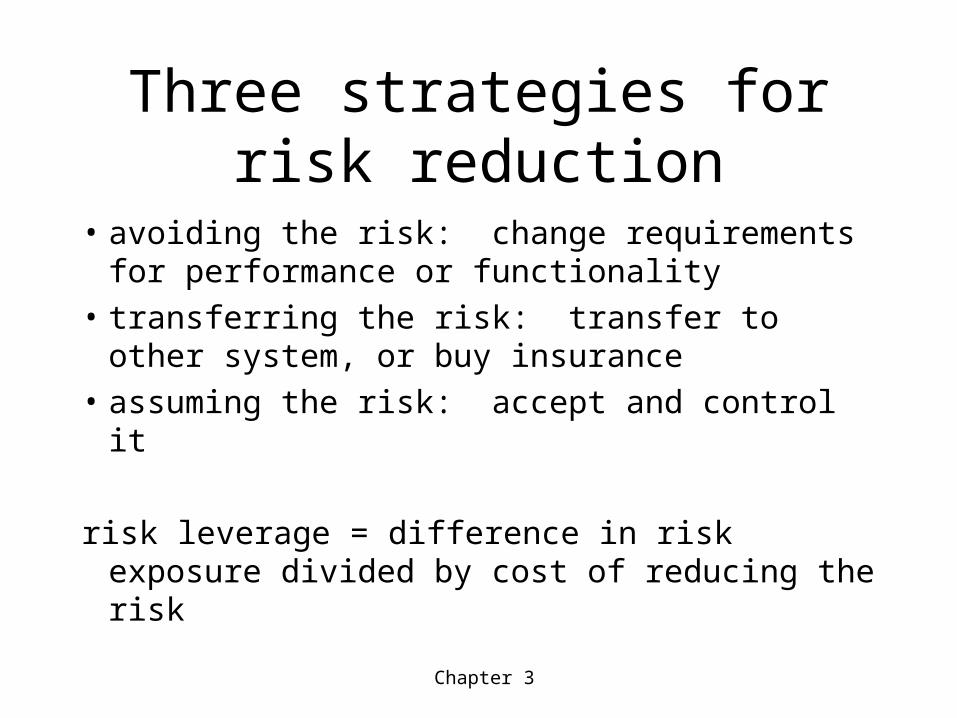
Three strategies for risk reduction
• avoiding the risk: change requirements for performance or functionality
• transferring the risk: transfer to other system, or buy insurance
• assuming the risk: accept and control it
risk leverage = difference in risk exposure divided by cost of reducing the risk
Chapter 3
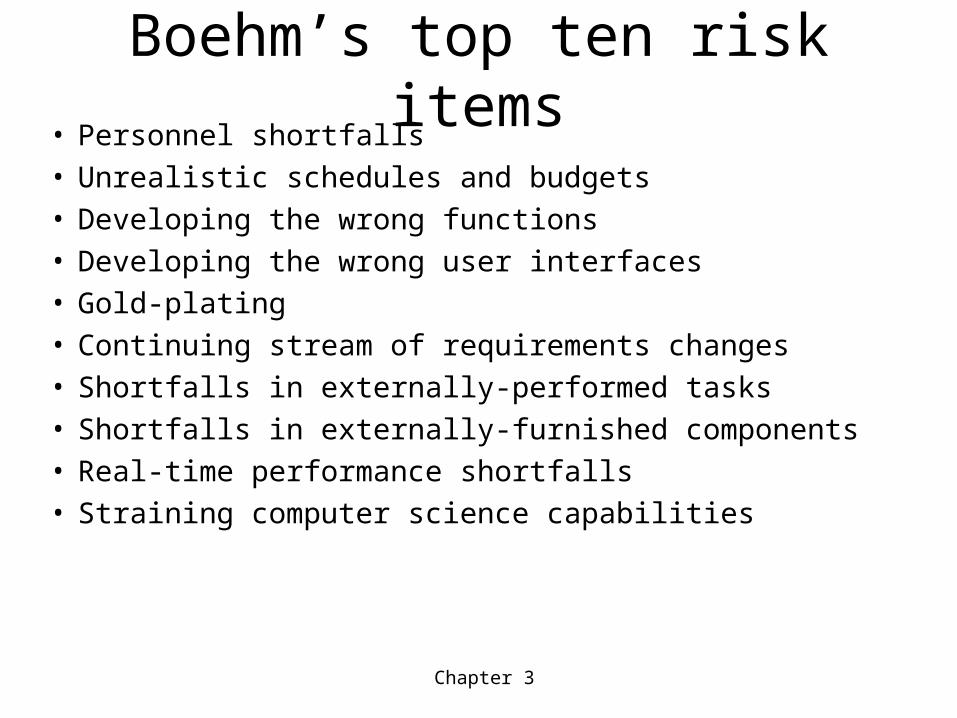
Boehm’s top ten risk items• Personnel shortfalls• Unrealistic schedules and budgets• Developing the wrong functions• Developing the wrong user interfaces• Gold-plating• Continuing stream of requirements changes• Shortfalls in externally-performed tasks• Shortfalls in externally-furnished components• Real-time performance shortfalls• Straining computer science capabilities
Chapter 3
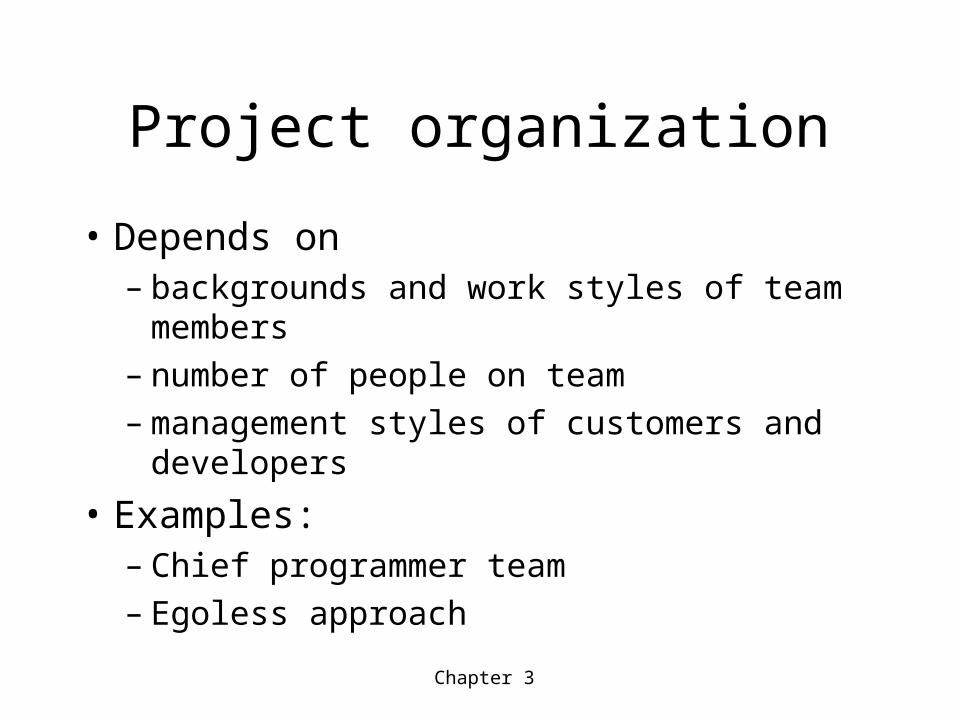
Project organization
• Depends on– backgrounds and work styles of team members– number of people on team– management styles of customers and
developers
• Examples:– Chief programmer team– Egoless approach
Chapter 3
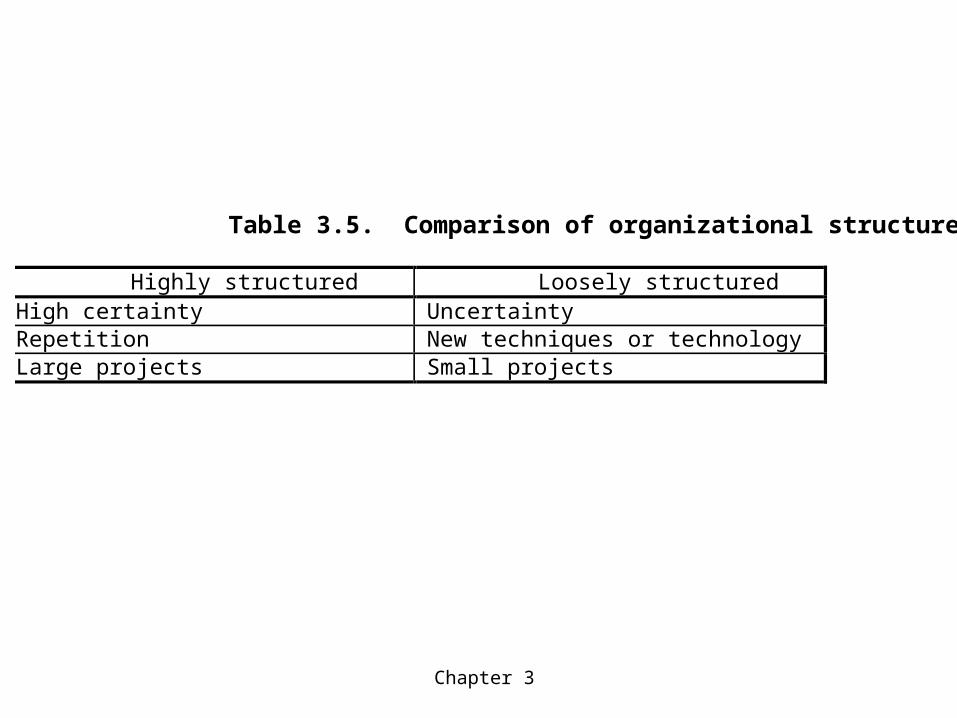
Table 3.5. Comparison of organizational structures.
Highly structured Loosely structuredHigh certainty UncertaintyRepetition New techniques or technologyLarge projects Small projects
Chapter 3
Digital Alpha AXP: Enrollment management model
• Establish an appropriately large shared vision
• Delegate completely and elicit specific commitments from participants
• Inspect vigorously and provide supportive feedback
• Acknowledge every advance and learn as the program progresses
Chapter 3
Lockheed Martin: Accountability modeling
• Matrix organization– Each engineer belongs to a functional unit based on
type of skill
• Integrated product development team– Combines people from different functional units into
interdisciplinary work unit
• Each activity tracked using cost estimation, critical path analysis, schedule tracking– Earned value a common measure for progress
Chapter 3
Anchoring milestones
• Objectives: Why is the system being developed?• Milestones and schedules: What will be done by when?• Responsibilities: Who is responsible for a function?• Approach: How will the job be done, technically and
managerially?• Resources: How much of each resource is needed?• Feasibility: Can this be done, and is there a good
business reason for doing it?
Chapter 3
Project plan contents
• project scope• project schedule• project team organization• technical description of
system• project standards and
procedures• quality assurance plan• configuration management
plan
• documentation plan• data management plan• resource management
plan• test plan• training plan• security plan• risk management plan• maintenance plan
Chapter 3
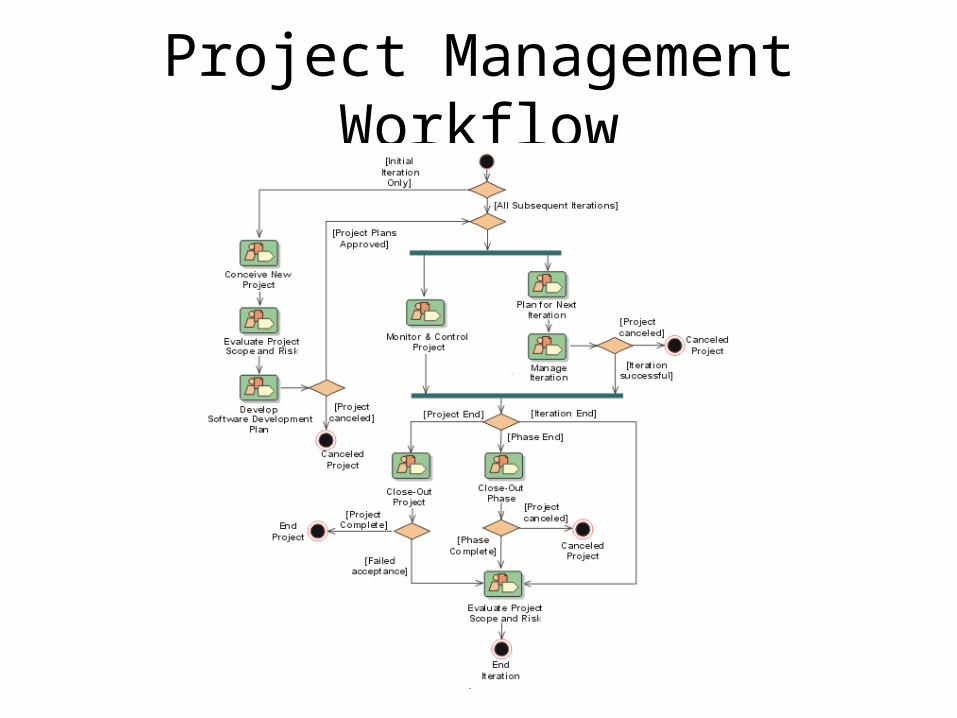
Project Management Workflow
Chapter 3
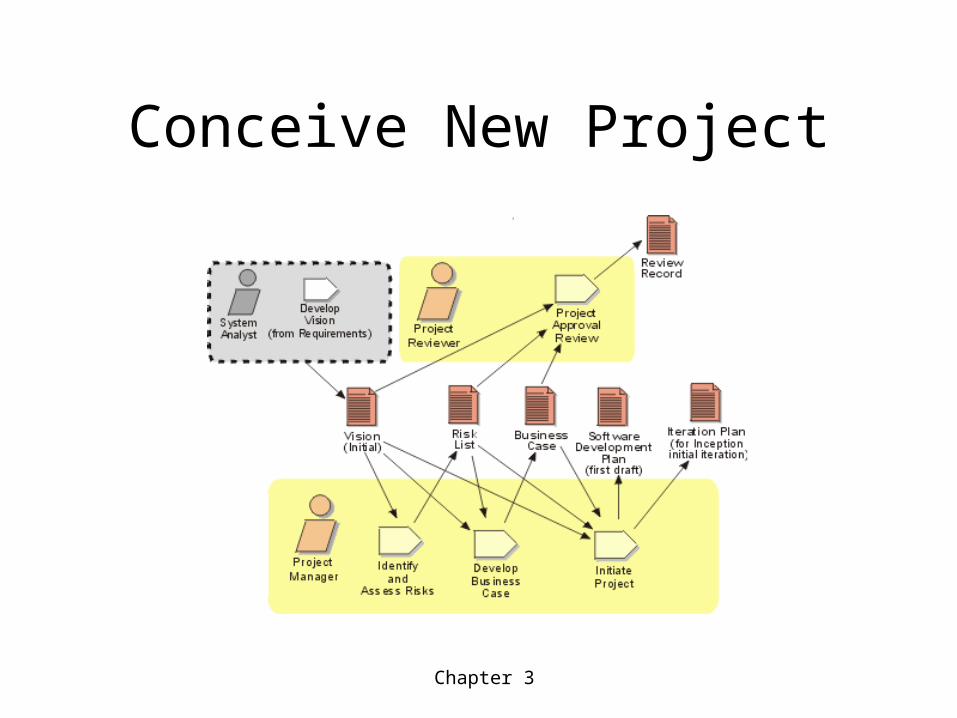
Conceive New Project
Chapter 3
Conceive New Project Steps
• Identify Potential Risks
• Analyze and Prioritize Risks
• Identify Risk Avoidance Strategies
• Identify Risk Mitigation Strategies
• Identify Risk Contingency Strategies
• Revisiting Risks during the Iteration
• Revisiting Risks at the End of an Iteration
Chapter 3
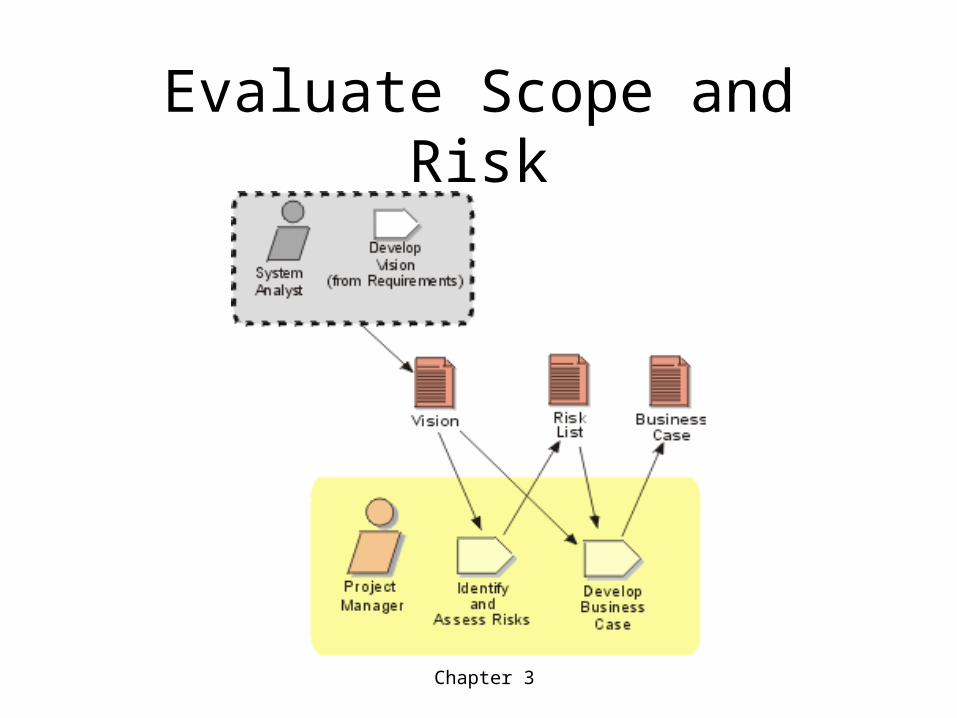
Evaluate Scope and Risk
Chapter 3
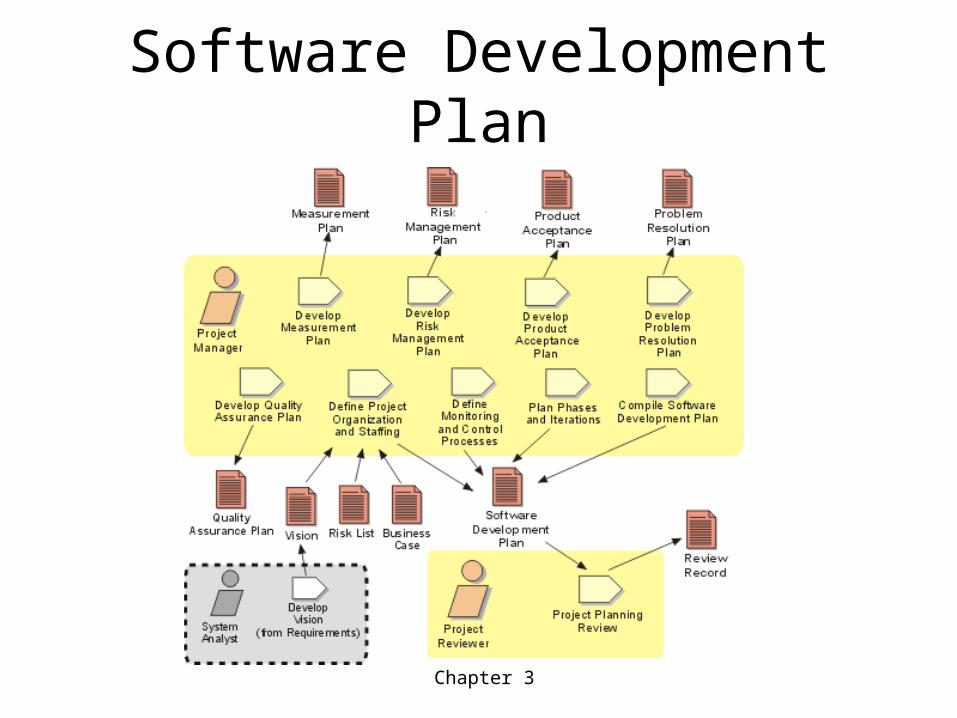
Software Development Plan
Chapter 3
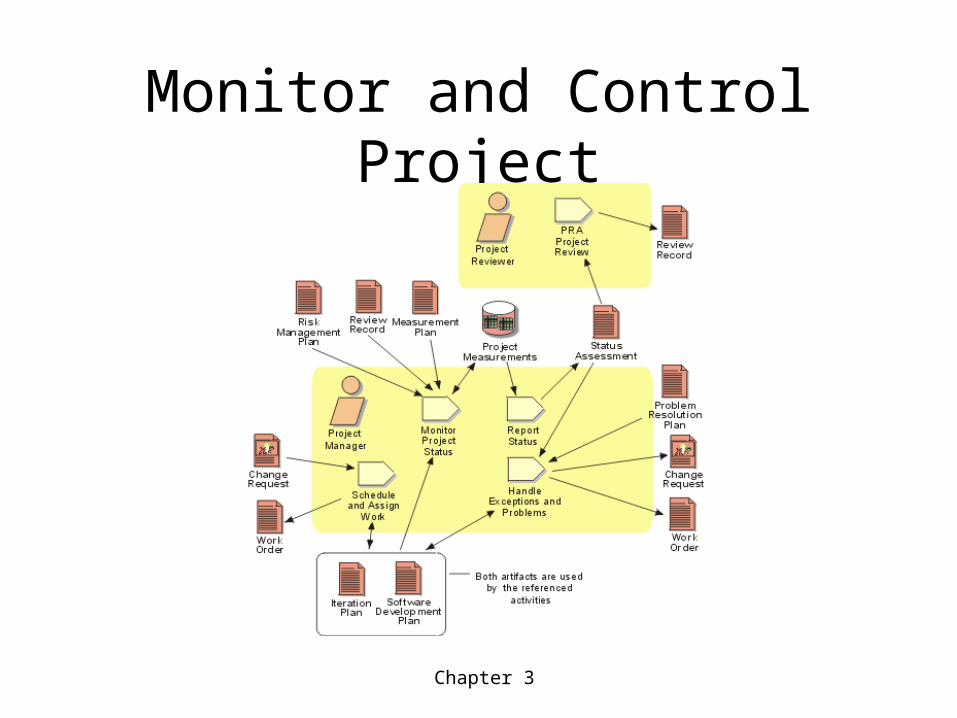
Monitor and Control Project

Chapter 3
Plan for Next Iteration
Chapter 3
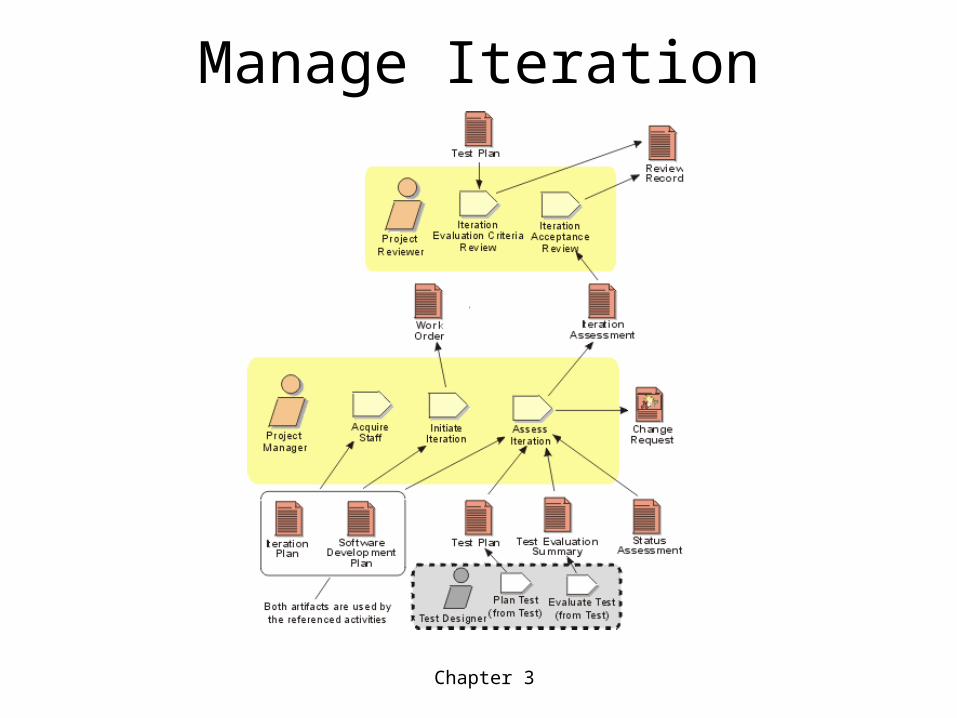
Manage Iteration
Chapter 3
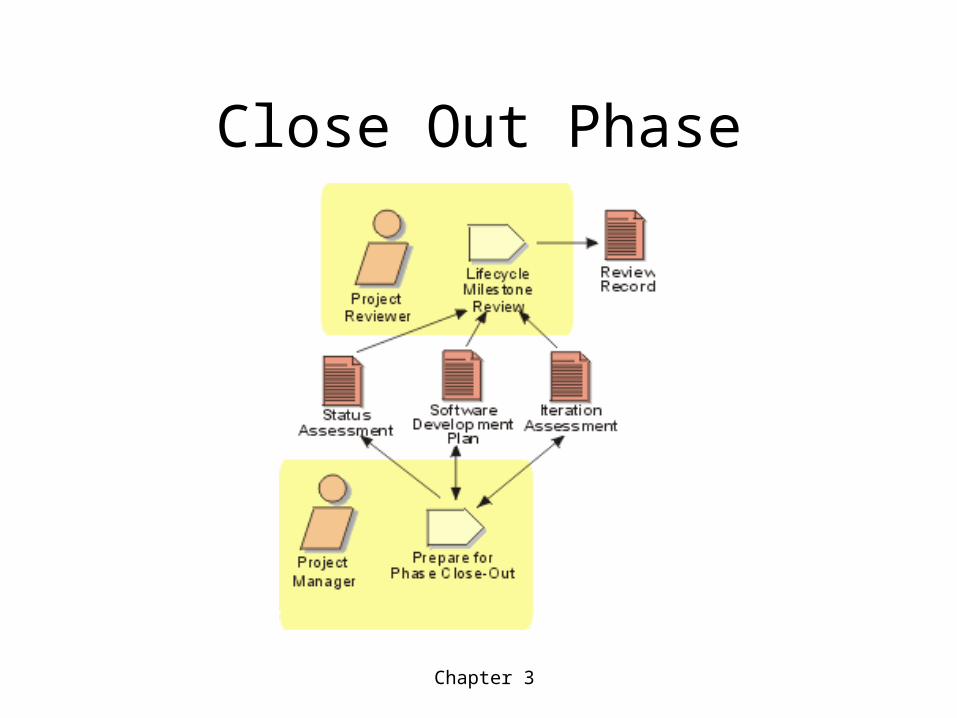
Close Out Phase
Chapter 3
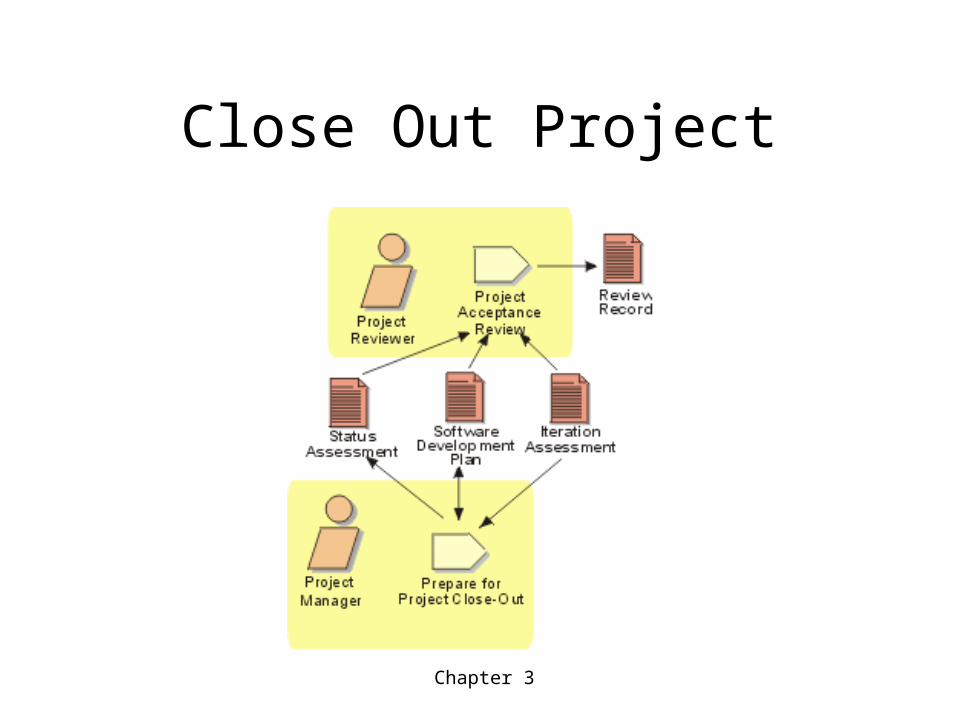
Close Out Project
Chapter 3
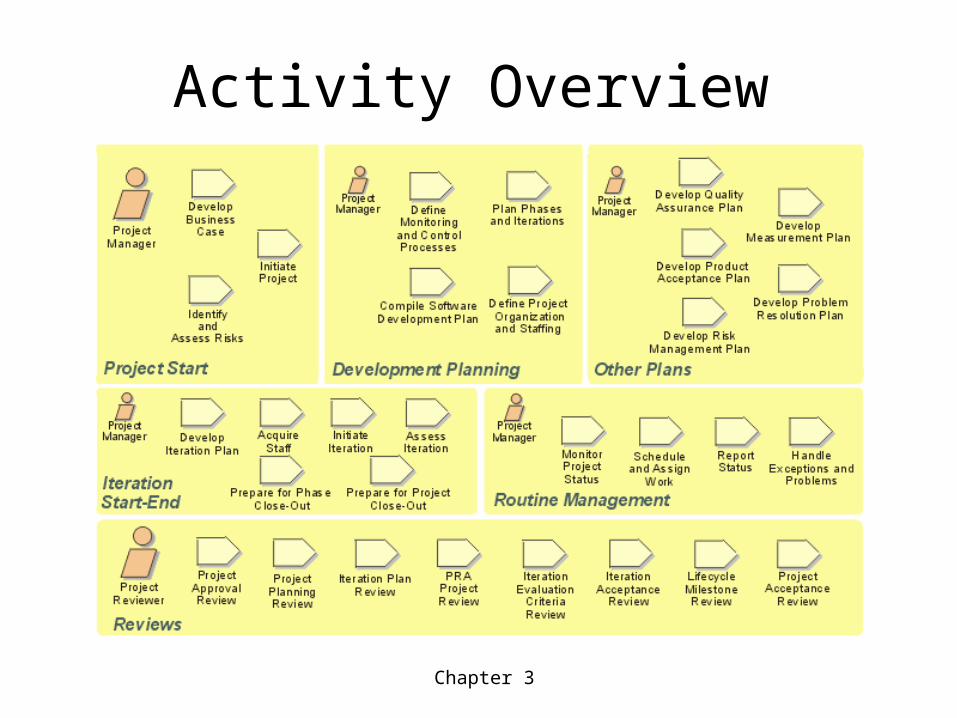
Activity Overview
Chapter 3
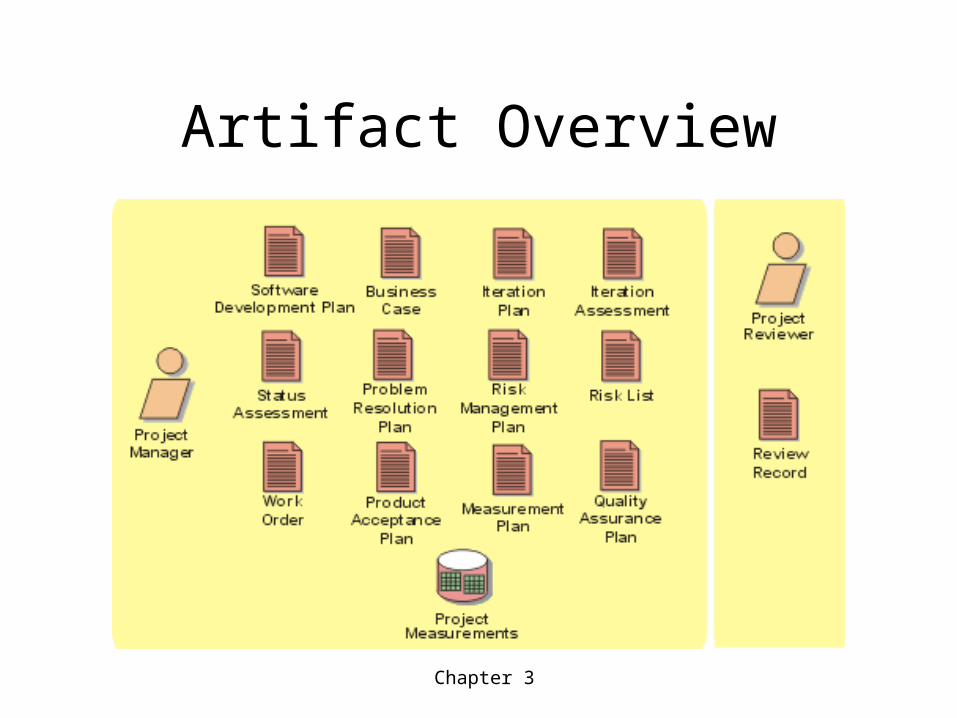
Artifact Overview