Embed Size (px)
Citation preview
Chapter 3: Commercial and Industrial Lighting Controls Evaluation Protocol
Stephen Carlson, DNV KEMA Subcontract Report NREL/SR-7A30-53827 April 2013
3 - 1
Chapter 3 – Table of Contents 1 Measure Description .............................................................................................................. 2 2 Application Conditions of Protocol ....................................................................................... 3 3 Savings Calculations .............................................................................................................. 5
3.1 Algorithms ....................................................................................................................... 5 4 Role of the Lighting Control Program Implementer .............................................................. 7
4.1 Implementation Data Requirements ................................................................................ 7 4.2 Implementation Data Collection Method ......................................................................... 7
5 Role of the Evaluator ............................................................................................................. 9 5.1 Evaluator Data Requirements .......................................................................................... 9 5.2 Evaluator Data Collection Method .................................................................................. 9
6 Measurement and Verification Plan ..................................................................................... 10 6.1 IPMVP Option ............................................................................................................... 10 6.2 Verification Process ....................................................................................................... 11 6.3 Measurement Process..................................................................................................... 12 6.4 Report M&V Savings .................................................................................................... 13 6.5 Data Requirements and Sources .................................................................................... 14
7 Other Evaluation Issues ....................................................................................................... 17 7.1 New Construction .......................................................................................................... 17 7.2 Coincidence Factor ........................................................................................................ 17
8 Program Evaluation Elements.............................................................................................. 18 9 Resources ............................................................................................................................. 19 10 Appendix .............................................................................................................................. 20
List of Tables Table 1: Required Lighting Control Data Fields........................................................................................... 8 Table 2: Lighting Control Data Required by Evaluator ................................................................................ 9 Table 3: Metering Requirements for Various Lighting Control Strategies ................................................. 11 Table 4: Lighting Control Savings Factors by Control Type ...................................................................... 15 Table 5: New York Standard Approach for Estimating Energy Savings from Energy Efficiency Programs New York Department of Public Service Appendix C: Standard Fixture Watts (excerpt, page 270) ........ 20
3 - 2
1 Measure Description This Commercial and Industrial Lighting Controls Evaluation Protocol (the protocol) describes methods to account for energy savings resulting from programmatic installation of lighting control equipment in large populations of commercial, industrial, government, institutional, and other nonresidential facilities. This protocol does not address savings resulting from changes in codes and standards, or from education and training activities.1 When lighting controls are installed in conjunction with a lighting retrofit project, the lighting control savings must be calculated parametrically with the lighting retrofit project so savings are not double counted.2
An “energy efficiency measure” can be defined as a set of actions and equipment changes― compared to standard or existing practices―resulting in reduced energy use, while maintaining the same or improved service levels for customers or processes.
In addition to delivering light levels required for activities or processes in facilities, lighting control measures shut off lighting fixtures when a space is unoccupied, or operate lighting at reduced power when ambient light levels are high. For retrofit installations, the baseline condition typically equals the lighting operating at normal power levels or when the space is both occupied and unoccupied during normal business hours.3 New construction baseline conditions are generally provided by state and local building codes. Although codes vary widely throughout the country, typically they require some form of control for most interior lighting. This document includes a detailed discussion of baselines.
Lighting control measures in commercial, industrial, and other nonresidential facilities include:
• Sweep controls/energy management systems that shut off lighting at a set time, typically after normal operating hours
• Lighting occupancy sensors (OS) that turn lights on or off, based on space occupancy conditions
• Dimming control systems:
o Stepped dimming systems, such as dual ballasts (inboard/outboard)
o Dual ballast high/low high-intensity discharge (HID)4
o Continuous daylight dimming systems.
1 This protocol addresses only automated lighting control measures, which do not require behavioral actions by
space occupants (such as “tuning” light levels for different tasks). 2 Typically, post-lighting retrofit wattages are used to calculate the lighting controlled kilowatt (kW) value for
lighting control savings calculations. 3 In this case “normal” refers to fixtures operating at full power, and is applicable for all forms of lighting control
applications during business operating hours. 4 Such HID fixtures typically have only one lamp that can be operated at two different output levels by a two
stage ballast; this differs from stepped dimming systems that dim by controlling lamps powered by a single ballast.
3 - 3
2 Application Conditions of Protocol Historically, lighting control equipment has accounted for a relatively small portion of cost-effective, electric energy efficiency resources in the United States. However, use of lighting controls has been increasing due to building efficiency certification standards (such as Leadership in Energy and Environmental Design) and the increased prevalence of demand-response programs.
Typically, lighting controls do not provide a sufficiently large component of an energy efficiency program to warrant their own evaluation efforts, so these measures tend to be included as small parts of commercial and industrial program evaluation. Thus, little effort has been expended to move beyond post-installation metering or applying a 30% control savings factor (CSF).5
This evaluation protocol assumes a focus on lighting controls, and that primary data captured will be used to inform the evaluation, or to determine deemed savings in a technical reference manual. By following the methods presented here, evaluators can determine energy savings resulting from lighting controls installed through efficiency programs in a manner that is consistent across jurisdictions or regions. Resulting data will provide planners, policymakers, regulators, and others with sound, comparable information for use in comprehensive energy planning.6
The protocol applies to installation of commercial, industrial, and nonresidential lighting control measures in customer facilities; installations result from energy efficiency programs, which have varying delivery methods, depending on target markets and customer types. Primarily, the delivery method can be distinguished by parties receiving incentive payments from a program. Although methods described in this protocol apply to all programs, issues with customer and baseline equipment data vary with each. Common program delivery types include:
1. Incentive and Rebate: Under this delivery method, administrators pay program participants in target markets for installing lighting control measures. Participants receive an incentive payment, based on annual energy savings ($/kilowatt-hour [kWh]) for each installed measure, or based on demand savings ($/kW). Participants include design teams, contractors, building owners, and building managers. Savings can be estimated through one or more of the following techniques:
o Simple engineering calculations
o A measurement and verification (M&V) process that measures key parameters, such as equivalent full load hours (EFLH), controlled fixture wattages, or a CSF as part of project implementation.
Programs also may pay rebates for specific lighting control equipment types (for example, ceiling-mounted OS), with the program using assumptions about “replaced
5 The 30% savings percentage for OS has been adopted and borrowed in so many technical reference manuals
and public savings documents that its exact origin is difficult to trace. Table 4 in this document is an ASHRAE table of control savings factors, and the values range from 0.10 to 0.40 depending on the type of control.
6 As discussed in Considering Resource Constraints in the “Introduction” of this UMP report, small utilities (as defined under the Small Business Administration regulations) may face additional constraints in undertaking this protocol. Therefore, alternative methodologies should be considered for such utilities.
3 - 4
equipment.” Thus, increased administrative efficiency is exchanged for less certainty about baseline conditions and, therefore, savings. This type of program implementation approach is often referred to as a “deemed” savings approach where savings are developed on a per unit basis and very little site-specific information is required to determine the claimed (ex ante) program savings estimate.
Incentive programs often collect more detailed baseline data than do rebate programs. This includes extensive data about controlled equipment wattages and hours of operation, which facilitates determination of savings impacts, typically using a savings calculation based on these site-specific data. Although rebate programs typically begin with useful information regarding the quantity of lighting control equipment, these programs do not always collect data about controlled fixtures, because it is not necessary to calculate the claimed program savings.
2. Direct Install: Using this delivery method, contractors engaged through a program install lighting control equipment in customer facilities. The programs pay contractors directly, while customers receive a lighting control measure free or at a reduced cost. Direct-install programs target hard-to-reach customers—typically small businesses—overlooked by contractors working through incentive and rebate programs. Direct-install programs typically do not focus on lighting control measures, but they may be eligible measures.
In addition to their distinctive delivery methods, commercial, industrial, and nonresidential lighting programs (which include lighting controls) can be classified as targeting retrofit (serving existing facilities) or new construction markets. The program delivery types described above apply to existing building programs. New construction programs primarily employ incentives and rebates to acquire energy efficiency reductions.
New construction programs present evaluators with a dilemma in establishing baselines for buildings that previously did not exist. This problem can be addressed by referring to new construction energy codes for commercial, industrial, and nonresidential facilities (usually by referencing ASHRAE Standard 90.1 or the International Energy Conservation Code). The ASHRAE Standard defines lighting controls under section 9.4.1; these are mandatory for interior lighting in buildings larger than 5,000 ft2.7 Other federal, state, and local standards may establish additional baseline constraints on lighting controls.
7 ASHRAE 90.1, 2004, page 61 addresses mandatory provisions and exceptions for lighting controls in newly
constructed buildings.
3 - 5
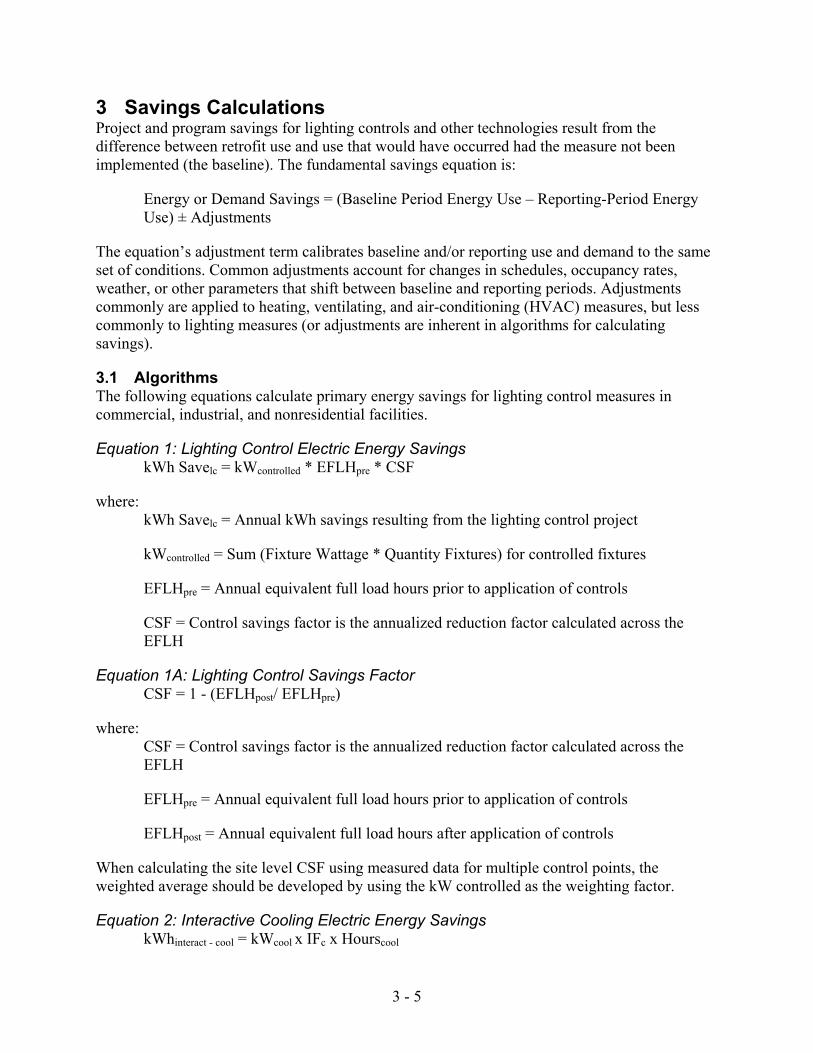
3 Savings Calculations Project and program savings for lighting controls and other technologies result from the difference between retrofit use and use that would have occurred had the measure not been implemented (the baseline). The fundamental savings equation is:
Energy or Demand Savings = (Baseline Period Energy Use – Reporting-Period Energy Use) ± Adjustments
The equation’s adjustment term calibrates baseline and/or reporting use and demand to the same set of conditions. Common adjustments account for changes in schedules, occupancy rates, weather, or other parameters that shift between baseline and reporting periods. Adjustments commonly are applied to heating, ventilating, and air-conditioning (HVAC) measures, but less commonly to lighting measures (or adjustments are inherent in algorithms for calculating savings).
3.1 Algorithms The following equations calculate primary energy savings for lighting control measures in commercial, industrial, and nonresidential facilities.
Equation 1: Lighting Control Electric Energy Savings kWh Savelc = kWcontrolled * EFLHpre * CSF
where: kWh Savelc = Annual kWh savings resulting from the lighting control project
kWcontrolled = Sum (Fixture Wattage * Quantity Fixtures) for controlled fixtures
EFLHpre = Annual equivalent full load hours prior to application of controls
CSF = Control savings factor is the annualized reduction factor calculated across the EFLH
Equation 1A: Lighting Control Savings Factor CSF = 1 - (EFLHpost/ EFLHpre)
where: CSF = Control savings factor is the annualized reduction factor calculated across the EFLH
EFLHpre = Annual equivalent full load hours prior to application of controls
EFLHpost = Annual equivalent full load hours after application of controls
When calculating the site level CSF using measured data for multiple control points, the weighted average should be developed by using the kW controlled as the weighting factor.
Equation 2: Interactive Cooling Electric Energy Savings kWhinteract - cool = kWcool x IFc x Hourscool

3 - 6
Equation 3: Interactive Heating Electric Energy Savings kWh interact - heat = kWheat x IFh x Hoursheat
where:
kWhinteract – cool = Interactive cooling savings from the lighting control project
kWcool = Mean kW reduction coincident with the cooling hours
Hourscool = Hours when the space is in cooling mode
IFc = Interactive cooling factor, ratio of cooling energy reduction per unit of lighting energy; caused by reductions in lighting waste heat removed by an HVAC system
kWhinteract –heat = Interactive heating savings due to lighting control project: a negative value
kWheat = Mean kW reduction coincident with the heating hours
Hoursheat = Hours when the space is in heating mode
IFh = Interactive heating factor, ratio of heating energy increase per unit of lighting energy; caused by reductions in lighting heat removed by an HVAC system
Equation 4: Total annual energy savings kWh Savetotal = kWh Savelc + kWhinteract – cool + kWhinteract –heat
3 - 7
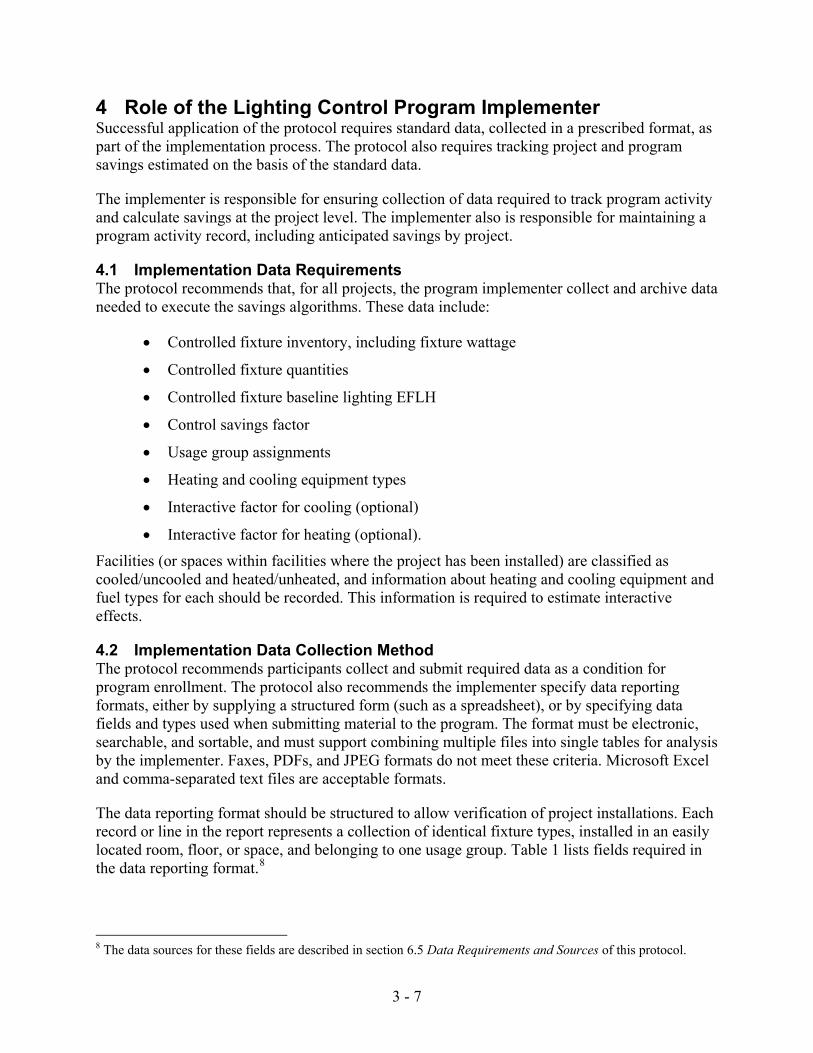
4 Role of the Lighting Control Program Implementer Successful application of the protocol requires standard data, collected in a prescribed format, as part of the implementation process. The protocol also requires tracking project and program savings estimated on the basis of the standard data.
The implementer is responsible for ensuring collection of data required to track program activity and calculate savings at the project level. The implementer also is responsible for maintaining a program activity record, including anticipated savings by project.
4.1 Implementation Data Requirements The protocol recommends that, for all projects, the program implementer collect and archive data needed to execute the savings algorithms. These data include:
• Controlled fixture inventory, including fixture wattage
• Controlled fixture quantities
• Controlled fixture baseline lighting EFLH
• Control savings factor
• Usage group assignments
• Heating and cooling equipment types
• Interactive factor for cooling (optional)
• Interactive factor for heating (optional).
Facilities (or spaces within facilities where the project has been installed) are classified as cooled/uncooled and heated/unheated, and information about heating and cooling equipment and fuel types for each should be recorded. This information is required to estimate interactive effects.
4.2 Implementation Data Collection Method The protocol recommends participants collect and submit required data as a condition for program enrollment. The protocol also recommends the implementer specify data reporting formats, either by supplying a structured form (such as a spreadsheet), or by specifying data fields and types used when submitting material to the program. The format must be electronic, searchable, and sortable, and must support combining multiple files into single tables for analysis by the implementer. Faxes, PDFs, and JPEG formats do not meet these criteria. Microsoft Excel and comma-separated text files are acceptable formats.
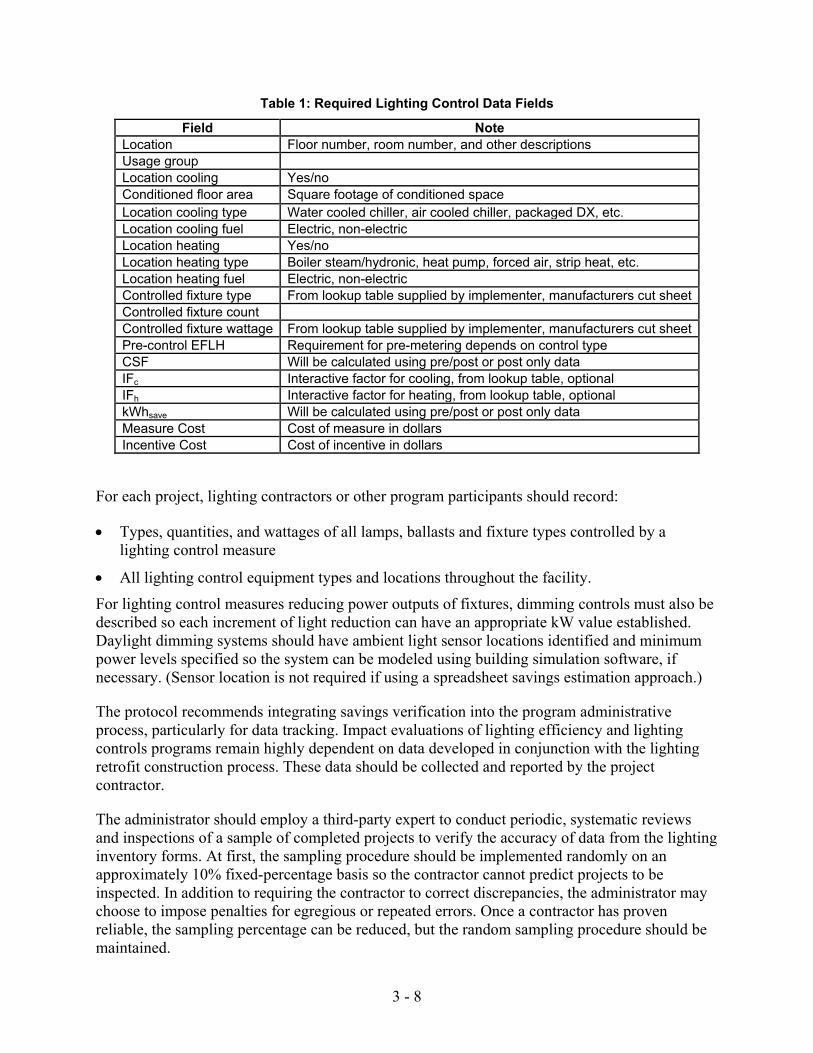
The data reporting format should be structured to allow verification of project installations. Each record or line in the report represents a collection of identical fixture types, installed in an easily located room, floor, or space, and belonging to one usage group. Table 1 lists fields required in the data reporting format.8
8 The data sources for these fields are described in section 6.5 Data Requirements and Sources of this protocol.
3 - 8
Table 1: Required Lighting Control Data Fields
Field Note Location Floor number, room number, and other descriptions Usage group Location cooling Yes/no Conditioned floor area Square footage of conditioned space Location cooling type Water cooled chiller, air cooled chiller, packaged DX, etc. Location cooling fuel Electric, non-electric Location heating Yes/no Location heating type Boiler steam/hydronic, heat pump, forced air, strip heat, etc. Location heating fuel Electric, non-electric Controlled fixture type From lookup table supplied by implementer, manufacturers cut sheet Controlled fixture count Controlled fixture wattage From lookup table supplied by implementer, manufacturers cut sheet Pre-control EFLH Requirement for pre-metering depends on control type CSF Will be calculated using pre/post or post only data IFc Interactive factor for cooling, from lookup table, optional IFh Interactive factor for heating, from lookup table, optional kWhsave Will be calculated using pre/post or post only data Measure Cost Cost of measure in dollars Incentive Cost Cost of incentive in dollars
For each project, lighting contractors or other program participants should record:
• Types, quantities, and wattages of all lamps, ballasts and fixture types controlled by a lighting control measure
• All lighting control equipment types and locations throughout the facility.
For lighting control measures reducing power outputs of fixtures, dimming controls must also be described so each increment of light reduction can have an appropriate kW value established. Daylight dimming systems should have ambient light sensor locations identified and minimum power levels specified so the system can be modeled using building simulation software, if necessary. (Sensor location is not required if using a spreadsheet savings estimation approach.)
The protocol recommends integrating savings verification into the program administrative process, particularly for data tracking. Impact evaluations of lighting efficiency and lighting controls programs remain highly dependent on data developed in conjunction with the lighting retrofit construction process. These data should be collected and reported by the project contractor.
The administrator should employ a third-party expert to conduct periodic, systematic reviews and inspections of a sample of completed projects to verify the accuracy of data from the lighting inventory forms. At first, the sampling procedure should be implemented randomly on an approximately 10% fixed-percentage basis so the contractor cannot predict projects to be inspected. In addition to requiring the contractor to correct discrepancies, the administrator may choose to impose penalties for egregious or repeated errors. Once a contractor has proven reliable, the sampling percentage can be reduced, but the random sampling procedure should be maintained.
3 - 9
5 Role of the Evaluator The evaluator’s role is to determine energy savings resulting from the operation of lighting control efficiency programs. The procedure reviews a sample of completed projects, including conducting on-site M&V activities, calculating a realization rate (the ratio of evaluator to implementer anticipated savings), and using the realization rate to adjust implementer-anticipated savings.
5.1 Evaluator Data Requirements The protocol recommends the program evaluator collect the same data as the implementer. As described in M&V, the evaluator must have access to implementation lighting inventory forms and participant application materials for each project in the sample.
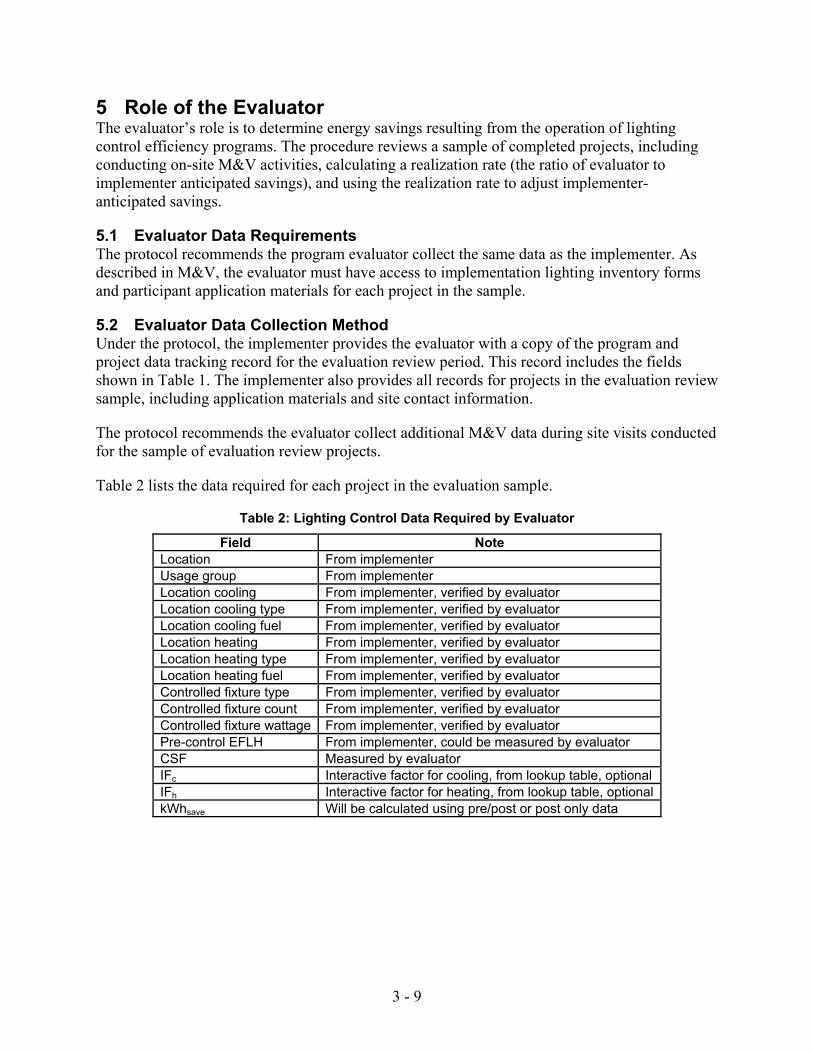
5.2 Evaluator Data Collection Method Under the protocol, the implementer provides the evaluator with a copy of the program and project data tracking record for the evaluation review period. This record includes the fields shown in Table 1. The implementer also provides all records for projects in the evaluation review sample, including application materials and site contact information.
The protocol recommends the evaluator collect additional M&V data during site visits conducted for the sample of evaluation review projects.
Table 2 lists the data required for each project in the evaluation sample.
Table 2: Lighting Control Data Required by Evaluator
Field Note Location From implementer Usage group From implementer Location cooling From implementer, verified by evaluator Location cooling type From implementer, verified by evaluator Location cooling fuel From implementer, verified by evaluator Location heating From implementer, verified by evaluator Location heating type From implementer, verified by evaluator Location heating fuel From implementer, verified by evaluator Controlled fixture type From implementer, verified by evaluator Controlled fixture count From implementer, verified by evaluator Controlled fixture wattage From implementer, verified by evaluator Pre-control EFLH From implementer, could be measured by evaluator CSF Measured by evaluator IFc Interactive factor for cooling, from lookup table, optional IFh Interactive factor for heating, from lookup table, optional kWhsave Will be calculated using pre/post or post only data

3 - 10
6 Measurement and Verification Plan The M&V plan describes how evaluators determine verified energy savings in a facility where a lighting controls efficiency project has been installed. M&V results are applied to the population of all completed projects to determine program savings. All M&V activities in the protocol are conducted for a representative sample of completed projects. The evaluator is responsible for meeting M&V requirements in the protocol.
6.1 IPMVP Option The selection of the appropriate International Performance Measurement and Verification Protocol (IPMVP) evaluation method for reporting evaluated (ex post) savings is contingent on site-specific criteria. The key factors for determining the method are the availability of whole premise interval metered data and preferably sub-metered lighting data, and the relative size of the savings impact attributable to the lighting control measure. When the savings impact for the lighting control measure is at least 5%, and preferably at least 10% of the energy usage for the available interval data, then IPMVP Option C–Whole Facility should be selected.9 When Option C is selected, there must be both pre- and post-metered data available to evaluate the lighting control impacts. Because lighting controls often do not meet the relative impact criteria, the IPMVP Option A–Retrofit Isolation: Key Parameter Measurement approach is the most common method used to evaluate savings. Key parameters to be measured include EFLHpre and EFLHpost, to calculate the CSF term in Equation 1. Accurately measuring these variables typically requires determining lighting usage in the pre-control state, and may require measuring usage in the post-control state.10
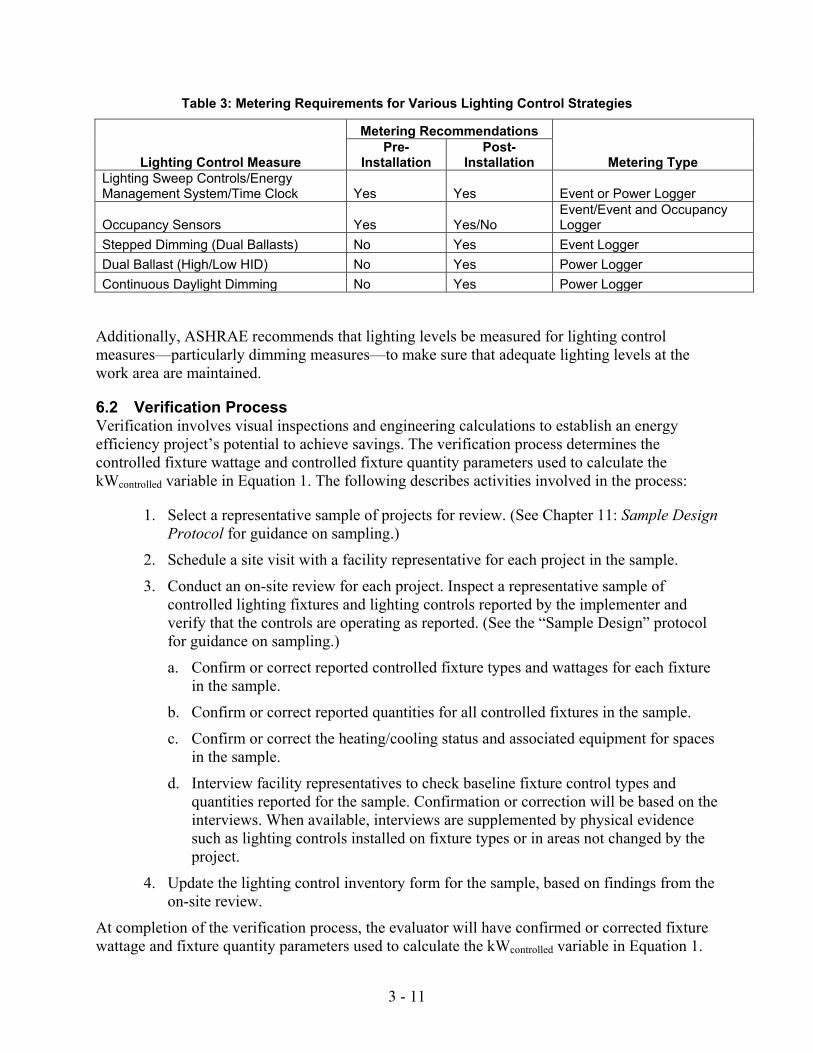
Table 3 provides metering recommendations for measuring various types of lighting control measures. In summary:
• Lighting sweep controls, energy management systems, and time clock measures require pre- and post-installation metering to establish EFLH and CSF accurately.
• OS measures can be determined effectively through pre-installation metering only if using a lighting event logger with infrared occupancy sensor capabilities.11
• Most dimming applications can be measured using post-installation data only when these are sufficiently accurate to assume uncontrolled kW would equal controlled lighting operating at full power.
• Event loggers typically are lighting loggers monitoring lighting on/off operations via a photocell; power loggers monitor power consumption of controlled lighting circuits.
9 In this case, the data could be either whole premise data or lighting end use data, which contain the savings attributable to the lighting control measure(s) as a portion of the data. In either case the savings impact must be at least 5% of the total usage observed in the data in order to quantify the impacts accurately using this method. 10 IPMVP Option A - Retrofit Isolation requires the key savings variable be measured pre and post. However, when conducting M&V in an impact evaluation, it can be a challenge to obtain baseline data. The program administrator often does not collect the data, and evaluators commonly do not become involved until after the project is installed. 11 These loggers monitor lighting on/off as well as whether the space is occupied or unoccupied. These data, coupled with the lighting latency factor, can be used to establish EFLH and CSF. Some companies maintain these data by building type and space, offering data that can be purchased: www.sensorswitch.com/Literature.aspx
3 - 11
Table 3: Metering Requirements for Various Lighting Control Strategies
Metering Recommendations
Lighting Control Measure
Pre-Installation
Post-Installation Metering Type
Lighting Sweep Controls/Energy Management System/Time Clock Yes Yes Event or Power Logger
Occupancy Sensors Yes Yes/No Event/Event and Occupancy Logger
Stepped Dimming (Dual Ballasts) No Yes Event Logger Dual Ballast (High/Low HID) No Yes Power Logger Continuous Daylight Dimming No Yes Power Logger
Additionally, ASHRAE recommends that lighting levels be measured for lighting control measures—particularly dimming measures—to make sure that adequate lighting levels at the work area are maintained.
6.2 Verification Process Verification involves visual inspections and engineering calculations to establish an energy efficiency project’s potential to achieve savings. The verification process determines the controlled fixture wattage and controlled fixture quantity parameters used to calculate the kWcontrolled variable in Equation 1. The following describes activities involved in the process:
1. Select a representative sample of projects for review. (See Chapter 11: Sample Design Protocol for guidance on sampling.)
2. Schedule a site visit with a facility representative for each project in the sample.
3. Conduct an on-site review for each project. Inspect a representative sample of controlled lighting fixtures and lighting controls reported by the implementer and verify that the controls are operating as reported. (See the “Sample Design” protocol for guidance on sampling.)
a. Confirm or correct reported controlled fixture types and wattages for each fixture in the sample.
b. Confirm or correct reported quantities for all controlled fixtures in the sample.
c. Confirm or correct the heating/cooling status and associated equipment for spaces in the sample.
d. Interview facility representatives to check baseline fixture control types and quantities reported for the sample. Confirmation or correction will be based on the interviews. When available, interviews are supplemented by physical evidence such as lighting controls installed on fixture types or in areas not changed by the project.
4. Update the lighting control inventory form for the sample, based on findings from the on-site review.
At completion of the verification process, the evaluator will have confirmed or corrected fixture wattage and fixture quantity parameters used to calculate the kWcontrolled variable in Equation 1.
3 - 12
6.3 Measurement Process The measurement process involves using electronic metering equipment to collect data determining EFLH and CSF parameters in Equation 1. Usually, equipment is installed temporarily during the measurement period; in some facilities, existing building automation systems monitoring lighting circuits may be employed. Lighting control measures particularly can be challenging to measure as they may require use of pre/post metering of either on/off operations or interval power consumption.
Meters and metering data used to measure lighting control operating characteristics either record a change of state (light on, light off), or continuously sample and record current or power on a lighting circuit or reduced light output of a fixture. All data must be time-stamped for application in the protocol.
Temporary metering equipment, in the form of data loggers, is most commonly used for establishing lighting EFLH.
Change-of-state lighting data loggers are small (matchbox sized), integrated devices that include a photocell, microprocessor, and memory. These data loggers are mounted inside fixtures. Each time lamps in the fixtures are turned on or off, the event is recorded and time stamped. Such lighting loggers are only suitable for monitoring on/off lighting controls, such as OS, lighting sweep controls/energy management systems, and stepped dimming systems (for example, inboard/outboard configurations, where controlled lamps can be isolated from uncontrolled lamps). For lighting control systems that vary lighting power, such as dimming systems or dual ballast HID systems in which the lamps cannot be isolated, interval power of the lighting system must be monitored.
Data loggers continuously sampling and recording lighting operating hours information usually require an external sensor, such as a current transformer (CT) or photocell. Data loggers with CTs can monitor amperage to a lighting circuit. Spot measurements of the circuit’s amperage with lights on and off establishes threshold amperages for on conditions. Similarly, data loggers with an external photocell can record light levels in a space. Spot measurements of lumen levels with the fixtures on and off establishes light level thresholds for on conditions. Data loggers are commonly used for amperage measurement; continuous light level monitoring to determine hours of operation is less common.
Data logger failures due to incorrect adjustments, locations, or software launches occur commonly. The protocol recommends carefully following manufacturer’s recommendations.
Measurement involves metering lighting operating hours for a representative sample of controlled fixtures selected for verification. Meters are deployed (or metering routines are established, if using an existing building management system [BMS]) during the verification site visit. The process requires the following activities:
1. Meter operating hours for each circuit in the verification sample.
a. If using light loggers, deploy loggers in one or more fixtures controlled by the circuit. Only one logger per last point of control is required; however, additional loggers are commonly deployed to offset logger failure or loss.
3 - 13
b. If measuring amperage, install the CT and data logger in lighting panels for the sampled circuit. The sampling interval should be 15 minutes or less. Spot-measure amperage with lights on and off for the circuit leg with the CT. Record the amperage threshold for the lights-on condition.
c. If the lighting control measure is an on/off type of control (such as occupancy sensors), an event type power logger can be used. Event power loggers record a change of state when the power is on and off and provide similar data as a change of state lighting logger. The sampling interval is irrelevant for event loggers because it captures transitions and data can be output at any interval desired.
d. If using a BMS, establish trends for lighting on/off status for each circuit in the sample. The sampling interval should be 15 minutes or less. Check that the BMS has sufficient capacity to archive recorded data, and that the metering task will not adversely slow the BMS response time.
2. Check data logger operations. Before leaving the site, spot-check a few data loggers to confirm they are recording data as expected. Correct any deficiencies, and, if they appear systemic, redeploy the loggers. If using BMS trends, spot-check recorded data.
3. Leave metering equipment for the monitoring period, which could include pre and post periods. The protocol recommends a monitoring period capturing the full range of facility operating schedules. For facilities with constant schedules (such as office buildings, grocery stores, and retail shops), the protocol calls for metering a minimum of two weeks for pre periods and a minimum of four weeks for post periods. Facilities with variable schedules will require additional time. Facilities with seasonal schedules, such as schools, should be monitored during active periods.
4. Analyze metering data. Calculate the percent-on time for metered lighting equipment for each usage group. When pre-control data are collected for control systems, pre-control EFLH can be calculated directly, and post EFLH can be calculated as well. In this case, the CSF equals 1 minus the ratio of post EFLH, divided by pre EFLH. For lighting control measures varying seasonally, such as continuous daylight dimming systems, it will be necessary to annualize metered data to account for daylight hours during the metering period so summer metering does not over-predict savings, or winter metering does not under-predict savings. Similarly, facilities with seasonal schedules, such as schools, which should have been metered during active periods, have annual EFLH and CSF values adjusted to reflect operating schedules.
6.4 Report M&V Savings Information collected during the M&V processes can be used to calculate M&V project savings as follows:
1. Using results from the last step in the measurement process and the sample lighting inventory form from the verification process, update the inventory EFLH and CSF parameters and calculate M&V savings for the sample.
2. Calculate the project realization rate: the ratio of M&V savings to savings reported by the implementer for the sample.

3 - 14
3. Calculate project M&V savings: the product of the project realization rate and project savings reported by the implementer.
4. Site level savings estimates are used to develop program level results and are weighted and expanded based upon the sample design to develop program level realization rates and statistical relative precision at the selected confidence interval.12
6.5 Data Requirements and Sources Data requirements are described in Role of the Lighting Control Program Implementer and Role of the Evaluator, with additional detail included in the M&V. This section addresses information on the fixture wattage, EFLH, and CSF parameters in the algorithm equations.
6.5.1 Fixture Wattage The protocol recommends use of fixture wattage tables, developed and maintained by existing energy efficiency programs and associated regulatory agencies. The tables list all common fixture types, and most are updated as new fixtures and lighting technologies become available. Wattage values are measured according to American National Standards Institute standards13 by research facilities working on behalf of manufacturers and academic laboratories.
In the wattage table, each fixture and screw-in bulb is fully described, and assigned a unique identifier. The implementer enters a fixture code into the lighting inventory form, which automatically performs a lookup function to enter the associated demand into the form. The evaluator verifies or corrects the fixture type for the evaluation sample in a copy of the implementer’s inventory form, automatically updating lighting values.
The protocol recommends adopting a fixture wattage table used by an established and recognized lighting efficiency program. As of May 2012, the following sources serve as examples:
• Massachusetts Technical Reference Manual 2011, Massachusetts Device Codes and Rated Lighting System Wattage Table. Available from the Massachusetts Energy Efficiency Advisory Council: www.ma-eeac.org/index.htm. This is a slightly abbreviated and simplified table of common fixtures and their wattages.
• New York Standard Approach for Estimating Energy Savings from Energy Efficiency Programs 2010, Appendix C Standard Fixture Watts. Available from the New York Department of Public Service: www.dps.ny.gov/TechManualNYRevised10-15-10.pdf. This is a comprehensive (34 page) list used by the New York State Energy Research and Development Authority (NYSERDA) since the late 1990s.
• Database for Energy Efficiency Resources. Available from the California Public Utilities Commission: www.deeresources.com. An exhaustive list of all parameters
12 The confidence interval and testing criteria (one-tail vs. two-tail) can be different based upon jurisdictional
requirements. For example, PJM requires relative precision of demand impacts be calculated at 90% confidence using a one-tail test: Independent System Operator-New England requires relative precision of demand impacts be calculated at 80% confidence interval using a two-tail test, both calculations provide the same result.
13 The American National Standards Institute 82.2-2002 test protocol specifies ambient conditions for ballast/lamp combinations in luminaires. The test is conducted on an open, suspended fixture. Actual fixture wattage varies, depending on the installation (suspended, recessed) and housing type. Differences are small, less than 5% (see DOE 1993 Advanced Lighting Guidelines.)
3 - 15
driving energy use and savings for a lengthy list of measures. References California codes and weather zones.
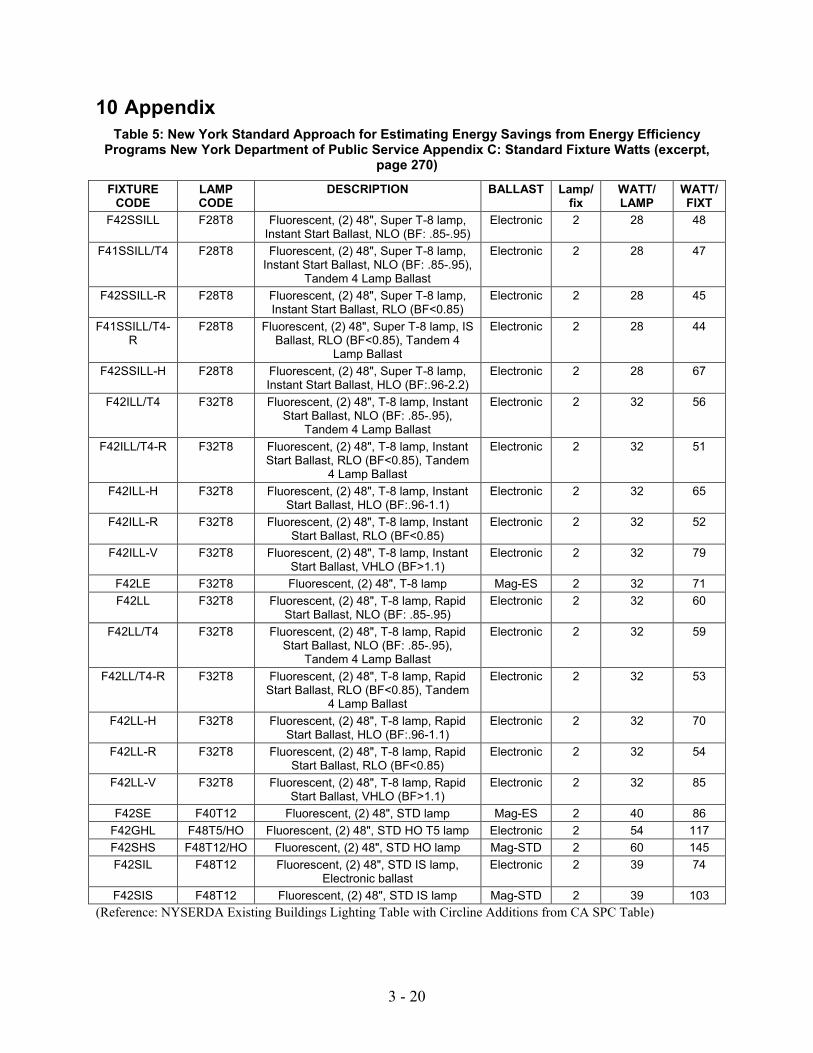
An excerpt from the New York Standard Approach for Estimating Energy Savings from Energy Efficiency Programs is included in the Appendix to this protocol as an example of a wattage table. Wattage tables are used by implementers and evaluators.
6.5.2 EFLH and CSF EFLH and CSF greatly vary by application. The protocol requires evaluators measure pre- and/or post-EFLH (depending on the control type [see Table 3]) and calculate the CSF to minimize uncertainty.
The following section describes data sources and methods used by program implementers for estimating EFLH and CSF parameters to reliably report project and program savings. The protocol requires program participants to provide estimates of EFLH values by usage group and an estimate of CSF by control type in their lighting inventory forms. The estimate should not be based on the building schedule alone, although this may be used to inform the estimate. The protocol recommends participants develop EFLH and CSF values using one of the following sources, with guidance from the program implementer:
1. Lighting schedules in buildings with energy management systems or time clocks that control lighting equipment. Schedules should be checked by interviewing building managers to determine whether they are overridden. When available, control schedules (or trend data) provide reliable estimates of true lighting operating hours.
2. Interviews with building managers. Building managers are usually familiar with lighting schedules; they may not, however, know how lighting is controlled, and may not be a good source of estimates for CSF values.
3. Tables of EFLH and CSF values by building type, provided by the program implementer.
4. Combinations of interviews and tables.
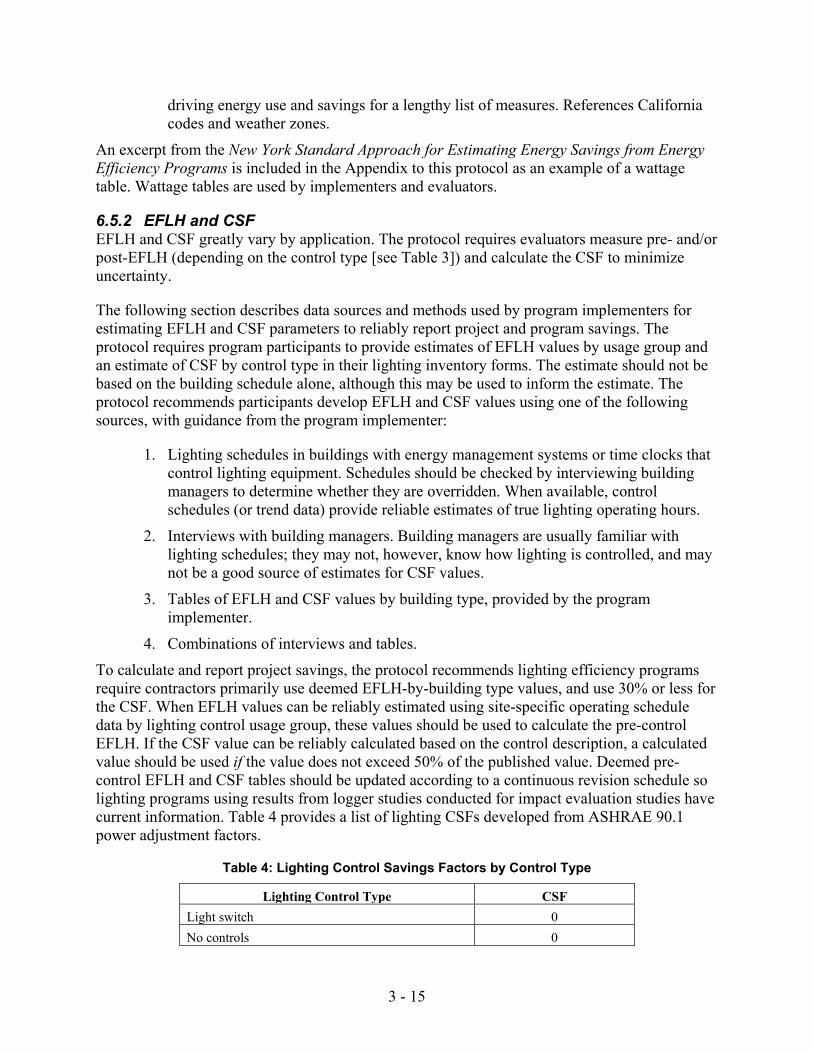
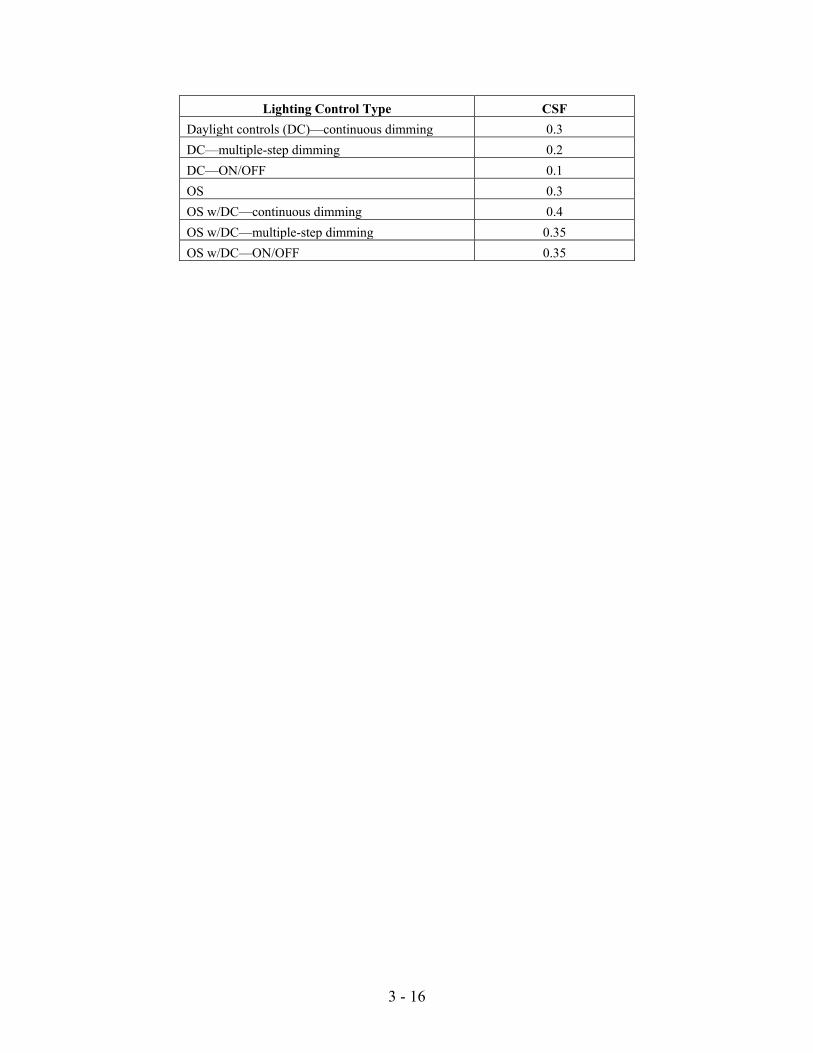
To calculate and report project savings, the protocol recommends lighting efficiency programs require contractors primarily use deemed EFLH-by-building type values, and use 30% or less for the CSF. When EFLH values can be reliably estimated using site-specific operating schedule data by lighting control usage group, these values should be used to calculate the pre-control EFLH. If the CSF value can be reliably calculated based on the control description, a calculated value should be used if the value does not exceed 50% of the published value. Deemed pre-control EFLH and CSF tables should be updated according to a continuous revision schedule so lighting programs using results from logger studies conducted for impact evaluation studies have current information. Table 4 provides a list of lighting CSFs developed from ASHRAE 90.1 power adjustment factors.
Table 4: Lighting Control Savings Factors by Control Type
Lighting Control Type CSF Light switch 0 No controls 0
3 - 16
Lighting Control Type CSF Daylight controls (DC)—continuous dimming 0.3 DC—multiple-step dimming 0.2 DC—ON/OFF 0.1 OS 0.3 OS w/DC—continuous dimming 0.4 OS w/DC—multiple-step dimming 0.35 OS w/DC—ON/OFF 0.35
3 - 17
7 Other Evaluation Issues
7.1 New Construction Lighting control savings for new construction projects can be difficult to calculate as it can be difficult to monitor pre-controls conditions. In some cases, one may override the controls, as to meter non-control conditions. When possible, EFLH and CSF can be measured using pre/post metering techniques. Overriding controls can also be used for retrofit and incentive programs, providing the site contact is cooperative and the extra site visit is considered in evaluation planning.14
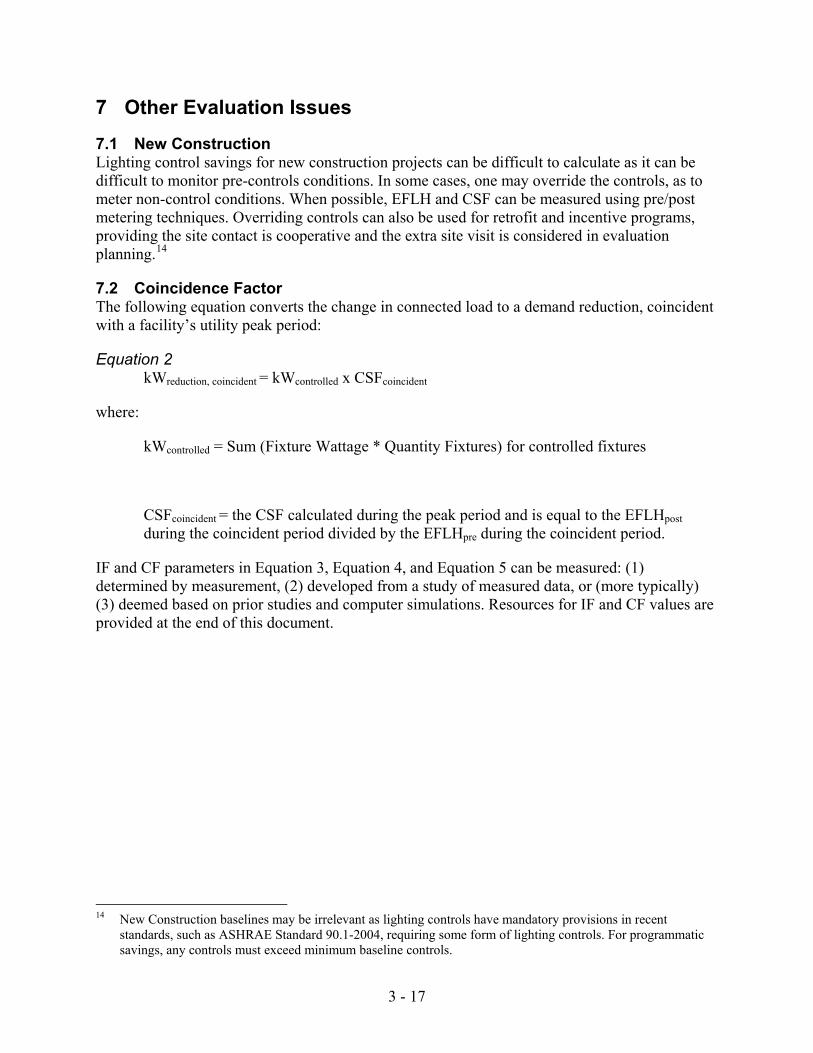
7.2 Coincidence Factor The following equation converts the change in connected load to a demand reduction, coincident with a facility’s utility peak period:
Equation 2 kWreduction, coincident = kWcontrolled x CSFcoincident
where:
kWcontrolled = Sum (Fixture Wattage * Quantity Fixtures) for controlled fixtures
CSFcoincident = the CSF calculated during the peak period and is equal to the EFLHpost during the coincident period divided by the EFLHpre during the coincident period.
IF and CF parameters in Equation 3, Equation 4, and Equation 5 can be measured: (1) determined by measurement, (2) developed from a study of measured data, or (more typically) (3) deemed based on prior studies and computer simulations. Resources for IF and CF values are provided at the end of this document.
14 New Construction baselines may be irrelevant as lighting controls have mandatory provisions in recent
standards, such as ASHRAE Standard 90.1-2004, requiring some form of lighting controls. For programmatic savings, any controls must exceed minimum baseline controls.
3 - 18
8 Program Evaluation Elements Building a foundation for successful evaluation of a commercial, industrial, and nonresidential lighting controls program begins in the program design phase. Administrators support future evaluations by ensuring the data required to conduct an impact study have been collected, stored, and checked for quality. These data include measured and stipulated values available from prior studies or equipment tests. Administrators must set data requirements before a program’s launch so that when data are ultimately reviewed through an impact evaluation, information required to conduct the research will be available.
3 - 19
9 Resources
Note: EFLH, CF, and IF values as well as individual fixture wattages can be found in the following references. (The Pennsylvania reference includes an extensive table of fixture wattages.)
American Society of Heating Refrigerating and Air-Conditioning Engineers (ASHRAE). (2004) ANSI/ASHRAE/IESNA Standard 90.1-2004 Energy Standard for Buildings Except Low-Rise Residential Buildings.
California Public Utilities Commission (CPUC). (2008). Database for Energy Efficient Resources (DEER). www.deeresources.com.
Federal Energy Management Program (FEMP). (2008). M&V Guidelines: Measurement and Verification for Federal Energy Projects Version 3.0. www1.eere.energy.gov/femp/pdfs/mv_guidelines.pdf.
Massachusetts Program Administrators. (2011). Massachusetts Technical Reference Manual for Estimating Savings from Energy Efficiency Measures 2012 Program Year—Plan Version. www.masssave.com.
Pennsylvania Public Utility Commission. (2011). Technical Reference Manual, Appendix C. www.puc.state.pa.us/electric/Act129/TRM.aspx.
TecMarket Works. (2010). New York Standard Approach for Estimating Energy Savings from Energy Efficiency Programs—Residential, Multi-Family and Commercial/Industrial Measures. Prepared for the New York Public Service Commission. www.dps.ny.gov/TechManualNYRevised10-15-10.pdf.
Vermont Energy Investment Corporation. (2010). State of Ohio Energy Efficiency Technical Reference Manual. Prepared for the Public Utilities Commission of Ohio. http://amppartners.org/pdf/TRM_Appendix_E_2011.pdf.
Federal Energy Management Program (FEMP). (2008). M&V Guidelines: Measurement and Verification for Federal Energy Projects Version 3.0. www1.eere.energy.gov/femp/pdfs/mv_guidelines.pdf.
3 - 20
10 Appendix Table 5: New York Standard Approach for Estimating Energy Savings from Energy Efficiency
Programs New York Department of Public Service Appendix C: Standard Fixture Watts (excerpt, page 270)
FIXTURE CODE
LAMP CODE
DESCRIPTION BALLAST Lamp/ fix
WATT/ LAMP
WATT/ FIXT
F42SSILL F28T8 Fluorescent, (2) 48", Super T-8 lamp, Instant Start Ballast, NLO (BF: .85-.95)
Electronic 2 28 48
F41SSILL/T4 F28T8 Fluorescent, (2) 48", Super T-8 lamp, Instant Start Ballast, NLO (BF: .85-.95),
Tandem 4 Lamp Ballast
Electronic 2 28 47
F42SSILL-R F28T8 Fluorescent, (2) 48", Super T-8 lamp, Instant Start Ballast, RLO (BF<0.85)
Electronic 2 28 45
F41SSILL/T4-R
F28T8 Fluorescent, (2) 48", Super T-8 lamp, IS Ballast, RLO (BF<0.85), Tandem 4
Lamp Ballast
Electronic 2 28 44
F42SSILL-H F28T8 Fluorescent, (2) 48", Super T-8 lamp, Instant Start Ballast, HLO (BF:.96-2.2)
Electronic 2 28 67
F42ILL/T4 F32T8 Fluorescent, (2) 48", T-8 lamp, Instant Start Ballast, NLO (BF: .85-.95),
Tandem 4 Lamp Ballast
Electronic 2 32 56
F42ILL/T4-R F32T8 Fluorescent, (2) 48", T-8 lamp, Instant Start Ballast, RLO (BF<0.85), Tandem
4 Lamp Ballast
Electronic 2 32 51
F42ILL-H F32T8 Fluorescent, (2) 48", T-8 lamp, Instant Start Ballast, HLO (BF:.96-1.1)
Electronic 2 32 65
F42ILL-R F32T8 Fluorescent, (2) 48", T-8 lamp, Instant Start Ballast, RLO (BF<0.85)
Electronic 2 32 52
F42ILL-V F32T8 Fluorescent, (2) 48", T-8 lamp, Instant Start Ballast, VHLO (BF>1.1)
Electronic 2 32 79
F42LE F32T8 Fluorescent, (2) 48", T-8 lamp Mag-ES 2 32 71 F42LL F32T8 Fluorescent, (2) 48", T-8 lamp, Rapid
Start Ballast, NLO (BF: .85-.95) Electronic 2 32 60
F42LL/T4 F32T8 Fluorescent, (2) 48", T-8 lamp, Rapid Start Ballast, NLO (BF: .85-.95),
Tandem 4 Lamp Ballast
Electronic 2 32 59
F42LL/T4-R F32T8 Fluorescent, (2) 48", T-8 lamp, Rapid Start Ballast, RLO (BF<0.85), Tandem
4 Lamp Ballast
Electronic 2 32 53
F42LL-H F32T8 Fluorescent, (2) 48", T-8 lamp, Rapid Start Ballast, HLO (BF:.96-1.1)
Electronic 2 32 70
F42LL-R F32T8 Fluorescent, (2) 48", T-8 lamp, Rapid Start Ballast, RLO (BF<0.85)
Electronic 2 32 54
F42LL-V F32T8 Fluorescent, (2) 48", T-8 lamp, Rapid Start Ballast, VHLO (BF>1.1)
Electronic 2 32 85
F42SE F40T12 Fluorescent, (2) 48", STD lamp Mag-ES 2 40 86 F42GHL F48T5/HO Fluorescent, (2) 48", STD HO T5 lamp Electronic 2 54 117 F42SHS F48T12/HO Fluorescent, (2) 48", STD HO lamp Mag-STD 2 60 145 F42SIL F48T12 Fluorescent, (2) 48", STD IS lamp,
Electronic ballast Electronic 2 39 74
F42SIS F48T12 Fluorescent, (2) 48", STD IS lamp Mag-STD 2 39 103 (Reference: NYSERDA Existing Buildings Lighting Table with Circline Additions from CA SPC Table)