Embed Size (px)
Citation preview
Engineering Economics ECIV 5245
Chapter 2
Engineering Costs and Cost Estimating
2
COSTS
Fixed and Variable Marginal and average Direct and Indirect Sunk and Opportunity Recurring and Non-recurring Incremental Cash and Book Life-Cycle
3
COSTS
Fixed CostsThey are constant or unchanging regardless of the level of
output or activity e.g. Costs for factory floor space stays the same regardless of the
production quantity, number of employees, and the level of work-in-process.
Variable CostsThey vary with the level of output or activity e.g. Labor costs since they depend on the number of employees
4
COSTS
Marginal CostThe variable cost for one more unit Used to decide whether the additional unit should be made, purchased,
or enrolled in.
Average CostThe total cost divided by the number of units Used to attain an overall cost picture of the investment on a per unit
basis.
5
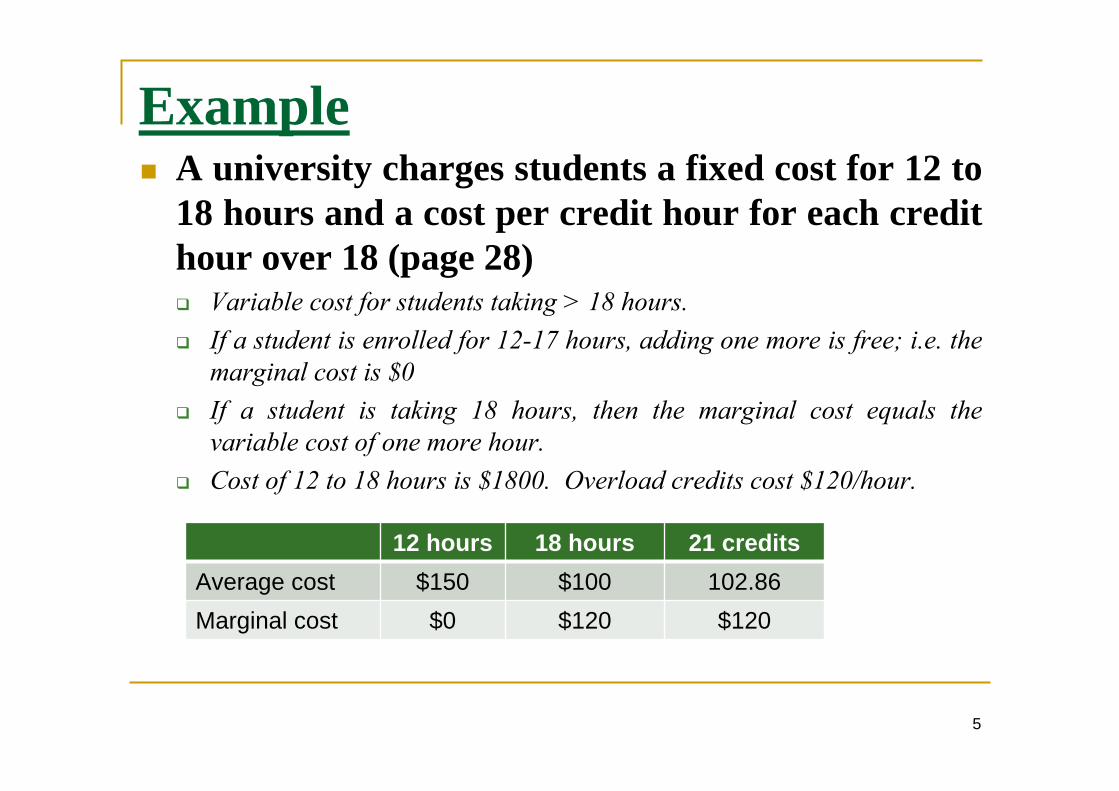
Example A university charges students a fixed cost for 12 to
18 hours and a cost per credit hour for each credit hour over 18 (page 28) Variable cost for students taking > 18 hours. If a student is enrolled for 12-17 hours, adding one more is free; i.e. the
marginal cost is $0 If a student is taking 18 hours, then the marginal cost equals the
variable cost of one more hour. Cost of 12 to 18 hours is $1800. Overload credits cost $120/hour.
12 hours 18 hours 21 creditsAverage cost $150 $100 102.86Marginal cost $0 $120 $120
6
COSTS
Total cost = Total fixed cost + Total variable cost
7
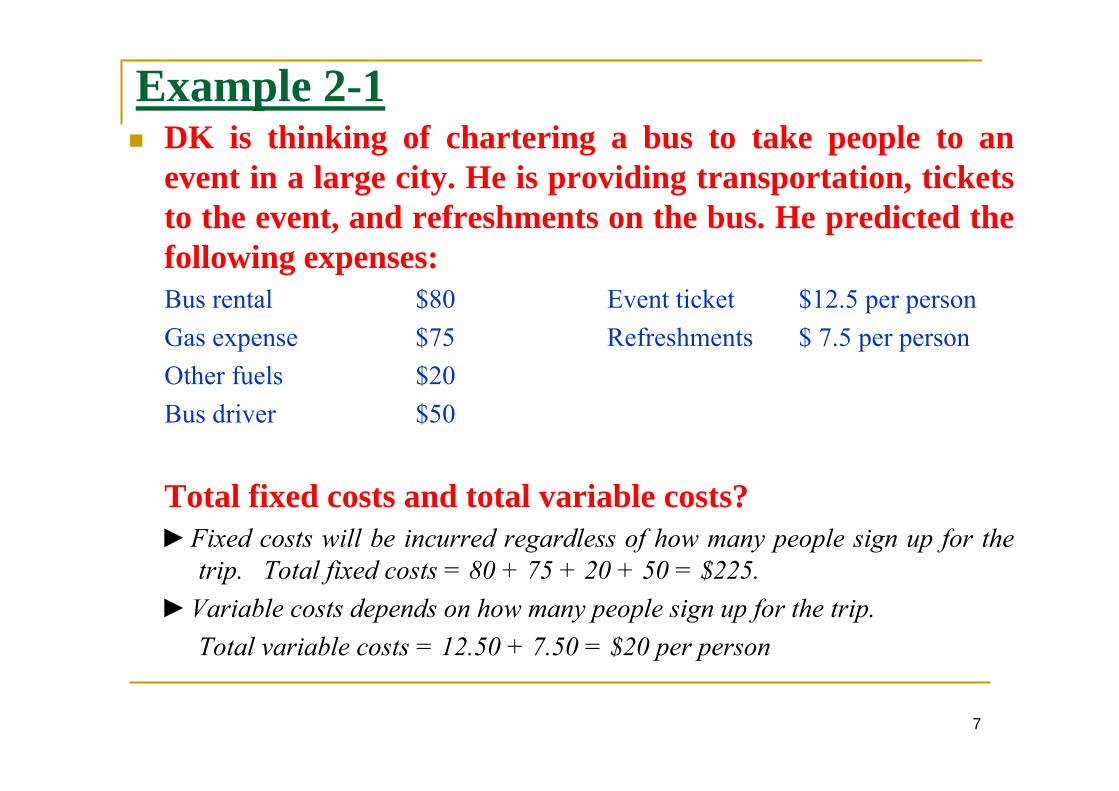
Example 2-1 DK is thinking of chartering a bus to take people to an
event in a large city. He is providing transportation, tickets to the event, and refreshments on the bus. He predicted the following expenses:Bus rental $80 Event ticket $12.5 per personGas expense $75 Refreshments $ 7.5 per personOther fuels $20Bus driver $50
Total fixed costs and total variable costs?►Fixed costs will be incurred regardless of how many people sign up for the
trip. Total fixed costs = 80 + 75 + 20 + 50 = $225.►Variable costs depends on how many people sign up for the trip.
Total variable costs = 12.50 + 7.50 = $20 per person
8
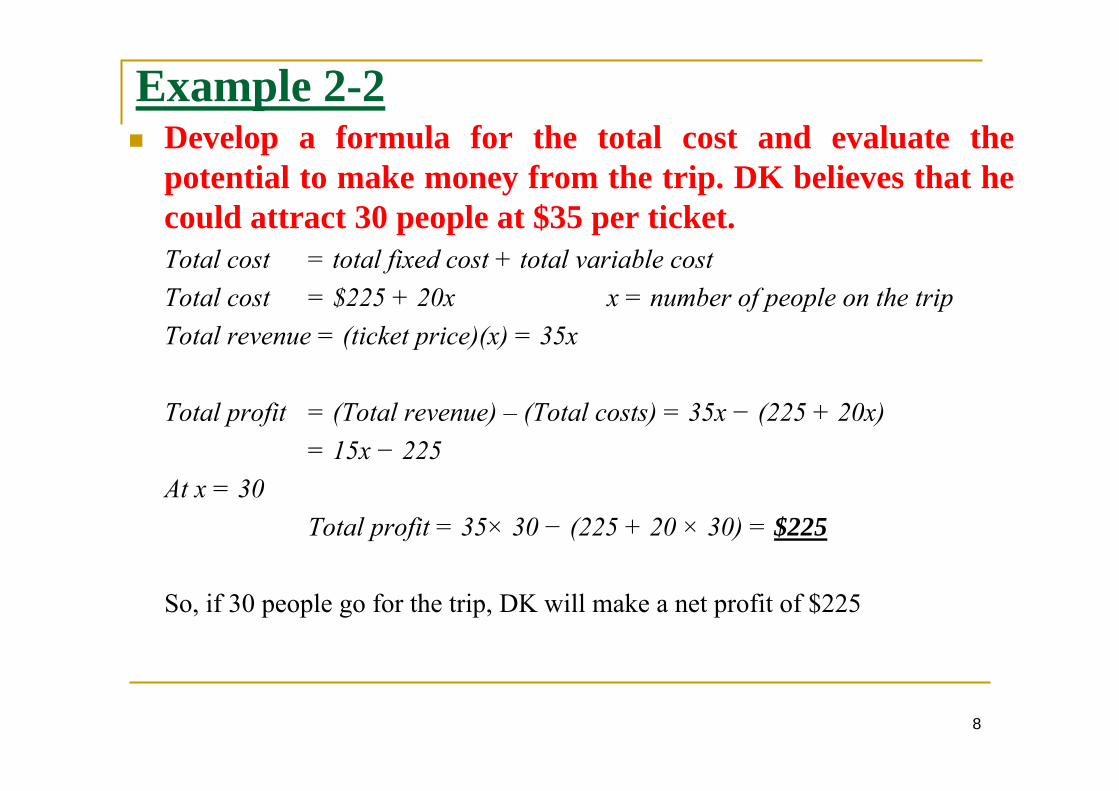
Example 2-2 Develop a formula for the total cost and evaluate the
potential to make money from the trip. DK believes that he could attract 30 people at $35 per ticket.Total cost = total fixed cost + total variable costTotal cost = $225 + 20x x = number of people on the tripTotal revenue = (ticket price)(x) = 35x
Total profit = (Total revenue) – (Total costs) = 35x − (225 + 20x)= 15x − 225
At x = 30Total profit = 35× 30 − (225 + 20 × 30) = $225
So, if 30 people go for the trip, DK will make a net profit of $225
9
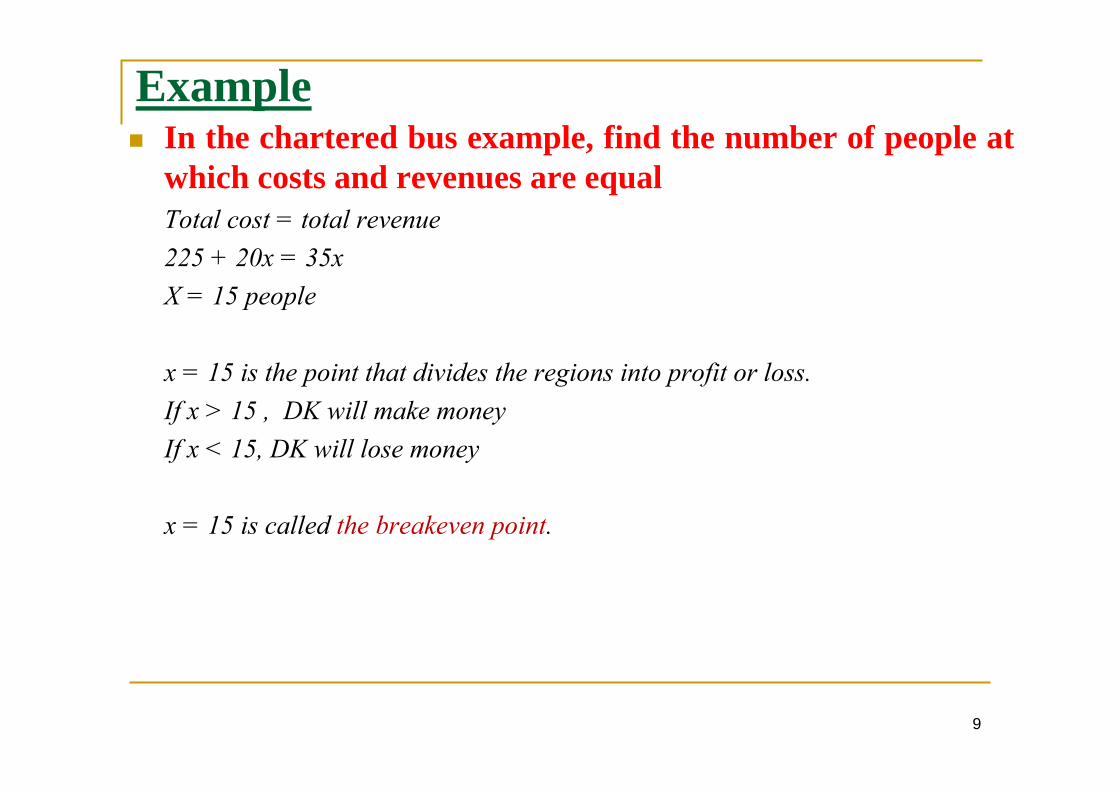
Example In the chartered bus example, find the number of people at
which costs and revenues are equalTotal cost = total revenue225 + 20x = 35xX = 15 people
x = 15 is the point that divides the regions into profit or loss.If x > 15 , DK will make moneyIf x < 15, DK will lose money
x = 15 is called the breakeven point.

10
Breakeven chart for DK chartered bus
Breakeven point
Total cost
Cos
t
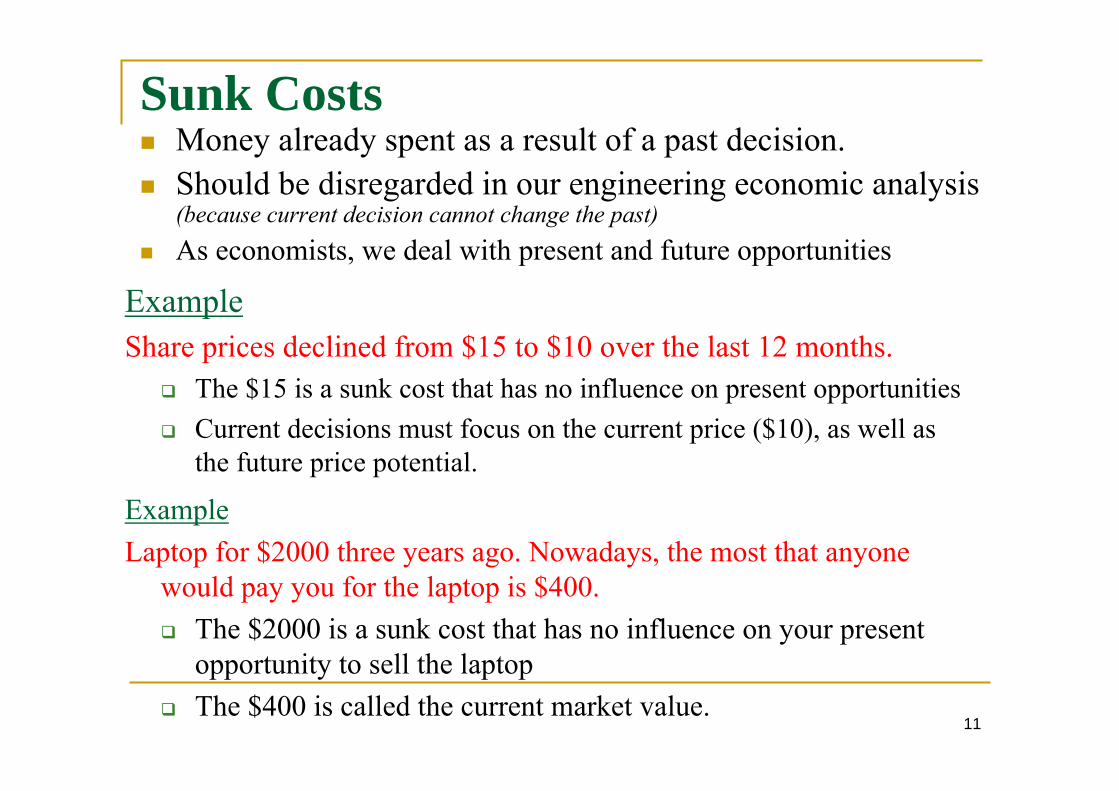
Sunk Costs Money already spent as a result of a past decision. Should be disregarded in our engineering economic analysis
(because current decision cannot change the past) As economists, we deal with present and future opportunities
ExampleShare prices declined from $15 to $10 over the last 12 months.
The $15 is a sunk cost that has no influence on present opportunities Current decisions must focus on the current price ($10), as well as
the future price potential.
ExampleLaptop for $2000 three years ago. Nowadays, the most that anyone
would pay you for the laptop is $400. The $2000 is a sunk cost that has no influence on your present
opportunity to sell the laptop The $400 is called the current market value.
11
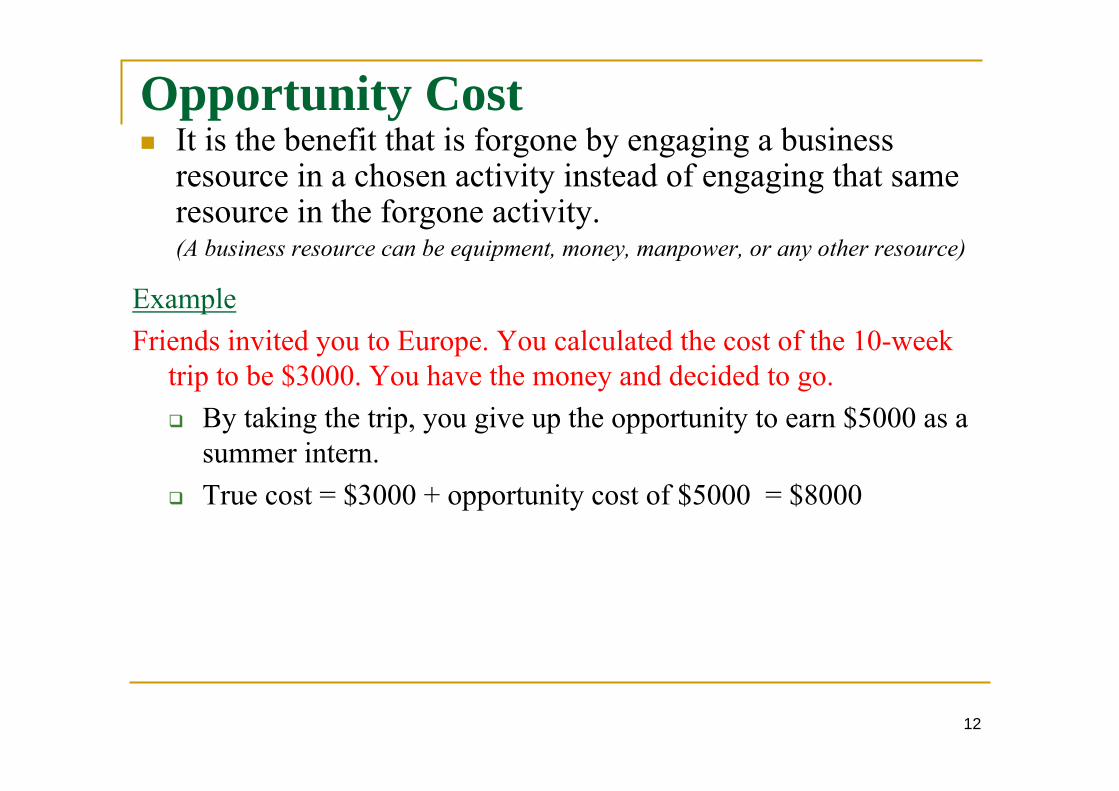
Opportunity Cost It is the benefit that is forgone by engaging a business
resource in a chosen activity instead of engaging that same resource in the forgone activity.(A business resource can be equipment, money, manpower, or any other resource)
ExampleFriends invited you to Europe. You calculated the cost of the 10-week
trip to be $3000. You have the money and decided to go. By taking the trip, you give up the opportunity to earn $5000 as a
summer intern. True cost = $3000 + opportunity cost of $5000 = $8000
12
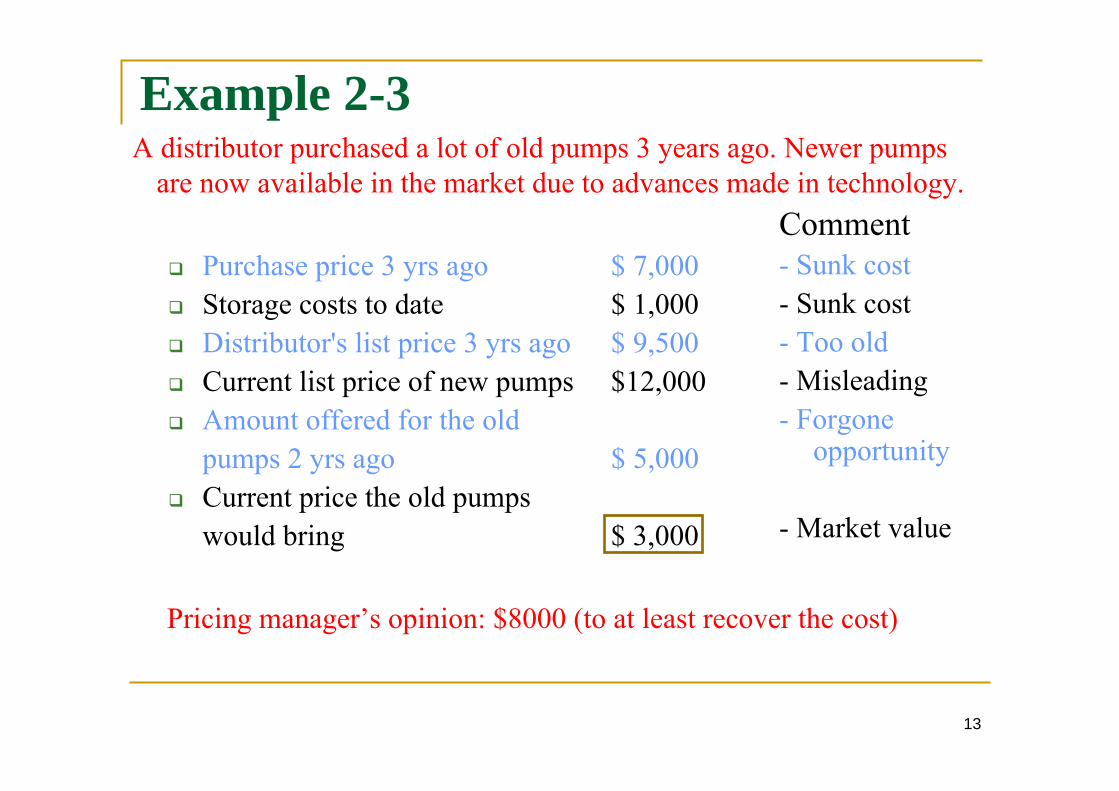
Example 2-3
Purchase price 3 yrs ago $ 7,000 Storage costs to date $ 1,000 Distributor's list price 3 yrs ago $ 9,500 Current list price of new pumps $12,000 Amount offered for the old
pumps 2 yrs ago $ 5,000 Current price the old pumps
would bring $ 3,000
A distributor purchased a lot of old pumps 3 years ago. Newer pumps are now available in the market due to advances made in technology.
Comment- Sunk cost- Sunk cost- Too old- Misleading- Forgone
opportunity
- Market value
Pricing manager’s opinion: $8000 (to at least recover the cost)
13
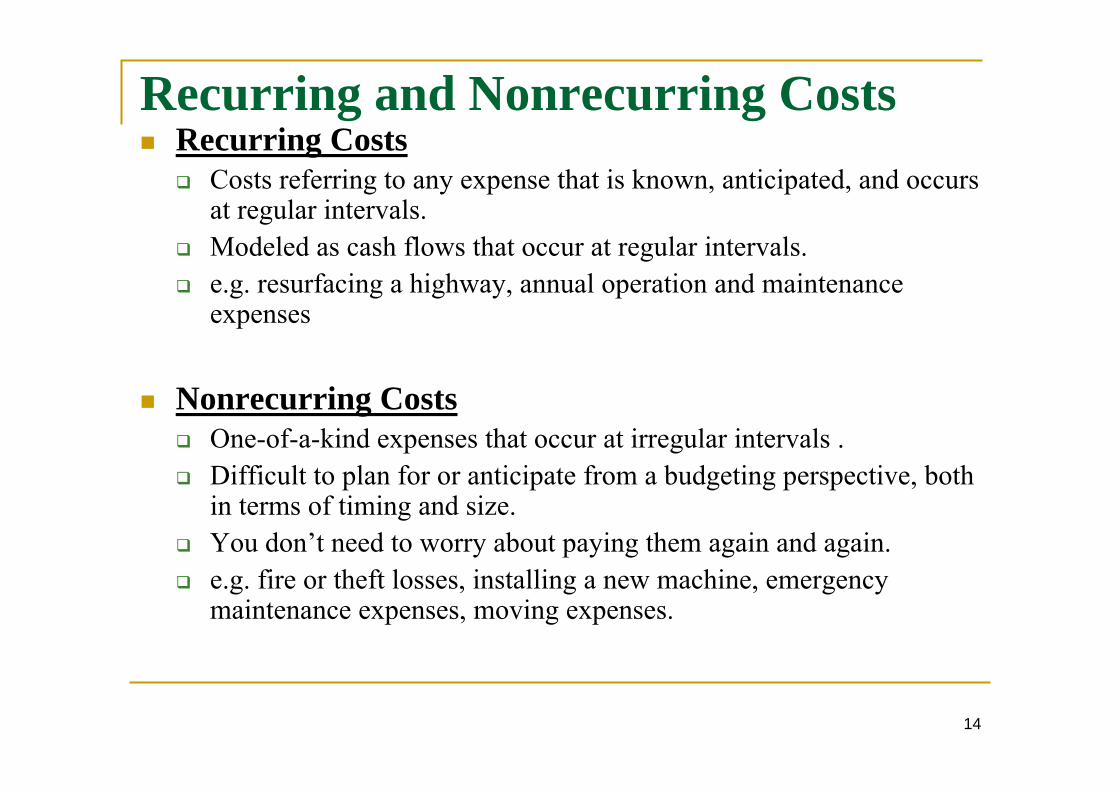
Recurring and Nonrecurring Costs Recurring Costs
Costs referring to any expense that is known, anticipated, and occurs at regular intervals.
Modeled as cash flows that occur at regular intervals. e.g. resurfacing a highway, annual operation and maintenance
expenses
Nonrecurring Costs One-of-a-kind expenses that occur at irregular intervals . Difficult to plan for or anticipate from a budgeting perspective, both
in terms of timing and size. You don’t need to worry about paying them again and again. e.g. fire or theft losses, installing a new machine, emergency
maintenance expenses, moving expenses.
14
Incremental Costs
When making a choice among competing alternatives, focus should be placed on the differences between those alternatives, i.e. incremental costs, not on the costs that are the same.
15
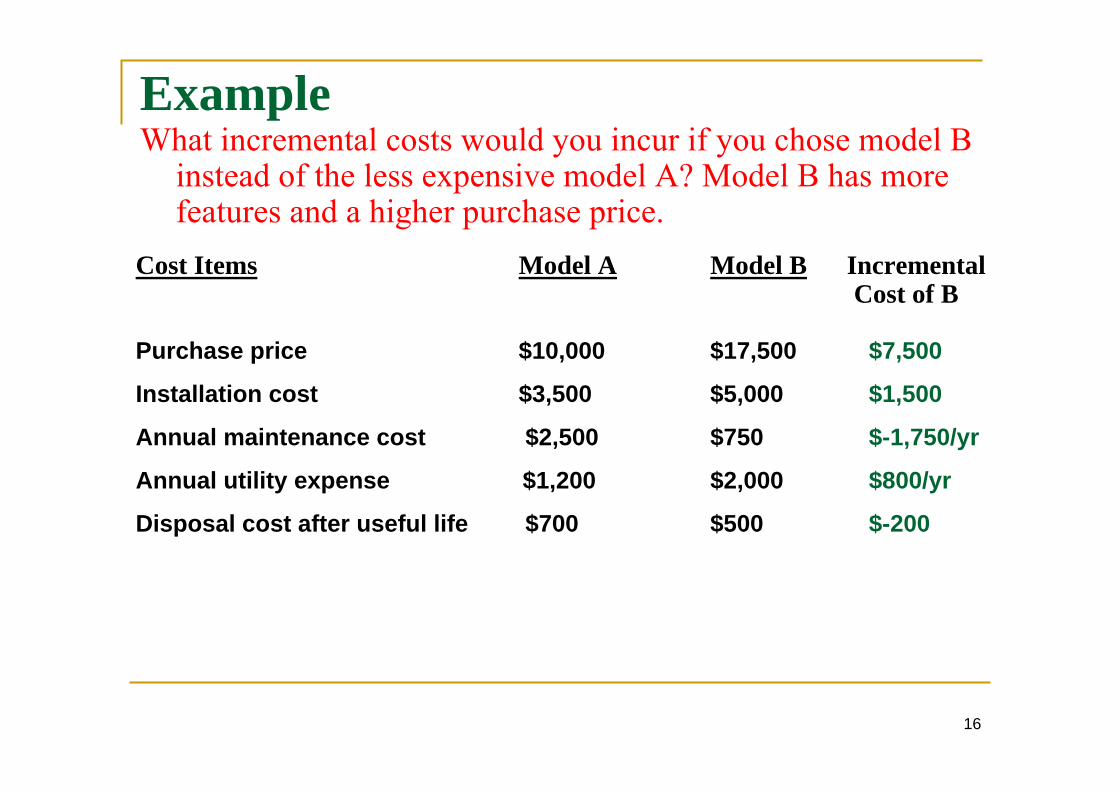
ExampleWhat incremental costs would you incur if you chose model B
instead of the less expensive model A? Model B has more features and a higher purchase price.
Cost Items Model A Model B Incremental Cost of B
Purchase price $10,000 $17,500
Installation cost $3,500 $5,000
Annual maintenance cost $2,500 $750
Annual utility expense $1,200 $2,000
Disposal cost after useful life $700 $500
$7,500
$1,500
$-1,750/yr
$800/yr
$-200
16
Cash Costs versus Book CostsCash CostsA cash cost requires the cash transaction of dollars “out of one person’s pocket” into “the pocket of someone else”.
i.e. you are incurring a cash cost or cash flow.Cash costs and cash flows are the basis for engineering economic
analysisBook CostsThey are cost effects from past decisions that are recorded in in the books (accounting books). They are costs reflected in the accounting system only.
Don’t represent cash flowsNot included in the engineering economic analysis
Example: You might use Edmond’s Used Car Guide to conclude the book value of your car is $6,000. The book value can be thought of as the book cost. If you actually sell the car to a friend for $5,500, then the cash cost to your friend is $5,500.
17
Life-Cycle Costs Similar to humans; goods, products, and services designed by
engineers progress through a life cycle.
Typical Life Cycle1. Needs definition2. Conceptual design3. Detailed design4. Production5. Operation use6. Decline and retirement
18
Life-Cycle Costs Life-cycle costing: Refers to the concept of designing products,
goods, and services with a full and explicit recognition of the associated costs over the various phases of their life cycles.
Engineers should consider all life-cycle costs when designing products and the systems that produce them.
Life-cycle cost: It is the summation of all costs related to a product, structure, system, or service during its life span. Allamounts are expressed in dollars and they must be time equivalent.
This time-equivalency is important because a dollar today is worth more than a dollar next year because of the interest (profit) it can earn.
19
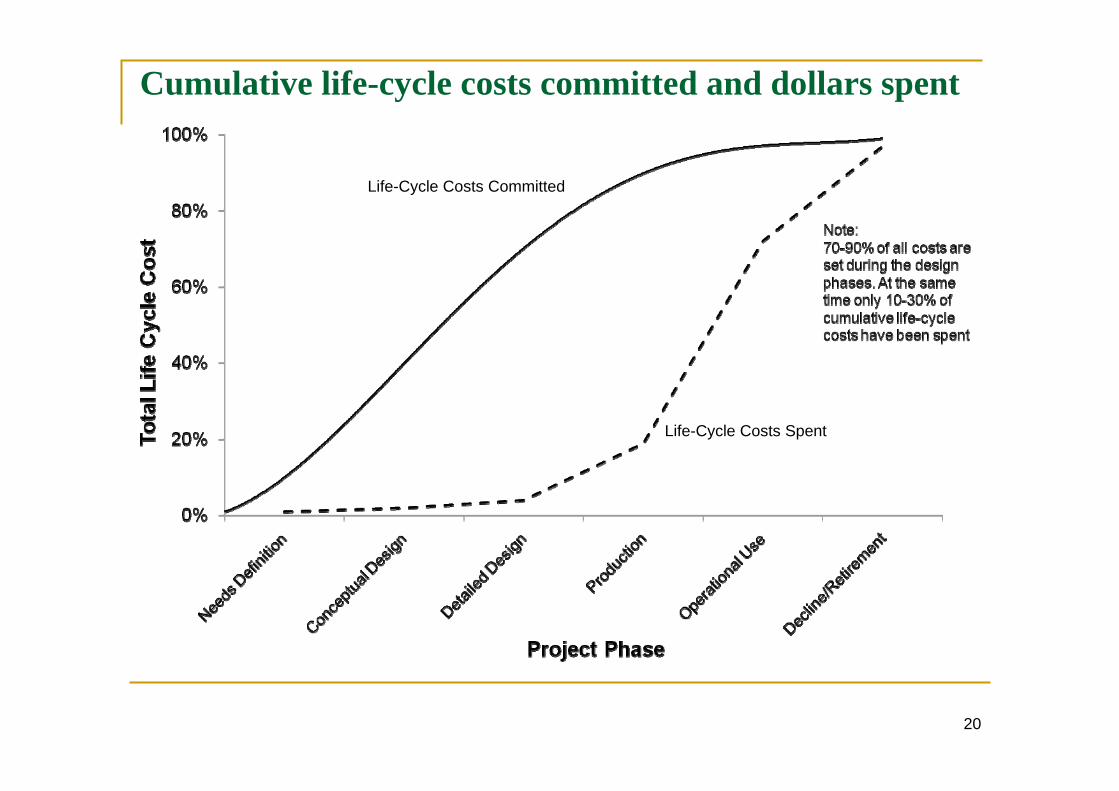
Cumulative life-cycle costs committed and dollars spent
Life-Cycle Costs Committed
Life-Cycle Costs Spent
20
Life-Cycle Costs
Two key concepts in life-cycle costing The later design changes are made, the higher the costs Decisions made early in the life cycle tend to lock in costs that are
incurred later.
21
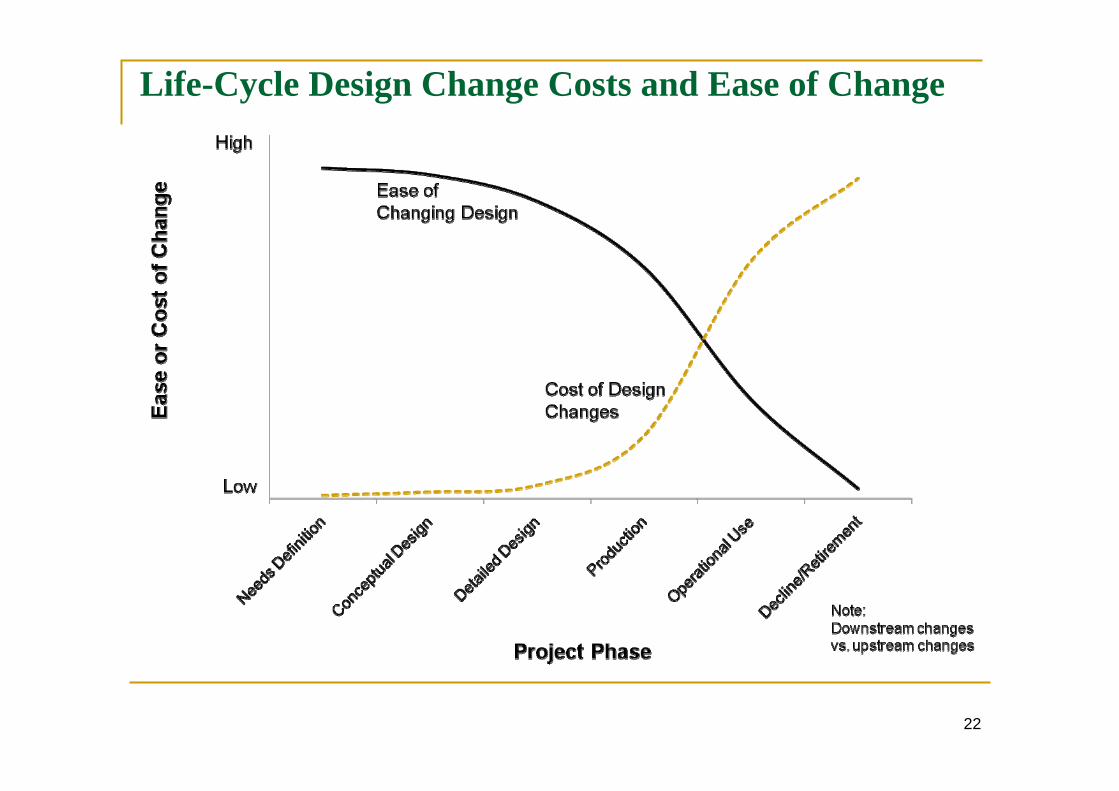
Life-Cycle Design Change Costs and Ease of Change
22
Costs Estimating
Difficult because future is unknown
It is the foundation of economic analysis If poor data are used, the analysis will be grossly inaccurate – no matter
how detailed your economic analysis was. This means that it is crucial to make careful estimates.
In other words: The outcome is only as good as the quality of the numbers used.
23
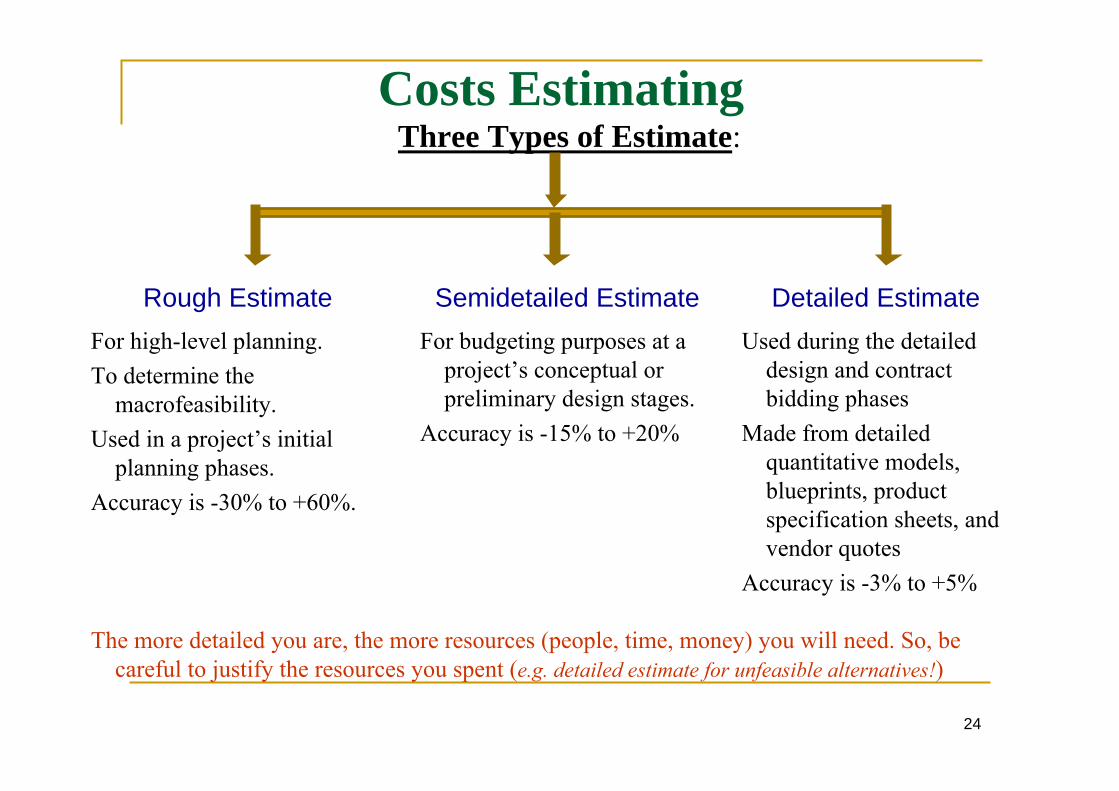
Costs EstimatingThree Types of Estimate:
Rough Estimate Semidetailed Estimate Detailed EstimateFor high-level planning.To determine the
macrofeasibility.Used in a project’s initial
planning phases.Accuracy is -30% to +60%.
For budgeting purposes at a project’s conceptual or preliminary design stages.
Accuracy is -15% to +20%
Used during the detailed design and contract bidding phases
Made from detailed quantitative models, blueprints, product specification sheets, and vendor quotes
Accuracy is -3% to +5%
The more detailed you are, the more resources (people, time, money) you will need. So, be careful to justify the resources you spent (e.g. detailed estimate for unfeasible alternatives!)
24
Estimating Models
Per-Unit Model Segmenting Model Cost indexes Power-sizing Model
25
Estimating Models
Per-Unit Model Uses a per unit factor (e.g. cost per square meter) Commonly used in the construction industry Other examples: Gasoline cost per 1 km or how many km per
1L of gas
26
Estimating Models
Segmenting Model Estimate is segmented into its individual components Then the estimates are aggregated back together.
27
Cost Indexes
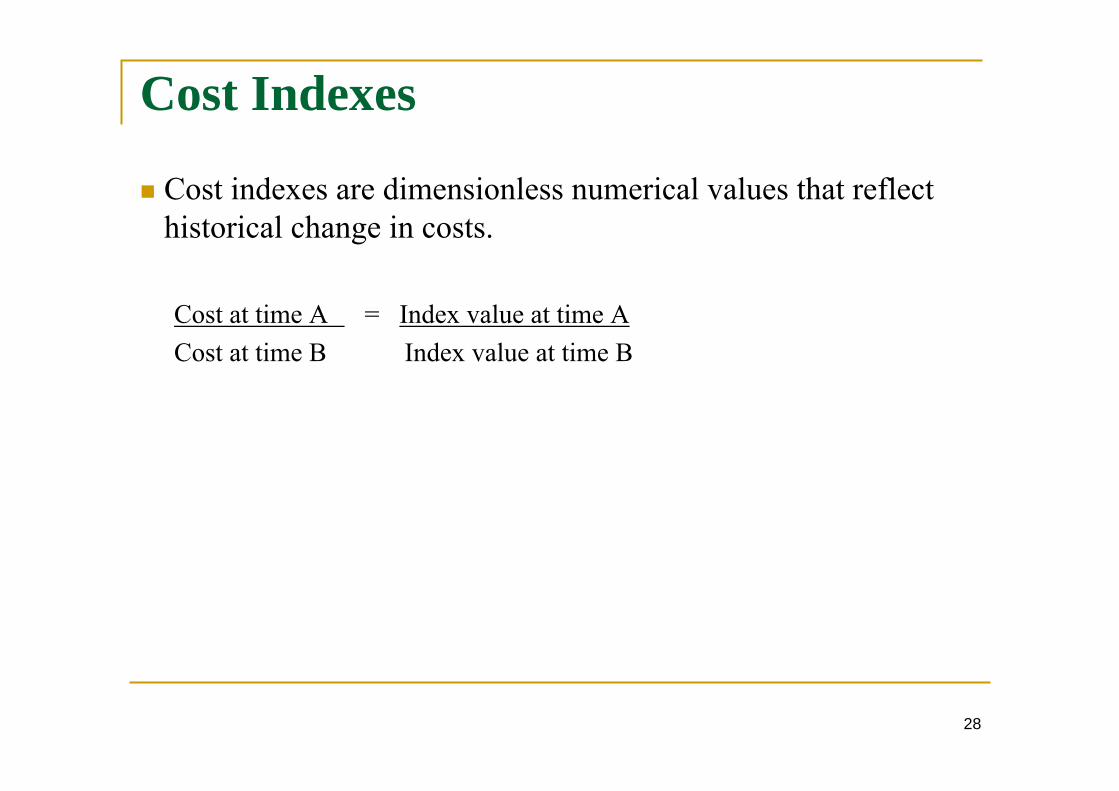
Cost indexes are dimensionless numerical values that reflect historical change in costs.
Cost at time A = Index value at time ACost at time B Index value at time B
28
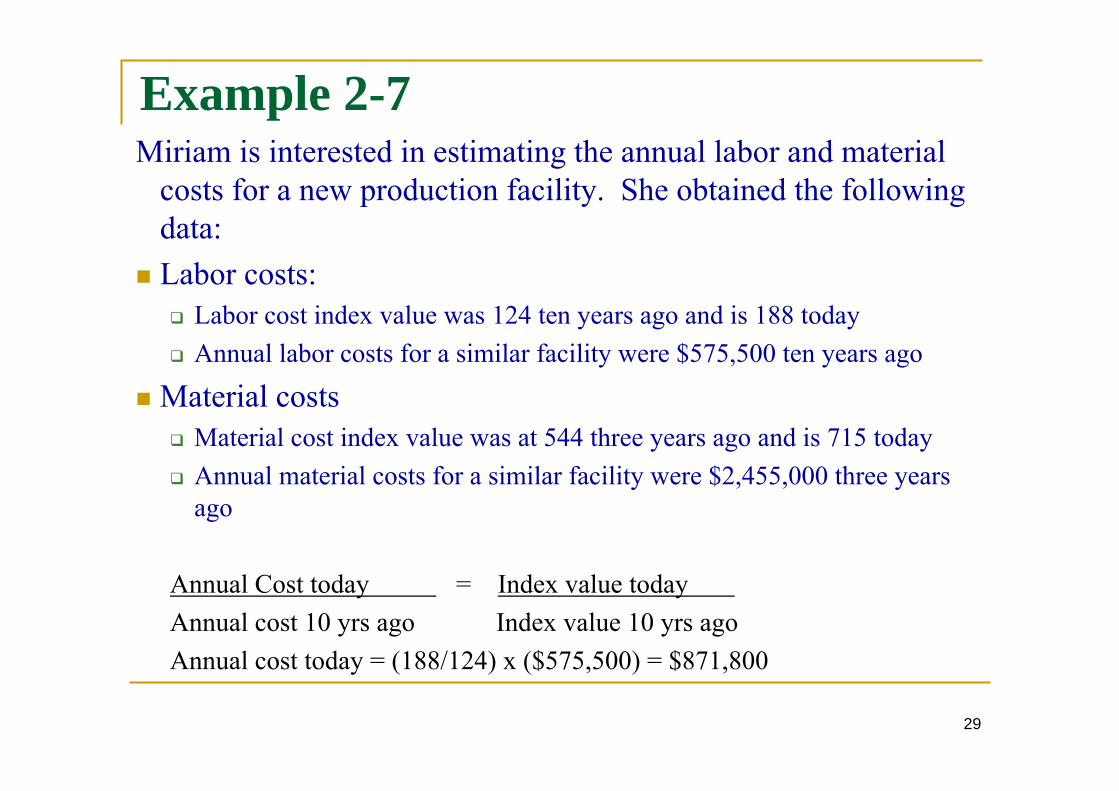
Example 2-7Miriam is interested in estimating the annual labor and material
costs for a new production facility. She obtained the followingdata:
Labor costs: Labor cost index value was 124 ten years ago and is 188 today Annual labor costs for a similar facility were $575,500 ten years ago
Material costs Material cost index value was at 544 three years ago and is 715 today Annual material costs for a similar facility were $2,455,000 three years
ago
Annual Cost today = Index value today Annual cost 10 yrs ago Index value 10 yrs agoAnnual cost today = (188/124) x ($575,500) = $871,800
29
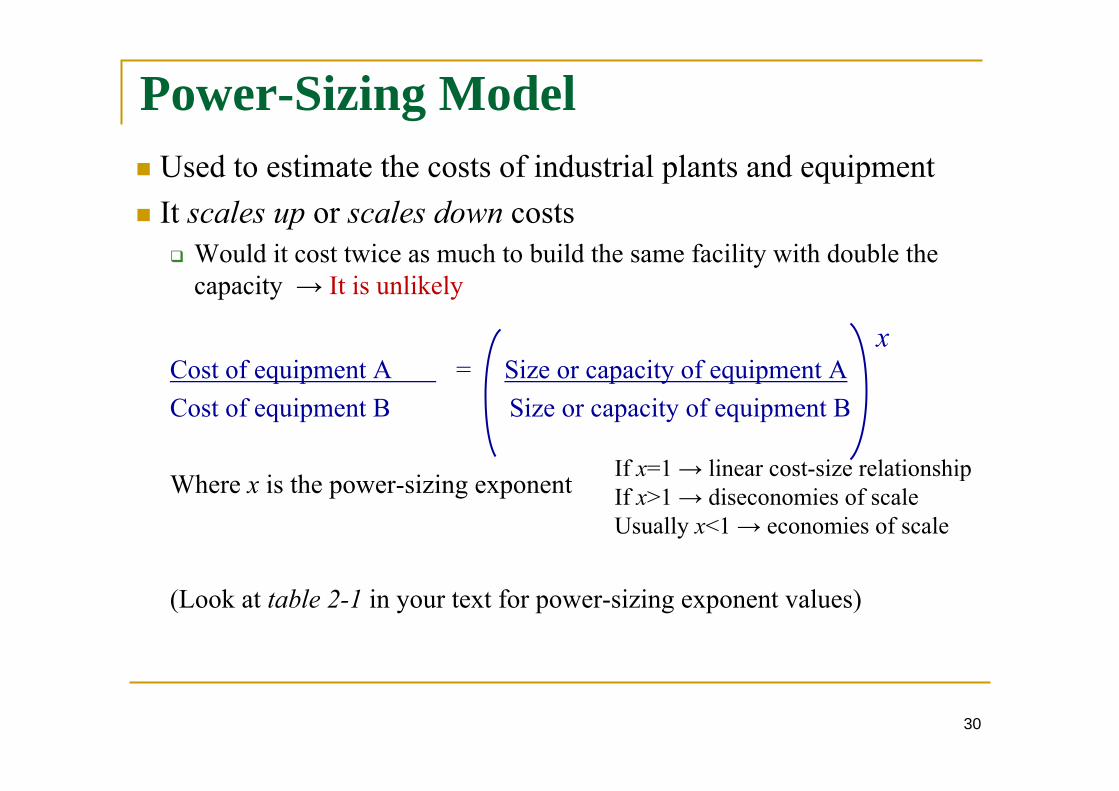
Power-Sizing Model Used to estimate the costs of industrial plants and equipment It scales up or scales down costs
Would it cost twice as much to build the same facility with double the capacity → It is unlikely
Cost of equipment A = Size or capacity of equipment ACost of equipment B Size or capacity of equipment B
Where x is the power-sizing exponent
(Look at table 2-1 in your text for power-sizing exponent values)
x
If x=1 → linear cost-size relationshipIf x>1 → diseconomies of scaleUsually x<1 → economies of scale
30
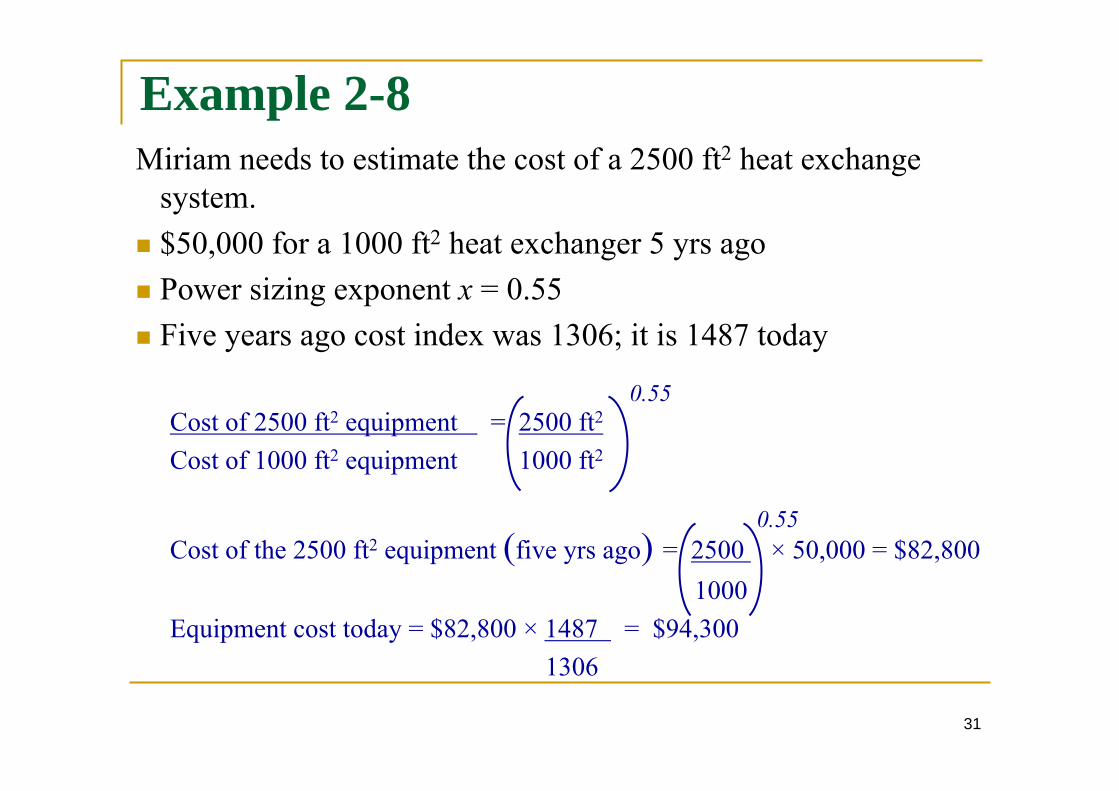
Example 2-8Miriam needs to estimate the cost of a 2500 ft2 heat exchange
system. $50,000 for a 1000 ft2 heat exchanger 5 yrs ago Power sizing exponent x = 0.55 Five years ago cost index was 1306; it is 1487 today
Cost of 2500 ft2 equipment = 2500 ft2
Cost of 1000 ft2 equipment 1000 ft2
Cost of the 2500 ft2 equipment (five yrs ago) = 2500 × 50,000 = $82,8001000
Equipment cost today = $82,800 × 1487 = $94,3001306
0.55
0.55
31
Estimating Benefits An important part of the economic analysis that should not be
overlooked Similar to concepts and models used in estimating costs Benefits are more likely to be overestimated while costs are
more likely to be underestimated Benefits continue in the future while costs are incurred in the
near future
32
Cash Flow Diagrams (CFD) Costs & benefits of engineering products occur over time
Use Cash Flow Diagram to represent them.
CFD illustrates the size, sign, and timing of individual cash flows.
Use one perspective: One person’s cash outflow is another person’s inflow
33