Embed Size (px)
Citation preview
Copyright ©2011 by Pearson Education, Inc.All rights reserved.
Chapter 11
Classical and KeynesianMacro Analyses
11-2Copyright © 2011 Pearson Education, Inc. All rights reserved.
Introduction
The same basic pattern has repeated four times in recent U.S. history: 1973-1974, 1979-1980, 1990, and 2000-2001
First, world oil prices jump. Then companies scale back productions. Finally, price levels rise even as real GDP slides, and the word “recession” is in the air
Why have oil price increases so often preceded recessions? Do recessions necessarily follow a run-up in the world price of oil?
Reading this chapter will help you answer these questions
11-3Copyright © 2011 Pearson Education, Inc. All rights reserved.
Learning Objectives
• Discuss the central assumptions of the classical model
• Describe the short-run determination of equilibrium real GDP and the price level in the classical model
• Explain the circumstances under which the short-run aggregate supply curve may be either horizontal or upward sloping

11-4Copyright © 2011 Pearson Education, Inc. All rights reserved.
Learning Objectives (cont'd)
• Understand what factors cause shifts in the short-run and long-run aggregate supply curves
• Evaluate the effects of aggregate demand and supply shocks on equilibrium real GDP in the short run
• Determine the causes of short-run variations in the inflation rate
11-5Copyright © 2011 Pearson Education, Inc. All rights reserved.
Chapter Outline
• The Classical Model• Keynesian Economics and the Keynesian
Short-Run Aggregate Supply Curve• Output Determination Using Aggregate
Demand and Aggregate Supply: Fixed versus Changing Price Levels in the Short Run
11-6Copyright © 2011 Pearson Education, Inc. All rights reserved.
Chapter Outline (cont'd)
• Shifts in the Aggregate Supply Curve• Consequences of Changes in Aggregate
Demand• Explaining Short-Run Variations in Inflation

11-7Copyright © 2011 Pearson Education, Inc. All rights reserved.
Did You Know That...
• The price of a 6.5 oz bottle of Coca-Cola remained unchanged at 5 cents from 1886–1959?
• Prices of final goods and services have not always adjusted immediately in response to changes in aggregate demand
• The classical model and the Keynesian approach help in understanding variations in real GDP and the price level
11-8Copyright © 2011 Pearson Education, Inc. All rights reserved.
The Classical Model
• The classical model was the first attempt to explain – Determinants of the price level
– National levels of real GDP
– Employment
– Consumption
– Saving
– Investment
11-9Copyright © 2011 Pearson Education, Inc. All rights reserved.
The Classical Model (cont'd)
• Classical economists—Adam Smith, J.B. Say, David Ricardo, John Stuart Mill, Thomas Malthus, A.C. Pigou, and others—wrote from the 1770s to the 1930s
• They assumed wages and prices were flexible, and that competitive markets existed throughout the economy

11-10Copyright © 2011 Pearson Education, Inc. All rights reserved.
The Classical Model (cont'd)
• Say’s Law– A dictum of economist J.B. Say that supply
creates its own demand
– Producing goods and services generates the means and the willingness to purchase other goods and services
– Supply creates its own demand; hence it follows that desired expenditures will equal actual expenditures
11-11Copyright © 2011 Pearson Education, Inc. All rights reserved.
Figure 11-1 Say’s Law and the Circular Flow
11-12Copyright © 2011 Pearson Education, Inc. All rights reserved.
The Classical Model (cont'd)
• Assumptions of the classical model
– Pure competition exists
– Wages and prices are flexible
– People are motivated by self-interest
– People cannot be fooled by money illusion

11-13Copyright © 2011 Pearson Education, Inc. All rights reserved.
The Classical Model (cont'd)
• Money Illusion
– Reacting to changes in money prices rather than relative prices
– If a worker whose wages double when the price level also doubles thinks he or she is better off, that worker is suffering from money illusion
11-14Copyright © 2011 Pearson Education, Inc. All rights reserved.
The Classical Model (cont'd)
• Consequences of the assumptions
– If the role of government in the economy is minimal,
– If pure competition prevails, and all prices and wages are flexible,
– If people are self-interested, and do not experience money illusion,
– Then problems in the macroeconomy will be temporary and the market will correct itself.
11-15Copyright © 2011 Pearson Education, Inc. All rights reserved.
The Classical Model (cont'd)
• Equilibrium in the credit market
– When income is saved, it is not reflected in product demand
– It is a type of leakage from the circular flow of income and output, because saving withdraws funds from the income stream
– Therefore, total planned consumption spending can fall short of total current real GDP

11-16Copyright © 2011 Pearson Education, Inc. All rights reserved.
The Classical Model (cont'd)
• Equilibrium in the credit market
– Classical economists contended each dollar saved would be matched by business investment
– Leakages would thus equal injections
– At equilibrium, the price of credit—the interest rate—ensures that the amount of credit demanded equals the amount supplied
11-17Copyright © 2011 Pearson Education, Inc. All rights reserved.
Figure 11-2 Equating Desired Saving and Investment in the Classical Model
11-18Copyright © 2011 Pearson Education, Inc. All rights reserved.
The Classical Model (cont'd)
• Equating Desired Saving and Investment in the Classical Model
– Changes in saving and investment create a surplus or shortage in the short run
– In the long run, this is offset by changes in the interest rate
– This interest rate adjustment returns the market to equilibrium where S = I
11-19Copyright © 2011 Pearson Education, Inc. All rights reserved.
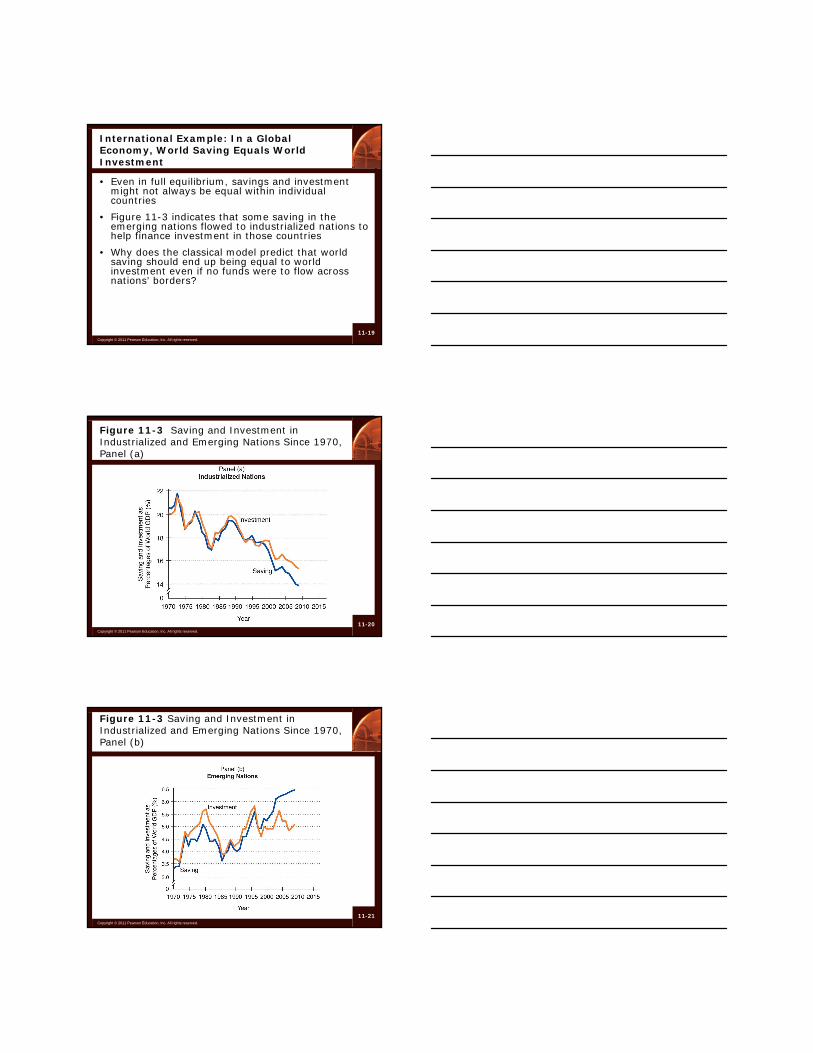
International Example: In a Global Economy, World Saving Equals World Investment
• Even in full equilibrium, savings and investment might not always be equal within individual countries
• Figure 11-3 indicates that some saving in the emerging nations flowed to industrialized nations to help finance investment in those countries
• Why does the classical model predict that world saving should end up being equal to world investment even if no funds were to flow across nations’ borders?
11-20Copyright © 2011 Pearson Education, Inc. All rights reserved.
Figure 11-3 Saving and Investment in Industrialized and Emerging Nations Since 1970, Panel (a)
11-21Copyright © 2011 Pearson Education, Inc. All rights reserved.
Figure 11-3 Saving and Investment in Industrialized and Emerging Nations Since 1970, Panel (b)

11-22Copyright © 2011 Pearson Education, Inc. All rights reserved.
The Classical Model (cont'd)
• Question– Would unemployment be a problem in the
classical model?
• Answer– No, classical economists assumed wages would
always adjust to the full employment level
11-23Copyright © 2011 Pearson Education, Inc. All rights reserved.
Figure 11-4 Equilibrium in the Labor Market
11-24Copyright © 2011 Pearson Education, Inc. All rights reserved.
Table 11-1 The Relationship Between Employment and Real GDP

11-25Copyright © 2011 Pearson Education, Inc. All rights reserved.
The Classical Model (cont’d)
• Classical theory, vertical aggregate supply and the price level– In the classical model, long-term unemployment
is impossible
– Say’s law, coupled with flexible interest rates, prices, and wages would tend to keep workers fully employed
– The LRAS curve is vertical
– A change in aggregate demand will cause a change in the price level
11-26Copyright © 2011 Pearson Education, Inc. All rights reserved.
Figure 11-5 Classical Theory and Increases in Aggregate Demand
Classical theorists believed that Say’s law, flexible interest rates, prices, and wages would always lead to full employment at real GDP of $15 trillion
11-27Copyright © 2011 Pearson Education, Inc. All rights reserved.
Figure 11-6 Effect of a Decrease in Aggregate Demand in the Classical Model

11-28Copyright © 2011 Pearson Education, Inc. All rights reserved.
Keynesian Economics and the Keynesian Short-Run Aggregate Supply Curve
• The classical economists’ world was one of fully utilized resources
• In the 1930s, Europe and the United States entered a period of economic decline that could not be explained by the classical model
• John Maynard Keynes developed an explanation that has become known as the Keynesian model
11-29Copyright © 2011 Pearson Education, Inc. All rights reserved.
Keynesian Economics and the Keynesian Short-Run Aggregate Supply Curve (cont'd)
• Keynes and his followers argued
– Prices, including wages (the price of labor) are inflexible, or “sticky”, downward
– An increase in aggregate demand, AD, will not raise the price level
– A decrease in AD will not cause firms to lower the price level
11-30Copyright © 2011 Pearson Education, Inc. All rights reserved.
Keynesian Economics and the Keynesian Short-Run Aggregate Supply Curve (cont'd)
• Keynesian Short-Run Aggregate Supply Curve
– The horizontal portion of the aggregate supply curve in which there is excessive unemployment and unused capacity in the economy
11-31Copyright © 2011 Pearson Education, Inc. All rights reserved.
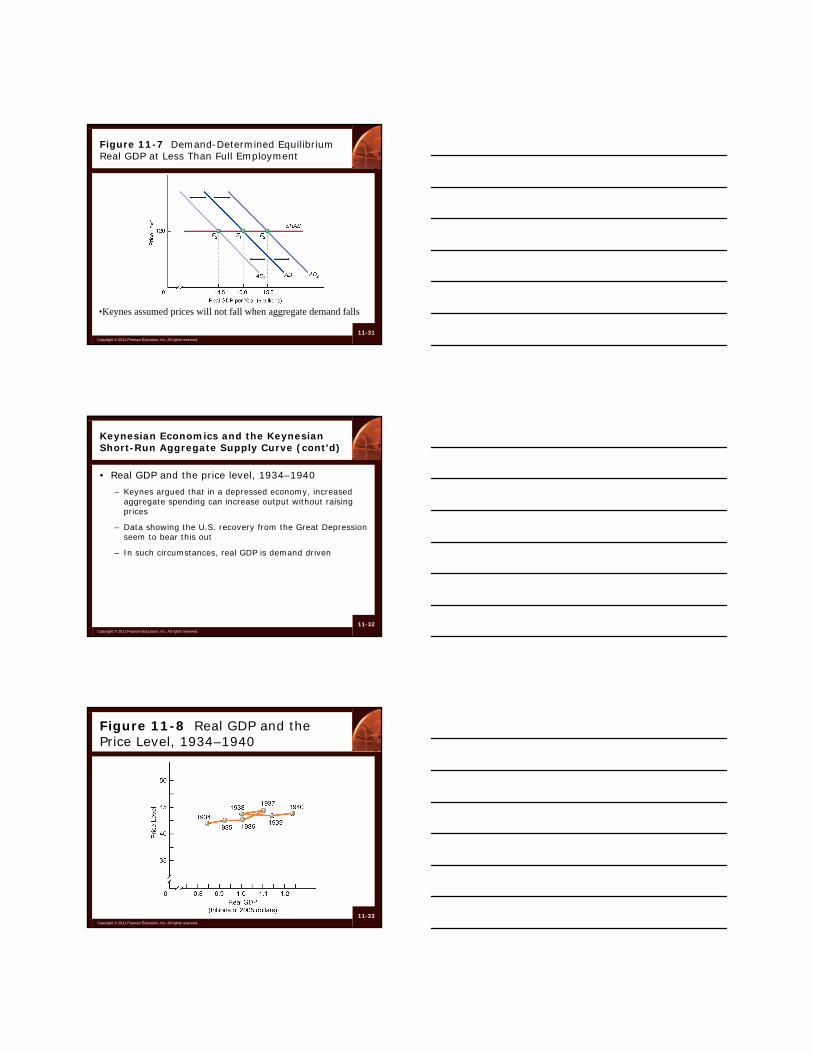
Figure 11-7 Demand-Determined Equilibrium Real GDP at Less Than Full Employment
•Keynes assumed prices will not fall when aggregate demand falls
11-32Copyright © 2011 Pearson Education, Inc. All rights reserved.
Keynesian Economics and the Keynesian Short-Run Aggregate Supply Curve (cont'd)
• Real GDP and the price level, 1934–1940
– Keynes argued that in a depressed economy, increased aggregate spending can increase output without raising prices
– Data showing the U.S. recovery from the Great Depression seem to bear this out
– In such circumstances, real GDP is demand driven
11-33Copyright © 2011 Pearson Education, Inc. All rights reserved.
Figure 11-8 Real GDP and the Price Level, 1934–1940

11-34Copyright © 2011 Pearson Education, Inc. All rights reserved.
Keynesian Economics and the Keynesian Short-Run Aggregate Supply Curve (cont'd)
• The Keynesian model
– Equilibrium GDP is demand-determined
– The Keynesian short-run aggregate supply schedule shows sources of price rigidities• Union and long-term contracts explain inflexibility of
nominal wage rates
11-35Copyright © 2011 Pearson Education, Inc. All rights reserved.
Example: Are the U.S. and European SRAS Curves Horizontal?
• New Keynesians contend that the SRAS is essentially flat
• Based on research, they contend SRAS is horizontal because firms adjust their prices about once a year
• If the SRAS schedule were really horizontal, how could the price level ever increase?
11-36Copyright © 2011 Pearson Education, Inc. All rights reserved.
Output Determination Using Aggregate Demand and Aggregate Supply: Fixed versus Changing Price Levels in the Short Run
• The underlying assumption of the simplified Keynesian model is that the relevant range of the short-run aggregate supply schedule (SRAS) is horizontal
11-37Copyright © 2011 Pearson Education, Inc. All rights reserved.
Output Determination Using Aggregate Demand and Aggregate Supply: Fixed versus Changing Price Levels in the Short Run (cont'd)
• The price level has drifted upward in recent decades
• Prices are not totally sticky
• Modern Keynesian analysis recognizes some—but not complete—price adjustment takes place in the short run
11-38Copyright © 2011 Pearson Education, Inc. All rights reserved.
Output Determination Using Aggregate Demand and Aggregate Supply: Fixed versus Changing Price Levels in the Short Run (cont'd)
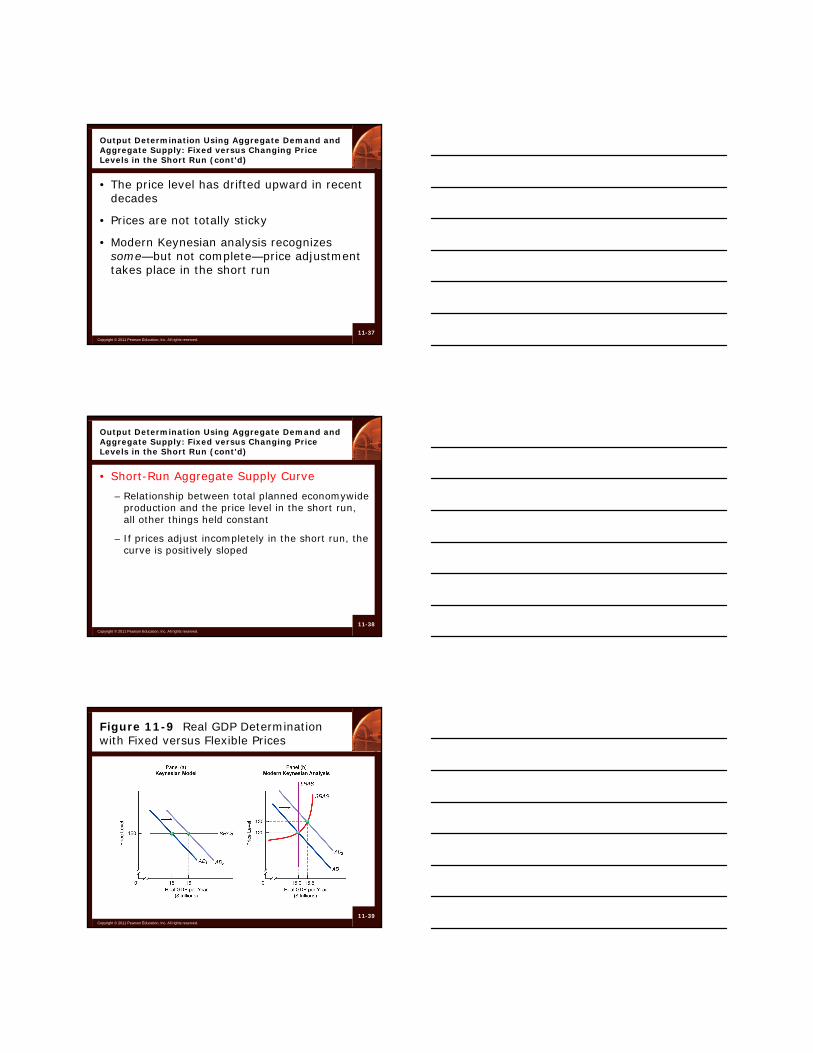
• Short-Run Aggregate Supply Curve
– Relationship between total planned economywide production and the price level in the short run, all other things held constant
– If prices adjust incompletely in the short run, the curve is positively sloped
11-39Copyright © 2011 Pearson Education, Inc. All rights reserved.
Figure 11-9 Real GDP Determination with Fixed versus Flexible Prices

11-40Copyright © 2011 Pearson Education, Inc. All rights reserved.
Output Determination Using Aggregate Demand and Aggregate Supply: Fixed versus Changing Price Levels in the Short Run (cont'd)
• In modern Keynesian short run, when the price level rises partially, real GDP can be expanded beyond the level consistent with its long-run growth path
11-41Copyright © 2011 Pearson Education, Inc. All rights reserved.
Output Determination Using Aggregate Demand and Aggregate Supply: Fixed versus Changing Price Levels in the Short Run (cont'd)
• All these adjustments cause real GDP to rise as the price level increases
– Firms use workers more intensively, (getting workers to work harder)
– Existing capital equipment used more intensively, (use machines longer)
– If wage rates held constant, a higher price level leads to increased profits, which leads to lower unemployment as firms hire more
11-42Copyright © 2011 Pearson Education, Inc. All rights reserved.
Shifts in the Aggregate Supply Curve
• Just as non-price-level factors can cause a shift in the aggregate demand curve, there are non-price-level factors that can cause a shift in the aggregate supply curve

11-43Copyright © 2011 Pearson Education, Inc. All rights reserved.
Shifts in the Aggregate Supply Curve (cont'd)
• Shifts in both the short- and long-run aggregate supply
– Includes any change in our endowments of the factors of production
• Shifts in SRAS only
– Includes changes in production input prices, particularly those caused by temporary external events
11-44Copyright © 2011 Pearson Education, Inc. All rights reserved.
Figure 11-10 Shifts in Both Short- and Long-Run Aggregate Supply
11-45Copyright © 2011 Pearson Education, Inc. All rights reserved.
Figure 11-11 Shifts in SRAS Only

11-46Copyright © 2011 Pearson Education, Inc. All rights reserved.
Table 11-2 Determinants of Aggregate Supply
11-47Copyright © 2011 Pearson Education, Inc. All rights reserved.
Policy Example: The Aggregate Supply Impact of Cuts in U.S. Marginal Tax Rates
• In 2003, Congress reduced marginal tax rates applicable to earned income, capital gains, and dividend income
• The U.S. Treasury estimates that the long-run effect of these tax rate cuts has been a 0.7 percent increase in annual real GDP
• Thus, these marginal tax rate cuts together generated rightward shifts in the LRAS and SRAS curves of about $96 billion, in constant dollars, per year
11-48Copyright © 2011 Pearson Education, Inc. All rights reserved.
Consequences of Changes in Aggregate Demand
• Aggregate Demand Shock – Any event that causes the aggregate demand
curve to shift inward or outward
• Aggregate Supply Shock– Any event that causes the aggregate supply
curve to shift inward or outward
11-49Copyright © 2011 Pearson Education, Inc. All rights reserved.
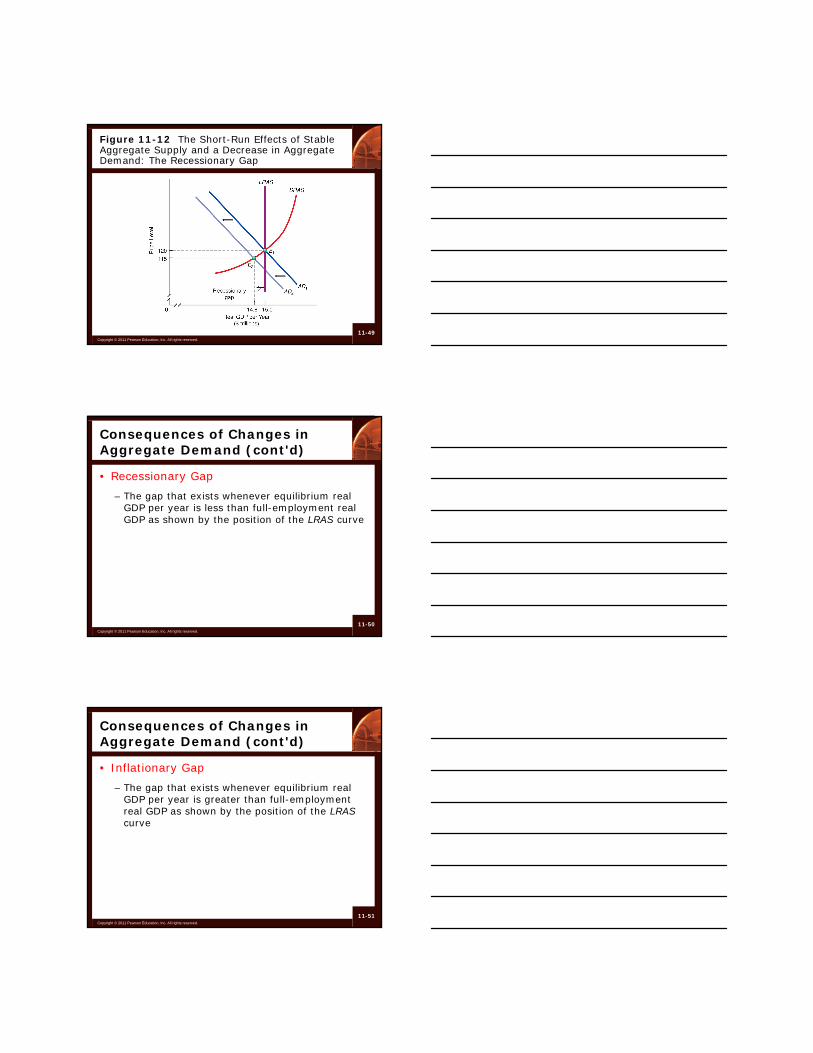
Figure 11-12 The Short-Run Effects of Stable Aggregate Supply and a Decrease in Aggregate Demand: The Recessionary Gap
11-50Copyright © 2011 Pearson Education, Inc. All rights reserved.
Consequences of Changes in Aggregate Demand (cont'd)
• Recessionary Gap
– The gap that exists whenever equilibrium real GDP per year is less than full-employment real GDP as shown by the position of the LRAS curve
11-51Copyright © 2011 Pearson Education, Inc. All rights reserved.
Consequences of Changes in Aggregate Demand (cont'd)
• Inflationary Gap
– The gap that exists whenever equilibrium real GDP per year is greater than full-employment real GDP as shown by the position of the LRAS curve
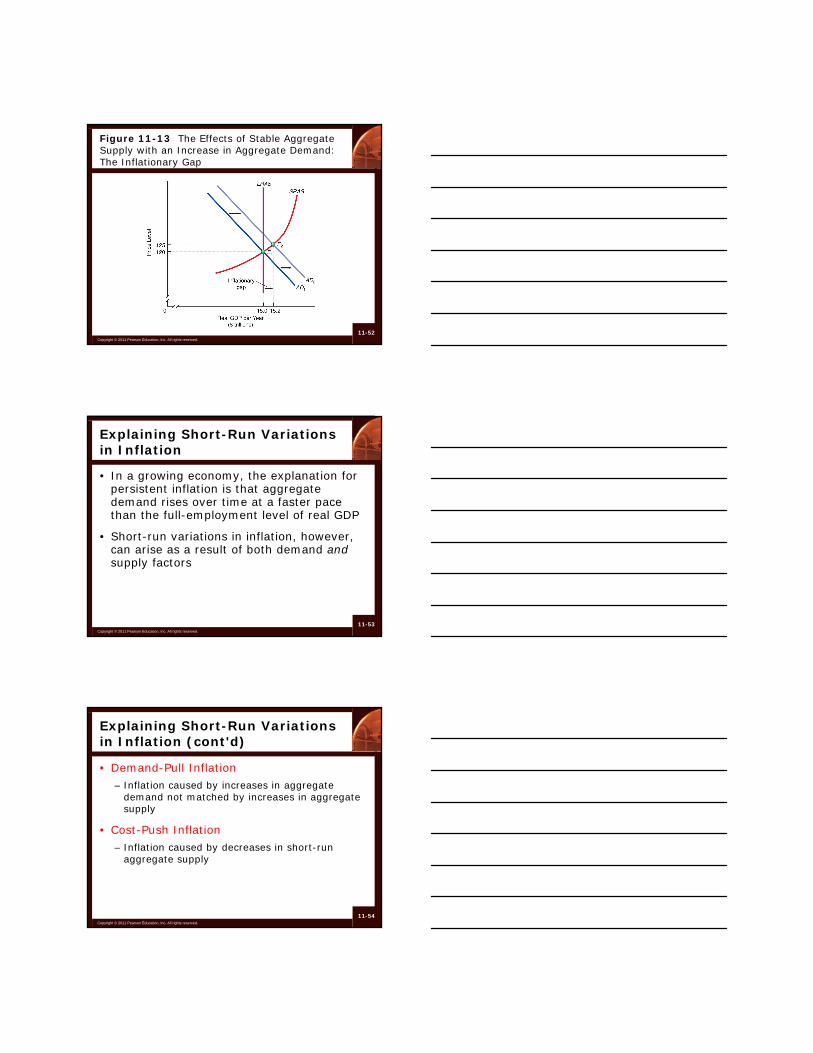
11-52Copyright © 2011 Pearson Education, Inc. All rights reserved.
Figure 11-13 The Effects of Stable Aggregate Supply with an Increase in Aggregate Demand: The Inflationary Gap
11-53Copyright © 2011 Pearson Education, Inc. All rights reserved.
Explaining Short-Run Variations in Inflation
• In a growing economy, the explanation for persistent inflation is that aggregate demand rises over time at a faster pace than the full-employment level of real GDP
• Short-run variations in inflation, however, can arise as a result of both demand andsupply factors
11-54Copyright © 2011 Pearson Education, Inc. All rights reserved.
Explaining Short-Run Variations in Inflation (cont'd)
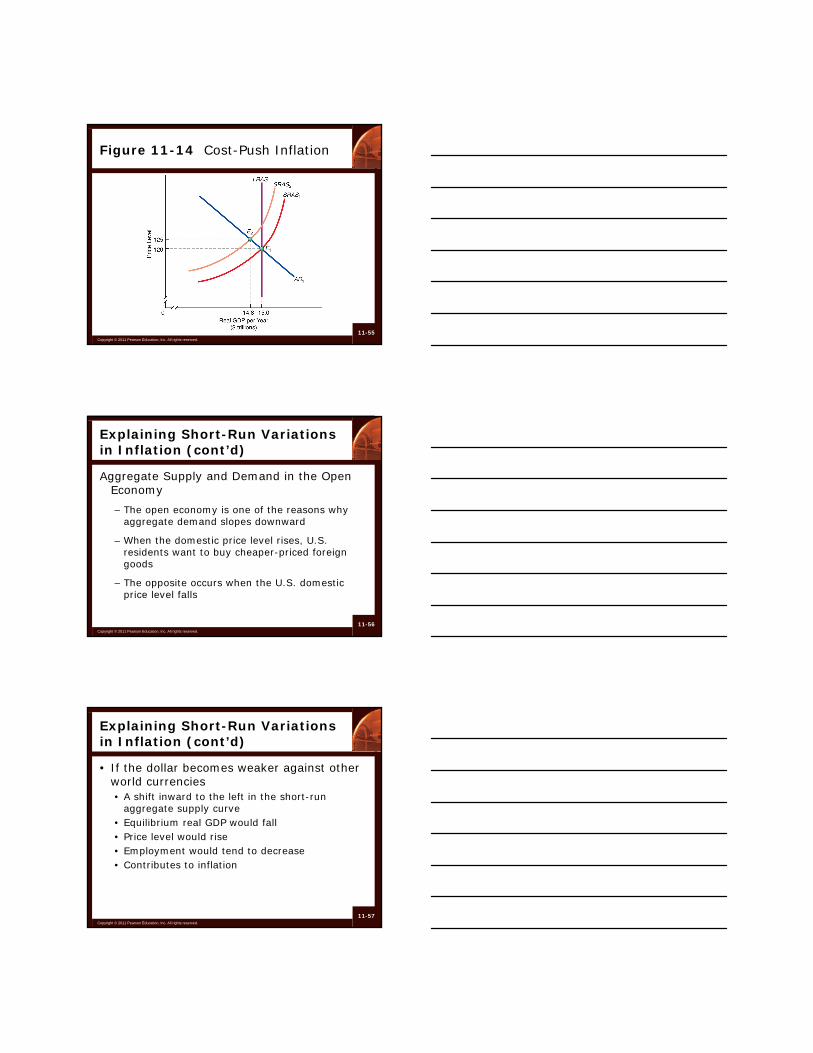
• Demand-Pull Inflation– Inflation caused by increases in aggregate
demand not matched by increases in aggregate supply
• Cost-Push Inflation– Inflation caused by decreases in short-run
aggregate supply
11-55Copyright © 2011 Pearson Education, Inc. All rights reserved.
Figure 11-14 Cost-Push Inflation
11-56Copyright © 2011 Pearson Education, Inc. All rights reserved.
Explaining Short-Run Variations in Inflation (cont’d)
Aggregate Supply and Demand in the Open Economy
– The open economy is one of the reasons why aggregate demand slopes downward
– When the domestic price level rises, U.S. residents want to buy cheaper-priced foreign goods
– The opposite occurs when the U.S. domestic price level falls
11-57Copyright © 2011 Pearson Education, Inc. All rights reserved.
Explaining Short-Run Variations in Inflation (cont’d)
• If the dollar becomes weaker against other world currencies• A shift inward to the left in the short-run
aggregate supply curve• Equilibrium real GDP would fall• Price level would rise• Employment would tend to decrease• Contributes to inflation
11-58Copyright © 2011 Pearson Education, Inc. All rights reserved.
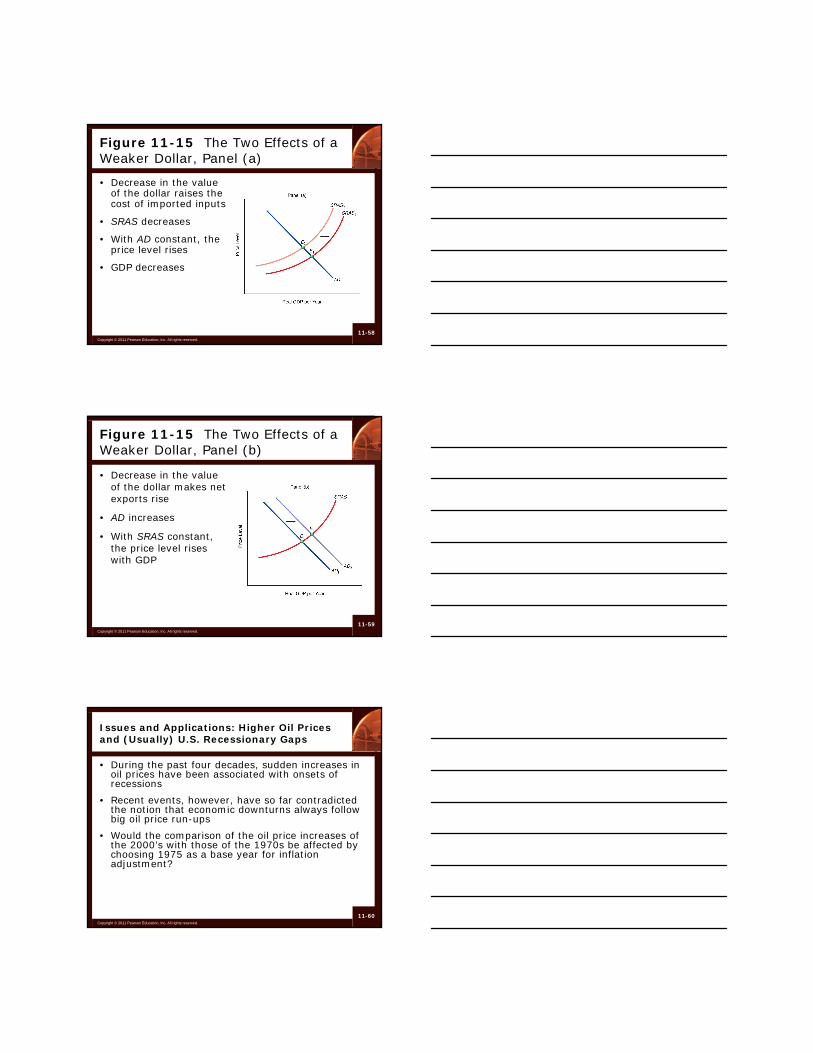
Figure 11-15 The Two Effects of a Weaker Dollar, Panel (a)
• Decrease in the value of the dollar raises the cost of imported inputs
• SRAS decreases
• With AD constant, the price level rises
• GDP decreases
11-59Copyright © 2011 Pearson Education, Inc. All rights reserved.
Figure 11-15 The Two Effects of a Weaker Dollar, Panel (b)
• Decrease in the value of the dollar makes net exports rise
• AD increases
• With SRAS constant, the price level rises with GDP
11-60Copyright © 2011 Pearson Education, Inc. All rights reserved.
Issues and Applications: Higher Oil Prices and (Usually) U.S. Recessionary Gaps
• During the past four decades, sudden increases in oil prices have been associated with onsets of recessions
• Recent events, however, have so far contradicted the notion that economic downturns always follow big oil price run-ups
• Would the comparison of the oil price increases of the 2000’s with those of the 1970s be affected by choosing 1975 as a base year for inflation adjustment?

11-61Copyright © 2011 Pearson Education, Inc. All rights reserved.
Figure 11-16 Real Oil Prices and Year-to-Year Growth in U.S. Personal Consumption Expenditures Since 1970
11-62Copyright © 2011 Pearson Education, Inc. All rights reserved.
Summary Discussion of Learning Objectives
• The four assumptions of the classical model are
1. Pure competition prevails
2. Wages and prices are flexible
3. People are motivated by self-interest
4. No money illusion
11-63Copyright © 2011 Pearson Education, Inc. All rights reserved.
Summary Discussion of Learning Objectives (cont'd)
• Short-run determination of equilibrium real GDP and the price level in the classical model– The short-run aggregate supply curve is vertical at full-
employment real GDP
– Even in the short run, real GDP cannot increase in the absence of changes in factors of production that induce longer-term economic growth
– Movements in equilibrium price level are generated by variations in position of AD curve

11-64Copyright © 2011 Pearson Education, Inc. All rights reserved.
Summary Discussion of Learning Objectives (cont'd)
• Circumstances under which the SRAS may be horizontal or upward sloping
– If product prices and wages and other input prices are “sticky,” the SRAS curve can be horizontal over much of its range
– This is the Keynesian SRAS curve
11-65Copyright © 2011 Pearson Education, Inc. All rights reserved.
Summary Discussion of Learning Objectives (cont'd)
• Factors that induce shifts in the SRAS and LRAS curves
– LRAS shifts in response to changes in the availability of labor or capital or to changes in technology and productivity
– Changes in these factors also cause the SRAScurve to shift
11-66Copyright © 2011 Pearson Education, Inc. All rights reserved.
Summary Discussion of Learning Objectives (cont'd)
• Effects of aggregate demand and supply shocks on equilibrium real GDP in the short run
– Shock that causes AD to shift leftward and pushes equilibrium real GDP below full-employment real GDP in the short run, so there is a recessionary gap

11-67Copyright © 2011 Pearson Education, Inc. All rights reserved.
Summary Discussion of Learning Objectives (cont'd)
• Effects of aggregate demand and supply shocks on equilibrium real GDP in the short run
– Shock that induces a rightward shift in the AD curve and results in an inflationary gap in which short-run equilibrium real GDP exceeds full-employment
11-68Copyright © 2011 Pearson Education, Inc. All rights reserved.
Summary Discussion of Learning Objectives (cont'd)
• Causes of short-run variations in the inflation rate
– An increase in aggregate demand
• Demand-pull
– A decrease in short-run aggregate supply
• Cost-push