Embed Size (px)
Citation preview
1
CHAPTER 1
INTRODUCTION
The enduring growth of wireless digital communications, as well as the increasing
number of wireless users, has raised the spectrum shortage in the last decade. With
this growth, the accessibility of high quality wireless communication spectrum
becomes severely inadequate [1]. Inflexible spectrum management approach
implemented by the government regulatory agencies in assigning specified frequency
band and allowed operator to strictly bind within the band. This approach is termed as
fixed spectrum allocation scheme. Most of the prime radio spectrum is assigned
exclusively for existing services and applications. So it is becoming very hard to find
empty band [2] to deploy new services or enhancing the existing services or providing
services to the new users entering into the existing system. This kind of problem is
severe in metropolitan areas. However, measurements carried out in various countries
shows that most of the radio spectrum is utilized inefficiently. In fact, the Federal
Communications Commission (FCC), United States of America has reported the
temporal and geographical variations in spectrum utilization in the range of 15% to
85%. Particularly spectrum allocated for Television (TV) bands in India is utilized in
the range of 10% to 50% that varies from one geographical area to other [3].
Therefore the real problem is not spectrum scarcity but inefficient spectrum allocation
and usage. This is due to
Fixed spectrum allocation for applications
Firm regulations
Rigid radio functions and
Restricted network conditions
1.1 India’s National Frequency Allocation Plan
The National Frequency Allocation Plan (NFAP) outline the basis for
development of wireless equipment and spectrum utilization in the country
[4, 5]. Frequency bands allocated to various types of radio services in India are
as follows:
1 - 87.5 MHz is used for marine and aeronautical navigation, short and
medium wave radio, amateur (Ham) radio and cordless phones.
2
87.5 - 108 MHz is used for FM radio broadcasts.
109-173MHz used for Satellite communication, aeronautical
navigation and outdoor broadcast vehicles.
174 - 230 MHz not allocated.
230 - 450 MHz used for Satellite communication, aeronautical
navigation and outdoor broadcast vehicles.
450- 585 MHz is not allocated.
585-698 MHz is used for TV broadcast.
698-806 MHz not allocated.
806-960 MHz is used by GSM and CDMA mobile services.
960-1710 MHz is used for Aeronautical and space
1710- 1930 MHz is used for GSM mobile services.
1930-2010 MHz is used by defence forces.
2010-2025 MHz is not allocated.
2025-2110 MHz is used for Satellite and space communications.
2110-2170 MHz is not allocated.
2170-2300 MHz is used for Satellite and space communications.
2300-2400 MHz is not allocated.
2400- 2483.5 MHz used for Wi-Fi and Bluetooth short range services.
2483.5-3300 MHz Space communications.
3300-3600 MHz not allocated.
3600-10000 MHz Space research, radio navigation.
10000 MHz used for satellite downlink for broadcast and DTH
services.
From the above plan, it is clear that the spectrum is not utilized completely. That is
the reason why Joseph Mitola coined cognitive radio technology [1]. The static
frequency band allocation scheme currently followed cannot accommodate the latest
requirements of band headed for development of applications and addition of users in
the existing services.
3
1.2 Growth of Mobile Services and Users in India
India has the fastest growing telecom network in the world with its high population
and development potential. The major operators in India are BSNL, Airtel, Vodafone,
Idea, Uninor, Reliance, Tata docomo, Aircel, Tata Indicom and MTNL. However,
rural India stills lacks strong infrastructure. India's public sector telecom
company BSNL is the 7th largest telecom company in world.
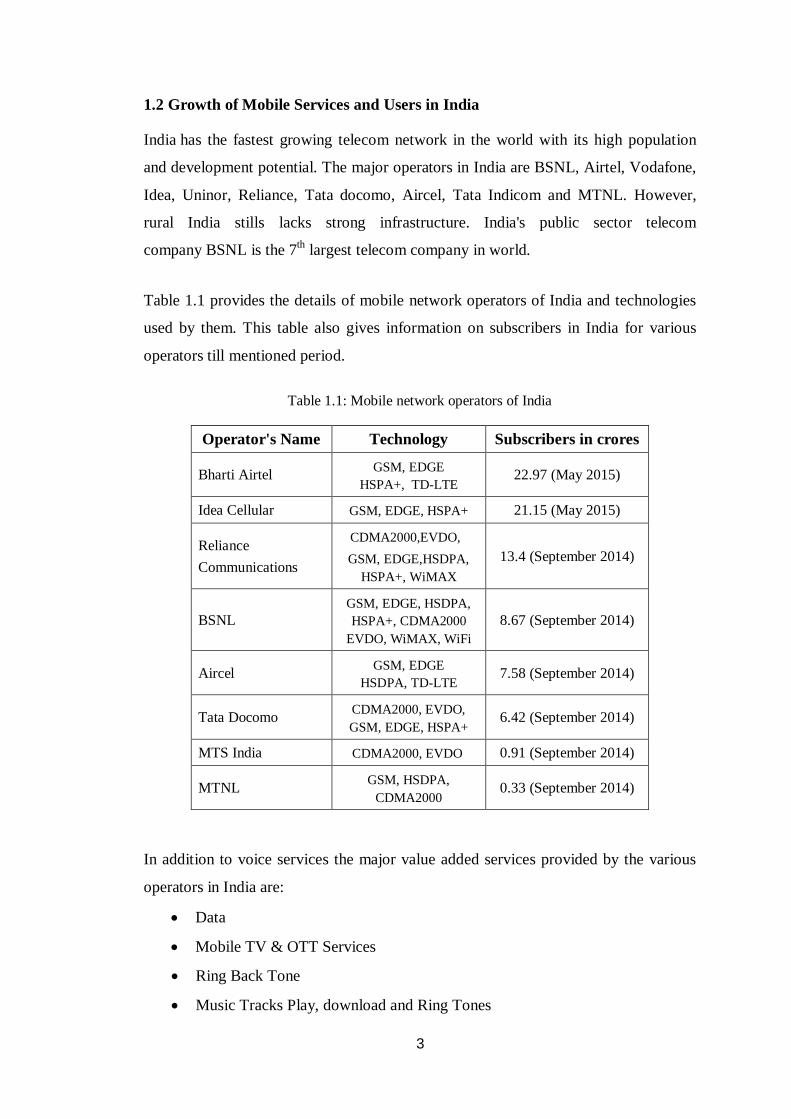
Table 1.1 provides the details of mobile network operators of India and technologies
used by them. This table also gives information on subscribers in India for various
operators till mentioned period.
Table 1.1: Mobile network operators of India
Operator's Name Technology Subscribers in crores
Bharti Airtel GSM, EDGE HSPA+, TD-LTE
22.97 (May 2015)
Idea Cellular GSM, EDGE, HSPA+ 21.15 (May 2015)
Reliance Communications
CDMA2000,EVDO, GSM, EDGE,HSDPA,
HSPA+, WiMAX 13.4 (September 2014)
BSNL GSM, EDGE, HSDPA, HSPA+, CDMA2000
EVDO, WiMAX, WiFi 8.67 (September 2014)
Aircel GSM, EDGE HSDPA, TD-LTE
7.58 (September 2014)
Tata Docomo CDMA2000, EVDO, GSM, EDGE, HSPA+
6.42 (September 2014)
MTS India CDMA2000, EVDO 0.91 (September 2014)
MTNL GSM, HSDPA, CDMA2000
0.33 (September 2014)
In addition to voice services the major value added services provided by the various
operators in India are:
Data
Mobile TV & OTT Services
Ring Back Tone
Music Tracks Play, download and Ring Tones
4
Sports, Information and Entertainment Services
Location Based Services
Missed Call Alerts and Voice Mail Box
Online Gaming
Live Streaming
Devotional Applications
Mobile Money & M-commerce based services
Mobile Advertisements
Contests & Voting
Phone Backup and Security Services
Outbound Dialer Services
WAP content downloads
Utility Services
Stickering
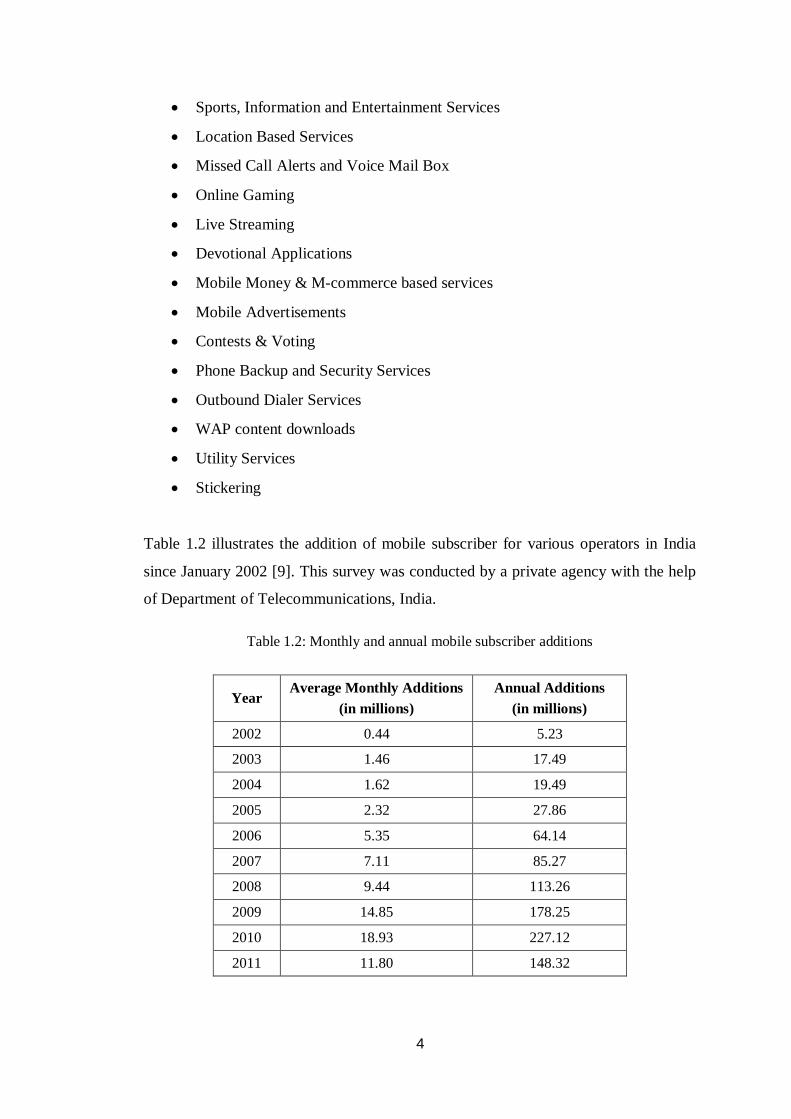
Table 1.2 illustrates the addition of mobile subscriber for various operators in India
since January 2002 [9]. This survey was conducted by a private agency with the help
of Department of Telecommunications, India.
Table 1.2: Monthly and annual mobile subscriber additions
Year Average Monthly Additions
(in millions) Annual Additions
(in millions)
2002 0.44 5.23
2003 1.46 17.49
2004 1.62 19.49
2005 2.32 27.86
2006 5.35 64.14
2007 7.11 85.27
2008 9.44 113.26
2009 14.85 178.25
2010 18.93 227.12
2011 11.80 148.32

5
Another survey was conducted during November 2014 by the Department of
Telecommunication. The details of the survey are shown in Fig. 1.1. The mobile user
additions are very high in urban areas rather than rural areas. The graph shows there
was an exponential growth during 2012 to 2013.
Fig. 1.1: Mobile user growth chart in India
1.3 White Spaces
White spaces refers to portions of licensed radio spectrum that do not use all of the
time or in all geographical locations. The other name for white spaces is spectrum
holes. Fig.1.2 shows the white spaces in time and frequency domain.
Fig. 1.2: White Spaces in time and frequency domain

6
1.3.1 TV White Spaces in India
The white spaces in the TV spectrum are located in VHF (54-216 MHz) and
UHF (470-698 MHz) bands which has characteristics that make it highly desirable for
wireless communications. Presently, some channels are being also used for other
services in sharing with broadcasting services.
The frequency allocated for TV broadcasting in very high frequency (VHF) and ultra
high frequency (UHF) bands are shown below.
Freq. 54 72 76 88 108 174 216 470 698 (MHz)
Almost 50% of the band is unoccupied and whereas the occupied band is also not
utilizing all the time in all geographical areas. Doordarshan is the only terrestrial TV
broadcaster in India with 7MHz Radio Frequency (RF) bandwidth in VHF & 8MHz
in UHF. More than 30 carriers have been assigned to Doordarshan. Except metros,
transmission is still analog. BSNL, MTNL and Reliance Communication are the
major mobile TV operators in India [3]. Government of India has taken a step to
switch the analog transmissions to digital in four phases.
For this work, the White spaces data in India is collected from IITB, Mumbai during
16-17 December, 2012. The data was focused on TV bands VHF & UHF, FM
broadcasting, De-licensed bands and ISM bands. The data was provided by Dr. Ashok
Chandra, Wireless Advisor, The Wireless Planning and Coordination (WPC),
Ministry of Telecommunications, Government of India [111].

7
1.3.2 Other White Spaces in India
Other than TV broadcasting, there are FM and digital audio broadcasting in India. The
frequency allocation for these broadcasting is as follows:
FM Broadcasting: 91.5-95 MHz.
Private FM Broadcasting: 88 – 100 MHz and 103.8 – 108 MHz.
Digital Audio Broadcasting: 174 – 230 MHz.
Digital broadcasting services: 585 – 698 MHz.
1.3.3 De-licensed Bands in India
In India, there are some bands neither licensed nor unlicensed. These bands are
reserved for special applications are strictly restricted for sharing with other services.
The frequency allocations of such bands are given below:
Low power RF devices: 13.553- 13.567 MHz.
Wireless equipment (Effective Radiated Power- 5 W): 26.957- 27.283 MHz.
Medical wireless devices (Power - 25 mW): 402-405 MHz.
Low power short range (10 mW, BW=10 KHz): 433-434 MHz.
Low power cordless telephone system: 926-926.5 MHz.
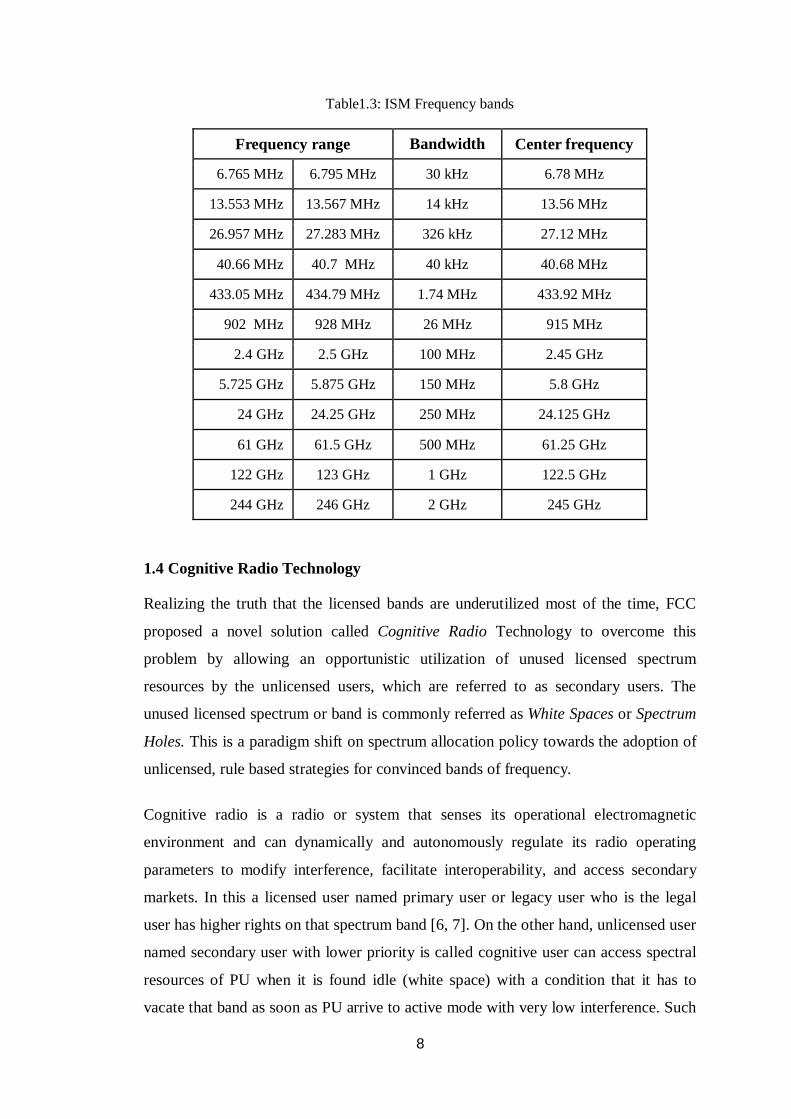
1.3.4 Un-licensed Bands in India
The Industrial, Scientific and Medical (ISM) radio bands are reserved internationally
for the use of radio frequency energy for industrial, scientific and medical purposes
other than commercial telecommunications. The details of frequencies allocated and
bandwidth available for ISM bands are specified in Table 1.3.
8
Table1.3: ISM Frequency bands
Frequency range Bandwidth Center frequency
6.765 MHz 6.795 MHz 30 kHz 6.78 MHz
13.553 MHz 13.567 MHz 14 kHz 13.56 MHz
26.957 MHz 27.283 MHz 326 kHz 27.12 MHz
40.66 MHz 40.7 MHz 40 kHz 40.68 MHz
433.05 MHz 434.79 MHz 1.74 MHz 433.92 MHz
902 MHz 928 MHz 26 MHz 915 MHz
2.4 GHz 2.5 GHz 100 MHz 2.45 GHz
5.725 GHz 5.875 GHz 150 MHz 5.8 GHz
24 GHz 24.25 GHz 250 MHz 24.125 GHz
61 GHz 61.5 GHz 500 MHz 61.25 GHz
122 GHz 123 GHz 1 GHz 122.5 GHz
244 GHz 246 GHz 2 GHz 245 GHz
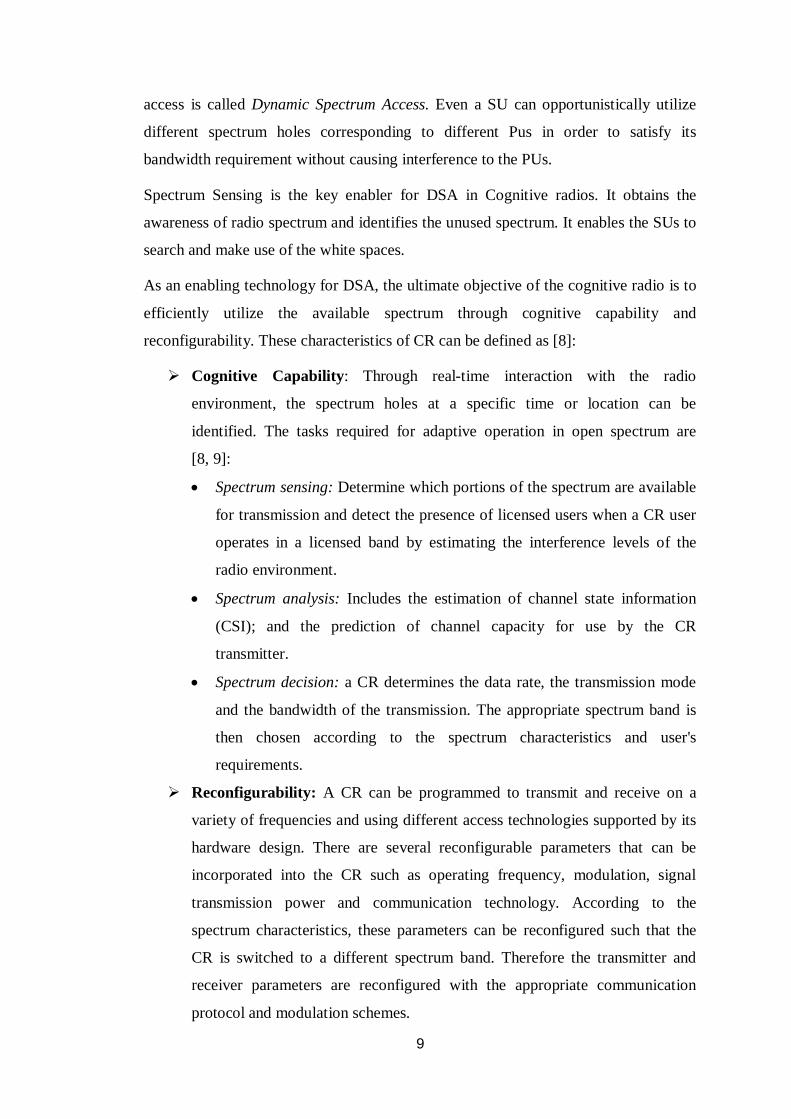
1.4 Cognitive Radio Technology
Realizing the truth that the licensed bands are underutilized most of the time, FCC
proposed a novel solution called Cognitive Radio Technology to overcome this
problem by allowing an opportunistic utilization of unused licensed spectrum
resources by the unlicensed users, which are referred to as secondary users. The
unused licensed spectrum or band is commonly referred as White Spaces or Spectrum
Holes. This is a paradigm shift on spectrum allocation policy towards the adoption of
unlicensed, rule based strategies for convinced bands of frequency.
Cognitive radio is a radio or system that senses its operational electromagnetic
environment and can dynamically and autonomously regulate its radio operating
parameters to modify interference, facilitate interoperability, and access secondary
markets. In this a licensed user named primary user or legacy user who is the legal
user has higher rights on that spectrum band [6, 7]. On the other hand, unlicensed user
named secondary user with lower priority is called cognitive user can access spectral
resources of PU when it is found idle (white space) with a condition that it has to
vacate that band as soon as PU arrive to active mode with very low interference. Such
9
access is called Dynamic Spectrum Access. Even a SU can opportunistically utilize
different spectrum holes corresponding to different Pus in order to satisfy its
bandwidth requirement without causing interference to the PUs.
Spectrum Sensing is the key enabler for DSA in Cognitive radios. It obtains the
awareness of radio spectrum and identifies the unused spectrum. It enables the SUs to
search and make use of the white spaces.
As an enabling technology for DSA, the ultimate objective of the cognitive radio is to
efficiently utilize the available spectrum through cognitive capability and
reconfigurability. These characteristics of CR can be defined as [8]:
Cognitive Capability: Through real-time interaction with the radio
environment, the spectrum holes at a specific time or location can be
identified. The tasks required for adaptive operation in open spectrum are
[8, 9]:
Spectrum sensing: Determine which portions of the spectrum are available
for transmission and detect the presence of licensed users when a CR user
operates in a licensed band by estimating the interference levels of the
radio environment.
Spectrum analysis: Includes the estimation of channel state information
(CSI); and the prediction of channel capacity for use by the CR
transmitter.
Spectrum decision: a CR determines the data rate, the transmission mode
and the bandwidth of the transmission. The appropriate spectrum band is
then chosen according to the spectrum characteristics and user's
requirements.
Reconfigurability: A CR can be programmed to transmit and receive on a
variety of frequencies and using different access technologies supported by its
hardware design. There are several reconfigurable parameters that can be
incorporated into the CR such as operating frequency, modulation, signal
transmission power and communication technology. According to the
spectrum characteristics, these parameters can be reconfigured such that the
CR is switched to a different spectrum band. Therefore the transmitter and
receiver parameters are reconfigured with the appropriate communication
protocol and modulation schemes.
10
If spectrum sensing is done by an individual SU then it is called as Single User
Sensing or Local Detection. Local detection becomes complicated in challenging
propagation environments like
Multipath fading
Doppler spread and
Shadowing
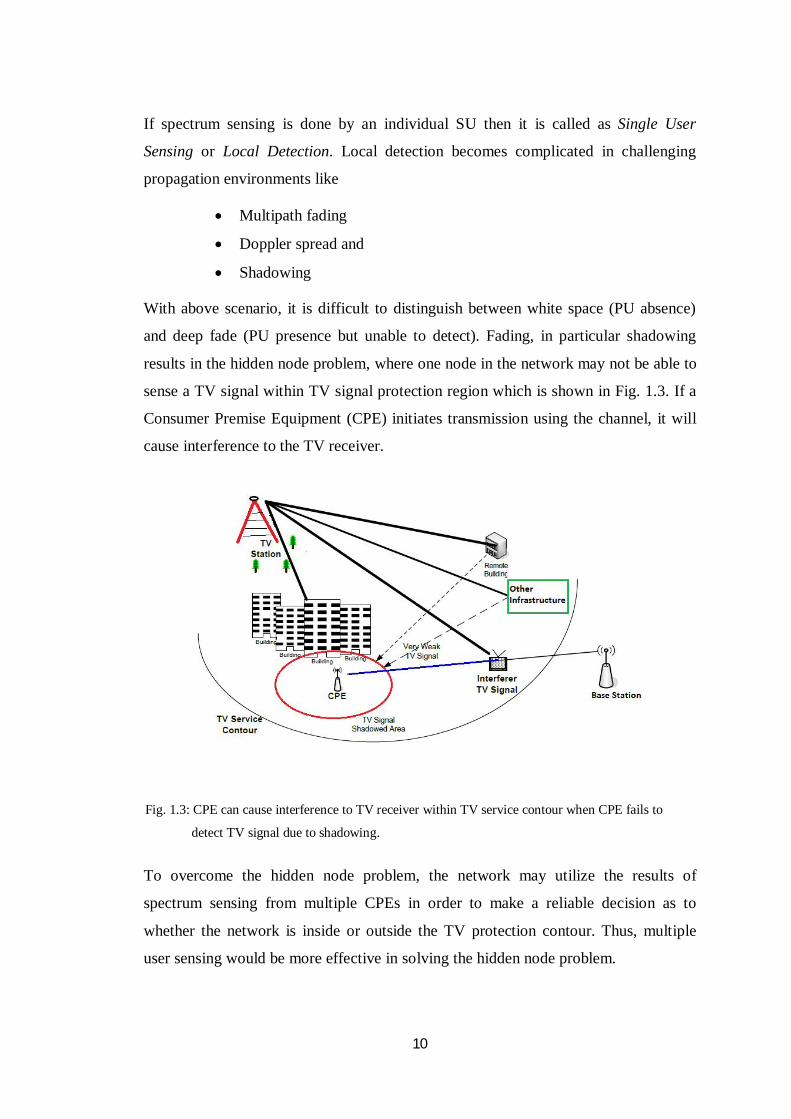
With above scenario, it is difficult to distinguish between white space (PU absence)
and deep fade (PU presence but unable to detect). Fading, in particular shadowing
results in the hidden node problem, where one node in the network may not be able to
sense a TV signal within TV signal protection region which is shown in Fig. 1.3. If a
Consumer Premise Equipment (CPE) initiates transmission using the channel, it will
cause interference to the TV receiver.
Fig. 1.3: CPE can cause interference to TV receiver within TV service contour when CPE fails to
detect TV signal due to shadowing.
To overcome the hidden node problem, the network may utilize the results of
spectrum sensing from multiple CPEs in order to make a reliable decision as to
whether the network is inside or outside the TV protection contour. Thus, multiple
user sensing would be more effective in solving the hidden node problem.

11
1.5 Cooperative Spectrum Sensing
The limitations of single user sensing are overcome with cooperative spectrum
sensing (CSS). In this a group of secondary users are involved in sensing the spectrum
for making a combined decision to detect the presence of a PU. It helps to mitigate the
effects of multipath fading and shadowing. The sensing performance is improved by
exploiting the spatial diversity in the observations of spatially located CR users. The
probability of all the users in challenging environment like multipath fading, Doppler
spread and shadowing are negligible. The CR users share information using
centralized approach. A central entity called Fusion Centre coordinate and assists all
SUs to perform individual spectrum sensing and reporting to it. It takes decision that
which user has to sense which frequency band. After sensing, the local decision is
sent to FC. At FC all local decisions are combined and finally determine the status of
presence of PU based on fusion rule.
In the geolocation method, a centralized database is maintained where PUs register
the data related to coverage area; transmit power and duration of transmission. Then
SUs are allowed to access the database to determine the availability of white spaces in
different geographical locations. In the beacon method, a beacon signal is
continuously transmitted by the primary in a fixed frequency which is treated as
control signal stating that white space of the TV band. The secondary users receives
control signal while sensing then start utilizing the TV band in that particular
geographical area.
The above two methods are not reliable because dedicated standardized channel is
needed to broadcast the beacons. Modification to the current licensed systems and
their deployment is costly. Additional connectivity is needed to access database. If
modification in the functionality of PU changes the database has to be update
immediately in every geographical area to avoid interference. In spectrum sensing
method, SUs as an individual, detects the presence of PU signal by utilizing partial
band of TV spectrum. It requires low infrastructure cost and it is more compatible
with the network infrastructure. Chapter 2 provides detailed overview of all the
methods available in the literature.
12
The FCC has already articulated its interest in permitting unlicensed access to white
spaces in TV spectrum. An example to CR based DSA network in commercial sector
is IEEE 802.22 WRAN (Wireless Regional Area Network) [11] which is the first
worldwide effort to define a novel common air interface standard based on CR.The
IEEE 802.22 WRAN utilizes the unused TV spectrum for its operational band. TV
spectrum is attractive because of its deterministic channel allocation and excellent
radio propagation characteristics [12] and their relatively predictable spatio-temporal
usage characteristics. In addition, the TV bands are heavily underutilized; most TV
channels are unoccupied most of the time. The methods employ to identify the white
spaces are geolocation combined with access to database, beacons, spectrum sensing
or a combination of any of those methods.
1.6 Motivation for the Work
Inefficient spectrum utilization is the motivating force behind cognitive radio and
adopting CR technology to address the spectrum scarcity problem in terms of better
utilization of the spectrum resources. The cognitive radio presents a very productive
area of the research field. Spectrum Sensing examine the frequency spectrum for
empty bands forms the foremost part of the cognitive radio. There are number of
schemes for spectrum sensing like Energy detector, Cyclostationary and Matched
filter. But they require prior knowledge of PU except in energy detector.
Previous works on CSS rely a lot on the idea of sequential spectrum sensing in which
multiple secondary users cooperate to sense a single channel in each sensing period.
However, this traditional cooperative sensing technique [13] may limit the overall
sensing efficiency, which refers to the number of channels or spectrum access
opportunities that can be discovered in each sensing period. Therefore, it is important
to investigate other cooperative sensing techniques that can enhance the sensing
efficiency by simultaneously detecting multiple distinct channels within each sensing
period. This enhancement can result in higher opportunistic throughput for secondary
users.
In co-operative sensing, number of users lead to more overhead [6] and thus takes
time for final decision. Lowering the detection threshold increases the detection as
well as the chances of false detection. Thus one cannot lower the threshold value. This

13
work presents an algorithm for finding an optimal number of users and a couple of
threshold optimization schemes.
The cyclostationary detection method is considered without prior knowledge of
primary user called blind approach [14] at very low Signal-to-Noise Ratio (SNR) for
better performance of detection probability with various peak detection techniques
which discriminate signal from noise. The performances of the proposed schemes are
studied using analytical methods and extensive MATLAB simulations.
1.7 Objectives
It is proposed to use the energy and cyclostationary detection techniques for
sensing the spectrum without prior knowledge of primary user.
To develop undemanding and computationally efficient sensing algorithm
which overcome the drawbacks of techniques proposed in literatures.
To improve the performance, the number of cognitive radio user’s decisions is
optimized for determining the presence or absence of primary user.
Proper time bandwidth product is proposed for better performance of sensing
with less sensing duration.
It is proposed to determine the best threshold fixing in determine the
probability of detection.
To realize and implement various peak detection techniques after evaluating
cyclic domain profile for phase modulation signal to determine the primary
user status of presence or absence at low SNRs.
The conventional and proposed methods of spectrum sensing will be
compared with the performance metrics: probability of detection, detection
threshold and optimal number of cognitive users.
14
1.8 Organization of the Thesis
The entire thesis is organized into six chapters and the contents dealt with are as
follows:
Chapter 1: It deals with the introduction, necessity, motivation and objectives of thesis
work.
Chapter 2: This chapter describes the literature review in the area of Cooperative
spectrum sensing in cognitive radio networks and also provides white
spaces in Indian TV spectrum.
Chapter 3: In this chapter, the Energy detection technique is employed which optimize
the number of cognitive radios involved in cooperative spectrum sensing.
The optimal decision voting rule is chosen to minimize the total error
probability. The performance of the detection is improved by adapting
gradient descent algorithm.
Chapter 4: This chapter explains the signal detection technique subject to a constraint
on the global probability of false alarm and detection. Two models are
formulated. First model is an Energy efficient setup which determines the
minimum number of cognitive radios that satisfies the global probabilities.
Second model Throughput enhancement setup where the throughput of the
cognitive radio network is maximized with optimal number of CR users
and sensing duration.
Chapter 5: This chapter proposes Cyclostationary signal detection techniques without
prior knowledge using peak factor of cycle frequency domain profile or
cyclic domain profile (CDP). The performance is evaluated for the
Absolute Threshold, Standard Deviation and Filtfilt techniques to show the
superiority in terms of probability of detection.
Chapter 6: Summary, conclusions of the research work and scope for future work is
discussed in this chapter.