Embed Size (px)
Citation preview
11
Chapter 1 Energy
Introduction 1.1 This chapter presents figures on overall energy production and consumption. Figures showing the flow of energy from production, transformation and energy industry use through to final consumption are presented in the format of an energy balance based on the individual commodity balances in Chapters 2 to 6. 1.2 The chapter begins with aggregate energy balances covering the last three years (Tables 1.1 to 1.3) starting with the latest year, 2017, compiled using Gross Calorific Values (see paragraph 1.29). Energy value balances then follow this for the same years (Tables 1.4 to 1.6) and Table 1.7 shows sales of electricity and gas by sector in value terms. The explanation of the principles behind the energy balance and commodity balance presentations, and how this links with the figures presented in other chapters, is set out in Annex A. Information on long term trends (Tables 1.1.1 to 1.1.9) are available on BEIS’s energy statistics website at: www.gov.uk/government/collections/digest-of-uk-energy-statistics-dukes
Key points
• In 2017, UK energy production was up 0.4 per cent on a year earlier. The rise was driven by growth from wind, solar and hydro and bioenergy and waste. Overall fossil fuel production contracted with coal reaching a record low. (Tables 1.1 and 1.2).
• Imports and exports in 2017 were both up; overall net imports decreased though they still accounted for 36 per cent of energy used in the UK.
• Primary energy consumption was down 1.2 per cent; and on a temperature adjusted basis
primary energy consumption was down 0.3 per cent continuing the downward trend of the last ten years. UK temperatures were above normal with a decrease in heating degree days compared to 2016. (Table 1.1.7).
• Final energy consumption fell by 0.7 per cent as demand for heating decreased with
temperature adjusted final energy consumption up by 0.9 per cent on 2016 levels, mainly due to increased energy use in transport. (More details are available in Energy Consumption in the UK www.gov.uk/government/collections/energy-consumption-in-the-uk)
• Fossil fuels remain the dominant source of energy supply, but now accounts for 80.1 per
cent, a record low level. Supply from renewables increased, with their contribution accounting for 10.2 per cent of final consumption on the EU agreed basis (see Chapter 6).
• In 2017, there was a switch in the main sources of electricity generation away from coal and gas
to renewables. Generation from coal fell by 27 per cent, gas fell by 4.6 per cent, whilst renewables rose by 19.5 per cent. Renewables’ share of generation was at a record high level of 29.3 per cent in 2017, up from 24.5 per cent in 2016, due to increased renewables generation capacity (wind and solar) and more favourable weather conditions for wind generation (see chapters 5 and 6).
• Provisional BEIS estimates suggest that overall emissions fell by 12 million tonnes of carbon dioxide (MtCO2) (3.2 per cent) to 366.9 MtCO2 between 2016 and 2017, driven by the changes in electricity generation.
12
Aggregate energy balance (Tables 1.1, 1.2 and 1.3) 1.3 These tables show the flows of energy in the United Kingdom from production to final consumption through conversion into secondary fuels such as coke, petroleum products, secondary electricity and heat sold. The figures are presented on an energy supplied basis, in tonnes of oil equivalent (toe), a unit of energy where 1 toe = 41.868 GJ, see also paragraph 1.28 for other energy units. The basic principles of energy balances and guidance on what is included in each row is detailed in Annex A of this publication.
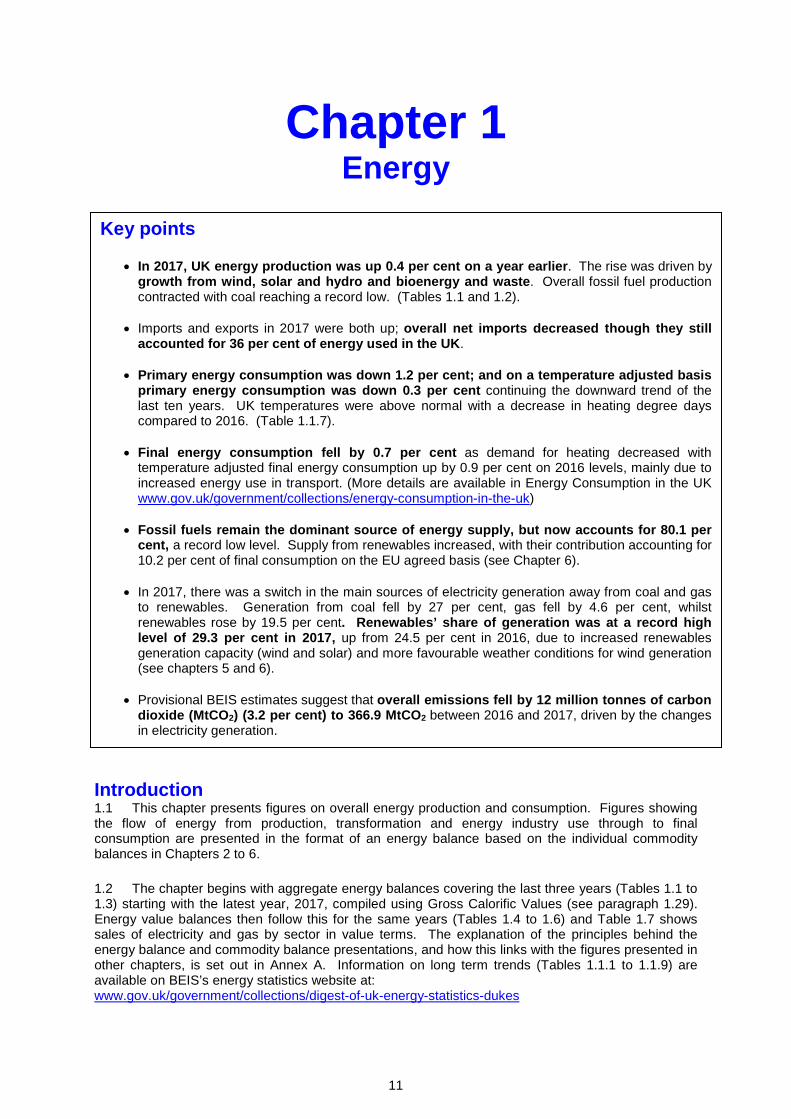
Energy production and supply 1.4 Indigenous production in 2017 was 0.4 per cent higher than in 2016 (Chart 1.1). This small increase is the third consecutive rise since UK energy production peaked in 1999 and is now 57 per cent below that peak with production falling in each of the years between 2000 and 2014 due to declines in output from the UK Continental Shelf (UKCS). The rise in 2017 was due to an increase in renewable fuel production. The combined output of wind, hydro and solar photovoltaics rose by 27 per cent, as wind and solar capacity increased and weather conditions (primarily wind speeds) improved. This was matched with strong growth in bioenergy production, up 9.4 per cent on last year. Although gas production was up slightly (0.3 per cent) overall fossil fuel production contracted with coal posting a new record low. Chart 1.1: UK energy production level Annual growth rate
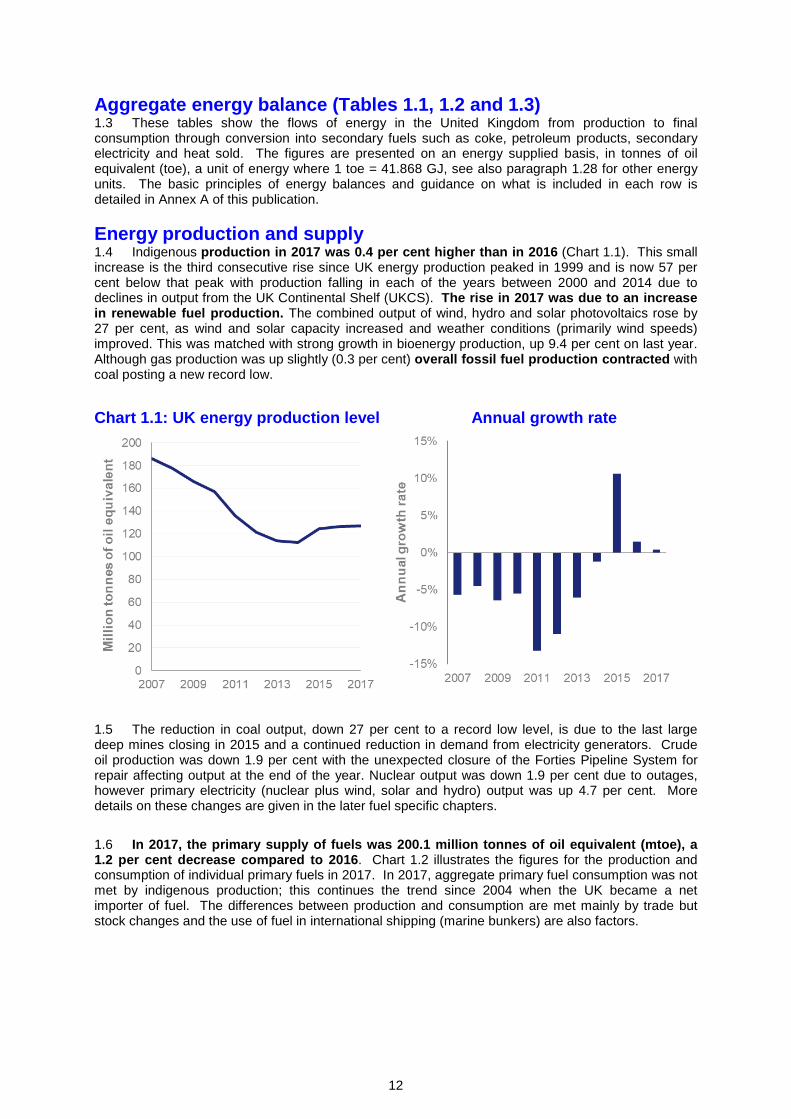
1.5 The reduction in coal output, down 27 per cent to a record low level, is due to the last large deep mines closing in 2015 and a continued reduction in demand from electricity generators. Crude oil production was down 1.9 per cent with the unexpected closure of the Forties Pipeline System for repair affecting output at the end of the year. Nuclear output was down 1.9 per cent due to outages, however primary electricity (nuclear plus wind, solar and hydro) output was up 4.7 per cent. More details on these changes are given in the later fuel specific chapters. 1.6 In 2017, the primary supply of fuels was 200.1 million tonnes of oil equivalent (mtoe), a 1.2 per cent decrease compared to 2016. Chart 1.2 illustrates the figures for the production and consumption of individual primary fuels in 2017. In 2017, aggregate primary fuel consumption was not met by indigenous production; this continues the trend since 2004 when the UK became a net importer of fuel. The differences between production and consumption are met mainly by trade but stock changes and the use of fuel in international shipping (marine bunkers) are also factors.
13
Chart 1.2: Production and consumption of primary fuels 2017
1.7 As explained in subsequent chapters, the UK has traded fuels such as oil and gas regardless of whether it has been a net exporter or importer. Imports in 2017 at 151.9 million toe rose by 1.2 per cent from 2016 but are down 16 per cent from their peak in 2013. Imports of petroleum products and gas fell, but these were more than offset by the rise in imports of primary oil which were up by 9.4 per cent to meet UK refinery demand. Exports at 79.3 million toe were up 4.7 per cent, as a result of OPEC production cuts making it cheaper for Asian refineries to use UK supplies resulting in an increase of 10.1 per cent in crude oil exports. The UK remained a net importer of all main fuel types in 2017. In 2017 the UK net import gap fell back to 72.6 million toe from the 2013 peak of 104 million toe. Net imports accounted for 36 per cent of energy used in the UK in 2017, down from their share of 48 per cent in 2013.
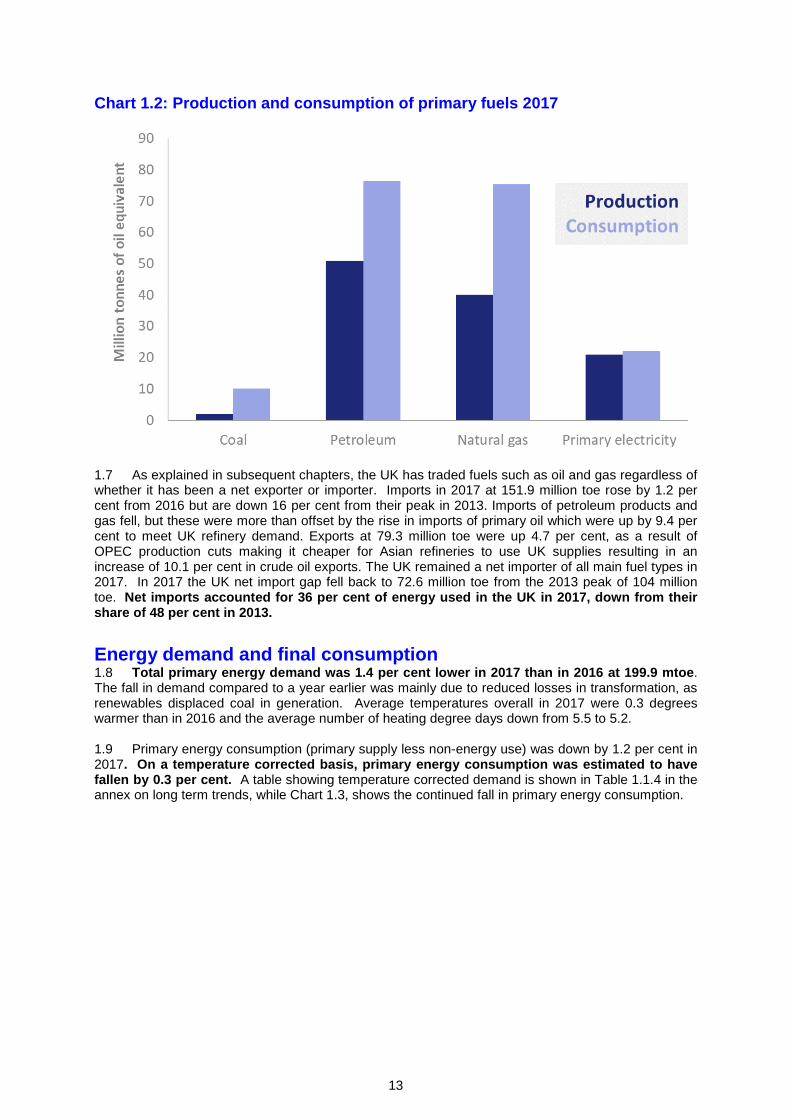
Energy demand and final consumption 1.8 Total primary energy demand was 1.4 per cent lower in 2017 than in 2016 at 199.9 mtoe. The fall in demand compared to a year earlier was mainly due to reduced losses in transformation, as renewables displaced coal in generation. Average temperatures overall in 2017 were 0.3 degrees warmer than in 2016 and the average number of heating degree days down from 5.5 to 5.2. 1.9 Primary energy consumption (primary supply less non-energy use) was down by 1.2 per cent in 2017. On a temperature corrected basis, primary energy consumption was estimated to have fallen by 0.3 per cent. A table showing temperature corrected demand is shown in Table 1.1.4 in the annex on long term trends, while Chart 1.3, shows the continued fall in primary energy consumption.
14
Chart 1.3: Primary energy consumption
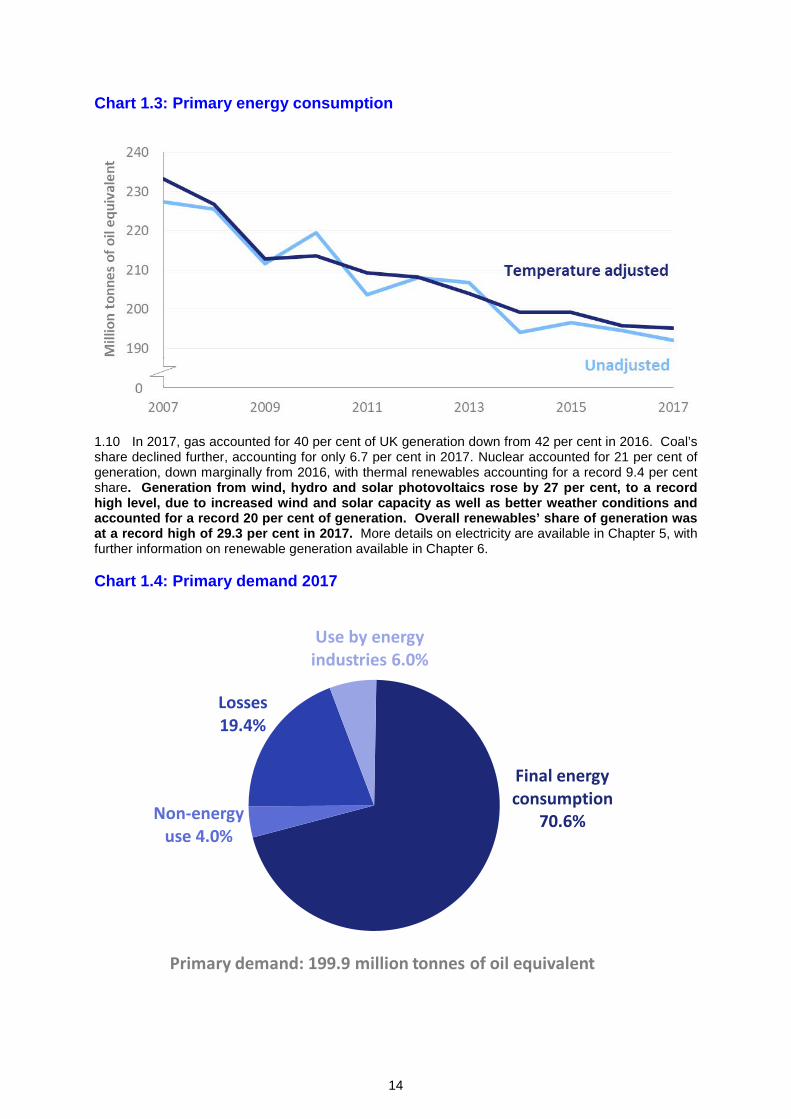
1.10 In 2017, gas accounted for 40 per cent of UK generation down from 42 per cent in 2016. Coal’s share declined further, accounting for only 6.7 per cent in 2017. Nuclear accounted for 21 per cent of generation, down marginally from 2016, with thermal renewables accounting for a record 9.4 per cent share. Generation from wind, hydro and solar photovoltaics rose by 27 per cent, to a record high level, due to increased wind and solar capacity as well as better weather conditions and accounted for a record 20 per cent of generation. Overall renewables’ share of generation was at a record high of 29.3 per cent in 2017. More details on electricity are available in Chapter 5, with further information on renewable generation available in Chapter 6. Chart 1.4: Primary demand 2017
Final energy consumption
70.6%Non-energy use 4.0%
Losses 19.4%
Use by energy industries 6.0%
Primary demand: 199.9 million tonnes of oil equivalent
15
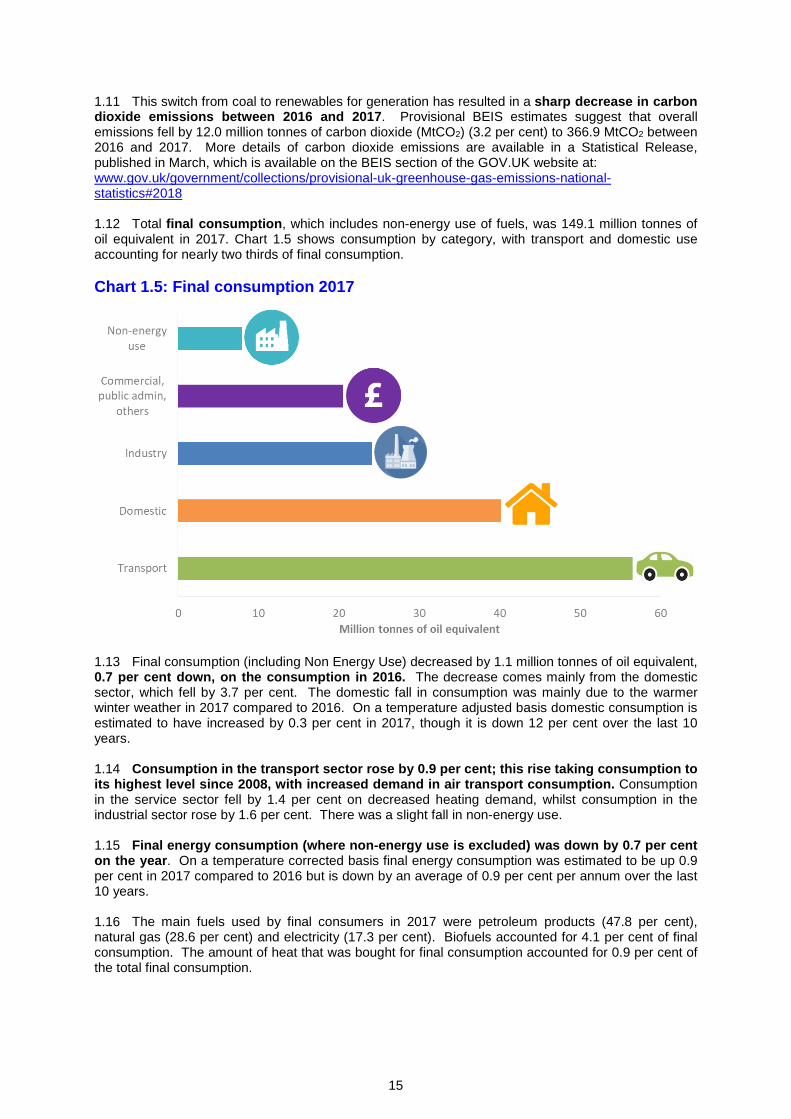
1.11 This switch from coal to renewables for generation has resulted in a sharp decrease in carbon dioxide emissions between 2016 and 2017. Provisional BEIS estimates suggest that overall emissions fell by 12.0 million tonnes of carbon dioxide (MtCO2) (3.2 per cent) to 366.9 MtCO2 between 2016 and 2017. More details of carbon dioxide emissions are available in a Statistical Release, published in March, which is available on the BEIS section of the GOV.UK website at: www.gov.uk/government/collections/provisional-uk-greenhouse-gas-emissions-national-statistics#2018 1.12 Total final consumption, which includes non-energy use of fuels, was 149.1 million tonnes of oil equivalent in 2017. Chart 1.5 shows consumption by category, with transport and domestic use accounting for nearly two thirds of final consumption. Chart 1.5: Final consumption 2017
1.13 Final consumption (including Non Energy Use) decreased by 1.1 million tonnes of oil equivalent, 0.7 per cent down, on the consumption in 2016. The decrease comes mainly from the domestic sector, which fell by 3.7 per cent. The domestic fall in consumption was mainly due to the warmer winter weather in 2017 compared to 2016. On a temperature adjusted basis domestic consumption is estimated to have increased by 0.3 per cent in 2017, though it is down 12 per cent over the last 10 years. 1.14 Consumption in the transport sector rose by 0.9 per cent; this rise taking consumption to its highest level since 2008, with increased demand in air transport consumption. Consumption in the service sector fell by 1.4 per cent on decreased heating demand, whilst consumption in the industrial sector rose by 1.6 per cent. There was a slight fall in non-energy use. 1.15 Final energy consumption (where non-energy use is excluded) was down by 0.7 per cent on the year. On a temperature corrected basis final energy consumption was estimated to be up 0.9 per cent in 2017 compared to 2016 but is down by an average of 0.9 per cent per annum over the last 10 years. 1.16 The main fuels used by final consumers in 2017 were petroleum products (47.8 per cent), natural gas (28.6 per cent) and electricity (17.3 per cent). Biofuels accounted for 4.1 per cent of final consumption. The amount of heat that was bought for final consumption accounted for 0.9 per cent of the total final consumption.
16
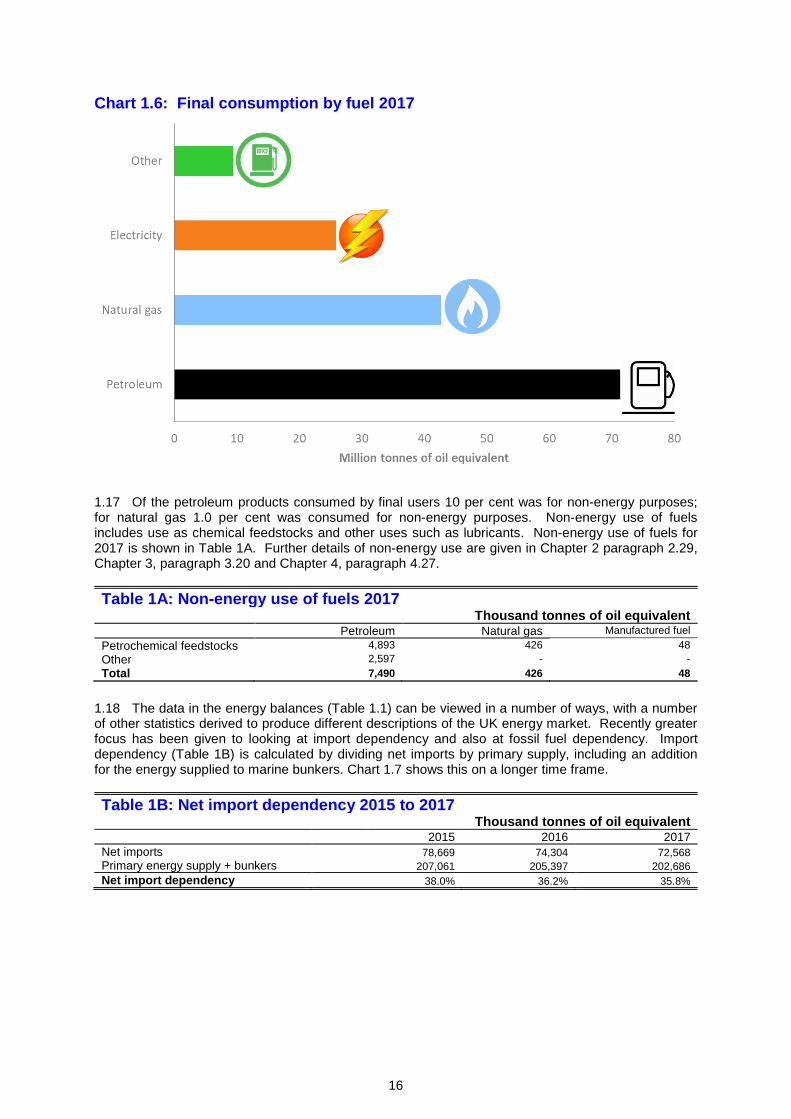
Chart 1.6: Final consumption by fuel 2017
1.17 Of the petroleum products consumed by final users 10 per cent was for non-energy purposes; for natural gas 1.0 per cent was consumed for non-energy purposes. Non-energy use of fuels includes use as chemical feedstocks and other uses such as lubricants. Non-energy use of fuels for 2017 is shown in Table 1A. Further details of non-energy use are given in Chapter 2 paragraph 2.29, Chapter 3, paragraph 3.20 and Chapter 4, paragraph 4.27. Table 1A: Non-energy use of fuels 2017
Thousand tonnes of oil equivalent Petroleum Natural gas Manufactured fuel Petrochemical feedstocks 4,893 426 48 Other 2,597 - - Total 7,490 426 48
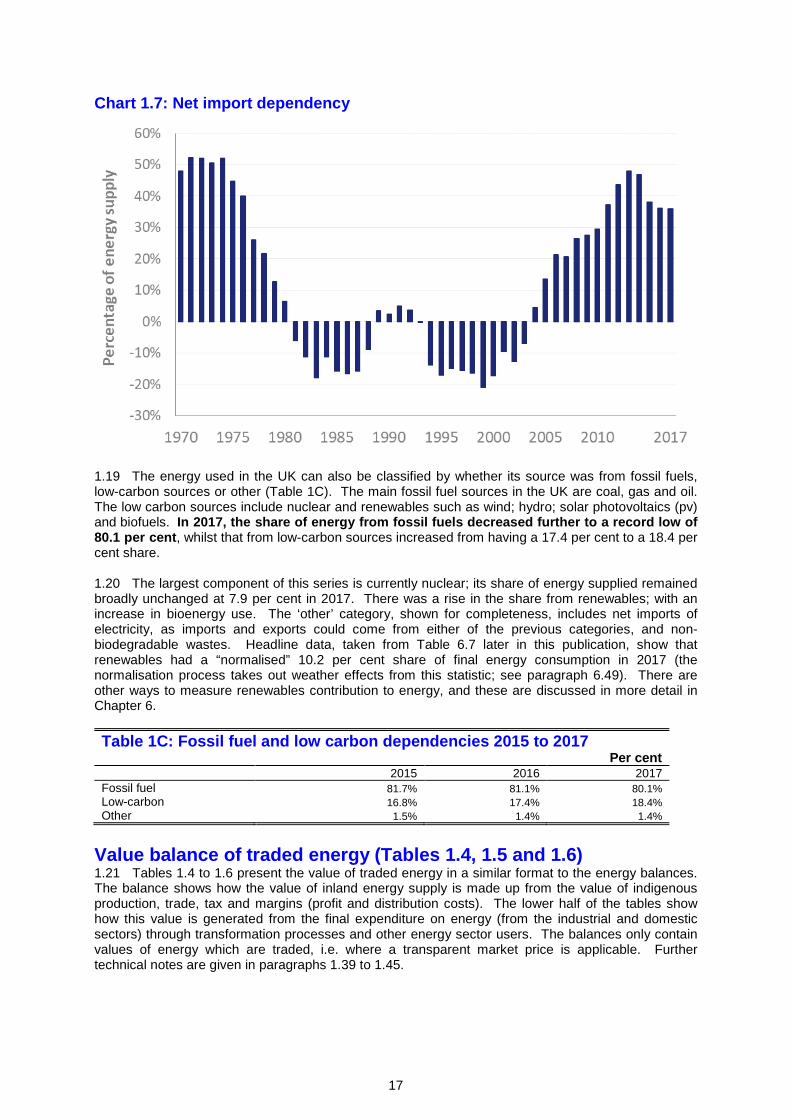
1.18 The data in the energy balances (Table 1.1) can be viewed in a number of ways, with a number of other statistics derived to produce different descriptions of the UK energy market. Recently greater focus has been given to looking at import dependency and also at fossil fuel dependency. Import dependency (Table 1B) is calculated by dividing net imports by primary supply, including an addition for the energy supplied to marine bunkers. Chart 1.7 shows this on a longer time frame. Table 1B: Net import dependency 2015 to 2017
Thousand tonnes of oil equivalent 2015 2016 2017 Net imports 78,669 74,304 72,568 Primary energy supply + bunkers 207,061 205,397 202,686 Net import dependency 38.0% 36.2% 35.8%
17
Chart 1.7: Net import dependency
1.19 The energy used in the UK can also be classified by whether its source was from fossil fuels, low-carbon sources or other (Table 1C). The main fossil fuel sources in the UK are coal, gas and oil. The low carbon sources include nuclear and renewables such as wind; hydro; solar photovoltaics (pv) and biofuels. In 2017, the share of energy from fossil fuels decreased further to a record low of 80.1 per cent, whilst that from low-carbon sources increased from having a 17.4 per cent to a 18.4 per cent share. 1.20 The largest component of this series is currently nuclear; its share of energy supplied remained broadly unchanged at 7.9 per cent in 2017. There was a rise in the share from renewables; with an increase in bioenergy use. The ‘other’ category, shown for completeness, includes net imports of electricity, as imports and exports could come from either of the previous categories, and non-biodegradable wastes. Headline data, taken from Table 6.7 later in this publication, show that renewables had a “normalised” 10.2 per cent share of final energy consumption in 2017 (the normalisation process takes out weather effects from this statistic; see paragraph 6.49). There are other ways to measure renewables contribution to energy, and these are discussed in more detail in Chapter 6. Table 1C: Fossil fuel and low carbon dependencies 2015 to 2017
Per cent 2015 2016 2017 Fossil fuel 81.7% 81.1% 80.1% Low-carbon 16.8% 17.4% 18.4% Other 1.5% 1.4% 1.4%
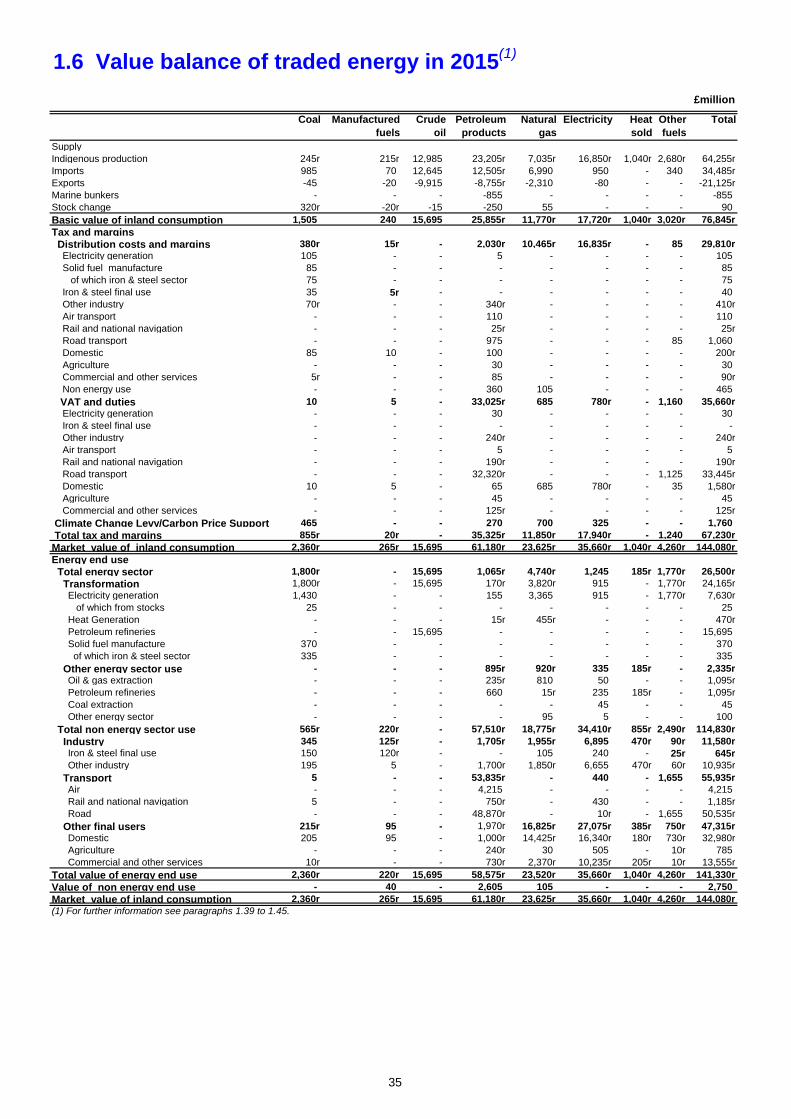
Value balance of traded energy (Tables 1.4, 1.5 and 1.6) 1.21 Tables 1.4 to 1.6 present the value of traded energy in a similar format to the energy balances. The balance shows how the value of inland energy supply is made up from the value of indigenous production, trade, tax and margins (profit and distribution costs). The lower half of the tables show how this value is generated from the final expenditure on energy (from the industrial and domestic sectors) through transformation processes and other energy sector users. The balances only contain values of energy which are traded, i.e. where a transparent market price is applicable. Further technical notes are given in paragraphs 1.39 to 1.45.
18
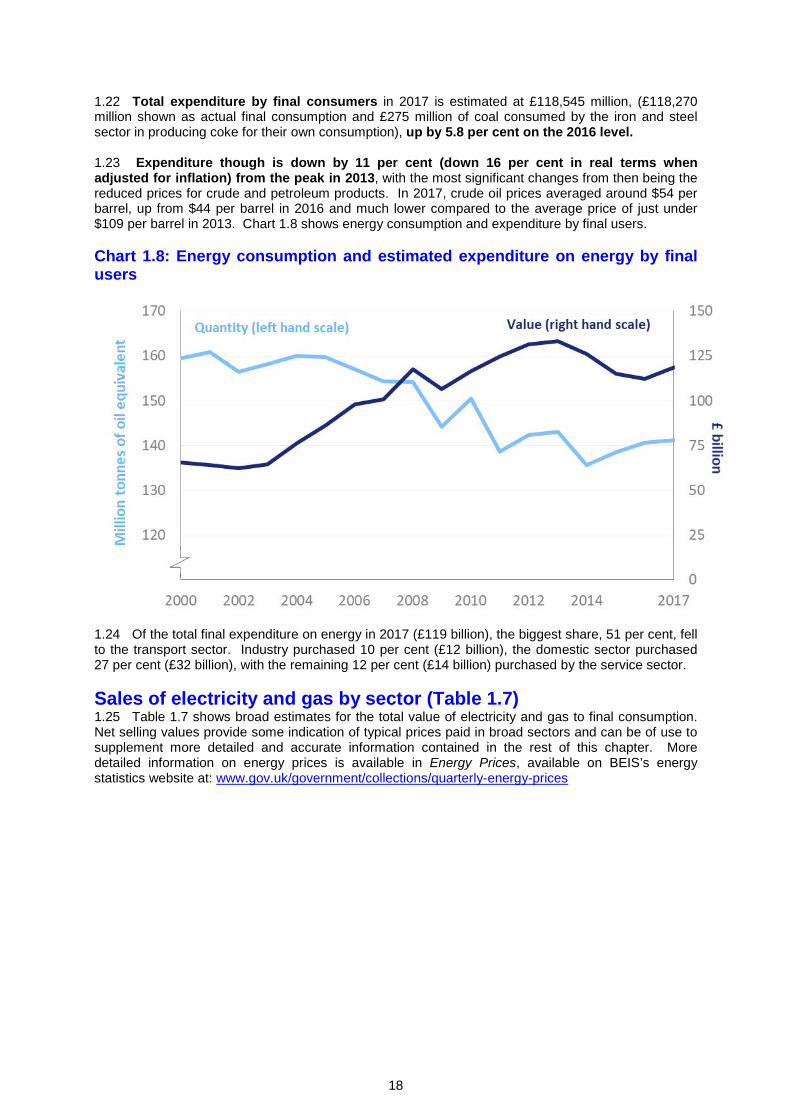
1.22 Total expenditure by final consumers in 2017 is estimated at £118,545 million, (£118,270 million shown as actual final consumption and £275 million of coal consumed by the iron and steel sector in producing coke for their own consumption), up by 5.8 per cent on the 2016 level. 1.23 Expenditure though is down by 11 per cent (down 16 per cent in real terms when adjusted for inflation) from the peak in 2013, with the most significant changes from then being the reduced prices for crude and petroleum products. In 2017, crude oil prices averaged around $54 per barrel, up from $44 per barrel in 2016 and much lower compared to the average price of just under $109 per barrel in 2013. Chart 1.8 shows energy consumption and expenditure by final users. Chart 1.8: Energy consumption and estimated expenditure on energy by final users
1.24 Of the total final expenditure on energy in 2017 (£119 billion), the biggest share, 51 per cent, fell to the transport sector. Industry purchased 10 per cent (£12 billion), the domestic sector purchased 27 per cent (£32 billion), with the remaining 12 per cent (£14 billion) purchased by the service sector. Sales of electricity and gas by sector (Table 1.7) 1.25 Table 1.7 shows broad estimates for the total value of electricity and gas to final consumption. Net selling values provide some indication of typical prices paid in broad sectors and can be of use to supplement more detailed and accurate information contained in the rest of this chapter. More detailed information on energy prices is available in Energy Prices, available on BEIS’s energy statistics website at: www.gov.uk/government/collections/quarterly-energy-prices
19
The energy industries 1.26 The energy industries in the UK play a central role in the economy by producing, transforming and supplying energy in its various forms to all sectors. They are also major contributors to the UK’s Balance of Payments through the exports of crude oil and oil products. The box below summarises the energy industries’ contribution to the economy in 2017, based on the latest available data from the Office for National Statistics (ONS): • 2.9 per cent of GDP;
• 9.8 per cent of total investment;
• 33.6 per cent of industrial investment;
• 181,000 people directly employed (6.3 per cent of industrial employment);
• Many others indirectly employed (e.g. an estimated 142,000 in support of UK Continental Shelf production).
1.27 The share of GDP at 2.9 per cent compares to a peak level of 10.4 per cent in 1982. The share fell to below 4 per cent in most years since 2000, with energy’s share of the UK economy falling to a low of 2.8 per cent in 2016 before rising marginally in 2017. The rise between 2016 and 2017 is largely due to the increase in the price of oil; which rose by around 23 per cent in 20171. In 2017 investment in the energy industries rose lightly with increased spending for electricity. Employment has remained broadly unchanged in the last eight years, but up from 10 years ago.
1 www.bp.com/en/global/corporate/energy-economics/statistical-review-of-world-energy/oil/oil-prices.html
20
Technical notes and definitions I Units and measurement of energy Units of measurement 1.28 The original units of measurement appropriate to each fuel are used in the individual fuel chapters. A common unit of measurement, the tonne of oil equivalent (toe), which enables different fuels to be compared and aggregated, is used in Chapter 1. In common with the International Energy Agency and with the Statistical Office of the European Communities, the tonne of oil equivalent is defined as follows:
1 tonne of oil equivalent = 107 kilocalories = 396.83 therms = 41.868 Gigajoules (GJ) = 11,630 Kilowatt hours (kWh)
This unit should be regarded as a measure of energy content rather than a physical quantity. One tonne of oil is not equal to one tonne of oil equivalent. Calorific values when producing energy statistics 1.29 In this publication Gross Calorific Values (GCVs) are used to convert fuel from their original units to tonnes of oil equivalent (toe). An alternative is to use Net Calorific Values (NCVs) as detailed in paragraph XVII of the introduction. The fuel specific GCVs and NCVs are shown at Annex A. However, as some EU targets are calculated on data converted using net calorific values, aggregate energy balances for the most recent years have been calculated using NCVs; these are used in Table 6.7, and are available on the internet version, Annex I, of this publication at: www.gov.uk/government/collections/digest-of-uk-energy-statistics-dukes. Thermal content - energy supplied basis of measurement 1.30 Tables 1.1 to 1.3 and 1.1.1 to 1.1.5 (available on the BEIS section of GOV.UK at: www.gov.uk/government/statistics/energy-chapter-1-digest-of-united-kingdom-energy-statistics-dukes are compiled on an energy-supplied basis. Detailed data for individual fuels are converted from original units to tonnes of oil equivalent using gross calorific values and conversion factors appropriate to each category of fuel. The results are then aggregated according to the categories used in the tables. Gross calorific values represent the total energy content of the fuel, including the energy needed to evaporate the water present in the fuel (see also paragraph 1.55). 1.31 Estimated gross and net calorific values for 2017 are given in Table A.1 in Annex A. Calorific values are reviewed each year in collaboration with the fuel industries, and figures for earlier years can be found in Tables A.2 and A.3. To construct energy balances on an energy supplied basis calorific values are required for production, trade, and stocks, as follows: Coal The weighted average gross calorific value of all indigenous coal consumed is used to derive the thermal content of coal production and undistributed stocks. Thermal contents of imports and exports allow for the quality of coal. Thermal contents of changes in coal stocks at secondary fuel producers are the average calorific values of indigenous coal consumed. Petroleum Work carried out in 1997 to revise calorific values for petroleum products did not find any recent work on the subject. In the absence of such work, the gross calorific values, included in Annex A and used in the construction of these energy balances from 1990 onwards, have been calculated using a formula derived by the US Bureau of Standards. This formula estimates the gross calorific value of products according to their density as follows:
278.883.51 dGJ ×−= , where d is the density of the product in terms of kilograms per litre. For crude petroleum and refinery losses, the weighted average calorific value for all petroleum products from UK refineries is used. A notional figure of 43.0 GJ per tonne is used for non-energy petroleum products (industrial and white spirits, lubricants, bitumen, petroleum coke, waxes and miscellaneous products).
21
Gases Although the original unit for gases is the cubic metre, figures for gases are generally presented in the fuel sections of this Digest in gigawatt hours (GWh), having been converted from cubic metres using gross calorific values provided by the industries concerned. Conversion factors between units of energy are given on the flap inside the back cover and in Annex A. Electricity and heat Unlike other fuels, the original unit used to measure electricity and heat is a measure of energy. The figures for electricity and heat can therefore be converted directly to toe using the conversion factors on the flap inside the back cover and in Annex A. Primary electricity Hydro electricity and net imports of electricity are presented in terms of the energy content of the electricity produced (the energy supplied basis). This is consistent with international practice. Primary inputs for nuclear electricity assume the thermal efficiencies at nuclear stations given in Chapter 5, Table 5.10 (40.0 per cent in 2017). (See Chapter 5, paragraphs 5.71 and 5.79). Non-energy uses of fuel 1.32 Energy use of fuel mainly comprises use for lighting, heating, motive power and power for appliances. Non-energy use includes use as chemical feedstocks, solvents, lubricants and road making material. It should be noted that the amounts of non-energy use of natural gas included in the Digest are approximate. Further discussion of non-energy uses of lubricating oils and petroleum coke appears in Chapter 3, paragraph 3.20. Autogeneration of electricity 1.33 Autogeneration is defined as the generation of electricity by companies whose main business is not electricity generation, the electricity being produced mainly for that company’s own use. Estimated amounts of fuel used for thermal generation of electricity by such companies, the output of electricity and the thermal losses incurred in generation are included within the Transformation section in the energy balances shown in Tables 1.1 to 1.3. Electricity used in the power generation process by autogenerators is shown within the Energy Industry Use section. Electricity consumed by industry and commerce from its own generation is included as part of final consumption. This treatment is in line with the practice in international energy statistics. 1.34 Figures on total amount of fuel used and electricity generated by autogenerators, and the amount of electricity for own consumption is shown in Tables 5.1 to 5.6. Table 5.4 summarises the figures by broad industrial groups. Much of the power generated is from combined heat and power (CHP) plants and data from Chapter 7 are included within Table 5.4. Differences will occur where CHP plants are classified to major power producers, and this mainly affects the chemicals sector. The method of allocating fuel used in CHP plants between electricity production and heat production is described in Chapter 7 paragraphs 7.36 to 7.41. This method can give rise to high implied conversion efficiencies in some sectors, most notably in the iron and steel sector. Final consumption, deliveries, stock changes 1.35 Figures for final consumption relate to deliveries, if fuels can be stored by users and data on actual consumption are not available. Final consumption of petroleum and solid fuels is on a deliveries basis throughout, except for the use of solid fuels by the iron and steel industry. Figures for domestic use of coal are based on deliveries to merchants. Figures for stock changes in Tables 1.1 to 1.3 cover stocks held by primary and secondary fuel producers, major distributors of petroleum products, and stocks of coke and breeze held by the iron and steel industry; for coal they also include an estimate of volumes in transit. Figures for stock changes in natural gas represent the net amount put into storage by gas companies operating pipelines. 1.36 Figures for final consumption of electricity include sales by the public distribution system and consumption of electricity produced by generators other than the major electricity producing companies. Thus electricity consumption includes that produced by industry and figures for deliveries of other fuels to industry exclude amounts used to generate electricity (except for years prior to 1987, shown in tables giving long term trends).
22
Heat sold 1.37 Heat sold is defined as heat that is produced and sold under the provision of a contract. The heat sold figures have been derived from two sources covering CHP plants and community heating schemes without CHP plants. Data for heat sold were supplied by CHP plants to the Combined Heat and Power Quality Assurance Programme and were processed by Ricardo-AEA. Data for heat consumption from community heating schemes were derived from the Building Research Establishment’s (BRE) ‘Nationwide Survey of Community Heating’ that was carried out in 1997, a database of community heating schemes in social housing in 2000, and Community Heating Sales Surveys undertaken between 2003 and 2005. The estimates from these sources have been used to derive heat sold figures since 1999. When information about where the heat was generated was not available from the BRE sources, it was assumed that domestic sector heat consumption was provided by the commercial sector, public sector heat consumption was provided by the public administration and industrial sectors (using proportions derived from CHP statistics) and that industrial sector heat consumption was provided by the industrial sector. The introduction of heat sold into the energy balances has not affected the individual fuel totals, since the energy used to generate the heat has been deducted from the final consumption section of the energy balance and transferred to the transformation section. The figures that are included in the balances should be treated as indicative of the amount of heat sold. Annex J of the Digest, at: www.gov.uk/government/collections/digest-of-uk-energy-statistics-dukes shows the quantity of fuel by consuming sector used to produce heat that is subsequently sold. II Energy balances (Tables 1.1, 1.2 and 1.3) 1.38 Tables 1.1, 1.2 and 1.3 show the energy flows as the primary fuels are processed (or used) and as the consequent secondary fuels are used. The net inputs to transformation are shown in the transformation rows and hence outputs from transformation processes into which primary fuels are input (such as electricity generation, heat generation or petroleum refining) appear as positive figures under the secondary product’s heading in the tables. Similarly the net inputs are shown as negative figures under the primary fuel headings. III Value balances (Tables 1.4, 1.5 and 1.6) Valuation of energy purchases 1.39 In common with the rest of the chapter, these tables covering energy expenditure follow a balance format. While a user may derive data on a similar basis as that previously published, the balance tables allow for more varied use and interpretation of traded energy value data. That said, the tables continue to only show values for energy that has to be purchased and therefore do not include estimated values of a sector’s internal consumption, such as coal used in the process of coal extraction. The value balance 1.40 The tables balances around market value of inland consumption, with the lower half of the tables showing the total value of consumption by end users, sub divided into energy sector users and final users both for energy and non-energy use. The top half of the tables show the supply components that go to make up the final market value of inland consumption, namely upstream cost of production, imports, taxes and the margins and costs of delivering and packaging the fuel for the final consumer. The total final consumers’ value of energy consumption is represented by the lines ‘total non-energy sector use’ and iron and steel sectors’ purchases of coal for use in solid fuel manufacture. All figures are estimates and have been rounded to the nearest £5 million. 1.41 In keeping with the energy balances, the value balances, since 2000, have included data on heat generation and heat sold. Additionally, an estimate of the amount of Climate Change Levy (CCL) and the Carbon Price Support (CPS) paid is included in Tables 1.4, 1.5 and 1.6. The CCL was introduced in April 2001 and is payable by non-domestic final consumers of gas, electricity, coal, coke and LPG, with the Carbon Price Support (CPS), a tax on fossil fuel used to generate electricity, introduced in April 2013.
23
1.42 The value balance demonstrates how the value chain works in the production and consumption of energy. For example, in 2017, £15,545 million of crude oil was indigenously produced, of which £12,835 million was exported; and £16,165 million of crude oil was imported. Allowing for stock changes, this provides a total value of UK inland crude oil supply of £18,985 million. This fuel was then completely consumed within the petroleum industry in the process of producing £27,295 million of petroleum products. Again, some external trade and stock changes took place before arriving at a basic value of petroleum products of £29,590 million. In supplying the fuel to final consumers, distribution costs were incurred, and some profit was made amounting to £2,315 million, whilst duty and tax meant a further £34,165 million was added to the basic price to arrive at the final market value of £66,150 million. This was the value of petroleum products purchased, of which industry purchased £1,845 million, domestic consumers for heating purposes purchased £1,105 million, with the vast majority £58,260 million, purchased by the transport sector. Fuel definitions in value balances 1.43 Crude oil includes Natural Gas Liquids (NGLs) and refinery feedstocks. Natural gas does not include colliery methane. Electricity only includes electricity delivered via the public distribution system and therefore does not value electricity produced and consumed by autogenerators; however the fuels used by autogenerators are included under Transformation. Manufactured solid fuels include coke, breeze and other solid manufactured fuels, mainly products from patent fuel and carbonisation plants. Other fuels include all other fuels not separately listed, where they can be clearly considered as traded and some reasonable valuation can be made. Fuels mainly contributing to this year’s values are wood, coke oven and colliery methane gases sold on to other industrial users and some use of waste products such as poultry litter. Energy end use 1.44 Values represent the cost to the final user including transportation of the fuel. They are derived, except where actual values are available, from the traded element of the volumes presented in aggregate energy balance and end user prices collected from information supplied by users or energy suppliers. The energy sector consists of those industries engaged in the production and sale of energy products, but values are not given for consumption of self-generated fuels e.g. coke oven gas used by coke producers. Many of the processes in the iron and steel industry are considered to be part of the energy sector in the energy balances, but for the purposes of this economic balance their genuine purchases are treated as those of final consumers, except for purchases of coal directly used in coke manufacture, which is shown separately as part of manufacture of solid fuel. Coal used directly in or to heat blast furnaces is shown as iron and steel final use. Transformation includes those fuels used directly in producing other fuels e.g. crude oil in petroleum products. Electricity generators keep and use significant stocks of coal, and the stocks used in consumption each year are shown separately. The value and margins for these being assumed to be the same as other coal purchased in the year. Road transport includes all motor spirit and DERV (diesel-engined road vehicle) use. Commercial and other users include public administration and miscellaneous uses not classified to the industrial sector. Supply 1.45 The supply side money chain is derived using various methods. Indigenous production represents the estimated basic value of in-year sales by the upstream producers. This value is gross of any taxes or cost they must meet. The valuation problems in attributing network losses in gas and electricity between upstream and downstream within this value chain means any costs borne are included in the production value. Imports and exports are valued in accordance with data published by HM Revenue and Customs, contained in Annex G (which can be found on the Internet at: www.gov.uk/government/collections/digest-of-uk-energy-statistics-dukes). However, crude oil is treated differently, where the value is formed from price data taken from a census survey of refiners and volume data taken from Table 3.1. These values are considered to reflect the complete money chain more accurately than Tables G.1 to G.7. Stock changes are those for undistributed stocks except for coal where coke oven and generators’ stocks are included. A stock increase takes money out of the money chain and is therefore represented as a negative. Distribution costs are arrived at by removing an estimate of producers’ value along with any taxes from the end user values shown. For most fuels, the estimate of producer value is derived from the consumption used for end use and the producer price taken from survey of producers. No sector breakdown is given for gas and
24
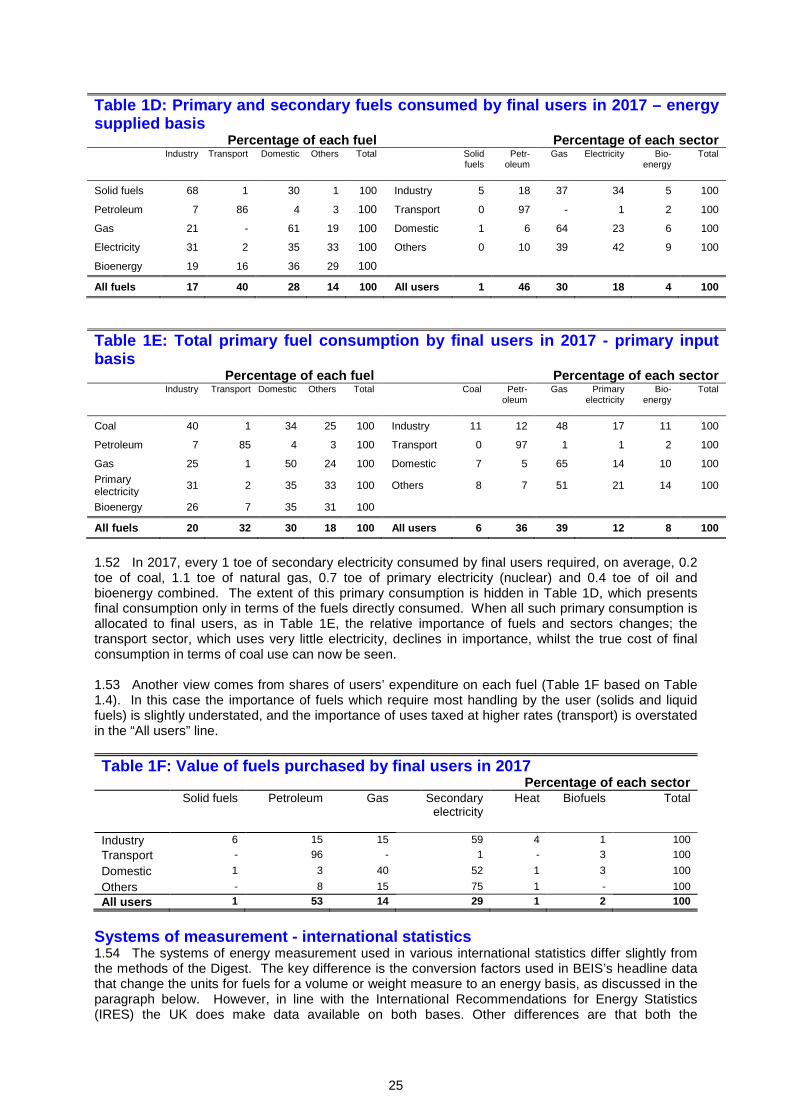
electricity margins because it is not possible to accurately measure delivery costs for each sector. Taxes include VAT where not refundable and duties paid on downstream sales. Excluded are the gas and fossil fuel levies, petroleum revenue tax and production royalties and licence fees. The proceeds from the fossil fuel levy are redistributed across the electricity industry, whilst the rest are treated as part of the production costs. Sales of electricity and gas by sector (Table 1.7) 1.46 This table provides data on the total value of gas and electricity sold to final consumers. The data are collected from the energy supply companies. The data are useful in indicating relative total expenditure between sectors, but the quality of data provided in terms of industrial classification has been worsening in recent years. Net selling values provide an indication of typical prices paid in broad sectors. IV Measurement of energy consumption Primary fuel input basis 1.47 Energy consumption is usually measured in one of three different ways. The first, known as the primary fuel input basis, assesses the total input of primary fuels and their equivalents. This measure includes energy used or lost in the conversion of primary fuels to secondary fuels (for example in power stations and oil refineries), energy lost in the distribution of fuels (for example in transmission lines) and energy conversion losses by final users. Primary demands as in Table 1.1, 1.2 and 1.3 are on this basis. Final consumption - energy supplied basis 1.48 The second method, known as the energy supplied basis, measures the energy content of the fuels, both primary and secondary, supplied to final users. Thus it is net of fuel industry own use and conversion, transmission and distribution losses, but it includes conversion losses by final users. Table 1D presents shares of final consumption on this basis. The final consumption figures are presented on this basis throughout Chapter 1. 1.49 Although this is the usual and most direct way to measure final energy consumption, it is also possible to present final consumption on a primary fuel input basis. This can be done by allocating the conversion losses, distribution losses and energy industry use to final users. This approach can be used to compare the total primary fuel use which each sector of the economy accounts for. Table 1E presents shares of final consumption on this basis. Final consumption - useful energy basis 1.50 Thirdly, final consumption may be expressed in the form of useful energy available after deduction of the losses incurred when final users convert energy supplied into space or process heat, motive power or light. Such losses depend on the type and quality of fuel and the equipment used and on the purpose, conditions, duration and intensity of use. Statistics on useful energy are not sufficiently reliable to be given in this Digest; there is a lack of data on utilisation efficiencies and on the purposes for which fuels are used. Shares of each fuel in energy supply and demand 1.51 The relative importance of the energy consumption of each sector of the economy depends on the method used to measure consumption. Shares of final consumption on an energy supplied basis (that is in terms of the primary and secondary fuels directly consumed) in 2017 are presented in Table 1D. For comparison, Table 1E presents shares of final consumption on a primary fuel input basis.
25
Table 1D: Primary and secondary fuels consumed by final users in 2017 – energy supplied basis
Percentage of each fuel Percentage of each sector Industry Transport Domestic Others Total Solid
fuels Petr-
oleum
Gas Electricity Bio-energy
Total
Solid fuels 68 1 30 1 100 Industry 5 18 37 34 5 100
Petroleum 7 86 4 3 100 Transport 0 97 - 1 2 100
Gas 21 - 61 19 100 Domestic 1 6 64 23 6 100
Electricity 31 2 35 33 100 Others 0 10 39 42 9 100
Bioenergy 19 16 36 29 100
All fuels 17 40 28 14 100 All users 1 46 30 18 4 100
Table 1E: Total primary fuel consumption by final users in 2017 - primary input basis
Percentage of each fuel Percentage of each sector Industry Transport Domestic Others Total Coal Petr-
oleum
Gas Primary electricity
Bio-energy
Total
Coal 40 1 34 25 100 Industry 11 12 48 17 11 100
Petroleum 7 85 4 3 100 Transport 0 97 1 1 2 100
Gas 25 1 50 24 100 Domestic 7 5 65 14 10 100 Primary electricity 31 2 35 33 100 Others 8 7 51 21 14 100
Bioenergy 26 7 35 31 100
All fuels 20 32 30 18 100 All users 6 36 39 12 8 100
1.52 In 2017, every 1 toe of secondary electricity consumed by final users required, on average, 0.2 toe of coal, 1.1 toe of natural gas, 0.7 toe of primary electricity (nuclear) and 0.4 toe of oil and bioenergy combined. The extent of this primary consumption is hidden in Table 1D, which presents final consumption only in terms of the fuels directly consumed. When all such primary consumption is allocated to final users, as in Table 1E, the relative importance of fuels and sectors changes; the transport sector, which uses very little electricity, declines in importance, whilst the true cost of final consumption in terms of coal use can now be seen. 1.53 Another view comes from shares of users’ expenditure on each fuel (Table 1F based on Table 1.4). In this case the importance of fuels which require most handling by the user (solids and liquid fuels) is slightly understated, and the importance of uses taxed at higher rates (transport) is overstated in the “All users” line. Table 1F: Value of fuels purchased by final users in 2017
Percentage of each sector Solid fuels Petroleum Gas Secondary
electricity Heat
Biofuels Total
Industry 6 15 15 59 4 1 100 Transport - 96 - 1 - 3 100 Domestic 1 3 40 52 1 3 100 Others - 8 15 75 1 - 100 All users 1 53 14 29 1 2 100
Systems of measurement - international statistics 1.54 The systems of energy measurement used in various international statistics differ slightly from the methods of the Digest. The key difference is the conversion factors used in BEIS’s headline data that change the units for fuels for a volume or weight measure to an energy basis, as discussed in the paragraph below. However, in line with the International Recommendations for Energy Statistics (IRES) the UK does make data available on both bases. Other differences are that both the
26
International Energy Agency (IEA) as well as the United Nations’ IRES have International Aviation Bunkers as well as International Marine Bunkers shown together and not included in the country’s energy supply. The UK in its energy balances continues to show fuel used for international marine bunkers in this manner but has maintained its practice of showing fuel for international aviation as part of final consumption - this practice is also followed by Eurostat. Net calorific values 1.55 Calorific values (thermal contents) used internationally are net rather than gross. The difference between the net and gross thermal content is the amount of energy necessary to evaporate the water present in the fuel or formed during the combustion process. The differences between gross and net values are generally taken to be 5 per cent for liquid and solid fuels (except for coke and coke breeze where there is no difference), 10 per cent for gases (except for blast furnace gas, 1 per cent), 15 per cent for straw, and 16 per cent for poultry litter. The calorific value of wood is highly dependent on its moisture content. In Annex A, the gross calorific value is given as 16.3 GJ at 20 per cent moisture content and 20.3 GJ for dry wood. Both gross and net calorific values are shown in Annex A. Energy balances on a net calorific basis are published in an annex to DUKES available at: www.gov.uk/government/statistics/energy-chapter-1-digest-of-united-kingdom-energy-statistics-dukes V Definitions of fuels 1.56 The following paragraphs explain what is covered under the terms “primary” and “secondary” fuels. Primary fuels Coal - Production comprises all grades of coal, including slurry. Primary oils - This includes crude oil, natural gas liquids (NGLs) and feedstock. Natural gas liquids - Natural gas liquids (NGLs) consist of condensates (C5 or heavier) and petroleum gases other than methane C1, that is ethane C2, propane C3 and butane C4, obtained from the onshore processing of associated and non-associated gas. These are treated as primary fuels when looking at primary supply but in the consumption data presented in this chapter these fuels are treated as secondary fuels, being transferred from the primary oils column in Tables 1.1, 1.2 and 1.3. Natural gas - Production relates to associated or non-associated methane C1 from land and the United Kingdom sector of the Continental Shelf. It includes that used for drilling production and pumping operations, but excludes gas flared or re-injected. It also includes colliery methane piped to the surface and consumed by collieries or others. Nuclear electricity - Electricity generated by nuclear power stations belonging to the major power producers. See Chapter 5, paragraphs 5.62 to 5.69. Natural flow hydro-electricity - Electricity generated by natural flow hydroelectric power stations, whether they belong to major power producers or other generators. Pumped storage stations are not included (see under secondary electricity below). Renewable energy sources - In this chapter figures are presented for renewables and waste in total. Further details, including a detailed breakdown of the commodities and technologies covered are in Chapter 6. Secondary fuels Manufactured fuel - This heading includes manufactured solid fuels such as coke and breeze, other manufactured solid fuels, liquids such as benzole and tars and gases such as coke oven gas and blast furnace gas. Further details are given in Chapter 2, Tables 2.5 and 2.6. Coke and breeze – Coke, oven coke and hard coke breeze. Further details are given in Chapter 2, Table 2.5. Other manufactured solid fuels – Manufactured solid fuels produced at low temperature carbonisation plants and other manufactured fuel and briquetting plants. Further details are given in Chapter 2, Table 2.5. Coke oven gas - Gas produced at coke ovens, excluding low temperature carbonisation plants. Gas bled or burnt to waste is included in production and losses. Further details are given in Chapter 2, Table 2.6. Blast furnace gas - Blast furnace gas is mainly produced and consumed within the iron and steel industry. Further details are given in Chapter 2, Table 2.6.
27
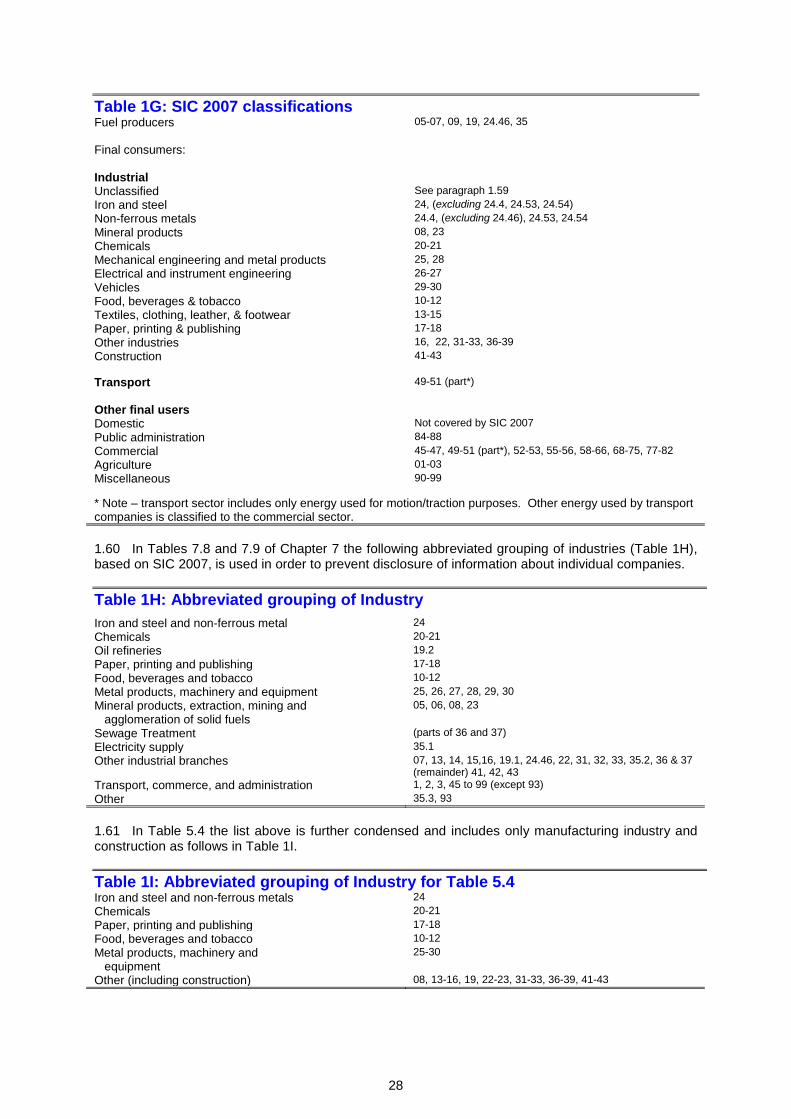
Petroleum products - Petroleum products produced mainly at refineries, together with inland deliveries of natural gas liquids. Secondary electricity - Secondary electricity is that generated by the combustion of another fuel, usually coal, natural gas, biofuels or oil. The figure for outputs from transformation in the electricity column of Tables 1.1, 1.2 and 1.3 is the total of primary and secondary electricity, and the subsequent analysis of consumption is based on this total. Heat sold – Heat sold is heat that is produced and sold under the provision of a contract. VI Classification of consumers 1.57 The Digest has been prepared, as far as is practicable, on the basis of the Standard Industrial Classification (SIC) 2007, details of which are available at: www.ons.gov.uk/methodology/classificationsandstandards/ukstandardindustrialclassificationofeconomicactivities/uksic2007). Table 1G shows the categories of consumers together with their codes in SIC 2007. SIC(2007) replaced SIC(2003) on 1 January 2008, with energy statistics being compiled on the new basis from 2010. SIC(2003) was introduced at the start of 2003; the previous classification SIC(1992) was used from 1995. Between 1986 and 1994 data in the Digest were prepared on the basis of SIC(1980). The changes in classification between SIC(1992), SIC(2003) and SIC(2007) are mainly in the very detailed classifications at the four or five digit level. As such the classifications used for energy statistics are unaffected by these changes. 1.58 The coverage varies between tables (e.g. in some instances the ‘other’ category is split into major constituents, whereas elsewhere it may include transport). This is because the coverage is dictated by what data suppliers can provide. The table also shows the disaggregation available within industry. This disaggregation forms the basis of virtually all the tables that show a disaggregated industrial breakdown. 1.59 There is also an ‘unclassified’ category in the industry sector (see Table 1G). In cases where the data supplier has been unable to allocate an amount between categories, but the Department for Business, Energy and Industrial Strategy has additional information, from other data sources, with which to allocate between categories, then this has been done. Where such additional information is not available the data are included in the ‘unclassified’ category, enabling the reader to decide whether to accept a residual, pro-rate, or otherwise adjust the figures. The ‘miscellaneous’ category also contains some unallocated figures for the services sector.
28
Table 1G: SIC 2007 classifications Fuel producers 05-07, 09, 19, 24.46, 35 Final consumers: Industrial Unclassified See paragraph 1.59 Iron and steel 24, (excluding 24.4, 24.53, 24.54) Non-ferrous metals 24.4, (excluding 24.46), 24.53, 24.54 Mineral products 08, 23 Chemicals 20-21 Mechanical engineering and metal products 25, 28 Electrical and instrument engineering 26-27 Vehicles 29-30 Food, beverages & tobacco 10-12 Textiles, clothing, leather, & footwear 13-15 Paper, printing & publishing 17-18 Other industries 16, 22, 31-33, 36-39 Construction 41-43 Transport 49-51 (part*) Other final users Domestic Not covered by SIC 2007 Public administration 84-88 Commercial 45-47, 49-51 (part*), 52-53, 55-56, 58-66, 68-75, 77-82 Agriculture 01-03 Miscellaneous 90-99
* Note – transport sector includes only energy used for motion/traction purposes. Other energy used by transport companies is classified to the commercial sector. 1.60 In Tables 7.8 and 7.9 of Chapter 7 the following abbreviated grouping of industries (Table 1H), based on SIC 2007, is used in order to prevent disclosure of information about individual companies. Table 1H: Abbreviated grouping of Industry
Iron and steel and non-ferrous metal 24 Chemicals 20-21 Oil refineries 19.2 Paper, printing and publishing 17-18 Food, beverages and tobacco 10-12 Metal products, machinery and equipment 25, 26, 27, 28, 29, 30 Mineral products, extraction, mining and 05, 06, 08, 23 agglomeration of solid fuels Sewage Treatment (parts of 36 and 37) Electricity supply 35.1 Other industrial branches 07, 13, 14, 15,16, 19.1, 24.46, 22, 31, 32, 33, 35.2, 36 & 37
(remainder) 41, 42, 43 Transport, commerce, and administration 1, 2, 3, 45 to 99 (except 93) Other 35.3, 93 1.61 In Table 5.4 the list above is further condensed and includes only manufacturing industry and construction as follows in Table 1I. Table 1I: Abbreviated grouping of Industry for Table 5.4 Iron and steel and non-ferrous metals 24 Chemicals 20-21 Paper, printing and publishing 17-18 Food, beverages and tobacco 10-12 Metal products, machinery and 25-30 equipment Other (including construction) 08, 13-16, 19, 22-23, 31-33, 36-39, 41-43
29
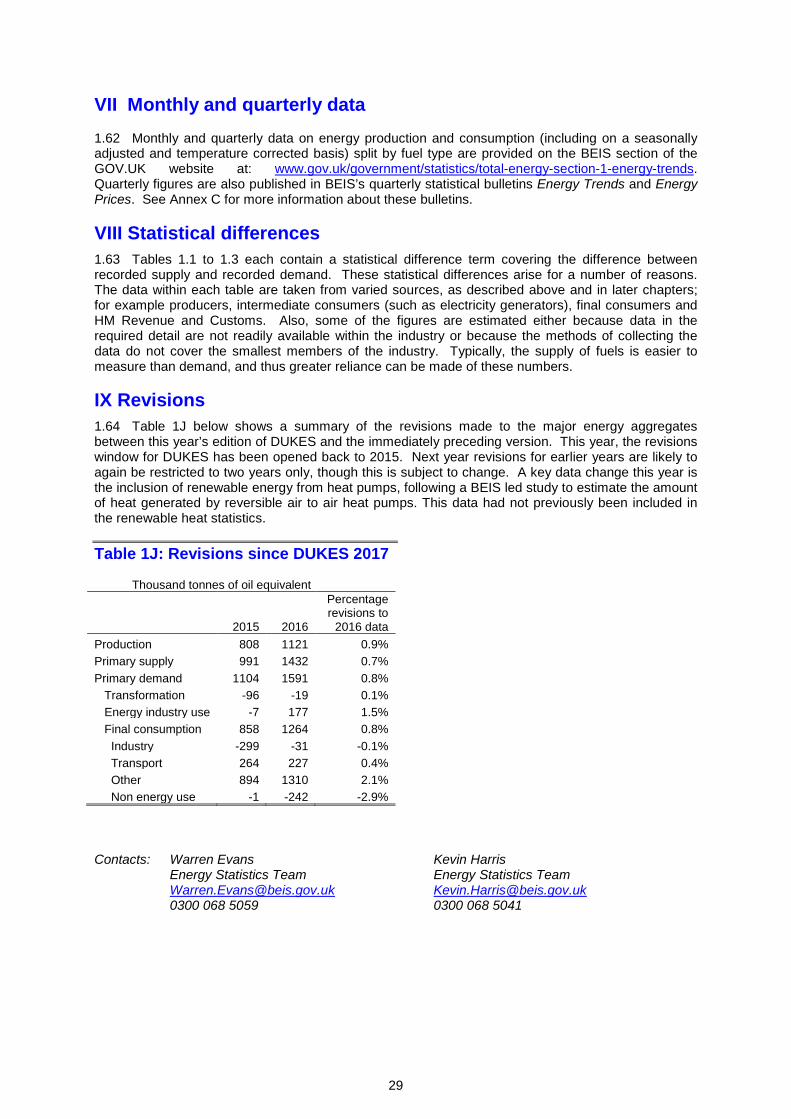
VII Monthly and quarterly data 1.62 Monthly and quarterly data on energy production and consumption (including on a seasonally adjusted and temperature corrected basis) split by fuel type are provided on the BEIS section of the GOV.UK website at: www.gov.uk/government/statistics/total-energy-section-1-energy-trends. Quarterly figures are also published in BEIS’s quarterly statistical bulletins Energy Trends and Energy Prices. See Annex C for more information about these bulletins. VIII Statistical differences 1.63 Tables 1.1 to 1.3 each contain a statistical difference term covering the difference between recorded supply and recorded demand. These statistical differences arise for a number of reasons. The data within each table are taken from varied sources, as described above and in later chapters; for example producers, intermediate consumers (such as electricity generators), final consumers and HM Revenue and Customs. Also, some of the figures are estimated either because data in the required detail are not readily available within the industry or because the methods of collecting the data do not cover the smallest members of the industry. Typically, the supply of fuels is easier to measure than demand, and thus greater reliance can be made of these numbers. IX Revisions 1.64 Table 1J below shows a summary of the revisions made to the major energy aggregates between this year’s edition of DUKES and the immediately preceding version. This year, the revisions window for DUKES has been opened back to 2015. Next year revisions for earlier years are likely to again be restricted to two years only, though this is subject to change. A key data change this year is the inclusion of renewable energy from heat pumps, following a BEIS led study to estimate the amount of heat generated by reversible air to air heat pumps. This data had not previously been included in the renewable heat statistics. Table 1J: Revisions since DUKES 2017
Thousand tonnes of oil equivalent
2015 2016
Percentage revisions to
2016 data Production 808 1121 0.9% Primary supply 991 1432 0.7% Primary demand 1104 1591 0.8% Transformation -96 -19 0.1% Energy industry use -7 177 1.5% Final consumption 858 1264 0.8% Industry -299 -31 -0.1% Transport 264 227 0.4% Other 894 1310 2.1% Non energy use -1 -242 -2.9% Contacts: Warren Evans Kevin Harris Energy Statistics Team Energy Statistics Team
[email protected] [email protected] 0300 068 5059 0300 068 5041
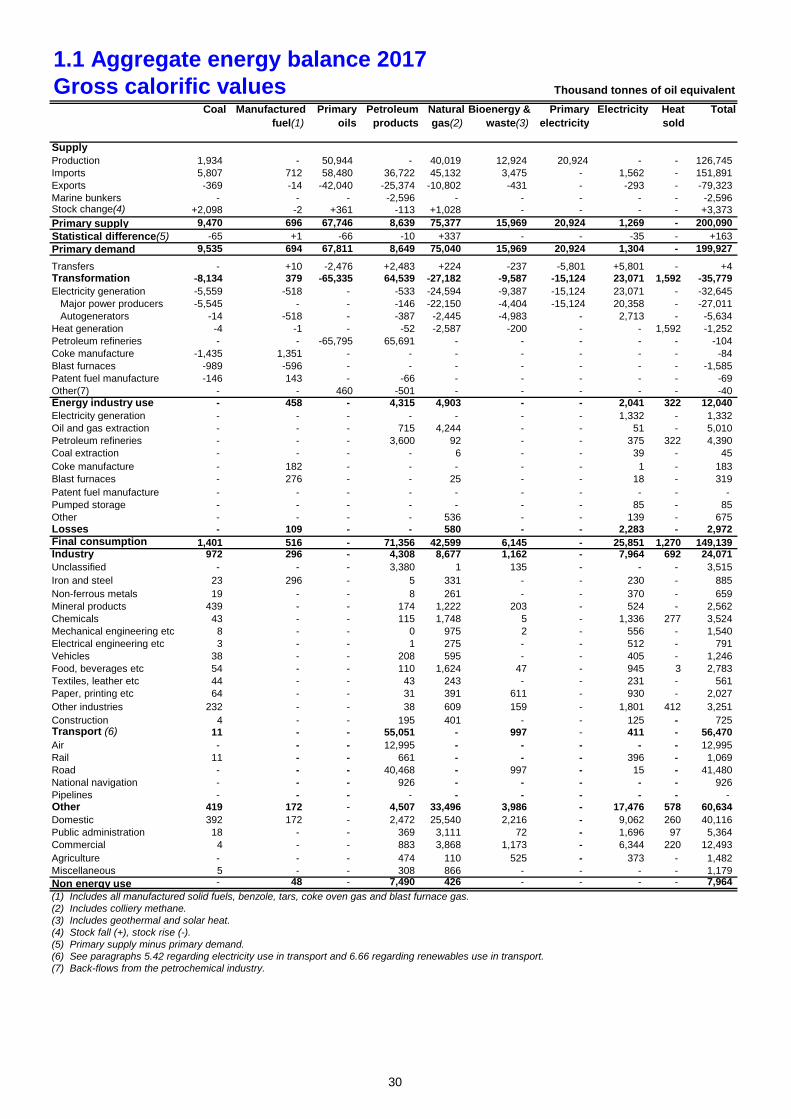
1.1 Aggregate energy balance 2017Gross calorific values Thousand tonnes of oil equivalent
Coal Manufactured fuel(1)
Primary oils
Petroleum products
Natural gas(2)
Bioenergy & waste(3)
Primary electricity
Electricity Heat sold
Total
Supply Production 1,934 - 50,944 - 40,019 12,924 20,924 - - 126,745 Imports 5,807 712 58,480 36,722 45,132 3,475 - 1,562 - 151,891 Exports -369 -14 -42,040 -25,374 -10,802 -431 - -293 - -79,323 Marine bunkers - - - -2,596 - - - - - -2,596 Stock change(4) +2,098 -2 +361 -113 +1,028 - - - - +3,373 Primary supply 9,470 696 67,746 8,639 75,377 15,969 20,924 1,269 - 200,090 Statistical difference(5) -65 +1 -66 -10 +337 - - -35 - +163 Primary demand 9,535 694 67,811 8,649 75,040 15,969 20,924 1,304 - 199,927 Transfers - +10 -2,476 +2,483 +224 -237 -5,801 +5,801 - +4 Transformation -8,134 379 -65,335 64,539 -27,182 -9,587 -15,124 23,071 1,592 -35,779 Electricity generation -5,559 -518 - -533 -24,594 -9,387 -15,124 23,071 - -32,645 Major power producers -5,545 - - -146 -22,150 -4,404 -15,124 20,358 - -27,011 Autogenerators -14 -518 - -387 -2,445 -4,983 - 2,713 - -5,634 Heat generation -4 -1 - -52 -2,587 -200 - - 1,592 -1,252 Petroleum refineries - - -65,795 65,691 - - - - - -104 Coke manufacture -1,435 1,351 - - - - - - - -84 Blast furnaces -989 -596 - - - - - - - -1,585 Patent fuel manufacture -146 143 - -66 - - - - - -69 Other(7) - - 460 -501 - - - - - -40 Energy industry use - 458 - 4,315 4,903 - - 2,041 322 12,040 Electricity generation - - - - - - - 1,332 - 1,332 Oil and gas extraction - - - 715 4,244 - - 51 - 5,010 Petroleum refineries - - - 3,600 92 - - 375 322 4,390 Coal extraction - - - - 6 - - 39 - 45 Coke manufacture - 182 - - - - - 1 - 183 Blast furnaces - 276 - - 25 - - 18 - 319 Patent fuel manufacture - - - - - - - - - - Pumped storage - - - - - - - 85 - 85 Other - - - - 536 - - 139 - 675 Losses - 109 - - 580 - - 2,283 - 2,972 Final consumption 1,401 516 - 71,356 42,599 6,145 - 25,851 1,270 149,139 Industry 972 296 - 4,308 8,677 1,162 - 7,964 692 24,071 Unclassified - - - 3,380 1 135 - - - 3,515 Iron and steel 23 296 - 5 331 - - 230 - 885 Non-ferrous metals 19 - - 8 261 - - 370 - 659 Mineral products 439 - - 174 1,222 203 - 524 - 2,562 Chemicals 43 - - 115 1,748 5 - 1,336 277 3,524 Mechanical engineering etc 8 - - 0 975 2 - 556 - 1,540 Electrical engineering etc 3 - - 1 275 - - 512 - 791 Vehicles 38 - - 208 595 - - 405 - 1,246 Food, beverages etc 54 - - 110 1,624 47 - 945 3 2,783 Textiles, leather etc 44 - - 43 243 - - 231 - 561 Paper, printing etc 64 - - 31 391 611 - 930 - 2,027 Other industries 232 - - 38 609 159 - 1,801 412 3,251 Construction 4 - - 195 401 - - 125 - 725 Transport (6) 11 - - 55,051 - 997 - 411 - 56,470 Air - - - 12,995 - - - - - 12,995 Rail 11 - - 661 - - - 396 - 1,069 Road - - - 40,468 - 997 - 15 - 41,480 National navigation - - - 926 - - - - - 926 Pipelines - - - - - - - - - - Other 419 172 - 4,507 33,496 3,986 - 17,476 578 60,634 Domestic 392 172 - 2,472 25,540 2,216 - 9,062 260 40,116 Public administration 18 - - 369 3,111 72 - 1,696 97 5,364 Commercial 4 - - 883 3,868 1,173 - 6,344 220 12,493 Agriculture - - - 474 110 525 - 373 - 1,482 Miscellaneous 5 - - 308 866 - - - - 1,179 Non energy use - 48 - 7,490 426 - - - - 7,964 (1) Includes all manufactured solid fuels, benzole, tars, coke oven gas and blast furnace gas.(2) Includes colliery methane.(3) Includes geothermal and solar heat.(4) Stock fall (+), stock rise (-).(5) Primary supply minus primary demand.(6) See paragraphs 5.42 regarding electricity use in transport and 6.66 regarding renewables use in transport.(7) Back-flows from the petrochemical industry.
30
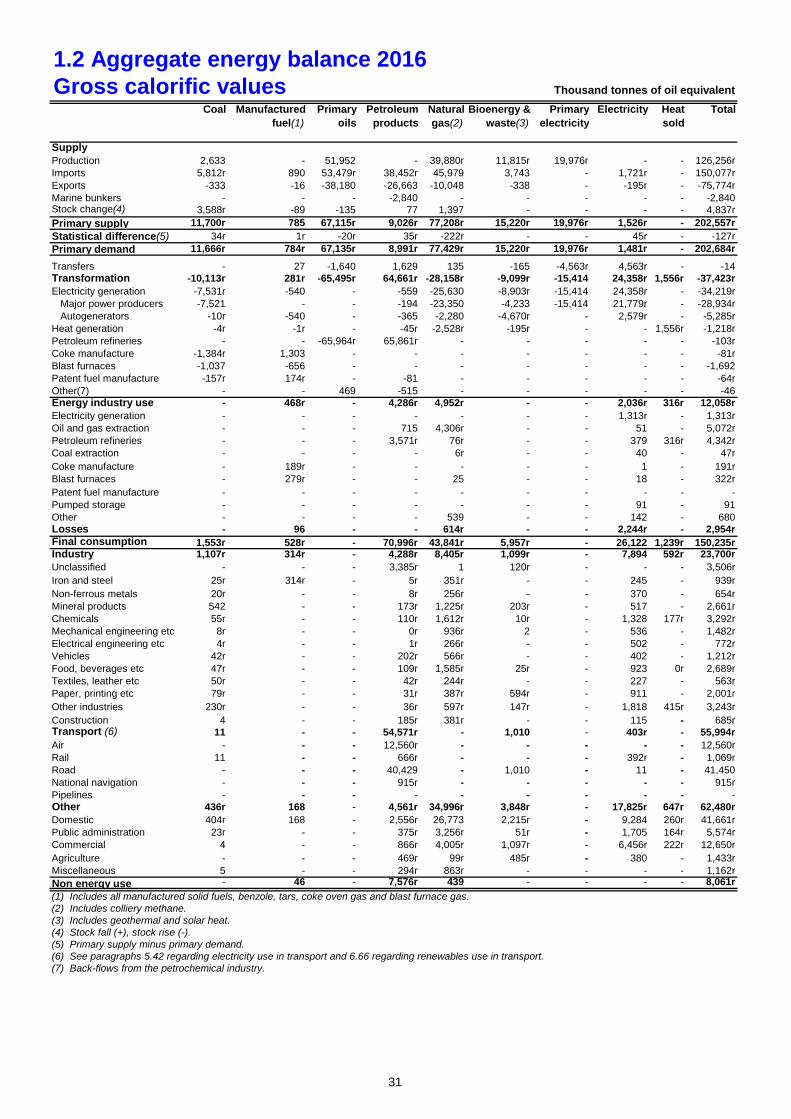
1.2 Aggregate energy balance 2016Gross calorific values Thousand tonnes of oil equivalent
Coal Manufactured fuel(1)
Primary oils
Petroleum products
Natural gas(2)
Bioenergy & waste(3)
Primary electricity
Electricity Heat sold
Total
Supply Production 2,633 - 51,952 - 39,880r 11,815r 19,976r - - 126,256rImports 5,812r 890 53,479r 38,452r 45,979 3,743 - 1,721r - 150,077rExports -333 -16 -38,180 -26,663 -10,048 -338 - -195r - -75,774rMarine bunkers - - - -2,840 - - - - - -2,840Stock change(4) 3,588r -89 -135 77 1,397 - - - - 4,837rPrimary supply 11,700r 785 67,115r 9,026r 77,208r 15,220r 19,976r 1,526r - 202,557rStatistical difference(5) 34r 1r -20r 35r -222r - - 45r - -127rPrimary demand 11,666r 784r 67,135r 8,991r 77,429r 15,220r 19,976r 1,481r - 202,684rTransfers - 27 -1,640 1,629 135 -165 -4,563r 4,563r - -14Transformation -10,113r 281r -65,495r 64,661r -28,158r -9,099r -15,414 24,358r 1,556r -37,423rElectricity generation -7,531r -540 - -559 -25,630 -8,903r -15,414 24,358r - -34,219r Major power producers -7,521 - - -194 -23,350 -4,233 -15,414 21,779r - -28,934r Autogenerators -10r -540 - -365 -2,280 -4,670r - 2,579r - -5,285rHeat generation -4r -1r - -45r -2,528r -195r - - 1,556r -1,218rPetroleum refineries - - -65,964r 65,861r - - - - - -103rCoke manufacture -1,384r 1,303 - - - - - - - -81rBlast furnaces -1,037 -656 - - - - - - - -1,692Patent fuel manufacture -157r 174r - -81 - - - - - -64rOther(7) - - 469 -515 - - - - - -46Energy industry use - 468r - 4,286r 4,952r - - 2,036r 316r 12,058rElectricity generation - - - - - - - 1,313r - 1,313rOil and gas extraction - - - 715 4,306r - - 51 - 5,072rPetroleum refineries - - - 3,571r 76r - - 379 316r 4,342rCoal extraction - - - - 6r - - 40 - 47rCoke manufacture - 189r - - - - - 1 - 191rBlast furnaces - 279r - - 25 - - 18 - 322rPatent fuel manufacture - - - - - - - - - -Pumped storage - - - - - - - 91 - 91Other - - - - 539 - - 142 - 680Losses - 96 - - 614r - - 2,244r - 2,954rFinal consumption 1,553r 528r - 70,996r 43,841r 5,957r - 26,122 1,239r 150,235rIndustry 1,107r 314r - 4,288r 8,405r 1,099r - 7,894 592r 23,700rUnclassified - - - 3,385r 1 120r - - - 3,506rIron and steel 25r 314r - 5r 351r - - 245 - 939rNon-ferrous metals 20r - - 8r 256r - - 370 - 654rMineral products 542 - - 173r 1,225r 203r - 517 - 2,661rChemicals 55r - - 110r 1,612r 10r - 1,328 177r 3,292rMechanical engineering etc 8r - - 0r 936r 2 - 536 - 1,482rElectrical engineering etc 4r - - 1r 266r - - 502 - 772rVehicles 42r - - 202r 566r - - 402 - 1,212rFood, beverages etc 47r - - 109r 1,585r 25r - 923 0r 2,689rTextiles, leather etc 50r - - 42r 244r - - 227 - 563rPaper, printing etc 79r - - 31r 387r 594r - 911 - 2,001rOther industries 230r - - 36r 597r 147r - 1,818 415r 3,243rConstruction 4 - - 185r 381r - - 115 - 685rTransport (6) 11 - - 54,571r - 1,010 - 403r - 55,994rAir - - - 12,560r - - - - - 12,560rRail 11 - - 666r - - - 392r - 1,069rRoad - - - 40,429 - 1,010 - 11 - 41,450National navigation - - - 915r - - - - - 915rPipelines - - - - - - - - - -Other 436r 168 - 4,561r 34,996r 3,848r - 17,825r 647r 62,480rDomestic 404r 168 - 2,556r 26,773 2,215r - 9,284 260r 41,661rPublic administration 23r - - 375r 3,256r 51r - 1,705 164r 5,574rCommercial 4 - - 866r 4,005r 1,097r - 6,456r 222r 12,650rAgriculture - - - 469r 99r 485r - 380 - 1,433rMiscellaneous 5 - - 294r 863r - - - - 1,162rNon energy use - 46 - 7,576r 439 - - - - 8,061r(1) Includes all manufactured solid fuels, benzole, tars, coke oven gas and blast furnace gas.(2) Includes colliery methane.(3) Includes geothermal and solar heat.(4) Stock fall (+), stock rise (-).(5) Primary supply minus primary demand.(6) See paragraphs 5.42 regarding electricity use in transport and 6.66 regarding renewables use in transport.(7) Back-flows from the petrochemical industry.
31
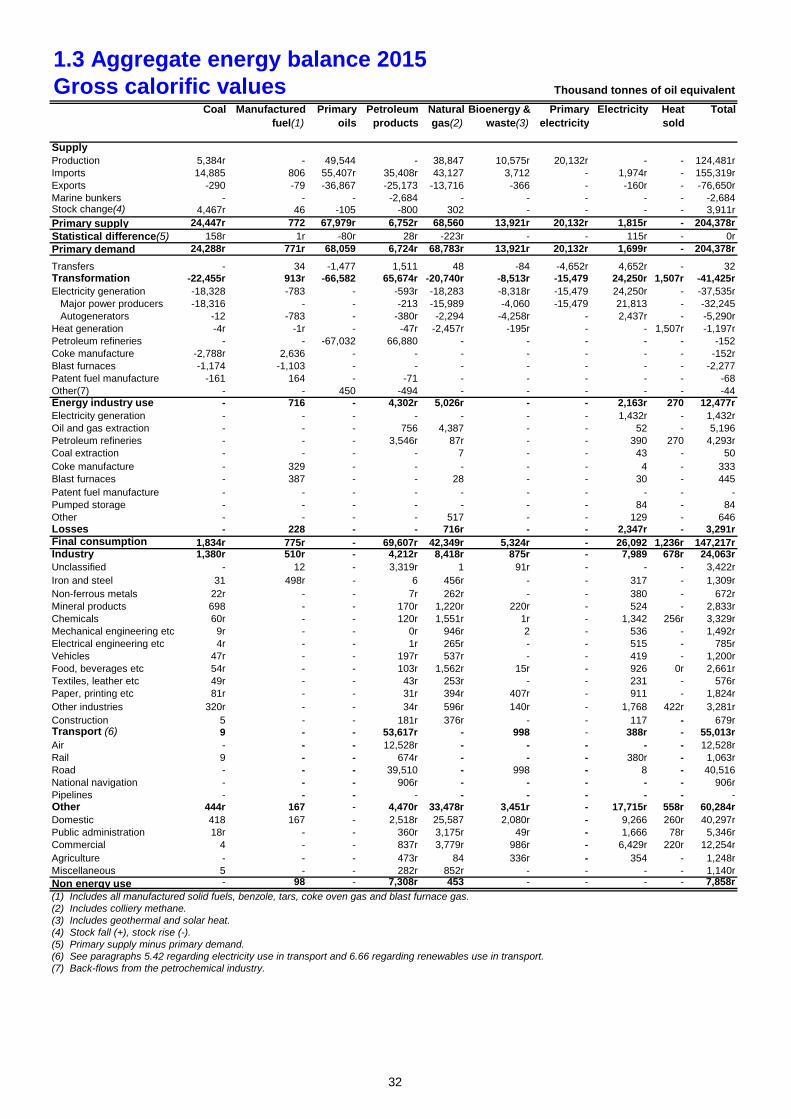
1.3 Aggregate energy balance 2015Gross calorific values Thousand tonnes of oil equivalent
Coal Manufactured fuel(1)
Primary oils
Petroleum products
Natural gas(2)
Bioenergy & waste(3)
Primary electricity
Electricity Heat sold
Total
Supply Production 5,384r - 49,544 - 38,847 10,575r 20,132r - - 124,481rImports 14,885 806 55,407r 35,408r 43,127 3,712 - 1,974r - 155,319rExports -290 -79 -36,867 -25,173 -13,716 -366 - -160r - -76,650rMarine bunkers - - - -2,684 - - - - - -2,684Stock change(4) 4,467r 46 -105 -800 302 - - - - 3,911rPrimary supply 24,447r 772 67,979r 6,752r 68,560 13,921r 20,132r 1,815r - 204,378rStatistical difference(5) 158r 1r -80r 28r -223r - - 115r - 0rPrimary demand 24,288r 771r 68,059 6,724r 68,783r 13,921r 20,132r 1,699r - 204,378rTransfers - 34 -1,477 1,511 48 -84 -4,652r 4,652r - 32Transformation -22,455r 913r -66,582 65,674r -20,740r -8,513r -15,479 24,250r 1,507r -41,425rElectricity generation -18,328 -783 - -593r -18,283 -8,318r -15,479 24,250r - -37,535r Major power producers -18,316 - - -213 -15,989 -4,060 -15,479 21,813 - -32,245 Autogenerators -12 -783 - -380r -2,294 -4,258r - 2,437r - -5,290rHeat generation -4r -1r - -47r -2,457r -195r - - 1,507r -1,197rPetroleum refineries - - -67,032 66,880 - - - - - -152Coke manufacture -2,788r 2,636 - - - - - - - -152rBlast furnaces -1,174 -1,103 - - - - - - - -2,277Patent fuel manufacture -161 164 - -71 - - - - - -68Other(7) - - 450 -494 - - - - - -44Energy industry use - 716 - 4,302r 5,026r - - 2,163r 270 12,477rElectricity generation - - - - - - - 1,432r - 1,432rOil and gas extraction - - - 756 4,387 - - 52 - 5,196Petroleum refineries - - - 3,546r 87r - - 390 270 4,293rCoal extraction - - - - 7 - - 43 - 50Coke manufacture - 329 - - - - - 4 - 333Blast furnaces - 387 - - 28 - - 30 - 445Patent fuel manufacture - - - - - - - - - -Pumped storage - - - - - - - 84 - 84Other - - - - 517 - - 129 - 646Losses - 228 - - 716r - - 2,347r - 3,291rFinal consumption 1,834r 775r - 69,607r 42,349r 5,324r - 26,092 1,236r 147,217rIndustry 1,380r 510r - 4,212r 8,418r 875r - 7,989 678r 24,063rUnclassified - 12 - 3,319r 1 91r - - - 3,422rIron and steel 31 498r - 6 456r - - 317 - 1,309rNon-ferrous metals 22r - - 7r 262r - - 380 - 672rMineral products 698 - - 170r 1,220r 220r - 524 - 2,833rChemicals 60r - - 120r 1,551r 1r - 1,342 256r 3,329rMechanical engineering etc 9r - - 0r 946r 2 - 536 - 1,492rElectrical engineering etc 4r - - 1r 265r - - 515 - 785rVehicles 47r - - 197r 537r - - 419 - 1,200rFood, beverages etc 54r - - 103r 1,562r 15r - 926 0r 2,661rTextiles, leather etc 49r - - 43r 253r - - 231 - 576rPaper, printing etc 81r - - 31r 394r 407r - 911 - 1,824rOther industries 320r - - 34r 596r 140r - 1,768 422r 3,281rConstruction 5 - - 181r 376r - - 117 - 679rTransport (6) 9 - - 53,617r - 998 - 388r - 55,013rAir - - - 12,528r - - - - - 12,528rRail 9 - - 674r - - - 380r - 1,063rRoad - - - 39,510 - 998 - 8 - 40,516National navigation - - - 906r - - - - - 906rPipelines - - - - - - - - - -Other 444r 167 - 4,470r 33,478r 3,451r - 17,715r 558r 60,284rDomestic 418 167 - 2,518r 25,587 2,080r - 9,266 260r 40,297rPublic administration 18r - - 360r 3,175r 49r - 1,666 78r 5,346rCommercial 4 - - 837r 3,779r 986r - 6,429r 220r 12,254rAgriculture - - - 473r 84 336r - 354 - 1,248rMiscellaneous 5 - - 282r 852r - - - - 1,140rNon energy use - 98 - 7,308r 453 - - - - 7,858r(1) Includes all manufactured solid fuels, benzole, tars, coke oven gas and blast furnace gas.(2) Includes colliery methane.(3) Includes geothermal and solar heat.(4) Stock fall (+), stock rise (-).(5) Primary supply minus primary demand.(6) See paragraphs 5.42 regarding electricity use in transport and 6.66 regarding renewables use in transport.(7) Back-flows from the petrochemical industry.
32
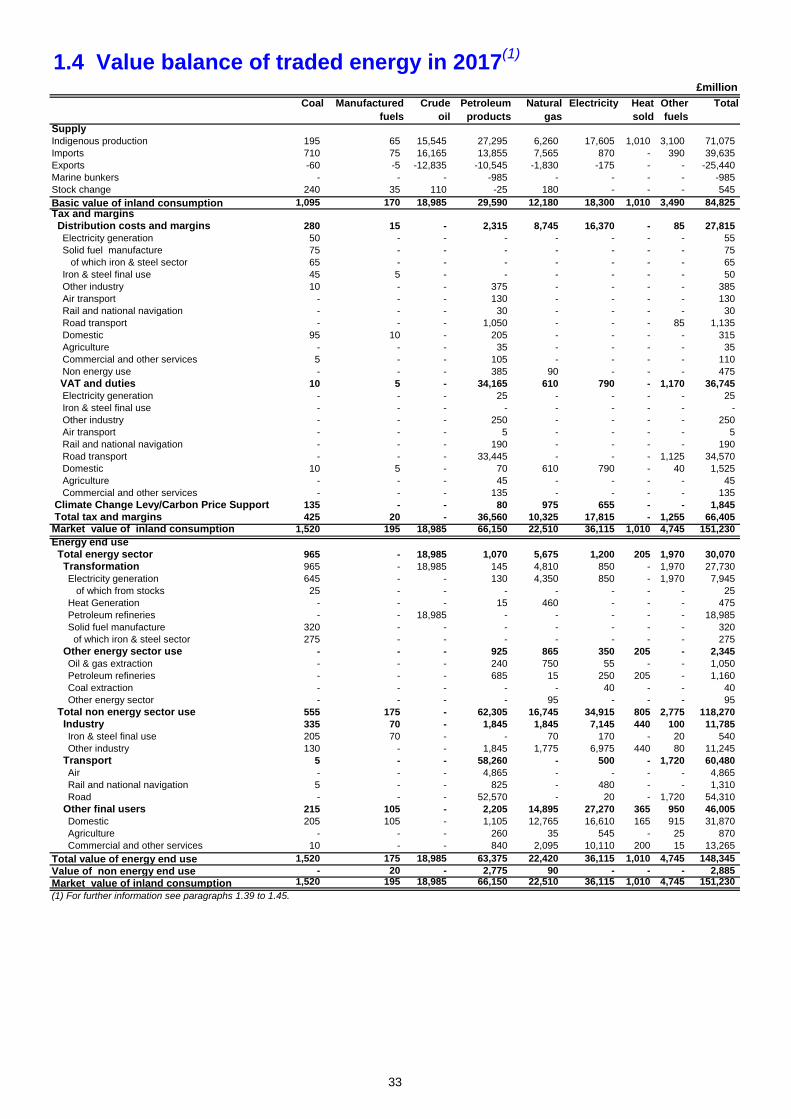
1.4 Value balance of traded energy in 2017(1)
Coal Manufactured fuels
Crude oil
Petroleum products
Natural gas
Electricity Heat sold
Other fuels
Total
SupplyIndigenous production 195 65 15,545 27,295 6,260 17,605 1,010 3,100 71,075 Imports 710 75 16,165 13,855 7,565 870 - 390 39,635 Exports -60 -5 -12,835 -10,545 -1,830 -175 - - -25,440 Marine bunkers - - - -985 - - - - -985 Stock change 240 35 110 -25 180 - - - 545 Basic value of inland consumption 1,095 170 18,985 29,590 12,180 18,300 1,010 3,490 84,825 Tax and margins Distribution costs and margins 280 15 - 2,315 8,745 16,370 - 85 27,815 Electricity generation 50 - - - - - - - 55 Solid fuel manufacture 75 - - - - - - - 75 of which iron & steel sector 65 - - - - - - - 65 Iron & steel final use 45 5 - - - - - - 50 Other industry 10 - - 375 - - - - 385 Air transport - - - 130 - - - - 130 Rail and national navigation - - - 30 - - - - 30 Road transport - - - 1,050 - - - 85 1,135 Domestic 95 10 - 205 - - - - 315 Agriculture - - - 35 - - - - 35 Commercial and other services 5 - - 105 - - - - 110 Non energy use - - - 385 90 - - - 475 VAT and duties 10 5 - 34,165 610 790 - 1,170 36,745 Electricity generation - - - 25 - - - - 25 Iron & steel final use - - - - - - - - - Other industry - - - 250 - - - - 250 Air transport - - - 5 - - - - 5 Rail and national navigation - - - 190 - - - - 190 Road transport - - - 33,445 - - - 1,125 34,570 Domestic 10 5 - 70 610 790 - 40 1,525 Agriculture - - - 45 - - - - 45 Commercial and other services - - - 135 - - - - 135 Climate Change Levy/Carbon Price Support 135 - - 80 975 655 - - 1,845 Total tax and margins 425 20 - 36,560 10,325 17,815 - 1,255 66,405 Market value of inland consumption 1,520 195 18,985 66,150 22,510 36,115 1,010 4,745 151,230 Energy end use Total energy sector 965 - 18,985 1,070 5,675 1,200 205 1,970 30,070 Transformation 965 - 18,985 145 4,810 850 - 1,970 27,730 Electricity generation 645 - - 130 4,350 850 - 1,970 7,945 of which from stocks 25 - - - - - - - 25 Heat Generation - - - 15 460 - - - 475 Petroleum refineries - - 18,985 - - - - - 18,985 Solid fuel manufacture 320 - - - - - - - 320 of which iron & steel sector 275 - - - - - - - 275 Other energy sector use - - - 925 865 350 205 - 2,345 Oil & gas extraction - - - 240 750 55 - - 1,050 Petroleum refineries - - - 685 15 250 205 - 1,160 Coal extraction - - - - - 40 - - 40 Other energy sector - - - - 95 - - - 95 Total non energy sector use 555 175 - 62,305 16,745 34,915 805 2,775 118,270 Industry 335 70 - 1,845 1,845 7,145 440 100 11,785 Iron & steel final use 205 70 - - 70 170 - 20 540 Other industry 130 - - 1,845 1,775 6,975 440 80 11,245 Transport 5 - - 58,260 - 500 - 1,720 60,480 Air - - - 4,865 - - - - 4,865 Rail and national navigation 5 - - 825 - 480 - - 1,310 Road - - - 52,570 - 20 - 1,720 54,310 Other final users 215 105 - 2,205 14,895 27,270 365 950 46,005 Domestic 205 105 - 1,105 12,765 16,610 165 915 31,870 Agriculture - - - 260 35 545 - 25 870 Commercial and other services 10 - - 840 2,095 10,110 200 15 13,265 Total value of energy end use 1,520 175 18,985 63,375 22,420 36,115 1,010 4,745 148,345 Value of non energy end use - 20 - 2,775 90 - - - 2,885 Market value of inland consumption 1,520 195 18,985 66,150 22,510 36,115 1,010 4,745 151,230 (1) For further information see paragraphs 1.39 to 1.45.
£million
33
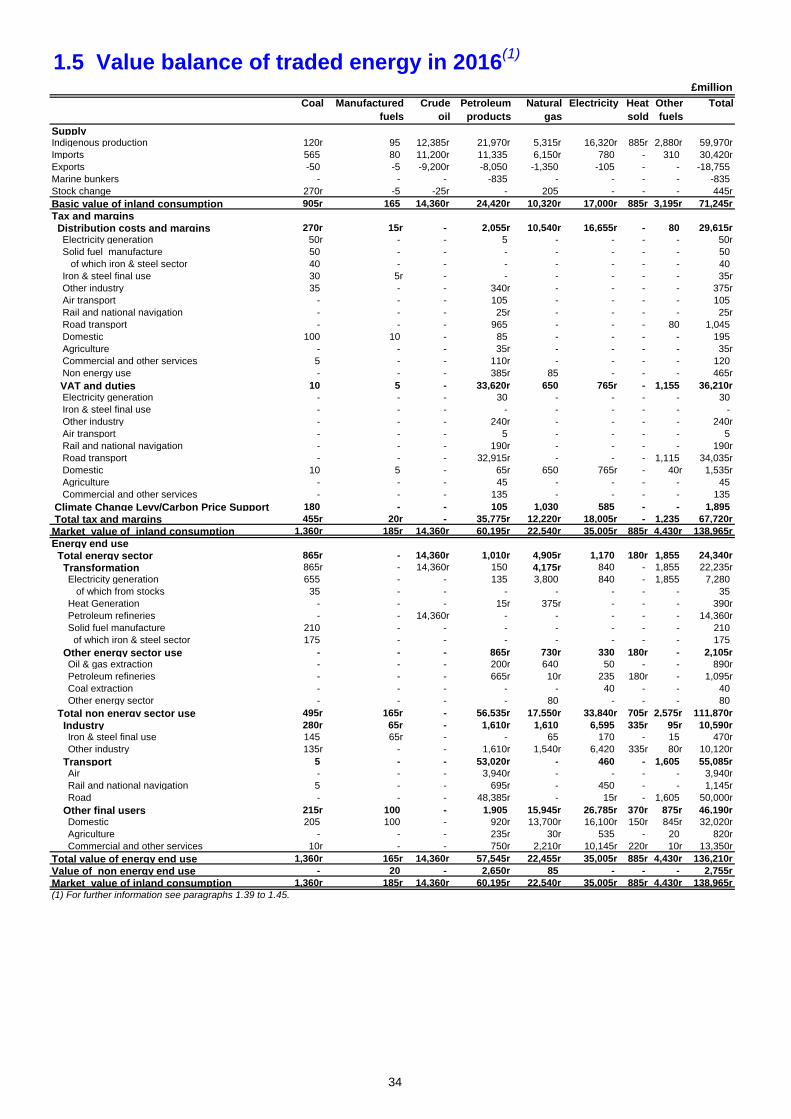
1.5 Value balance of traded energy in 2016(1)
Coal Manufactured fuels
Crude oil
Petroleum products
Natural gas
Electricity Heat sold
Other fuels
Total
SupplyIndigenous production 120r 95 12,385r 21,970r 5,315r 16,320r 885r 2,880r 59,970rImports 565 80 11,200r 11,335 6,150r 780 - 310 30,420rExports -50 -5 -9,200r -8,050 -1,350 -105 - - -18,755 Marine bunkers - - - -835 - - - - -835 Stock change 270r -5 -25r - 205 - - - 445rBasic value of inland consumption 905r 165 14,360r 24,420r 10,320r 17,000r 885r 3,195r 71,245rTax and margins Distribution costs and margins 270r 15r - 2,055r 10,540r 16,655r - 80 29,615r Electricity generation 50r - - 5 - - - - 50r Solid fuel manufacture 50 - - - - - - - 50 of which iron & steel sector 40 - - - - - - - 40 Iron & steel final use 30 5r - - - - - - 35r Other industry 35 - - 340r - - - - 375r Air transport - - - 105 - - - - 105 Rail and national navigation - - - 25r - - - - 25r Road transport - - - 965 - - - 80 1,045 Domestic 100 10 - 85 - - - - 195 Agriculture - - - 35r - - - - 35r Commercial and other services 5 - - 110r - - - - 120 Non energy use - - - 385r 85 - - - 465r VAT and duties 10 5 - 33,620r 650 765r - 1,155 36,210r Electricity generation - - - 30 - - - - 30 Iron & steel final use - - - - - - - - - Other industry - - - 240r - - - - 240r Air transport - - - 5 - - - - 5 Rail and national navigation - - - 190r - - - - 190r Road transport - - - 32,915r - - - 1,115 34,035r Domestic 10 5 - 65r 650 765r - 40r 1,535r Agriculture - - - 45 - - - - 45 Commercial and other services - - - 135 - - - - 135 Climate Change Levy/Carbon Price Support 180 - - 105 1,030 585 - - 1,895 Total tax and margins 455r 20r - 35,775r 12,220r 18,005r - 1,235 67,720rMarket value of inland consumption 1,360r 185r 14,360r 60,195r 22,540r 35,005r 885r 4,430r 138,965rEnergy end use Total energy sector 865r - 14,360r 1,010r 4,905r 1,170 180r 1,855 24,340r Transformation 865r - 14,360r 150 4,175r 840 - 1,855 22,235r Electricity generation 655 - - 135 3,800 840 - 1,855 7,280 of which from stocks 35 - - - - - - - 35 Heat Generation - - - 15r 375r - - - 390r Petroleum refineries - - 14,360r - - - - - 14,360r Solid fuel manufacture 210 - - - - - - - 210 of which iron & steel sector 175 - - - - - - - 175 Other energy sector use - - - 865r 730r 330 180r - 2,105r Oil & gas extraction - - - 200r 640 50 - - 890r Petroleum refineries - - - 665r 10r 235 180r - 1,095r Coal extraction - - - - - 40 - - 40 Other energy sector - - - - 80 - - - 80 Total non energy sector use 495r 165r - 56,535r 17,550r 33,840r 705r 2,575r 111,870r Industry 280r 65r - 1,610r 1,610 6,595 335r 95r 10,590r Iron & steel final use 145 65r - - 65 170 - 15 470r Other industry 135r - - 1,610r 1,540r 6,420 335r 80r 10,120r Transport 5 - - 53,020r - 460 - 1,605 55,085r Air - - - 3,940r - - - - 3,940r Rail and national navigation 5 - - 695r - 450 - - 1,145r Road - - - 48,385r - 15r - 1,605 50,000r Other final users 215r 100 - 1,905 15,945r 26,785r 370r 875r 46,190r Domestic 205 100 - 920r 13,700r 16,100r 150r 845r 32,020r Agriculture - - - 235r 30r 535 - 20 820r Commercial and other services 10r - - 750r 2,210r 10,145r 220r 10r 13,350rTotal value of energy end use 1,360r 165r 14,360r 57,545r 22,455r 35,005r 885r 4,430r 136,210rValue of non energy end use - 20 - 2,650r 85 - - - 2,755rMarket value of inland consumption 1,360r 185r 14,360r 60,195r 22,540r 35,005r 885r 4,430r 138,965r(1) For further information see paragraphs 1.39 to 1.45.
£million
34
1.6 Value balance of traded energy in 2015(1)
Coal Manufactured fuels
Crude oil
Petroleum products
Natural gas
Electricity Heat sold
Other fuels
Total
SupplyIndigenous production 245r 215r 12,985 23,205r 7,035r 16,850r 1,040r 2,680r 64,255rImports 985 70 12,645 12,505r 6,990 950 - 340 34,485rExports -45 -20 -9,915 -8,755r -2,310 -80 - - -21,125rMarine bunkers - - - -855 - - - - -855 Stock change 320r -20r -15 -250 55 - - - 90 Basic value of inland consumption 1,505 240 15,695 25,855r 11,770r 17,720r 1,040r 3,020r 76,845rTax and margins Distribution costs and margins 380r 15r - 2,030r 10,465r 16,835r - 85 29,810r Electricity generation 105 - - 5 - - - - 105 Solid fuel manufacture 85 - - - - - - - 85 of which iron & steel sector 75 - - - - - - - 75 Iron & steel final use 35 5r - - - - - - 40 Other industry 70r - - 340r - - - - 410r Air transport - - - 110 - - - - 110 Rail and national navigation - - - 25r - - - - 25r Road transport - - - 975 - - - 85 1,060 Domestic 85 10 - 100 - - - - 200r Agriculture - - - 30 - - - - 30 Commercial and other services 5r - - 85 - - - - 90r Non energy use - - - 360 105 - - - 465 VAT and duties 10 5 - 33,025r 685 780r - 1,160 35,660r Electricity generation - - - 30 - - - - 30 Iron & steel final use - - - - - - - - - Other industry - - - 240r - - - - 240r Air transport - - - 5 - - - - 5 Rail and national navigation - - - 190r - - - - 190r Road transport - - - 32,320r - - - 1,125 33,445r Domestic 10 5 - 65 685 780r - 35 1,580r Agriculture - - - 45 - - - - 45 Commercial and other services - - - 125r - - - - 125r Climate Change Levy/Carbon Price Support 465 - - 270 700 325 - - 1,760 Total tax and margins 855r 20r - 35,325r 11,850r 17,940r - 1,240 67,230rMarket value of inland consumption 2,360r 265r 15,695 61,180r 23,625r 35,660r 1,040r 4,260r 144,080rEnergy end use Total energy sector 1,800r - 15,695 1,065r 4,740r 1,245 185r 1,770r 26,500r Transformation 1,800r - 15,695 170r 3,820r 915 - 1,770r 24,165r Electricity generation 1,430 - - 155 3,365 915 - 1,770r 7,630r of which from stocks 25 - - - - - - - 25 Heat Generation - - - 15r 455r - - - 470r Petroleum refineries - - 15,695 - - - - - 15,695 Solid fuel manufacture 370 - - - - - - - 370 of which iron & steel sector 335 - - - - - - - 335 Other energy sector use - - - 895r 920r 335 185r - 2,335r Oil & gas extraction - - - 235r 810 50 - - 1,095r Petroleum refineries - - - 660 15r 235 185r - 1,095r Coal extraction - - - - - 45 - - 45 Other energy sector - - - - 95 5 - - 100 Total non energy sector use 565r 220r - 57,510r 18,775r 34,410r 855r 2,490r 114,830r Industry 345 125r - 1,705r 1,955r 6,895 470r 90r 11,580r Iron & steel final use 150 120r - - 105 240 - 25r 645r Other industry 195 5 - 1,700r 1,850r 6,655 470r 60r 10,935r Transport 5 - - 53,835r - 440 - 1,655 55,935r Air - - - 4,215 - - - - 4,215 Rail and national navigation 5 - - 750r - 430 - - 1,185r Road - - - 48,870r - 10r - 1,655 50,535r Other final users 215r 95 - 1,970r 16,825r 27,075r 385r 750r 47,315r Domestic 205 95 - 1,000r 14,425r 16,340r 180r 730r 32,980r Agriculture - - - 240r 30 505 - 10r 785 Commercial and other services 10r - - 730r 2,370r 10,235r 205r 10r 13,555rTotal value of energy end use 2,360r 220r 15,695 58,575r 23,520r 35,660r 1,040r 4,260r 141,330rValue of non energy end use - 40 - 2,605 105 - - - 2,750 Market value of inland consumption 2,360r 265r 15,695 61,180r 23,625r 35,660r 1,040r 4,260r 144,080r(1) For further information see paragraphs 1.39 to 1.45.
£million
35

1.7 Sales of electricity and gas by sector United Kingdom
2013 2014 2015 2016 2017Total selling value (£ million)(1)
Electricity generation - Gas 4,722 4,109 3,366 3,798 4,352
Industrial - Gas(2) 2,457 2,325 1,948 1,604 1,843 - Electricity 7,462 7,143 7,227 6,924 7,497 of which: Fuel industries 334 320 333 330 350 Industrial sector 7,129 6,823 6,894 6,594 7,147
Domestic sector - Gas 15,822 13,833 13,737 13,049 12,159 - Electricity 15,809 15,720 15,562 15,336 15,820
Other - Gas 3,488 2,583 2,501 2,339 2,217 - Electricity 10,918 10,867 11,178 11,142 11,156 of which: Agricultural sector 437 455 503 534 547 Commercial sector 8,613 8,504 8,664 8,598 8,576 Transport sector 398 431 442 461 499 Public lighting 170 178 190 194 201 Public admin. and other services 1,300 1,299 1,378 1,355 1,334
Total, all consumers 60,678 56,580 55,519 54,190 55,044 of which gas 26,489 22,850 21,552 20,789 20,571 of which electricity 34,189 33,730 33,966 33,401 34,473 Average net selling value per kWh sold (pence)(1)
Electricity generation - Gas 2.299 1.890 1.586 1.276 1.524
Industrial - Gas 2.616 2.310 1.990 1.641 1.826 - Electricity 7.992 8.073 8.191 8.074 8.631 of which: Fuel industries 8.219 8.645 8.652 8.648 9.130 Industrial sector 7.981 8.048 8.170 8.047 8.608
Domestic sector - Gas 4.606 4.876 4.616 4.191 4.093 - Electricity 14.017 14.666 14.594 14.384 15.215
Other - Gas 3.023 3.009 2.726 2.446 2.397 - Electricity 10.854 11.380 11.747 11.635 12.151 of which: Agricultural sector 11.284 11.846 12.221 12.079 12.600 Commercial sector 11.284 11.846 12.221 12.079 12.600 Transport sector 9.142 9.558 9.779 9.829 10.441 Public lighting 9.166 9.622 10.041 10.012 10.485 Public admin. and other services 9.166 9.622 10.041 10.012 10.485
Average, all consumers 5.698 5.781 5.611 4.969 5.199 of which gas 3.494 3.323 3.081 2.591 2.651 of which electricity 11.146 11.585 11.712 11.592 12.196 (1) Excludes VAT where payable - see paragraph 1.46 for a definition of average net selling value.(2) Excludes Fuel Industry use
36