Embed Size (px)
Citation preview
Infacon XV: International Ferro-Alloys Congress, Edited by R.T. Jones, P. den Hoed, & M.W. Erwee, Southern African Institute of Mining and Metallurgy, Cape Town, 25–28 February 2018
1
Changing nickel and chromium stainless steel markets
H.H. Pariser, N.R. Backeberg, O.C.M. Masson, and J.C.M. Bedder Roskill Pariser Steel Alloys, London, UK
Abstract – This market review covers the changing fortunes of the nickel and chromium markets, which are intimately tied to stainless steel production. Over the last decades, growth in the stainless steel market has outpaced that of the carbon steel, aluminium, copper and zinc markets, and as a result demand for nickel and chromium has increased. The emergence of China as the world’s largest stainless steel producer – estimated at 54% of world supply in 2017 – means that the country needs greater quantities of chrome ore: Chinese imports increased by 29% year on year in 2017. The dynamics of the chrome trade are heavily built on South Africa and China, but how long will this continue? The sheer size of China’s stainless steel industry means that it is also the largest consumer of primary nickel, thanks to the industry’s reliance on primary units, mostly in nickel pig iron. We estimate that stainless steel production accounted for 68% of global primary nickel demand in 2017, but this ratio is set to decrease in the years ahead as the increased electrification of automotive transport leads to higher requirements for nickel in batteries.
Keywords: stainless steel, nickel, chromium, ferrochrome, scrap
INTRODUCTION Stainless steel remains the principal end use for chromium and nickel units. Stainless steel is a generic term for corrosion resistant alloy steels containing 10.5% or more of chromium. In the AISI (American Iron and Steel Institute) classification of steels, stainless steel must contain 10% or more chromium; in the BSI (British Standards Institution) classification, they must contain 11.5% chromium or more. The addition of 10% chromium to a steel gives corrosion resistance in mild atmospheres; additions of over 18% chromium give protection in more destructive atmospheres in the chemical, petrochemical, process and power industries. Nickel is mostly added to improve the formability and ductility of stainless steel. By 1960, nickel demand in stainless steel was 219 kt, accounting for no more than 34% of the global nickel demand. This grew to a 68% market share in 2017, accounting for approximately 1,470 kt of primary nickel. Alloying with these elements brings out different crystal structures in stainless steel to enable different properties in machining, forming and welding. Roskill Pariser presents a market review for the nickel and chromium stainless steel markets, with historical data as of 19 January 2018. The data presented in this paper are sourced to Roskill Pariser Steel Alloys and Roskill Information Services, unless stated otherwise. It includes certain statements that may be deemed ‘forward-looking statements’. We have made every reasonable effort to ensure the veracity of the information presented, yet we cannot expressly guarantee the accuracy and reliability of the estimates, forecasts and conclusions contained herein. Accordingly, the statements in the presentation should be used for general guidance only.

2
STAINLESS STEEL Stainless steel has been one of the fastest-growing metal products over the past decades, outperforming carbon steels and aluminium, as well as base metals, owing to the rapid growth in demand from sectors such as construction, transportation, and consumer products (see Figure 1).
Figure 1: Comparison of growth rates of stainless steel to other metals, 1980 to 2015. Source: ISSF
Stainless steel demand in the 1950s to ’70s was defined by the post-war reconstruction period. Before the 1960s, the US stainless steel market was leading global development, until a few stainless steel producers in Japan and in Europe steadily increased their market shares to overtake the US in the late ’60s. Prior to 1980 China had been sporadically melting stainless steel, but only became a noteworthy supply source from the year 2000 onwards. In recent years, China developed into the global market leader thanks to rapidly growing Asian stainless demand and China’s capability of meeting this demand with ‘unconventional’ raw material usage – in particular nickel pig iron (NPI), but also because of state-supported capital expenditures into modern stainless steel making equipment. Japan has become a technology leader in a range of stainless steel applications for the automotive industry and various other consumer goods, while European stainless steel producers have focused on a wide range of applications in equipment used under demanding conditions in, for example, chemical plants and power stations, and a wide range of household appliances, consumer goods, and automotive parts. In the United States, market performance has been relatively steady over the last five years. In contrast, the performance in Japan has been more volatile, whereas China’s stainless output resumed its upward path in 2016 and 2018 following a modest decline in 2015. In 2017, we estimate that China accounted for 54% of world crude stainless steel production. End use structure of stainless steel It is a hopeless task quantifying the thousands of different applications of stainless steels. The top five end-use segments account for some 77% of recent markets, which we outline here. The dominant end-use applications for stainless steels are still machinery and equipment, followed by basic metals as well as fabricated metal products. These three

3
product groups account for some 58% of the aggregated market volume in industrialized countries, while in developing and emerging countries their share is as high as 69%. Motor vehicles play an important role in industrialized countries where they account for some 12.4%, whereas their ratio in developing and emerging countries is not more than 5.3% (see Figure 2).
Figure 2: Typical end-use structure in industrialized and developing & emerging countries
One market segment with a strong regional application is architecture, building, and construction (ABC). Globally ABC accounts for some 13% of the stainless steel requirement, but we observe wide variations between regions. Japan, for instance, has traditionally had a strong preference for stainless steel roofing and bath tubs, but these applications are hardly found in European countries. We follow quarterly stainless supply and demand volumes, which show an almost steady performance, which reflects the stabilizing impact of steady growth of the Chinese economy. In earlier decades, the market went through significant fluctuations owing to stocking and de-stocking activity. The two diagrams in Figure 3 illustrate the developments in stainless steel demand over the last seven years. Demand growth in developing and emerging countries amounts to some 6.3% annually, which is more than twice that of industrialized countries. Stainless steel price and market balance One of the key reasons for the steady demand growth in stainless steel is relative price stability. Stainless steel prices are published by various sources, but we found that our own price evaluation of service-centre sales prices provides a more realistic picture of the market over the past 6 to 8 years. In our opinion, the lack of reliable price information is a major handicap for the global stainless steel market. Modern price hedging under the prevailing circumstances is hardly possible.

4
Figure 3a: Weighted stainless steel demand index in industrialized countries
Figure 3b: Weighted stainless steel demand index in developing and emerging countries
We have followed stainless steel prices regularly since 1967, the first year that a generally accepted definition for stainless steel was introduced. Since then, nominal stainless steel prices have remained within a narrow range, close to the 1967 base year. Major price increases occurred during periods of high nickel prices, as was the case in 1989–1990 and again two decades later in 2008–2010. However, stainless steel prices have usually weakened again after the short high-price periods. In contrast, since 2005 stainless steel prices have stabilized above the base year value, in a range of some 120–130 index points. A price comparison with other commodities shows that iron and steel prices have outgrown stainless steel prices significantly, while prices for non-ferrous alloys, which include mostly copper alloys and aluminium, have also outperformed stainless steel (see Figure 4).
NICKEL “I have called it Nickel” – Axel Fredrik Cronstedt, Swedish mineralogist and chemist (1751)
China has developed into the largest market for primary nickel. The country is forecast to account for almost 57% of global nickel consumption in 2018. The second largest regional market is in the European Union, accounting for 13.5%, whereas markets combined under ‘Other Asia’ rank third with a global share of almost 10%. All other regions remain well below the 5% market position. Primary nickel markets have been divided into Class I and Class II materials, and chemical products used in the battery industry. We forecast the use of primary nickel in batteries to rise by an average of over 20% a year between 2017 and 2027. The scale

5
of the growth reflects not only the expected size of the market a decade from now, but also its currently small size. The main driver behind the forecast increase in the size of this market is the electrification of the automotive industry. Not only will nickel demand benefit from the substitution of internal combustion engines in cars by lithium-ion batteries, but also from changes in battery chemistries towards increasing concentrations of nickel, which will give the market an additional boost primarily from nickel sulfates. The details of this research were recently published in Roskill’s broader battery materials analytics and bespoke research.
127.0
40.0
250.8
20
60
100
140
180
220
260
300
340
1967 1972 1977 1982 1987 1992 1997 2002 2007 2012 2017
Inde
x, 1
967
= 1
00
Nominal Price 304
Deflated Price 304Growth Rate: -1.5 %
*) Base: Germany
Iron & Steel
©
Figure 4: Stainless steel price competitiveness indexed to 1967
The changing product-mix production is influencing only marginally the Class I nickel segment, which includes carbonyl nickel pellets, electrolytic nickel cathodes, and briquettes. The segment is expanding by only 1.2% per annum over the same period (2017–2027); it is expected to reach a level of some 1 Mt by 2027. Class II materials are primarily applied for stainless steel melting and include the classical ferronickel qualities, but also utility nickel, nickel oxide sinter, and nickel pig iron (NPI). This product group is expected to expand by 4.9% per annum to 1.7Mt between 2017 and 2027. Overall, nickel supply might need to reach some 3.1 Mt by 2027 to keep up with rising demand, particularly from the batteries sector – that is, 1 Mt more than in 2017 (we assume a market volume for nickel in 2018 of approximately 2.1 Mt). Electrolytic nickel cathodes should remain the main product group, followed closely by NPI, both accounting for about 600 kt. Ferronickel is the third largest product at 450 kt, with nickel briquettes accounting for just over 200 kt. The balance includes nickel oxide sinter, carbonyl nickel pellets and sulfates (see Figure 5). Nickel Pig Iron in China The development of the NPI market enabled China to feed its rising stainless steel production. NPI output grew strongly between 2005 and 2014, but slowed from 2015 onwards primarily due to a shortage in feed material. Production moved back recently to over 100 kt per quarter as the availability of ore has started to improve.

6
Figure 5: Nickel supply by type, 2013–2018
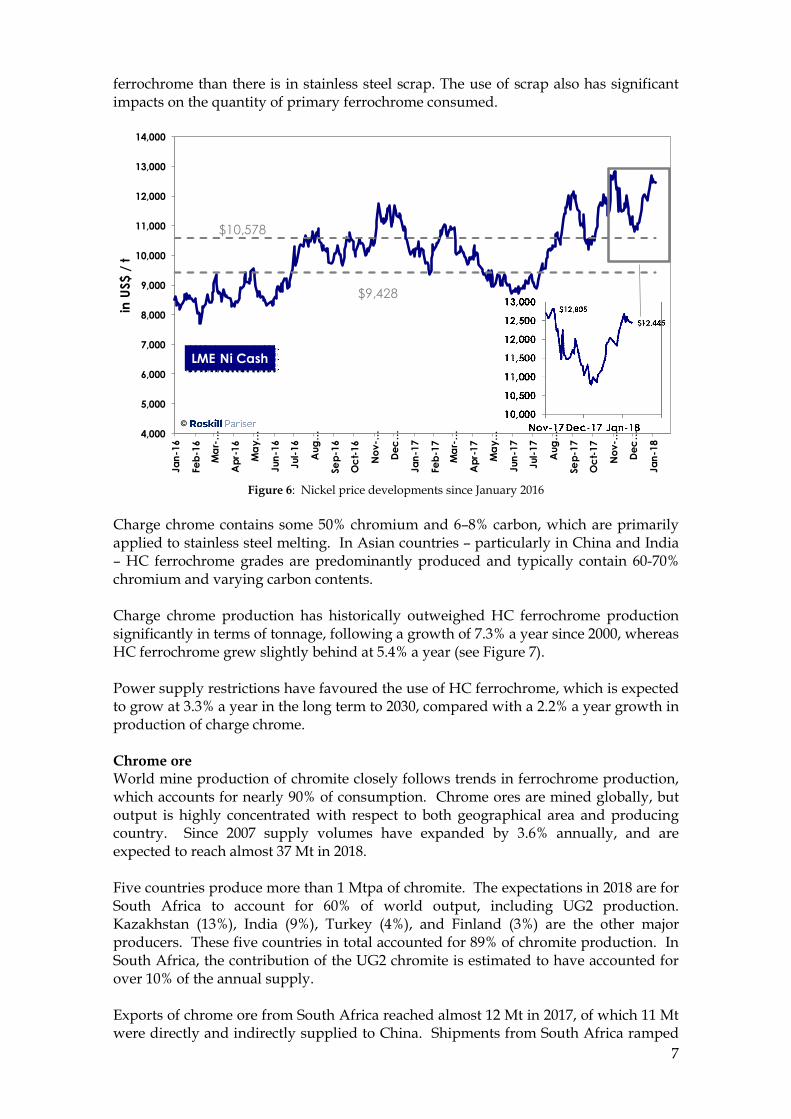
Over the years Chinese producers of NPI have changed their product mix. Almost 80% of the current output consists of high-grade materials containing more than 10% Ni, while low-grade materials with no more than 2% Ni have diminished to approximately 20%. Medium-grade (4–6% Ni) NPI was popular at the beginning of the decade when it accounted for some 30% of the total NPI output, but this market has since disappeared (it fell below 1% in 2016). Nickel price developments since January 2016 Nickel prices started 2016 at particularly low levels of about US$8,000/t (see Figure 6). However, as the market began to tighten after several years of chronic oversupply, prices began to improve. In the second half of 2016, prices were comfortably above the US$10,000/t mark, and traded within a range of US$9,000/t to US$11,000/t until the third quarter of 2017. Since then, however, the growing realization that strong prospects for nickel demand in batteries should sustain strong demand growth coupled with a continued market deficit has supported a further price appreciation. By early 2018, the LME nickel cash price had approached the US$13,000/t level. One factor that could hold prices back is the stock that had accumulated during the recent period of sustained market surpluses.
CHROMIUM Without chromium there is no stainless steel!
From a stainless steel producer’s point of view two types of chromium ferroalloys are to be distinguished: the charge chrome and the high-carbon (HC) ferrochrome (FeCr). In a stainless steel mill most of the required ferrochrome is added directly into the electric-arc furnace (EAF), with the stainless producer having the choice of adding either charge chrome or HC ferrochrome. When the steel has been decarburized and tapped from the furnace, the stainless producer will then usually add a small amount of medium-low carbon (MLC) ferrochrome to “trim up” the chrome specification of the steel. There are usually significant differences between the levels of certain impurities present in charge chrome vis-à-vis HC ferrochrome, especially levels of silicon. The scrap ratio used in stainless steel mills has a significant effect on the type of ferrochrome consumed; as there are almost always far more impurities in all grades of
7
ferrochrome than there is in stainless steel scrap. The use of scrap also has significant impacts on the quantity of primary ferrochrome consumed.
4,000
5,000
6,000
7,000
8,000
9,000
10,000
11,000
12,000
13,000
14,000
Jan-
16
Feb-
16
Mar
-…
Apr
-16
May
…
Jun-
16
Jul-1
6
Aug
…
Sep-
16
Oct
-16
Nov
-…
Dec…
Jan-
17
Feb-
17
Mar
-…
Apr
-17
May
…
Jun-
17
Jul-1
7
Aug
…
Sep-
17
Oct
-17
Nov
-…
Dec…
Jan-
18
in U
S$ /
t
LME Ni Cash
$9,428
$10,578
©
Figure 6: Nickel price developments since January 2016
Charge chrome contains some 50% chromium and 6–8% carbon, which are primarily applied to stainless steel melting. In Asian countries – particularly in China and India – HC ferrochrome grades are predominantly produced and typically contain 60-70% chromium and varying carbon contents. Charge chrome production has historically outweighed HC ferrochrome production significantly in terms of tonnage, following a growth of 7.3% a year since 2000, whereas HC ferrochrome grew slightly behind at 5.4% a year (see Figure 7). Power supply restrictions have favoured the use of HC ferrochrome, which is expected to grow at 3.3% a year in the long term to 2030, compared with a 2.2% a year growth in production of charge chrome. Chrome ore World mine production of chromite closely follows trends in ferrochrome production, which accounts for nearly 90% of consumption. Chrome ores are mined globally, but output is highly concentrated with respect to both geographical area and producing country. Since 2007 supply volumes have expanded by 3.6% annually, and are expected to reach almost 37 Mt in 2018. Five countries produce more than 1 Mtpa of chromite. The expectations in 2018 are for South Africa to account for 60% of world output, including UG2 production. Kazakhstan (13%), India (9%), Turkey (4%), and Finland (3%) are the other major producers. These five countries in total accounted for 89% of chromite production. In South Africa, the contribution of the UG2 chromite is estimated to have accounted for over 10% of the annual supply. Exports of chrome ore from South Africa reached almost 12 Mt in 2017, of which 11 Mt were directly and indirectly supplied to China. Shipments from South Africa ramped

8
up in 2005–2008 as China’s stainless steel boom set in to an average 425 ktpm until 2012. Exports grew to 700 ktpm in 2013, but settled back to 590 ktpm in 2014, with less than 66% shipped to China in that year. Since 2015 monthly exports have increased sharply to an average of 970 ktpm by 2017.
Figure 7: Charge chrome and HC ferrochrome production comparison
The counterpart to the trade in chrome ore is China’s rapidly expanding stainless steel industry, which obtains the bulk of its chrome ore from South Africa (approximately 72% in 2017). Minor chromite deposits are available in China, but the country’s large stainless steel industry is dependent on imports. Other important sources of chromite to China include Turkey, Albania, and Pakistan. Preliminary 2017 data indicate that China’s chrome-ore imports expanded by 29% last year (see Figure 8).
Figure 8: Average monthly Chinese imports of chrome ore for 2016 and 2017
0
2.000
4.000
6.000
8.000
10.000
12.000
2000 2005 2010 2015 2020 2025 2030
Prod
uctio
n, in
´00
0 t
Charge CrG.R.: 7.3% p.a.
Charge CrG.R.: 2.2% p.a.
HC FeCrG.R.: 3.3% p.a.
HC FeCrG.R.: 5.4% p.a.
Actual Forecast
©

9
Ferrochrome production We estimate last year’s global ferrochrome production at approximately 11.7 Mt. Three countries produced more than 1 Mt of HC ferrochrome/charge chrome in 2017. China and South Africa together accounted for 68% of the total output, with Kazakhstan contributing a further 12% (see Figure 9). India fell just below the 1 Mt mark in 2017. Ferrochrome prices have moved largely up and down with ore prices, though the changes both up and down have been lower.
Figure 9: Ferrochrome production by region, 2017
In 2016, demand for ferrochrome increased to 11.1 Mt, followed by another expansion to 12.5 Mt in 2017. For the immediate future in 2018, destocking is expected while demand is expected to decline by some 191 kt. Cutbacks are expected from the EU and several other countries, but China is likely to increase its consumption again. Real ferrochrome demand is expected to increase by 3.6% to just over 12 Mt in 2018, while apparent consumption could rise by 4.4% to 12.3 Mt. Ferrochrome production of 12.5 Mt corresponds to a capacity utilization ratio of 74%, and leads to a minor supply surplus of 216 kt. However, if the supply is compared with ‘real’ demand, the surplus would be as high as 489 kt. Production costs For more than three decades our analysts have reviewed the global production costs on an ex-works basis. It appears that the most favourable conversion costs are identified for Kazakhstan, which for years has had the most competitive supply source. This is followed by South Africa’s Glencore-Merafe joint venture, while Finland’s Outokumpu Group ranks third. These three ferrochrome producers accounted last year for approximately half of global production. China’s ferrochrome smelters are often not competitive and relatively small by international standards. They rank typically 13th and 20th in this comparison. We currently estimate 2017 average ‘C3 cost’ (in US cents) at US cents 66.7/lb Cr content and we expect a marginal increase to US cents 66.8/lb Cr for 2018. A direct 2017 cost comparison between South Africa and China helps one draw the following conclusions: · South Africa has a cost advantage of US cents 17.7/lb Cr in chrome ore input
10
· There is a disadvantage of US cents 4.1/lb Cr for South Africa in reductants and other cost components
· Energy costs in South Africa are US cents 7.4/lb higher than those in China · Semi-fixed costs of US cents 5.94/lb compare with US cents 2.89/lb in China · Aggregated total direct cash cost amounted last year to US cents 54.1 1/lb in South
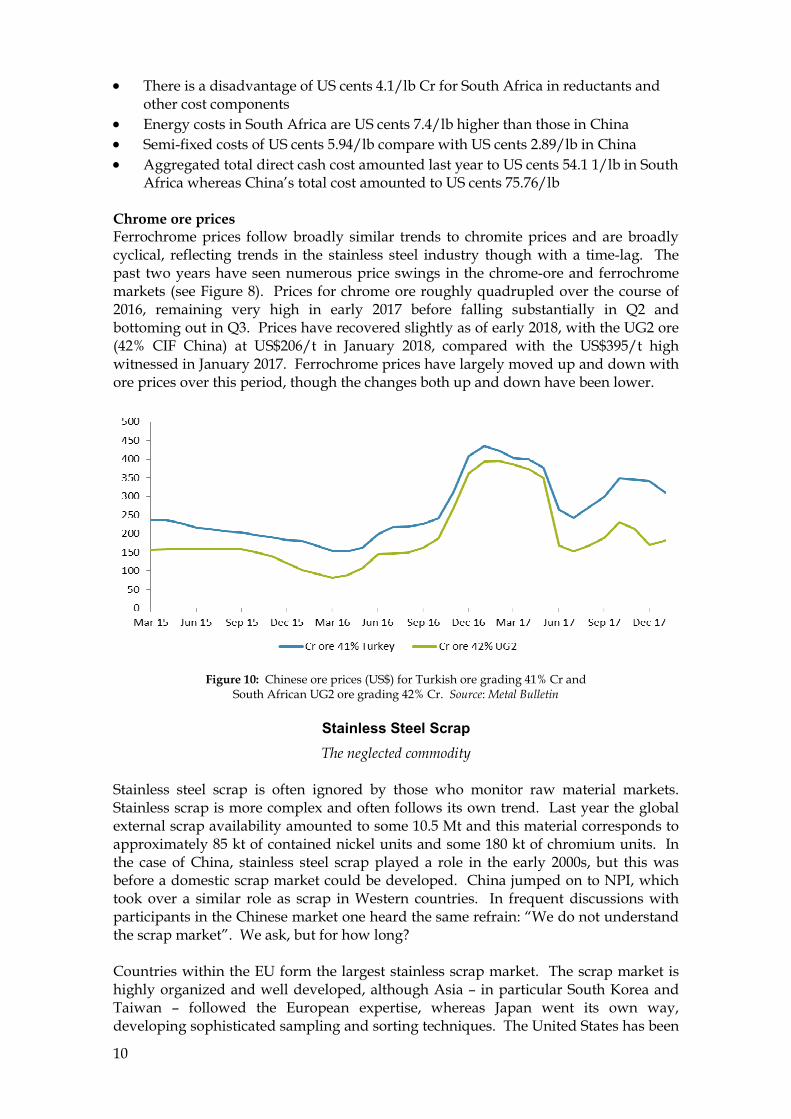
Africa whereas China’s total cost amounted to US cents 75.76/lb Chrome ore prices Ferrochrome prices follow broadly similar trends to chromite prices and are broadly cyclical, reflecting trends in the stainless steel industry though with a time-lag. The past two years have seen numerous price swings in the chrome-ore and ferrochrome markets (see Figure 8). Prices for chrome ore roughly quadrupled over the course of 2016, remaining very high in early 2017 before falling substantially in Q2 and bottoming out in Q3. Prices have recovered slightly as of early 2018, with the UG2 ore (42% CIF China) at US$206/t in January 2018, compared with the US$395/t high witnessed in January 2017. Ferrochrome prices have largely moved up and down with ore prices over this period, though the changes both up and down have been lower.
Figure 10: Chinese ore prices (US$) for Turkish ore grading 41% Cr and
South African UG2 ore grading 42% Cr. Source: Metal Bulletin
Stainless Steel Scrap The neglected commodity
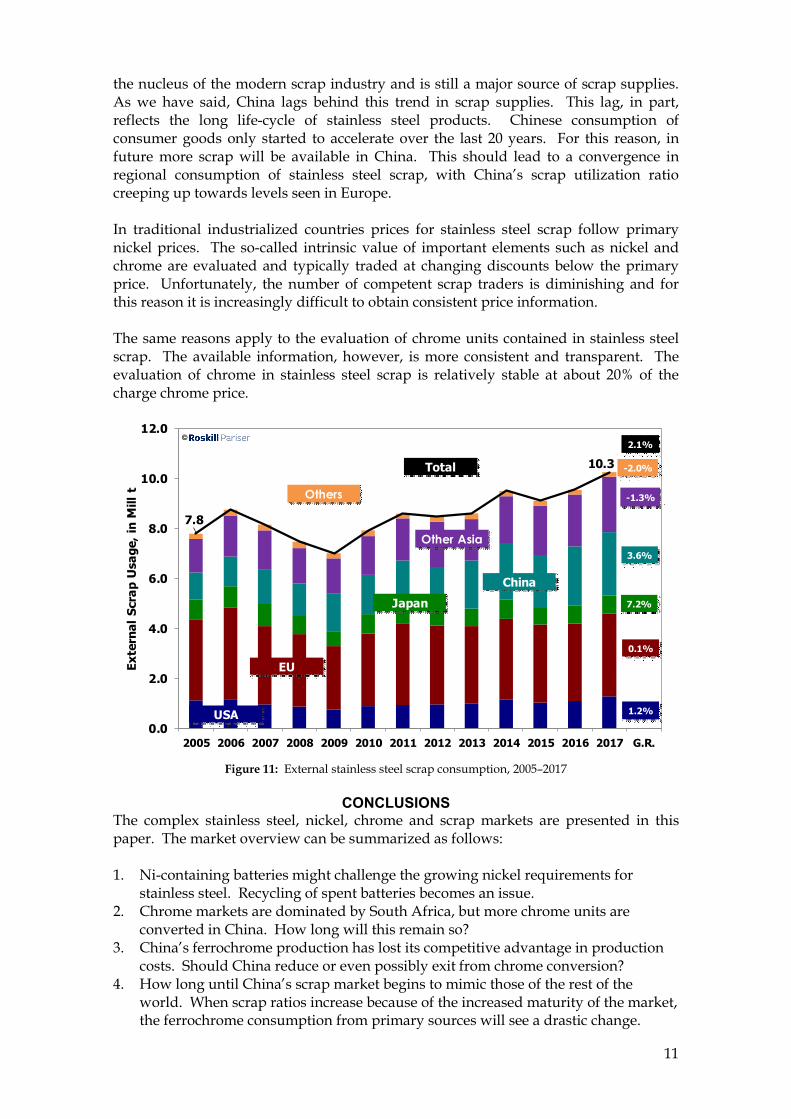
Stainless steel scrap is often ignored by those who monitor raw material markets. Stainless scrap is more complex and often follows its own trend. Last year the global external scrap availability amounted to some 10.5 Mt and this material corresponds to approximately 85 kt of contained nickel units and some 180 kt of chromium units. In the case of China, stainless steel scrap played a role in the early 2000s, but this was before a domestic scrap market could be developed. China jumped on to NPI, which took over a similar role as scrap in Western countries. In frequent discussions with participants in the Chinese market one heard the same refrain: “We do not understand the scrap market”. We ask, but for how long? Countries within the EU form the largest stainless scrap market. The scrap market is highly organized and well developed, although Asia – in particular South Korea and Taiwan – followed the European expertise, whereas Japan went its own way, developing sophisticated sampling and sorting techniques. The United States has been
11
the nucleus of the modern scrap industry and is still a major source of scrap supplies. As we have said, China lags behind this trend in scrap supplies. This lag, in part, reflects the long life-cycle of stainless steel products. Chinese consumption of consumer goods only started to accelerate over the last 20 years. For this reason, in future more scrap will be available in China. This should lead to a convergence in regional consumption of stainless steel scrap, with China’s scrap utilization ratio creeping up towards levels seen in Europe. In traditional industrialized countries prices for stainless steel scrap follow primary nickel prices. The so-called intrinsic value of important elements such as nickel and chrome are evaluated and typically traded at changing discounts below the primary price. Unfortunately, the number of competent scrap traders is diminishing and for this reason it is increasingly difficult to obtain consistent price information. The same reasons apply to the evaluation of chrome units contained in stainless steel scrap. The available information, however, is more consistent and transparent. The evaluation of chrome in stainless steel scrap is relatively stable at about 20% of the charge chrome price.
7.8
10.3
0.0
2.0
4.0
6.0
8.0
10.0
12.0
2005 2006 2007 2008 2009 2010 2011 2012 2013 2014 2015 2016 2017 G.R.
Exte
rnal
Scr
ap U
sage
, in
Mill
t
USA
EU
JapanChina
Others
1.2%
0.1%
7.2%
3.6%
-1.3%
-2.0%Total
2.1%
Other Asia
©
Figure 11: External stainless steel scrap consumption, 2005–2017
CONCLUSIONS
The complex stainless steel, nickel, chrome and scrap markets are presented in this paper. The market overview can be summarized as follows: 1. Ni-containing batteries might challenge the growing nickel requirements for
stainless steel. Recycling of spent batteries becomes an issue. 2. Chrome markets are dominated by South Africa, but more chrome units are
converted in China. How long will this remain so? 3. China’s ferrochrome production has lost its competitive advantage in production
costs. Should China reduce or even possibly exit from chrome conversion? 4. How long until China’s scrap market begins to mimic those of the rest of the
world. When scrap ratios increase because of the increased maturity of the market, the ferrochrome consumption from primary sources will see a drastic change.
12
REFERENCES Roskill Pariser Stainless Steel. 2018. Stainless Steel & Alloys Weekly.
https://roskill.com/market-report/stainless-steel-alloys-weekly/ Roskill. 2018. Nickel: Global Industry, Markets & Outlook. 14th Edition.
https://roskill.com/market-report/nickel/ Roskill. 2018. Nickel Sulphate: Global Industry, Markets & Outlook. 1st Edition.
https://roskill.com/market-report/nickel-sulphate/ Roskill. 2018. Chromium: Global Industry, Markets & Outlook. 14th Edition.
https://roskill.com/market-report/chromium/
Heinz H. Pariser Principal Consultant, Roskill Pariser Steel Alloys Heinz has over 55 years of experience in the metals industry. He is an internationally recognized authority in the stainless steel, nickel-based alloys, ferro-alloys, nickel and scrap industries. Trained in metals forwarding in LME warehouses in Rotterdam and Hamburg, he spent several years as a market researcher at INCO, before trading nickel at the LME on behalf of today’s ELG Haniel. In 1981 Heinz founded
Heinz H. Pariser Alloy Metals & Steel Market Research.