Embed Size (px)
Citation preview

MASTER’S THESIS
2006:156 CIV
EMMA BRANDTANDREAS TJÄRNING
Changing from aReactive to a ProactiveMaintenance Culture
Implementation of OEE
MASTER OF SCIENCE PROGRAMMEErgonomic Design & Production Engineering
Luleå University of TechnologyDepartment of Human Work Sciences
Division of Industrial Production Environment
2006:156 CIV • ISSN: 1402 - 1617 • ISRN: LTU - EX - - 06/156 - - SE

MASTER’S THESIS
Changing from a reactive to a proactive maintenance culture
- Implementation of OEE
Andreas Tjärning Emma Brandt
Luleå University of Technology
M.Sc. Programme in Engineering
Department of Human Work Science Division of Industrial Work Environment
ABSTRACT
ABSTRACT The maintenance department at Electrolux cooking plant, Dudley Park, Adelaide, Australia has over the past thirty years evolved into a reactive rather than proactive department with respect to equipment reliability. Therefore ABB was engaged in a benchmarking study where 13 different areas were found in need for improvement. Implementation of Overall Equipment Effectiveness was found as one important area to change and is the scope for this Masters Thesis. Overall Equipment Effectiveness, OEE, is a key performance index for machine utilisation and takes into consideration three different factors: Availability, Performance, and Quality. There is also focus on removing the Six Big Losses in order to improve the OEE-numbers. As a method and help in finding the losses and remove those permanently Root Cause Failure Analysis have been used and a causal tree over the biggest problem area has been created. The area chosen as a pilot area where to try out OEE was the Side Panel Machine, SPM, which produces side panels for upright cookers which is regarded as one of the biggest future bottleneck. The biggest problem area with the SPM was the second station, Notch and Pierce and panels not leaving to the roll former station. OEE was implemented with cross functional meetings and meeting attendants from all departments involved in the Side Panel Machine; tooling, production, maintenance, and engineering. As a result from the meetings the machine was rebuilt and improved during the Christmas break. The OEE team also put in big efforts to try and mount a camera to record breakdowns at the Side Panel Machine. The collection of production data was improved with a new OEE- sheet for the operator to fill in time losses and a new scrap audit sheet to fill in quality losses. The recommendations for Electrolux are to continue working with OEE. To do this they need to find a new driving force, educate OEE teams about OEE and RCFA and focus on the collection of accurate production data.

PREFACE
PREFACE This Master’s Thesis is the final part of our university degree in Ergonomic Design & Production Engineering with a major in Production Engineering. It has been carried out in association with Electrolux cooking plant, Adelaide, Australia and the Department of Human Work Science at Luleå University of Technology starting in September 2005 and ending in March 2006. During our stay the Electrolux facilities went trough a big change, with investments in new production lines and many new projects and it was very interesting to take part in this. This project had not been completed without help from several people. We want to thank Robert Speedie and Evangelos Lambrinos, University of South Australia, for giving us the opportunity to come to Adelaide and write our thesis; Electrolux and our OEE-team for support in our work; Bo Johansson, Luleå University of Technology, for support and feedback during the finalisation of the thesis. And a special thanks to John Thomas, who was our supervisor at Electrolux and also became a very good friend during our stay in Adelaide. Adelaide March 2006 ___________________ __________________ Emma Brandt Andreas Tjärning

TABLE OF CONTENTS
TABLE OF CONTENTS 1 INTRODUCTION _____________________________ 6
1.1 Electrolux Group ______________________________ 6 1.2 Cooking Plant, Dudley Park______________________ 7 1.3 Side panel machine_____________________________ 8
2 PROJECT___________________________________ 12 2.1 Background__________________________________ 12 2.2 Definition ___________________________________ 13
3 METHOD___________________________________ 15 3.1 Project organisation___________________________ 15 3.2 Planning ____________________________________ 15 3.3 Side Panel Machine ___________________________ 16 3.4 Literature studies _____________________________ 16 3.5 Discussions and brainstorming __________________ 17 3.6 Analysis_____________________________________ 17
4 THEORETICAL REFERENCES _______________ 18 4.1 Choice of theories_____________________________ 18 4.2 Total Productive Maintenance ___________________ 18 4.3 Overall Equipment Effectiveness _________________ 19 4.4 Root Cause Failure Analysis ____________________ 27 4.5 Implementation and resistance to change __________ 29 4.6 Brainstorming________________________________ 31 4.7 Summary of theories ___________________________ 32
TABLE OF CONTENTS
5 ACCOMPLISHMENTS _______________________ 33 5.1 Meetings ____________________________________ 33 5.2 Practical ____________________________________ 35 5.3 Data and Documentation _______________________ 39
6 ANALYSIS__________________________________ 41 6.1 The project _____________________________________ 41 6.2 Fulfilment of project aims _________________________ 42 6.3 Side Panel Machine ______________________________ 44
7 RECOMMENDATIONS ______________________ 45
REFERENCES __________________________________ 47
APPENDICES Appendix A: Old Side Panel Machine data sheet Appendix B: New Side Panel Machine data sheet Appendix C: Scrap audit sheet Appendix D: Causal tree Appendix E: Meeting minutes Appendix F: OEE top ten graph Appendix G: Weekley OEE average Appendix H: OEE graphs
INTRODUCTION
1 INTRODUCTION This chapter gives the reader an introduction to the history of the Electrolux Group and continues with the Cooking Plant at Dudley Park. The last section brings up the Side Panel Machine where the main part of the project was performed.
1.1 Electrolux Group
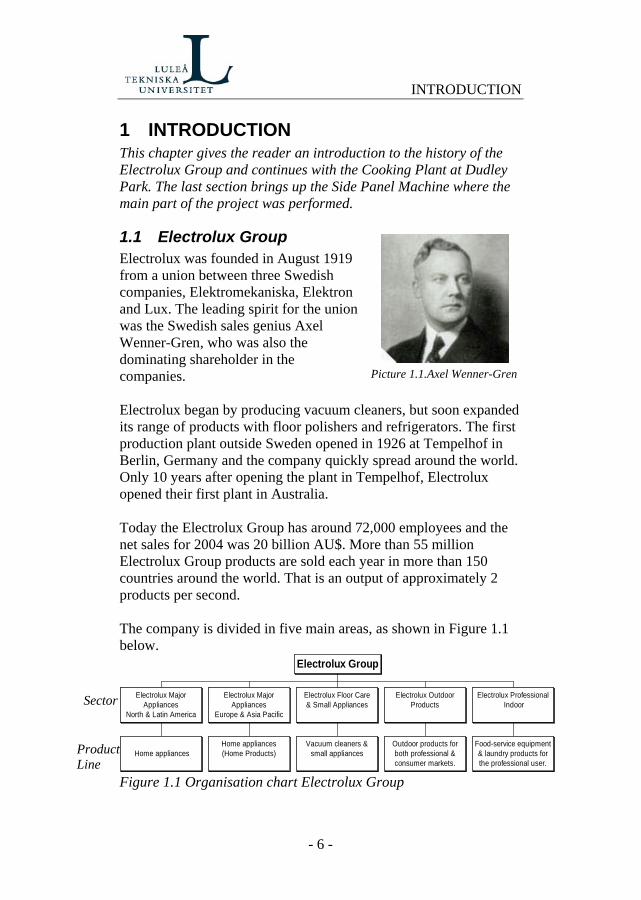
Picture 1.1.Axel Wenner-Gren
Electrolux was founded in August 1919 from a union between three Swedish companies, Elektromekaniska, Elektron and Lux. The leading spirit for the union was the Swedish sales genius Axel Wenner-Gren, who was also the dominating shareholder in the companies. Electrolux began by producing vacuum cleaners, but soon expanded its range of products with floor polishers and refrigerators. The first production plant outside Sweden opened in 1926 at Tempelhof in Berlin, Germany and the company quickly spread around the world. Only 10 years after opening the plant in Tempelhof, Electrolux opened their first plant in Australia. Today the Electrolux Group has around 72,000 employees and the net sales for 2004 was 20 billion AU$. More than 55 million Electrolux Group products are sold each year in more than 150 countries around the world. That is an output of approximately 2 products per second. The company is divided in five main areas, as shown in Figure 1.1 below.
Home appliances
Electrolux MajorAppliances
North & Latin America
Home appliances(Home Products)
Electrolux MajorAppliances
Europe & Asia Pacific
Vacuum cleaners &small appliances
Electrolux Floor Care& Small Appliances
Outdoor products forboth professional &consumer markets.
Electrolux OutdoorProducts
Food-service equipment& laundry products forthe professional user.
Electrolux Professional Indoor
Electrolux Group
Sector
Product Line
Figure 1.1 Organisation chart Electrolux Group
- 6 -
INTRODUCTION Professional Indoor Products comprise food-service equipment for restaurants and institutions as well as laundry equipment for such applications as apartment-house laundry rooms and professional laundries. Outdoor Products comprise garden equipment for the consumer market as well as garden and turf-care equipment, high-performance chainsaws, clearing saws and cutting equipment for the professional market. Electrolux has leading market positions in most of these product areas around the world. Floor Care and Small Appliances is the world’s largest producer of vacuum cleaners, with a world market share of around 20 percent The Floor Care & Small Appliances business sector sells not only vacuum cleaners, but also appliances such as coffee machines, irons, toasters, food processors and mixers. Floor Care is organised into four geographical areas: North America, South America, Europe and International (Africa, Asia and Australia). Major Appliances are the largest sector in the Electrolux group, comprising 65 percent of the net sales. This sector develops, manufactures and sells a large range of products including cooking appliances, cleaning, and refrigerator products. Similar to the floor care and small appliance group, major appliances is organised in four geographical areas: North America, Latin America, Europe and Asia Pacific.
1.2 Cooking Plant, Dudley Park The Electrolux facility in Dudley Park has around 650 employees and manufactures more than 500,000 cooking appliances each year. These appliances include cooktops, rangehoods, free-standing and built-in ovens. The processes that exist in the plant include assembly, press shop and enamel shop which utilise some high value and complex equipment. The site at Dudley Park was established in the late 1930's by A. Simpson & Son and has since been one of the major producing plants for different companies. In 2001, Electrolux acquired the company that was Email major appliances, and started to manufacture the existing brands under the Electrolux name. After the take over, Electrolux moved the production of their Chef
- 7 -

INTRODUCTION cookers to Dudley Park to get all manufacturing of cookers into one location in Australia. In recent times Electrolux has initiated large investments in Dudley Park, which include a new fully-automated oven maker, and a tandem press line, including five simultaneous 3-axis robots. The company has also moved production of cookers from a New Zealand plant in Christchurch to the Dudley Park Plant. All these changes together have laid a solid foundation for continued manufacturing on the site. The Dudley Park Plant has large amount of different machinery, which demands plenty of maintenance. This calls for the maintenance department to have a large staff available and make the operators work with TPM in order to minimize the downtime of the machinery. The maintenance department today works three shifts, day, afternoon, and night, with most employees during nightshift in order to perform preventive maintenance tasks.
1.3 Side panel machine The Side Panel Machine (SPM) is a machine that produces side panels for a range of different cookers in the Dudley Park Plant. It was installed in 1996 by the American company Lockformer from Illinois. The SPM produces four different variants of panels, which only differ in hole and notch placement. Essentially a side panel consists of a large piece of 0.8mm galvabond sheet metal, with a zinc-coating on one side and the dimensions are 926x666mm. The flat panel comes in a pallet of 310 from a Chinese vendor, Sungju CO Ltd.
Figure 1.2 Side panel flat and mounted on cooker
- 8 -
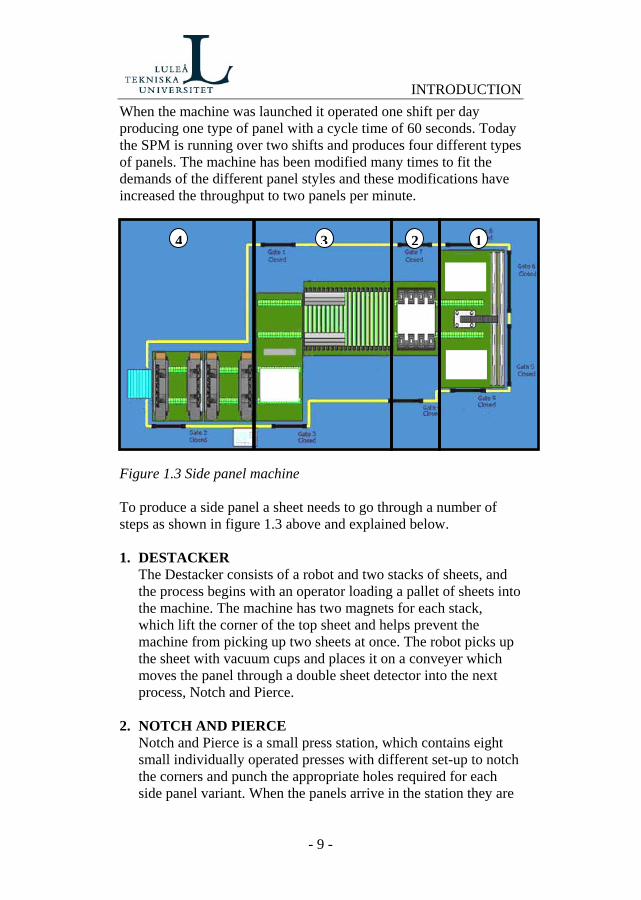
INTRODUCTION When the machine was launched it operated one shift per day producing one type of panel with a cycle time of 60 seconds. Today the SPM is running over two shifts and produces four different types of panels. The machine has been modified many times to fit the demands of the different panel styles and these modifications have increased the throughput to two panels per minute.
234 1
Figure 1.3 Side panel machine To produce a side panel a sheet needs to go through a number of steps as shown in figure 1.3 above and explained below. 1. DESTACKER
The Destacker consists of a robot and two stacks of sheets, and the process begins with an operator loading a pallet of sheets into the machine. The machine has two magnets for each stack, which lift the corner of the top sheet and helps prevent the machine from picking up two sheets at once. The robot picks up the sheet with vacuum cups and places it on a conveyer which moves the panel through a double sheet detector into the next process, Notch and Pierce.
2. NOTCH AND PIERCE
Notch and Pierce is a small press station, which contains eight small individually operated presses with different set-up to notch the corners and punch the appropriate holes required for each side panel variant. When the panels arrive in the station they are
- 9 -

INTRODUCTION stopped and aligned using a hydraulic system before the piercing begins. This is an essential operation to ensure the panels are to the drawing specification tolerance of ±0.5mm. The panel is then released to the Rollformer.
3. ROLLFORMER
The Rollformer process is the biggest and most complex phase of the machine. It consists of 23 sets of rollers that make the folding profile along the long side. After this fold the panels are transported into a turning device, which turns the panel upside-down for the final steps of the machine.
4. END FOLD AND TOGGLE LOCK
The last two steps are the End Fold and Toggle Lock. The End Fold is exactly what its name suggests, the part of the SPM that folds the ends of the panels. In the last step the panels are given a toggle lock in every corner to keep the folding in place. See figure 1.4 for a more detailed explanation. The panel automatically exits the machine into a buffer conveyor, and is then ready to be used on the assembly line.
Figure 1.4 Toggle lock
The machine is guarded by a security fence, with nine interlocked gates for maintenance access, as shown in figure 1.3. The machine stops operation if any of these gates are opened and remains off until the safety system is reset and the gates are closed. The SPM current has three emergency stops on the outside of the fence, and as there is no direct interaction between the machine and operator, no presence-sensing systems are required. Since April 2005 Electrolux has collected OEE data on the Side Panel Machine through OEE sheets, see appendix A, filled in by the
- 10 -

INTRODUCTION team leader of each shift. The Data consisted of relatively unstructured information about the faults and the downtime of the certain faults. Out of these data an OEE value was calculated and shown in graphs, see appendix F, G, and H.
- 11 -

PROJECT
2 PROJECT In the following paragraph the authors describe the conditions of the project. The chapter starts with the background, followed by the project definition and the last part gives the purpose of the thesis.
2.1 Background A culture has evolved over the past thirty years where the maintenance team has become reactive rather than proactive or preventive with respect to equipment reliability. Although some maintenance activities can be described as preventive, it is still only a small proportion of the overall daily work activity. Capital project work has become part and parcel of everyday maintenance life at Dudley Park. This means that the proportion of work activity, which falls in the category of planned preventive maintenance, is less than 40 percent. World class manufacturing facilities have a planned preventive maintenance activity level which is greater than 80 percent of their total work activity. The remaining 20 percent are made up of unplanned activity such as break downs and equipment improvement work. Within these world class facilities there is a high proportion of condition based monitoring rather than fixed time maintenance therefore there is a high degree of prediction for equipment failure rather than inspections or component replacement at fixed intervals.
60%
40%
Unplanned WorkPlanned Work
20%
80%
Unplanned WorkPlanned Work
Reactive Proactive
Figure 2.1 Reactive and proactive workload
- 12 -

PROJECT ABB have been engaged as consultants in order to assess the Dudley Park maintenance functions against the needs of the facility. This assessment involved a benchmarking exercise to determine the level of performance in a number of areas. ABB provided a detailed report, which included a number of recommendations. The senior management at Dudley Park decided to create the position of maintenance manager whose task was to coordinate an improvement project in the maintenance department. This project involves the implementation of the ABB recommendations in a serious attempt to change the Dudley Park maintenance culture from reactive to proactive. This in turn will improve the effectiveness of the maintenance team by improving equipment reliability and enable the manufacturing facility to operate with minimum disruption caused by equipment failure.
2.2 Definition The scope for our involvement in this improvement project is to find the best way of how to implement OEE and provide recommendations to maintain and improve the work. To facilitate the work and the follow up of the thesis, the scope has been divided into intermediate aims. The aims are written in order of time and the main purpose is to help Electrolux Dudley Park make a change in the maintenance culture by implementing OEE.
1. Analyse data One of the most important elements in OEE is the collection and calculation of data. Therefore the first aim is to investigate the present data collection and the calculations made to get the OEE numbers.
2. Start up meetings Our choice of working with OEE is by using Cross Functional Teams, and starting up weekly meetings. This is also the main objective of the thesis.
3. Continue meetings The last and most important in long term for Electrolux is to continue the OEE work and see the results. Therefore the final aim for the thesis is to make sure that the meetings will continue to run after the authors have finished their project
- 13 -

PROJECT The thesis will be based on a case study, and observations made in the plant. The theories used in the project are Total Productive Maintenance, Overall Equipment Effectiveness, Root Cause Failure Analysis, Failure Mode and Effect Analysis and implementation theories. Knowledge about the theories will be gained through literature studies.
- 14 -

METHOD
3 METHOD This chapter shows how the project was organised, planned and performed. In the end the work with data collection and brainstorming is shown. During the project data has been collected in different ways, both from literature, observations and discussions. There was already existing production data about the side panel machine that has been used.
3.1 Project organisation The OEE-project has for the most part been carried out by the authors. The maintenance manager, who initiated the whole project, was the supervisor in order to be a moral support and also keep the project going in the planned direction. With expertise in the subject of OEE, both the supervisor and two consultants from ABB were of big help in questions and queries concerning the project. The supervisor from Luleå University of Technology was involved in the initial stages of the project, and his role was to evaluate the technical content and scope, and approve its suitability for a thesis. He also had input to help out with the structure of the thesis and the work. The contact with him was mostly made via e-mail.
3.2 Planning From the beginning the project included far more than what was possible to achieve within the 20 weeks the project was given. Therefore the project scope was changed first one time but was still too wide to make it possible to include everything. The second time the project was changed it was possible to accomplish everything included. This modification of the project scope resulted in a loss of two weeks worth of work. For the planning of the project the authors used Gantt chart in Microsoft project. There were also regular project timing meetings with the supervisor to make sure that everything went on as planned and any problem was dealt with immediately. A plan for the large maintenance project were established before the authors came to Electrolux, Dudley Park, and this affected the planning of the thesis and provided a rough time plan to follow.
- 15 -

METHOD Figure 3.1 shows how the time was spent during the project. Note that it is only a simplified picture of the time plan; during the project the different phases overlapped each other much more. During the first nine weeks the OEE-work was planned, and it was carried out during the following six weeks before the documentation and writing of thesis. A diary was written during the entire project to make sure everything was documented and nothing forgotten. Week Task 1 Introduction 2 Planning 3 - 4 Mapping out SPM & maintenance, literature studies 5 - 6 Literature studies 7 - 8 Meeting preparation & literature studies 9 - 15 Meetings, OEE-work and thesis 16 -20 Thesis Figure 3.1 Time table of Planning
3.3 Side Panel Machine To gain better knowledge of the process of making side panels the SPM has been observed and the authors also analysed the already existing data sheets, which had been collected since April 2005. The dayshift team leader Mick Ferguson was a great help by answering and discussing any questions regarding the operations and processes of the machine. Since the main objective with the thesis was to implement OEE the authors didn’t map out the SPM completely due to the expertise already existing in operators and engineers at Electrolux. Although a good overview was needed to find and introduce improvements on the machine.
3.4 Literature studies The literature studies performed during this thesis include TPM, OEE, RCFA, implementation and cross-functional teams. The information was found in articles and books via databases at University of South Australia Mawson Lakes Library, Luleå University of Technology Library, and internet. Past theses from other students were also researched, which have been an inspiration for this report and used to extend the literature studies. More
- 16 -
METHOD information about the literature can be found in the reference section.
3.5 Discussions and brainstorming Throughout the project discussions and brainstorming about the implementation, the side panel machine and other processes has been held with the supervisor John Thomas in order to get a good understanding, information, and new ideas. The authors have also worked close connected to the ABB consultants Grant Maria and Lindsay Tonkins, who have put their expertise into the project through discussions.
3.6 Analysis The collected data has been analysed with the help of the theories. OEE was used to improve the data collection, and arrange and start up the meetings. RCFA was put into practise when working with eliminating the six big losses in an organised way and improve the largest problem area of the machine. It was also an important tool when creating the causal tree. In the end of the project all gained facts were used to perform an analysis of the current situation at Electrolux. The analysis is based on the used theories and also on the knowledge of the authors. From the analysis a number of recommendations for Electrolux were developed.
- 17 -

THEORETICAL REFERENCES
4 THEORETICAL REFERENCES This chapter presents the theoretical references that were used during the project. Firstly the authors describe the choices of theories and then progress with the explaining the used theories. To end the chapter a brief summary is made.
4.1 Choice of theories In order to complete the project it was necessary to study a range of theories and since OEE is the main scope of the thesis this was the first theory to be study. To obtain the entire background of OEE the authors investigated TPM which is the foundation of OEE. RCFA was also studied to find a tool in solving issues brought up in the meetings. In these meeting the authors wanted a broad diversity of expertise and to facilitate this, theories about cross-functional teams were chosen to be studied. When the meetings were started discoveries about resistance to change in the workplace initiated a literature study to find out how to handle those issues. In the planning phase the authors used brainstorming as a tool which also was studied to get better understanding.
4.2 Total Productive Maintenance Not long ago, most operations in a manufacturing plant were performed manually with human labour. The industrial development during the 20th century has brought modern technology with automation and robots and nowadays only a handful of people are needed to do what used to take hundreds of people Total Productive Management (TPM) is a management concept that combines the American way of preventive maintenance with the Japanese idea of quality and total involvement of the employees. The origin of TPM is Preventive Maintenance (PM). PM originated in the United States in the 1950’s. In the 1970’s the Japanese Engineer Seiichi Nakajima developed and enhanced PM to fit the Japanese industrial environment. Simplistic Total Productive Maintenance is based on the idea of lowering maintenance costs by preventing breakdowns and to get zero defects from the production. It is a company wide concept, hence for successful implementation all departments must be aware and involved, including production, engineering, and maintenance.
- 18 -
THEORETICAL REFERENCES Management must support and facilitate these changes, and guide the employees into the TPM mentality in order for this concept to be successful. One important aspect of TPM is that the operator should have pride in taking care of the machine, with the ultimate goal of having zero break downs. A current problem in production today is the operator mentality that a breakdown results in a break. This can make the operator strive for breakdowns, or at least not doing his or hers best to prevent one. There is also the fear of working too hard, under the impression that the managers will think that the work can be done by less people, or that management will push to produce more output with the same labour content.
4.3 Overall Equipment Effectiveness When machine effectiveness is calculated, the value often only takes into consideration the time the machine has been producing, not the quantity output or the quality. With OEE these three different aspects are included to indicate the overall picture of the machines effectiveness. Overall Equipment Effectiveness is a part of TPM and consists of three different areas: Availability, Performance, and Quality. Each area represents one aspect of machine effectiveness and, when multiplied, shows the overall effectiveness of the machine, hence the name OEE. Figure 4.1 shows schematic how OEE is built up. The three factors included in OEE are explained in more details in paragraph 4.3.1 – 4.3.3 and the “six big losses” are explained in 4.3.5.
- 19 -
THEORETICAL REFERENCES
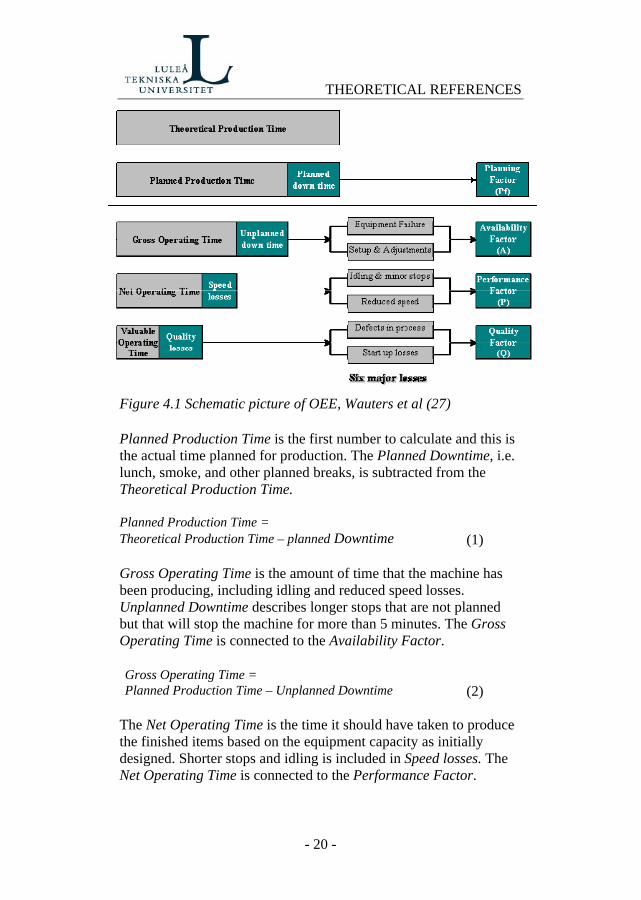
Figure 4.1 Schematic picture of OEE, Wauters et al (27) Planned Production Time is the first number to calculate and this is the actual time planned for production. The Planned Downtime, i.e. lunch, smoke, and other planned breaks, is subtracted from the Theoretical Production Time.
- 20 -
(1)
Planned Production Time = Theoretical Production Time – planned Downtime
Gross Operating Time is the amount of time that the machine has been producing, including idling and reduced speed losses. Unplanned Downtime describes longer stops that are not planned but that will stop the machine for more than 5 minutes. The Gross Operating Time is connected to the Availability Factor. Gross Operating Time = Planned Production Time – Unplanned Downtime (2)
The Net Operating Time is the time it should have taken to produce the finished items based on the equipment capacity as initially designed. Shorter stops and idling is included in Speed losses. The Net Operating Time is connected to the Performance Factor.
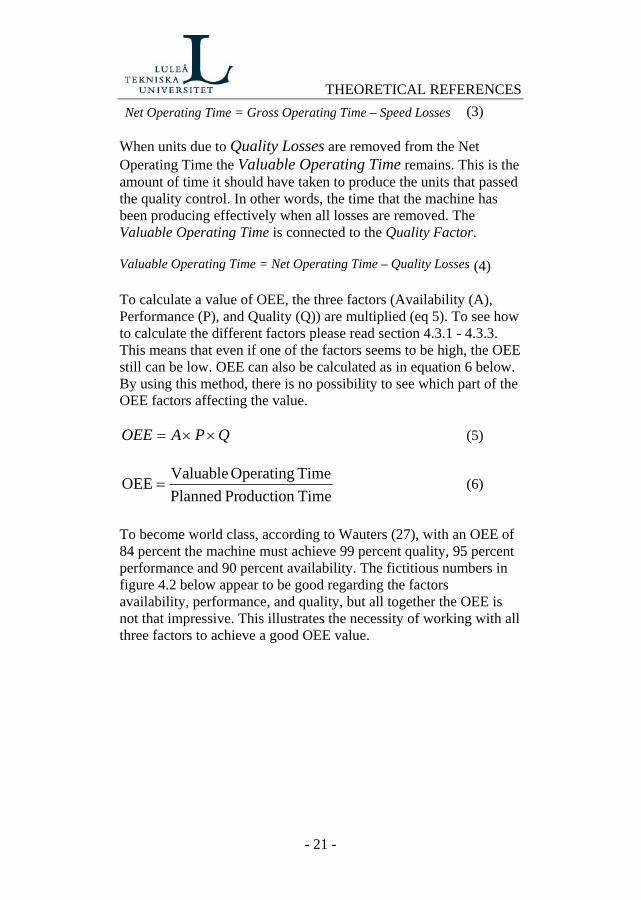
THEORETICAL REFERENCES (3) When units due to Quality Losses are removed from the Net Operating Time the Valuable Operating Time remains. This is the amount of time it should have taken to produce the units that passed the quality control. In other words, the time that the machine has been producing effectively when all losses are removed. The Valuable Operating Time is connected to the Quality Factor. (4)
Net Operating Time = Gross Operating Time – Speed Losses
Valuable Operating Time = Net Operating Time – Quality Losses To calculate a value of OEE, the three factors (Availability (A), Performance (P), and Quality (Q)) are multiplied (eq 5). To see how to calculate the different factors please read section 4.3.1 - 4.3.3. This means that even if one of the factors seems to be high, the OEE still can be low. OEE can also be calculated as in equation 6 below. By using this method, there is no possibility to see which part of the OEE factors affecting the value.
QPAOEE ××= (5)
Timeoduction Pr PlannedTime Operating ValuableOEE = (6)
To become world class, according to Wauters (27), with an OEE of 84 percent the machine must achieve 99 percent quality, 95 percent performance and 90 percent availability. The fictitious numbers in figure 4.2 below appear to be good regarding the factors availability, performance, and quality, but all together the OEE is not that impressive. This illustrates the necessity of working with all three factors to achieve a good OEE value.
- 21 -

THEORETICAL REFERENCES
Figure 4.2 OEE Pyramid, Loughlin, (14) OEE can be used in three different ways. Firstly, as a benchmark to compare initial values with future values to see improvements made. Secondly, it can be used to compare internal line performance across the factory. Finally, it can be used to show which machine has the poorest performance to identify where TPM resources are best needed. In all three cases, it is essential that OEE is calculated in the same way with accurate data otherwise the information from it is useless. It is also important to remember that not only equipment losses impacts on OEE, but also factors such as operators, facilities, material, scheduling requirements etc.
4.3.1 Availability Availability of a machine is the amount of time it is available for production, accordingly it is a measure of how big the downtime losses are. This part of OEE is the easiest to measure.
Timeoduction Pr PlannedTime Operating GrossA = (7)
4.3.2 Performance When a machine is not producing it doesn’t necessarily need to have a breakdown, it could be idling due to lack of material or labour.
Availability
70%
OEE 53%
Performance 80%
Quality 95%
- 22 -

THEORETICAL REFERENCES The performance rate measures in other words how effective the machine transforms input to output, the real production time compared to the theoretical.
Time Operating GrossTime OperatingNet P = (8)
4.3.3 Quality The quality factor takes into consideration the rate of rejected items due to quality defects. For example, if a machine produces ten items and only nine are approved the rate of product quality is 0.9 or 90 percent. Both equation (9) and (10) can be used to calculate the Quality factor.
Time OperatingNet Time Operating ValuableQ = (9)
ItemsProducedofNumber Quality todue Items Rejected ofNumber 1Q −= (10)
4.3.4 Example This is a basic example of how to calculate OEE on a machine in the way as described earlier in this chapter.
A machine that is producing parts for an assembly line is working day and afternoon shift. Both shifts are eight hours, 480 min, and both have two breaks, during the production time, of totally 45 min. The machine has a planned rate of two mins per part, which gives 0.5 parts per minute. Today the machine had a breakdown for two hours, 120 min, due to a broken tool and throughout the rest of the day it produced 330 parts, which is 45 less than planned. Of the 330 produced parts 15 didn’t make it through the quality control, due to dents on the sheets. To find the value of OEE need to calculate the three factors (A, P, and Q) and start with Availability:
- 23 -

THEORETICAL REFERENCES 870)45*2()480*2(Time Production Planned =−=
(eq. 1) 750120870Time Operating Gross =−= (eq. 2)
As equation (7): %2.86100870750
=×=A
Next step is to find the Performance factor:
660)245(750Time OperatingNet =×−= (eq. 3)
As equation (8): %88100750660
=×=P
Last factor to find is Quality:
630)215(660Time Operating Valuable =×−= (eq. 4)
As equation (9): %5.95100660630
=×=Q
To calculate OEE now only have to multiply the three factors together as equation (5):
%4.72%5.95%88%2.86 =××=OEE OEE can also be calculated as number of good produced parts over number of planned produced parts as equation (6), but detailed information about where the losses are will be lost.
%4.72100435315
=×=OEE
4.3.5 Six big losses When eliminating the six big losses it is important to start with the issue that causes the biggest loss. If focus is on the small issues there won’t be any immediate improvements and the biggest losses will continue to decrease the production rate. If the biggest issues are eliminated, instant increases in production appear and it is likely that some minor issues will disappear along with the bigger issues. The first two losses are considered as downtime losses and therefore connected to availability. These losses are
- 24 -
THEORETICAL REFERENCES 1. Equipment failure – these losses are due to chronic and
sporadic disturbances 2. Set up & adjustment – this refers to time losses from the
end of previous item until set up and changes for nest item is finished and the machines is producing in a satisfactory way.
Losses number three and four is speed losses. This has to do with the machines performance rate.
3. Idling & minor stops – these stops occur when the production is temporarily interrupted or when the machine is idling. These stoppages are shorter than downtime losses and lasts less than five minutes.
4. Reduced speed – when the equipment speed is slower than planned cycle time it is classified as reduced speed losses
Quality losses are the name for losses number five and six. Every product that is out of the quality range goes under this category.
5. Defects in process – the losses counted in here is volume losses due to defects and rework and the time it takes to turn defected products into good ones.
6. Start up losses – every loss due to start up after periodic repair, long time stoppage, holidays, and lunch break is also counted into quality losses.
4.3.6 Chronic and sporadic disturbances Disturbances in a factory can be divided roughly into two categories, chronic and sporadic. The chronic disturbances is the kind of disturbances that are small and hidden and does not stop the machine from producing, it only slows the production rate down. Chronic disturbances are hard to find and often accepted as part of the normal state. The only way of finding chronic disturbances is to compare the performance of the machine with what is theoretical possible. The sporadic disturbances are more obvious since they occur quickly and with large deviations from the normal state. Both chronic and sporadic disturbances result in some kind of waste, and one objective of OEE is to identify these losses.
- 25 -

THEORETICAL REFERENCES Figure 4.3 Disturbances, Bamber et al,(4)
Time
Production disturbance level
Chronic disturbances
Sporadic disturbance
4.3.7 Cross-functional teams When working with OEE a cross-functional team, CFT, is essential. As written above, the six big losses cover a wide range of areas and issues. For that reason it is important to include all departments concerned in the work in order to address the issues effectively, see figure 4.4. A cross-functional team consists of a big variety of people that are experts in different areas that crosses the organisational lines of the organisation. These experts provide the combined skills and knowledge of the entire production system, which gives them the opportunity to identify and address the right activities to eliminate the issues. They should also have the right authority to make impact in decisions about these activities. To obtain a successful CFT a driving force to develop the team and increase the effectiveness is required, not only to inspire the team but also to clarify the roles of the team members and evaluate the function of the team. It’s also important to provide the team members with access to training in team working skills such as communicating, listening and facilitating.
- 26 -

THEORETICAL REFERENCES
OEE Team Engineering•Solutions•Issues•Changes
Data•Data collection•Charts
Production•Solutions•Issues•Changes
Maintenance•Solutions•Issues•Preventive maintenance
Figure 4.4 Cross-functional Team
4.4 Root Cause Failure Analysis Often when a problem with a machine occurs, quick actions needs to be taken to get the machine up and running again as fast as possible. The fix on the machine is only temporary and the machine is likely to break down soon again. Next time it is the same thing, the machine needs to be up and running as soon as possible. Very seldom the temporary fix on the machine will prevent the breakdown to happen again because it is not the actual root cause of the problem that is fixed. Therefore it happens again and again and again. Management is often more concerned about the machine running or not, not how it is running. The purpose of Root Cause Failure Analysis (RCFA) is to find the true root cause of a problem. The cause that seems to be the most obvious is not always the one that is really causing the problem. If it is an equipment failure that keeps re-occurring every sixth week and is replaced when it is broken down the problem is still there. Possible root causes could be an operator that is doing something wrong or preventive maintenance is missing. It could also be a wrong tooling design or changes in the organisation. Figure 4.5 shows the difference between root causes and why it is so important to find the true cause to prevent an issue to happen again. A physical root is the physical reason why the component failed, the
- 27 -
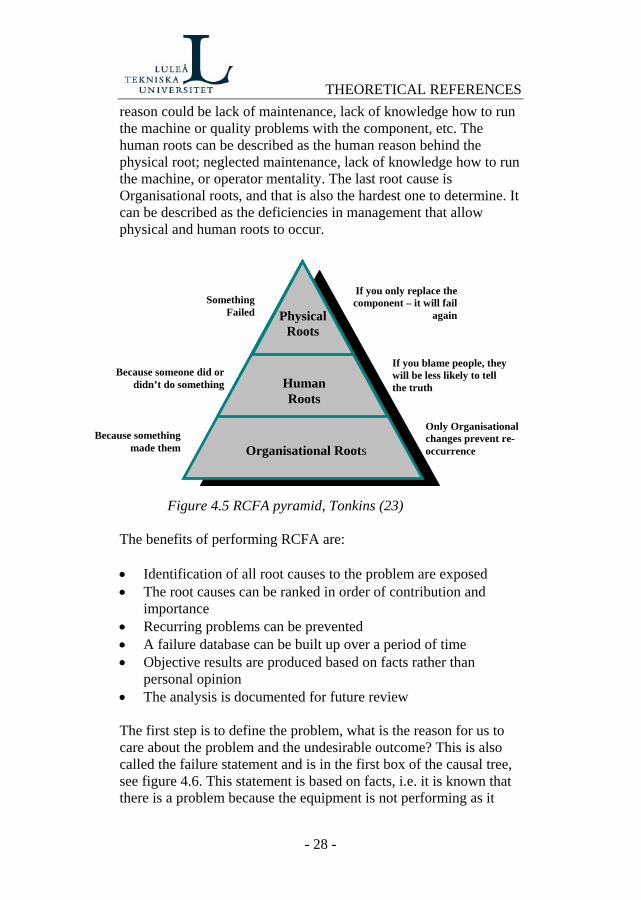
THEORETICAL REFERENCES reason could be lack of maintenance, lack of knowledge how to run the machine or quality problems with the component, etc. The human roots can be described as the human reason behind the physical root; neglected maintenance, lack of knowledge how to run the machine, or operator mentality. The last root cause is Organisational roots, and that is also the hardest one to determine. It can be described as the deficiencies in management that allow physical and human roots to occur.
Physical Roots
Human Roots
Organisational Roots Because something
made them
Because someone did or didn’t do something
Something Failed
If you only replace the component – it will fail
again
If you blame people, they will be less likely to tell the truth
Only Organisational changes prevent re-occurrence
Figure 4.5 RCFA pyramid, Tonkins (23) The benefits of performing RCFA are: • Identification of all root causes to the problem are exposed • The root causes can be ranked in order of contribution and
importance • Recurring problems can be prevented • A failure database can be built up over a period of time • Objective results are produced based on facts rather than
personal opinion • The analysis is documented for future review The first step is to define the problem, what is the reason for us to care about the problem and the undesirable outcome? This is also called the failure statement and is in the first box of the causal tree, see figure 4.6. This statement is based on facts, i.e. it is known that there is a problem because the equipment is not performing as it
- 28 -
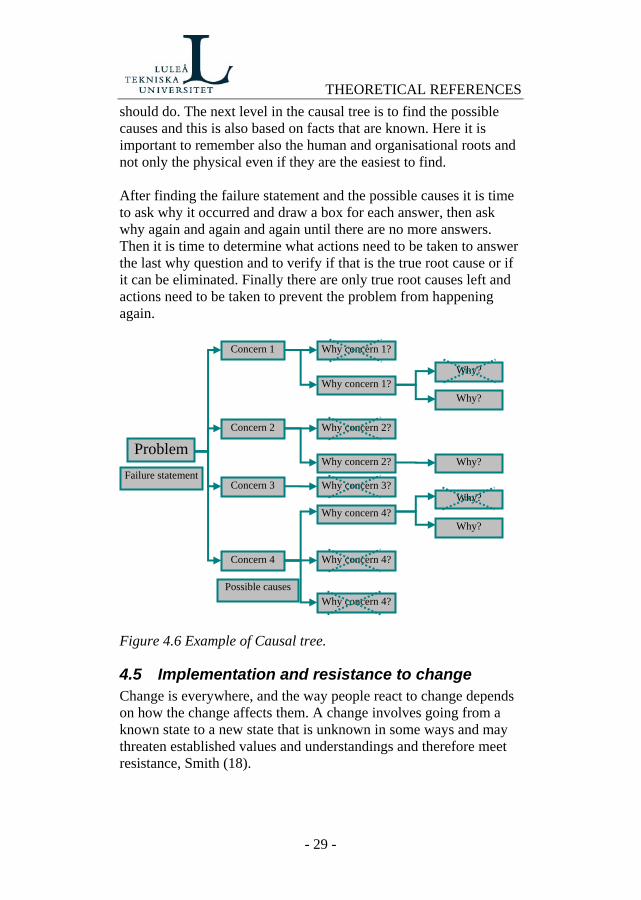
THEORETICAL REFERENCES should do. The next level in the causal tree is to find the possible causes and this is also based on facts that are known. Here it is important to remember also the human and organisational roots and not only the physical even if they are the easiest to find. After finding the failure statement and the possible causes it is time to ask why it occurred and draw a box for each answer, then ask why again and again and again until there are no more answers. Then it is time to determine what actions need to be taken to answer the last why question and to verify if that is the true root cause or if it can be eliminated. Finally there are only true root causes left and actions need to be taken to prevent the problem from happening again.
Concern 1 Why concern 1?
Why? Why concern 1?
Figure 4.6 Example of Causal tree.
4.5 Implementation and resistance to change Change is everywhere, and the way people react to change depends on how the change affects them. A change involves going from a known state to a new state that is unknown in some ways and may threaten established values and understandings and therefore meet resistance, Smith (18).
Problem
Concern 3
Concern 2
Concern 4
Why concern 2?
Why concern 2?
Why concern 4?
Why concern 4?
Why concern 4?
Why?
Why?
Why?
Why?
Why concern 3? Failure statement
Possible causes
- 29 -

THEORETICAL REFERENCES There is also often an inbuilt assumption that resistance is a negative force and has to be overcome and eliminated as quickly as possible. According to Smith, this negative force often shows bad planning or poorly implemented change. It should instead be viewed as a pointer to a better way of implement and help to make the change more desirable. Implementation of a project can be approached in many different ways and with many different styles depending of the scenario. There are four different ways to approach an implementation of a change: incentive, argumentation, accommodation, and bargaining, Nutt, (15). The incentive approach uses motivation and tangible rewards. This will encourage and coax the desired behaviour from the stakeholders. Argumentations are about arguing for the benefits of the proposed change and convince the stakeholders that the change is for the best. An accommodation situation uncovers interests and points of view that may provoke support or opposition. Bargaining calls on managers to use bargaining skills and incompatibility is managed by “horse trading”. Changes can be divided into evolutionary and strategic, de Val & Fuentes (11). The evolutionary changes are first order changes that are improving the present situation but still keep the general working framework. The second order changes or strategic changes are radical and the framework is totally transformed. Both types of changes meet resistance. De Val and Fuentes have divided the resistance in five groups, where the first three groups deals with resistance in the formulation stage of an implementation and the last two groups deals with the implementation. See figure 4.7
- 30 -

THEORETICAL REFERENCES
- 31 -
Distorted perception, interpretation barriers and vague strategic
priorities
• Myopia • Denial • Perpetuation of ideas • Implicit assumptions • Communication barriers • Organisational silence
Low motivation
• Direct costs of change • Cannibalisation costs • Cross subsidy comforts • Past failures • Different interests among employees
and management
Formulation Stage
Lack of creative response
• Fast and complex environmental changes
• Resignation • Inadequate strategic vision
Political and cultural deadlocks
• Implementation climate and relation between change values and organisational values
• Department politics • Incommensrable beliefs • Deep rooted values • Forgetfullness of the social
dimension of changes
Implementation Stage
Other sources
• Leadership inaction • Embedded routines • Collective action problems • Capabilities gap • Cynicism
Figure 4.7 Sources of resistance
4.6 Brainstorming Brainstorming is a process for generating new ideas. A group of people meet and try to generate as many new ideas as possible around a specific area of interest. The only rule is that no negative criticism is allowed and no ideas are irrelevant. After the brainstorming session is over the ideas are evaluated. “Using rules which remove inhibitions, people are able to think more freely and move into new areas of thought and so create numerous new ideas and solutions.” – www.brainstorming.co.uk (19)

THEORETICAL REFERENCES
4.7 Summary of theories The most beneficial theories in this project are OEE and RCFA, since these were the foundation of our project. To gain good knowledge about OEE the TPM theory gave the authors guidance and background history, which was important in order to understand OEE. Other theories have been used less often during the work, but were still necessary to realize the project aims.
- 32 -

ACCOMPLISHMENTS
5 ACCOMPLISHMENTS In this paragraph the accomplishments achieved throughout the project will be presented. It will be explained what was achieved both in the meetings and in practical work. The last part of the chapter describes the documentation performed during the project.
5.1 Meetings The emphasis in this project has been to start up regular meetings in order to improve OEE. It was important to keep everything as simple as possible to minimise the workload for the meeting attendants, and also to maintain everybody’s interest and motivation to continue working with OEE and not do it because they had to. The plan was to hold OEE meetings once a week to see what progress was done and what improvements that gave result. If necessary there would also be held a RCFA meeting to map out the SPM and the problems, in order to find the true root cause of the major issues instead of spending money on the wrong cause without getting rid of the problem. The author’s role in these meetings was to prepare and present the data required for the meetings, put together the structure and give advice of the decisions.
5.1.1 OEE To begin with literature about OEE was studied, to gather knowledge about the subject and how to work with it. The literature was found via article databases at Luleå University library and at UniSA Mawson Lakes Library. Some literature was also received from ABB consultant Lindsay Tonkin. Next, a meeting structure was formulated and together with supervisor and maintenance manager John Thomas it was decided that creating cross functional teams was the best way of implementing OEE. Therefore the meeting team consisted of representatives from maintenance, engineering, production, and tooling. Invitations were sent out to the persons of interest by John Thomas one week before the meeting. In the start up phase, the authors and consultants from ABB also were a part of the team as well as the maintenance manager. After a while the authors and the consultants were asked to only support the meeting but not
- 33 -

ACCOMPLISHMENTS participate. The idea was that the meetings should continue with no external help. The meeting structure was made by the authors alone and started with a review of the previous meetings. After that the OEE numbers were investigated in order to see any changes and progress in the work. The top ten downtime list (a list over the top ten things that has caused the most downtime in three different time episodes; last week, last month and since the project started) was the next item on the agenda. The purpose with that was to see if the changes made to the side panel machine affected the downtime or if the focus was in the wrong issues. Finally the action plan was reviewed; any matters that were settled were removed from the action plan and if there were any new actions they were added along with whom responsible for the action and a due date. See appendix E. On the first meeting the attendants were introduced to each other and were told about the purpose of the meetings. After that, downtime data for SPM was presented to kick off the OEE work and to decide where to start. The team decided, with help from the downtime data and the production representative, that the biggest area of problem was the Notch and Pierce station and that the panels wouldn’t leave from there. Therefore the first action to be taken was a RCFA meeting to find the root cause of why panels won’t leave the Notch and Pierce station, and to create a causal tree. The RCFA was decided to take place the following week. It was also decided to mount a camera and record the Notch and Pierce station to see what really happens when a panel gets stuck. The OEE meetings took place every week, section 5.2 Practical tells in more detail about the work done. The documentation of the OEE meeting consisted of two different documents that were created by the authors. Firstly the meeting minutes which was written in a new document for every meeting, secondly the action plan that was updated in the same document after each meeting. Both documents were saved on the Electrolux intranet and emailed to the attendants after every meeting.
5.1.2 RCFA The purpose of RCFA meetings was as a complement to the OEE meetings in order to find the real cause of the downtime. It was decided that RCFA meetings should be held every Wednesday when
- 34 -
ACCOMPLISHMENTS it was needed to map out some part of the machine or a new problem arose. As written above it was decided on the first OEE meeting to do a RCFA on the issue “Panels won’t leave Notch and Pierce”. It began with a brainstorming to find every possible cause behind the issue. This was the basis for the causal tree. It took another three meetings to get the causal tree complete, and to find the root causes of the problems with the Notch and Pierce station. It turned out to be far more complex than could ever be imagined to map out the station and the problems with it. The team came up with a number of root causes in different areas such as problems with the conveyor, redesign of the scrap removal system, tooling design, and panel specifications. The causes that were dealt with during our stay at Electrolux are described in next section, 5.2 Practical and the causal tree can be viewed in appendix D.
5.2 Practical During the project there have been a number of practical actions to improve the side panel machine including rebuilding the machine, taking video footage of the operations, cleaning and planning the Christmas break. These actions can be found in greater detail below.
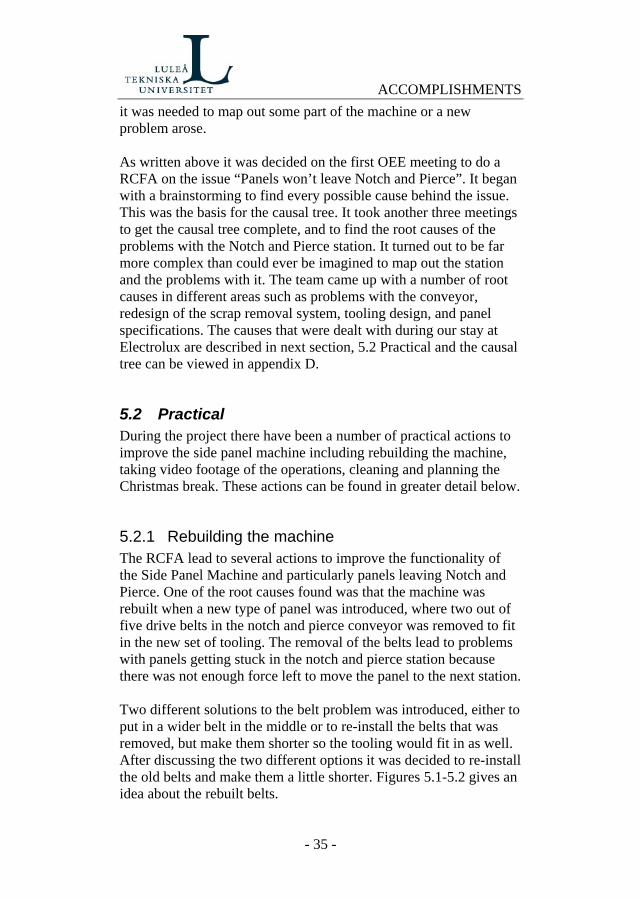
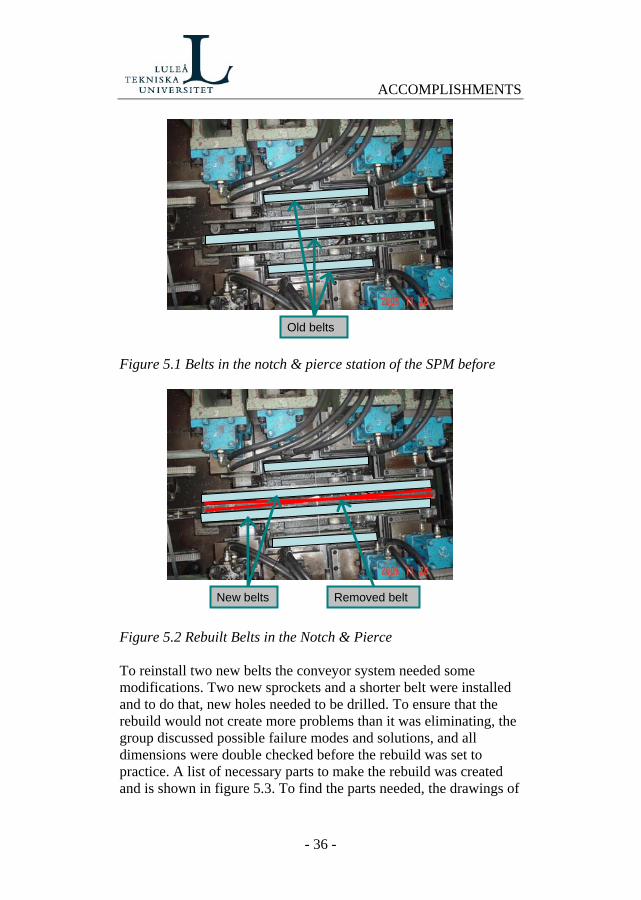
5.2.1 Rebuilding the machine The RCFA lead to several actions to improve the functionality of the Side Panel Machine and particularly panels leaving Notch and Pierce. One of the root causes found was that the machine was rebuilt when a new type of panel was introduced, where two out of five drive belts in the notch and pierce conveyor was removed to fit in the new set of tooling. The removal of the belts lead to problems with panels getting stuck in the notch and pierce station because there was not enough force left to move the panel to the next station. Two different solutions to the belt problem was introduced, either to put in a wider belt in the middle or to re-install the belts that was removed, but make them shorter so the tooling would fit in as well. After discussing the two different options it was decided to re-install the old belts and make them a little shorter. Figures 5.1-5.2 gives an idea about the rebuilt belts.
- 35 -
ACCOMPLISHMENTS
Old belts Figure 5.1 Belts in the notch & pierce station of the SPM before
Removed beltNew belts
Figure 5.2 Rebuilt Belts in the Notch & Pierce To reinstall two new belts the conveyor system needed some modifications. Two new sprockets and a shorter belt were installed and to do that, new holes needed to be drilled. To ensure that the rebuild would not create more problems than it was eliminating, the group discussed possible failure modes and solutions, and all dimensions were double checked before the rebuild was set to practice. A list of necessary parts to make the rebuild was created and is shown in figure 5.3. To find the parts needed, the drawings of
- 36 -

ACCOMPLISHMENTS the machine were studied thoroughly to make sure that everything had the correct dimensions. Figure 5.3 Part list for conveyor belt rebuild
Item Quantity 21 teeth sprocket 10T 4 Stub shaft 20*25 with fasteners 4 10T belts, 2120 mm 2 40x40x4 RHS and fasteners M6x16 mm SHCS 2 M7 drill 1 M11 drill 1 M20 reamer, drill to suit, long series 1 1M6x16 SHCS 10
After some research most of the parts was found on site. 4 new shafts and 3 new belts were ordered, 2 of the shafts and one belt to keep as spare parts and the rest to use for the rebuild. The rebuild took two persons two shifts to finish during a weekend. They started by removing the conveyor assembly from the machine and moving it to the maintenance area. During the time it took to rebuild the conveyor operator Mick Ferguson cleaned the machine. The next step was to drill the new holes for the new idle sprockets and shafts. In between the sprockets a RHS (rectangular hollow section) was mounted to hold up the belt. The three inner belts were mounted 0.5 mm above the outer ones to help lift the panel for easier transport into the roll former. The hardest and most time consuming part was to align the belts and the conveyor in the machine. It was important that the belts were correct aligned and in level with the tool, the panel is only 0.6 mm thick and a small change in belt height can make a big difference. When everything was back in place with two re-installed belts the machine was ready for test run and it worked!
5.2.2 Camera When a break down occurs on the side panel machine it is hard to know why because the operators only load material every 300 panels in one end and takes the finished panels of the machine in the other end and no one really sees what happens. They know that
- 37 -

ACCOMPLISHMENTS something is wrong when there are no panels coming out of the machine and they can see where the panel is stuck, but to know what really happened and why is many times a guess work. This problem was discussed during the RCFA-meetings. When trying to find the true root cause of a problem it is important to know what really happened and the solution to this was to mount a camera on the side panel machine to record the process. This made it easier to understand what happened by looking at the tape over and over again. Unfortunately this matter has been nothing but problems due to overload of work in the IT-department and organisational changes. From the start a handy cam was to be used. It was decided where to mount it to the machine when there was a breakdown and a chance to get inside the gates. The problem was that a TV and video recorder was needed outside the gates because the tape was only 1 hour, and it was impossible to stop the machine every hour just to change the tape. Therefore another type of camera was found, that could monitor 24 hours per day and save the information on a hard disc of a laptop. Another benefit of this camera was that it was connected to internet and could be viewed from any computer in the world that was connected to internet if the right username and password were used. Brackets, power points, and network connection were installed and the only thing left to put in was the camera. The first problem encountered was the integrity of the operators. There was a small chance that they could be monitored and they wouldn’t allow that. One idea was to mount a partition but that didn’t work because then the operators couldn’t see the machine properly. After that there was done some organisational changes and the one taking care of this matter was transferred to another line and had nothing more to do with the side panel machine. This is where the story ends so far. Everything is setup and the only thing left is to install the camera and convince the operators that this has nothing to do with them.
5.2.3 Christmas break Due to all the attention paid to SPM and a big breakdown of five shifts there were a number of activities planned to take place during Christmas break. Both to clean the machine, sharpen dies, change
- 38 -
ACCOMPLISHMENTS the belts, build stock, and other maintenance activities. To get away from chaos and nobody knowing nothing about anything the involved persons were invited to a meeting to discuss the different activities and when they should take place. The things that were to be fixed during the Christmas break were the following: Front stop modification, Top fold modification, Squaring sheet, Cleaning roll form, Tool sharpening, Modify Notch and Pierce conveyor, Grease machine, and Build stock. The work went smooth with just a few smaller incidents that could not have been foreseen, and resulted in lack of time to build stock.
5.3 Data and Documentation Since the OEE is a key index based on data the documentation is an important part of OEE. A good documentation makes it easy to go back to check how and why the OEE numbers are changing over time, it also helps to find what has been made to improve the OEE numbers. In this project the focus was on the top three items of downtime, which made it necessary to have valid data to work on the right issues.
“Go fishing where the fish are!” – John Thomas, (22)
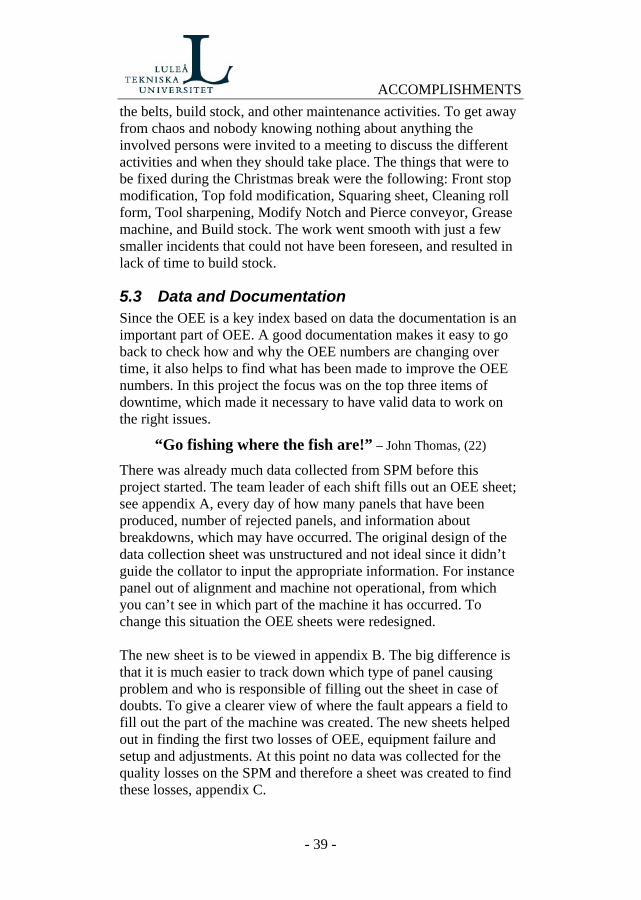
There was already much data collected from SPM before this project started. The team leader of each shift fills out an OEE sheet; see appendix A, every day of how many panels that have been produced, number of rejected panels, and information about breakdowns, which may have occurred. The original design of the data collection sheet was unstructured and not ideal since it didn’t guide the collator to input the appropriate information. For instance panel out of alignment and machine not operational, from which you can’t see in which part of the machine it has occurred. To change this situation the OEE sheets were redesigned. The new sheet is to be viewed in appendix B. The big difference is that it is much easier to track down which type of panel causing problem and who is responsible of filling out the sheet in case of doubts. To give a clearer view of where the fault appears a field to fill out the part of the machine was created. The new sheets helped out in finding the first two losses of OEE, equipment failure and setup and adjustments. At this point no data was collected for the quality losses on the SPM and therefore a sheet was created to find these losses, appendix C.
- 39 -

ACCOMPLISHMENTS The quality sheet for documentation of the rejected panels was developed to find the two last of the six big losses, defects in process and start up losses. The sheets contain the frequency and the reason for rejection of panels and were designed in the same way as the OEE sheets to make it easier to fill out. Both new sheets were designed and developed with the help of Saab Virdi, whom started the work with collecting data from the SPM in late April 2005. Much time was spent on sorting and preparing the collected data for analysis and also to develop a system for creating graphs to visualise OEE. These efforts were made to make the future work with OEE as easy as possible for Electrolux, Dudley Park. Appendix F, G, and H shows the OEE graphs that was updated and analysed in the meetings.
- 40 -

ANALYSIS
6 ANALYSIS In this paragraph it will be discussed what has been done and how well it has been done. It will also be evaluated what could have been done better, what factors that may have effected the work and the sources of error.
6.1 The project This project has been very interesting and challenging even though it has not been the ideal subject for a master’s thesis. Most theses are about investigating something and making a proposal on how to change and improve, which was not the case with our project. It has been a part of a bigger project and directly connected to the production which means that the decisions and recommendations made are meant to be implemented as soon as possible, and evaluated and documented for future needs. This has been a big challenge since authors don’t have the authority nor any experience of this type of work, and therefore have to wait for help from other people involved in the project to evaluate and approve the changes want to make. The time plan made from the beginning was very optimistic and included far more than what was possible to achieve. This lead to a cut down of the project and a reconstruction of the time plan twice, and a loss of approximately 1-2 weeks worth of work. The project has also been more time consuming than planned. Two reasons are that not all parties concerned prioritised this project and lack of authority to get people to understand the importance of the work. If the authors would have done the same project again today, more effort would have been put in the planning and a cut down the project made earlier. This could have helped in starting the meetings much earlier and there would have been more time to see the outcome of the changes. The authors would also have tried to enforce the project and particularly the meetings more urgently. Our supervisor that was the driving force in the big project had much more to think about with the whole bigger project ongoing. It must also be considered that both OEE and RCFA are new to Electrolux as well as the authors and the approach in this thesis has been of a trial and error type.
- 41 -
ANALYSIS 6.2 Fulfilment of project aims The following section analyses how well the project aims have been fulfilled and discusses the source of error, as well as other factors that may have affected the project.
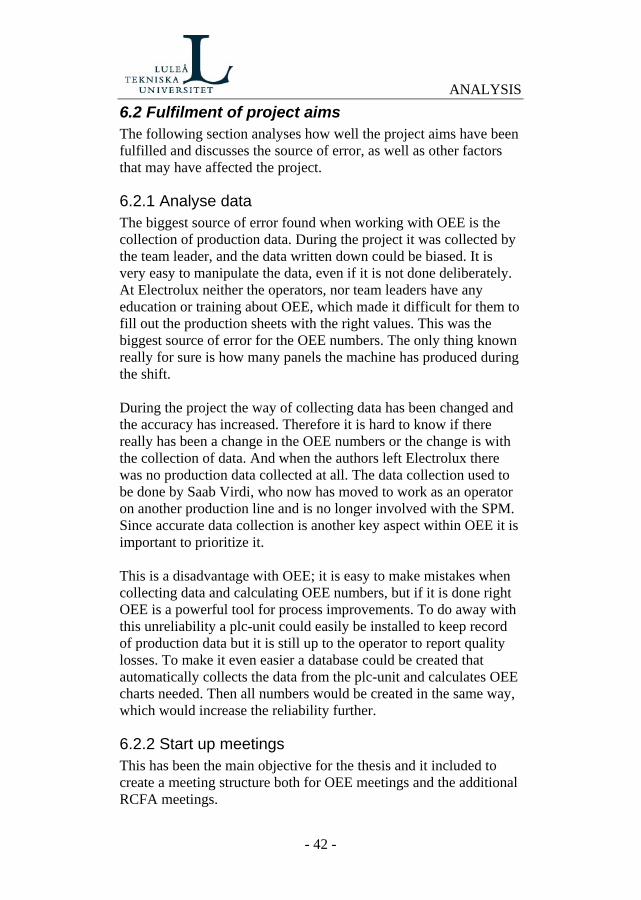
6.2.1 Analyse data The biggest source of error found when working with OEE is the collection of production data. During the project it was collected by the team leader, and the data written down could be biased. It is very easy to manipulate the data, even if it is not done deliberately. At Electrolux neither the operators, nor team leaders have any education or training about OEE, which made it difficult for them to fill out the production sheets with the right values. This was the biggest source of error for the OEE numbers. The only thing known really for sure is how many panels the machine has produced during the shift. During the project the way of collecting data has been changed and the accuracy has increased. Therefore it is hard to know if there really has been a change in the OEE numbers or the change is with the collection of data. And when the authors left Electrolux there was no production data collected at all. The data collection used to be done by Saab Virdi, who now has moved to work as an operator on another production line and is no longer involved with the SPM. Since accurate data collection is another key aspect within OEE it is important to prioritize it. This is a disadvantage with OEE; it is easy to make mistakes when collecting data and calculating OEE numbers, but if it is done right OEE is a powerful tool for process improvements. To do away with this unreliability a plc-unit could easily be installed to keep record of production data but it is still up to the operator to report quality losses. To make it even easier a database could be created that automatically collects the data from the plc-unit and calculates OEE charts needed. Then all numbers would be created in the same way, which would increase the reliability further.
6.2.2 Start up meetings This has been the main objective for the thesis and it included to create a meeting structure both for OEE meetings and the additional RCFA meetings.
- 42 -

ANALYSIS It was decided to have a cross-functional team to work with OEE to have all different points of view and not miss out on anything of importance. This has been hard since different departments work on similar project with similar people involved without taking notice of each other. It has also been hard to get hold of an operator and maintenance fitter because their work tasks do not include attending a meeting. The operator’s supervisor does not see the importance of having the operator at the meeting and will not help with arranging for someone to replace him. Therefore the OEE team has not been able to work as effective as possible since important data has been missing. During the meetings the team often started to talk about something, then the conversation drifted away and suddenly the team talked about something totally different. This is good in one way because many new things about the machine were discovered and new problem areas were found. But it was hard to focus on the problem that the team was working on at that time, and everything took longer due to it. To really see the progress immediately and get things done it is important not to have too many tasks ongoing. If the focus is on the major problem and only one or two problems at a time, it is more likely that the improvement will happen in a shorter period of time and the results will be more noticeable than if focus were on ten issues and everything moved really slow forwards.
6.2.3 Continue meetings This is the major part for Electrolux to do and when the project time was due there seemed to be very little interest in this matter. There have been some organisational changes which has affected the project and that includes a new maintenance manager. Since the former maintenance manager was the driving force in implementing OEE and TPM, the new management needs to be involved in this if the project is to continue successfully. If the team had been more educated within OEE and RCFA, and the authors had more experience in implementation processes the project would probably have been more successful.
- 43 -

ANALYSIS 6.3 Side Panel Machine When the SPM was purchased the planned production was one shift and one part per minute. Today it feeds one line with 2 parts per minute and in the future it will serve even more lines and will have to produce much more than today and it is definitely not built with that in mind. The outcome is many breakdowns and lots of work with maintaining the machine. The purpose of implementing OEE for SPM was to prevent breakdowns and prepare the machine for the increasing production level. Unfortunately, for every thing that was fixed on the machine, 10 new things were discovered and no one seemed to know what had been done, by whom, or why. If the produced panel is compared to the drawing, one will discover that the panel has been fit to purpose instead of fit to drawing. There is also the mentality that has accepted the SPM as it is and that no improvements can be made. The chronic disturbances are included in the machines normal state. These chronic disturbances could be found with the help of RCFA and removed for ever. That would improve the performance factor of the SPM and increase the OEE numbers. For example: sometimes it takes up to two hours before a truck driver reloads the machine, no problems with the machine but OEE is affected negatively. There are many safety instructions and precautions and no one is allowed inside the safety fence while the machine is running unless very many managers, including the plant manager, has approved it and is there to watch the work. Therefore there is often much guess work about the cause of the problem when it is so hard to see what is going on inside the machine during runtime. The solution to this problem was to mount a camera inside the machine, the idea was born the first OEE-meeting and organised as much as possible but the camera was still not there when the project was due. Any immediate changes and improvements in the OEE could not be seen before the thesis was due, the reason could be that the accuracy of the measurements increased and the authors only had a limited time for the project.
- 44 -

RECOMMENDATIONS
7 RECOMMENDATIONS This project has resulted in one major recommendation followed by a number of subsequent suggestions that all are important parts in the first one. From what we have learned about OEE and experienced during our stay at Electrolux cooking plant, we think that OEE is a good way of working with improvements in a production process. Consequently our major recommendation for Electrolux is to continue the OEE work that we have started. To facilitate this we have found a number of subsequent recommendations that is necessary for the future OEE work. The first thing that is required is to find a new driving force for OEE that can be a support for the OEE team and help them move forward. It is also important to educate the team about both OEE and RCFA to make them understand the importance of the work and to use the tools provided in the best and most efficient way. For the team and the rest of the company to see the progress in the work it is of substance to only focus on a maximum of three issues at a time, otherwise there will be too many tasks going on at the same time and the improvements will take longer time and that can cause a loss of motivation. To really ease the collection and calculation of data, Electrolux should consider creating a database that automatically collects the data and creates the necessary charts and documents needed to visualise the OEE progress. If this is made all OEE numbers of different equipment will be calculated in the same way and can consequently be compared within the facilities. Then it will be easier for Electrolux to find bottlenecks and where to put in most maintenance efforts.
- 45 -

RECOMMENDATIONS CONTINUE WORKING WITH OEE
• Find driving force
• Educate cross-functional OEE teams
About OEE
About RCFA
About data collection
• Concentrate on top issue
• Collection of data
Initiate database for OEE
- 46 -
REFERENCES
REFERENCES Books:
1. Nakajima, S. (1988). Introduction to TPM, Total productive maintenance, Cambridge, Mass Productivity Press
2. Niebel, B.W. (1994). Engineering maintenance management, New
York, Dekker cop.
3. Mobley, R.K. (1999). Root cause failure analysis, Boston, Oxford Newnes cop.
Articles:
4. Bamber, C.J., Castka, P., Sharp, J.M., Motara, Y. (2003). Cross-functional team working for overall equipment effectiveness (OEE). Journal of quality in Maintenance Engineering. Vol. 9, No. 3
5. Bartell, R. (2001). Reliability Program for Plant Maintenance.
Industry Applications Magazine. Vol. 7, No. 5 6. Bergman, B.L.S., Fundin, A.P., Gremyr, I.C., Johansson, P.M.
Beyond Root-Cause Analysis. Proceedings of the Annual Reliability and Maintainability Symposium. P. 140-146
7. Bonal, J., Ortega, C., Rios, L., Aparicio, S., Fernández, M.,
Rosendo, M., Sánchez, A., Malvar, S., (1996). Overall Fab Efficiency. SEMI Advanced Semiconductor Manufacturing Conference and Workshop. P. 49-52
8. Da Costa, S.E.G. & De Lima, E.P. (2002). Uses and misuses of the
“Overall Equipment Effectiveness” for Production Management. International Engineering Management Conference, ver. 2
9. De Ron, A.J. & Rooda, J.E. (2005). Fab Performance. Transactions
on Semiconductor Manufacturing. Vol. 18, No. 3
10. De Ron, A.J. & Rooda, J.E. (2005). Equipment Effectiveness: OEE Revisited. transactions on semiconductor manufacturing, vol. 18, no. 1
REFERENCES
11. del Val, M.P., Fuentes, C.M., (2003). Resistance to change: a
literature review and empirical study. Management Decision. Vol. 41, No. 2
12. Kwon, O., Lee, H. (2004). Calculation methodology for managerial
effect by OEE as a result of TPM activities.Journal of quality in Maintenance Engineering. Vol. 10, No. 4
13. Leachman, R.C., Busing, D.P., Ting-Yun, L., Moore, D. (1997).
Equipment Efficiency Improvement: The New Frontier. International Symposium on Semiconductor Manufacturing Conference Proceedings. P. 39-40
14. Loughlin, S. (2003). A holistic approach to Overall Equipment
Effectiveness (OEE). Computing & Control Engineering. Vol. 14, No. 6
15. Nutt, P.C. (1995). Implementation Style and Use of Implementation
Approaches. Omega. Vol. 23, No. 5
16. Oechsner, R., Pfeffer, M., Pfitzner, L., Binder, H., Müller, E., Vonerstrass, T. From overall equipment efficiency (OEE) to overall Fab effectiveness (OFE). Materials Science in Semiconductor Processing. Vol. 5, No. 4-5
17. Pomorski, T. (1997). Managing Overall Equipment Effectiveness
(OEE) to Optimize Factory Performance. International Symposium on Semiconductor Manufacturing Conference. P. A33-A36
18. Smith, I. (2005). Continuing professional development and
workplace learning 13: Resistance to change - recognition and response. Library management. Vol. 26, No. 8/9

REFERENCES
Internet:
19. http://www.brainstorming.co.uk/tutorials/whatisbrainstorming.html sdf 17/01/06
20. http://www.humtech.com/opm/grtl/ols/ols3.cfm 30/01/06
Respondents:
21. Maria, Grant, Maintenance Engineer Consultant, ABB Maintenance Engineering & Consulting Service, Adelaide. 2005/09/07 - 2006/01/27
22. Thomas, John, Maintenance Manager, Electrolux Dudley Park,
Adelaide. 2005/09/07 - 2006/01/27
23. Tonkins, Lindsay, Senior Maintenance Engineer Consultant, ABB Maintenance Engineering & Consulting Service, Adelaide. 2005/09/07 - 2006/01/27
Other sources:
24. ABB asset Consulting Service. (2005). Root Cause Failure Analysis Training.
25. ABB maintenance engineering & consulting services. (2005),
Benchmark studies Electrolux Adelaide & Orange sites.
26. Electrolux intranet (September 2005 to January 2006)
27. Wauters, F., & Mathot, J. (2002). OEE - Overall Equipment Effectiveness, ABB

APPENDIX
APPENDIX ASide panel machine data (old)
Downtime Information (Fault desription) Time Total (Mins)
Start:
Finish:
Start:
Finish:
Start:
Finish:
Start:
Finish:
Start:
Finish:
Start:
Finish:
Start:
Finish:
Start:
Finish:
No. of side panels produced for total shift (Including defective panels):
Total no. of defective panels:
Total downtime (Mins):
Shift (DS/AS):
Maintenance comment

APPENDIX
APPENDIX B Side panel machine data (new)
Date:
Area Description Time Total
(Mins)0038.006.706 Start:0038.006.7580038.006.763 Finish:0038.006.7980038.006.706 Start:0038.006.7580038.006.763 Finish:0038.006.7980038.006.706 Start:0038.006.7580038.006.763 Finish:0038.006.7980038.006.706 Start:0038.006.7580038.006.763 Finish:0038.006.7980038.006.706 Start:0038.006.7580038.006.763 Finish:0038.006.7980038.006.706 Start:0038.006.7580038.006.763 Finish:0038.006.7980038.006.706 Start:0038.006.7580038.006.763 Finish:0038.006.7980038.006.706 Start:0038.006.7580038.006.763 Finish:0038.006.798
DNRETXChanging the stack
Destacker
UC 20 Side Panel Machine OEE Data
Notch and PierceRoll FormerEnd foldToggle lock
Total downtime (Mins):
Legends - Area Description:
Operator (Initials):
No. of side panels produced for total shift (including defective panels):
Total no of defective panels (please refer to reject panels audit sheet):
Downtime information / FaultsPanel number (Please ?)
Colour (Please ? )
Green
Grey
Grey
Grey
Green
Green
Green
Grey
Grey
Grey
Green
Green
Green
Grey
Green
Grey
Shift (DS/AS): AS
DD / MM / YYYY2006

APPENDIX
APPENDIX C Scrap audit sheet
Date:
Reason for the panel rejection Total
0038.006.706
0038.006.758
0038.006.763
0038.006.798
0038.006.706
0038.006.758
0038.006.763
0038.006.798
0038.006.706
0038.006.758
0038.006.763
0038.006.798
0038.006.706
0038.006.758
0038.006.763
0038.006.798
0038.006.706
0038.006.758
0038.006.763
0038.006.798
0038.006.706
0038.006.758
0038.006.763
0038.006.798
0038.006.706
0038.006.758
0038.006.763
0038.006.798
0038.006.706
0038.006.758
0038.006.763
0038.006.798
0038.006.706
0038.006.758
0038.006.763
0038.006.798
0038.006.706
0038.006.758
0038.006.763
0038.006.798
Shift (DS/AS): Operator Initials:
1
2
5
UC 20 Side Panel Machine - Scrap audit sheet
Occurences (Please use roman numerals)
7
8
9
10
3
4
6
Panel No. (Please ?)
Colour (Please ?)
Grand Total:
DD / MM / YYYY

APPENDIX Panels get stuck due to
burr
Panels w
on't leave notch and pierce
Pre notched and pierced
panels, elevated and New
Zealand 600 panels
Obstruction
Burr on panel w
hen entering N
&P
Tools not in level, surface is not plane, contact w
ith belt reduced
Not enough surface for
belts to move panels
Not enough drive on belts
to move the panel
Only 3 belts
To hard to access tools
Incorrect frequency of sharpening
Reactive tooling
maintenance
Tool not fit to purpose
2 outside belts removed
Panel is bow
ing due to lack of support on the outside of the panel
Tools have been raised but not belts
Double sheet can blunt
the tool
Tool is not sharp
Reactive tooling
maintenance
Incorrect freqsharpening
uency of
Tooling TP300 not sharp
APPENDIX D Casual tree
Non m
achine
Scrap not exiting tooling
effectively
Levels on tools is not checked w
hen tools are fixed
Stalled shaker trays
Scrap
Foreign body
Shaker tray not
synchronised with tooling
Shaker trays position
incorrect
Drive can't overcom
e friction
Piece of dam
aged tool
Hole is to close to edge
Wrong tool design
SM
ED
: Singl
Exchange o
Team E
xerc
e Minute
f Toolsise
Contam
ination film >
sticking
Oil or w
ater
Stacked and
compressed
Burr
Central belt m
odification
PM
on mainpac
Spare set of tools
Put in 2nd sensor to
sense 2 panels at pickup. B
unty with the help of
Mick and Jam
es
Bunty
Panels bow
ed
Grant
Quote 170 m
m belt drive
Lindsay>Tem
plate>R
esponsibility code>Frequency
Grant collects the data
needed for Vladim
ir to do a cost justification
Talk to supplier about them
stapling the paper to the pallet.
Check if concave side is
green or grey then it is a straightening problem
Finnpower m
akes dim
ples on the end of the panel, m
akes the stack bow
.
Mick
Paper
Check again how
much
it varies.
Blanks not set up
correctly as straightener not set up correctly
John
Gloves
Consider rede
scrap remo
sign of val
Grant
Grant
Check it out
James
Yes it is
Verify flatness
specification and send to supplier
John
Investigate elimination of
dimples
Bunty

APPENDIX
APPENDIX E Meeting minutes
Item Subject Who
Agenda: 1. OEE charts
2. Top 10 charts
3. Root Cause Failure Analysis
4. Action plan
a) Last week
b) New issues
1.
−
2.
−
3.
−
4a.
−
4b.
−
Time Date Location Next meeting
Subject: OEE meeting Date: From: Present: Apologies: Absent:
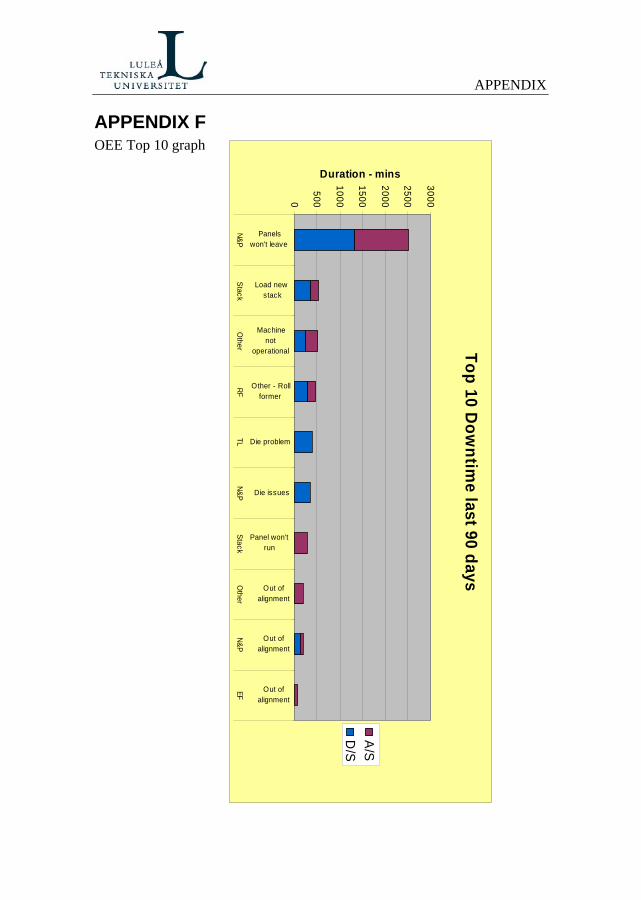
APPENDIX
APPENDIX F OEE Top 10 graph
Duration - mins
Top 10 Dow
ntime last 90 days
0
500
1000
1500
2000
2500
3000
Panelswon't leave
Load newstack
Machine
N&PStack
notoperational
Other - Rollformer
Die problem
Die issues
Panel won'trun
Out ofalignment
Out ofalignment
Out ofalignment
Other
RFTL
N&PStack
Other
N&PEF
D/S
A/S

APPENDIX
APPENDIX G Weekly OEE Average
UC
20 Side P
anel Machine W
eekly OE
E
0%10%
20%30%
40%50%
60%70%
80%90%
100%26
27
28
29
30
31
32
33
34
35
36
37
38
39
40
41
42
43
44
45
46
47
48
49
D/S Weekly OEE Average %
A/S Weekly OEE Average %
Target
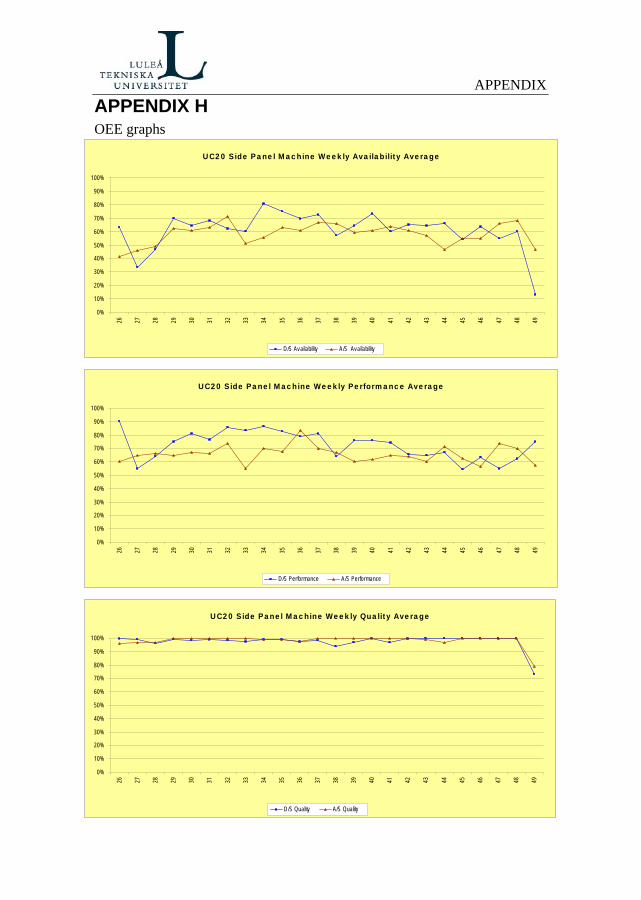
APPENDIX APPENDIX H OEE graphs
UC20 Side Panel Machine Weekly Availability Average
0%
10%
20%
30%
40%
50%
60%
70%
80%
90%
100%
26 27 28 29 30 31 32 33 34 35 36 37 38 39 40 41 42 43 44 45 46 47 48 49
D/S Availability A/S Availability
UC20 Side Panel Machine Weekly Performance Average
0%
10%
20%
30%
40%
50%
60%
70%
80%
90%
100%
26 27 28 29 30 31 32 33 34 35 36 37 38 39 40 41 42 43 44 45 46 47 48 49
D/S Performance A/S Performance
UC20 Side Panel Machine Weekly Quality Average
0%
10%
20%
30%
40%
50%
60%
70%
80%
90%
100%
26 27 28 29 30 31 32 33 34 35 36 37 38 39 40 41 42 43 44 45 46 47 48 49
D/S Quality A/S Quality