Embed Size (px)
Citation preview
L H Martin Institute | Changes in funding in Australian vocational education and their effects i
— L H Martin Institute Graduate School of Education
Changes in funding in Australian vocational education and their effects Gerald Burke Honorary (Principal Fellow) L H Martin Institute Graduate School of Education University of Melbourne Adjunct Professor Faculty of Education Monash University 31 July 2018
)
L H Martin Institute | Changes in funding in Australian vocational education and their effects ii
Table of Contents
Overview .......................................................................................................................... 1
Funding changes in context .............................................................................................. 3
Funding and enrolment changes ....................................................................................... 5 1. Public spending on providers ........................................................................................... 6
2. VET Student Loans ............................................................................................................ 7
3. Support for apprentices ................................................................................................... 8
4. Student assistance ............................................................................................................ 9
5. Support for the national training system ....................................................................... 10
6. Programs for access to training ...................................................................................... 10
7. Commonwealth funding for labour market programs ................................................... 10
8. Domestic fees to public providers from students and employers ................................. 10
9. International students’ expenditure .............................................................................. 11
10. Other private fees to private providers .......................................................................... 11
Pricing policy, concessions and exemptions, subsidy rates and contracts.............................. 11
Effects of funding changes .............................................................................................. 12 Efficiency .................................................................................................................................. 13
Equity ....................................................................................................................................... 13
Effectiveness ............................................................................................................................ 13
Aspects of quality ..................................................................................................................... 14
Concluding comment ...................................................................................................... 16 More comprehensive analysis of funding ................................................................................ 16
Improved governance for stable and efficient funding ........................................................... 16
Quality and external assessment ............................................................................................. 17
The public provider, effectiveness and equity......................................................................... 17
References ..................................................................................................................... 19
Appendix: Tables and Figures ......................................................................................... 24
L H Martin Institute | Changes in funding in Australian vocational education and their effects 1
Overview1 The paper considers changes in funding for vocational education and training (VET) from the early 1990s when the move towards a market in vocational education began.
Government funding to non-TAFE provider began to grow in the 1990s with provision by the Commonwealth government to the states of ‘growth funds’ of which a proportion had to be allocated to private providers. User Choice was introduced for the training of apprentices and trainees which allowed the employer to choose the public or private training provider who then received public funding. Commonwealth incentive payments to employers of apprentices were extended to traineeships and to existing and part-time workers. From 1995 there was a rapid increase in international students, associated with permanent migration, and very substantial fee revenues mainly received by private providers.
Some additional Commonwealth programs under the Howard and Rudd governments increased the funds to private and public providers. In 2008 the Council of Australian Governments (COAG) considered an entitlement for all Australians to at least Certificate III. Victoria led the way from 2009 and all states agreed to it from 2012. Under the scheme funds for non-apprentice/trainee courses would be more generally available to non-TAFE providers. There was also agreement in 2012 to extend availability of VET FEE-HELP loans for diploma and higher level vocational courses.
Each of these developments while extending the provision of training was associated with waste and fraud. The largest overall waste of funds was VET FEE-HELP where outlays reached nearly $3 billion in 2015. However there were problems reported by 1999 for traineeships. Fraud in the award of qualifications to international students to enable permanent migration led to the removal of several VET related occupations from the migration occupations list in 2010. The entitlement scheme in Victoria led to a huge budget blow out by 2011, a sharp contraction in TAFE and expansion in private providers and extensive fraud. Other states schemes were introduced later. They were mostly more limited and better monitored.
Against this background the paper reviews the funding to vocational education from the early 2000s.
Government funding paid to providers of training recently totalled about $5 billion:
• Total real government funds for VET providers changed little in the early 2000s, increased from 2008 to 2012 and then fell 20 per cent to be lower than in 2003.
• The Commonwealth share rose until by 2011, fell briefly with a short-lived expansion of states’ spending and then, with a fall in states’ funding, rose to nearly 40 per cent in 2016.
• Real government funds per hour of training tended to fall over a long period and vary substantially among states.
• The share of public funds going to non-TAFE providers increased from 10 per cent in 2007 to 25 per cent in 2016, with large variation across states.
Public funding paid to providers is only part of public funding. Other public funding is now about $2 billion:
• Support for apprentices and trainees, including Employer Incentives, about $0.7billion
• Support for the national training system, access and Migrant English programs funds, share to VET approximately $0.3 billion.
• VET Student Loans, an annual cost about $0.3 billion, a fraction of the cost of VET FEE-HELP.
• Means tested grants to VET students such as Youth Allowance, approximately $0.7 billion.
Private funding is in excess of $2.3 billion and includes fees from Australian students, from Australian enterprises and from international students.
The main types of funds are discussed in relation to numbers in training, to participation by equity groups, to efficiency and to effectiveness:
1. Advice from Michael Keating, Mike Long, Joanna Palser, Robin Shreeve and Phil Toner is much appreciated. They do not necessarily agree with the views expressed.
L H Martin Institute | Changes in funding in Australian vocational education and their effects 2
• The number of students in government funded vocational education grew to 2012 and then fell by over 20 per cent to be lower than in 2003.
• The rapid extension of funding to for-profit providers led to a decline in quality, fraud and waste.
• Vocational education remains easily the major provider for less advantaged students but the equity indicators for government funded VET showed average to poor performance recently.
• Measures of effectiveness such as employer satisfaction fell; student satisfaction changed little.
• Employment outcomes declined though this could in part be due to the growth in part-time employment and underemployment for young people; university graduates were also affected.
• Only a small proportion of vocational graduates other than trade apprentices obtain employment in the occupation of their training, raising questions on the nature of vocational education.
• Quality issues remain affected by the quality of teachers, courses provided in unduly short time, excessive use of on-line delivery and thousands of providers carrying out assessments and awarding qualifications.
The analyses in the paper are drawn on to suggest matters for more detailed consideration:
• A comprehensive and regular evaluation of the whole range of funds for vocational education.
• A need for a state and Commonwealth agreement for national oversight of funding of vocational and higher education as a means of rationalising subsidies across tertiary education.
• A need for improved confidence in quality, including an extension of external assessment.
• Development of more autonomous public vocational providers well supported at state and national level.
L H Martin Institute | Changes in funding in Australian vocational education and their effects 3
Funding changes in context The early 1990s was a time when belief in market systems compared with command economies was at its peak – the West’s Mercedes compared with the East’s Trabant.
In education, government support for markets bloomed but its introduction was concentrated on the vocational sector. In schooling, funding for private providers increased but was confined to not-for-profit providers. In higher education almost all public grants were reserved for public providers though students in approved private providers could receive loans.
Critics of TAFE saw it as provider-led, not sufficiently responsive to the needs of employers and, with its unionised teaching workforce, relatively expensive. The new Australian National Training Authority in 1994 said:
“Competition is less comfortable and more challenging than monopoly or protection. It is now, however, universally recognised as the most effective way to improve services, contain or reduce costs and focus an organisation’s efforts away from its own preoccupations toward those of its customers” (ANTA 1994).
Facilitating the move to competition was the development of a national system of vocational education and national qualifications with mutual recognition of the qualifications awarded in all states. The Australian Qualifications Framework (AQF) was developed to improve pathways in education and from education to work. Training was more closely aligned to industry needs. Skills Councils developed nationally endorsed competency standards for occupations and progressively from the late 1990s assembled these into ‘training packages’ (Smith, 2010). The packages included units of competency, assessment procedures and the qualifications that could be awarded. A training organisation wishing to deliver nationally recognised training had to be registered against national standards by (then) state-based qualifications authorities. This broad structure persists, though with a dominant quality assurance body, the Australian Skills Quality Authority (ASQA), and a new advisory structure for the development of training packages.
In the 1990s a small proportion of additional ‘growth funds’, provided for several years by the Commonwealth, was made available to private providers. ‘User Choice’, whereby the employer of an apprentice or trainee could choose an approved public or private provider for the (mainly) off-the-job training, was introduced from 1998 but with variations across the states.
The Commonwealth from the 1970s provided incentives to employers of trade apprentices. From the mid-1990s these were extended to the traineeship system including for part-time trainees and apprentices and also to existing workers (those employed for three months or more). Traineeships had been established in the late 1980s to provide apprentice-type training for young people in non-trade occupations with the aim of capturing “the benefits of the ‘dual system’ operating in German-speaking countries” (Kirby, 1985).
Together with the introduction of a (lower) training wage for trainees, the incentives and User Choice led to a very rapid expansion in the numbers of trainees in the late 1990s and to new training modes including fully on-the-job training. There was a sharp increase in the number of providers delivering training, the total swelling rapidly to near its recent level of over 4000 registered training organisations (RTOs), including over 3000 private providers (Korbel and Misko, 2016; NCVER, 2017e)2. Several reviews of the traineeship system were carried out by Kaye Schofield. A strong finding was the inadequacy of quality assurance. She also found that the traineeship system was “in many cases a de facto source of wage subsidies to firms, with very little or no structured training provided” (Schofield, 1999).
The experience with the market up to the early 2000s was reviewed by Damon Anderson (2006). Based largely on a survey of public and private providers he found outcomes on balance to be negative. They were positive for choice and diversity, for responsiveness (to medium/large enterprises and fee-paying clients), flexibility, and innovation. He found negative outcomes in relation to efficiency (e.g., high transaction costs and complexity), responsiveness (to small enterprises, local/surrounding communities, and government-subsidised students), quality, and access and equity (Anderson, 2006).
2 ASQA recently said there are about 5000 providers though the NCVER showed only a little over 4000 registered training organisations reporting delivery of training in 2016 (ASQA, 2018; NCVER 2017f).
L H Martin Institute | Changes in funding in Australian vocational education and their effects 4
In the period 2005 to 2010 the private training market expanded due to an extraordinary growth in numbers of international students: from just over 50,000 to over 200,000 enrolments. This was fuelled by the then easy access to permanent migration for those who held a qualification on a list of occupations in demand. However, as reviewed by Baird (2010) some or even many providers engaged in fraudulent behaviour and awarded qualifications while providing little training. Migration lists were amended and many occupations associated with vocational education removed. International student enrolments in vocational education fell by 70,000 or some 35 per cent to 2013. Easing visa conditions since then have seen the numbers recover (DET, 2018e).
An OECD review of Australian vocational education in this period strongly advocated national assessment procedures, preferably exit tests, to ensure that students had achieved the required standards (Hoeckel et al., 2008). Its advice on assessment was not taken.
The Howard Government in 2007 with its Work Skills Vouchers allocated some additional Commonwealth funding directly to training providers, as did the Rudd Government from 2008 with its Productivity Places Program which operated until 2011–2012. The latter was partly funded by states, which took over administration. The funds were available to public, community and private training providers with most taken up by private providers. Doubts were expressed about the balance of courses undertaken and quality of training but considerable deficiencies in data severely hindered evaluation of the program (Allen Consulting, 2010).
Access by private providers to the major part of vocational funds in the states came with the implementation of an entitlement to government funding of training for qualifications up to certificate 3. This idea was considered by COAG in 2008 though only Victoria was clearly on-side, already initiating its own scheme to start in 2009.3 In Victoria there was a huge expansion in enrolments, largely with private for-profit providers, some in courses little related to job prospects (Figures 1 and 2). Budgetary problems were quickly evident along with quality issues, summed up as “college collapses, student exploitation, sham qualifications, ineffective regulatory intervention” (Mackenzie, 2015, 2016). By early 2012 the Victorian Government had announced severe cuts to funding rates in many fields of education and tightened contracts with providers.
Seemingly ignoring the Victorian experience and advice on quality from Skills Australia (2011), all governments signed the National Partnership Agreement on Skills Reform on 12 April 2012, which committed them to:
“introducing and strengthening a national entitlement to a government subsidised training place to a minimum of the first Certificate III qualification … which… is accessible through any registered training organisation (RTO), public or private, which meets state-based criteria for access to the national training entitlement” (COAG, 2012).
That agreement also provided for increased availability of VET FEE-HELP income-contingent loans to vocational students in diploma and higher level courses. The blow-out and vast misuse of those loans is outlined in the government’s own review (DET, 2016b) and by Saccaro & Hall (2018) in this series of papers.
The states differed considerably in their implementation of the national partnership agreement of 2012. An overview of developments to 2015 was provided by Bowman and McKenna (2016). No state went as far as Victoria in implementing an entitlement scheme and some including Victoria have since modified or reversed the privatisation of vocational education.
Where the entitlement model in higher education was seen as demand-driven (by students), the vocational entitlement scheme was seen fairly quickly to be ‘provider-driven’. States then reverted to tailoring the distribution of places to estimates of industry needs, which could be considered ‘government-driven’.
The market for vocational education was unlikely to work well for many reasons: fees paid, if any, for subsidised courses were often very low; easy loans were available for higher-level courses; information on the quality of providers was limited; potential students had little relevant knowledge or ‘skin in the game’; and (of considerable importance) the assessment of students leading to the award of a qualification was done by thousands of providers, making regulation of quality a daunting task.
The Grattan Institute (2016) summed up:
3 The final COAG agreement only required a commitment to “driving further competition in current training arrangements” but left the implementation to the states (COAG, 2008). Victoria was labelled a ‘reform state’ by the Commonwealth and provided with some additional funding.
L H Martin Institute | Changes in funding in Australian vocational education and their effects 5
“…taxpayer funding of for-profit entities to provide services at the behest of individual citizens inherently creates opportunities for poor outcomes, or even fraud that must be carefully managed”.
Management of quality has been tightened over several years. A former head of the Prime Minister’s Department, Michael Keating, recently concluded that:
“ public funding can be rorted if there is inadequate regulation. However, with experience governments have found out how to regulate the training market so that quality is preserved, while competition can reduce costs and increase choice and responsiveness to customer needs.” (Keating, 2017).
However, Terry Moran, the foundation CEO of ANTA which actively promoted competition and the funding of for-profit providers began a recent speech with a quotation from John Maynard Keynes: “When the facts change, I change my mind.” While not referring specifically to vocational education, he said:
“The policy pendulum is swinging away from a consensus on the primacy of light touch regulation of markets, the unexamined benefits of outsourced service delivery, a general preference for smaller government… (Moran, 2017).
Funding and enrolment changes Much of the discussion of funding for vocational education has concentrated on government money paid to for the provision of training by RTOs. The total of such public spending in 2016 was about $5 billion.4 In real terms this is lower than in the early 2000s.
The downward trend has not stopped. The Commonwealth and states in 2017 agreed to a national agreement and a national partnership. The two agreements commit the Commonwealth to about $1.9 billion per annum for five years. This represents a fall in real terms from the 2012 agreements and, as noted by the Treasury (2018a):
“Expenses under the vocational and other education sub-function are expected to decrease…by 3.1 per cent in real terms from 2018-19 to 2021-22.”5
In addition to $5 billion of public funding paid to providers there is a range of other revenues for vocational education. They vary considerably over time. Currently they exceed $4.3 billion (Table 1):
Other public support of $2.0 billion annually:
• A range of support for apprentices and trainees, including Employer Incentives which were cut substantially early this decade, the Apprenticeship Support Network, and Trade Support Loans, $0.7billion (DET, 2018c, DJSB, 2017).
• Support for the national training system, programs for job seekers, Migrant English programs, estimated $0.3 billion received by RTOs (DET 2018c).
• VET Student Loans projected at annual cost of $0.3 billion, a fraction of the cost of VET FEE-HELP which they replaced (DET, 2018c).
• Means tested grants to students for Youth Allowance, Austudy and ABSTUDY approximately $0.7 billion to VET students annually (DSS, 2018)
Private funds, exceeding $2.3 billion annually:
• onshore international student’s fees, $1.4 billion in 2016–2017 and rising (ABS, 2018)
• domestic student fees and other fees-for-service received by public providers, $1.0 billion in 2016 (NCVER, 2017c)
• other private income of private providers, not reported.
4 Excluding user cost of capital but including fee-for-service payments from government agencies (Productivity Commission, 2018). 5 The decline is partly due to the low rate of indexation for price changes in the National Agreement and no adjustment for prices in the National Partnership Agreement.
L H Martin Institute | Changes in funding in Australian vocational education and their effects 6
Government funds to providers are a major factor driving the number of publicly supported students, though demand-driven funding for higher education from 2012 has drawn some potential students away from VET. Total numbers may also have been driven down by the reduction of subsidies to providers for courses seen as low priority or at diploma and higher levels where student loans were available.
Total publicly funded students numbered about 1.3 million in 2003, stagnated to 2009, rose sharply and briefly to 2012 but then fell back in 2016 to the level of 2003 (Figures 1; NCVER, 2018a)6. For comparison, in this period the population in relevant age groups grew more than 20 per cent and will continue to grow (Noonan & Pilcher 2018, ABS 2013). There were large differences among the largest states (Figure 2).
The distribution of students changed sharply. In 2009 TAFEs had three times the number of students as private providers, in 2012 they had 50 per cent more. In 2015 they had equal numbers. TAFE student numbers contracted by a third from 2012 to 2015 before beginning to grow again.
A third sector is Adult and Community Education. Its numbers are shown to have contracted this century from around 13 per cent of total students to about 6 per cent. This sector is important for the education of adults and for the less advantage. It needs separate consideration.
Even though student numbers in 2016 were at the 2003 level, the number of hours of training provided was 25 per cent higher (Figures 3 & 4). This was due to an increase in hours per student. A factor in this is the growth in students classified as full-time – those taking more than 75 per cent of a full year’s load (considered to be 720 hours). Among publicly funded students the proportion full-time grew from 12 per cent in 2002 to 22 per cent in 2014, then falling a little. Other factors affecting hours per student are multiple enrolments per student or students taking courses with more hours. Among private providers, average hours per student in 2016 were 50 per cent more than in 2003 (Table 2). For TAFEs the hours were 10 per cent more. Some of these changes in hours may have been due to gaming the system where public funding was provided per hour of training.
A data collection on students and courses for the total vocational system was started in 2014. For 2016 there were an estimated 4.2 million students, over 50 per cent with private providers (Table 3)7. Publicly funded students make up about 33 per cent of the total: they make up 75 per cent of students with public providers and 20 per cent of students with all other private providers (Table 4)
1. Public spending on providers Public spending on vocational education is first considered relative to spending on schools and higher education. The only financial data allowing comparisons across sectors are the aggregated data the Australian Bureau of Statistics (ABS) compiles as part of its government finance statistics (ABS, 2017b).
Real public funding of providers of vocational education (excluding any private revenues) fell substantially in the ABS estimates in the fourteen years to 2015-16 (Figures 5, 6 & 7, Pilcher & Torii, 2017). For schools there was an increase of over 40 per cent in real public funds. For universities real public funding rose 60 per cent, with recent growth supported by demand-driven funding.
For more detailed consideration of the funds for vocational education the NCVER financial information on publicly funded vocational education is used (NCVER, 2017c). These data show the same trends as the ABS data though there are differences in the absolute levels due to different data sources and definitions. In summary the NCVER data as used by the Productivity Commission (2018):
• Total real government funds for VET providers increased in real terms from 2008 to 2012 and then fell 20 per cent to $5 billion in 2016, lower than in 2003.
• The Commonwealth share of these funds was around 25 per cent in the early 2000s, grew to over 30 per cent by 2011, fell briefly with a temporary expansion spending especially in Victoria and then rose to nearly 40 per cent in 2016 largely because of a fall in states’ spending.
6 Data released in July 2018 showed numbers of publicly funded students fell by six per cent in 2017 and the fall was concentrated in private providers (NCVER, 2018a). 7 The Australian Bureau of Statistics each year publishes Education and Work from a sample survey of households in May (ABS 2017 6227.0). It provides estimates of students aged 15 to 64 in schools, higher education, TAFE and in other educational institutions. The total for TAFE and other was less than a million for 2016. This in part is due to it being a point in time estimate. The NCVER data are for the total students enrolled in a calendar year. Some of the difference may also be the ABS survey being answered by a ‘responsible adult’ and not necessarily the person studying. It does mean we have wildly different estimates.
L H Martin Institute | Changes in funding in Australian vocational education and their effects 7
• The average share of public funds going to non-TAFE providers increased from a little over 10 per cent in 2007 to over 25 per cent in 2016, but about 40 per cent in Victoria and Queensland and 10 per cent in NSW (Figure 13).
• Real government funds per hour of training fluctuated and trended down over a long period and they vary across states e.g. NSW $18 per hour and Victoria $12 in 2016 (Figure 10).
In Victoria public expenditure increased 65 per cent in real terms from 2009 to 2012. It then fell to 2016 as much as it had risen. Notable expansions and contractions also occurred in Western Australia and South Australia (Figures 8 and 9). As mentioned earlier, to rein in the budget in Victoria from 2012, the funding rates for ‘low priority’ courses were cut substantially. The average funding rate per hour of training in Victoria fell by 25 per cent from 2012 to 2014 (Figure 10). It recovered somewhat to 2016 in part due to a shift in course mix away from the now low-funded courses in business and administration (Figure 11). The fall in student numbers in these courses was exacerbated by the Commonwealth’s removal of incentives for existing workers in most traineeships after 2012. Student numbers in business and administration in Victoria totalled over 130,000 in 2012 but fell to around 30,000 in 2016.
The expansion of spending in Victoria was concentrated on private providers. From $150 million in 2009 the outlay on non-TAFE providers rose to over $800 million in 2012, $850 in 2014 but then fell to $550 million in 2016. Queensland doubled its spending on non-TAFE providers from $180 million in 2013 to $380 million in 2016. South Australia more than doubled its outlay on non-TAFE providers from 2011 to 2013 but then cut it to below the 2011 total (Figure 12).
2. VET Student Loans VET FEE-HELP loans were provided by the Australian government for VET diploma, advanced diploma and graduate certificate/diploma courses. They were introduced in 2009 but vastly expanded after 2012. As mentioned, VET FEE-HELP was seriously flawed and wasted a huge amount of money and students’ time (DET, 2016b; Saccaro & Hall, 2018). The Department of Education in 2017 reported a ‘fair value’ loss of over $6 billion on its higher education loan program, of which a substantial part was for VET FEE-HELP (DET, 2017b p. 45).
VET Student Loans replaced VET FEE-HELP in 2017. VET Student Loans are available to a much smaller number of providers and students than was VET FEE-HELP. They are available for about 300 courses, in general ones for which at least two states provide subsidies, an indicator that they have relevance to employment. There are three loan caps, $5000, $10,000 or $15,000, based on course costs where the classification draws on recent analysis for NSW TAFE. Providers need a strong track record of training outcomes and financial management. They need evidence that the students are qualified for diploma and higher courses for which loans can be made. The Commonwealth Ombudsman can investigate complaints. The Australian National Office of Audit is undertaking a review to be completed later this year.
Warburton (2017) warned that the new VET Student Loans scheme was under-developed and its implementation had been rushed. This may be behind the very small level of loans in 2017 – less than $200 million compared to the loans of $2.9 billion VET FEE-HELP loans in 2015 (Table 5). Under VET FEE-HELP about eighty per cent of loans went for courses with private providers. In contrast only 30 per cent VET Student Loans in 2017 went to private providers. Nine of the top ten providers ranked by loans granted in 2017 were public providers (DET, 2018f)8.
Students in Diploma and higher level programs in government funded education fell 8 per cent in 2017 (NCVER, 2018a). For private providers program enrolments at Diploma and higher levels suffered a heavy fall. They fell in 2017 by over 100,000 or 20 per cent accounting for nearly all the fall in total program enrolments of 5 per cent (NCVER 2018d).
8 The annual expense of these loans is not the amount borrowed but an estimate of the amount that will not be repaid and any interest subsidy (Norton & Cakitaki, 2016). This expense for VET Student Loans is shown to expand substantially in the forward estimates to around $0.3 billion annually (DET, 2018c). This seems too high an estimate given the low total value of loans in 2017.
L H Martin Institute | Changes in funding in Australian vocational education and their effects 8
3. Support for apprentices Trade apprenticeships are the section of vocational training that receives the most public attention. Apprentices and trainees recently made up nearly 25 per cent of publicly funded vocational students with the trade apprentices now the larger proportion at about 15 per cent (NCVER, 2018a&b). Trade apprentices are important in providing workers in skilled trades which have often been in shortage (DJSB, 2018). Most trade apprentices on completion work in the areas for which they trained. In some licensed trades there is industry assessment of training to ensure quality is maintained.
As mentioned above, the Commonwealth has provided incentive payments to the employers of trade apprentices from the early 1970s. These incentives are currently provided to some 57,000 employers. A typical payment, unchanged in nominal terms for more than ten years, is $1,500 as a commencing incentive and $2,500 as a completion incentive.
Some states also provide support to apprentices: NSW for example offers travel concessions, travel and accommodation assistance and a rebate of part of car registration, and employers can get a rebate of payroll tax for a new entrant-trainee and a reduction in workers compensation insurance. No estimate of states’ spending is available. State subsidies to providers of training to apprentices appear to be well above levels for non-apprentice training (Victoria DET, 2018).
The national partnership agreement in 2017, the Skilling Australians Fund, is to operate for five years with a focus on apprenticeships (DET, 2018d). New South Wales has announced it would scrap fees for new apprentices in 2019. It is not clear how much this will affect the number of apprentices rather than diminish the cost to employers and apprentices.
NCVER has undertaken a wide range of studies on apprenticeships and traineeships. Notable findings included:
• “Australia is the only country that pays government incentives and subsidies on a large scale to the employers of apprentices and trainees to offset wage costs (Knight et al, 2011).
• “The government incentives are relatively unimportant for apprenticeships of three to four years duration but are significant for the shorter-duration traineeships” (Karmel & Rice 2010).
• For non-trade traineeships Karmel, Blomberg and Vnuk (2010) found “The evidence for increased skill levels is not, on average, convincing.”
An Expert Panel on Apprenticeships (McDowell, 2011) drew on the NCVER work and suggested a redirection of the funds:
“Australian Government support should focus on occupations that have tangible and enduring value for the economy – both in the traditional trades and the newer forms of apprenticeships and traineeships, such as community services, health services and information technology.” Recommendation 5
“Reinforce the need for a shared responsibility for the Australian Apprenticeships system by establishing an Employer Contribution Scheme in which employer contributions will be matched by the Australian Government. Employers who meet defined benchmarks for training and support of eligible apprentices and trainees would have their contribution rebated, either in part or in full.” Recommendation 6
The Commonwealth government responded mainly to recommendation 5. It left the incentive system in place for trade apprentices. Except for specified priority care occupations, it removed incentives from traineeships for existing workers (those who had been in the job three months or more). This, together with the cutting of state subsidies to training providers for courses deemed to be non-priority areas, had an expected large effect on traineeships (Table 6). The impact was larger on females, who had been the majority in the targeted traineeships. Total Commonwealth outlay on incentives is now around $400 million a year, about half the level at the beginning of the decade. This represents a substantial decline in funds for the vocational sector.
The expert panel’s recommendation for an employer contribution scheme could be given further consideration. However, the changes in the nature of employment and greater effects of technology suggest it is time again to consider the apprenticeship system and the associated training packages. We may need a system where investments in technical skills are augmented by:
L H Martin Institute | Changes in funding in Australian vocational education and their effects 9
“an increased commitment to providing future workers with a broader set of competencies – in areas such as communication, teamwork, and empathy – which remain uniquely human skills, and the foundation for our advantage over even the most sophisticated of machine” (Healy, Nicholson and Gahan, 2017).
Trade support loans and LAFHA A new system of income contingent loans, Trade Support Loans, replaced a previous grant, Tools for Your Trade, in 2014. The loans, which can total $20,000, are spread over four years, the largest sum in the first year. On completion a 20 per cent discount is applied to the amounts borrowed.
These loans are provided to 45,000 trade apprentices each year. The government’s outlay in the early years could be over $200 million. The annual expense to budget (largely the projected non-repayment of loans) is projected to total $65 million annually.
So far little is known of the effects of Trade Support Loans. A review of non-completion of apprenticeships found the major reasons given as “interpersonal difficulties with employers or colleagues, being made redundant, not liking the work and changing careers” (Bednarz, 2014). If these factors are not well addressed it is possible that Trade Support Loans will not have much effect.
There are other forms of support for apprentices for which a total outlay figure is not readily accessible. An important one is the Commonwealth grant of a Living Away From Home allowance (LAFHA), worth up to $4000 in the first year and smaller amounts in the next two years. A research study of incentives found that those paid to employers made little difference to apprentice retention and completion but the LAFHA did show a positive effect on completions (DAE, 2012).
Australian Apprenticeship Support Network (AASN) There is additional support for apprentices. The Australian Apprenticeship Support Network costs $190 million annually: eleven Apprenticeship Network providers deliver support services to employers, apprentices and trainees from around 400 locations, including in rural and remote areas. An evaluation found support for the model system but the possibility of improvements to services and indicators of performance (DET, 2018a).
Summing up support for trade apprentices Trade apprentices are now to receive extra support via the national partnership. They are already supported by incentive grants to employers, by the AASN, by trade support loans and LAFHA, by minor access to the student assistance grants discussed below, by a variety of state support and by a better rate of subsidy to the providers of their training.
This is a considerably higher level of support than other areas of vocational training, a matter that could be subject to review.
4. Student assistance Youth Allowances, Austudy and ABSTUDY are means tested grants for full-time students. They are provided annually to 55,000 vocational students including some apprentices and to about 5,000 indigenous vocational students (DSS, 2017 & 2018). Separate from these allowances are a range of funds, not readily quantified, provided by states and Commonwealth governments for Indigenous persons and persons with disability.
Student assistance appears to be provided to about 20 per cent of the total full-time VET students in eligible course as full-time and about 40 per cent of the full-time Indigenous students. For comparison, in higher education about 200,000 students are assisted, equal to about 30 per cent of full-time domestic undergraduates.9 The relatively low percentage of full-time vocational students receiving student assistance is surprising, as vocational students tend to come from lower socioeconomic backgrounds than higher education students.
In the absence of separate data on student assistance to vocational students, is assumed that they receive on average the same amount as higher education students. This leads to an estimate of approximately $650 million for vocational students and $2,400 million for higher education students (DSS, 2017a).
9 Some postgraduate coursework students also access these grants.
L H Martin Institute | Changes in funding in Australian vocational education and their effects 10
It is hard to find analysis of effectiveness of this assistance. A study for all of tertiary education indicated that students receiving assistance had an improved rate of completion (Karmel, 2014). Financial assistance for higher education students has been subject to some scrutiny (Lee Dow, 2011; Bexley et al., 2012). Bradley et al (2008) had recommended
“That the Australian Government undertake a regular process of triennial review of the income support system to assess the overall effectiveness of the support payments in reducing financial barriers to participation of students in need.”
Data are needed on the vocational students assisted, their characteristics and progress, as a first step in the review. Youth allowance, Austudy and ABSTUDY could be considered along with other forms of support available to indigenous persons and persons with a disability.
5. Support for the national training system The Commonwealth allocates over $80 million to support a range of bodies to underpin the national system including the Australian Industry and Skills Committee (AISC), whose work includes approval of training packages developed by Industry Reference Groups with the support of Skills Services Organisations (SSOs). The Commonwealth also supports the National Centre for Vocational Education Research and its data collections, and the Australian Skills Quality Authority.
6. Programs for access to training Additional Commonwealth government funding is provided for the Adult Migrant English Program and for Skills for Education and Employment which is focussed on job seeker groups with literacy and/or numeracy training needs. These cost $0.4 billion in 2017–201810. The funds are allocated by tender usually to a limited number of providers in each state.
7. Commonwealth funding for labour market programs Youth Jobs PaTH is a major part of a four year Youth Employment Package of over $200 million a year (DJSB, 2017). It is managed by employment services providers. For job applicants who need it, Youth Jobs PaTH firstly prepares (P) them in employability skills and helps them understand the expectations of employers. The training in employability skills is delivered by RTOs. The remaining parts of the program are trial (T) – a subsidised internship – and then hopefully the hire (H) of the applicant. So far there is no information on the extent of the funds directed to vocational providers or the effects of the activity.
8. Domestic fees to public providers from students and employers Fees paid by domestic students to public providers were about 4 per cent of total revenues of government-supported training over a long period, but rose rapidly in share for a few years after 2012 to about 7 per cent or $500 million in 2016. Evaluating student fees raised would need to focus on fairness, the effects on the size and distribution of training, and to take account of loans, concessions and levels of subsidies.
‘Other Fee-For-Service’ including payments by employers rose from 5 per cent in 2002 to about 6.5 per cent and stayed at about that level – much less than predicted in the 1990s (NCVER, 2017c; Shreeve, 2018).
Employers’ spending on training is much larger than the amounts seen to be received by public providers. The Australian Bureau of Statistics undertook several surveys of employer training expenditure and practices up to 2002 (ABS, 2003). The estimated total employer net expenditure on structured training in 2001–2002 of $3.6 billion was about the same as total public expenditure on vocational training at that time. Expenditure was made on in-house training (about a third of total net expenditure was for dedicated trainers) and on external providers especially TAFE and private providers with the latter the more used by larger employers.
These surveys were discontinued because of cost and the difficulty of obtaining good information from employers, who often did not keep records of training. A review of ways of measuring employer expenditure argued the importance of a survey yielding approximate data which could be supplemented with qualitative research (Smith, Burke, Dumbrell & Long, 2008).
Employer expenditure on training can be boosted by training levies on employers. Australia has a number of sectoral levy schemes. An example is the Construction Training Fund. It operates in five states and territories. 10 That part of the expenditure on these programs received by public providers is counted in government recurrent expenditure by the NCVER and the Productivity Commission.
L H Martin Institute | Changes in funding in Australian vocational education and their effects 11
Such schemes have been initiated with industry support but enforced through legislation in the state or territory in which they operate. A levy of approximately 0.2 per cent is paid on the full cost of the building and construction activity. The levy is used primarily to support the training of apprentices and trainees (McDowell, 2011). There is little public evaluation of such schemes.
9. International students’ expenditure International students are a major source of revenue for education. Vocational education received $1.4 billion from onshore international student fees in 2016–2017, well above the level of $0.9 billion in 2012–2013 but lower than the peak level of $1.7 billion in 2009–2010 (Figure 14).
International students also contribute to the economy through their spending on ‘goods and services’, their living expenses. For vocational students these were estimated at $3.4 billion in 2016–2017, much larger than the fee revenues (ABS, 2017c). 11
In 2016 TAFE and other public and community providers delivered about 40 per cent of the hours of training to international vocational students and private providers about 60 per cent (NCVER, 2017f). Public providers reportedly received $210 million from onshore students or less than twenty per cent of the total international fee revenue, less than might be expected from the share of hours delivered (NCVER, 2017c).
The vocational sector received about 12 per cent of the total fee revenues from international students compared with the higher education sector’s 70 per cent (Figures 14 to 16). Vocational education providers also receive some of the fee revenue for English language intensive courses for overseas students (ELICOS) and for non-award courses that may provide entry to higher education and vocational courses.
Students studying outside Australia but with Australian providers are an important source of revenue. Their payments to public vocational providers totalled $68 million in 2016 (NCVER, 2017c). No information is available for private providers.
While the issue of fairness is raised in relation to fees paid by domestic students, it is not mentioned in relation to full-fee international students in vocational education. For higher education a range of problems have been identified by Ziguras (2016). Attention has been drawn to ‘wage theft’, the underpayment suffered by many temporary migrants including students (Berg & Farbenblum, 2017).
Government scholarships such as the Australia Awards are provided for higher education and vocational students, particularly for those from the Pacific Islands (DFAT, 2018). These awards cost over $300 million a year, but funds from these are not discussed further in this chapter.12
10. Other private fees to private providers As mentioned, most of the funds outlaid on VET-FEE-HELP were received by private providers. Of the small total outlay on VET Student Loans in 2017 only about 30 per cent went to private provides (DET, 2018f).
As discussed above private providers may have received fees from international students of over $1 billion in 2016–2017. Other private fee revenues of private providers are not reported. This is in contrast to private schools and private higher education providers. Private (not-for-profit) schools reported fees and other private revenues of $10 billion in 2015 (ACARA, 2017). All private higher education providers are required to submit their revenues and expenditures, and the data are analysed and reported for the major-sub-sectors (TEQSA, 2017a).
Pricing policy, concessions and exemptions, subsidy rates and contracts States provide concession or exemptions from fees for certificate courses. For example, in New South Wales those eligible for concession pay $240 for a course whatever the fee prescribed (which may be up to $2400 for a Certificate III in Automotive Electrical Technology). Full fee exemption is provided for Indigenous persons or 11 Some of this spending is financed through part-time work as well as funds brought from overseas (Birrell & Smith, 2010). Some of the revenue received by providers is spent on recruiting agent fees. Some tertiary institutions, particularly universities, provide accommodation for international students and hence receive part of the expenditure on living expenses 12 . In higher education most international research students are supported from government and university research funds, involving outlays of at least $340 million a year. Some funds are from the surplus on other international students’ fees. Some are from the government’s Research Training Program of over $1 billion annually which limits spending on international research students to 10 per cent of the total allocated (Olsen, 2014; DET, 2016c).
L H Martin Institute | Changes in funding in Australian vocational education and their effects 12
persons who meet disability criteria. Additional allocations are made to providers for special needs students and for students in remote and regional locations. States’ policies vary.
Every state still reserves part of its funds for the public provider. By 2015 Queensland and Victoria had fully deregulated fees, whereas in New South Wales they remained fixed and largely so in other states (Bowman & McKenna, 2016). In 2018, however, Victoria designated twenty non-apprenticeship courses and eighteen apprenticeship courses to be provided without fees in TAFEs in 2019. New South Wales (2018) has announced that fees will not be charged for new apprentices in 2019. Federal Labor has announced it will if elected abolish fees for 100,000 vocational students.13.
Bowman, McKenna and Griffen (2016) considered that:
“Overall, the original concept of a student ‘entitlement’ now sits in some contrast to what has evolved, this being several different ‘managed demand-driven systems’, needing to satisfy industry and jobs demand within constrained public budgets.”
John Ross argues that the changes to subsidies and their elimination from some courses mean that the reforms post-2012 provide an entitlement in name only (Ross. 2018).
Subsidy and fee policies in VET and higher education State subsidy rates for courses vary, with lower rates for courses seen as low priority for the economy and higher rates for priority areas, notably trade apprenticeships. In Victoria the rates for apprentices vary but are often around $13 per hour of training, perhaps 50 per cent higher than for non-apprentice courses (Victoria DET, 2018; NSW DI, 2018). With the extension of VET FEE-HELP from 2012, states reduced their subsidies to courses at diploma and higher, a form of cost-shifting from state to Commonwealth (DET, 2016b). Recent subsidy rates in Victoria for diploma courses are around $6 per hour but with a higher rate for a priority course such as Building and only $2 per hour for a Diploma in Fitness14..
Whereas in vocational education subsidies are highest for courses with the best economic rewards a different approach is taken to subsidies in higher education. There the subsidy is reduced for courses with higher expected earnings, e.g. the subsidy in 2018 for business is $2,100 and a fee of $10,800 and for humanities a subsidy of $5,900 and a fee of $6,400 (DET 2018g)15.) This is seen to be more equitable..
Vocational courses vary considerably in the number of funded hours. The Australian Qualifications Framework (AQF), currently being reviewed, says that the volume of learning of a Diploma is typically 1-2 years. In Victoria a Diploma of Building and Construction (Building) has 2090 payable hours. The Diploma in Business has 500 payable hours (AQF 2013).
The differences in course length, subsidy and fee policies are matters for further consideration in any attempt to align higher education and vocational funding policies. Along with concessions and exemptions the fee and subsidy policies can be assumed to be important for participation by less advantaged persons and for the distribution of training across fields (Figure 10).
Effects of funding changes Funding changes are of major importance to total enrolments, their distribution across equity groups, their distribution by fields and levels of qualification and the extent to which they meet the skill needs of individuals and industry. The changes affect the resources provided and through that the quality of teachers and training.
Some of the effects of funding changes on the total number of students, hours of training provided and on apprenticeships and traineeships have been discussed already. Here consideration is given to some indicators of efficiency, equity and effectiveness – especially quality of education and training, and employment
13 Note that no tuition fees are charged for year 12 courses in government schools, and these courses are ranked at AQF level 3. 14 For example in Victoria a Diploma of Building and Construction (Building) has 2090 payable hours allocated at $7 per hour, the Diploma of Early Childhood Education and Care has 1998 hours at a rate of $6 per hour, a Diploma of Community Health has 1,115 hours and a subsidy rate of $6.50, a Diploma of Fitness has 1110 hours at $2 per hour. A Diploma of Business has 500 hours with a subsidy rate of $4 per hour. 15. A funding review for higher education recommended a subsidy of 60 per cent of cost across all fields but this was rejected by the government on equity grounds (Lomax-Smith et al 2011).
L H Martin Institute | Changes in funding in Australian vocational education and their effects 13
outcomes. Effects of funding are not however easily separated from other influences such as the quality assurance system, the nature of competency-based training, technological change and the relative increase in part-time work.
Efficiency The Productivity Commission uses real government expenditure per hour of publicly funded training as an indicator of efficiency. As discussed above this has tended to fall, is very different across states, and has moved erratically over time (Figure 10). It was 25 per cent lower in 2014 than in 2007. Rather than indicating efficiency has occurred it could reflect the lack of government support for vocational education relative to schools and higher education. Without reference to the output and its quality real spending per hour is a very limited indicator of efficiency.
Equity The decline in total publicly funded vocational students of about 20 per cent from 2012 to 2016 per cent along with population growth meant a fall in participation rates for vocational education (NCVER 2017d). There was also a decline in participation in several equity groups:
• The participation rate of Indigenous people remained twice that for non-Indigenous but fell 2012 to 2015 with a small recovery in 2016.
• The participation rate of persons from remote and very remote areas is much higher than for persons in major cities but it fell in this period.
• The number of persons with a disability remained constant while total VET students declined.
• The numbers from the most disadvantaged quintile fell about the 15 per cent 2012 to 2016, almost the same rate as the fall for all vocational students.
• Female student numbers fell more than male, with the decline in traineeships a particular factor.
• Students aged fifteen to nineteen fell by a larger percentage than total students.
The growth in students in higher education in this period offset some of the fall in vocational education. The expansion in domestic undergraduates in higher education 2012 to 2016 was just over 100,000 compared with a decline in publicly funded vocational students of over 250,000 students16. Equity groups in higher education improved their share in the growing student numbers 2012 to 2016 (DET, 2017c).
Vocational education, however, remains the major destination for disadvantaged students. In 2016 in government funded VET there were 84,000 Indigenous students, 114,000 with a disability and over 300,000 from the lowest quintile of SES (socioeconomic background). Among undergraduates in higher education there were 13,000 indigenous students, 50,000 with a disability and around 140,000 in the lowest SES quartile (NCVER, 2017d &e; DET, 2017c). For the total vocational sector there are much higher number of students in the less advantaged categories.17
The cessation in 2018 of demand-driven funding of higher education could curtail equity in universities and could reduce enrolments across tertiary education as a whole (Noonan & Pilcher 2018).
Effectiveness The level of satisfaction of students and employers is an indicator of effectiveness. For graduates and subject completers in vocational education, overall satisfaction has changed very little over time, remaining at about 85 per cent satisfied. It is similar across provider types (NCVER, 2017e).
The proportion of employers satisfied with all forms of training they ‘engaged with’ declined from nearly 78 per cent in 2009 to a little over 71 per cent in 2017 (NCVER, 2017b).
Course completion rates are a measure of training effectiveness. The rate has increased substantially in recent years and the increase was greater with non-TAFE providers (NCVER, 2017h). This was however the period of 16 2012 was an atypical high year for vocational education because of the temporary expansion in students in VET in Victoria. 17 For Total VET for 2016 an estimated 170,000 Indigenous students, 180,000 student with a disability and 777,000 in the lowest quintile of SES (NCVER 2017f).
L H Martin Institute | Changes in funding in Australian vocational education and their effects 14
rapid expansion students with private providers and concerns about the standards achieved by their graduates.
Labour market outcomes are key objectives of the vocational system. Skill shortages are often cited in policies for vocational education and especially for trade apprentices. Skill shortages are often not as pervasive as in popular reports (Shah & Burke, 2005). Skill shortages exist where employers are unable to fill or have considerable difficulty filling a position. The list of shortages compiled by the Department of Jobs and Small Business shows several trades in shortage in recent years but only four, automotive electricians, motor mechanics, sheetmetal workers and arborists were reported in shortage every year from 2010 to 2017 (DJSB, 2017b).
Young vocational graduates are in a labour market where unemployment and underemployment rates and the proportion in part-time work have grown in the past ten years (Dhillon & Cassidy, 2018). Newly graduating apprentices can face competition from skilled migrants (DI, 2018). Less skilled workers may face some competition from temporary migrants including international students, who in total contribute about 10 per cent to the 15 to 24 year olds in the labour force (Dhillon & Cassidy, 2018).
In this context it is not surprising that the outcomes of vocational graduates have declined in recent years. In 2008, 68 per cent of vocational graduates reported improved employment outcomes after training, but 56 per cent in 2017. The proportion of vocational graduates employed in May following completion fell from 82 per cent in 2008 to 74 per cent in 2017. The proportion progressing to further studies has also fallen, from 36 per cent in 2008 to 30 per cent in 2017. However, the employment outcomes for university graduates also deteriorated, with the proportion employed falling by about the same percentage as for vocational graduates (NCVER, 2017e; QILT, 2018).
Of particular concern is that while 70 per cent of persons completing trade apprenticeships work in their area of training, for vocational graduates as a whole only 30 per cent obtain work in the occupation group for which they trained. Another 30 per cent who are employed in an occupation different to their training area indicate that their training is relevant to their job. These matters were the subject of an important article, ‘Is VET vocational?’ (Karmel, Mlotkowski & Awodeyi, 2008; see also Wibrow, 2014). Key messages which still apply ten years on are:
• With the exception of the trades, there is no neat match between courses and the occupations in which most people end up working.
• Those developing training packages need to be aware that many graduates will not work in their intended occupation.
These findings on the low match of training area to the job entered and the recent growth of part-time employment for young people add weight to the case for vocational education to develop the capacity to enter and learn in a range of employments.
Aspects of quality Quality has been a major issue for many years. As discussed above, this was highlighted with traineeships from the turn of the century, the rorting in delivery to international students, the experiences were in Victoria, especially in 2011–2012, and Australia-wide with VET FEE-HELP in 2013–2016. What proportion of training is still a little or a lot below the required standard remains a major concern but cannot be estimated. Four issues are considered here.
External assessment Possibly the biggest issue for quality is whether students assessed by a provider as meeting standards for a qualification have actually done so. The requirements in relation to independent validation of the process of assessment have been lifted. But this concerns the process, not the assurance that any group of students have met the required standard.
In some of the licensed trades assessment is undertaken by the industry. For example, in Victoria, to be recognised as a plumber you must pass the plumbing licence exam conducted by the Victorian Building Authority. But other than in licensed occupations it is nearly always the provider that carries out the assessment of students.
L H Martin Institute | Changes in funding in Australian vocational education and their effects 15
The Australian government discussion paper on quality of assessment canvassed a range of external forms of assessment (DET, 2016a). Responses to this paper were considered by the government’s Training and Assessment Working Group. The following comment indicates a divide in opinion on external testing.
“The majority of respondents indicated that industry endorsed, externally administered tests are not viable as this undermines competency-based training and would rely on a level of industry engagement that is often difficult to achieve. It was noted by some respondents that externally administered tests are important and are already in place in some circumstances for licencing purposes or high risk qualifications”. (TAWG, 2016)
An OECD Review of Australian VET (Hoeckel et al 2008) had drawn attention to practice in other countries and that exit examinations could be used with competency based teaching—as they are for plumbers here.
“National exit examinations are used in countries that maintain a relatively centralised system of qualifications in VET such as Japan and Korea. Several less centralised countries with competence-based training also require national or external exit tests to obtain a VET qualification (Hoeckel 2008).
One objection to external testing is the cost. Gillis et al. (2015) noted that:
“such costs would be significantly less than the collective costs associated with nearly 5000 providers duplicating human and financial resources to design, administer and validate their own assessments at the local level and then for the national regulatory body to monitor such RTO based assessments”.
It seems likely that where good performance was demonstrated in external tests a provider might be exempted from some other aspects of regulation, offsetting some of the costs.
There is movement in the direction of external assessment. The Productivity Commission (2017) suggested:
“The Australian Government, in conjunction with employers, the Industry and Skills Committee and the Australian Skills Quality Authority, should investigate areas of vocational education and training where an independent certification model could robustly test a person’s skills.”
The recent review of the VET Regulator Act includes a recommendation for a teacher position called Master Assessor, whose role includes providing:
…”a service in what is essentially external assessment for high risk VET industries in the sector. ASQA can interrogate an RTO’s success in delivering desirable student outcomes through engaging the services of a Master Assessor” (Braithwaite, 2018).
Cost cutting As mentioned above, the long-term decline in total funding and funding per hour of training may affect quality. It may be a major cause of provision of courses in an unduly short time, with TAFEs as well as private providers cited for this (ASQA, 2017). A review is under way.
Cuts in funding may also be a stimulus to online teaching, which can be effective or be just cost cutting--the review of VET FEE-HELP noted that 45 per cent of courses were delivered on line, often with very low completion rates (DET, 2016b p. 22).
Quality of staff Cuts to funding tend to promote the use of part time or casual staff, costing less than full-time ongoing staff. The most recent review of the TAFE workforce was by the Productivity Commission (2011) which had quite limited data. It found that the proportion of vocational education staff working part-time or as casuals was higher than for the whole workforce. The qualifications required for vocational teachers have been strengthened but remain fairly low, and the number of teachers their employment status and qualifications is not known. The extent of professional development is again not known but believed to be inadequate especially for casual teachers.
The importance of these issues is considered in the paper by Guthrie and Jones (2018). It is good news to hear that NCVER is undertaking a survey of the current VET workforce on behalf of the Commonwealth Department of Education and Training that may in 2019 provide much of the missing data.
L H Martin Institute | Changes in funding in Australian vocational education and their effects 16
Training for a specific qualification or related occupations A higher-level question about quality relates to training packages where a qualification relates to the competencies identified for a particular occupation. Are they appropriate when the proportion of graduates employed in their training area is so low as discussed above? Instead consideration could be given to education for related occupations, vocational streams. This is discussed in a range of authoritative papers by Wheelahan, Buchanan and Wu (2015) and in the papers by Hodge (2018) and Jones (2018) in this collection. More consideration can be given to the role of vocational education in developing citizens who can fully participate in the community, a matter often raised in relation to schools and higher education.
Concluding comment Issues for further consideration have been are raised in the paper. It is important to acknowledge that the data presented are fairly aggregated. The paper does not provide analysis for a wide range of matters such as vocational education in schools, the role of adult and community education, the role of group training companies, the uses of different course levels including those for and literacy and numeracy.
Based on the matters discussed in the paper and in other papers in this series four areas are raised here for consideration in policy and research.
More comprehensive analysis of funding This paper indicates a need for more comprehensive evaluation of the total public and private funding of vocational education. Particular issues include18:
• Effectiveness of means tested grants such as Youth Allowance, Austudy and ABSTUDY; data are needed on students assisted, their characteristics and progress.
• The level of support for trade apprentices versus non-apprenticeship training taking account of: the new national partnership; incentive grants to employers, the AASN, trade support loans, LAFHA, student assistance grants, state government support to employers and apprentices; higher rates of subsidy for trade apprentice courses.
• Analysis of subsidies and fees by levels of education and fields of education taking account of concessions and exemptions and the availability of loans.
• Implications of course subsidy policies in vocational education compared with higher education — the higher rate of subsidy in vocational education for courses seen as high priority for the economy and a lower rate of subsidy in higher education for courses with better earnings prospects.
Improved governance for stable and efficient funding The past decade in particular has seen a decline in government funding and the erratic changes among the states and shifting of shares of funding from states to Commonwealth. There was an extraordinary expansion in the funding to private providers and now some contraction.
It is hard to be optimistic, given that policy has often been arbitrary, poorly developed and badly implemented (Shreeve and Palser, 2018). This may be due in part to the lack of staff in government departments with knowledge and experience of vocational education, its relationships to schools and higher education and its functions in providing education and training for all, to benefit the economy and society. Use of consultants rather than building departmental capacity may have contributed to this. John Hewson (2018) has pointed to the need to restore the talent in government departments that had been eroded over the years so that “many departments are now referred to as gutted shells”.
It has been obvious for a long time that Commonwealth and State responsibilities need to be reformed. The Bradley committee‘s recommendations included:
• that all governments agree to establish a single ministerial council with responsibility for all tertiary education and training;
18 Some further suggestions are in Table 11.
L H Martin Institute | Changes in funding in Australian vocational education and their effects 17
• that the Australian Government negotiate with the states and territories to introduce a tertiary entitlement funding model across higher education and vocational education and training (VET) commencing with the upper levels of VET (diplomas and advanced diplomas) and progressing to the other levels as soon as practicable, to ensure that student choices are not distorted by different levels of public subsidy for similar education and training depending on the sector in which it is delivered. (Bradley et al 2008).
If these proposals had been implemented much of the current variations in funding across the states might have been justified or eliminated. If vocational education had been considered in the same political process as higher education the funding decline might have stopped. The extent of differential funding of vocational and higher education diplomas and advanced diplomas could have been addressed.
Recently the Business Council of Australia proposed a national framework where subsidies to providers would be drawn from a Lifelong Skills Account and a continuing system of income-contingent loans (BCA. 2017). The BCA recommended development of a single platform of market information to compile new data and make existing data accessible.
Noonan (2016) and Croucher, Noonan and Chew (2017) consider relevant issues. Croucher et al stress that governments need to agree on the aims for financing, regulation and incentives before considering the financial arrangements. They saw the need for an expert advisory body. Such a body would be needed whatever new structure of Commonwealth and state relations is established.
Quality and external assessment The declining rate of funding, the sharp cuts in in allocation to TAFEs and the expansion to for profit providers contributed to the concern with quality. Factors signalling poor quality included:
• delivery of courses in unduly short time and excessive use of on-line delivery and assessment
• the extraordinary expansions and contractions in the quantity of delivery
• increased instability in staffing and the casualisation of teachers.
A repeated claim is that providers have awarded a qualification to graduates who have received little or no training. On the other hand in several licensed trades external assessment is carried out, as it is in many other countries.
There would be confidence that graduates had achieved the standards required if external assessment was the norm. It seems that support for this is growing. Substantial work is needed on how it could be done and how its considerable cost might be offset by reductions in other forms of quality control.
The public provider, effectiveness and equity The case for the redevelopment of the TAFE system includes the need for large institutions for:
• delivery in critical areas, with stable and experienced staffing
• likelihood of and capacity for more internal quality control
• a prime role with trade apprenticeships and the integration of education with industry
• greater integration with the local community
• coverage of regional and remote areas
• adult literacy and numeracy
• overall support for the less advantaged including early leavers
• ongoing links with schools and universities and community providers (Mackenzie, 2016; Skills Australia’ 2011).
A revival of TAFE does not mean it will be costly and unresponsive. Competition can continue with strong public providers. Arguably in the last twenty five years the large Victorian TAFEs, which had considerable autonomy, were more entrepreneurial and responsive than TAFEs in states with more centralised arrangements. They were competitive in ways that were more usual in the universities.
L H Martin Institute | Changes in funding in Australian vocational education and their effects 18
Autonomy must be put in context. Tucker (2018b) argues this in relation to the top-performing school system in Finland. A coherent state and national policy framework should underpin relatively autonomous education institutions and professionals and avoid setting oversimplified performance targets that can distort behaviour (Gittens, 2018).
The findings of the recent report for UNIVERSITAS 21 by the Melbourne Institute on rankings of higher education systems may have relevance. Countries were graded on four modules, resources, output, connectivity and environment. Australia, where not-for-profit universities dominate the system, came tenth of fifty countries in the overall rankings but it was second to the US on environment:
A well-designed policy environment is needed to ensure that resources are used well. A consensus is emerging that the preferred environment is one where institutions are allowed considerable autonomy tempered by external monitoring and competition (Williams & Leahy, 2018).
L H Martin Institute | Changes in funding in Australian vocational education and their effects 19
References Allen Consulting Group (2010). Mid-Term Review of the National Partnership Agreement for the Productivity
Places Program. Melbourne: Allen Consulting
Anderson, D (2006). Trading places: The impact and outcomes of market reform in vocational education and training, Supporting Document Adelaide: NCVER.
Australian Bureau of Statistic (ABS) (2003). Employer Training Expenditure and Practices 2001-02 6362.0. Canberra: ABS.
ABS (2013). Population Projections, Australia, 3222. Canberra: ABS.
ABS (2017a). Education and Work 2017, 6227.0. Canberra: ABS.
ABS (2017b). Government Finance Statistics, Education, Australia, 2015-16, 5518.0.55.001. Canberra: ABS.
ABS (2017c). International Trade: Supplementary Information, 2016-17, 5368.0.55.004. Canberra: ABS.
Australian Curriculum and Reporting Authority (ACARA) (2017). National Report on Schooling in Australia 2015. Sydney: ACARA.
Australian National Training Authority (ANTA) 1994. Towards a Skilled Australia, a national strategy for Vocational Education and Training. Brisbane: ANTA.
Australian Qualifications Framework Council (AQFC) 2013. Australian Qualifications Framework, Second Edition. Adelaide: AQFC.
Australian Skills Quality Authority (ASQA) (2015). Fact sheet: conducting validation. Melbourne: ASQA.
ASQA (2016). Fact sheets. Melbourne: ASQA.
ASQA (2017). A review of issues relating to unduly short training. Melbourne: ASQA.
ASQA (2018). About RTOs. Melbourne: ASQA. Retrieved 18 June 2018 from www.asqa.gov.au/about/australias-vet-sector/about-rtos.
Baird B (2010). Stronger, simpler, smarter ESOS: supporting international students. Canberra: Department of Education and Training.
Bednarz A (2014). Understanding the non-completion of apprentices. Adelaide: NCVER.
Berg L & Farbenblum B (2017). Wage theft in Australia, Findings of the National Temporary Migrant Work Survey. Sydney: Migrant Worker Justice Initiative.
Bexley E, Daroesman S, Arkoudis S & James, R (2013). University student finances. Canberra: Universities Australia.
Birrell B & Smith T (2010). ‘Export earnings from the overseas student industry: how much?’ Australian Universities Review. vol. 52, no. 1, 2010.
Bowman K & McKenna S (2016). Jurisdictional approaches to student training entitlements: commonalities and differences. Adelaide: NCVER.
Bowman K, McKenna S & Griffen T (2016). Balancing consistency and flexibility in student training entitlements: Research Overview. Adelaide: NCVER.
Bradley, D, Noonan, P, Nugent, H & Scales, B (2008). Review of Australian higher education. Canberra: DEEWR.
Braithwaite V (2018). All eyes on quality: Review of the National Vocational Education and Training Regulator Act 2011 report. Canberra: DET.
Burke G, Harrold R & McKenzie P (2001). An evaluation of education and training financial statistics, Report to ABS. Retrieved from www.researchgate.net/publication/238050940.
Burke G & White P (2003).Price measures in education and training. Working Paper 53, CEET, Melbourne: Monash University.
Burke, G (2016). Data on total investment in VET: what should be collected. Adelaide: NCVER.
L H Martin Institute | Changes in funding in Australian vocational education and their effects 20
Business Council of Australia (BCA) 2017). Future-proof, protecting Australians through education and skills. Melbourne: BCA.
Council of Australian Governments (COAG) (2008). National agreement for Skills and Workforce Development. Canberra: COAG.
COAG (2012). National Partnership Agreement on Skills Reform. Canberra: COAG
Croucher G, Noonan P & Chew J (2017). ‘Funding an Expanded Tertiary System: Designing a coherent financing architecture’, Visions for Australian Tertiary Education, James R, French S & Kelly P (eds). Centre for the Study of Higher Education, University of Melbourne.
Deloitte Access Economics (DAE) (2012). Econometric Analysis of the Australian Apprenticeships Incentives Program. DAE.
Department of Education and Training (DET) (2016a). Quality of assessment in vocational education and training – Discussion Paper. Canberra: DET.
DET (2016b). Redesigning VET FEE-HELP: Discussion Paper. Canberra: DET.
DET (2016c). Research Snapshot: Australian scholarships and support for international students. Canberra: DET.
DET (2017a). Addressing issues relating to unduly short courses – discussion paper December 2017. Canberra: DET.
DET (2017b). Annual Report 2016-17 Appendix 2. Canberra: DET.
DET (2017c). Higher Education Statistics. Canberra: DET.
DET (2017d). 2016 VET FEE-HELP Statistical Report. Canberra: DET.
DET (2017e). VET Student Loans Six-monthly report – 1 January to 30 June 2017. Canberra: DET.
DET (2018a). Australian Apprenticeship Support Network (AASN): Evaluation of the AASN Model. Canberra: DET.
DET (2018b). International student data, monthly summary January–December 2017. Canberra: DET.
DET (2018c). Portfolio Budget Statements 2018–19. Canberra: DET.
DET (2018d). Skilling Australians Fund Fact Sheet. Canberra: DET.
DET (2018e). Time Series – International Student Enrolments in Australia 1994–2017. Canberra: DET.
DET (2018f). VET Student Loans, Six-monthly report- 1 July to 31 December 2017. Canberra: DET.
DET (2018g). Allocation of units of study to funding clusters and student contribution bands according to field of education codes 2018. Canberra: DET.
Department of Foreign Affairs and Trade (2018). Australia Awards. Retrieved 17 May 2018 from dfat.gov.au/people-to-people/australia-awards/Pages/australia-awards-scholarships.aspx.
Department of Immigration (DI) (2018). Migration IMMI 18/051: Specification of Occupations and Assessing Authorities Instrument 2018. Canberra: DI.
Department of Jobs and Small Business (DJSB) (2017). Portfolio Budget Statements 2016–17. Canberra: DJSB.
DJSB (2016). Indicative Department of Employment Skill Shortage Ratings – 1986 to 2015. Canberra: DJSB.
DJSB (2017). Skill Shortage List Australia. Canberra: DJSB.
Department of Social Services (DSS) (2017a). Portfolio Budgets Statements 2017–18. Canberra: DSS.
DSS (2017b). Annual Report 2016-17. Canberra: DSS.
DSS (2018). Portfolio Budgets Statements 2018-19. Canberra: DSS.
Gillis S, Rice, S & Bateman A (2015). External Assessment for High Risk Qualifications: International Approaches and Implications for Australia. Melbourne: University of Melbourne.
L H Martin Institute | Changes in funding in Australian vocational education and their effects 21
Gittens R, (2018). ’There's a smarter way to encourage better staff performance’, Sydney Morning Herald, July 11.
Glanville B (2018). ‘TAFE fees scrapped for some apprentices to help combat the NSW skills shortage.’ ABC News, 18 June 2018.
Grattan Institute (2016). Orange Book 2016, Priorities for the next Commonwealth Government. Melbourne: Grattan Institute.
Guthrie H & Jones A (2018). How can VET teacher education and development be improved? L H Martin Institute, University of Melbourne.
Healy J, Nicholson D & Gahan P (2017). The Future of Work in Australia: Anticipating how new technologies will reshape labour markets, occupations and skill requirements (University of Melbourne). Sydney: NSW DET.
Hewson J (2018). ‘All aboard the latest gravy train’, The Age, 24 May 2018.
Hippach-Schneider U & Huismann A (2016). Germany VET in Europe, 2016 Country Report. Thessaloniki: CEDEFOP.
Hodge 2018, The problematic role of CBT in Australian VET. Melbourne: L H Martin Institute, University of Melbourne.
Hoeckel K, Field S, Justesen T & Kim M (2008). Learning for Jobs, OECD Reviews of Vocational Education and Training Australia. Paris: OECD.
Jones A (2018). Vocational education for the twenty first century. Melbourne: L H Martin Institute, University of Melbourne.
Karmel T, Mlotkowski P & Awodeyi T (2008). Is VET vocational? The relevance of training to the occupations of vocational education and training graduates. Adelaide: NCVER.
Karmel T, Blomberg D & Vnuk M (2010). The effectiveness of the traineeship model, Adelaide: NCVER.
Karmel T & Rice J (2010). The Economics of Apprenticeships. Adelaide: NCVER.
Keating M (2017). ‘Should VET be contestable?’ Pearls and Irritations, 16 October 2017 retrieved from johnmenadue.com, 27 February 2018.
Karmel T (2013). Student income support and education and training participation in Australia, Overview. Adelaide: NCVER.
Kirby P (1985). Report of the Committee of Inquiry into Labour Market Programs. Canberra: Australian Government Publishing Service, 1985.
Knight B, Karmel T & Guthrie H (2011). ‘The efficiency of the apprenticeship and traineeship system’, NCVER Report 2 Overview of apprenticeship and traineeship institutional structures. Adelaide: NCVER.
Korbel P & Misko J (2016). VET provider market structures: history, growth and change. Adelaide: NCVER.
Lomax-Smith J (Chair),Watson L & Webster B (2011). Higher education Base Funding Review. Canberra: Department of Education, Employment and Workplace Relations.
Mackenzie B (Chair) (2015). Final Report of the VET Funding Review. Melbourne: DET.
Mackenzie B (2016). ‘Taking hard VET lessons into a smarter future’, The Australian TAFE Teacher, Autumn.
McDowell, J (Chair) (2011). Apprenticeships for the 21st Century: Expert Panel Paper 2011. Canberra: Department of Industry.
Moran T (2017) IPAA Victoria Fellows’ Oration, ‘Back in the Game’. Retrieved from //cpd.org.au/wp-content/uploads/2017/11/Terry-Moran-AC-IPAA-Victoria-Oration-21-November-2017.pdf.
National Centre for Vocational Education Research (NCVER) (2017a). Apprentices and trainees 2016. Adelaide: NCVER.
NCVER (2017b). Employers’ uses and views of the VET system (2017a). Adelaide: NCVER.
NCVER (2017c). Financial Information 2016. Adelaide: NCVER.
L H Martin Institute | Changes in funding in Australian vocational education and their effects 22
NCVER (2017d). Government funded students and courses 2016. Adelaide: NCVER.
NCVER (2017e). Total VET graduate outcomes 2017. Adelaide: NCVER.
NCVER (2017f). Total VET Students and Courses 2016. Adelaide: NCVER.
NCVER 2017(2017g). VET in schools 2017.). Adelaide: NCVER.
NCVER (2017h). VET program completion rates 2011–15. Adelaide: NCVER.
NCVER (2017i). Young people in education and training. Adelaide: NCVER.
NCVER (2018a), Government-funded students and courses 2017. Adelaide: NCVER.
NCVER (2018b), Historical Time Series Apprentice and Trainee Statistics. Adelaide: NCVER.
NCVER (2018c), VOCSTATS <http://www.ncver.edu.au/resources/vocstats.html>
NCVER (2017d). Total VET Students and Courses 2016. Adelaide: NCVER.
New South Wales Department of Industry (NSW DI) (2018). Smart and Skilled Prices and Fees – v7.1.
Noonan, P. (2016). A New system for financing Australian tertiary education. Melbourne: Mitchell Institute.
Noonan P & Pilcher S (2018). Participation in tertiary education in Australia: Modelling and scenario analysis. Melbourne: Mitchell Institute.
Norton A & Cakitaki, B (2016). Mapping Australian higher education 2016. Grattan Institute.
Olsen A (2014). 2014 Research agenda, Australian Universities international Directors’ Forum, Presentation to the Australian International Education Conference. Retrieved from www.spre.com.au/download/AIEC2014AUIDFResearchPaper.pdf, 20 July 2018
Pilcher S & Torii K (2017). Expenditure on education and training in Australia: Update and analysis, Mitchell Institute policy paper No. 05/2017. Melbourne: Mitchell Institute.
Productivity Commission (2011). Vocational Education and Training Workforce, Research Report. Canberra: Productivity Commission.
Productivity Commission (2017). Shifting the Dial: 5 year productivity review. Canberra: Productivity Commission.
Productivity Commission (2018). Review of Government Services 2018. Canberra: Productivity Commission.
Quality Indicators for Learning and Teaching (QILT) (2018). Graduate Outcomes Survey 2017.
QILT (2018). 2017 Student Experience Survey, National Report. Melbourne: The Social Research Centre
Ross J (2018). ‘Can vocational education make a comeback? Times Higher Education, 14 June 2018.
Saccaro F and Hall R 2018, VET FEE-HELP – What went wrong? Melbourne: L H Martin Institute, University of Melbourne.
Schofield, Kaye (1999). Independent Investigation into the Quality of Training in Queensland's Traineeship System Final Report. Department of Employment, Training and Industrial Relations, Brisbane.
Shah C. & G. Burke G (2005). Skills Shortages: Concepts, Measurement and Policy Responses, Australian Bulletin of Labour, vol. 31, no. 1, 44.
Shreeve R (2018). A fifty percent self-funded TAFE system, the Scott and Deveson Reports twenty-eight years on. Retrieved from www.linkedin.com/pulse/fifty-percent-self-funded-tafe-system-scott-deveson-reports-shreeve/ 20 July 2018.
Shreeve R and Palser J (2018). The NSW response – 1990s-2017. Melbourne: L H Martin Institute, University of Melbourne.
Skills Australia (2011). Skills for prosperity, A roadmap for vocational education and training, Canberra: Skills Australia.
Smith A, Burke, G, Dumbrell T & Long M (2008). Approaches to measuring and understanding employer training expenditure. Adelaide: NCVER.
L H Martin Institute | Changes in funding in Australian vocational education and their effects 23
Smith, E (2010). A review of twenty years of competency-based training in the Australian vocational education and training system, International Journal of Training and Development, vol. 14, 44-54.
Tertiary Education Quality and Standards Agency (TEQSA) (2017a). Key financial metrics on Australia’s higher education sector. Melbourne: TEQSA.
TEQSA (2017b). Statistics Report on TEQSA Registered Higher Education Providers – May. Melbourne: TEQSA.
Training and Assessment Working Group (TAWG) 2016). Improving the quality of assessment in vocational education and training. Canberra: DET.
Tucker M (2018a). Learning from the nursing profession in the new teacher strike era, Education Week 20 April 2018.
Tucker M (2018b). School Autonomy Isn’t The Cure-All You Might Think It Is, NCEE and Education Week 8 June. Retrieved 13 July 2018 from //ncee.org/2018/06/school-autonomy-isnt-the-cure-all-you-might-think-it-is/
Treasury (2018). Budget Strategy and Outlook, Budget Paper No. 1, 2018-19. Canberra: Treasury.
Treasury (2018). Federal Financial Relations Budget Paper No. 3, 2018–19. Canberra: Treasury.
Victoria Department of Education and Training (Victoria DET) (2008). Securing Jobs for Your Future, Skills for Victoria (August). Accessed 13 July 2018 //www.voced.edu.au/content/ngv%3A31982
Victoria DET (2018). Skills First – 2018 funded course list and subsidies. Melbourne: Department of Education and Training.
Warburton M (2016). The VET FEE-HELP debacle: Helping its victims and lessons for administration. LH Martin Institute, University of Melbourne.
Wheelahan L, Buchanan J & Yu S (2015). Linking qualifications and the labour market through capabilities and vocational streams. Adelaide: NCVER.
Wheelahan L (2016). ‘Patching bits won’t fix vocational education in Australia –a new model is needed’, International Journal of Training Research 3.
Wibrow B (2014). Qualification utilisation: occupational outcomes – overview. Adelaide: NCVER.
Williams R & Leahy A (2018). U21 Ranking of National Higher Education Systems. Birmingham: UNIVERSITAS.21.
Ziguras C (2016). ‘And fairness for all? Equity and the international student cohort’, Student Equity in Australian Higher Education, Harvey A et al. (eds). Singapore: Springer.
L H Martin Institute | Changes in funding in Australian vocational education and their effects 24
Appendix: Tables and Figures
Tables
Table 1 Approximate funds received for vocational education by providers, students and employers 2017 ($billion ...................................................................................................................................................... 33
Table 2 Publicly funded hours per student by provider type, Australia 2003 to 2016 ......................................... 33
Table 3 Total students and hours of delivery by provider type, Australia 2016 ................................................... 33
Table 4 Total and publicly funded vocational students by provider type, Australia 2016 (‘000) ......................... 34
Table 5 Students assisted and outlays on VET FEE-HELP, Australia, 2009 to 2016 ($billion) .............................. 34
Table 6 Apprentices and trainees in-training at 30 June by occupation (trade/non-trade), 1995–2017 ............. 35
Table 7 Trade and non-trade apprentice and trainee commencements 2012–16 (’000) .................................... 35
Table 8 Publicly funded VET students by age, Australia 2003 to 2016 ('000) ....................................................... 36
Table 9 Proportion of employers satisfied with all forms of VET, Australia 2009 to 2017 ................................... 36
Table 10 Vocational and university graduates, Australia 2008 to 2017, percentage employed .......................... 37
Table 11 Some data and research issues ............................................................................................................. 38
Figures
Figure 1: Government-funded vocational students by main provider type, Australia, 2003–2016 ('000) ........... 25
Figure 2: Government-funded vocational education, students, larger states, 2003–2016 ('000) ....................... 25
Figure 3: Government-funded vocational education, hours of training by main provider type, Australia, 2003–2016 (million) ............................................................................................................................................ 26
Figure 4: Government-funded training, hours of training, Australia and larger states, 2007–2016 (million) ...... 26
Figure 5: Public Expenditure on education plus the private revenue of public institutions, Australia, 2001–2002 to 2015–2016, ($billion) (2015–2016 dollars) ........................................................................................... 27
Figure 6: Public expenditure by sector, Australia, 2001–2002 to 2015–2016 ($billion) (2015–2016 dollars)...... 27
Figure 7 VET total operating expenditures, and revenues from States, Commonwealth and ‘Sales’, 2001-02 to 2015-16, Australia, ($billion), (2015-16 dollars) ........................................................................................ 28
Figure 8 Government expenditure on VET, Australia and large states, 2002 to 2016 $ billion (2016 dollars) ..... 28
Figure 9 Government expenditure on VET 2002-16, WA, SA and Tasmania, $ billion (2016 dollars) .................. 29
Figure 10 Government recurrent expenditure per hour of training, Australia, NSW and Vic, 2002 to 2016 (2016 dollars) ....................................................................................................................................................... 29
Figure 11 Publicly funded vocational students by main field of education, Victoria 2003 to 2016, ('000) .......... 30
Figure 12 Government payments to non-TAFE providers, larger states, 2007 to 2016, ($m) (2016 dollars)....... 30
Figure 13 Government payments to non-TAFE providers as a proportion of total government expenditure, Australia and larger states, 2007 to 2016.................................................................................................. 31
Figure 14 International onshore students fee revenue by sectors 2000-01 to 2016-17, Australia ($billion) nominal prices ........................................................................................................................................... 31
Figure 15 International onshore enrolments by sector, Australia, 2001 to 2016 (‘000) ...................................... 32
Figure 16 Approximate fee revenue per international enrolment by sector, Australia, 2002-03 to 2016-17, ($'000) nominal prices ............................................................................................................................... 32

L H Martin Institute | Changes in funding in Australian vocational education and their effects 25
Figure 1: Government-funded vocational students by main provider type, Australia, 2003–2016 ('000)
Source: NCVER (2018c)
Note: Government-funded students include l students for whom the provider is subsidised directly. This does not include students who are fully fee for service even where supported by a government student loan.
Figure 2: Government-funded vocational education, students, larger states, 2003–2016 ('000)
Source: NCVER (2018c)
Note: As for Figure 1
1266 1244
1543
1266
905 877 882
660
170283
567
570532
190116 79 730
200
400
600
800
1000
1200
1400
1600
1800
2003 2004 2005 2006 2007 2008 2009 2010 2011 2012 2013 2014 2015 2016
Total
TAFE andother public
Private andother
Adult andcommunity
483
329
454
322306
494
338
196
254
216
110 119
89
150
71
0
100
200
300
400
500
600
2003 2004 2005 2006 2007 2008 2009 2010 2011 2012 2013 2014 2015 2016
NSW
Vic.
Qld
WA
SA
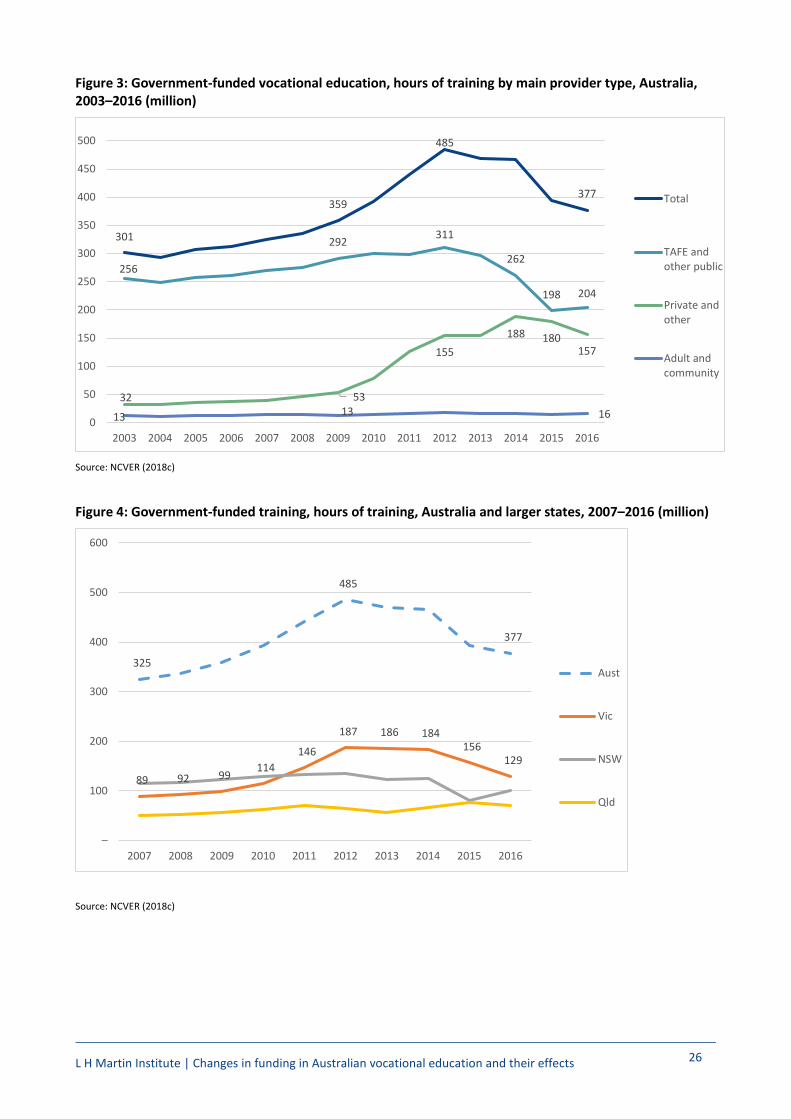
L H Martin Institute | Changes in funding in Australian vocational education and their effects 26
Figure 3: Government-funded vocational education, hours of training by main provider type, Australia, 2003–2016 (million)
Source: NCVER (2018c)
Figure 4: Government-funded training, hours of training, Australia and larger states, 2007–2016 (million)
Source: NCVER (2018c)
301
359
485
377
256
292 311
262
198 204
32 53
155188 180
157
13 13 160
50
100
150
200
250
300
350
400
450
500
2003 2004 2005 2006 2007 2008 2009 2010 2011 2012 2013 2014 2015 2016
Total
TAFE andother public
Private andother
Adult andcommunity
325
485
377
89 92 99114
146
187 186 184156
129
–
100
200
300
400
500
600
2007 2008 2009 2010 2011 2012 2013 2014 2015 2016
Aust
Vic
NSW
Qld
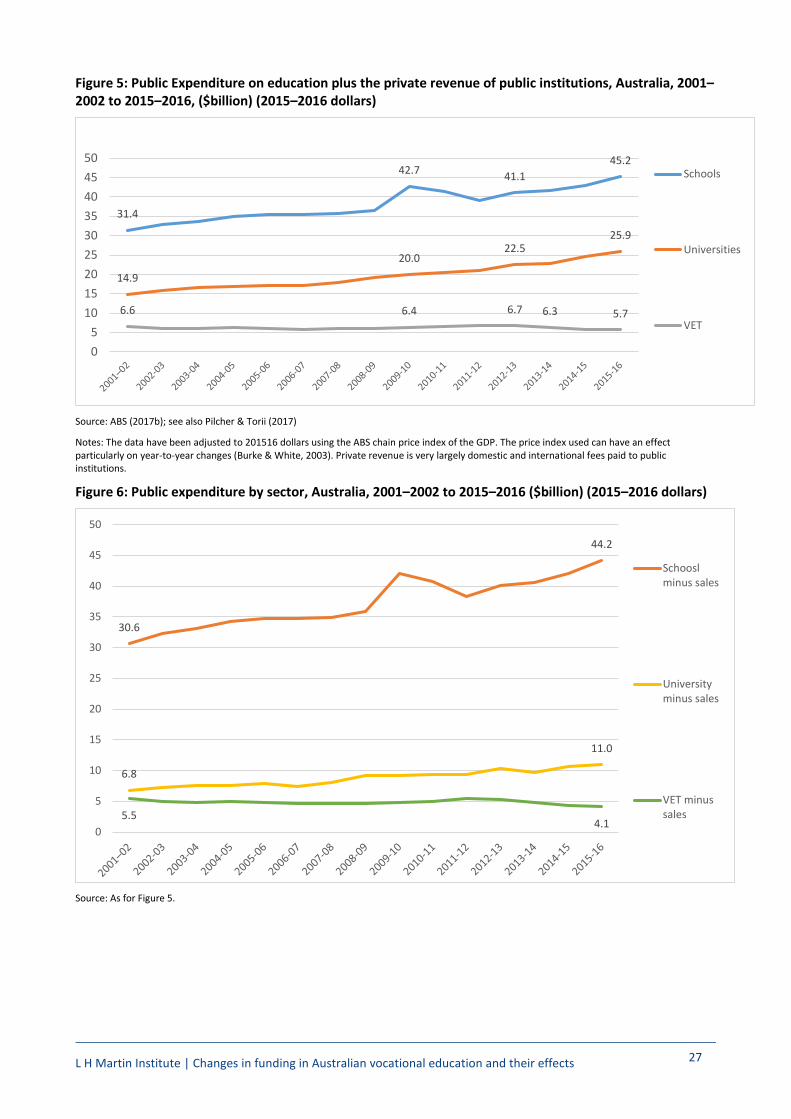
L H Martin Institute | Changes in funding in Australian vocational education and their effects 27
Figure 5: Public Expenditure on education plus the private revenue of public institutions, Australia, 2001–2002 to 2015–2016, ($billion) (2015–2016 dollars)
Source: ABS (2017b); see also Pilcher & Torii (2017)
Notes: The data have been adjusted to 201516 dollars using the ABS chain price index of the GDP. The price index used can have an effect particularly on year-to-year changes (Burke & White, 2003). Private revenue is very largely domestic and international fees paid to public institutions.
Figure 6: Public expenditure by sector, Australia, 2001–2002 to 2015–2016 ($billion) (2015–2016 dollars)
Source: As for Figure 5.
31.4
42.7 41.145.2
14.9
20.022.5
25.9
6.6 6.4 6.7 6.3 5.7
05
101520253035404550
Schools
Universities
VET
30.6
44.2
6.8
11.0
5.54.1
0
5
10
15
20
25
30
35
40
45
50
Schooslminus sales
Universityminus sales
VET minussales
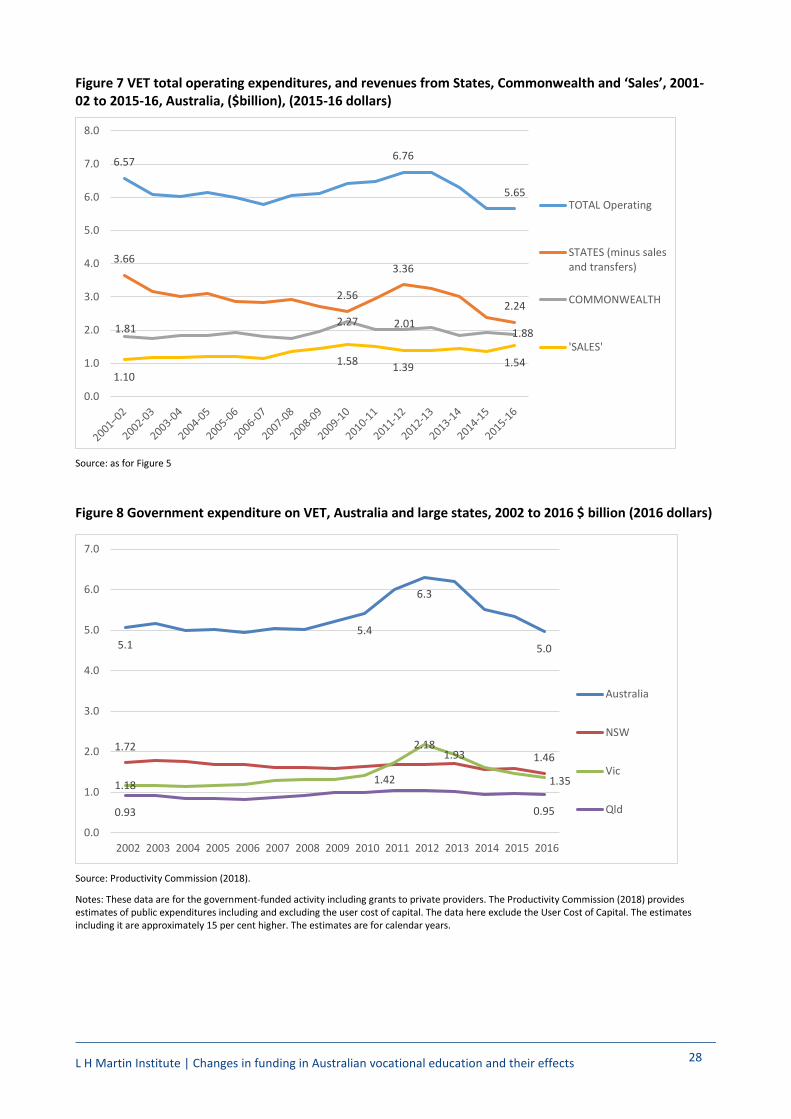
L H Martin Institute | Changes in funding in Australian vocational education and their effects 28
Figure 7 VET total operating expenditures, and revenues from States, Commonwealth and ‘Sales’, 2001-02 to 2015-16, Australia, ($billion), (2015-16 dollars)
Source: as for Figure 5
Figure 8 Government expenditure on VET, Australia and large states, 2002 to 2016 $ billion (2016 dollars)
Source: Productivity Commission (2018).
Notes: These data are for the government-funded activity including grants to private providers. The Productivity Commission (2018) provides estimates of public expenditures including and excluding the user cost of capital. The data here exclude the User Cost of Capital. The estimates including it are approximately 15 per cent higher. The estimates are for calendar years.
6.57 6.76
5.65
3.66
2.56
3.36
2.24
1.81 2.27 2.011.88
1.101.58 1.39 1.54
0.0
1.0
2.0
3.0
4.0
5.0
6.0
7.0
8.0
TOTAL Operating
STATES (minus salesand transfers)
COMMONWEALTH
'SALES'
5.15.4
6.3
5.0
1.721.46
1.18 1.42
2.181.93
1.35
0.93 0.95
0.0
1.0
2.0
3.0
4.0
5.0
6.0
7.0
2002 2003 2004 2005 2006 2007 2008 2009 2010 2011 2012 2013 2014 2015 2016
Australia
NSW
Vic
Qld
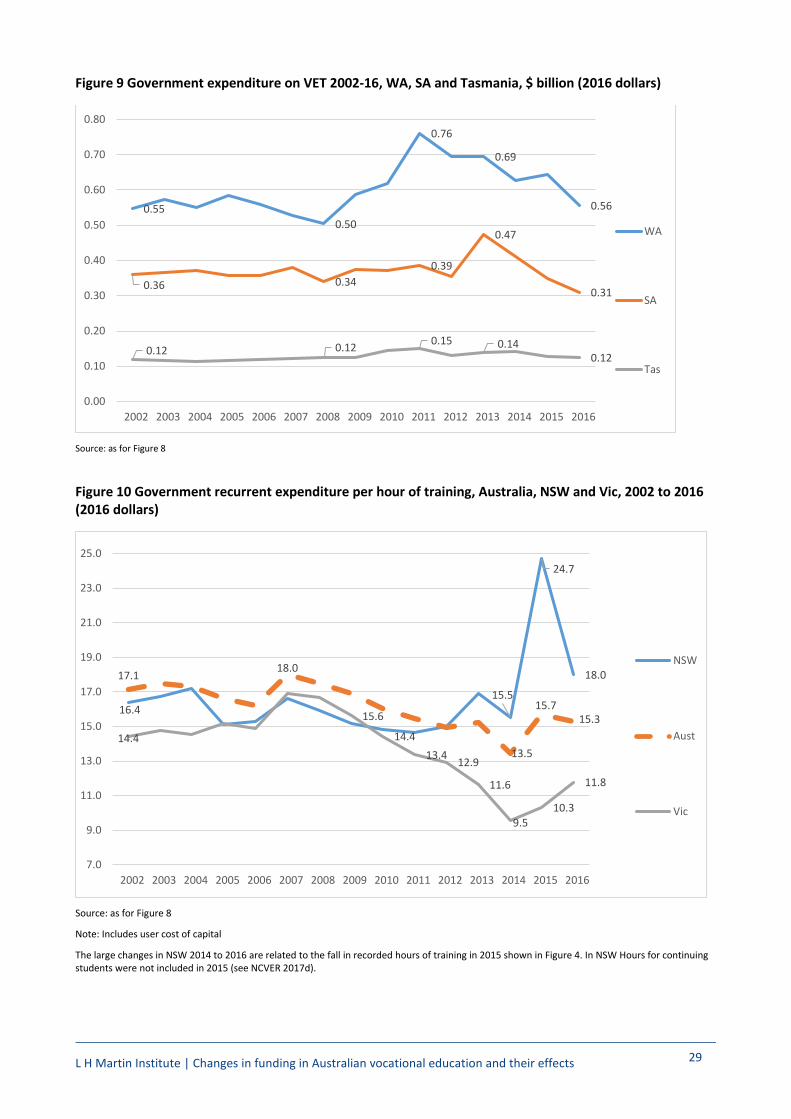
L H Martin Institute | Changes in funding in Australian vocational education and their effects 29
Figure 9 Government expenditure on VET 2002-16, WA, SA and Tasmania, $ billion (2016 dollars)
Source: as for Figure 8
Figure 10 Government recurrent expenditure per hour of training, Australia, NSW and Vic, 2002 to 2016 (2016 dollars)
Source: as for Figure 8
Note: Includes user cost of capital
The large changes in NSW 2014 to 2016 are related to the fall in recorded hours of training in 2015 shown in Figure 4. In NSW Hours for continuing students were not included in 2015 (see NCVER 2017d).
0.550.50
0.76
0.69
0.56
0.36 0.340.39
0.47
0.31
0.12 0.12 0.15 0.140.12
0.00
0.10
0.20
0.30
0.40
0.50
0.60
0.70
0.80
2002 2003 2004 2005 2006 2007 2008 2009 2010 2011 2012 2013 2014 2015 2016
WA
SA
Tas
16.415.5
24.7
18.017.118.0
13.5
15.715.3
14.4
15.6
14.413.4 12.9
11.6
9.510.3
11.8
7.0
9.0
11.0
13.0
15.0
17.0
19.0
21.0
23.0
25.0
2002 2003 2004 2005 2006 2007 2008 2009 2010 2011 2012 2013 2014 2015 2016
NSW
Aust
Vic
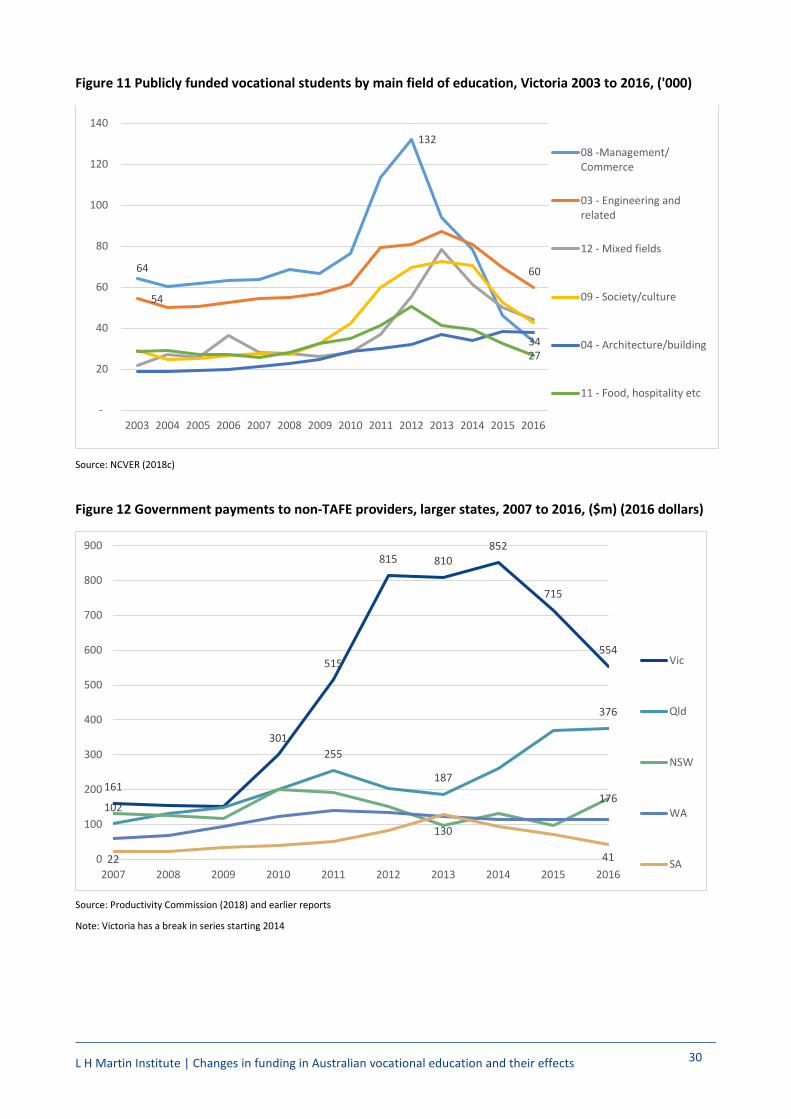
L H Martin Institute | Changes in funding in Australian vocational education and their effects 30
Figure 11 Publicly funded vocational students by main field of education, Victoria 2003 to 2016, ('000)
Source: NCVER (2018c)
Figure 12 Government payments to non-TAFE providers, larger states, 2007 to 2016, ($m) (2016 dollars)
Source: Productivity Commission (2018) and earlier reports
Note: Victoria has a break in series starting 2014
64
132
34
54
60
27
-
20
40
60
80
100
120
140
2003 2004 2005 2006 2007 2008 2009 2010 2011 2012 2013 2014 2015 2016
08 -Management/Commerce
03 - Engineering andrelated
12 - Mixed fields
09 - Society/culture
04 - Architecture/building
11 - Food, hospitality etc
161
301
515
815 810 852
715
554
102
255
187
376
176
22
130
41 0
100
200
300
400
500
600
700
800
900
2007 2008 2009 2010 2011 2012 2013 2014 2015 2016
Vic
Qld
NSW
WA
SA

L H Martin Institute | Changes in funding in Australian vocational education and their effects 31
Figure 13 Government payments to non-TAFE providers as a proportion of total government expenditure, Australia and larger states, 2007 to 2016
Source Productivity Commission (2018)
Figure 14 International onshore students fee revenue by sectors 2000-01 to 2016-17, Australia ($billion) nominal prices
ABS (2017c)
0.53
0.41
0.15
0.39
0.26
0.21
0.06
0.13
0.06
0.12
0.00
0.10
0.20
0.30
0.40
0.50
0.60
2007 2008 2009 2010 2011 2012 2013 2014 2015 2016
Vic
Qld
Aust
WA
SA
NSW
1.1
4.8
8.4
0.4
1.7 1.4
0.60
0.47
0.0
1.0
2.0
3.0
4.0
5.0
6.0
7.0
8.0
9.0
Higher
Vocational
Non-Award
ELICOS
Schools
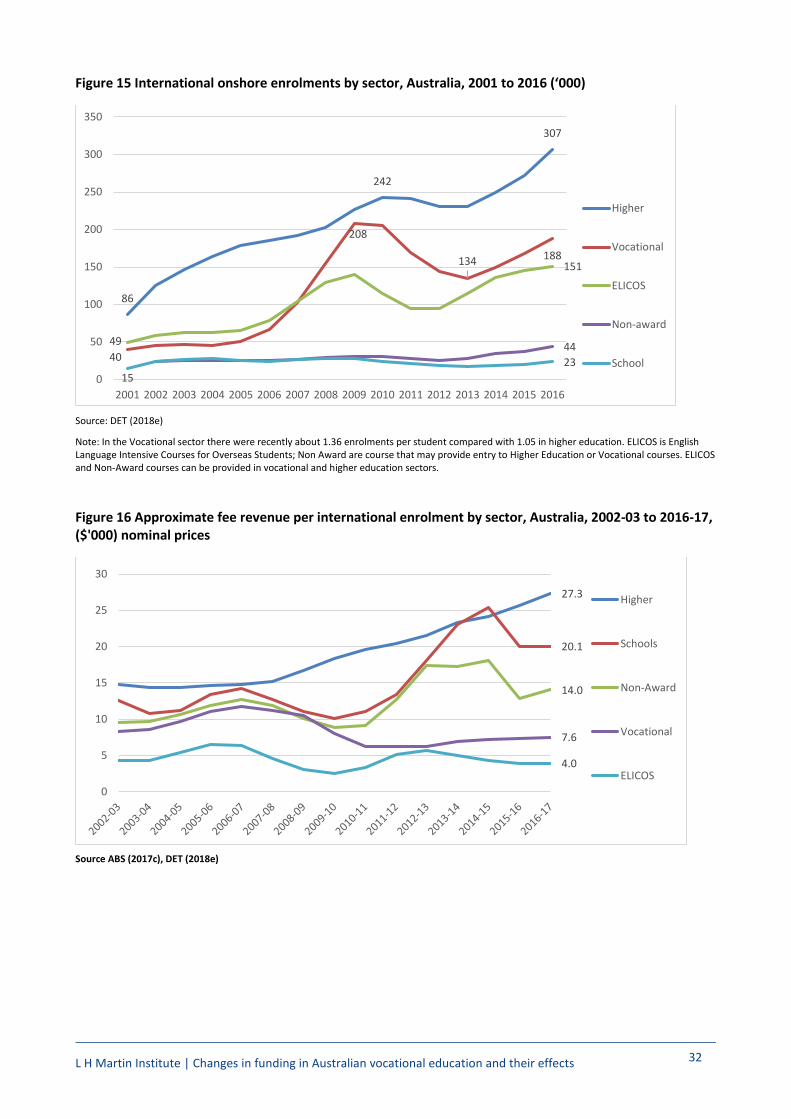
L H Martin Institute | Changes in funding in Australian vocational education and their effects 32
Figure 15 International onshore enrolments by sector, Australia, 2001 to 2016 (‘000)
Source: DET (2018e)
Note: In the Vocational sector there were recently about 1.36 enrolments per student compared with 1.05 in higher education. ELICOS is English Language Intensive Courses for Overseas Students; Non Award are course that may provide entry to Higher Education or Vocational courses. ELICOS and Non-Award courses can be provided in vocational and higher education sectors.
Figure 16 Approximate fee revenue per international enrolment by sector, Australia, 2002-03 to 2016-17, ($'000) nominal prices
Source ABS (2017c), DET (2018e)
86
242
307
40
208
134 188
49
151
44
1523
0
50
100
150
200
250
300
350
2001 2002 2003 2004 2005 2006 2007 2008 2009 2010 2011 2012 2013 2014 2015 2016
Higher
Vocational
ELICOS
Non-award
School
27.3
20.1
14.0
7.6
4.0
0
5
10
15
20
25
30
Higher
Schools
Non-Award
Vocational
ELICOS
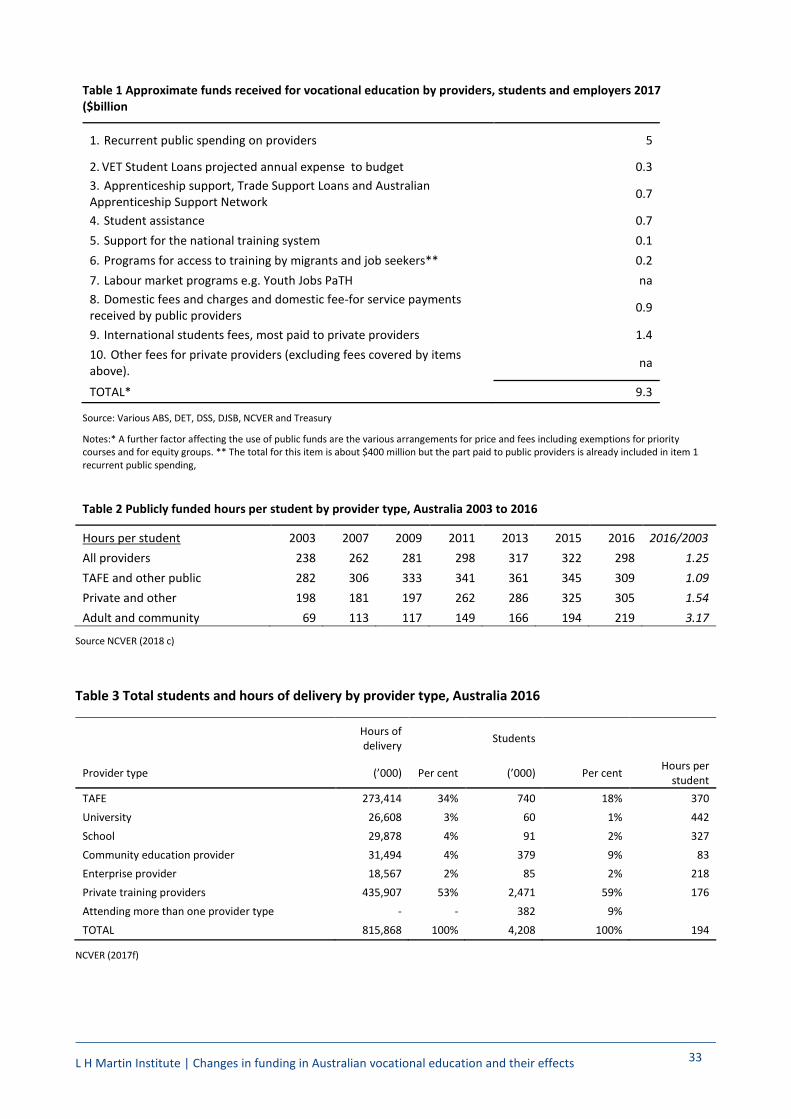
L H Martin Institute | Changes in funding in Australian vocational education and their effects 33
Table 1 Approximate funds received for vocational education by providers, students and employers 2017 ($billion
1. Recurrent public spending on providers 5
2. VET Student Loans projected annual expense to budget 0.3 3. Apprenticeship support, Trade Support Loans and Australian Apprenticeship Support Network 0.7
4. Student assistance 0.7 5. Support for the national training system 0.1 6. Programs for access to training by migrants and job seekers** 0.2 7. Labour market programs e.g. Youth Jobs PaTH na 8. Domestic fees and charges and domestic fee-for service payments received by public providers 0.9
9. International students fees, most paid to private providers 1.4 10. Other fees for private providers (excluding fees covered by items above). na
TOTAL* 9.3
Source: Various ABS, DET, DSS, DJSB, NCVER and Treasury
Notes:* A further factor affecting the use of public funds are the various arrangements for price and fees including exemptions for priority courses and for equity groups. ** The total for this item is about $400 million but the part paid to public providers is already included in item 1 recurrent public spending,
Table 2 Publicly funded hours per student by provider type, Australia 2003 to 2016
Hours per student 2003 2007 2009 2011 2013 2015 2016 2016/2003 All providers 238 262 281 298 317 322 298 1.25 TAFE and other public 282 306 333 341 361 345 309 1.09 Private and other 198 181 197 262 286 325 305 1.54 Adult and community 69 113 117 149 166 194 219 3.17
Source NCVER (2018 c)
Table 3 Total students and hours of delivery by provider type, Australia 2016
Hours of delivery
Students
Provider type (’000) Per cent (’000) Per cent Hours per student
TAFE 273,414 34% 740 18% 370 University 26,608 3% 60 1% 442 School 29,878 4% 91 2% 327 Community education provider 31,494 4% 379 9% 83 Enterprise provider 18,567 2% 85 2% 218 Private training providers 435,907 53% 2,471 59% 176 Attending more than one provider type - - 382 9%
TOTAL 815,868 100% 4,208 100% 194
NCVER (2017f)
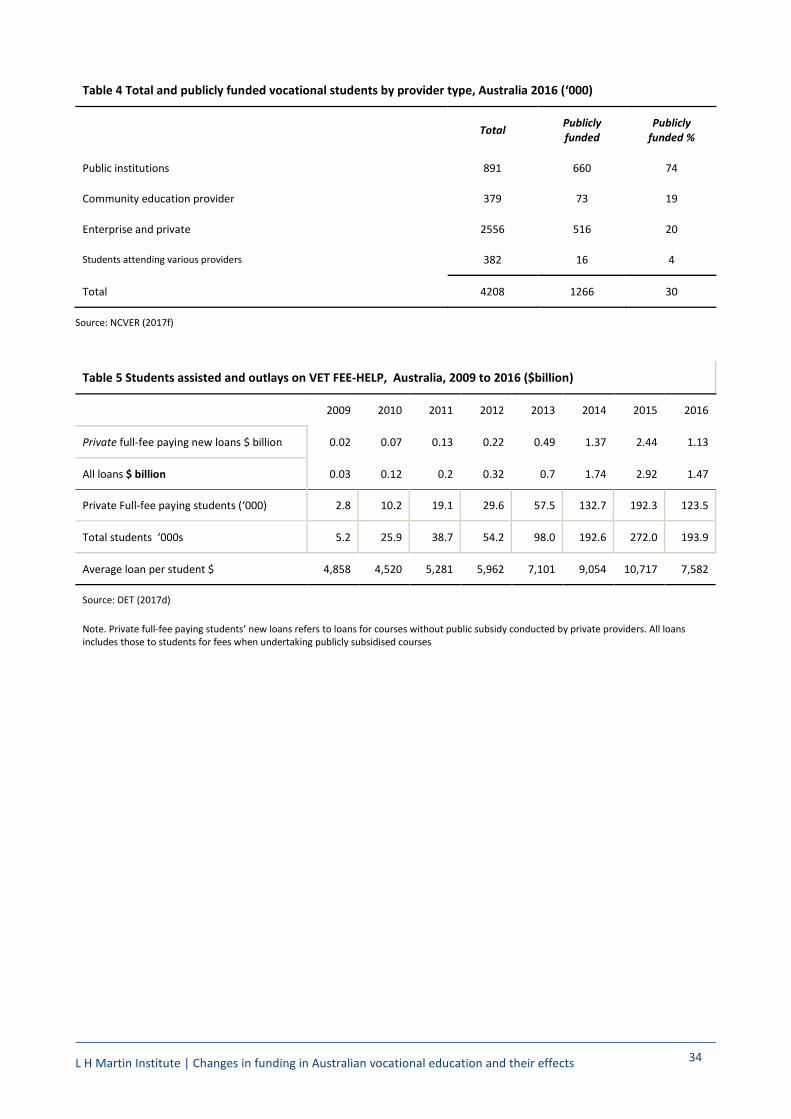
L H Martin Institute | Changes in funding in Australian vocational education and their effects 34
Table 4 Total and publicly funded vocational students by provider type, Australia 2016 (‘000)
Total Publicly
funded Publicly
funded %
Public institutions 891 660 74
Community education provider 379 73 19
Enterprise and private 2556 516 20
Students attending various providers 382 16 4
Total 4208 1266 30
Source: NCVER (2017f)
Table 5 Students assisted and outlays on VET FEE-HELP, Australia, 2009 to 2016 ($billion)
2009 2010 2011 2012 2013 2014 2015 2016
Private full-fee paying new loans $ billion 0.02 0.07 0.13 0.22 0.49 1.37 2.44 1.13
All loans $ billion 0.03 0.12 0.2 0.32 0.7 1.74 2.92 1.47
Private Full-fee paying students (‘000) 2.8 10.2 19.1 29.6 57.5 132.7 192.3 123.5
Total students ‘000s 5.2 25.9 38.7 54.2 98.0 192.6 272.0 193.9
Average loan per student $ 4,858 4,520 5,281 5,962 7,101 9,054 10,717 7,582
Source: DET (2017d)
Note. Private full-fee paying students’ new loans refers to loans for courses without public subsidy conducted by private providers. All loans includes those to students for fees when undertaking publicly subsidised courses
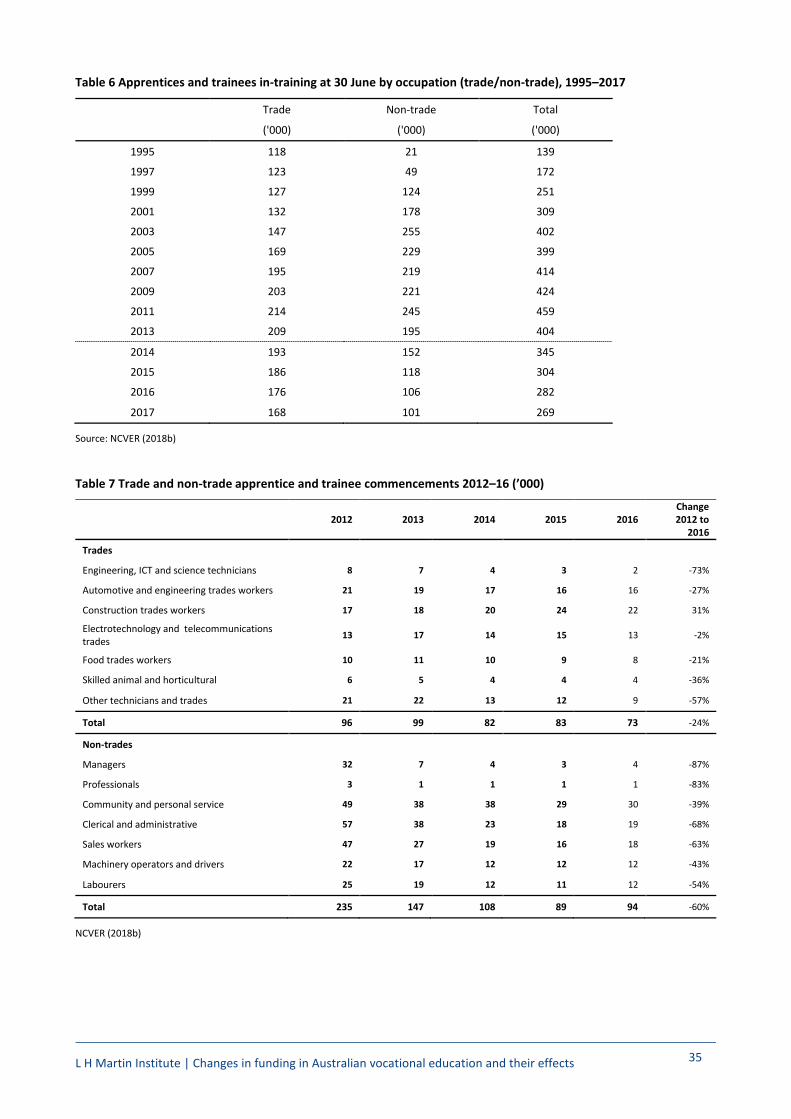
L H Martin Institute | Changes in funding in Australian vocational education and their effects 35
Table 6 Apprentices and trainees in-training at 30 June by occupation (trade/non-trade), 1995–2017
Trade Non-trade Total
('000) ('000) ('000)
1995 118 21 139
1997 123 49 172
1999 127 124 251
2001 132 178 309
2003 147 255 402
2005 169 229 399
2007 195 219 414
2009 203 221 424
2011 214 245 459
2013 209 195 404
2014 193 152 345
2015 186 118 304
2016 176 106 282
2017 168 101 269
Source: NCVER (2018b)
Table 7 Trade and non-trade apprentice and trainee commencements 2012–16 (’000)
2012 2013 2014 2015 2016 Change 2012 to
2016
Trades
Engineering, ICT and science technicians 8 7 4 3 2 -73%
Automotive and engineering trades workers 21 19 17 16 16 -27%
Construction trades workers 17 18 20 24 22 31%
Electrotechnology and telecommunications trades 13 17 14 15 13 -2%
Food trades workers 10 11 10 9 8 -21%
Skilled animal and horticultural 6 5 4 4 4 -36%
Other technicians and trades 21 22 13 12 9 -57%
Total 96 99 82 83 73 -24%
Non-trades
Managers 32 7 4 3 4 -87%
Professionals 3 1 1 1 1 -83%
Community and personal service 49 38 38 29 30 -39%
Clerical and administrative 57 38 23 18 19 -68%
Sales workers 47 27 19 16 18 -63%
Machinery operators and drivers 22 17 12 12 12 -43%
Labourers 25 19 12 11 12 -54%
Total 235 147 108 89 94 -60%
NCVER (2018b)
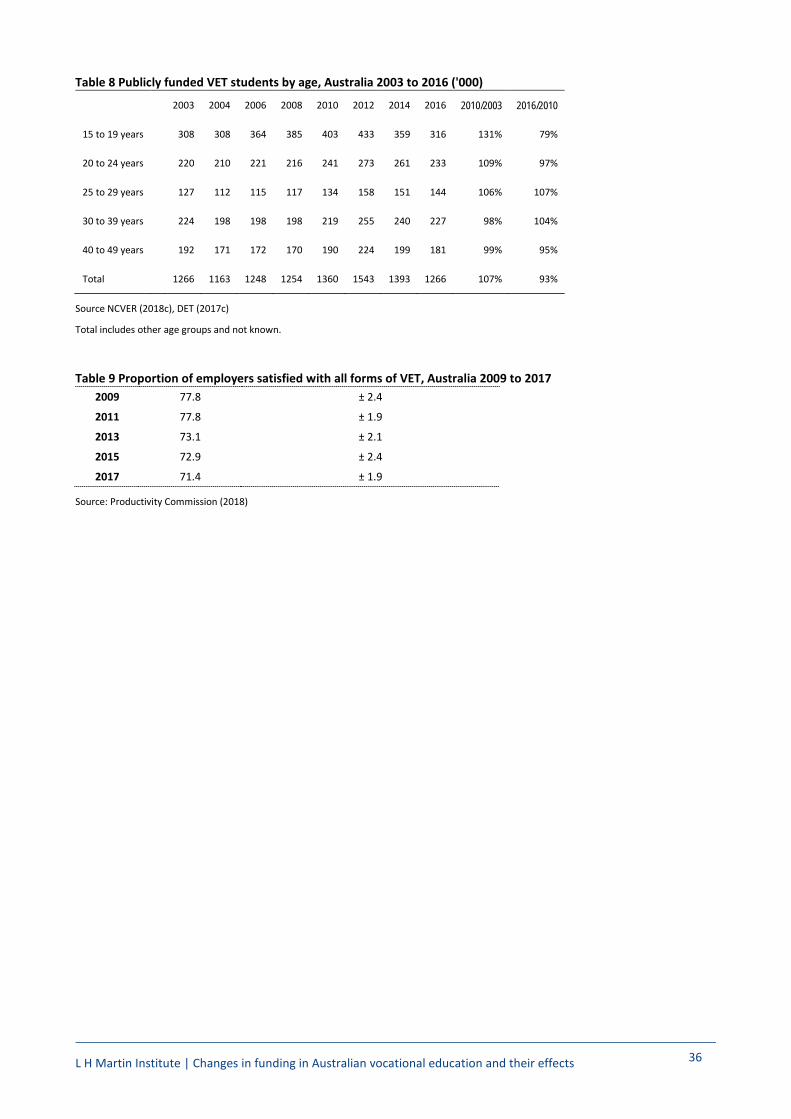
L H Martin Institute | Changes in funding in Australian vocational education and their effects 36
Table 8 Publicly funded VET students by age, Australia 2003 to 2016 ('000) 2003 2004 2006 2008 2010 2012 2014 2016 2010/2003 2016/2010
15 to 19 years 308 308 364 385 403 433 359 316 131% 79%
20 to 24 years 220 210 221 216 241 273 261 233 109% 97%
25 to 29 years 127 112 115 117 134 158 151 144 106% 107%
30 to 39 years 224 198 198 198 219 255 240 227 98% 104%
40 to 49 years 192 171 172 170 190 224 199 181 99% 95%
Total 1266 1163 1248 1254 1360 1543 1393 1266 107% 93%
Source NCVER (2018c), DET (2017c)
Total includes other age groups and not known.
Table 9 Proportion of employers satisfied with all forms of VET, Australia 2009 to 2017 2009 77.8 ± 2.4
2011 77.8 ± 1.9
2013 73.1 ± 2.1
2015 72.9 ± 2.4
2017 71.4 ± 1.9
Source: Productivity Commission (2018)
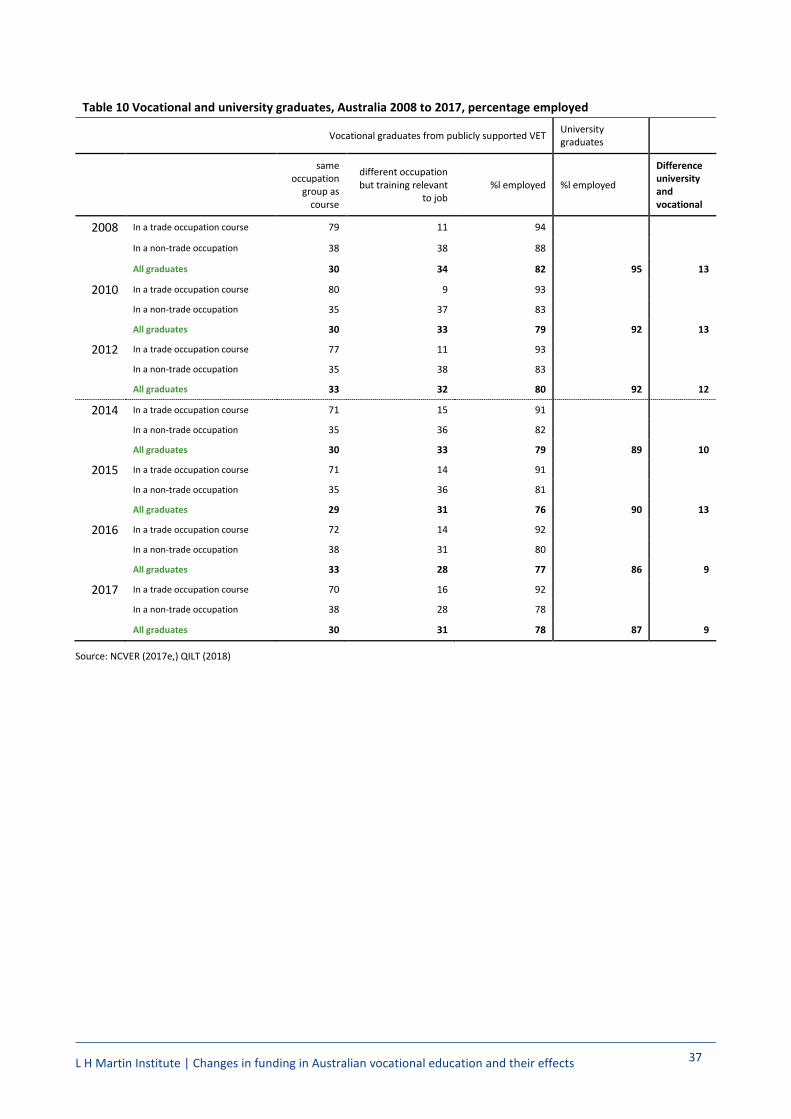
L H Martin Institute | Changes in funding in Australian vocational education and their effects 37
Table 10 Vocational and university graduates, Australia 2008 to 2017, percentage employed
Vocational graduates from publicly supported VET University graduates
same occupation
group as course
different occupation but training relevant
to job %l employed %l employed
Difference university and vocational
2008 In a trade occupation course 79 11 94
In a non-trade occupation 38 38 88
All graduates 30 34 82 95 13
2010 In a trade occupation course 80 9 93
In a non-trade occupation 35 37 83
All graduates 30 33 79 92 13
2012 In a trade occupation course 77 11 93
In a non-trade occupation 35 38 83
All graduates 33 32 80 92 12
2014 In a trade occupation course 71 15 91
In a non-trade occupation 35 36 82
All graduates 30 33 79 89 10
2015 In a trade occupation course 71 14 91
In a non-trade occupation 35 36 81
All graduates 29 31 76 90 13
2016 In a trade occupation course 72 14 92
In a non-trade occupation 38 31 80
All graduates 33 28 77 86 9
2017 In a trade occupation course 70 16 92
In a non-trade occupation 38 28 78 All graduates 30 31 78 87 9
Source: NCVER (2017e,) QILT (2018)
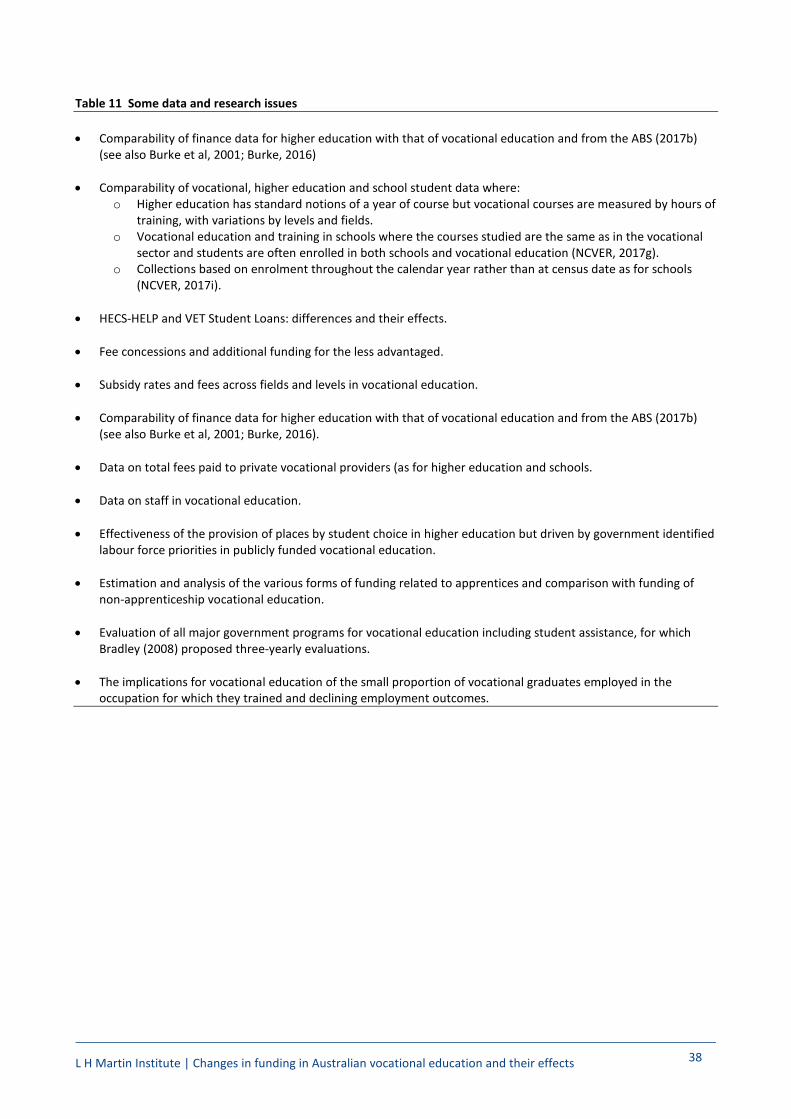
L H Martin Institute | Changes in funding in Australian vocational education and their effects 38
Table 11 Some data and research issues • Comparability of finance data for higher education with that of vocational education and from the ABS (2017b)
(see also Burke et al, 2001; Burke, 2016)
• Comparability of vocational, higher education and school student data where: o Higher education has standard notions of a year of course but vocational courses are measured by hours of
training, with variations by levels and fields. o Vocational education and training in schools where the courses studied are the same as in the vocational
sector and students are often enrolled in both schools and vocational education (NCVER, 2017g). o Collections based on enrolment throughout the calendar year rather than at census date as for schools
(NCVER, 2017i).
• HECS-HELP and VET Student Loans: differences and their effects.
• Fee concessions and additional funding for the less advantaged.
• Subsidy rates and fees across fields and levels in vocational education.
• Comparability of finance data for higher education with that of vocational education and from the ABS (2017b) (see also Burke et al, 2001; Burke, 2016).
• Data on total fees paid to private vocational providers (as for higher education and schools.
• Data on staff in vocational education.
• Effectiveness of the provision of places by student choice in higher education but driven by government identified labour force priorities in publicly funded vocational education.
• Estimation and analysis of the various forms of funding related to apprentices and comparison with funding of
non-apprenticeship vocational education.
• Evaluation of all major government programs for vocational education including student assistance, for which Bradley (2008) proposed three-yearly evaluations.
• The implications for vocational education of the small proportion of vocational graduates employed in the occupation for which they trained and declining employment outcomes.


![高點網路書店O Repeat with me merit P merit] (n.) demerit [dP (n.) @ Repeat with me They have lived in Taiwan for 10 years. They fell in love with this island. Having lived in](https://img.dokumen.tips/doc/110x75/60bb1102ef924c2e92394c8a/eece-o-repeat-with-me-merit-p-merit-n-demerit-dp-n-repeat.jpg)