Embed Size (px)
Citation preview
ORIGINAL ARTICLE
Changes in ant communities along an age gradient of cocoacultivation in the Oumé region, central Côte d’Ivoireens_520 324..339
Mouhamadou KONE 1,2, Souleymane KONATE2, Kolo YEO2, Philippe Kouassi KOUASSI1
and K. Eduard LINSENMAIR3
1Unité de Formation et de Recherches en Biosciences, Université de Cocody, 2Station d’Écologie de Lamto, Universitéd’Abobo-Adjamé, Abidjan, Côte d’Ivoire; and 3Department of Animal Ecology and Tropical Biology, University of Würzburg,Würzburg, Germany
AbstractWe identified the extent to which ant diversity occurs despite conversion of forests into cocoa plantations byexamining the communities across four age classes of plantations (classes I–IV with increasing age from 0–5to 21–40 years) and in their original forests. An extensive sampling protocol consisting of pitfall trapping,leaf litter sampling, soil sampling and hand sampling was used to characterize ant species richness andcomposition in three replicates of each age class and in the remaining forest patches. A total of one hundredant species was found in all habitats combined. While the forest was the richest habitat (73 species), speciesrichness in the different plantation age classes varied as follows (sorted in descending order): class IV (69species) > class III (57 species) > class I (52 species) > class II (43 species). Age gradient was thus significantlypositively correlated with mean species richness and with the relative abundance of some subfamilies. Thespecies composition differed greatly between some plantation age classes and the forest. The two youngestcocoa age classes (I and II) were most dissimilar to the forest. In contrast, forest ants were well representedin the old cocoa age classes (III and IV). Three functional guilds (generalist predators, specialist predatorsand territorially dominant arboreal species) were in their relative abundance significantly correlated to theage gradient. Overall, cocoa cultivations retaining a floristically diverse and structurally complex foreststructure are a suitable management system for the conservation of ant species of the formerly forestedhabitats.
Key words: age classes, conservation, forest, management system, species composition.
INTRODUCTION
Tropical rainforests are considered the most complexand species-rich ecosystems in the world (Wilson 1995).However, these species-rich forests are increasinglysubject to modifications mainly due to timber extrac-tion, habitat conversion and fragmentation for agri-cultural use including oil palm, rubber and cocoaplantations. Harboring over 50% of the world’s terres-trial species and occupying only 7% of the terrestrialearth, they have undergone a considerable loss of their
biodiversity in recent decades (Barbault et al. 2002).With the continuing loss of tropical forests, there isincreasing interest in cultivated areas for their potentialvalue in conserving tropical biodiversity, especially atthe frontier between human cultivation and still pristineecosystems (Rice & Greenberg 2000; Bawa et al. 2004;Tscharntke et al. 2005). A broad generalization is that a90% reduction in the area of a habitat results in a 50%reduction in the number of species present (Reid &Miller 1989). However, as Lugo (1988) pointed out,such calculations do not take into account the ability ofmany species to survive in habitats that are disturbed orconverted to agricultural use, which commonly remainfollowing the loss of the primary forest.
Ants are abundant and diverse in almost all terres-trial habitats (Hölldobler & Wilson 1990), easy tocollect without requiring very sophisticated expertise
Correspondence: Mouhamadou Kone, Station d’Écologie deLamto, Unité de Formation et de Recherches en Biosciences,Université de Cocody, Abidjan BP 28 N’Douci, Côted’Ivoire.Email: [email protected]
Received 1 June 2011; accepted 24 January 2012.
Entomological Science (2012) 15, 324–339 doi:10.1111/j.1479-8298.2012.00520.x
bs_bs_banner
© 2012 The Entomological Society of Japan
(Greenslade & Greenslade 1984; Fisher 1999; Agosti &Alonso 2000) and sensitive to environmental changes(Campbell & Tanton 1981; Majer 1983; Andersen1990). They are one of the most important arthropodgroups in tropical forests in terms of biomass and eco-system impact (Carroll & Janzen 1973; Fittkau & Klinge1973; Wilson 1987; Hölldobler & Wilson 1990). Theyare prime predators of other invertebrates, and severalant species act as agents of biological control (Majer1976; Way & Khoo 1992; Dejean et al. 1997; Perfecto &Castiñeiras 1998; Kenne et al. 1999; Vandermeer et al.2002; Philpott & Armbrecht 2006; Armbrecht &Gallego 2007; Van Mele 2008). Ants also have an impor-tant influence on soils (Lobry de Bruyn & Conacher1994; Lobry de Bruyn 1999), vegetation (Buckley 1982)and other faunal groups through their involvement in awide range of key ecological processes. They play impor-tant roles in forest ecosystems, such as in soil turnover,seed dispersal and nutrient transport and local enrich-ment, and actively manipulate their environment (Joneset al. 1994). Because of this importance, they are widelyused as bioindicators and are included in monitoringprograms focusing on the ecological effects of humanimpacts on ant communities (Andersen 1993). Changesin the composition of ant communities are oftenmonitored by centering attention on functional groupapproach (Andersen 1995). This approach provides apromising way of identifying general rules based onfundamental biological features rather than on particularspecies identities, offering possibilities for comparing antresponses up to a global scale (Niemelä et al. 2000). Antfunctional groups have been successfully used to monitorenvironmental stress and disturbance (Majer 1983,1985; Andersen 1995, 1997; Bestelmeyer & Wiens 1996;King et al. 1998; Hoffmann et al. 2000; Read & Ander-sen 2000; Hoffmann & Andersen 2003; Andersen &Majer 2004; Nakamura et al. 2007).
Forest disturbance effects on ant communities havebeen studied because these insects are of high impor-tance for ground-living communities (Levings &Windsor 1985; Stork & Brendell 1990; Belshaw &Bolton 1993; Kaspari 1996a,b) as well as for arborealfauna in tropical forests (Erwin 1983; Adis et al. 1984;Floren & Linsenmair 1997; Watt et al. 1997a,b). InCôte d’Ivoire the rainforest formerly covered 12 millionhectares, but today not more than 2.6 million hectaresremain mostly due to conversion to agriculture withcocoa production being a major driver of deforestation.Cocoa cultivation plays an important role in theeconomy of Côte d’Ivoire, making up 40% of theexports and 10% of internal gross product. Cocoa isgrown either in monospecific plantations or in agrofor-estry systems replacing the original forest ecosystems
(Ruf & Schroth 2004). However, in comparison to otherland uses, traditional cocoa agroforests have a diverseand complex structure due to the conservation of differ-ent shade-providing trees with extensive canopies. Theyare thus among the agricultural land uses that are mostlikely to conserve a significant portion of the originalforest biodiversity (Rice & Greenberg 2000; Schrothet al. 2004; Waltert et al. 2004; Kessler et al. 2005).Literature regarding the conservation value of cocoaproduction landscapes is abundant (Room 1971, 1975;Belshaw & Bolton 1993; Bos et al. 2007; Delabie et al.2007; Schroth & Harvey 2007; Cassano et al. 2009);however, there are few and limited studies in the litera-ture examining ant diversity along an age gradient ofcocoa .
Using ground-foraging ants as a model group weassessed the extent to which the forest ant fauna stilloccurs in different cocoa plantations. We hypothesizedthat ant diversity would follow an increasing age gradi-ent of cocoa cultivation in the above described type ofbasically forest-like plantations. In this study, we ana-lyzed changes in ground-foraging ant diversity andabundance across four age classes of cocoa cultivation incomparison to the original forests in Central-West Côted’Ivoire.
MATERIALS AND METHODS
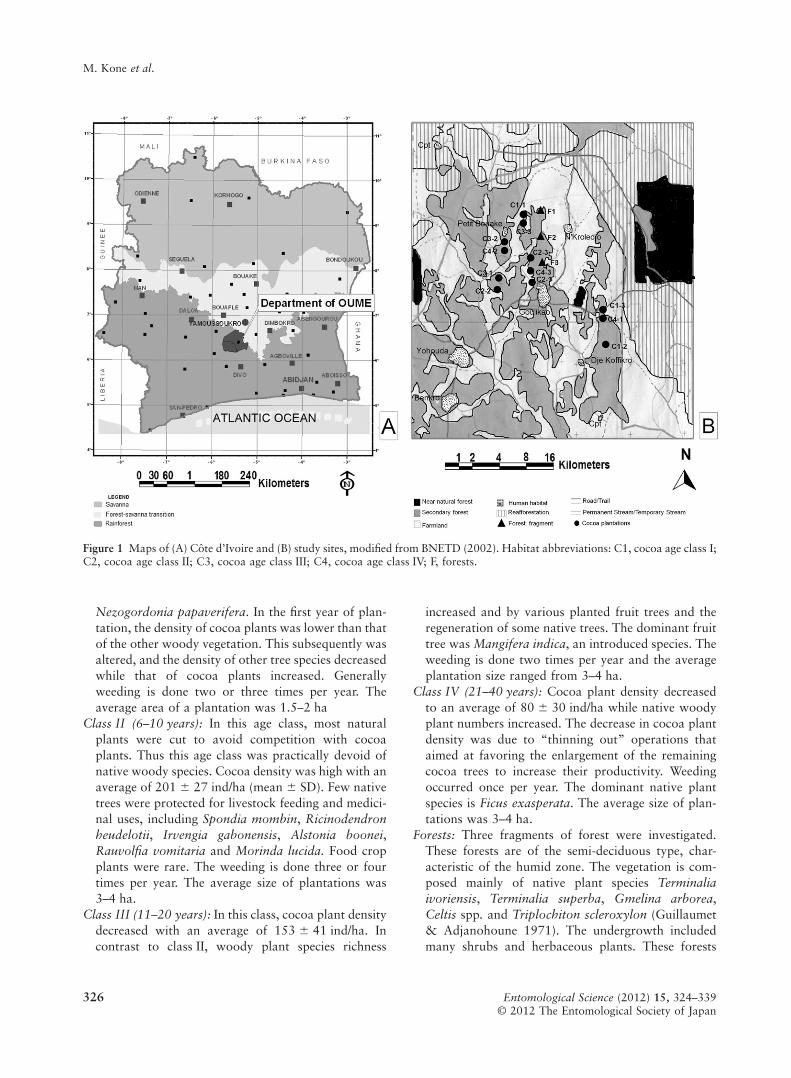
Study sitesThis study was carried out during the rainy season(May–September) in 2008 in Oumé region, near thevillage of Goulikao (6°30′N, 5°31′W) (Fig. 1). Oumé islocated in Central-west Côte d’Ivoire and is character-ized by semi-deciduous degraded forests (Chatelainet al. 2003). This region is an intensive cocoa cultivationzone. Average annual rainfall and temperature are1639 mm and 26°C, respectively. Cocoa plantations inthe village of Goulikao are owned and managed bysmall holders. We selected three replicate sites of each ofthe four age classes of cocoa plantation and the forest.Sites were within 3 km of each other. A transect(200 m ¥ 10 m) was established inside all sites with atotal of 15 transects for all habitats. We defined four ageclasses of cocoa plantations, which differed in tree diver-sity and density.
They were characterized as follows:
Class I (0-5 years): This age class was composed of amixture of different crop plants (e.g. plantain banana,maize, yam, taro, cassava, eggplant and cocoa trees).Some trees from the previous forest were maintained.The dominant tree species in this age class were Mil-lettia zechiana, Mansonia altissima, Albizia zygia and
Ant communities in cocoa plantations
Entomological Science (2012) 15, 324–339 325© 2012 The Entomological Society of Japan
Nezogordonia papaverifera. In the first year of plan-tation, the density of cocoa plants was lower than thatof the other woody vegetation. This subsequently wasaltered, and the density of other tree species decreasedwhile that of cocoa plants increased. Generallyweeding is done two or three times per year. Theaverage area of a plantation was 1.5–2 ha
Class II (6–10 years): In this age class, most naturalplants were cut to avoid competition with cocoaplants. Thus this age class was practically devoid ofnative woody species. Cocoa density was high with anaverage of 201 � 27 ind/ha (mean � SD). Few nativetrees were protected for livestock feeding and medici-nal uses, including Spondia mombin, Ricinodendronheudelotii, Irvengia gabonensis, Alstonia boonei,Rauvolfia vomitaria and Morinda lucida. Food cropplants were rare. The weeding is done three or fourtimes per year. The average size of plantations was3–4 ha.
Class III (11–20 years): In this class, cocoa plant densitydecreased with an average of 153 � 41 ind/ha. Incontrast to class II, woody plant species richness
increased and by various planted fruit trees and theregeneration of some native trees. The dominant fruittree was Mangifera indica, an introduced species. Theweeding is done two times per year and the averageplantation size ranged from 3–4 ha.
Class IV (21–40 years): Cocoa plant density decreasedto an average of 80 � 30 ind/ha while native woodyplant numbers increased. The decrease in cocoa plantdensity was due to “thinning out” operations thataimed at favoring the enlargement of the remainingcocoa trees to increase their productivity. Weedingoccurred once per year. The dominant native plantspecies is Ficus exasperata. The average size of plan-tations was 3–4 ha.
Forests: Three fragments of forest were investigated.These forests are of the semi-deciduous type, char-acteristic of the humid zone. The vegetation is com-posed mainly of native plant species Terminaliaivoriensis, Terminalia superba, Gmelina arborea,Celtis spp. and Triplochiton scleroxylon (Guillaumet& Adjanohoune 1971). The undergrowth includedmany shrubs and herbaceous plants. These forests
Figure 1 Maps of (A) Côte d’Ivoire and (B) study sites, modified from BNETD (2002). Habitat abbreviations: C1, cocoa age class I;C2, cocoa age class II; C3, cocoa age class III; C4, cocoa age class IV; F, forests.
M. Kone et al.
Entomological Science (2012) 15, 324–339326© 2012 The Entomological Society of Japan
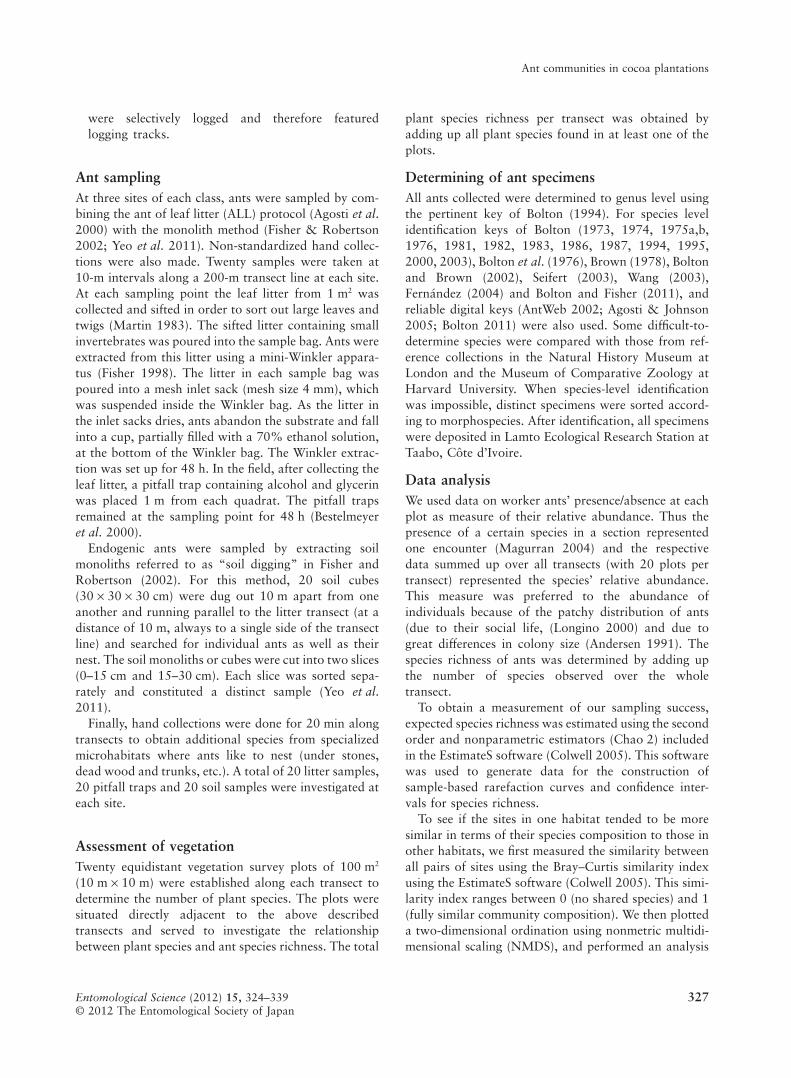
were selectively logged and therefore featuredlogging tracks.
Ant samplingAt three sites of each class, ants were sampled by com-bining the ant of leaf litter (ALL) protocol (Agosti et al.2000) with the monolith method (Fisher & Robertson2002; Yeo et al. 2011). Non-standardized hand collec-tions were also made. Twenty samples were taken at10-m intervals along a 200-m transect line at each site.At each sampling point the leaf litter from 1 m2 wascollected and sifted in order to sort out large leaves andtwigs (Martin 1983). The sifted litter containing smallinvertebrates was poured into the sample bag. Ants wereextracted from this litter using a mini-Winkler appara-tus (Fisher 1998). The litter in each sample bag waspoured into a mesh inlet sack (mesh size 4 mm), whichwas suspended inside the Winkler bag. As the litter inthe inlet sacks dries, ants abandon the substrate and fallinto a cup, partially filled with a 70% ethanol solution,at the bottom of the Winkler bag. The Winkler extrac-tion was set up for 48 h. In the field, after collecting theleaf litter, a pitfall trap containing alcohol and glycerinwas placed 1 m from each quadrat. The pitfall trapsremained at the sampling point for 48 h (Bestelmeyeret al. 2000).
Endogenic ants were sampled by extracting soilmonoliths referred to as “soil digging” in Fisher andRobertson (2002). For this method, 20 soil cubes(30 ¥ 30 ¥ 30 cm) were dug out 10 m apart from oneanother and running parallel to the litter transect (at adistance of 10 m, always to a single side of the transectline) and searched for individual ants as well as theirnest. The soil monoliths or cubes were cut into two slices(0–15 cm and 15–30 cm). Each slice was sorted sepa-rately and constituted a distinct sample (Yeo et al.2011).
Finally, hand collections were done for 20 min alongtransects to obtain additional species from specializedmicrohabitats where ants like to nest (under stones,dead wood and trunks, etc.). A total of 20 litter samples,20 pitfall traps and 20 soil samples were investigated ateach site.
Assessment of vegetationTwenty equidistant vegetation survey plots of 100 m2
(10 m ¥ 10 m) were established along each transect todetermine the number of plant species. The plots weresituated directly adjacent to the above describedtransects and served to investigate the relationshipbetween plant species and ant species richness. The total
plant species richness per transect was obtained byadding up all plant species found in at least one of theplots.
Determining of ant specimensAll ants collected were determined to genus level usingthe pertinent key of Bolton (1994). For species levelidentification keys of Bolton (1973, 1974, 1975a,b,1976, 1981, 1982, 1983, 1986, 1987, 1994, 1995,2000, 2003), Bolton et al. (1976), Brown (1978), Boltonand Brown (2002), Seifert (2003), Wang (2003),Fernández (2004) and Bolton and Fisher (2011), andreliable digital keys (AntWeb 2002; Agosti & Johnson2005; Bolton 2011) were also used. Some difficult-to-determine species were compared with those from ref-erence collections in the Natural History Museum atLondon and the Museum of Comparative Zoology atHarvard University. When species-level identificationwas impossible, distinct specimens were sorted accord-ing to morphospecies. After identification, all specimenswere deposited in Lamto Ecological Research Station atTaabo, Côte d’Ivoire.
Data analysisWe used data on worker ants’ presence/absence at eachplot as measure of their relative abundance. Thus thepresence of a certain species in a section representedone encounter (Magurran 2004) and the respectivedata summed up over all transects (with 20 plots pertransect) represented the species’ relative abundance.This measure was preferred to the abundance ofindividuals because of the patchy distribution of ants(due to their social life, (Longino 2000) and due togreat differences in colony size (Andersen 1991). Thespecies richness of ants was determined by adding upthe number of species observed over the wholetransect.
To obtain a measurement of our sampling success,expected species richness was estimated using the secondorder and nonparametric estimators (Chao 2) includedin the EstimateS software (Colwell 2005). This softwarewas used to generate data for the construction ofsample-based rarefaction curves and confidence inter-vals for species richness.
To see if the sites in one habitat tended to be moresimilar in terms of their species composition to those inother habitats, we first measured the similarity betweenall pairs of sites using the Bray–Curtis similarity indexusing the EstimateS software (Colwell 2005). This simi-larity index ranges between 0 (no shared species) and 1(fully similar community composition). We then plotteda two-dimensional ordination using nonmetric multidi-mensional scaling (NMDS), and performed an analysis
Ant communities in cocoa plantations
Entomological Science (2012) 15, 324–339 327© 2012 The Entomological Society of Japan
of similarities (anosim) with 999 permutations, usingPAST software (Hammer et al. 2001). This arranges thesites in a low-dimensional space so that the more similarones (according to their species composition) are placedcloser together and the more dissimilar ones furtherapart (Gauch 1982). The multidimensional scaling wasalso used to extract the single best eigenvector scores forall ant-based variables across all sites. The NMDS is apowerful method for ordinating similarity matrices as itis independent of the type of data distribution. Theaccompanying stress value of an ordination indicates thegoodness-of-fit of the scaling to the similarity matrix.Stress values of 0.20 and lower indicate a good fit (Stat-Soft 1984–2004).
We used the Simpson index to measure within-habitatdiversity of ant communities. This index and its even-ness (uniformity of occurrence distributions amongspecies) were computed using the program PAST.
The ants’ species richness and the relative abundancesof subfamilies and functional groups were correlatedwith the age gradient of the cocoa plantations usingSpearman’s rank correlation test to examine the exist-ence of such dependencies. To test this correlation, thesites of each age class were scored according to 5-pointscale (where 1 = sites of the class I; 2 = sites of class II;3 = sites of class III; 4 = sites of class IV; 5 = forest sites).These analyses were performed using the softwareStatistica v7.1 (StatSoft France 2005).
We defined as “common” species those whose fre-quency of occurrence equals or exceeds the mean fre-quency of occurrence (= 20) in the combined data fromall habitats. Each ant species was assigned to a func-tional group based on its competitive interactions, for-aging strategies, habitat requirements and microclimatepreferences. The functional groups were consistent withrelevant literature (Lévieux 1983; Majer 1983; Ander-sen 1995, 1997; King et al. 1998; Hoffmann et al. 2000;Read & Andersen 2000; Andersen & Majer 2004;Dejean et al. 2007; Bolton & Fisher 2008) of, forexample, specialist predators (SP), generalist predators(GP), generalists (G), opportunists (OP), territoriallydominant arboreal species (TDA), non dominant arbo-real species (NDA), column-hunting ants or legionaryants (CHA) and high-temperature tolerating specialists(HTT). The characteristics of each functional group areas follows:1 SP: feed on a single type of prey.2 GP: hunt several types of prey.3 G: exploit diverse sources of food including plant
carbohydrates and proteins.4 OP: are non-specialists and non-competitive ants dif-
fering from the other generalist species by their abilityto persist in disturbed environments.
5 TDA: are omnivores that may occasionally forage inthe leaf litter. They are highly aggressive and competi-tive. They have large colonies with large and/or poly-domous nests and tolerate non-dominant species ontheir territories.
6 NDA: are nonaggressive and noncompetitive. Theyhave relatively small colonies (up to a few thousandindividuals).
7 CHA: are generalist predators characterized bynonperennial nesting habits and collective huntingbehavior.
8 HTT: exhibit a range of physiological, morphologicaland behavioral specialization. They include thermo-philic taxa and seed harvesters.It has to be noticed that there are not always clear
boundaries between different functional groups becausespecies often fall in a continuum of ecological functions(Huston 1994). This is particularly true for ants, whichhave wide and overlapping lifestyles. For this reason ourcategorization of ants to guilds are to some extent sub-jective and arbitrary. Nevertheless the concept is usefulto the extent that it helps in understanding the regula-tion of some aspects of biodiversity. By these functionalgroups, we aim to provide keys suited to explain somevariation of species diversity under different environ-mental conditions related to human destructive impactson natural habitats. The use of functional groups may behighly advantageous since it enables researchers tobypass the taxonomical difficulties. This work is the firstthat attempts a functional grouping of the ants for use inbiodiversity studies in West Africa.
RESULTS
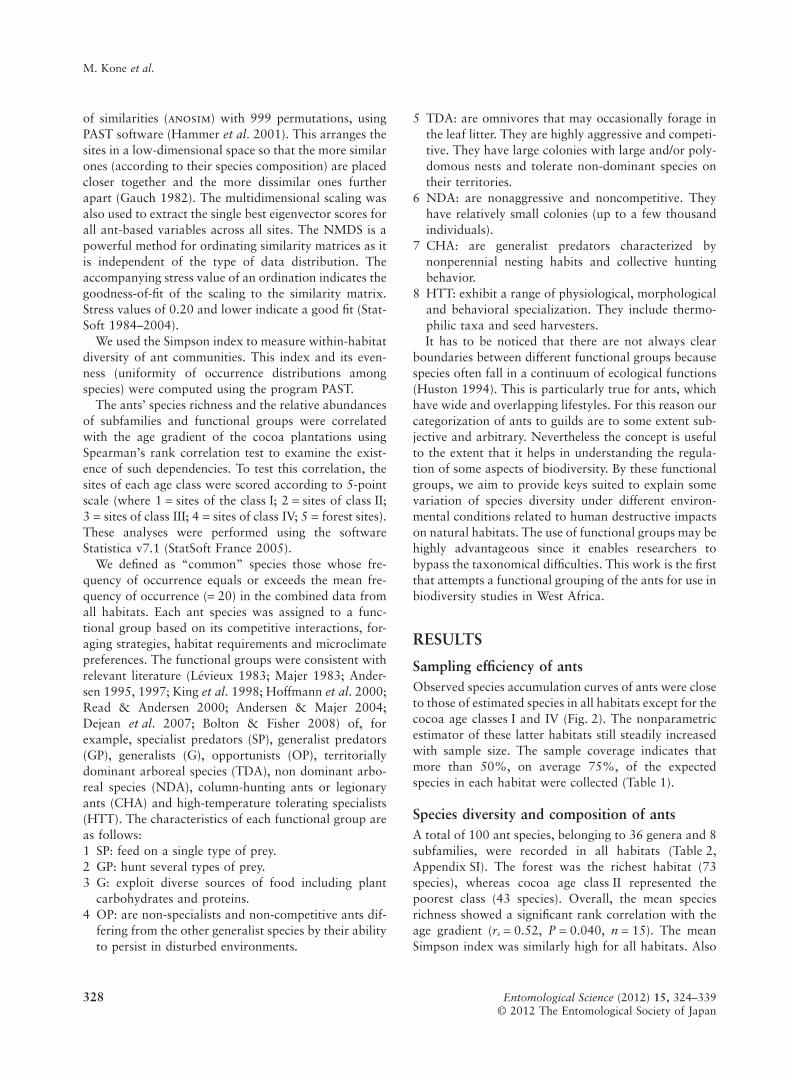
Sampling efficiency of antsObserved species accumulation curves of ants were closeto those of estimated species in all habitats except for thecocoa age classes I and IV (Fig. 2). The nonparametricestimator of these latter habitats still steadily increasedwith sample size. The sample coverage indicates thatmore than 50%, on average 75%, of the expectedspecies in each habitat were collected (Table 1).
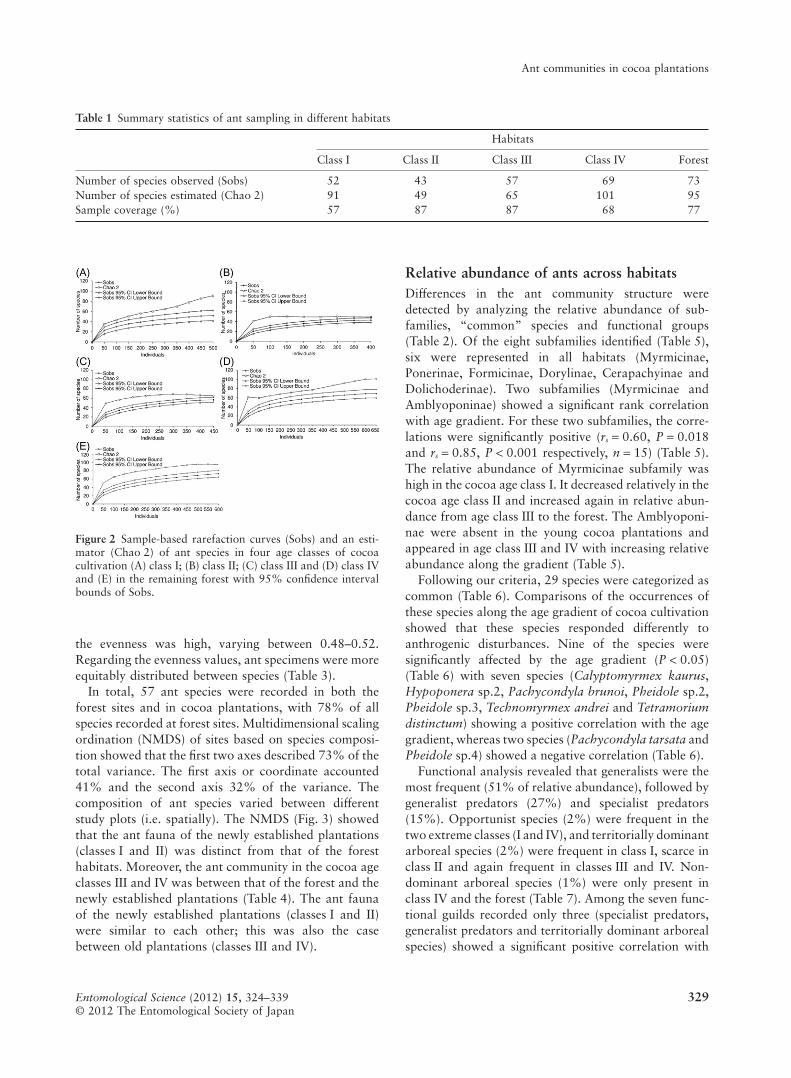
Species diversity and composition of antsA total of 100 ant species, belonging to 36 genera and 8subfamilies, were recorded in all habitats (Table 2,Appendix SI). The forest was the richest habitat (73species), whereas cocoa age class II represented thepoorest class (43 species). Overall, the mean speciesrichness showed a significant rank correlation with theage gradient (rs = 0.52, P = 0.040, n = 15). The meanSimpson index was similarly high for all habitats. Also
M. Kone et al.
Entomological Science (2012) 15, 324–339328© 2012 The Entomological Society of Japan
the evenness was high, varying between 0.48–0.52.Regarding the evenness values, ant specimens were moreequitably distributed between species (Table 3).
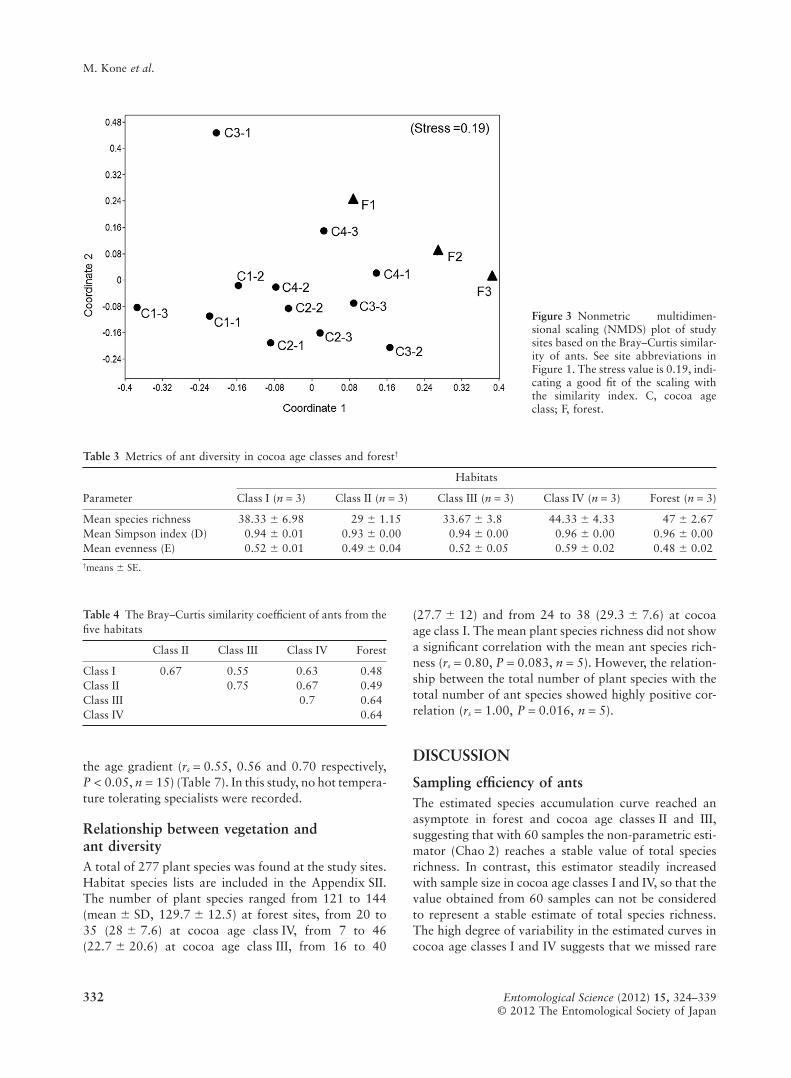
In total, 57 ant species were recorded in both theforest sites and in cocoa plantations, with 78% of allspecies recorded at forest sites. Multidimensional scalingordination (NMDS) of sites based on species composi-tion showed that the first two axes described 73% of thetotal variance. The first axis or coordinate accounted41% and the second axis 32% of the variance. Thecomposition of ant species varied between differentstudy plots (i.e. spatially). The NMDS (Fig. 3) showedthat the ant fauna of the newly established plantations(classes I and II) was distinct from that of the foresthabitats. Moreover, the ant community in the cocoa ageclasses III and IV was between that of the forest and thenewly established plantations (Table 4). The ant faunaof the newly established plantations (classes I and II)were similar to each other; this was also the casebetween old plantations (classes III and IV).
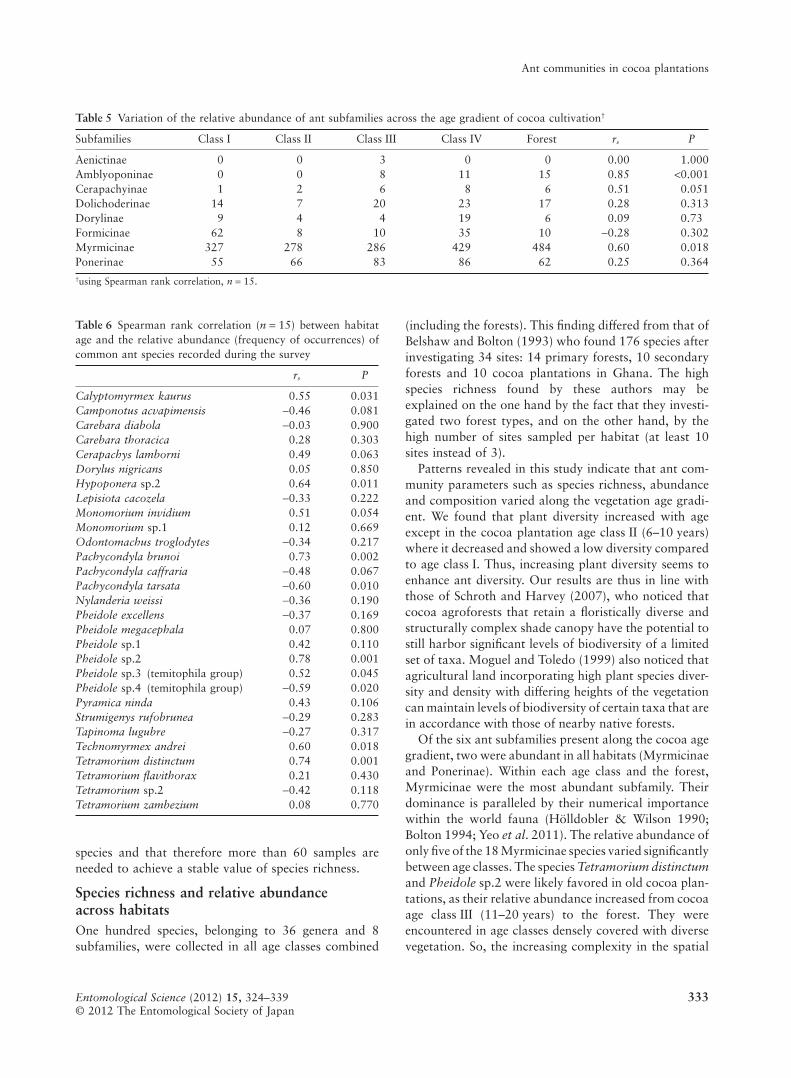
Relative abundance of ants across habitatsDifferences in the ant community structure weredetected by analyzing the relative abundance of sub-families, “common” species and functional groups(Table 2). Of the eight subfamilies identified (Table 5),six were represented in all habitats (Myrmicinae,Ponerinae, Formicinae, Dorylinae, Cerapachyinae andDolichoderinae). Two subfamilies (Myrmicinae andAmblyoponinae) showed a significant rank correlationwith age gradient. For these two subfamilies, the corre-lations were significantly positive (rs = 0.60, P = 0.018and rs = 0.85, P < 0.001 respectively, n = 15) (Table 5).The relative abundance of Myrmicinae subfamily washigh in the cocoa age class I. It decreased relatively in thecocoa age class II and increased again in relative abun-dance from age class III to the forest. The Amblyoponi-nae were absent in the young cocoa plantations andappeared in age class III and IV with increasing relativeabundance along the gradient (Table 5).
Following our criteria, 29 species were categorized ascommon (Table 6). Comparisons of the occurrences ofthese species along the age gradient of cocoa cultivationshowed that these species responded differently toanthrogenic disturbances. Nine of the species weresignificantly affected by the age gradient (P < 0.05)(Table 6) with seven species (Calyptomyrmex kaurus,Hypoponera sp.2, Pachycondyla brunoi, Pheidole sp.2,Pheidole sp.3, Technomyrmex andrei and Tetramoriumdistinctum) showing a positive correlation with the agegradient, whereas two species (Pachycondyla tarsata andPheidole sp.4) showed a negative correlation (Table 6).
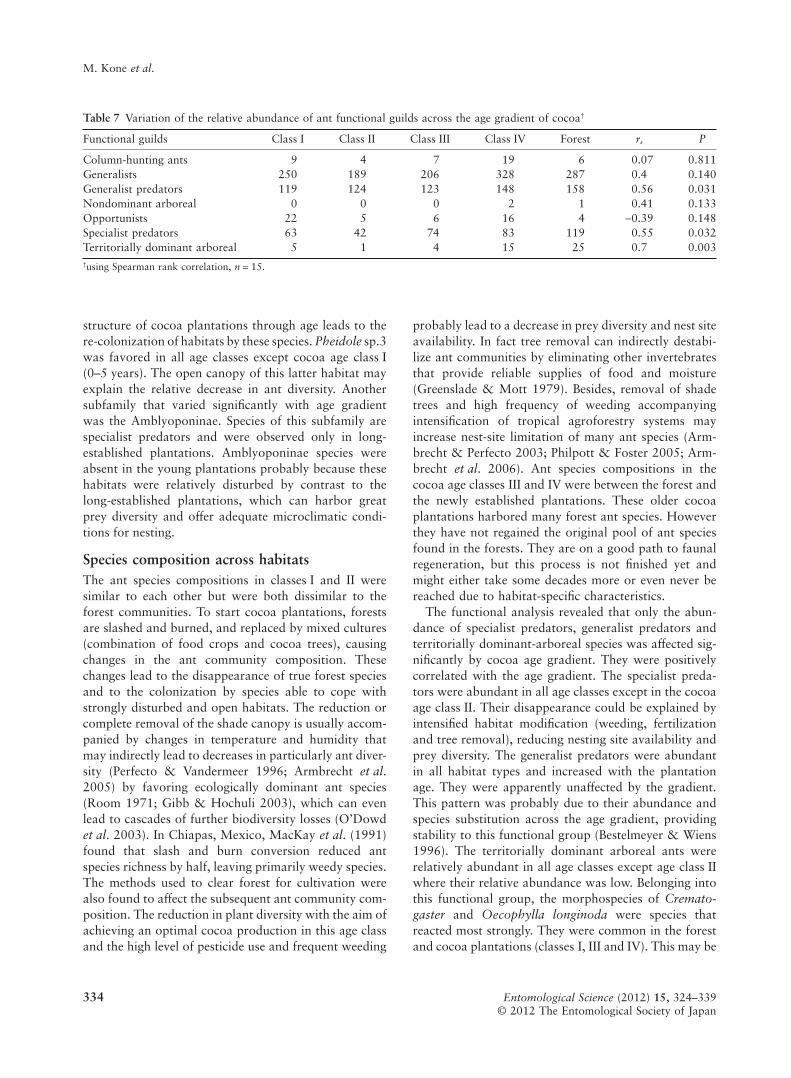
Functional analysis revealed that generalists were themost frequent (51% of relative abundance), followed bygeneralist predators (27%) and specialist predators(15%). Opportunist species (2%) were frequent in thetwo extreme classes (I and IV), and territorially dominantarboreal species (2%) were frequent in class I, scarce inclass II and again frequent in classes III and IV. Non-dominant arboreal species (1%) were only present inclass IV and the forest (Table 7). Among the seven func-tional guilds recorded only three (specialist predators,generalist predators and territorially dominant arborealspecies) showed a significant positive correlation with
Table 1 Summary statistics of ant sampling in different habitats
Habitats
Class I Class II Class III Class IV Forest
Number of species observed (Sobs) 52 43 57 69 73Number of species estimated (Chao 2) 91 49 65 101 95Sample coverage (%) 57 87 87 68 77
Figure 2 Sample-based rarefaction curves (Sobs) and an esti-mator (Chao 2) of ant species in four age classes of cocoacultivation (A) class I; (B) class II; (C) class III and (D) class IVand (E) in the remaining forest with 95% confidence intervalbounds of Sobs.
Ant communities in cocoa plantations
Entomological Science (2012) 15, 324–339 329© 2012 The Entomological Society of Japan
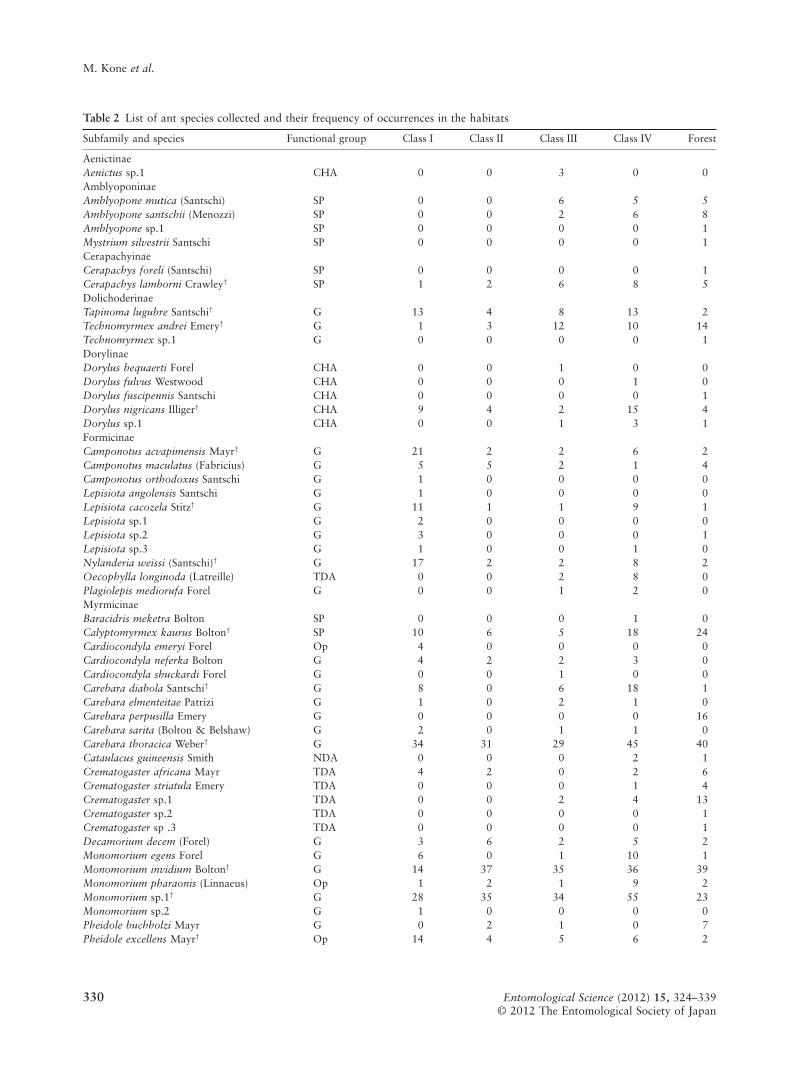
Table 2 List of ant species collected and their frequency of occurrences in the habitats
Subfamily and species Functional group Class I Class II Class III Class IV Forest
AenictinaeAenictus sp.1 CHA 0 0 3 0 0AmblyoponinaeAmblyopone mutica (Santschi) SP 0 0 6 5 5Amblyopone santschii (Menozzi) SP 0 0 2 6 8Amblyopone sp.1 SP 0 0 0 0 1Mystrium silvestrii Santschi SP 0 0 0 0 1CerapachyinaeCerapachys foreli (Santschi) SP 0 0 0 0 1Cerapachys lamborni Crawley† SP 1 2 6 8 5DolichoderinaeTapinoma lugubre Santschi† G 13 4 8 13 2Technomyrmex andrei Emery† G 1 3 12 10 14Technomyrmex sp.1 G 0 0 0 0 1DorylinaeDorylus bequaerti Forel CHA 0 0 1 0 0Dorylus fulvus Westwood CHA 0 0 0 1 0Dorylus fuscipennis Santschi CHA 0 0 0 0 1Dorylus nigricans Illiger† CHA 9 4 2 15 4Dorylus sp.1 CHA 0 0 1 3 1FormicinaeCamponotus acvapimensis Mayr† G 21 2 2 6 2Camponotus maculatus (Fabricius) G 5 5 2 1 4Camponotus orthodoxus Santschi G 1 0 0 0 0Lepisiota angolensis Santschi G 1 0 0 0 0Lepisiota cacozela Stitz† G 11 1 1 9 1Lepisiota sp.1 G 2 0 0 0 0Lepisiota sp.2 G 3 0 0 0 1Lepisiota sp.3 G 1 0 0 1 0Nylanderia weissi (Santschi)† G 17 2 2 8 2Oecophylla longinoda (Latreille) TDA 0 0 2 8 0Plagiolepis mediorufa Forel G 0 0 1 2 0MyrmicinaeBaracidris meketra Bolton SP 0 0 0 1 0Calyptomyrmex kaurus Bolton† SP 10 6 5 18 24Cardiocondyla emeryi Forel Op 4 0 0 0 0Cardiocondyla neferka Bolton G 4 2 2 3 0Cardiocondyla shuckardi Forel G 0 0 1 0 0Carebara diabola Santschi† G 8 0 6 18 1Carebara elmenteitae Patrizi G 1 0 2 1 0Carebara perpusilla Emery G 0 0 0 0 16Carebara sarita (Bolton & Belshaw) G 2 0 1 1 0Carebara thoracica Weber† G 34 31 29 45 40Cataulacus guineensis Smith NDA 0 0 0 2 1Crematogaster africana Mayr TDA 4 2 0 2 6Crematogaster striatula Emery TDA 0 0 0 1 4Crematogaster sp.1 TDA 0 0 2 4 13Crematogaster sp.2 TDA 0 0 0 0 1Crematogaster sp .3 TDA 0 0 0 0 1Decamorium decem (Forel) G 3 6 2 5 2Monomorium egens Forel G 6 0 1 10 1Monomorium invidium Bolton† G 14 37 35 36 39Monomorium pharaonis (Linnaeus) Op 1 2 1 9 2Monomorium sp.1† G 28 35 34 55 23Monomorium sp.2 G 1 0 0 0 0Pheidole buchholzi Mayr G 0 2 1 0 7Pheidole excellens Mayr† Op 14 4 5 6 2
M. Kone et al.
Entomological Science (2012) 15, 324–339330© 2012 The Entomological Society of Japan
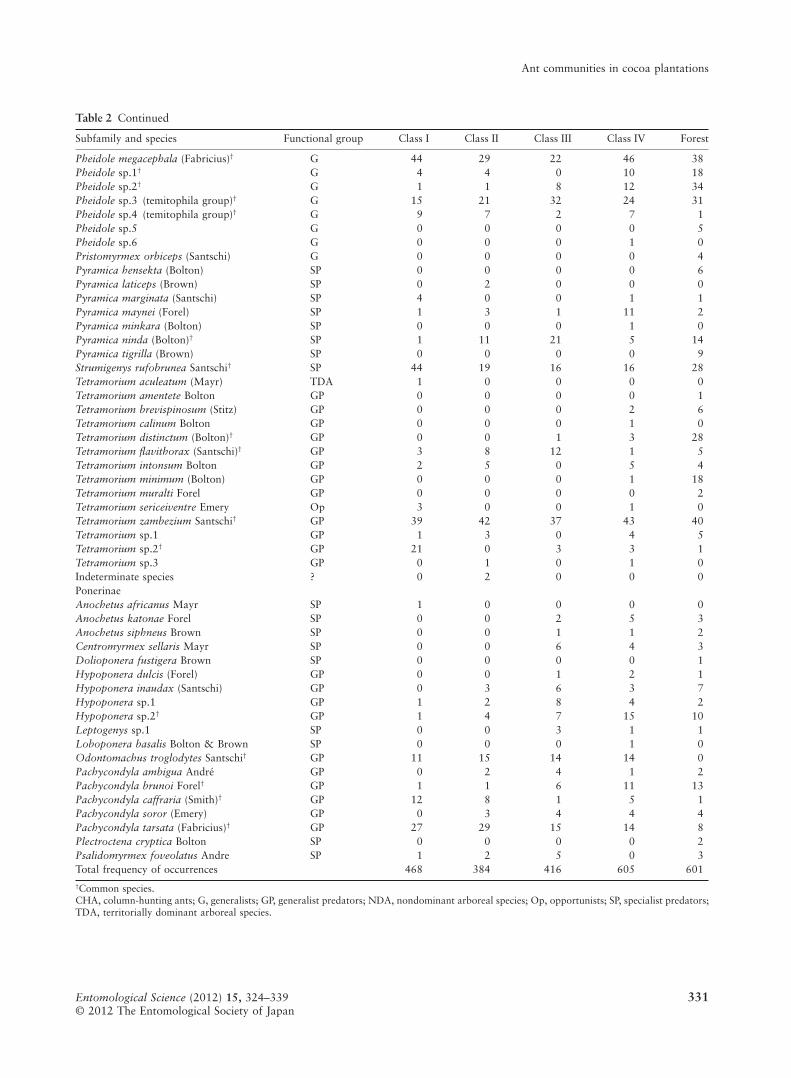
Table 2 Continued
Subfamily and species Functional group Class I Class II Class III Class IV Forest
Pheidole megacephala (Fabricius)† G 44 29 22 46 38Pheidole sp.1† G 4 4 0 10 18Pheidole sp.2† G 1 1 8 12 34Pheidole sp.3 (temitophila group)† G 15 21 32 24 31Pheidole sp.4 (temitophila group)† G 9 7 2 7 1Pheidole sp.5 G 0 0 0 0 5Pheidole sp.6 G 0 0 0 1 0Pristomyrmex orbiceps (Santschi) G 0 0 0 0 4Pyramica hensekta (Bolton) SP 0 0 0 0 6Pyramica laticeps (Brown) SP 0 2 0 0 0Pyramica marginata (Santschi) SP 4 0 0 1 1Pyramica maynei (Forel) SP 1 3 1 11 2Pyramica minkara (Bolton) SP 0 0 0 1 0Pyramica ninda (Bolton)† SP 1 11 21 5 14Pyramica tigrilla (Brown) SP 0 0 0 0 9Strumigenys rufobrunea Santschi† SP 44 19 16 16 28Tetramorium aculeatum (Mayr) TDA 1 0 0 0 0Tetramorium amentete Bolton GP 0 0 0 0 1Tetramorium brevispinosum (Stitz) GP 0 0 0 2 6Tetramorium calinum Bolton GP 0 0 0 1 0Tetramorium distinctum (Bolton)† GP 0 0 1 3 28Tetramorium flavithorax (Santschi)† GP 3 8 12 1 5Tetramorium intonsum Bolton GP 2 5 0 5 4Tetramorium minimum (Bolton) GP 0 0 0 1 18Tetramorium muralti Forel GP 0 0 0 0 2Tetramorium sericeiventre Emery Op 3 0 0 1 0Tetramorium zambezium Santschi† GP 39 42 37 43 40Tetramorium sp.1 GP 1 3 0 4 5Tetramorium sp.2† GP 21 0 3 3 1Tetramorium sp.3 GP 0 1 0 1 0Indeterminate species ? 0 2 0 0 0PonerinaeAnochetus africanus Mayr SP 1 0 0 0 0Anochetus katonae Forel SP 0 0 2 5 3Anochetus siphneus Brown SP 0 0 1 1 2Centromyrmex sellaris Mayr SP 0 0 6 4 3Dolioponera fustigera Brown SP 0 0 0 0 1Hypoponera dulcis (Forel) GP 0 0 1 2 1Hypoponera inaudax (Santschi) GP 0 3 6 3 7Hypoponera sp.1 GP 1 2 8 4 2Hypoponera sp.2† GP 1 4 7 15 10Leptogenys sp.1 SP 0 0 3 1 1Loboponera basalis Bolton & Brown SP 0 0 0 1 0Odontomachus troglodytes Santschi† GP 11 15 14 14 0Pachycondyla ambigua André GP 0 2 4 1 2Pachycondyla brunoi Forel† GP 1 1 6 11 13Pachycondyla caffraria (Smith)† GP 12 8 1 5 1Pachycondyla soror (Emery) GP 0 3 4 4 4Pachycondyla tarsata (Fabricius)† GP 27 29 15 14 8Plectroctena cryptica Bolton SP 0 0 0 0 2Psalidomyrmex foveolatus Andre SP 1 2 5 0 3Total frequency of occurrences 468 384 416 605 601†Common species.CHA, column-hunting ants; G, generalists; GP, generalist predators; NDA, nondominant arboreal species; Op, opportunists; SP, specialist predators;TDA, territorially dominant arboreal species.
Ant communities in cocoa plantations
Entomological Science (2012) 15, 324–339 331© 2012 The Entomological Society of Japan
the age gradient (rs = 0.55, 0.56 and 0.70 respectively,P < 0.05, n = 15) (Table 7). In this study, no hot tempera-ture tolerating specialists were recorded.
Relationship between vegetation andant diversityA total of 277 plant species was found at the study sites.Habitat species lists are included in the Appendix SII.The number of plant species ranged from 121 to 144(mean � SD, 129.7 � 12.5) at forest sites, from 20 to35 (28 � 7.6) at cocoa age class IV, from 7 to 46(22.7 � 20.6) at cocoa age class III, from 16 to 40
(27.7 � 12) and from 24 to 38 (29.3 � 7.6) at cocoaage class I. The mean plant species richness did not showa significant correlation with the mean ant species rich-ness (rs = 0.80, P = 0.083, n = 5). However, the relation-ship between the total number of plant species with thetotal number of ant species showed highly positive cor-relation (rs = 1.00, P = 0.016, n = 5).
DISCUSSION
Sampling efficiency of antsThe estimated species accumulation curve reached anasymptote in forest and cocoa age classes II and III,suggesting that with 60 samples the non-parametric esti-mator (Chao 2) reaches a stable value of total speciesrichness. In contrast, this estimator steadily increasedwith sample size in cocoa age classes I and IV, so that thevalue obtained from 60 samples can not be consideredto represent a stable estimate of total species richness.The high degree of variability in the estimated curves incocoa age classes I and IV suggests that we missed rare
Figure 3 Nonmetric multidimen-sional scaling (NMDS) plot of studysites based on the Bray–Curtis similar-ity of ants. See site abbreviations inFigure 1. The stress value is 0.19, indi-cating a good fit of the scaling withthe similarity index. C, cocoa ageclass; F, forest.
Table 3 Metrics of ant diversity in cocoa age classes and forest†
Parameter
Habitats
Class I (n = 3) Class II (n = 3) Class III (n = 3) Class IV (n = 3) Forest (n = 3)
Mean species richness 38.33 � 6.98 29 � 1.15 33.67 � 3.8 44.33 � 4.33 47 � 2.67Mean Simpson index (D) 0.94 � 0.01 0.93 � 0.00 0.94 � 0.00 0.96 � 0.00 0.96 � 0.00Mean evenness (E) 0.52 � 0.01 0.49 � 0.04 0.52 � 0.05 0.59 � 0.02 0.48 � 0.02†means � SE.
Table 4 The Bray–Curtis similarity coefficient of ants from thefive habitats
Class II Class III Class IV Forest
Class I 0.67 0.55 0.63 0.48Class II 0.75 0.67 0.49Class III 0.7 0.64Class IV 0.64
M. Kone et al.
Entomological Science (2012) 15, 324–339332© 2012 The Entomological Society of Japan
species and that therefore more than 60 samples areneeded to achieve a stable value of species richness.
Species richness and relative abundanceacross habitatsOne hundred species, belonging to 36 genera and 8subfamilies, were collected in all age classes combined
(including the forests). This finding differed from that ofBelshaw and Bolton (1993) who found 176 species afterinvestigating 34 sites: 14 primary forests, 10 secondaryforests and 10 cocoa plantations in Ghana. The highspecies richness found by these authors may beexplained on the one hand by the fact that they investi-gated two forest types, and on the other hand, by thehigh number of sites sampled per habitat (at least 10sites instead of 3).
Patterns revealed in this study indicate that ant com-munity parameters such as species richness, abundanceand composition varied along the vegetation age gradi-ent. We found that plant diversity increased with ageexcept in the cocoa plantation age class II (6–10 years)where it decreased and showed a low diversity comparedto age class I. Thus, increasing plant diversity seems toenhance ant diversity. Our results are thus in line withthose of Schroth and Harvey (2007), who noticed thatcocoa agroforests that retain a floristically diverse andstructurally complex shade canopy have the potential tostill harbor significant levels of biodiversity of a limitedset of taxa. Moguel and Toledo (1999) also noticed thatagricultural land incorporating high plant species diver-sity and density with differing heights of the vegetationcan maintain levels of biodiversity of certain taxa that arein accordance with those of nearby native forests.
Of the six ant subfamilies present along the cocoa agegradient, two were abundant in all habitats (Myrmicinaeand Ponerinae). Within each age class and the forest,Myrmicinae were the most abundant subfamily. Theirdominance is paralleled by their numerical importancewithin the world fauna (Hölldobler & Wilson 1990;Bolton 1994; Yeo et al. 2011). The relative abundance ofonly five of the 18 Myrmicinae species varied significantlybetween age classes. The species Tetramorium distinctumand Pheidole sp.2 were likely favored in old cocoa plan-tations, as their relative abundance increased from cocoaage class III (11–20 years) to the forest. They wereencountered in age classes densely covered with diversevegetation. So, the increasing complexity in the spatial
Table 5 Variation of the relative abundance of ant subfamilies across the age gradient of cocoa cultivation†
Subfamilies Class I Class II Class III Class IV Forest rs P
Aenictinae 0 0 3 0 0 0.00 1.000Amblyoponinae 0 0 8 11 15 0.85 <0.001Cerapachyinae 1 2 6 8 6 0.51 0.051Dolichoderinae 14 7 20 23 17 0.28 0.313Dorylinae 9 4 4 19 6 0.09 0.73Formicinae 62 8 10 35 10 -0.28 0.302Myrmicinae 327 278 286 429 484 0.60 0.018Ponerinae 55 66 83 86 62 0.25 0.364†using Spearman rank correlation, n = 15.
Table 6 Spearman rank correlation (n = 15) between habitatage and the relative abundance (frequency of occurrences) ofcommon ant species recorded during the survey
rs P
Calyptomyrmex kaurus 0.55 0.031Camponotus acvapimensis -0.46 0.081Carebara diabola -0.03 0.900Carebara thoracica 0.28 0.303Cerapachys lamborni 0.49 0.063Dorylus nigricans 0.05 0.850Hypoponera sp.2 0.64 0.011Lepisiota cacozela -0.33 0.222Monomorium invidium 0.51 0.054Monomorium sp.1 0.12 0.669Odontomachus troglodytes -0.34 0.217Pachycondyla brunoi 0.73 0.002Pachycondyla caffraria -0.48 0.067Pachycondyla tarsata -0.60 0.010Nylanderia weissi -0.36 0.190Pheidole excellens -0.37 0.169Pheidole megacephala 0.07 0.800Pheidole sp.1 0.42 0.110Pheidole sp.2 0.78 0.001Pheidole sp.3 (temitophila group) 0.52 0.045Pheidole sp.4 (temitophila group) -0.59 0.020Pyramica ninda 0.43 0.106Strumigenys rufobrunea -0.29 0.283Tapinoma lugubre -0.27 0.317Technomyrmex andrei 0.60 0.018Tetramorium distinctum 0.74 0.001Tetramorium flavithorax 0.21 0.430Tetramorium sp.2 -0.42 0.118Tetramorium zambezium 0.08 0.770
Ant communities in cocoa plantations
Entomological Science (2012) 15, 324–339 333© 2012 The Entomological Society of Japan
structure of cocoa plantations through age leads to there-colonization of habitats by these species. Pheidole sp.3was favored in all age classes except cocoa age class I(0–5 years). The open canopy of this latter habitat mayexplain the relative decrease in ant diversity. Anothersubfamily that varied significantly with age gradientwas the Amblyoponinae. Species of this subfamily arespecialist predators and were observed only in long-established plantations. Amblyoponinae species wereabsent in the young plantations probably because thesehabitats were relatively disturbed by contrast to thelong-established plantations, which can harbor greatprey diversity and offer adequate microclimatic condi-tions for nesting.
Species composition across habitatsThe ant species compositions in classes I and II weresimilar to each other but were both dissimilar to theforest communities. To start cocoa plantations, forestsare slashed and burned, and replaced by mixed cultures(combination of food crops and cocoa trees), causingchanges in the ant community composition. Thesechanges lead to the disappearance of true forest speciesand to the colonization by species able to cope withstrongly disturbed and open habitats. The reduction orcomplete removal of the shade canopy is usually accom-panied by changes in temperature and humidity thatmay indirectly lead to decreases in particularly ant diver-sity (Perfecto & Vandermeer 1996; Armbrecht et al.2005) by favoring ecologically dominant ant species(Room 1971; Gibb & Hochuli 2003), which can evenlead to cascades of further biodiversity losses (O’Dowdet al. 2003). In Chiapas, Mexico, MacKay et al. (1991)found that slash and burn conversion reduced antspecies richness by half, leaving primarily weedy species.The methods used to clear forest for cultivation werealso found to affect the subsequent ant community com-position. The reduction in plant diversity with the aim ofachieving an optimal cocoa production in this age classand the high level of pesticide use and frequent weeding
probably lead to a decrease in prey diversity and nest siteavailability. In fact tree removal can indirectly destabi-lize ant communities by eliminating other invertebratesthat provide reliable supplies of food and moisture(Greenslade & Mott 1979). Besides, removal of shadetrees and high frequency of weeding accompanyingintensification of tropical agroforestry systems mayincrease nest-site limitation of many ant species (Arm-brecht & Perfecto 2003; Philpott & Foster 2005; Arm-brecht et al. 2006). Ant species compositions in thecocoa age classes III and IV were between the forest andthe newly established plantations. These older cocoaplantations harbored many forest ant species. Howeverthey have not regained the original pool of ant speciesfound in the forests. They are on a good path to faunalregeneration, but this process is not finished yet andmight either take some decades more or even never bereached due to habitat-specific characteristics.
The functional analysis revealed that only the abun-dance of specialist predators, generalist predators andterritorially dominant-arboreal species was affected sig-nificantly by cocoa age gradient. They were positivelycorrelated with the age gradient. The specialist preda-tors were abundant in all age classes except in the cocoaage class II. Their disappearance could be explained byintensified habitat modification (weeding, fertilizationand tree removal), reducing nesting site availability andprey diversity. The generalist predators were abundantin all habitat types and increased with the plantationage. They were apparently unaffected by the gradient.This pattern was probably due to their abundance andspecies substitution across the age gradient, providingstability to this functional group (Bestelmeyer & Wiens1996). The territorially dominant arboreal ants wererelatively abundant in all age classes except age class IIwhere their relative abundance was low. Belonging intothis functional group, the morphospecies of Cremato-gaster and Oecophylla longinoda were species thatreacted most strongly. They were common in the forestand cocoa plantations (classes I, III and IV). This may be
Table 7 Variation of the relative abundance of ant functional guilds across the age gradient of cocoa†
Functional guilds Class I Class II Class III Class IV Forest rs P
Column-hunting ants 9 4 7 19 6 0.07 0.811Generalists 250 189 206 328 287 0.4 0.140Generalist predators 119 124 123 148 158 0.56 0.031Nondominant arboreal 0 0 0 2 1 0.41 0.133Opportunists 22 5 6 16 4 -0.39 0.148Specialist predators 63 42 74 83 119 0.55 0.032Territorially dominant arboreal 5 1 4 15 25 0.7 0.003†using Spearman rank correlation, n = 15.
M. Kone et al.
Entomological Science (2012) 15, 324–339334© 2012 The Entomological Society of Japan
related to the high density of understory vegetation inthe forest and in these cocoa age classes, because undersuch conditions high abundance of Homoptera may beexpected (Widodo et al. 2004). The reduction of habitatcomplexity due to a reduction of plant diversity withnesting sites and diminishing prey diversity associatedwith a wider range of treatment (weeding, pesticide use)in cocoa age class II could explain their decline.
Our investigations showed that the greater heteroge-neity provided by the shade plants in cocoa age classesmay be responsible for the high species richness andnumerical abundance of ants. Based on our results, suc-cessful conservation strategies for some of the ground-living arthropod communities in cocoa landscapes canbe achieved by keeping to the traditional form of cocoaagroforestry enriched with species that are useful tofarmers, including timber and native fruit trees.
ACKNOWLEDGMENTS
The authors thank all the farmers in Oumé region whoprovided access to their fields for this study, and to MrFirmin, Eric and Arnaud for their assistance in the field. Wethank Cartography and Remote Sensing Centre of BNETD(National Office of Technical Study and Development) forthe map of the study sites. We are grateful to Dr DethardtGoetze (Conservateur du Jardin Botanique, Institut desSciences Biologiques, de Botanique Générale et Particulière,Université de Rostock) for his assistance in positioningsampling point coordinates on a map. We also thank DrGary Alpert (Department of Environmental Health &Safety, Harvard University) and Dr Heather Axen (A MarshLife Sciences, Department of Biology, University ofVermont) for their critical reading and comments on thismanuscript. This work was founded by the German Min-istry of Education and Research (BMBF), through theBIOTA West project (FZ 01LC0617A2).
REFERENCES
Adis J, Lubin YD, Montgomery GG (1984) Arthropods fromthe canopy of inundated and terra firme forests nearManaus, Brazil, with critical considerations on thepyrethrum-fogging technique. Studies on NeotropicalFauna and Environment 19, 223–236.
Agosti D, Alonso LE (2000) The ALL protocol: a standardprotocol for the collection of ground-dwelling ants. In:Agosti D, Majer JD, Alonso LE, Schultz TR (eds) Ants:Standard Methods for Measuring and MonitoringBiodiversity, pp 204–206. Smithsonian Institution Press,Washington.
Agosti D, Johnson NF (2005) Antbase. World Wide Web elec-tronic publication [database on the Internet]. [Cited 21July 2011.] Available from URL: http://www.antbase.org
Agosti D, Majer JD, Alonso LE, Schultz TR (2000) Ants:Standard Methods for Measuring and Monitoring Biodi-versity. Smithsonian Institution Press, Washington.
Andersen AN (1990) The use of ant communities to evaluatechange in Australian terrestrial ecosystems: a review and arecipe. Proceedings of the Ecological Society of Australia16, 347–357.
Andersen AN (1991) Sampling communities of ground-foraging ants: pitfall catches compared with quadratcounts in an Australian tropical savanna. AustralianJournal of Ecology 16, 273–279.
Andersen AN (1993) Ants as indicators of restoration successat uranium mine in tropical Australia. RestorationEcology 1, 156–167.
Andersen AN (1995) A classification of Australian ant com-munities, based on functional groups which parallel plantlife-forms in relation stress and disturbance. Journal ofBiogeography 20, 15–29.
Andersen AN (1997) Functional groups and patterns oforganization in North American ant communities: a com-parison with Australia. Journal of Biogeography 24, 433–460.
Andersen AN, Majer JD (2004) Ants show the way downunder: invertebrates as bioindicators in land management.Frontier in Ecology and Environment 2, 291–298.
AntWeb (2002) Biodiversity Database. California Academy ofSciences (2002) [database on the Internet]. [Cited 21 July2011.] Available from URL: http://www.antweb.org
Armbrecht I, Gallego MC (2007) Testing ant predation on thecoffee berry borer in shaded and sun coffee plantations inColombia. Entomologia Experimentalis et Applicata 124,261–267.
Armbrecht I, Perfecto I (2003) Litter-twig dwelling ant speciesrichness and predation potential within a forest fragmentand neighboring coffee plantations of contrasting habitatquality in Mexico. Agriculture, Ecosystems and Environ-ment 97, 107–115.
Armbrecht I, Rivera L, Perfecto I (2005) Reduced diversity andcomplexity in the leaf-litter ant assemblage of Colombiancoffee plantations. Conservation Biology 19, 897–907.
Armbrecht I, Perfecto I, Silverman E (2006) Limitation ofnesting resources for ants in Colombian forests and coffeeplantations. Ecological Entomology 31, 403–410.
Barbault R, Cotnet C, Jouzel J, Mégie G, Sachs I, Weber J(2002) Johannesburg 2002. Sommet mondial du dével-oppement durable. Quels enjeux? Quelle contribution desscientifiques? Ministère des Affaires Etrangères – adpf,Paris.
Bawa SS, Kress WJ, Nadkarni NM, Lele S (2004) Beyondparadise- Meeting the challenges in tropical biology in the21st century. Biotropica 36, 437–446.
Belshaw R, Bolton B (1993) The effect of forest disturbance onleaf-litter ant fauna in Ghana. Biodiversity and Conserva-tion 2, 656–666.
Bestelmeyer B, Wiens JA (1996) The effects of land use on thestructure of ground foraging ant communities in theArgentine Chaco. Ecological Applications 6, 1225–1240.
Ant communities in cocoa plantations
Entomological Science (2012) 15, 324–339 335© 2012 The Entomological Society of Japan
Bestelmeyer BT, Agosti D, Alonso L, et al. (2000) Field tech-niques for the study of ground dwelling ants. In: Agosti D,Majer J, Alonso LE, Schultz TR (eds) Ants: StandardMethods for Measuring and Monitoring Biodiversity, pp122–144. Smithsonian Institution Press, Washington.
BNETD (Bureau National d’Etudes Techniques et de Dével-oppement) (2002). Centre de Cartographie et de Télédé-tection. Projet CIAT-TSBF/GF/2715-02.
Bolton B (1973) The ant genus Polyrhachis F. Smith in theEthiopian region (Hymenoptera: Formicidae). Bulletin ofthe British Museum (Natural History), Entomology 28,285–369.
Bolton B (1974) A revision of the Ponerine ant genus Plec-troctena F. Smith (Hymenoptera: Formicidae). Bulletin ofthe British Museum (Natural History), Entomology 30,311–338.
Bolton B (1975a) A revision of the ant genus Leptogenys Roger(Hymenoptera: Formicidae) in the Ethiopian region with areview of the Malagasy species. Bulletin of the BritishMuseum (Natural History), Entomology 31, 237–305.
Bolton B (1975b) A revision of the African ponerine ant genusPsalidomyrmex André (Hymenoptera: Formicidae). Bul-letin of the British Museum (Natural History), Entomol-ogy 32, 3–16.
Bolton B (1976) The ant tribe Tetramoriini (Hymenoptera:Formicidae). Constituent genera, review of smaller generaand review of Triglyphothrix Forel. Bulletin of the BritishMuseum (Natural History), Entomology 34, 283–379.
Bolton B (1981) A revision of the ant genera Meranoplus F.Smith, Dicroaspis Emery and Calyptomyrmex Emery(Hymenoptera: Formicidae) in the Ethiopian zoogeo-graphical region. Bulletin of the British Museum (NaturalHistory), Entomology 42, 43–81.
Bolton B (1982) Afrotropical species of the Myrmicine antgenera Cardiocondyla, Lepthothorax, Melissotarsus,Messor and Cataulacus (Formicidae). Bulletin of theBritish Museum (Natural History), Entomology 45, 307–370.
Bolton B (1983) The Afrotropical dacetine ants (Formicidae).Bulletin of the British Museum (Natural History), Ento-mology 46, 267–415.
Bolton B (1986) A taxonomic and biological review of thetetramoriine ant genus Rhoptromyrmex (Hymenoptera:Formicidae). Systematic Entomology 11, 1–17.
Bolton B (1987) A revision of the Solenopsis genus-groupand revision of Afrotropical Monomorium Mayr(Hymenoptera). Bulletin of the British Museum (NaturalHistory), Entomology 54, 263–452.
Bolton B (1994) Identification Guide to Ant Genera of theWorld. Harvard University Press, Cambridge, MA.
Bolton B (1995) A New General Catalogue of the Ants of theWorld. Harvard University Press, Cambridge, MA.
Bolton B (2000) The ant tribe Dacetini. Memoirs of the Ameri-can Entomological Institute 65, 1–1028.
Bolton B (2003) Synopsis and classification of Formicidae.Memoirs of the American Entomological Institute 71,1–370.
Bolton B (2011) An Online Catalog of Ants of the World.[Cited 21 July 2011.] Available from URL: http://www.antcat.org/catalog/index
Bolton B, Brown W Jr (2002) Loboponera gen. n. and a reviewof the Afrotropical Plectroctena genus group(Hymenoptera: Formicidae). Bulletin of the BritishMuseum (Natural History), Entomology 71, 1–18.
Bolton B, Fisher BL (2008) Afrotropical ants of the ponerinegenera Centromyrmex Mayr, Promyopias Santschi gen.rev. and Feroponera gen. n., with a revised key to generaof African Ponerinae (Hymenoptera: Formicidae).Zootaxa 1929, 1–37.
Bolton B, Fisher BL (2011) Taxonomy of Afrotropical andWest Palaearctic ants of the ponerine genus HypoponeraSantschi (Hymenoptera: Formicidae). Zootaxa 2843,1–118.
Bolton B, Gotwald WH Jr, Leroux J-M (1976) A new westAfrican ant of the genus Plectroctena with ecological notes(Hymenotera: Formicidae). Annales de l’Universitéd’Abidjan, Série E, Ecologie 9, 371–381.
Bos MM, Steffan-Dewenter I, Tscharntke T (2007) The con-tribution of cacao agroforests to the conservation of lowercanopy ant and beetle diversity in Indonesia. Biodiversityand Conservation 16, 2429–2444.
Brown JWL (1978) Contribution toward a reclassification ofthe Formicidae. Part VI. Ponerinae, tribe Ponerini, sub-tribe Odontomachiti. Section B. Genus Anochetus andBibliography. Studia Entomologica 20, 1–4.
Buckley RC (1982) Ant-plant interactions: a world review. In:Buckley RC (ed.) Ant-Plant Interactions in Australia,pp 111–141. W. Junk Publishers, The Hague.
Campbell AJ, Tanton MT (1981) Effects of fire on the inver-tebrate fauna of soil and litter of a eucalypt forest. In: GillAM, Groves RH, Noble IR (eds) Fire and the AustralianBiota, pp 215–241. Australian Academy of Sciences,Canberra.
Carroll CR, Janzen DH (1973) Ecology of foraging by ants.Annual Review of Ecology and Systematics 4, 231–257.
Cassano CR, Schroth G, Faria D, Delabie JHC, Bede L (2009)Landscape and farm scale management to enhance biodi-versity conservation in the cocoa producing region ofsouthern Bahia, Brazil. Biodiversity and Conservation 18,577–603.
Chatelain C, Dao H, Gautier L, Spichiger R (2003) Forestcover changes in Côte d’Ivoire and upper Guinea. In:Poorter L, Bongers F, Kouamé FN, Hawthorne WD (eds)An Ecological Atlas of Woody Plant Species: Biodiversityof West Africa Forests, pp 15–31. CABI, Wallingford.
Colwell RK (2005) Estimates: Statistical Estimation of SpeciesRichness and Shared Species from Samples. Department ofEcology and Evolutionary Biology, University of Con-necticut. Ver. 7.5. User’s Guide and Application. [Cited16 September 2010.] Available from URL: http://purl.oclc.org/estimates
Dejean A, Djiéto-Lordon C, Durand JL (1997) Ant mosaic inoil palm plantations of the South-west province of
M. Kone et al.
Entomological Science (2012) 15, 324–339336© 2012 The Entomological Society of Japan
Cameroon: impact on a leaf miner chrysomelid beetle.Journal of Economic Entomology 90, 1092–1096.
Dejean A, Corbara B, Orivel J, Leponce M (2007) Rainforestcanopy ants: the implications of territoriality and preda-tory behavior. Functional Ecosystems and Communities1, 105–120.
Delabie JHC, Jahyny B, do Nascimento IC et al. (2007) Contri-bution of cocoa plantations to the conservation of nativeants (Insecta: Hymenoptera: Formicidae) with a specialemphasis on the Atlantic Forest fauna of southern Bahia,Brazil. Biodiversity and Conservation 16, 2359–2384.
Erwin TL (1983) Beetles and other insects of tropical forestcanopies at Manaus, Brazil, sampled by insecticidalfogging. In: Sutton SL, Whitmore TC, Chadwick AC (eds)Tropical Rainforest: Ecology and Management, pp 59–75.Blackwell Scientific Publications, Oxford.
Fernández F (2004) The American species of the myrmicine antgenus Carebara Westwood (Hymenoptera: Formicidae).Caldasia 26, 191–238.
Fisher BL (1998) Ant diversity patterns along an elevationalgradient in the Réserve Spéciale d’Anjanaharibe-Sudand on the Western Masoala Peninsula, Madagascar. Fiel-diana Zoology 90, 39–67.
Fisher BL (1999) Improving inventory efficiency: a case studyof leaf litter ant diversity in Madagascar. EcologicalApplications 9, 714–731.
Fisher BL, Robertson HG (2002) Comparison and origin offorest and grassland ant assemblages in the high plateau ofMadagascar (Hymenoptera: Formicidae). Biotropica 34,155–167.
Fittkau EJ, Klinge H (1973) On biomass and trophic structureof the Central Amazonian rainforest ecosystem. Biotro-pica 5, 2–14.
Floren A, Linsenmair KE (1997) Diversity and recoloni-sation dynamics of selected arthropod groups on differenttree species in lowland rain forest in Sabah, Malaysia. In:Stork NE, Adis J, Didham RK (eds) Canopy Arthropods,pp 344–381. Chapman & Hall, London.
Gauch JHG (1982) Multivariate Analysis in CommunityEcology. Cambridge University Press, Cambridge.
Gibb H, Hochuli DF (2003) Colonisation by a dominant antfacilitated by anthropogenic disturbance: effects on antassemblage composition, biomass and resource use. Oikos103, 469–478.
Greenslade PJM, Greenslade P (1984) Invertebrates in environ-mental assessment. Environment and Planning 3, 13–15.
Greenslade PJM, Mott JJ (1979) Ants of native and sownpastures in the Katherine area, Northern Territory, Aus-tralia (Hymenoptera: Formicidae). In: Crosby T K, Pot-tinger R P (eds) Proceedings of the 2nd AustralasianConference on Grassland Invertebrate Ecology. Govern-ment Printer, Wellington.
Guillaumet JL, Adjanohoune E (1971) La végétation de la Côted’Ivoire. In: Avenard J-M, Adjanohoune E, Eldin M et al(eds) Le milieu naturel De La Côte d’Ivoire, pp 161–262.Mémoire Office de la recherche scientifique et techniqueoutre-mer, Paris.
Hammer Ø, Harper DAT, Ryan PD (2001) PAST: paleonto-logical statistics software package for education and dataanalysis. Palaeontologia Electronica 4, 1–9.
Hoffmann BD, Andersen AN (2003) Responses of ants todisturbance in Australia, with particular reference to func-tional groups. Austral Ecology 28, 444–464.
Hoffmann BD, Griffiths AD, Andersen AN (2000) Responsesof ant communities to dry sulphur deposition from miningemissions in semi-arid tropical Australia, with implica-tions for use of functional groups. Austral Ecology 25,653–663.
Hölldobler B, Wilson EO (1990) The Ants. Harvard UniversityPress, Cambridge, MA.
Huston AM (1994) Biological Diversity: The Coexistence ofSpecies on Changing Landscapes. Cambridge UniversityPress, New York.
Jones CG, Lawton JH, Schachak M (1994) Organisms as eco-systems engineers. Oikos 69, 373–386.
Kaspari M (1996a) Litter ant patchiness at the 1m2 scale:disturbance dynamics in three neotropical forests. Oeco-logia 107, 265–273.
Kaspari M (1996b) Testing resource-based models of patchi-ness in four neotropical litter ant assemblages. Oikos 76,443–454.
Kenne M, Corbara B, Dejean A (1999) Impact des fourmissur les plantes cultivées en milieu tropical. L’AnnéeBiologique 38, 195–212.
Kessler M, Kebler PJ, Gradstein SR, Bach K, Schmull M,Pitopang R (2005) Tree diversity in primary forest anddifferent land use systems in Central Sulawesi, Indonesia.Biodiversity and Conservation 14, 547–560.
King JR, Andersen AN, Cutter DA (1998) Ants as bioindica-tors of habitat disturbance: validation of the functionalgroup model for Australia’s humid tropics. Biodiversityand Conservation 7, 1627–1638.
Lévieux J (1983) Feeding strategies of ants in different WestAfrican savannas. In: Jaisson P (ed.) Social Insects inthe Tropics, pp 245–252. Presse de l’Université Paris 8,Paris.
Levings SC, Windsor DM (1985) Litter arthropod populationsin a tropical deciduous forest: relationships between yearsand arthropod groups. Journal of Animal Ecology 54,61–69.
Lobry de Bruyn LA (1999) Ants as bioindicators of soil func-tion in rural environments. Agriculture, Ecosystems andEnvironment 74, 425–441.
Lobry de Bruyn LA, Conacher AJ (1994) The bioturbationactivity of ants in agricultural and naturally vegetatedhabitats in semi-arid environments. Australia Journal ofSoil Research 32, 555–570.
Longino LT (2000) What to do with data. In: Agosti D, MajerJD, Alonso LE, Schultz TR (eds) ANTS: StandardMethods for Measuring and Monitoring Biodiversity, pp186–203. Smithsonian Institution Press, Washington.
Lugo AE (1988) Estimating reductions in diversity of tropicalforest species. In: Wilson EO (ed.) Biodiversity, pp 58–70.National Academy Press, Washington.
Ant communities in cocoa plantations
Entomological Science (2012) 15, 324–339 337© 2012 The Entomological Society of Japan
MacKay WP, Rebeles A, Arredondo HC, Rodriguez A, Gonza-lez DA, Vinson SB (1991) Impact of the slashing andburning of a tropical rainforest on the native antfauna (Hymentoptera: Formicidae). Sociobiology 18,257–268.
Magurran AE (2004) Measuring Biological Diversity. Black-well Science Ltd., Oxford.
Majer JD (1976) The influence of ants and ant manipulationon cocoa farm fauna. Journal of Applied Ecology 13,157–175.
Majer JD (1983) Ants: bio-indicators of minesite rehabilita-tion, land-use, and land conservation. EnvironmentalManagement 7, 375–385.
Majer JD (1985) Recolonisation by ants of rehabilitatedmineral sand mines on North Stradbroke Island, Queen-sland, with particular reference to seed removal. Austra-lian Journal of Ecology 10, 31–48.
Martin JEH (1983) Les insectes et Arachnides du Canada,partie I: Récolte, Préparation et Conservation desInsectes, des Acariens et des Araignées. Direction généralede la recherche, Agriculture Canada, Publication 1643,Ottawa.
Moguel P, Toledo VM (1999) Biodiversity conservationin traditional coffee systems of Mexico. ConservationBiology 13, 11–21.
Nakamura A, Catterall CP, House APN, Kitching RL, BurwellCJ (2007) The use of ants and other soil and litter arthro-pods as bio-indicators of the impacts of rainforest clearingand subsequent land use. Journal of Insect Conservation11, 177–186.
Niemelä J, Kotze J, Ashworth A et al. (2000) The searchfor common anthropogenic impacts on biodiversity:a global network. Journal of Insect Conservation 4,3–9.
O’Dowd DJ, Green PT, Lake PS (2003) Invasional“meltdown” on an oceanic island. Ecology Letter 6, 812–817.
Perfecto I, Castiñeiras A (1998) Deployment of the predaceousants and their conservation in agroecosystems. In: BarbosaP (ed.) Conservation Biological Control, pp 269–289.Academic Press, New York.
Perfecto I, Vandermeer J (1996) Microclimatic changes and theindirect loss of ant diversity in a tropical agroecosystem.Oecologia 108, 577–582.
Philpott SM, Armbrecht I (2006) Biodiversity in tropical agro-forests and the ecological role of ants and ant diversity inpredatory function. Ecological Entomology 31, 369–377.
Philpott SM, Foster PF (2005) Nest-site limitation in coffeeagroecosystems: artificial nests maintain diversity of arbo-real ants. Ecological Application 15, 1478–1485.
Read JL, Andersen AN (2000) The value of ants as earlywarning bioindicators: responses to pulsed grazing at anAustralian arid zone locality. Journal of Arid Environ-ments 45, 231–251.
Reid WV, Miller KR (1989) Keeping Options Alive: The Sci-entific Basis for Conserving Biodiversity. World ResourcesInstitute, New York.
Rice RA, Greenberg R (2000) Cacao cultivation andthe conservation of biological diversity. Ambio 29,81–87.
Room PM (1971) The relative distribution of ant species inGhana’s cocoa farms. Journal of Animal Ecology 40, 735–751.
Room PM (1975) Distributions of ant species in cocoa plan-tations in Papua New Guinea. Journal of Applied Ecology12, 47–61.
Ruf F, Schroth G (2004) Chocolate forests and monocultures:a historical view of cocoa growing and its conflicting rolein tropical deforestation and forest conservation. In:Schroth G, Fonseca GAB, Harvey CA, Gascon C, Vascon-celos HL, Izac A-MN (eds) Agroforestry and BiodiversityConservation in Tropical Landscapes, pp 107–134. IslandPress, Washington.
Schroth G, Harvey CA (2007) Biodiversity conservation incocoa production landscape: an overview. Biodiversityand Conservation 16, 2237–2244.
Schroth G, Fonseca GAB, Harvey CA, Gascon C, VasconcelosHL (2004) Agroforestry and Biodiversity Conservation inTropical Landscapes. Island Press, Washington.
Seifert B (2003) The ant genus Cardiocondyla (Insecta:Hymenoptera: Formicidae) – A taxonomic revision of theC. elegens, C. bulgarica, C. batesii, C. nuda, C. shuckardi,C. stambuloffii, C. wroughtonii, C. emeryi and C. minu-tior species groups. Annalen des NaturhistorischenMuseums in Wien 104, 203–338.
StatSoft France (2005) STATISTICA for Windows [Software-System for Data-analyses], Version 7.1. [Cited 16 Septem-ber 2010.] Available from URL: http://www.statsoft.com
StatSoft Inc (1984–2004). STATISTICA for Windows[Software-System for Data-analyses] Version 7.0. [Cited16 September 2010.] Available from URL: http://www.statsoft.com
Stork NE, Brendell MJD (1990) Variation in the insect fauna ofSulawesi trees with season, altitude and forest type. In:Knight WJ, Holloway JD (eds) Insects and the Rainforestsof South East Asia (Wallacea), pp 173–190. Royal Ento-mological Society, London.
Tscharntke T, Klein AM, Kruess A, Steffan-Dewenter I, ThiesC (2005) Landscape perspectives on agricultural intensi-fication and biodiversity-ecosystem service management.Ecology Letters 8, 857–874.
Van Mele P (2008) A historical review of research on theweaver ant Oecophylla in biological control. Agriculturaland Forest Entomology 10, 13–22.
Vandermeer J, Perfecto I, Nuñez GI, Philpott S, Ballinas AG(2002) Ants (Azteca sp.) as potential biological controlagents in shade coffee production in Chiapas, Mexico.Agroforestry Systems 56, 271–276.
Waltert M, Mardiastuti A, Mühlenberg M (2004) Effects ofland use on bird species richness in Sulawesi, Indonesia.Conservation Biology 18, 1339–1346.
Wang M (2003) A monographic revision of the ant genusPristomyrmex (Hymenoptera: Formicidae). BulletinMuseum of Comparative Zoology 157, 383–542.
M. Kone et al.
Entomological Science (2012) 15, 324–339338© 2012 The Entomological Society of Japan
Watt AD, Stork NE, Eggleton P et al. (1997a) Impact offorest loss and regeneration on insect abundance anddiversity. In: Watt AD, Stork NE, Hunter MD (eds)Forests and Insects, pp 274–286. Chapman & Hall,London.
Watt AD, Stork NE, McBeath C, Lawson GL (1997b) Impactof forest management on insect abundance and damage ina lowland tropical forest in southern Cameroon. Journalof Applied Ecology 34, 985–998.
Way MJ, Khoo KC (1992) Role of ants in pest management.Annual Review of Entomology 37, 479–503.
Widodo SE, Naito T, Mohamed M, Hashimoto Y (2004)Effects of selective logging on the arboreal ants of aBornean rainforest. Entomological Science 7, 341–349.
Wilson EO (1987) The arboreal ant fauna of Peruvian Amazonforests: a first assessment. Biotropica 19, 245–251.
Wilson EO (1995) The Diversity of Life. Harvard UniversityPress, Cambridge, MA.
Yeo K, Konate S, Tiho S, Camara KS (2011) Impacts of landuse types on ant communities in a tropical forest margin(Oumé – Côte d’Ivoire). African Journal of AgriculturalResearch 6, 260–274.
SUPPORTING INFORMATION
Additional Supporting Information may be found in theonline version of this article:
APPENDIX SI List of ant species collected and theirfrequency of occurrences in cocoa age classes and forestsites.APPENDIX SII List of plant species collected and theirabundances in the habitats.
Please note: Wiley-Blackwell is not responsible for thecontent or functionality of any supporting materialssupplied by the authors. Any queries (other than missingmaterial) should be directed to the corresponding authorfor the article.
Ant communities in cocoa plantations
Entomological Science (2012) 15, 324–339 339© 2012 The Entomological Society of Japan