Embed Size (px)
Citation preview

Challenges Faced In Developing Safe Interoperable Systems in Healthcare
Tracy Rausch, CCEFounder and CEO
DocBox Inc
Challenge
Develop and implement of open, safe and effective interoperable system of systems, based on clinical requirements, which enables the creation of evidence based improvements in clinical care.

Requirements from Providers• Complete and Accurate Data• Safe Systems• Secure Systems• Increased Efficiency
– Clinical Workflow– Device and Systems Maintenance
• Improved Quality• Flexible (Inpatient to Outpatient)• Able to deal with new and legacy equipment• Scalable• Facilitation of decision support and data visualization


Problems
• ~400,000 people a year die from medical errors.• $5000 - $7000 per hospital admit is the estimated
cost of adverse events.• Data has incorrect or inaccurate time stamps• Data is incomplete and incorrect• Data lacks context• Lack of data models systems level data models
which describe the patient

Current Device System Solutions
• Vertically Integrated• Proprietary• Lacks Data Models• Lacks correct time stamps• Lacks contextually complete data• Alarms are currently mostly limit alarms or
single source alarms.

What about EHR’s?What about Big Data?
What about Quality Improvement Systems

ACT – appeared to have been checked 22 minutes after heparin administration (was actually 30 min). Could stroke.Cause – ACT device time incorrect(Note - device does not use NTP)
10:54
11:02
ACT Machine
8 minutes
EMR time-stamp error
Data protocol converter
MetaVision EMR screen
ACT Machine
J. Goldman, MD MGH

BP Cuff-SpO2 Interaction (same arm)“smarter algorithms” need to consider time course of device operations and interactions
J. Goldman, MD MGH

Experiment: Pulse Oximetry Simulator is set to create transient de-saturation99%->70%->99%
2 sec averaging time
8 sec averaging time
Pulse Ox is set to: 16 sec averaging time
Julian M. Goldman, MD / MGH
Photos of pulse ox screens when they display the lowest saturation
What is the real O2saturation?Which value will be recorded in EHR or used by analytics engine

Neonatal Red and Infrared Data
Pulse oximeter signal averaging can hide physiological changes
6 seconds76% 31%
Studies suggests that in pre-term infants the desaturation rate may be as high a 7-10% per second (Poets et.al. Early Human Dev. 26, 1-12).
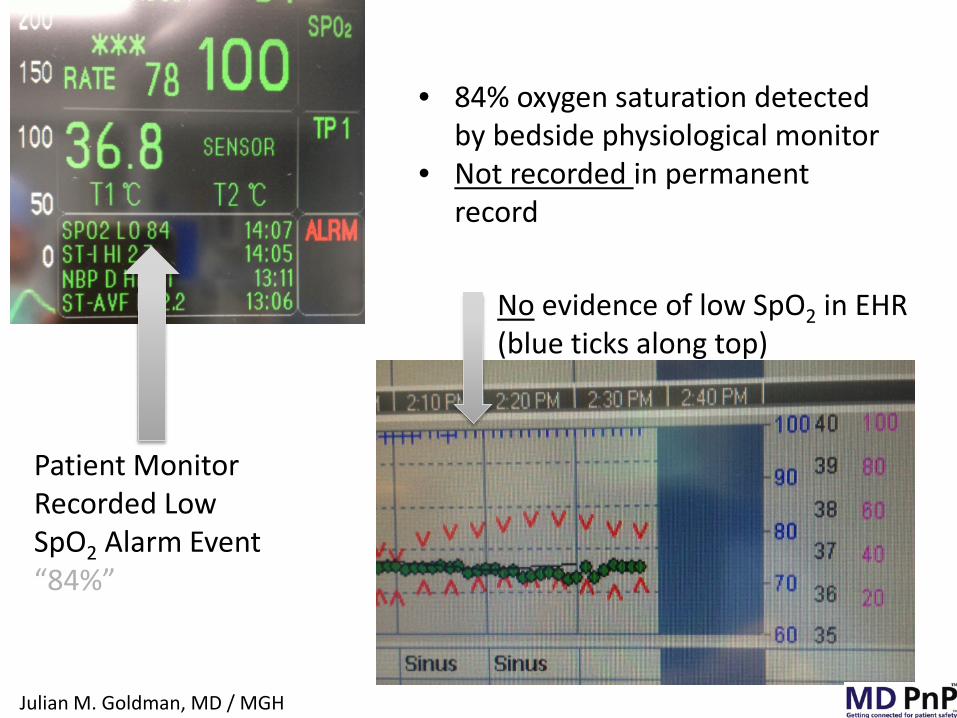
Patient Monitor Recorded Low SpO2 Alarm Event “84%”
No evidence of low SpO2 in EHR(blue ticks along top)
• 84% oxygen saturation detected by bedside physiological monitor
• Not recorded in permanent record
Julian M. Goldman, MD / MGH
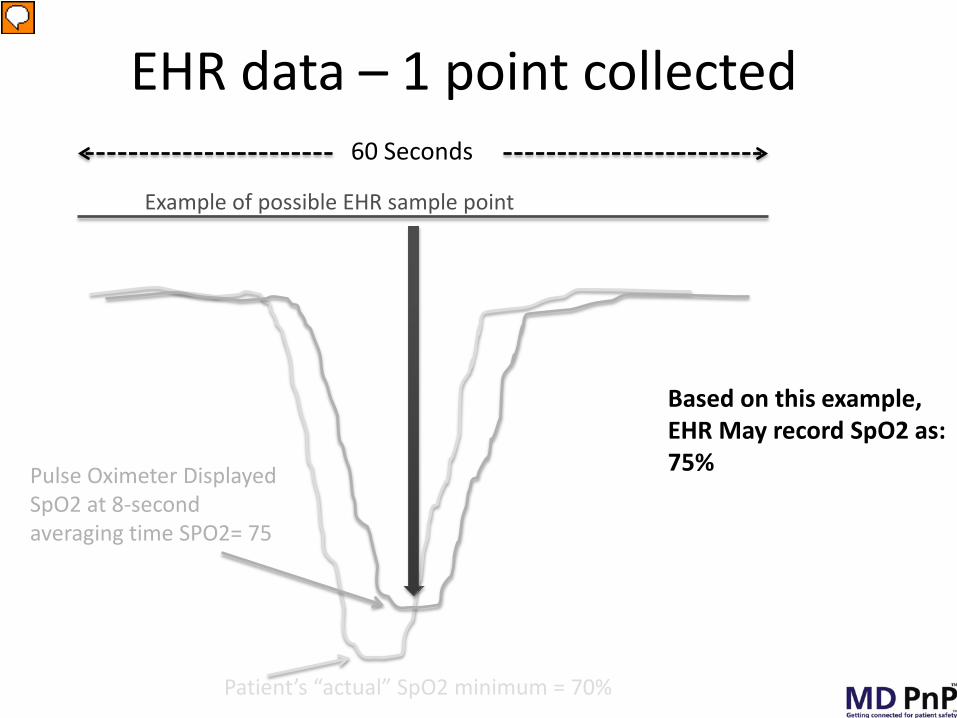
EHR data – 1 point collected
Patient’s “actual” SpO2 minimum = 70%
Pulse Oximeter Displayed SpO2 at 8-second averaging time SPO2= 75
60 Seconds
Example of possible EHR sample point
Based on this example,EHR May record SpO2 as:75%

Sources of variation in EHR documentation d/t Data Sampling
Patient’s “actual” SpO2 minimum = 70%
Pulse Oximeter Displayed SpO2 at 8-second averaging time SPO2= 75
60 Seconds
Example of possible EHR sample points for 1-minute recording
Based on this example,EHR May record SpO2 as:98%92%80%75%Etc.


The Future is Now!

The Future
• Requirements Requirements Requirements• Consider the System• Re-think Architecture• Open Communication across vendors• Design the System to be a learning System• Learning System (black box recorder)• Regulatory Considerations• Modeling of data using a patient/data-centric
approach.

ICE Supervisor
NetworkController
ICE Interface
DataLogger
ExternalInterface
Medical Device
ICE Interface
Other Equipment
Integrated Clinical Environment (ICE)
Functional Elements of the Integrated Clinical EnvironmentASTM standard F2761-2009Published January 2010 Clinician
Functional Elements of the Integrated Clinical Environment
Patient

Data-centric Approach
Device 1 Device 2 Device n
Medical App 1
Medical App 2
Medical App n
EMR/Other IS Systems
DDS RTPS Bus
ICE Controller
External Interface
Device Interface
Supervisor
Data Logger

Smart PCA System AppPatient
Demographics and History
Medication Conditions Orders
Sensor Data
Enterprise
Point of Care
CDS Algorithm(s)
Observations
Lab Results
PCA Pump(Actuator)
Other Infusions
Other Devices
Safety Interlock
Clinician
Patient

Hospital Unit
ICE ICE ICE
Pharmacy EHRLab
ICE Coordinator
ADT
Hospital Unit
ICE ICE ICE
Data Warehouse
Warehouse
Other Information
Systems
ICE System within Hospital IT Systems

Data Warehouse
Single Patient DB and App
Multiple Patient DB
ICE Data Bus (DDS)
ICE System App
ICE Clinical App
ICE Systems Apps Clinical Documentation App
CDS App 1 CDS App 3
CDS App 2
Medical Device (MD)
MD 1MD 2
MD 3MD n
ICE Manager
CDS App a
CDS App n
Hospital IT systems
EMR ADT Other
EnterpriseICE Systems Apps
ICE Coordinator Data Bus (DDS)
CDS App 2CDS App n
Clinical DocumentationCDS App 1
ICE Coordinator
Interface
1 2 3
Architectural Diagram

Coordinator 1 Coordinator 2 Coordinator n
Data Warehouse
ICE Manager ICE Manager ICE Manager

Patient Information Model
• System of Systems model based on the patients data.
DDS RTPS Bus

Hospital Unit
ICE ICE ICE
Pharmacy EHRLab
ICE Coordinator
ADT
Hospital Unit
ICE ICE ICE
Data Warehouse
Warehouse
Real Time AnalyticsPatient Specific CDS
Unit Level Analytics
Clinical Studies and
Outcomes Analytics
Hospital and Hospital Systems Analytics
Categories of AnalyticsReal Time
Long Term & Retrospective
Other Information
Systems
ICE and Analytics


Relationships of Data
Device
Measurement
UserUser Login

Clinical Staff Patient Care