Embed Size (px)
Citation preview

Annual Report 2012/13
Ceylon Investment PlC
Contents Corporate Information
Name of the CompanyCeylon Investment PlC(A Carson Cumberbatch Company)
Company Registration No.PQ 68
Domicile and Legal Form Ceylon Investment PlC is a Public Quoted Company with limited liability domiciled in sri lanka.
the Company was incorporated in sri lanka in 1919.
Principal Activity and Nature of OperationsDuring the year, the principal activity of the Company was holding and managing of an investment portfolio.
Directorsmr. I. Paulraj (Chairman) mr.D. C. R. Gunawardenamr.A.P. Weeratungemrs. m.A.R.C. Cooray mr.A. de Z. Gunasekeramr.v.m. Fernando mr. K. selvanathan
Bankersstandard Chartered Bank HsBCCommercial Bank of Ceylon PlC Deutsche Bank AGHatton national Bank PlCDFCC Bank Peoples’ Bank
Auditors messrs. KPmG Chartered Accountantsno. 32A, sir mohamed macan marker mawatha Colombo 03sri lanka.
Managers & SecretariesCarsons management services (Private) limited no. 61, Janadhipathi mawathaColombo 01 sri lanka.telephone no: +94-11-2039200 Fax no: +94-11-2039300
Fund ManagerGuardian Fund management limited no. 61,Janadhipathi mawatha Colombo 01sri lanka.telephone no: +94-11-2039200Fax no:+94-11-2039385
Registered Office & Principal Place of Businessno. 61, Janadhipathi mawatha Colombo 01sri lanka.telephone no: +94-11-2039200 Fax no: +94-11-2039300
Corporate Websitewww.carsoncumberbatch.com
Designed and produced by emagewiseDigital Plates by Imageline (Pvt) Ltd Printed by Printage (Pvt) Ltd
Financial Highlights 1
Chairman’s statement 2
managers’ Review 4
Risk management 14
Annual Report of the Board of Directors on the
Affairs of the Company 19
Profiles of the Directors 26
management team Profile 28
Audit Committee Report 29
Financial Information 31
Independent Auditors’ Report 32
statement of Comprehensive Income 33
statement of Financial Position 34
statement of Changes in equity 35
Cash Flow statement 36
notes to the Financial statements 37
Five year summary 73
Us$ Financials 75
Information to shareholders and Investors 80
notice of meeting 82
Form of Proxy 83
ANNUAL REPORT 2012/13 1
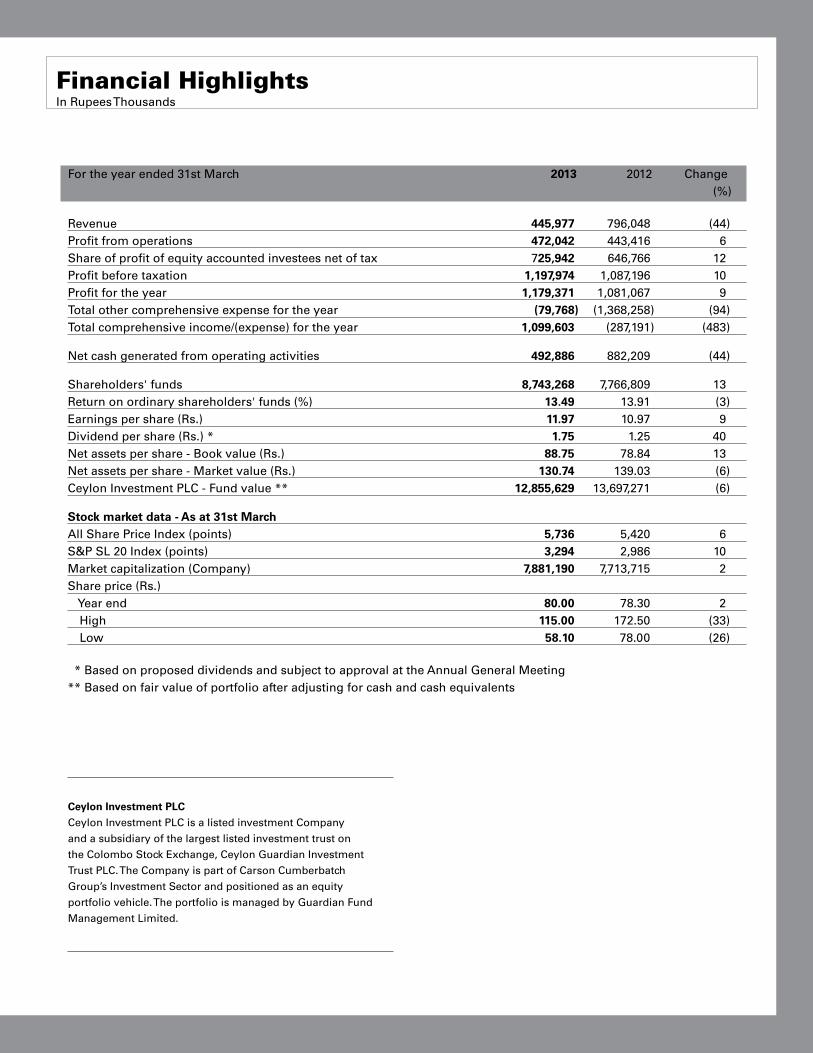
Financial HighlightsIn Rupees Thousands
For the year ended 31st March 2013 2012 Change (%)
Revenue 445,977 796,048 (44)Profit from operations 472,042 443,416 6Share of profit of equity accounted investees net of tax 725,942 646,766 12Profit before taxation 1,197,974 1,087,196 10Profit for the year 1,179,371 1,081,067 9Total other comprehensive expense for the year (79,768) (1,368,258) (94)Total comprehensive income/(expense) for the year 1,099,603 (287,191) (483)
Net cash generated from operating activities 492,886 882,209 (44)
Shareholders' funds 8,743,268 7,766,809 13Return on ordinary shareholders' funds (%) 13.49 13.91 (3)Earnings per share (Rs.) 11.97 10.97 9Dividend per share (Rs.) * 1.75 1.25 40Net assets per share - Book value (Rs.) 88.75 78.84 13Net assets per share - Market value (Rs.) 130.74 139.03 (6)Ceylon Investment PLC - Fund value ** 12,855,629 13,697,271 (6)
Stock market data - As at 31st MarchAll Share Price Index (points) 5,736 5,420 6S&P SL 20 Index (points) 3,294 2,986 10Market capitalization (Company) 7,881,190 7,713,715 2Share price (Rs.) Year end 80.00 78.30 2 High 115.00 172.50 (33) Low 58.10 78.00 (26)
* Based on proposed dividends and subject to approval at the Annual General Meeting** Based on fair value of portfolio after adjusting for cash and cash equivalents
Ceylon Investment PLC
Ceylon Investment PLC is a listed investment Company
and a subsidiary of the largest listed investment trust on
the Colombo Stock Exchange, Ceylon Guardian Investment
Trust PLC. The Company is part of Carson Cumberbatch
Group’s Investment Sector and positioned as an equity
portfolio vehicle. The portfolio is managed by Guardian Fund
Management Limited.
2 CEYLON INvESTMENT PLC
Dear shareholder,I welcome you to the 67th Annual General Meeting of the Company on behalf of the Board of Directors, and take pleasure in presenting the Annual Report and Audited Accounts of the Company for the year ended 31st March 2013.
The year under review has been a challenging one with the Colombo stock market experiencing much volatility and recording marginal positive growth during the period under review. Domestic and global issues have clouded the sentiment of the Colombo Bourse and transactions have been subdued. Economic concerns added to the prevailing sentiment, driving investors to fixed income products in the backdrop of a rising interest rate scenario. However, on the international front, markets have been buoyant despite challenging economic problems; namely the debt crisis of the European Union and financial cliff overhang of the US and decline in GDP momentum of China. Despite this, foreign markets have been on positive ground, going against the economic fundamentals faced by these developed economies. Recent indications of a strengthening of the US economy, coupled with a signal that fiscal stimulus packages would slowdown, has led to an outflow of capital from emerging markets back to the US.
Confident of Future Growth ProspectsDespite the clouding effect of both local and overseas macro factors, at Ceylon Investment, we still remain confident of the long term potential of Sri Lankan equities and the sustainability of the economic development plans set in place after an end to a 30 year civil war in 2009. We believe that the long term development potential of Sri Lanka will flow through to its equity markets and ratios such as market capitalisation to GDP (currently 29%) will improve in the near
Chairman’s Statement
future to more mature markets levels. Short term blips however are likely to bring uncertainty to equity investors, but we remain confident that in the long haul, the vagaries of the market will be ironed out. Hence, Ceylon Investment being a long term investor remains buoyant and would look to exploit weaknesses in equity markets to our advantage.
Strong PerformanceThe Company recorded a profit after tax of Rs. 1.18 bn despite volatile market conditions, whereby the market ended on a positive note for the financial year 2012/13. Our above average performance was attributed to booking of profits on selected overvalued stocks, capturing market anomalies and booking substantial capital gains despite volatile market conditions. Our portfolio value decreased to Rs. 12.86 bn, from Rs. 13.69 bn a year earlier; recording a depreciation of 6.1% vis-à-vis a 5.8% increase in the benchmark All Share Index and 10.32% appreciation in the newly constructed Standard & Poor's Sri Lanka 20 Index.
On evaluating the medium term performance, five year compounded annual portfolio growth rate was 21.67% on market value basis and 33.1% on market capitalization, vis-à-vis an All Share Index growth of 17.6%. The long term track record of Ceylon Investment is thus highlighted, on reading market conditions effectively enabling shifting of funds between asset classes contributing to portfolio performance. We have not been weary of holding high cash positions and waiting out of equities, being patient during times of market uncertainty.
Guardian Fund ManagementThe initiative of managing and growing assets under management (AUM) has been entrusted to Guardian Fund Management Limited the asset management company, of the Guardian Group. It provides a variety of diverse services, namely, customized portfolios for institutional clients and country and mutual fund management. Our initiative to model group company assets in terms of risk appetite into listed and private equity has been done via the three listed investment companies of the Ceylon Guardian Group. Based on the above, the investment companies have been sub grouped to best represent these multiple asset classes. Ceylon Guardian Investment Trust PLC functions as the main holding entity with diverse interests while Ceylon Investment PLC concentrates on listed equity investing, both having a mix of trading and long term portfolios to add different flavors based on investment horizon and strategy. The focus on unlisted private equity comes via Guardian Capital Partners a riskier but lucrative asset class. Thus, our corporate structure has been formulated to suit different investor groups and asset classes. Hence, we remain confident that our model would enable us to attract strategic global partners who would want to be part of the country’s capital markets.
Guardian Fund Management Limited (GFM) is registered with the Securities and Exchange Commission of Sri Lanka. GFM over the years has built an experienced team whereby competencies in all aspects of
ANNUAL REPORT 2012/13 3
fund management have been addressed. Our model puts emphasis on fundamental style investing, driven by research. All company portfolios are currently managed by GFM and competencies have been expanded by way of growth in AUM internally and externally by pitching for new client portfolios. In managing external client and mutual funds, GFM leverages the expertise it has built on managing its own proprietary funds, a unique advantage it has, as opposed to fund managers who only manage outsourced portfolios.
Future OutlookTaking a long term view of the development of capital markets in Sri Lanka, our strategy has extended our services to manage retail funds via our joint venture with Acuity Partners (Private) Limited (the investment banking arm of the HNB and DFCC Bank). We believe that in the long term this segment will grow, given the progression of the economy in the island and increase in national savings rate. Also our international fund “The Sri Lanka Fund” which caters to institutional investors, funds of fund investors and Sri Lankan diasporas has been slow to raise funds due to global challenges. However we believe that this space would attract investments in the future with credibility of its long track record and accreditation as a restricted investment scheme in Singapore. Currently GFM has built competencies in managing the fixed income asset class and believes that in the future it would become a core segment given build-up of cash generated through sales proceeds of the company.
Public and private partnership in developing Sri Lanka has been skewed towards more public sector participation in development programs, playing the role of infrastructure developer. However, the government has shown its long term commitment in attracting foreign direct investments by offering many concessions to attract investors and engaging the private sector in the development of Sri Lanka. Thus, we should see entrepreneurial capital flowing into the growth of the stock market. Also, as the country progresses, state-owned enterprises which account for significant economic activity are likely to get listed and thus support the depth of the capital markets in the country. We believe that bold steps such as this are required to make a significant change in the economic progress of the country. The Company is encouraged by the tax concessions granted for listed debt and other steps to widen the debt markets and the results have been immediately forthcoming with an array of debt issues coming into the market shortly afterwards.
Hence, we are not discouraged by the present volatile sentiment at the Colombo Bourse, nor are we overconfident of future expectations on the equity front. We remain practical and our investments would be guided on pure fundamentals. We believe many areas need to be addressed to bring confidence and economic progress to the country. Clear government policy is needed to take the country to the next level of sustained growth. The current challenges faced by Sri Lanka on its international standing will have to be managed to attract direct investments and build the platform for economic prosperity.
AcknowledgementsIn conclusion, I would like to thank the shareholders for the confidence placed in the management over the years and to the regulators for supporting our businesses. I would also like to thank the members of our staff for their untiring contribution; the Audit Committee, the Remuneration Committee and the Nomination Committee for their guidance; and lastly, my colleagues on the Board for their input. We believe that all our stakeholders would benefit and be part of the identified growth trajectory of the company.
(Sgd).Israel PaulrajChairman
Colombo18th June 2013
4 CEYLON INvESTMENT PLC
Managers’ Review
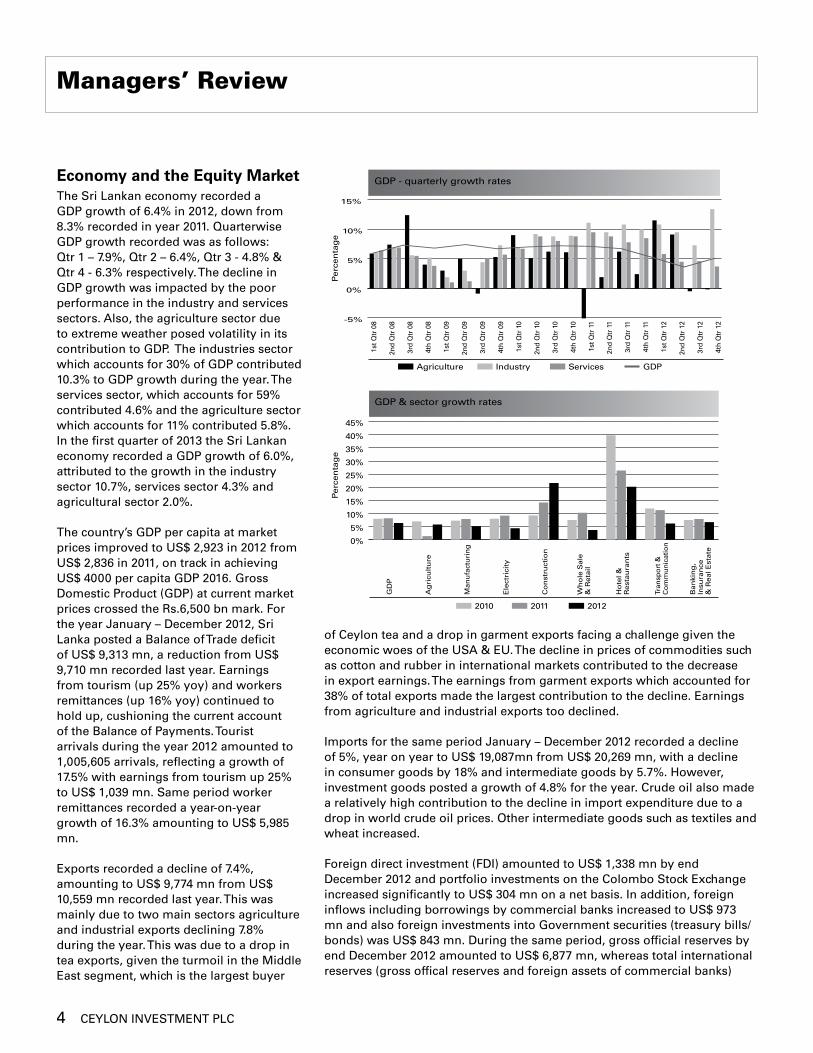
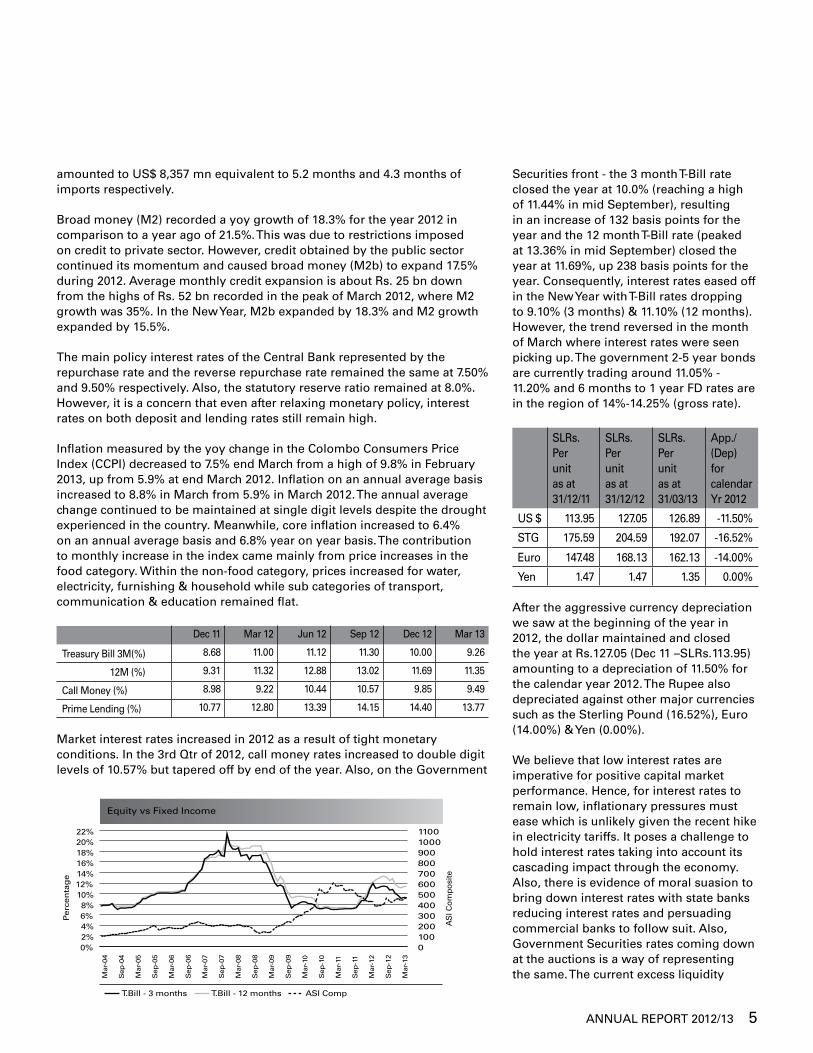
Economy and the Equity MarketThe Sri Lankan economy recorded a GDP growth of 6.4% in 2012, down from 8.3% recorded in year 2011. Quarterwise GDP growth recorded was as follows: Qtr 1 – 7.9%, Qtr 2 – 6.4%, Qtr 3 - 4.8% & Qtr 4 - 6.3% respectively. The decline in GDP growth was impacted by the poor performance in the industry and services sectors. Also, the agriculture sector due to extreme weather posed volatility in its contribution to GDP. The industries sector which accounts for 30% of GDP contributed 10.3% to GDP growth during the year. The services sector, which accounts for 59% contributed 4.6% and the agriculture sector which accounts for 11% contributed 5.8%. In the first quarter of 2013 the Sri Lankan economy recorded a GDP growth of 6.0%, attributed to the growth in the industry sector 10.7%, services sector 4.3% and agricultural sector 2.0%.
The country’s GDP per capita at market prices improved to US$ 2,923 in 2012 from US$ 2,836 in 2011, on track in achieving US$ 4000 per capita GDP 2016. Gross Domestic Product (GDP) at current market prices crossed the Rs.6,500 bn mark. For the year January – December 2012, Sri Lanka posted a Balance of Trade deficit of US$ 9,313 mn, a reduction from US$ 9,710 mn recorded last year. Earnings from tourism (up 25% yoy) and workers remittances (up 16% yoy) continued to hold up, cushioning the current account of the Balance of Payments. Tourist arrivals during the year 2012 amounted to 1,005,605 arrivals, reflecting a growth of 17.5% with earnings from tourism up 25% to US$ 1,039 mn. Same period worker remittances recorded a year-on-year growth of 16.3% amounting to US$ 5,985 mn.
Exports recorded a decline of 7.4%, amounting to US$ 9,774 mn from US$ 10,559 mn recorded last year. This was mainly due to two main sectors agriculture and industrial exports declining 7.8% during the year. This was due to a drop in tea exports, given the turmoil in the Middle East segment, which is the largest buyer
of Ceylon tea and a drop in garment exports facing a challenge given the economic woes of the USA & EU. The decline in prices of commodities such as cotton and rubber in international markets contributed to the decrease in export earnings. The earnings from garment exports which accounted for 38% of total exports made the largest contribution to the decline. Earnings from agriculture and industrial exports too declined.
Imports for the same period January – December 2012 recorded a decline of 5%, year on year to US$ 19,087mn from US$ 20,269 mn, with a decline in consumer goods by 18% and intermediate goods by 5.7%. However, investment goods posted a growth of 4.8% for the year. Crude oil also made a relatively high contribution to the decline in import expenditure due to a drop in world crude oil prices. Other intermediate goods such as textiles and wheat increased.
Foreign direct investment (FDI) amounted to US$ 1,338 mn by end December 2012 and portfolio investments on the Colombo Stock Exchange increased significantly to US$ 304 mn on a net basis. In addition, foreign inflows including borrowings by commercial banks increased to US$ 973 mn and also foreign investments into Government securities (treasury bills/bonds) was US$ 843 mn. During the same period, gross official reserves by end December 2012 amounted to US$ 6,877 mn, whereas total international reserves (gross offical reserves and foreign assets of commercial banks)
GDP - quarterly growth rates
-5%
0%
5%
10%
15%
Agriculture Industry Services GDP1s
t Qtr
08
2nd
Qtr
08
3rd
Qtr
08
4th
Qtr
08
1st Q
tr 0
9
2nd
Qtr
09
3rd
Qtr
09
4th
Qtr
09
1st Q
tr 1
0
2nd
Qtr
10
3rd
Qtr
10
4th
Qtr
10
1st Q
tr 1
1
2nd
Qtr
11
3rd
Qtr
11
4th
Qtr
11
1st Q
tr 1
2
2nd
Qtr
12
3rd
Qtr
12
4th
Qtr
12
Perc
en
tag
e
GDP & sector growth rates
2010 2011 2012
0%
5%
10%
15%
20%
25%
30%
35%
40%
45%
GD
P
Ag
ricu
ltu
re
Man
ufa
ctu
rin
g
Ele
ctri
city
Co
nst
ruct
ion
Wh
ole
Sale
&
Reta
il
Ho
tel &
Rest
au
ran
ts
Tran
spo
rt &
C
om
mu
nic
atio
n
Ban
kin
g,
Insu
ran
ce
& R
eal E
state
Perc
en
tag
e
ANNUAL REPORT 2012/13 5
amounted to US$ 8,357 mn equivalent to 5.2 months and 4.3 months of imports respectively.
Broad money (M2) recorded a yoy growth of 18.3% for the year 2012 in comparison to a year ago of 21.5%. This was due to restrictions imposed on credit to private sector. However, credit obtained by the public sector continued its momentum and caused broad money (M2b) to expand 17.5% during 2012. Average monthly credit expansion is about Rs. 25 bn down from the highs of Rs. 52 bn recorded in the peak of March 2012, where M2 growth was 35%. In the New Year, M2b expanded by 18.3% and M2 growth expanded by 15.5%.
The main policy interest rates of the Central Bank represented by the repurchase rate and the reverse repurchase rate remained the same at 7.50% and 9.50% respectively. Also, the statutory reserve ratio remained at 8.0%. However, it is a concern that even after relaxing monetary policy, interest rates on both deposit and lending rates still remain high.
Inflation measured by the yoy change in the Colombo Consumers Price Index (CCPI) decreased to 7.5% end March from a high of 9.8% in February 2013, up from 5.9% at end March 2012. Inflation on an annual average basis increased to 8.8% in March from 5.9% in March 2012. The annual average change continued to be maintained at single digit levels despite the drought experienced in the country. Meanwhile, core inflation increased to 6.4% on an annual average basis and 6.8% year on year basis. The contribution to monthly increase in the index came mainly from price increases in the food category. Within the non-food category, prices increased for water, electricity, furnishing & household while sub categories of transport, communication & education remained flat.
Dec 11 Mar 12 Jun 12 Sep 12 Dec 12 Mar 13
Treasury Bill 3M(%) 8.68 11.00 11.12 11.30 10.00 9.26
12M (%) 9.31 11.32 12.88 13.02 11.69 11.35
Call Money (%) 8.98 9.22 10.44 10.57 9.85 9.49
Prime Lending (%) 10.77 12.80 13.39 14.15 14.40 13.77
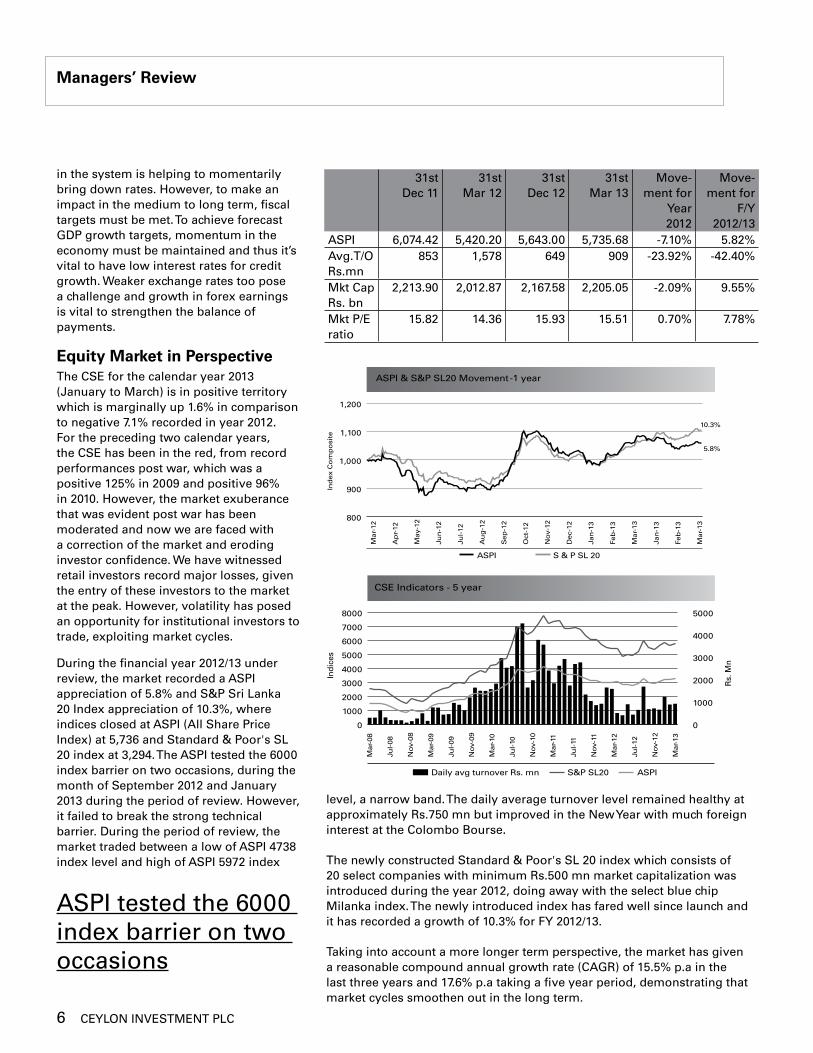
Market interest rates increased in 2012 as a result of tight monetary conditions. In the 3rd Qtr of 2012, call money rates increased to double digit levels of 10.57% but tapered off by end of the year. Also, on the Government
Securities front - the 3 month T-Bill rate closed the year at 10.0% (reaching a high of 11.44% in mid September), resulting in an increase of 132 basis points for the year and the 12 month T-Bill rate (peaked at 13.36% in mid September) closed the year at 11.69%, up 238 basis points for the year. Consequently, interest rates eased off in the New Year with T-Bill rates dropping to 9.10% (3 months) & 11.10% (12 months). However, the trend reversed in the month of March where interest rates were seen picking up. The government 2-5 year bonds are currently trading around 11.05% - 11.20% and 6 months to 1 year FD rates are in the region of 14%-14.25% (gross rate).
SLRs.Per unit as at 31/12/11
SLRs.Per unit as at 31/12/12
SLRs.Per unit as at 31/03/13
App./(Dep) for calendar Yr 2012
US $ 113.95 127.05 126.89 -11.50%
STG 175.59 204.59 192.07 -16.52%
Euro 147.48 168.13 162.13 -14.00%
Yen 1.47 1.47 1.35 0.00%
After the aggressive currency depreciation we saw at the beginning of the year in 2012, the dollar maintained and closed the year at Rs.127.05 (Dec 11 –SLRs.113.95) amounting to a depreciation of 11.50% for the calendar year 2012. The Rupee also depreciated against other major currencies such as the Sterling Pound (16.52%), Euro (14.00%) & Yen (0.00%).
We believe that low interest rates are imperative for positive capital market performance. Hence, for interest rates to remain low, inflationary pressures must ease which is unlikely given the recent hike in electricity tariffs. It poses a challenge to hold interest rates taking into account its cascading impact through the economy. Also, there is evidence of moral suasion to bring down interest rates with state banks reducing interest rates and persuading commercial banks to follow suit. Also, Government Securities rates coming down at the auctions is a way of representing the same. The current excess liquidity
Equity vs Fixed Income
0%2%4%6%8%
10%12%14%16%18%20%22%
010020030040050060070080090010001100
T.Bill - 3 months T.Bill - 12 months ASI Comp
Mar
-04
Sep
-04
Mar
-05
Sep
-05
Mar
-06
Sep
-06
Mar
-07
Sep
-07
Mar
-08
Sep
-08
Mar
-09
Sep
-09
Mar
-10
Sep
-10
Mar
-11
Sep
-11
Mar
-12
Sep
-12
Mar
-13
AS
I Co
mp
osi
te
Perc
en
tag
e
6 CEYLON INvESTMENT PLC
in the system is helping to momentarily bring down rates. However, to make an impact in the medium to long term, fiscal targets must be met. To achieve forecast GDP growth targets, momentum in the economy must be maintained and thus it’s vital to have low interest rates for credit growth. Weaker exchange rates too pose a challenge and growth in forex earnings is vital to strengthen the balance of payments.
Equity Market in PerspectiveThe CSE for the calendar year 2013 (January to March) is in positive territory which is marginally up 1.6% in comparison to negative 7.1% recorded in year 2012. For the preceding two calendar years, the CSE has been in the red, from record performances post war, which was a positive 125% in 2009 and positive 96% in 2010. However, the market exuberance that was evident post war has been moderated and now we are faced with a correction of the market and eroding investor confidence. We have witnessed retail investors record major losses, given the entry of these investors to the market at the peak. However, volatility has posed an opportunity for institutional investors to trade, exploiting market cycles.
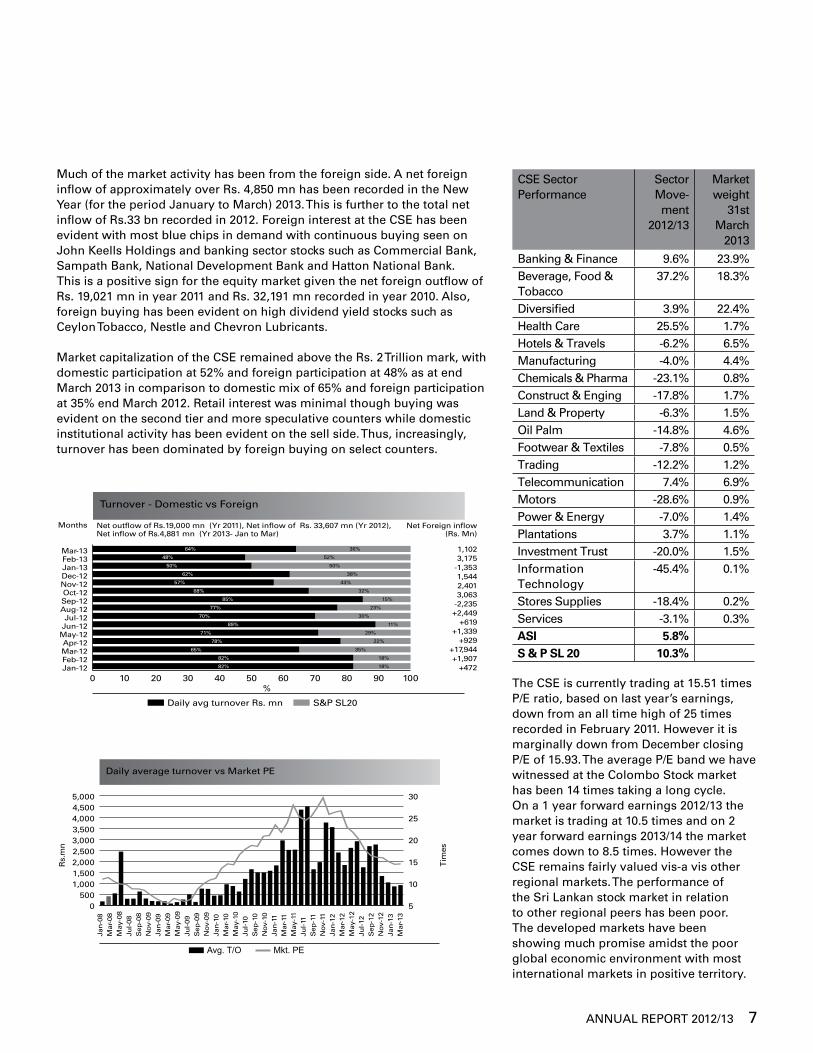
During the financial year 2012/13 under review, the market recorded a ASPI appreciation of 5.8% and S&P Sri Lanka 20 Index appreciation of 10.3%, where indices closed at ASPI (All Share Price Index) at 5,736 and Standard & Poor's SL 20 index at 3,294. The ASPI tested the 6000 index barrier on two occasions, during the month of September 2012 and January 2013 during the period of review. However, it failed to break the strong technical barrier. During the period of review, the market traded between a low of ASPI 4738 index level and high of ASPI 5972 index
Managers’ Review
CSE Indicators - 5 year
Daily avg turnover Rs. mn S&P SL20 ASPI
Mar
-09
No
v-08
Jul-
08
Mar
-08
Jul-
09
No
v-09
Mar
-10
Jul-
10
No
v-10
Mar
-11
Jul-
11
No
v-11
Mar
-12
Jul-
12
No
v-12
Mar
-13
Rs.
Mn
Ind
ices
0
1000
2000
3000
4000
5000
0
1000
2000
3000
4000
5000
6000
7000
8000
ASPI & S&P SL20 Movement -1 year
ASPI S & P SL 20
Mar-
12
Ind
ex C
om
po
site
Ap
r-12
May-
12
Jun
-12
Jul-
12
Au
g-1
2
Sep
-12
Oct
-12
No
v-12
Dec-
12
Jan
-13
Feb
-13
Mar-
13
800
900
1,000
1,100
1,200
5.8%
10.3%
Jan
-13
Feb
-13
Mar-
13
level, a narrow band. The daily average turnover level remained healthy at approximately Rs.750 mn but improved in the New Year with much foreign interest at the Colombo Bourse.
The newly constructed Standard & Poor's SL 20 index which consists of 20 select companies with minimum Rs.500 mn market capitalization was introduced during the year 2012, doing away with the select blue chip Milanka index. The newly introduced index has fared well since launch and it has recorded a growth of 10.3% for FY 2012/13.
Taking into account a more longer term perspective, the market has given a reasonable compound annual growth rate (CAGR) of 15.5% p.a in the last three years and 17.6% p.a taking a five year period, demonstrating that market cycles smoothen out in the long term.
ASPI tested the 6000 index barrier on two occasions
31st Dec 11
31st Mar 12
31st Dec 12
31st Mar 13
Move- ment for
Year2012
Move-ment for
F/Y 2012/13
ASPI 6,074.42 5,420.20 5,643.00 5,735.68 -7.10% 5.82%Avg.T/O Rs.mn
853 1,578 649 909 -23.92% -42.40%
Mkt Cap Rs. bn
2,213.90 2,012.87 2,167.58 2,205.05 -2.09% 9.55%
Mkt P/E ratio
15.82 14.36 15.93 15.51 0.70% 7.78%
ANNUAL REPORT 2012/13 7
Much of the market activity has been from the foreign side. A net foreign inflow of approximately over Rs. 4,850 mn has been recorded in the New Year (for the period January to March) 2013. This is further to the total net inflow of Rs.33 bn recorded in 2012. Foreign interest at the CSE has been evident with most blue chips in demand with continuous buying seen on John Keells Holdings and banking sector stocks such as Commercial Bank, Sampath Bank, National Development Bank and Hatton National Bank. This is a positive sign for the equity market given the net foreign outflow of Rs. 19,021 mn in year 2011 and Rs. 32,191 mn recorded in year 2010. Also, foreign buying has been evident on high dividend yield stocks such as Ceylon Tobacco, Nestle and Chevron Lubricants.
Market capitalization of the CSE remained above the Rs. 2 Trillion mark, with domestic participation at 52% and foreign participation at 48% as at end March 2013 in comparison to domestic mix of 65% and foreign participation at 35% end March 2012. Retail interest was minimal though buying was evident on the second tier and more speculative counters while domestic institutional activity has been evident on the sell side. Thus, increasingly, turnover has been dominated by foreign buying on select counters.
CSE Sector Performance
Sector Move-ment
2012/13
Market weight
31st March
2013
Banking & Finance 9.6% 23.9%Beverage, Food & Tobacco
37.2% 18.3%
Diversified 3.9% 22.4%Health Care 25.5% 1.7%Hotels & Travels -6.2% 6.5%Manufacturing -4.0% 4.4%Chemicals & Pharma -23.1% 0.8%Construct & Enging -17.8% 1.7%Land & Property -6.3% 1.5%Oil Palm -14.8% 4.6%Footwear & Textiles -7.8% 0.5%Trading -12.2% 1.2%Telecommunication 7.4% 6.9%Motors -28.6% 0.9%Power & Energy -7.0% 1.4%Plantations 3.7% 1.1%Investment Trust -20.0% 1.5%Information Technology
-45.4% 0.1%
Stores Supplies -18.4% 0.2%Services -3.1% 0.3%ASI 5.8%S & P SL 20 10.3%
The CSE is currently trading at 15.51 times P/E ratio, based on last year’s earnings, down from an all time high of 25 times recorded in February 2011. However it is marginally down from December closing P/E of 15.93. The average P/E band we have witnessed at the Colombo Stock market has been 14 times taking a long cycle. On a 1 year forward earnings 2012/13 the market is trading at 10.5 times and on 2 year forward earnings 2013/14 the market comes down to 8.5 times. However the CSE remains fairly valued vis-a vis other regional markets. The performance of the Sri Lankan stock market in relation to other regional peers has been poor. The developed markets have been showing much promise amidst the poor global economic environment with most international markets in positive territory.
Turnover - Domestic vs Foreign
Daily avg turnover Rs. mn S&P SL20
0 10 20 30 40 50 60 70 80 90 100Jan-12Feb-12Mar-12Apr-12
May-12Jun-12Jul-12
Aug-12Sep-12Oct-12
Nov-12Dec-12Jan-13Feb-13Mar-13
Net out�ow of Rs.19,000 mn (Yr 2011), Net in�ow of Rs. 33,607 mn (Yr 2012), Net in�ow of Rs.4,881 mn (Yr 2013- Jan to Mar)
1,102
-1,3533,175
1,5442,4013,063
-2,235+2,449
+619+1,339
+929+17,944+1,907
+472
Net Foreign in�ow(Rs. Mn)
Months
%
18%82%
64%
48%
50%
62%
57%
68%
85%
77%
70%
89%
71%
78%
65%
82%
36%
52%
50%
38%
43%
32%
15%
23%
30%
11%
29%
22%
35%
18%
0500
1,0001,5002,0002,5003,0003,5004,0004,5005,000
Daily average turnover vs Market PE
Avg. T/O
Jan
-08
Mar
-08
May
-08
Jul-
08S
ep-0
8N
ov-
09Ja
n-0
9 M
ar-0
9M
ay-0
9Ju
l-09
Sep
-09
No
v-09
Jan
-10
Mar
-10
May
-10
Jul-
10S
ep-1
0N
ov-
10Ja
n-1
1 M
ar-1
1M
ay-1
1Ju
l-11
Sep
-11
No
v-11
Jan
-12
Mar
-12
May
-12
Jul-
12S
ep-1
2N
ov-
12Ja
n-1
3 M
ar-1
3
Tim
es
Rs.
mn
5
10
15
20
25
30
Mkt. PE
8 CEYLON INvESTMENT PLC
Managers’ Review
Though Sri Lanka too has its own economic concerns the stock market has been on an uptrend. Further, we are wary of capital flights from equities given the proposed large bond issues at attractive rates by private sector companies and banks in the near term. The fixed income market also has an added attractiveness due to tax advantages announced in the recent budget thus being very attractive to both retail and corporate investors.
In the backdrop of challenging market conditions, corporates raising funding via the IPO route was minimal, opting instead for funding via debentures taking the fixed income route. Initial public offerings and rights issues raised Rs.13 bn during the calendar year 2012 in contrast to Rs.45 bn raised in 2011. Dividend yield of the market increased to 2.4% in 2012 from 1.8% in 2011. During the period of review, the market cap to GDP declined to 29% from 33% with the downturn in the market.
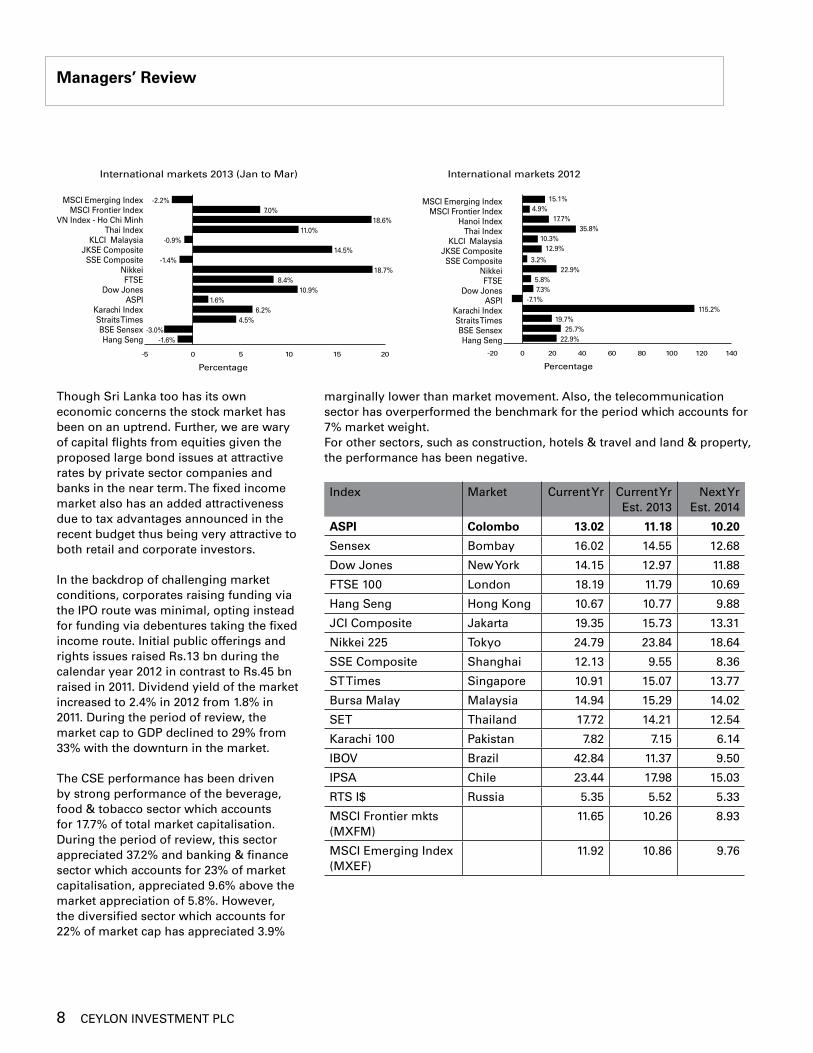
The CSE performance has been driven by strong performance of the beverage, food & tobacco sector which accounts for 17.7% of total market capitalisation. During the period of review, this sector appreciated 37.2% and banking & finance sector which accounts for 23% of market capitalisation, appreciated 9.6% above the market appreciation of 5.8%. However, the diversified sector which accounts for 22% of market cap has appreciated 3.9%
marginally lower than market movement. Also, the telecommunication sector has overperformed the benchmark for the period which accounts for 7% market weight. For other sectors, such as construction, hotels & travel and land & property, the performance has been negative.
Index Market Current Yr Current Yr Est. 2013
Next Yr Est. 2014
ASPI Colombo 13.02 11.18 10.20
Sensex Bombay 16.02 14.55 12.68
Dow Jones New York 14.15 12.97 11.88
FTSE 100 London 18.19 11.79 10.69
Hang Seng Hong Kong 10.67 10.77 9.88
JCI Composite Jakarta 19.35 15.73 13.31
Nikkei 225 Tokyo 24.79 23.84 18.64
SSE Composite Shanghai 12.13 9.55 8.36
ST Times Singapore 10.91 15.07 13.77
Bursa Malay Malaysia 14.94 15.29 14.02
SET Thailand 17.72 14.21 12.54
Karachi 100 Pakistan 7.82 7.15 6.14
IBOv Brazil 42.84 11.37 9.50
IPSA Chile 23.44 17.98 15.03
RTS I$ Russia 5.35 5.52 5.33
MSCI Frontier mkts (MXFM)
11.65 10.26 8.93
MSCI Emerging Index (MXEF)
11.92 10.86 9.76
International markets 2013 (Jan to Mar)
-5 0 5 10 15 20
Hang SengBSE Sensex
Straits TimesKarachi Index
ASPIDow Jones
FTSENikkei
SSE CompositeJKSE Composite
KLCI MalaysiaThai Index
VN Index - Ho Chi MinhMSCI Frontier Index
MSCI Emerging Index
-1.6%-3.0%
4.5%6.2%
1.6%10.9%
8.4%18.7%
-1.4%14.5%
-0.9%11.0%
18.6%7.0%
-2.2%
Percentage
International markets 2012
-20 0 20 40 60 80 100 120 140
Hang SengBSE Sensex
Straits TimesKarachi Index
ASPIDow Jones
FTSENikkei
SSE CompositeJKSE Composite
KLCI MalaysiaThai Index
Hanoi IndexMSCI Frontier Index
MSCI Emerging Index
22.9%25.7%
19.7%115.2%
-7.1%7.3%5.8%
22.9%3.2%
12.9%10.3%
35.8%17.7%
4.9%15.1%
Percentage
ANNUAL REPORT 2012/13 9
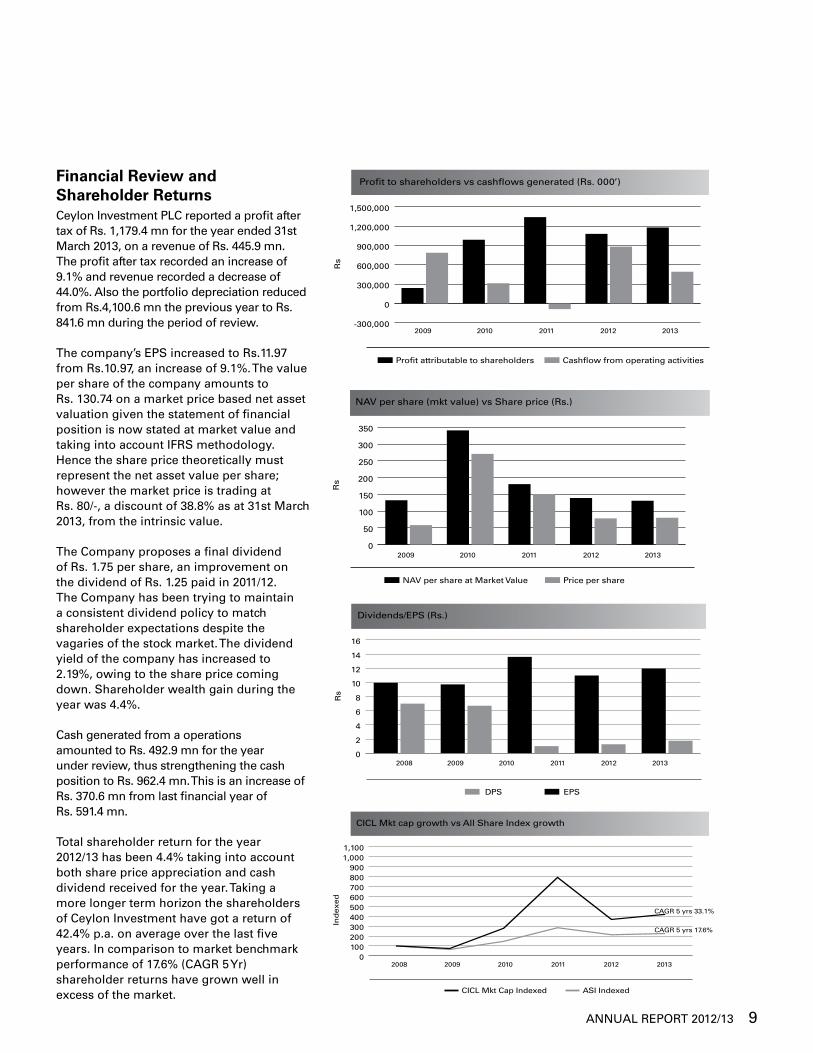
Financial Review and Shareholder ReturnsCeylon Investment PLC reported a profit after tax of Rs. 1,179.4 mn for the year ended 31st March 2013, on a revenue of Rs. 445.9 mn. The profit after tax recorded an increase of 9.1% and revenue recorded a decrease of 44.0%. Also the portfolio depreciation reduced from Rs.4,100.6 mn the previous year to Rs. 841.6 mn during the period of review.
The company’s EPS increased to Rs.11.97 from Rs.10.97, an increase of 9.1%. The value per share of the company amounts to Rs. 130.74 on a market price based net asset valuation given the statement of financial position is now stated at market value and taking into account IFRS methodology. Hence the share price theoretically must represent the net asset value per share; however the market price is trading at Rs. 80/-, a discount of 38.8% as at 31st March 2013, from the intrinsic value.
The Company proposes a final dividend of Rs. 1.75 per share, an improvement on the dividend of Rs. 1.25 paid in 2011/12. The Company has been trying to maintain a consistent dividend policy to match shareholder expectations despite the vagaries of the stock market. The dividend yield of the company has increased to 2.19%, owing to the share price coming down. Shareholder wealth gain during the year was 4.4%.
Cash generated from a operations amounted to Rs. 492.9 mn for the year under review, thus strengthening the cash position to Rs. 962.4 mn. This is an increase of Rs. 370.6 mn from last financial year of Rs. 591.4 mn.
Total shareholder return for the year 2012/13 has been 4.4% taking into account both share price appreciation and cash dividend received for the year. Taking a more longer term horizon the shareholders of Ceylon Investment have got a return of 42.4% p.a. on average over the last five years. In comparison to market benchmark performance of 17.6% (CAGR 5 Yr) shareholder returns have grown well in excess of the market.
Pro�t to shareholders vs cash�ows generated (Rs. 000’)
Pro�t attributable to shareholders Cash�ow from operating activities
2009 2010 2011 2012 2013R
s
-300,000
0
300,000
600,000
900,000
1,200,000
1,500,000
Dividends/EPS (Rs.)
DPS EPS
2008 2009 2010 2011 201320120
2
4
6
8
10
12
14
16
Rs
CICL Mkt cap growth vs All Share Index growth
CICL Mkt Cap Indexed ASI Indexed
2008 2009 2010 2011 2012 20130
100200300400500600700800900
1,0001,100
CAGR 5 yrs 33.1%
CAGR 5 yrs 17.6%
Ind
exed
NAV per share (mkt value) vs Share price (Rs.)
NAV per share at Market Value Price per share
2009 2010 2011 2012 2013
Rs
0
50
100
150
200
250
300
350
10 CEYLON INvESTMENT PLC
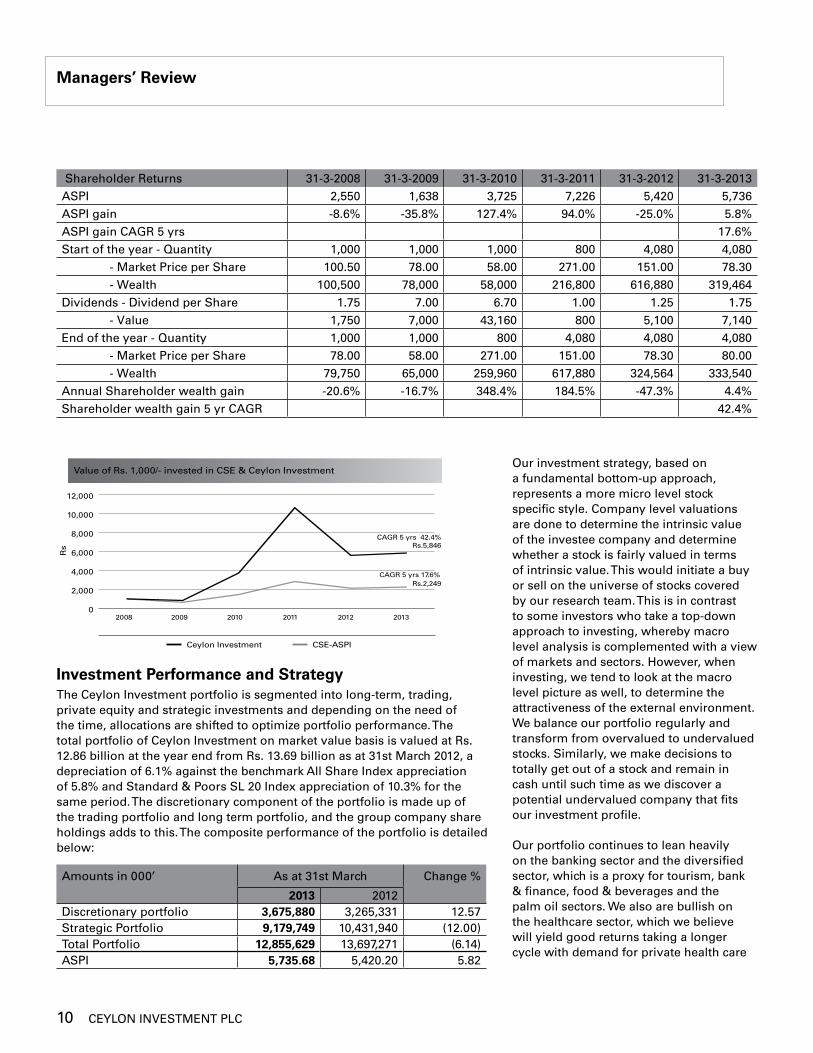
Investment Performance and StrategyThe Ceylon Investment portfolio is segmented into long-term, trading, private equity and strategic investments and depending on the need of the time, allocations are shifted to optimize portfolio performance. The total portfolio of Ceylon Investment on market value basis is valued at Rs. 12.86 billion at the year end from Rs. 13.69 billion as at 31st March 2012, a depreciation of 6.1% against the benchmark All Share Index appreciation of 5.8% and Standard & Poors SL 20 Index appreciation of 10.3% for the same period. The discretionary component of the portfolio is made up of the trading portfolio and long term portfolio, and the group company share holdings adds to this. The composite performance of the portfolio is detailed below:
Amounts in 000’ As at 31st March Change %
2013 2012Discretionary portfolio 3,675,880 3,265,331 12.57 Strategic Portfolio 9,179,749 10,431,940 (12.00)Total Portfolio 12,855,629 13,697,271 (6.14)ASPI 5,735.68 5,420.20 5.82
Our investment strategy, based on a fundamental bottom-up approach, represents a more micro level stock specific style. Company level valuations are done to determine the intrinsic value of the investee company and determine whether a stock is fairly valued in terms of intrinsic value. This would initiate a buy or sell on the universe of stocks covered by our research team. This is in contrast to some investors who take a top-down approach to investing, whereby macro level analysis is complemented with a view of markets and sectors. However, when investing, we tend to look at the macro level picture as well, to determine the attractiveness of the external environment. We balance our portfolio regularly and transform from overvalued to undervalued stocks. Similarly, we make decisions to totally get out of a stock and remain in cash until such time as we discover a potential undervalued company that fits our investment profile.
Our portfolio continues to lean heavily on the banking sector and the diversified sector, which is a proxy for tourism, bank & finance, food & beverages and the palm oil sectors. We also are bullish on the healthcare sector, which we believe will yield good returns taking a longer cycle with demand for private health care
Managers’ Review
Shareholder Returns 31-3-2008 31-3-2009 31-3-2010 31-3-2011 31-3-2012 31-3-2013 ASPI 2,550 1,638 3,725 7,226 5,420 5,736 ASPI gain -8.6% -35.8% 127.4% 94.0% -25.0% 5.8%ASPI gain CAGR 5 yrs 17.6%Start of the year - Quantity 1,000 1,000 1,000 800 4,080 4,080 - Market Price per Share 100.50 78.00 58.00 271.00 151.00 78.30 - Wealth 100,500 78,000 58,000 216,800 616,880 319,464Dividends - Dividend per Share 1.75 7.00 6.70 1.00 1.25 1.75 - value 1,750 7,000 43,160 800 5,100 7,140 End of the year - Quantity 1,000 1,000 800 4,080 4,080 4,080 - Market Price per Share 78.00 58.00 271.00 151.00 78.30 80.00 - Wealth 79,750 65,000 259,960 617,880 324,564 333,540 Annual Shareholder wealth gain -20.6% -16.7% 348.4% 184.5% -47.3% 4.4%Shareholder wealth gain 5 yr CAGR 42.4%
Value of Rs. 1,000/- invested in CSE & Ceylon Investment
Ceylon Investment CSE-ASPI
2008 2009 2010 2011 2012 20130
2,000
4,000
6,000
8,000
10,000
12,000
CAGR 5 yrs 42.4%
CAGR 5 yrs 17.6%
Rs Rs.5,846
Rs.2,249
ANNUAL REPORT 2012/13 11
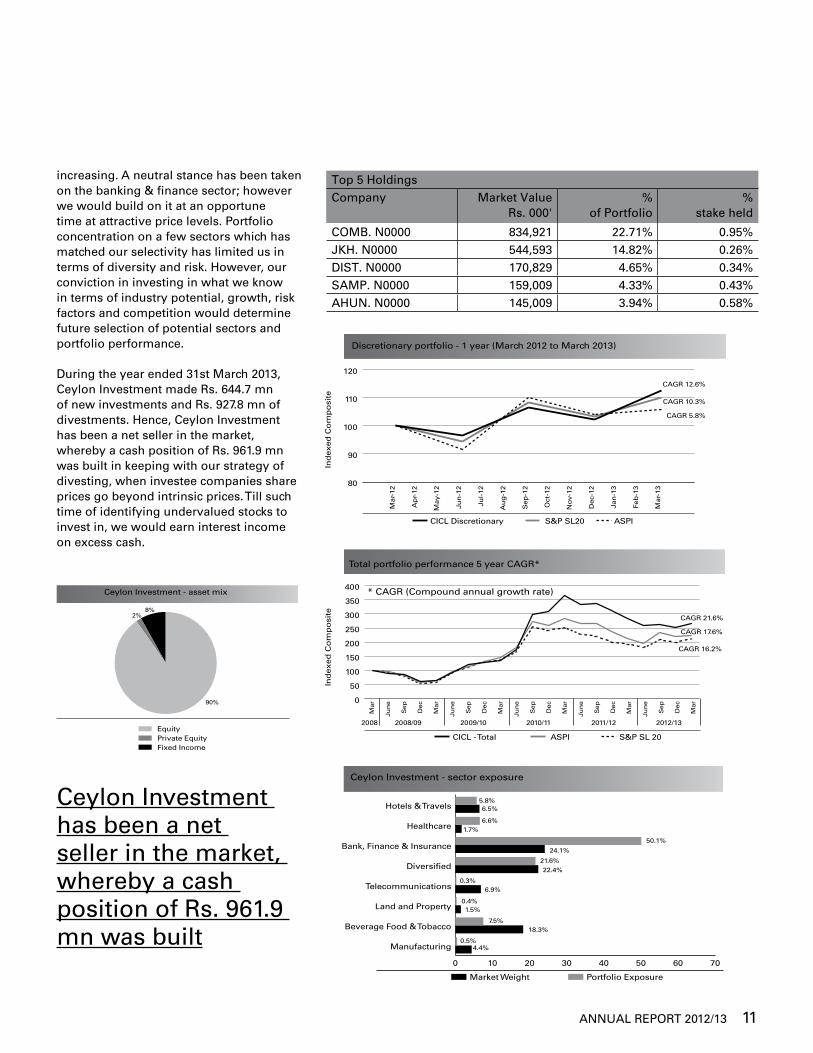
increasing. A neutral stance has been taken on the banking & finance sector; however we would build on it at an opportune time at attractive price levels. Portfolio concentration on a few sectors which has matched our selectivity has limited us in terms of diversity and risk. However, our conviction in investing in what we know in terms of industry potential, growth, risk factors and competition would determine future selection of potential sectors and portfolio performance.
During the year ended 31st March 2013, Ceylon Investment made Rs. 644.7 mn of new investments and Rs. 927.8 mn of divestments. Hence, Ceylon Investment has been a net seller in the market, whereby a cash position of Rs. 961.9 mn was built in keeping with our strategy of divesting, when investee companies share prices go beyond intrinsic prices. Till such time of identifying undervalued stocks to invest in, we would earn interest income on excess cash.
Ceylon Investment - sector exposure
Market Weight Portfolio Exposure
0 10 20 30 40 50 60 70
Manufacturing
Beverage Food & Tobacco
Land and Property
Telecommunications
Diversi�ed
Bank, Finance & Insurance
Healthcare
Hotels & Travels
0%
5.8%6.5%
6.6%1.7%
50.1%
24.1%
21.6%22.4%
0.3%6.9%
0.4%1.5%
7.5%18.3%
0.5%4.4%
Top 5 HoldingsCompany Market value
Rs. 000' %
of Portfolio%
stake held
COMB. N0000 834,921 22.71% 0.95%JKH. N0000 544,593 14.82% 0.26%DIST. N0000 170,829 4.65% 0.34%SAMP. N0000 159,009 4.33% 0.43%AHUN. N0000 145,009 3.94% 0.58%
Total portfolio performance 5 year CAGR*
CICL - Total ASPI S&P SL 20
0
50
100
150
200
250
300
350
400
Mar
Jun
e
Sep
Dec
Mar
Jun
e
Sep
Dec
Mar
Jun
e
Sep
Dec
Mar
Jun
e
Sep
Dec
Mar
Jun
e
Sep
Dec
Mar
2008/09 2009/10 2010/11 2011/12 2012/13
CAGR 21.6%
CAGR 17.6%
CAGR 16.2%
2008
Ind
exed
Co
mp
osi
te
* CAGR (Compound annual growth rate)Ceylon Investment - asset mix
2%8%
90%
EquityPrivate EquityFixed Income
Ceylon Investment has been a net seller in the market, whereby a cash position of Rs. 961.9 mn was built
Discretionary portfolio - 1 year (March 2012 to March 2013)
CICL Discretionary S&P SL20 ASPI
Mar-
12
Ap
r-12
May-
12
Jun
-12
Jul-
12
Au
g-1
2
Sep
-12
Oct
-12
No
v-12
Dec-
12
Jan
-13
Feb
-13
Mar-
13
80
90
100
110
120
CAGR 12.6%
CAGR 10.3%
CAGR 5.8%
Ind
exed
Co
mp
osi
te

12 CEYLON INvESTMENT PLC
Managers’ Review
Profile of the Fund ManagersThe funds are managed by Guardian Fund Management Ltd (GFM), which is a fully owned subsidiary of the Guardian Group and is registered with the Securities and Exchange Commission of Sri Lanka. It manages the largest listed equity fund in Sri Lanka and has built up its competencies in the field of portfolio management, research and support services. GFM manages the Sri Lanka Fund which was formerly known as the Regent Sri Lanka Fund, established in 1993. However the fund was re-launched in August 2010 after the end to the 30 year civil war to exploit opportunities in raising foreign capital. The company has extended its business model to capture retail funds by managing unit trust funds via a joint venture partnership with Acuity Partners (Private) Limited. We recognize the growth potential of the mutual fund industry in Sri Lanka and yet feel its at an infancy stage, and therefore foresee increasing saving habits to drive investments amongst Sri Lankans. Our joint venture Guardian Acuity Asset Management will address those needs and structure investment schemes to meet varying demand.
The fund management company has a professional outfit set up with an effective compliance process, code of ethics & standards of professional conduct for employees. Hence, the structure has been set in place as a comprehensive fund management unit. Guardian Fund Management has expanded its operation by extending its fund management capabilities to companies outside the group and built a portfolio of external clients consisting of provident fund, pension funds, corporate clients and a country fund. To enable the management of external client funds, we have an independent compliance officer to monitor client interest and ensure that objectives are being met with the risk profile of the client. The AUM under this category has grown to a sizeable amount of Rs. 1.4 bn. The fund management company also built its capabilities in becoming a specialist in private equity, perfecting the style of evaluating, managing and structuring private equity deals. This is a long term business and very different to the investment expertise built in terms of listed investments.
In the year under review, GFM has expanded horizons in specializing in the fixed income asset class. As a result, research capabilities have been enhanced in detailing macro economic variables and forecasting, to support the fixed income side of business which is growing in AUM.
Our future viewInvestor sentiment at the Colombo bourse is likely to be mixed with strong interest from overseas and lukewarm interest on the domestic front. Aggressive foreign buying on heavyweight select counters has kept up a positive momentum. Retail interest is likely to come in when blue chip counters have rallied to second tier stocks and when interest rate momentum dries up.
We believe the catalyst to market performance would be the underlying corporate earnings of the companies. We remain skeptical about the ability of the companies to record above average growth due to low GDP growth targets and falling exports against the background of cautious investing by the private sector, amidst volatile interest and exchange rates. Furthermore, higher energy costs and rising wage bills will have a knock-on effect on investor confidence. Looking forward, we feel that the equity space might be crowded out with the pipeline of debentures in the market. Enticing investors to move funds to high yielding debentures given the perceived low risk return option, will prompt an asset class shift in 2013.
Despite uncertainties affecting the Colombo Bourse, we remain confident in the long term on the potential of equities. We at Ceylon Investment believe that equities offer above average returns in long cycles
Our portfolio continues to lean heavily on the banking sector and the diversified sector, which is a proxy for tourism, bank & finance, food & beverages and the palm oil sectors
ANNUAL REPORT 2012/13 13
The ASPI will test the 6000 technical barrier in the New Year, but for this to happen, the largest market cap stocks need to demonstrate performance. Also, the heavyweight banking sector needs to hold its ground. We do not foresee any major IPO's entering the market in the coming months. However, the alternate asset class of debt issuances is to be active, given the new tax incentives making it very attractive to investors.
Despite uncertainties clouding the Colombo Bourse, we remain confident in the long term on the potential of equities. We at Ceylon Investment believe that equities offer above average returns in long cycles and hence are not reluctant to commit long term capital in good companies at attractive price levels. At present, the CSE is trading at 15.5 times, relatively valued in comparison to other Asian markets and frontier markets. However, on a 1 year forward earnings, the market is at a P/E ratio of 10.5 times and 2 year forward earnings at a P/E of 9.0 times. Hence, we are of the view that the market offers value in the medium term.
Guardian Fund Management LimitedInvestment Managers
Colombo18 June 2013
14 CEYLON INvESTMENT PLC
Risk Management
Risk management is an integral part of our business, particularly since balancing risks against returns is a critical trade off decision we have to make everyday when it comes to making investment decisions. We recognise the importance of risk management and have built a comprehensive risk management process & structure that focuses on continuous identification and management of business risks. We have in place several measures to strengthen our risk management processes which are linked to our daily investment decisions. These include policies to mitigate business risks along with the upgrading of the support systems that enable easy monitoring and management of risks.
We believe that risk management is of paramount importance in safeguarding the interest of all stakeholders and have undertaken a comprehensive review to enhance the risk mitigating processes already set in place by Guardian Fund Management Limited, the investment managers of the Company.
We see risk management not as an effort to eliminate risk, but as managing risk given certain risk tolerance levels set by the company. Risks appropriate for a particular portfolio will be assessed against the risk preferences of the investor and overall portfolio strategy.
The risk management structure in placeGuardian Fund Management (GFM) has been set up as an independent fund management company and the management of the portfolios of the Ceylon Guardian Group has been delegated to this company. The Board of Directors has formulated and approved an investment framework and control limits for GFM’s fund management operation. GFM’s management team is responsible for the recommendation and execution of the investment decisions, during the course of which oversight and management of the business, financial and operational risks of the company come into play.
The Fund Manager (GFM) has been registered as an Investment Manager with the Securities and Exchange Commission of Sri Lanka since 2006 while Ceylon Guardian Investment Trust PLC and its subsidiary Ceylon Investment PLC have been registered as underwriters since 2009. GFM as well as the Company therefore, come under the purview of the capital market regulator and hence internal monitoring is done on a quarterly basis to ensure that the set regulations are adhered to. Audits by the Securities and Exchange Commission may also be carried out as required. Furthermore, as a listed company it
conforms to the listing rules and guidelines of the Colombo Stock Exchange.
The Board of Directors of the company have ultimate responsibility for risk management. Hence the Boards are supported by an organization structure that covers the entire risk management framework through an independent Compliance Officer who functions within GFM, as well as the internal audit function of the Carson Cumberbatch Group to which the Ceylon Guardian Group companies belong. The Audit Committee of the Company has oversight over the financial reporting function of the company, the system of internal controls; as well as the audit, compliance and risk management processes. Further, an Investment Committee drawn from across the Carsons Group directorate provide advice and insights to the fund management team to further sharpen and refine their decision making process. This organization structure determines the objectives and policies of our risk management framework and promotes a culture of risk awareness and balanced risk-taking within the company.
Risk categoriesCeylon Guardian has identified and categorized its risks into 4 categories, namely macro environmental risks, portfolio risks, regulatory risks and operational risks. Given below is its approach in managing these key risk areas.
Macro environmental risksCountry risksCountry risk is applicable if an investment is made in a security issued by an entity subject to foreign laws or if transactions are entered into in markets in other jurisdictions. The sums invested and profits or returns accruing maybe subject to exchange control regulations, currency fluctuations, transaction costs & taxes and other actions that may be imposed by the government or policy making bodies of the said countries.
This risk is not currently applicable to the Guardian Group as our exposure at present is only to Sri Lankan investments. Hence no risk mitigating systems are required to be in place. However, since the capital account has now been liberalised to the extent of permitting approved overseas investments upto a certain value by listed companies, this is a new risk that we would have to build into our framework into the future.
Currency riskWhere investments are denominated in currencies other than our primary reference currency which is the
ANNUAL REPORT 2012/13 15
Sri Lanka Rupee, and where the company is required to convert funds from one currency to another upon making investments, as well as in receiving the returns from those investments, the company is exposed to the risk of the foreign exchange parities moving against one’s investment.
This risk is not currently applicable to the Guardian Group as the current exposure to investments denominated in foreign currencies is nil. Hence no risk mitigating processes are required; but looking ahead we need to prepare for this due to the gradual exchange control de-regulation that is now taking place. A detailed investment policy would be developed in the year ahead in gaining exposure to new markets.
Market risk - domesticThe broad definition of market risk is exposure to adverse movements in the securities markets for both equity and fixed income investments, which can result in value loss as well as variations in the anticipated returns from those securities. All financial institutions face market risks, created by changes in the macro environment related to political factors, national security, economic management and globalization influences which have an impact on systematic risk factors such as interest rates, currency parity, inflation, and availability of credit. Therefore, understanding market risks requires considering multiple dimensions and complexity in the macro environment.
Market risks are inherent in every security and are thus collectively considered at the portfolio level to take into account the asset allocation decisions of the portfolio. Thus market risks affecting a particular class of security are mitigated by switching to asset classes that are assessed to be less risky in a particular scenario.
All market participants such as Ceylon Investment should ideally develop its business model taking into account exposure limits and parameters to sustain itself when faced with market risks that can affect portfolio values temporarily. The only mitigating process is to develop a sound research base to determine changing economic fundamentals of the country and determine the impact on equity vs fixed income investments and the prompt shifting of funds between asset classes. This is of vital importance in trading portfolio decisions where quick encashment of equities is carried out if macro indicators move adversely leading to a slow down in stock market activity.
The process of assessing market risks on investee companies also forms a vital part of our research process, where sensitivity of stock valuations to changes in economic indicators are monitored.
Market risk - international and externalThese risks cannot be diversified or mitigated by the company. We as investors in the equity market in Sri Lanka have to live with the risk of international happenings affecting our market. There is an indirect impact of risks of other markets to our domestic market as clearly seen in the past with the spiraling impacts of the global financial crisis spreading to other Western countries and impacting Asian countries and in turn Sri Lanka.
In the global world of cross border trade and cross border investment flows, the impact of changing economic indicators and policy will be high for the domestic economy, especially in a country such as ours which is import dependent for vital commodities.
Hence in determining fund strategy we monitor key economic indicators such as interest rates, exchange rates, inflation, budget deficits of key economic super powers, as well as global commodity prices since Sri Lanka is a net importer of essential commodities. This enables the fund team to get a feel of changing international market dynamics and in turn relate that to local developments. The entry and exit of foreign investor interest on the local market is also determined by the macro economic trends prevailing in foreign markets and relative valuations of our market vis-a-vis developed and other comparative Asian markets. Information to monitor and interpret global developments in capital markets is vital to assess and mitigate this risk.
We believe that building expertise in foreign markets is of paramount importance going forward with possible further liberalisation on the cards. In mitigating the risk we are looking to tie up or collaborate with foreign entities that have expertise in such markets at such times when we have the ability to invest overseas.
Portfolio RisksGeneral Securities riskAny trading in securities carries inherent investment risks associated with the entity issuing those securities. In particular the price or value of any security can and does fluctuate and may even become valueless, resulting in possible loss not only of returns and profits, but even also of all or part of the principal sums invested in the case of a fixed income instrument. These risks arise as a result of the overall risks faced by the issuing entity which affects its ability to provide a return to the investors holding the securities issued by it. Particularly in the case of equities, past performance of any investment is not necessarily indicative of future performance. At Guardian
16 CEYLON INvESTMENT PLC
Risk Management
our approach focuses on the fact that there is no substitute for fundamental security assessment. Our portfolio management and investment selection process is designed to maximize the risk/return tradeoff to our shareholders and we employ a bottom up investment selection process.
Our risk mitigating methodology is based on our internal research process that has added value over time to our choice of investments. Prospective investments are selected from fundamental analysis and contact with corporate management of the issuing company through company visits. Once an investment is made, a continuous process of monitoring the performance of that investment is adopted.
We manage the concentration risk arising from over exposure to one security by monitoring sector exposure and single company exposure as mitigation strategies. Loss limits are set to monitor stocks performing below their cost of acquisition to determine whether temporary capital erosion is a concern. This helps us mitigate the downside risk of any security in the portfolio.
Liquidity riskUnder certain market conditions, an investor may find it difficult or impossible to liquidate a position. This can occur when trading is suspended by the exchange on which a security is listed or when poor market sentiment dries up investor interest in an investment. In addition, there may not be a ready market for certain investments due to low levels of publicly traded quantities. Some investments will have to be held to maturity. Proper information for determining the value of certain investments may also not be available under such circumstances of low liquidity. However the strategy of holding big stakes might be a limiting factor when selling, if the stock is illiquid or in the case of a change in fundamentals.
We mitigate this risk by investing in companies with a reasonable free float and where securities are heavily traded. Also by limiting the portfolio’s buy list to highly traded blue chips, the risk of illiquidity can be mitigated. Good research will enable the fund team to identify changes in fundamentals and be proactive in investment decision making.
In instances where we are presented with a promising investment opportunity, being short of funds to pursue that opportunity is also an extension of liquidity risk. A shortage may arise due to the inability of disposing existing positions with inferior risk/return trade off or the need to commit more money than available on hand to fully exploit the opportunity. To guard against this risk, we have
arranged several overdraft facilities, which have not been utilized as yet. However close monitoring of interest rate movements and liquidation of positions to cover overdrafts after 3-6 months exposure would be the risk mitigation methods used to ensure low exposure to interest rate risks.
Performance volatility risks The composition of portfolio investments will determine the portfolio’s ability to out perform the market. If more volatile stocks that respond more than proportionately to market movements are selected, there is a likelihood that the portfolio will outperform the benchmark All Share Price Index in a growing market, while in a downturn it can under-perform the market. It is once again an attempt at balancing good performance with a certain risk tolerance in a volatile environment.
Measuring portfolio volatility through calculation of a portfolio beta is one method of keeping ourselves aware of the sensitivities of the portfolio. In the case of the long term portfolio, we would not attempt to handle market volatility by encashing stocks, but would rather attempt to hold into fundamentally strong stocks and ride out low performing cycles. For this, we ensure adequate cash generation by way of dividend and other income flows to keep our daily operations running smoothly while we ride out low market periods. On the other hand, in the case of the trading portfolio, it is necessary to keep an even closer tab on market volatility, since it needs to regularly encash its profitable positions to remain a high performing portfolio.
Investment performance riskThis is the risk that the portfolio will not meet the investment objectives by over-performing the benchmark indices. This can adversely affect the reputation of the company and have impact in the future in terms of proven track record and confidence when raising money on future capital calls.
We mitigate this risk by setting a process which seeks to meet investment targets within stated risk parameters. Portfolio performance, valuations and risks are monitored by fund managers and managed on a regular basis.
Regulatory Risks Legal compliance The legal support services to Guardian Fund Management comes through the management services company of the Carson Cumberbatch Group, which ensures that the Guardian Group complies with all legal and regulatory provisions applicable to it. The legal function proactively identifies and advices GFM to set up appropriate systems
ANNUAL REPORT 2012/13 17
and processes for legal and regulatory compliance in respect of all our investments and regulated activities. We also ensure legal and regulatory compliance in any foreign country that we operate in, and in such instances through legal counsel retained in those environments.
Proactive monitoring of compliance process is followed and we see that our investments are made and trades are executed in keeping to the Companies Act, SEC regulations, tax regulations, exchange control regulations and other applicable guidelines. The legal advisors of the Company also carry out periodic awareness programmes to educate all staff members.
Regulatory ComplianceThe operations of the Guardian Group come within the rules and regulations applicable to all market participants operating in the equity (listed and unlisted) and debt markets of Sri Lanka, as well as the regulatory provisions applicable to companies listed on the CSE and regulations applicable to securities trading set by the Securities and Exchange Commission of Sri Lanka.
Our systems and processes are structured to satisfy the criteria set by these regulations, and staff is constantly kept aware of the compliance needs imposed by these regulations. An independent compliance officer undertakes responsibility for maintaining a check on the overall compliance process and he is supported by the internal audit function of the Carsons Group. GFM, as an Investment Manager registered with the SEC, is also subject to further regulation by the capital markets regulator.
Operational RisksProfessionalism in operational dealingsGuardian Fund Management (GFM) emphasizes professionalism in the manner in which the staff interacts with clients as well as market intermediaries, since it is vital for maintaining the company’s standing within the investment community. GFM staff has signed a Code of Ethics at the time of recruitment by the company, which lays down professional standards of conduct and dealing that is expected of staff. Structures to avoid conflicts of interest and compromising of best practices are set up. Staff education covers these areas of practice, and annual declarations by the staff members on compliance in personal equity trading are mandatory.
Compliance with SEC trading rules on insider trading, front running, market manipulation etc are checked by comparing trading statistics between portfolios and
pre-approved personal transaction of employees, by the Compliance Officer.
Compliance with the Code of Ethics ensures that the conduct of fund managers and other staff do not violate the code of ethics to which employees are signatories. Some of the areas that have been highlighted include avoiding conflict of interest between portfolios through coordination of trades between portfolio managers within the company, as well as internal controls and audits to ensure monitoring & compliance. .
Systems and process risksWe manage operational risks by identifying areas of risk, formulating plans for their management, promoting best practices, implementing internal controls and systems, and monitoring compliance with these internal guidelines for managing operational risks. Operational risks mainly cover the areas of system failure, continuity of decision making, dealing with contingencies and ensuring efficiency in operations and correct application of recommended management practices. Operational risk is the risk of loss resulting from inadequate or failed internal processes, people and systems or from external events.
In order to deal with unexpected contingencies, we have developed and implemented a business continuity plan, which looks after aspects such as staff deployment and systems backup in case of an unexpected disruption to the business. This business continuity plan forms a part of the Carsons Group’s business continuity plan, which is regularly tested.
The internal audit function of the Carsons Group, ensures the safeguarding of company assets and recommends process improvements in areas where process control failures are noted. Compliance with the investment objectives of each portfolio involves checking whether fund managers have adhered to the investment guidelines for each portfolio operating within set limits & not falling to prohibited investments; as well as monitoring portfolio performance against the benchmarks set. Further compliance with the operating process manual involves checking the application of proper internal controls such as segregation of duties, authority limits, approvals and that cash management processes are in order.
Systems support for the portfolio management software is made available through an annual maintenance agreement with the software vendor which ensures on line support for
18 CEYLON INvESTMENT PLC
Risk Management
system issues and queries. At the same time the financial transaction processing and reporting system are based on an ERP system in use at Carsons Group level and as such back up support services for this system are available through the parent company’s management services company.
Staff risksA fund management operational unit requires qualified professionals with experience in the fund management industry. Knowledge of the operating mechanism of the market as well as its norms and ethics is of importance. We attempt to pass on this valuable local knowledge to our staff at all levels. Having diversity in the team, developing a strong second level, training and development opportunities, are standard practices of the industry, which we benchmark ourselves with. A performance related incentive scheme for the staff is in place and is being reviewed. The networking ability of key staff source deals is important in running a successful fund management operation by being shown both important buy side and sell side deals by brokers.
The staff of GFM are all professionally qualified with a track record of experience in the industry. A strong research team has been developed to complement the fund management operation and raise the standard of the investment decision making process.
Staff training and development is identified as an important areas of concern, while retention is managed through a comprehensive reward structure & incentive scheme, opportunities for career progression and a culture of being HR oriented. Collectively, these steps help us work towards having an effective succession plan in place.
Reputation riskAs a company which carries out a role of trust between itself and a client, it is vital to safeguard the good name and reputation of the business. Further, now being in the public domain through unit trusts, safeguarding reputation risk is of utmost importance.
Employees are communicated the right values from the inception both by formal communication and by example. Our screening process at interviews, attempts to select people of the right caliber, while training them for higher responsibility is ongoing. The extensive compliance process also ensures that the company does not take the risk of process failure that will lead to reputation risk. Maintaining good relationships with all industry and government stakeholders further helps manage any crisis situations that can damage reputation.
Guardian Fund Management LimitedInvestment Managers
Colombo18 June 2013
ANNUAL REPORT 2012/13 19
Annual Report of the Board of Directors on the Affairs of the Company
The details set out herein provide the pertinent information required by the Companies Act, No. 07 of 2007, Listing Rules of the Colombo Stock Exchange and recommended best accounting practices. The Annual Report was approved by the Board of Directors on 18th June 2013.
1. GENERAL The Directors have pleasure in presenting to the
shareholders their report together with the audited financial statements for the year ended 31st March 2013 of Ceylon Investment PLC (the “Company”), a public limited liability company incorporated in Sri Lanka in 1919.
2. THE PRINCIPAL ACTIVITIES OF THE COMPANY
The principal activities of the Company and its associate company are to act as specialised investment vehicles focusing on listed equity investments, in order to better manage the risk profile of the portfolio to one specialized asset class.
There were no significant changes in the nature of the principal activities of the Company during the financial year under review.
3. REVIEw OF OPERATIONS AND FUTURE DEVELOPMENTS
The Chairman’s Statement and Managers’ Review on pages 2 to 13 provide an overall assessment of the business performance of the Company and its future developments. These reports together with the audited financial statements reflect the state of affairs of the Company.
4. FINANCIAL STATEMENTS The financial statements which comprise the
Statement of Comprehensive Income, Statement of Financial Position, Cash Flow Statement, Statement of Changes in Equity and notes to the financial statements of the Company for the year ended 31st March 2013 are set out on pages 33 to 72. These financial statements do comply with the requirements of the Companies Act, No. 7 of 2007.
4.1 Revenue The Company generated a revenue of Rs. 445.9 mn
(2012 – Rs.796.0 mn). A detailed analysis of the revenue for the period is given in note 11 to the financial statements.
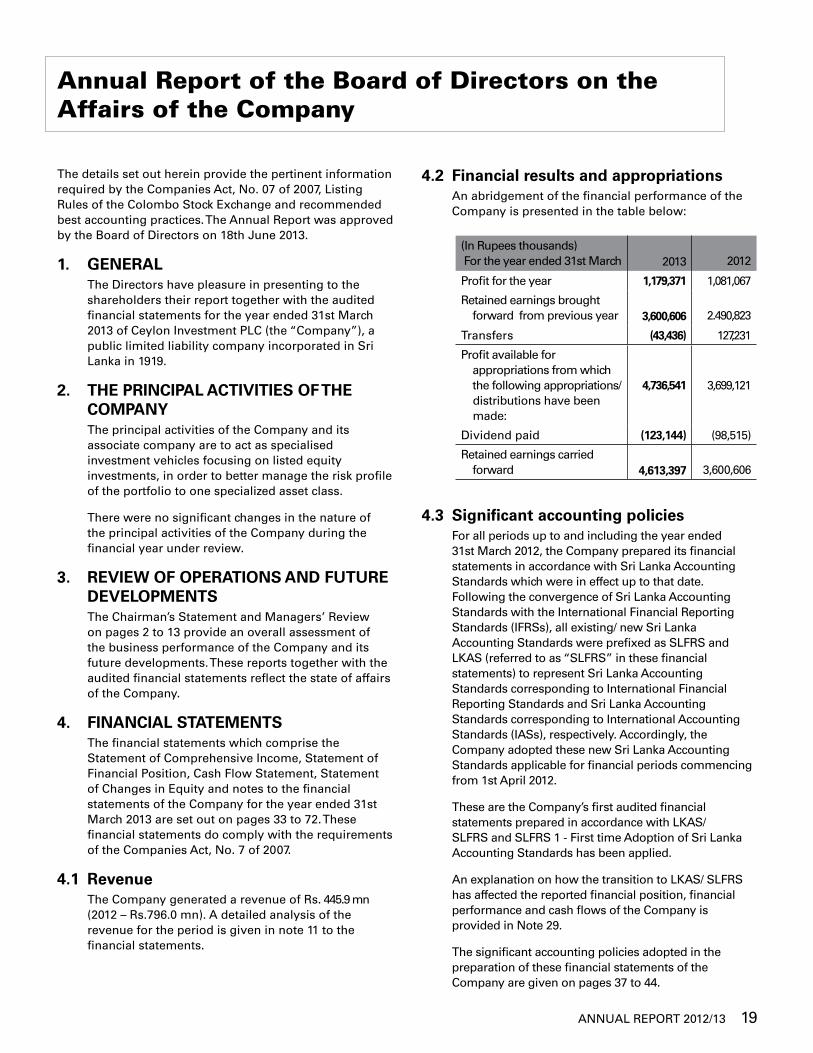
4.2 Financial results and appropriations An abridgement of the financial performance of the
Company is presented in the table below:
(In Rupees thousands) For the year ended 31st March
2013
2012
Profit for the year 1,179,371 1,081,067
Retained earnings brought forward from previous year
3,600,606
2.490,823
Transfers (43,436) 127,231
Profit available for appropriations from which the following appropriations/ distributions have been made:
4,736,541 3,699,121
Dividend paid (123,144) (98,515)
Retained earnings carried forward
4,613,397
3,600,606
4.3 Significant accounting policies For all periods up to and including the year ended
31st March 2012, the Company prepared its financial statements in accordance with Sri Lanka Accounting Standards which were in effect up to that date. Following the convergence of Sri Lanka Accounting Standards with the International Financial Reporting Standards (IFRSs), all existing/ new Sri Lanka Accounting Standards were prefixed as SLFRS and LKAS (referred to as “SLFRS” in these financial statements) to represent Sri Lanka Accounting Standards corresponding to International Financial Reporting Standards and Sri Lanka Accounting Standards corresponding to International Accounting Standards (IASs), respectively. Accordingly, the Company adopted these new Sri Lanka Accounting Standards applicable for financial periods commencing from 1st April 2012.
These are the Company’s first audited financial statements prepared in accordance with LKAS/ SLFRS and SLFRS 1 - First time Adoption of Sri Lanka Accounting Standards has been applied.
An explanation on how the transition to LKAS/ SLFRS has affected the reported financial position, financial performance and cash flows of the Company is provided in Note 29.
The significant accounting policies adopted in the preparation of these financial statements of the Company are given on pages 37 to 44.
20 CEYLON INvESTMENT PLC
4.4 Reserves As at 31st March 2013, the total reserves of the Company
stood at Rs. 8,069.7 mn (2012 - Rs. 7,093.3 mn).
The movements are set out in the Statement of Changes in Equity and note 24 to the financial statements.
4.5 Fair value through profit or loss financial assets reserve
Any gains arising from fair value adjustment will be transferred from retained earnings to “Fair value through profit or loss financial assets reserve” at reporting date and any realised losses arising will be transferred from “Fair value through profit or loss financial assets reserve” to retained earnings to the extent that loss does not exceed the balance held in the said reserve as at the date.
Accordingly, during the year an amount of Rs. 43.4 mn was transferred to (2012 - Rs.127.2 mn was transferred from) “Fair value through profit or loss financial assets reserve” resulting from the movements in fair value adjustment of Fair value through profit or loss financial asset as shown in the Statement of Changes in Equity.
4.6 Available for sales financial assets reserve
During the year, the net positive movement reflected in the ‘Available for sale financial asset reserve’ amounted to Rs. 60.9 mn (2012 - a net negative movement of Rs. 1.311.6 mn) arising out of realized gain and adjustment on fair valuation of investments in Available for sale financial assets.
5. STATEMENT OF DIRECTORS’ RESPONSIbILITIES
The responsibilities of the Directors, in relation to the financial statements are detailed in the following paragraphs, while the responsibilities of the Auditors are set out in the Independent Auditors’ Report.
According to the Companies Act, No. 7 of 2007 and Sri Lanka Accounting and Auditing Standards Act, No. 15 of 1995, Directors are required to prepare financial statements for each financial year, giving a true and fair view of the state of affairs of the Company as at the end of the financial year and of the performance for the said period.
The financial statements comprise of inter alia :
• aStatementoffinancialposition,whichpresentsa true and fair view of the state of affairs of the Company and its associate company as at the end of the financial year:
• aStatementofcomprehensiveincomeoftheCompany and its associate company, which presents a true and fair view of the profit and loss of the Company and its associate company for the financial year. In preparing these financial statements, the Directors are required to ensure that:
• appropriateaccountingpolicieshavebeenselected and applied consistently, while material departures, if any, have been disclosed and explained;
• allapplicableaccountingstandardshavebeencomplied with;
• reasonableandprudentjudgementsandestimates have been made; and
• providestheinformationrequiredbyandotherwise comply with the Colombo Stock Exchange.
The Directors are responsible for ensuring that the Company maintains sufficient accounting records to disclose with reasonable accuracy, the financial position of the Company, for ensuring that the financial statements have been prepared and presented in accordance with the Sri Lanka Accounting and Auditing Standards Act, No. 15 of 1995 and meet with the requirements of the Companies Act, No. 7 of 2007.
They are also responsible for taking reasonable measures to safeguard the assets of the Company and in this regard to give proper consideration to the establishment and effective operation of appropriate systems of internal control with a view to prevent, detect and rectify fraud and other irregularities.
These financial statements have been prepared on a going concern basis, since the Directors are of the view that the Company has adequate resources to continue in operation, for the foreseeable future from the date of signing these financial statements.
The Directors are also of the view that they have discharged their responsibilities as set out in this statement.
Annual Report of the board of Directors on the Affairs of the Company
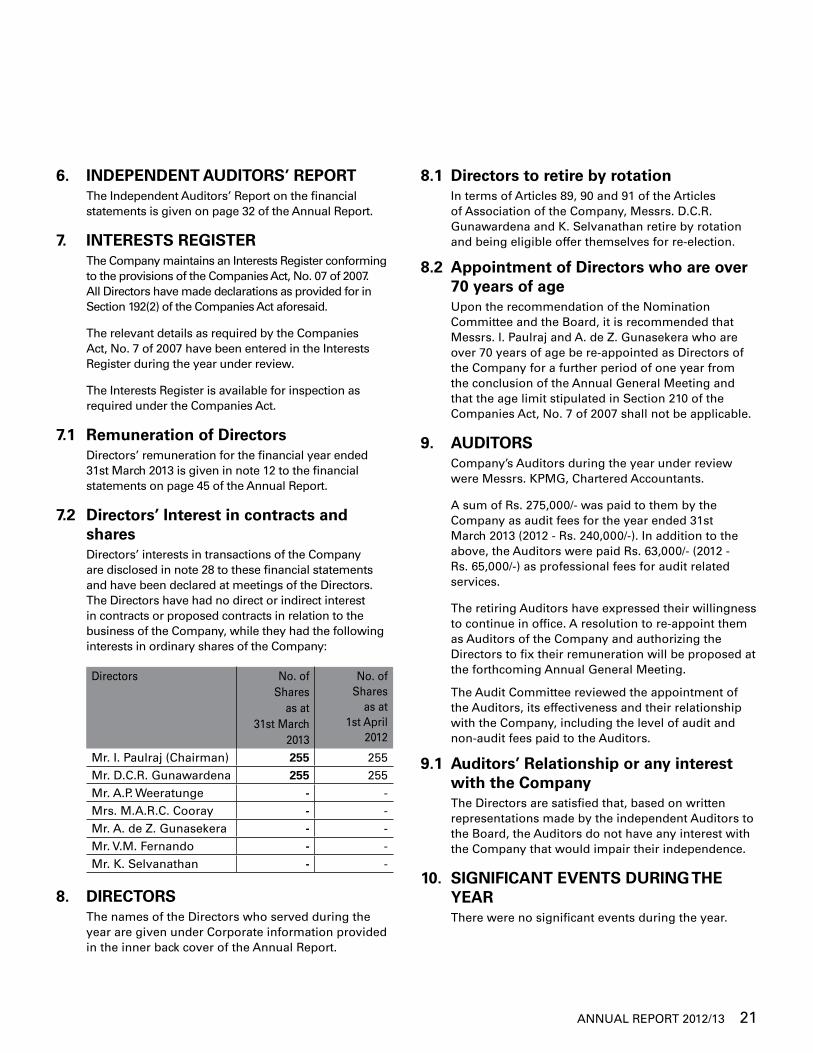
ANNUAL REPORT 2012/13 21
6. INDEPENDENT AUDITORS’ REPORT The Independent Auditors’ Report on the financial
statements is given on page 32 of the Annual Report.
7. INTERESTS REGISTER The Company maintains an Interests Register conforming
to the provisions of the Companies Act, No. 07 of 2007. All Directors have made declarations as provided for in Section 192(2) of the Companies Act aforesaid.
The relevant details as required by the Companies Act, No. 7 of 2007 have been entered in the Interests Register during the year under review.
The Interests Register is available for inspection as required under the Companies Act.
7.1 Remuneration of Directors Directors’ remuneration for the financial year ended
31st March 2013 is given in note 12 to the financial statements on page 45 of the Annual Report.
7.2 Directors’ Interest in contracts and shares
Directors’ interests in transactions of the Company are disclosed in note 28 to these financial statements and have been declared at meetings of the Directors. The Directors have had no direct or indirect interest in contracts or proposed contracts in relation to the business of the Company, while they had the following interests in ordinary shares of the Company:
Directors No. of Shares
as at31st March
2013
No. of Shares
as at1st April
2012
Mr. I. Paulraj (Chairman) 255 255Mr. D.C.R. Gunawardena 255 255Mr. A.P. Weeratunge - -Mrs. M.A.R.C. Cooray - -Mr. A. de Z. Gunasekera - -Mr. v.M. Fernando - -Mr. K. Selvanathan - -
8. DIRECTORS The names of the Directors who served during the
year are given under Corporate information provided in the inner back cover of the Annual Report.
8.1 Directors to retire by rotation In terms of Articles 89, 90 and 91 of the Articles
of Association of the Company, Messrs. D.C.R. Gunawardena and K. Selvanathan retire by rotation and being eligible offer themselves for re-election.
8.2 Appointment of Directors who are over 70 years of age
Upon the recommendation of the Nomination Committee and the Board, it is recommended that Messrs. I. Paulraj and A. de Z. Gunasekera who are over 70 years of age be re-appointed as Directors of the Company for a further period of one year from the conclusion of the Annual General Meeting and that the age limit stipulated in Section 210 of the Companies Act, No. 7 of 2007 shall not be applicable.
9. AUDITORS Company’s Auditors during the year under review
were Messrs. KPMG, Chartered Accountants.
A sum of Rs. 275,000/- was paid to them by the Company as audit fees for the year ended 31st March 2013 (2012 - Rs. 240,000/-). In addition to the above, the Auditors were paid Rs. 63,000/- (2012 - Rs. 65,000/-) as professional fees for audit related services.
The retiring Auditors have expressed their willingness to continue in office. A resolution to re-appoint them as Auditors of the Company and authorizing the Directors to fix their remuneration will be proposed at the forthcoming Annual General Meeting.
The Audit Committee reviewed the appointment of the Auditors, its effectiveness and their relationship with the Company, including the level of audit and non-audit fees paid to the Auditors.
9.1 Auditors’ Relationship or any interest with the Company
The Directors are satisfied that, based on written representations made by the independent Auditors to the Board, the Auditors do not have any interest with the Company that would impair their independence.
10. SIGNIFICANT EVENTS DURING THE YEAR
There were no significant events during the year.

22 CEYLON INvESTMENT PLC
11. RELATED PARTY TRANSACTIONS ExCEEDING 10% OF THE EqUITY OR 5% OF THE TOTAL ASSETS OF THE COMPANY
There were no transactions entered into by the Company in the ordinary course of business, the value of which exceeded 10% of the shareholders’ equity or 5% of the total assets of the company during the year.
12. CORPORATE GOVERNANCE The Board has ensured that the Company has
complied with the Corporate Governance Rules as per the Listing Rules of the Colombo Stock Exchange (CSE).
12.1 board of Directors The following Directors held office as at the reporting
date and their brief profiles are given on pages 26 to 27 of the Annual Report.
Directors Executive/ Non-Executive/ Independent
Mr. I. Paulraj (Chairman) Non-Executive/ Independent*
Mr. D.C.R. Gunawardena Non-Executive
Mr. A.P. Weeratunge Executive
Mrs. M.A.R.C. Cooray Non-Executive/ Independent**
Mr. A. de Z. Gunasekera Non-Executive / Independent***
Mr. v.M. Fernando Non-Executive / Independent****
Mr. K. Selvanathan Executive
Each of the Non-Executive Directors of the Company have submitted a signed declaration on Independence/ Non-Independence as per Rule 7.10.2.b of the Listing Rules of the Colombo Stock Exchange. The said declarations were tabled at the Board Meeting held on 18th June 2013, in order to enable the Board of Directors to determine the Independence/Non-Independence of the Non-Executive Directors.
*The Board has determined that Mr. I. Paulraj is an Independent Director in spite of being on the Board for more than 9 years and being a Director of Ceylon Guardian Investment Trust PLC, in which a majority of the other Directors of the Board are also Directors and which has a substantial shareholding in the Company,
since he is not directly involved in the management of the Company.
** The Board has determined that Mrs.M.A.R.C. Cooray is an Independent Director in spite of being a Director of Ceylon Guardian Investment Trust PLC, in which a majority of the other Directors of the Board are also Directors and which has a substantial shareholding in the Company, since she is not directly involved in the management of the Company.
***The Board has determined that Mr.A.de Z. Gunasekera is an Independent Director in spite of being a Director of Ceylon Guardian Investment Trust PLC, in which a majority of the other Directors of the Board are also Directors and which has a substantial shareholding in the Company, since he is not directly involved in the management of the Company.
****The Board has determined that Mr.v.M. Fernando is an Independent Director in spite of being a Director of Ceylon Guardian Investment Trust PLC, in which a majority of the other Directors of the Board are also Directors and which has a substantial shareholding in the Company, since he is not directly involved in the management of the Company.
12.2 Remuneration Committee As per Rule 7.10.5 of the Listing Rules of the Colombo
Stock Exchange, the Remuneration Committee of Carson Cumberbatch PLC (CCPLC), the ultimate Parent Company, functions as the Remuneration Committee of the Company and comprises of the following members :
Remuneration Committee Member
Executive/Non-Executive/Independent
Mr. I. Paulraj (Chairman) Non-Executive/Independent
Director of CCPLC
Mr. M. Moonesinghe Non-Executive/Independent Director of CCPLC
Mr. D.C.R. Gunawardena Non-Executive Director of CCPLC
The Committee has formulated a remuneration policy
based on market and industry factors and individual performance for all Group companies.
Aggregated remuneration paid to the Non-Executive Directors of the Company is disclosed under note 12 on page 45 of this Annual Report.
Executive Directors are not compensated for their role on the Board.
Annual Report of the board of Directors on the Affairs of the Company
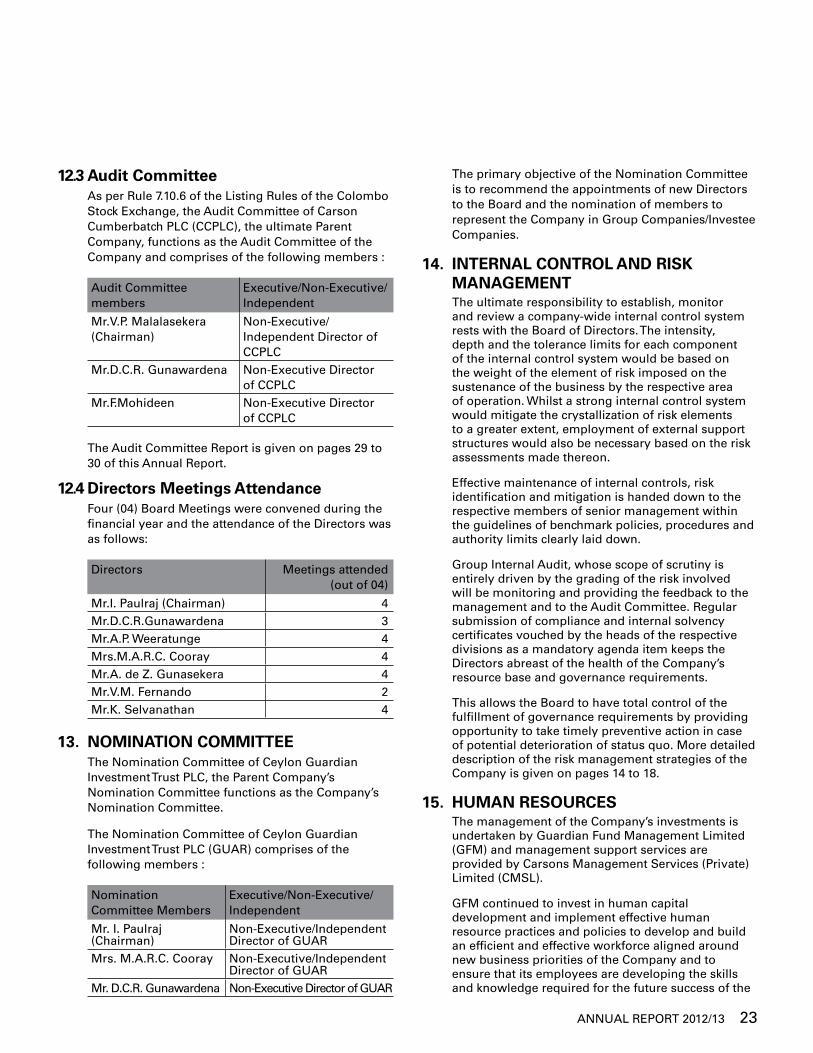
ANNUAL REPORT 2012/13 23
12.3 Audit Committee As per Rule 7.10.6 of the Listing Rules of the Colombo
Stock Exchange, the Audit Committee of Carson Cumberbatch PLC (CCPLC), the ultimate Parent Company, functions as the Audit Committee of the Company and comprises of the following members :
Audit Committee members
Executive/Non-Executive/ Independent
Mr.v.P. Malalasekera (Chairman)
Non-Executive/ Independent Director of CCPLC
Mr.D.C.R. Gunawardena Non-Executive Director of CCPLC
Mr.F.Mohideen Non-Executive Director of CCPLC
The Audit Committee Report is given on pages 29 to 30 of this Annual Report.
12.4 Directors Meetings Attendance Four (04) Board Meetings were convened during the
financial year and the attendance of the Directors was as follows:
Directors Meetings attended (out of 04)
Mr.I. Paulraj (Chairman) 4Mr.D.C.R.Gunawardena 3Mr.A.P. Weeratunge 4Mrs.M.A.R.C. Cooray 4Mr.A. de Z. Gunasekera 4Mr.v.M. Fernando 2Mr.K. Selvanathan 4
13. NOMINATION COMMITTEE The Nomination Committee of Ceylon Guardian
Investment Trust PLC, the Parent Company’s Nomination Committee functions as the Company’s Nomination Committee.
The Nomination Committee of Ceylon Guardian Investment Trust PLC (GUAR) comprises of the following members :
Nomination Committee Members
Executive/Non-Executive/ Independent
Mr. I. Paulraj (Chairman)
Non-Executive/Independent Director of GUAR
Mrs. M.A.R.C. Cooray Non-Executive/Independent Director of GUAR
Mr. D.C.R. Gunawardena Non-Executive Director of GUAR
The primary objective of the Nomination Committee is to recommend the appointments of new Directors to the Board and the nomination of members to represent the Company in Group Companies/Investee Companies.
14. INTERNAL CONTROL AND RISk MANAGEMENT
The ultimate responsibility to establish, monitor and review a company-wide internal control system rests with the Board of Directors. The intensity, depth and the tolerance limits for each component of the internal control system would be based on the weight of the element of risk imposed on the sustenance of the business by the respective area of operation. Whilst a strong internal control system would mitigate the crystallization of risk elements to a greater extent, employment of external support structures would also be necessary based on the risk assessments made thereon.
Effective maintenance of internal controls, risk identification and mitigation is handed down to the respective members of senior management within the guidelines of benchmark policies, procedures and authority limits clearly laid down.
Group Internal Audit, whose scope of scrutiny is entirely driven by the grading of the risk involved will be monitoring and providing the feedback to the management and to the Audit Committee. Regular submission of compliance and internal solvency certificates vouched by the heads of the respective divisions as a mandatory agenda item keeps the Directors abreast of the health of the Company’s resource base and governance requirements.
This allows the Board to have total control of the fulfillment of governance requirements by providing opportunity to take timely preventive action in case of potential deterioration of status quo. More detailed description of the risk management strategies of the Company is given on pages 14 to 18.
15. HUMAN RESOURCES The management of the Company’s investments is
undertaken by Guardian Fund Management Limited (GFM) and management support services are provided by Carsons Management Services (Private) Limited (CMSL).
GFM continued to invest in human capital development and implement effective human resource practices and policies to develop and build an efficient and effective workforce aligned around new business priorities of the Company and to ensure that its employees are developing the skills and knowledge required for the future success of the
24 CEYLON INvESTMENT PLC
Company, centered around the core competencies required by an investment house.
16. EqUITAbLE TREATMENT TO SHAREHOLDERS
The Company endeavours at all times to ensure equitable treatment to all shareholders.
17. DIVIDENDS Subject to approval of the shareholders at the Annual
General Meeting, the Board of Directors recommend a First & Final dividend of Rs. 1/75 per share for the year ended 31st March 2013.
The dividend payable has not been accounted for until it is approved at the forthcoming Annual General Meeting.
The details of the dividends paid during the year are set out in note 17 to the financial statements.
18. SOLVENCY TEST Taking into account the said distribution, the Directors
are satisfied that the Company would meet the Solvency Test requirement under Section 56(2) of the Companies Act, No.07 of 2007 immediately after the distribution. The Company’s Auditors, Messrs. KPMG, Chartered Accountants have issued a Certificate of Solvency confirming same.
19. STATED CAPITAL The Stated Capital of the Company as at 31st March
2013 was Rs. 673,529,144/- comprising of 98,514,874 ordinary shares. The movement in Stated Capital of the Company is given in note 23 to the financial statements. There was no change in the Stated Capital of the Company during the year.
20. INVESTMENTS Investments represent, investments in associates,
investments in available for sale financial assets and investments in fair value through profit or loss financial assets.
• Detailsoninvestment in associate company is given in note 18 in page 48.
• Detailsonavailable for sale financial assets at fair value are disclosed in note 19 in pages 49 to 52, comprising those investments which are held for a longer tenure, usually over 3-5 years. The fair value of the said investment portfolio stood at Rs. 2,210.3 mn (2012 – Rs. 2,217.5 mn) at the end of the financial year.
• The fair value through profit or loss portfolio engaged in active trading to realize the benefits of the movements in the stock market and is carried in the Statement of financial position at fair value as given in note 21 in pages 53 to 54. The carrying value of the fair value through profit or loss financial assets of the Company as at 31st March 2013 was Rs. 503.6 mn (2012 – Rs. 456.3 mn).
21. CAPITAL ExPENDITURE The Company has not incurred capital nature
expenditure on during the year under review (2012- Nil).
22. STATUTORY PAYMENTS The Directors to the best of their knowledge and
belief were satisfied that all statutory dues have been paid up to date or have been provided for in the financial statements.
23. GOING CONCERN The Board of Directors is satisfied that the Company
has adequate resources to continue its operations in the foreseeable future. Accordingly, the financial statements are prepared based on the going concern concept.
24. EVENTS AFTER THE REPORTING PERIOD
Subsequent to the reporting period no circumstances have arisen, which would require adjustments to or disclosures in the financial statements, other than those disclosed in note 26 to the financial statements.
25. CONTINGENT LIAbILITIES AND CAPITAL COMMITMENT
Contingent liabilities and commitments as at 31st March 2013 are given in note 27 to the financial statements.
26. CORPORATE DONATIONS There were no donations granted during the year.
27. SHARE INFORMATION The details relating to earnings, net assets, market
value per share and information on share trading are given on pages 73 to 74 and 80 to 81 of the Annual Report.
Annual Report of the board of Directors on the Affairs of the Company
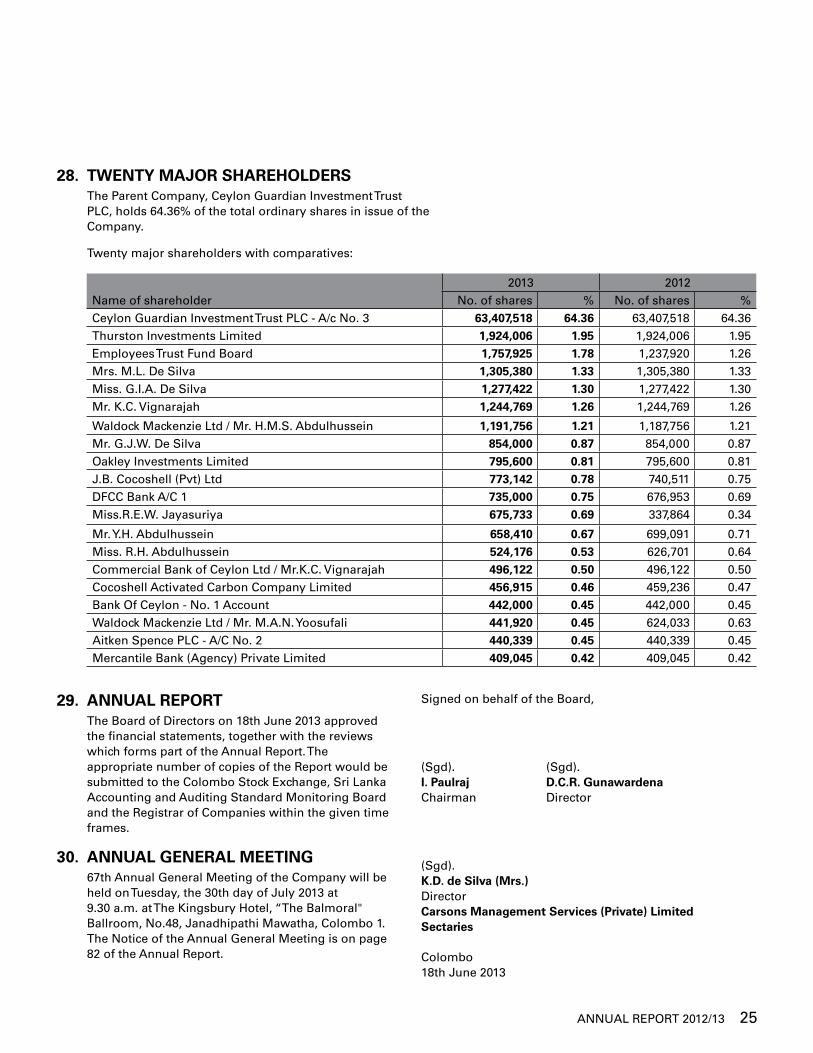
ANNUAL REPORT 2012/13 25
28. TwENTY MAjOR SHAREHOLDERS The Parent Company, Ceylon Guardian Investment Trust
PLC, holds 64.36% of the total ordinary shares in issue of the Company.
Twenty major shareholders with comparatives:
2013 2012Name of shareholder No. of shares % No. of shares %Ceylon Guardian Investment Trust PLC - A/c No. 3 63,407,518 64.36 63,407,518 64.36Thurston Investments Limited 1,924,006 1.95 1,924,006 1.95Employees Trust Fund Board 1,757,925 1.78 1,237,920 1.26Mrs. M.L. De Silva 1,305,380 1.33 1,305,380 1.33Miss. G.I.A. De Silva 1,277,422 1.30 1,277,422 1.30Mr. K.C. vignarajah 1,244,769 1.26 1,244,769 1.26
Waldock Mackenzie Ltd / Mr. H.M.S. Abdulhussein 1,191,756 1.21 1,187,756 1.21Mr. G.J.W. De Silva 854,000 0.87 854,000 0.87Oakley Investments Limited 795,600 0.81 795,600 0.81J.B. Cocoshell (Pvt) Ltd 773,142 0.78 740,511 0.75DFCC Bank A/C 1 735,000 0.75 676,953 0.69Miss.R.E.W. Jayasuriya 675,733 0.69 337,864 0.34
Mr. Y.H. Abdulhussein 658,410 0.67 699,091 0.71Miss. R.H. Abdulhussein 524,176 0.53 626,701 0.64Commercial Bank of Ceylon Ltd / Mr.K.C. vignarajah 496,122 0.50 496,122 0.50Cocoshell Activated Carbon Company Limited 456,915 0.46 459,236 0.47Bank Of Ceylon - No. 1 Account 442,000 0.45 442,000 0.45Waldock Mackenzie Ltd / Mr. M.A.N. Yoosufali 441,920 0.45 624,033 0.63Aitken Spence PLC - A/C No. 2 440,339 0.45 440,339 0.45Mercantile Bank (Agency) Private Limited 409,045 0.42 409,045 0.42
29. ANNUAL REPORT The Board of Directors on 18th June 2013 approved
the financial statements, together with the reviews which forms part of the Annual Report. The appropriate number of copies of the Report would be submitted to the Colombo Stock Exchange, Sri Lanka Accounting and Auditing Standard Monitoring Board and the Registrar of Companies within the given time frames.
30. ANNUAL GENERAL MEETING 67th Annual General Meeting of the Company will be
held on Tuesday, the 30th day of July 2013 at 9.30 a.m. at The Kingsbury Hotel, “The Balmoral" Ballroom, No.48, Janadhipathi Mawatha, Colombo 1. The Notice of the Annual General Meeting is on page 82 of the Annual Report.
Signed on behalf of the Board,
(Sgd). (Sgd).I. Paulraj D.C.R. Gunawardena Chairman Director
(Sgd).k.D. de Silva (Mrs.)DirectorCarsons Management Services (Private) LimitedSectaries
Colombo18th June 2013
26 CEYLON INvESTMENT PLC
Profiles of the Directors
ISRAEL PAULRAj Israel Paulraj is the Chairman of Ceylon Guardian Investment Trust PLC, Guardian Capital Partners PLC and Rubber Investment Trust Limited. He serves as a Director of Carson Cumberbatch PLC and of several of the subsidiary companies within the Carsons Group.
He served as Past Chairman of the Federation of Exporters Associations of Sri Lanka and The Coconut Products Traders Association. He was a member of the Executive Committee of The Ceylon Chamber of Commerce and the National Chamber of Commerce of Sri Lanka Shippers Council. He served on the Board of Arbitrators of The Ceylon Chamber of Commerce. He has served as Hony. General Secretary of the Central Council of Social Services, Hony. Treasurer of The Christian Conference in Asia, President of the Church of Ceylon Youth Movement and Hony. Treasurer of the National Christian Council of Sri Lanka. He has also served as the Chairman of the Incorporated Trustees of the Church of Ceylon.
He also served on the Presidential Task Force on Non-Traditional Export and Import Competitive Agriculture set up by President R.Premadasa. He also served as Chairman of the Ecumenical Loan Fund of Sri Lanka and on its International Board in Geneva. He was a member of the Commercial Law Reform Commission and has served on the Parliamentary Consultative Committee on Internal and International Trade.
He holds a Bachelor of Law Degree and an Executive Diploma in Business Administration.
CHANDIMA GUNAwARDENAChandima Gunawardena serves as a Non-Independent, Non-Executive Director of Carson Cumberbatch PLC and in most of the Carsons Group Companies in Sri Lanka and overseas. He is also a Director of Bukit Darah PLC. Since assuming Non-Executive status in the Group in 2011, he serves as an advisor to the Group's Strategic Planning and Management forums in Sri Lanka and serves on Board Committees including the Audit Committees of the Group in Sri Lanka and overseas covering all operating sectors of the Group.
Mr.Gunawardena has over four decades of experience in varied fields of business and commercial activities and has held senior positions in Corporate, Mercantile and State Institutions. He was appointed to the Carsons Group Directorate in 1990.
He has served on the Management committee of The Ceylon Chamber of Commerce for over 10 years and was a Founder Council member of the Sri Lanka Institute of Directors (SLID) and continued to serve in the council for over 10 years.
He is a Fellow of the Chartered Institute of Management Accountants, UK.
AjITH wEERATUNGE Ajith Weeratunge is a Director of the Carson Cumberbatch Group’s Management Company, Carsons Management Services (Private) Limited and holds the position of Head of Finance. He is also a Director of Equity One PLC and Equity Two PLC, as well as the Group’s Investment Holding Sector - Rubber Investment Trust Limited and Guardian Fund Management Limited. He counts over 32 years of finance related experience in the mercantile sector and has held positions in Lanka Walltile Ltd., Union Apparels (Pvt) Ltd., John Keells Holdings PLC, Phoenix Industries (Pvt) Ltd. and Ceylon Beverage Holdings PLC. He is a Fellow member of the Chartered Institute of Management Accountants of UK.
ROSE COORAYRose Cooray is a Director of Ceylon Guardian Investment Trust PLC and Hatton National Bank PLC. She is a retired Deputy Governor of the Central Bank of Sri Lanka where she served for over 35 years.
On release from the Central Bank, she had served at the Ministry of Finance in the capacity of Director General Fiscal Policy and Economic Affairs Department for nearly 6 years, represented the Government on the Boards of DFCC Bank, Sri Lanka Institute of Information Technology, Sri Lanka Telecom, Ceylon Electricity Board, De La Rue Currency and Security Print (Pvt) Ltd, Export Development Board, National Housing and Development Authority and represented the Monetary Board on West Coast Power (Pvt) Ltd.
She has functioned as the vice Chairperson of the Institute of Bankers of Sri Lanka for 5 years and has served on a number of Committees at national level covering a variety of subjects representing the Ministry of Finance and the Central Bank. She has also represented the Central Bank and the Ministry of Finance at various international meetings/seminars.
Mrs.Cooray has been involved extensively in policy making and implementing projects and programmes especially in the area of regional development and microfinance. She has wide experience in negotiating loans with multilateral and other donors, as well as bilateral trade agreements on behalf of the Government. Her articles/papers have been published in professional journals.

ANNUAL REPORT 2012/13 27
ASOkA DE Z. GUNASEkERA Asoka Gunasekera is a Director of Ceylon Guardian Investment Trust PLC. Also serves as Alternate Director to Mr. I.W Senanayake (Chairman) of IWS Holdings (Pvt) Ltd and in most of its Group companies. Past Chairman of the National Chamber of Commerce of Sri Lanka and Past President of the Ceylon National Chamber of Industries. He is a Past International Director and a Board Appointee of Lions Clubs International and was also a Member of the National Police Commission of Sri Lanka. He served as Legal Advisor and Secretary to the Ministry of Posts and Telecommunications; Co-ordinating Secretary to the Ministry of Power and Energy and Ministry of Highways and was the Acting Secretary to the Ministry of Policy Planning.
He is an Attorney - at- Law & Notary Public.
MANILAL FERNANDO Manilal Fernando is a Director of Ceylon Guardian Investment Trust PLC. He is currently the Chairman of Shipping Cargo Logistics (Pvt) Limited, Hyundai Lanka (Pvt) Limited and Dynamic Av Technologies (Pvt) Limited. Director of Pirarus (Pvt) Limited, Aitken Spence & Co. PLC, Sri Lankan Airlines Limited and Stallion Plantations (Pvt) Limited. He is also a Trustee of Joseph Fraser Memorial Hospital.
He has been a Past President of the Football Federation of Sri Lanka from 1979 to 1999. He is the vice President of the National Olympic Committee of Sri Lanka from 1990 to date. He is an Attorney-at-Law & Notary Public.
kRISHNA SELVANATHAN Krishna Selvanathan is a Director of Carsons Management Services (Private) Limited, Lion Brewery (Ceylon) PLC and the Investment Sector Companies of the Carsons Group. He is also a Director of Carlsberg India (Pvt) Ltd.
He holds a BA Degree in Accounting & Finance and Business Administration from the University of Kent, U.K.

28 CEYLON INvESTMENT PLC
Management Team Profile
RUVINI FERNANDO Ruvini Fernando is the Director and CEO of Guardian Fund Management Limited, the Fund Management Company of the Carsons Group and a Director of The Sri Lanka Fund - a foreign incorporated country fund managed by Guardian Fund Management Limited. Director of Guardian Acuity Asset Management Limited, a joint venture company of the Guardian Group, responsible for operating and managing licensed unit trusts. Represents the Guardian Group on the Board of Durdans Medical and Surgical Hospital Limited, in which the Group has an equity stake. Counts over 23 years work experience in the fields of Management Accounting, Finance, Research Analysis, Strategic Planning and Investments, within the Hayleys Group and Carson Cumberbatch Group. Was a former visiting faculty member of the Postgraduate Institute of Management in the MBA programme. Member of the Regaining Sri Lanka Tourism Steering Committee, a key policy making forum of the government from January 2002 to January 2004. Fellow of the Chartered Institute of Management Accountants, UK and the Association of Chartered Certified Accountants, UK. Has a Masters Degree in Business Administration from the Postgraduate Institute of Management (PIM), University of Sri Jayawardenapura, Sri Lanka.
NILOO jAYATILAkENiloo Jayatilake is a Director of Guardian Fund Management Limited and heads the portfolio management division of the management company. Alternate Director of Durdans Medical and Surgical Hospitals Limited and Guardian Acuity Asset Management Limited. Counts over 17 years experience in the investments field. Prior to joining the Carsons Group worked as Fund Manager at The Unit Trust Management Company Limited, managers of Ceybank Unit Trust Funds in Sri Lanka. Is a Fellow Member of the Chartered Institute of Management Accountants, UK and Associate Member of the Institute of Chartered Secretaries and Administrators, UK.
THARINDA jAYAwARDANAHead of Research of Guardian Fund Management Ltd. He has over 6 years experience in investment research. Prior to joining the Carson Cumberbatch Group he worked as a financial analyst at JB Securities Ltd.. He is a CFA Charter Holder and an Associate Member of the Chartered Institute of Management Accountants (UK). He also has a first class B.Sc (Hons) in Finance from the University of Sri Jayewardenepura.
SUMITH PERERAFund Manager, Guardian Fund Management Ltd. Has over 7 years of experience in the field of Asset Management working as a Fund Manager for CAAM Saudi Fransi LLC (Kingdom of Saudi Arabia), Investment Analyst for Eagle NDB Fund Management (Sri Lanka) and as a Financial Analyst for John Keells Stockbrokers (Sri Lanka). He holds a Bsc (Hons) in Economics and Business Finance from Brunel University, UK and is an Associate Member of the Chartered Institute of Management Accountants.
VIbATH wIjESINGHEFinancial Controller of Carsons Management Services (Private) Limited the management support service provider to the Carson Cumberbatch Group. He began his career at M/s. KPMG, Sri Lanka and has over ten years of experience in the fields of finance, corporate finance and auditing. He joined Carson Cumberbatch Group in 2004. He is an Associate Member of the Institute of Chartered Accountants of Sri Lanka, Chartered Institute of Management Accountants (UK) and of the Society of Certified Management Accountants of Sri Lanka. He also holds a Masters degree in Business Administration from Postgraduate Institute of Management – University of Sri Jayewardenepura.
PASAN AbEYGUNAwARDANEHead of Portfolio Operations, Guardian Fund Management Ltd. Has over 9 years experience in the field of Asset Management working as a Operations Manager for CAAM Saudi Fransi LLC (Kingdom of Saudi Arabia) and Eagle NDB Fund Management (Sri Lanka). He holds a Bsc (Gen) in Applied Science from Sri Jayawardenapura University and is an Associate Member of the Chartered Institute of Management Accountants.
GAYAN kARUNARATHNASector Accountant for the Investment, Real Estate and Leisure sectors. Commenced career at Ernst & Young, Chartered Accountants and progressed with PricewaterhouseCoopers, Chartered Accountants, prior to joining Carsons Group. Counts over seven years of experience in auditing, accounting and financial reporting. He is an Associate Member of the Institute of Chartered Accountants of Sri Lanka, Chartered Institute of Management Accountants, UK and a member of CPA Australia. He also holds a Bachelors Degree specializing in finance from the University of Colombo, Sri Lanka.
ASANkA jAYASEkERAManager Research, Guardian Fund Management Ltd. He has over 6 years of experience in investment research. Prior to joining the Carson Cumberbatch Group, he worked as a financial analyst at JB Securities Ltd. He is an associate member of the Chartered Institute of Management Accountants (UK) and holds a B.Sc degree from the University of Sri Jayewardenepura specializing in Finance.
LAkMAL wICkRAMAARACHCHIAccountant, Guardian Fund Management Limited. Commenced career at KPMG, Chartered Accountants, prior to joining the Carsons Group. Counts over six years of experience in auditing and accounting. Associate Member of the Institute of Chartered Accountants of Sri Lanka. Holds a B.Sc. Finance (Special) Degree from the University of Sri Jayewardenepura, Sri Lanka.
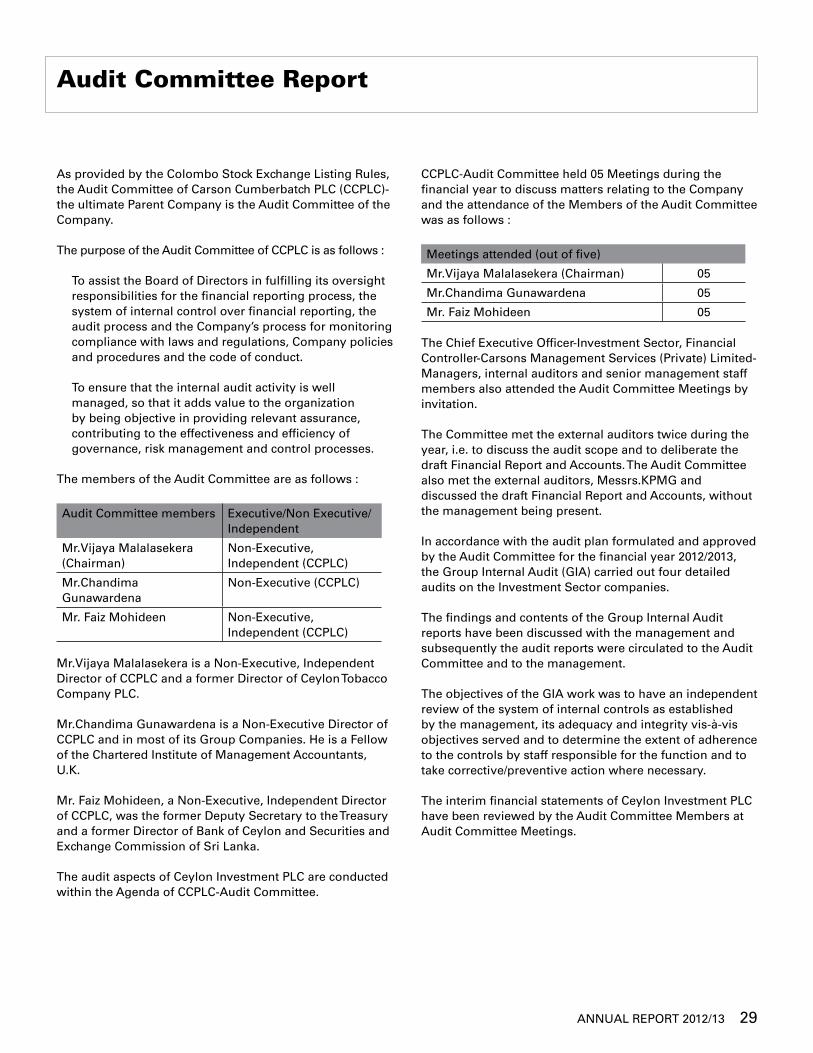
ANNUAL REPORT 2012/13 29
Audit Committee Report
As provided by the Colombo Stock Exchange Listing Rules, the Audit Committee of Carson Cumberbatch PLC (CCPLC)-the ultimate Parent Company is the Audit Committee of the Company.
The purpose of the Audit Committee of CCPLC is as follows :
To assist the Board of Directors in fulfilling its oversight responsibilities for the financial reporting process, the system of internal control over financial reporting, the audit process and the Company’s process for monitoring compliance with laws and regulations, Company policies and procedures and the code of conduct.
To ensure that the internal audit activity is well managed, so that it adds value to the organization by being objective in providing relevant assurance, contributing to the effectiveness and efficiency of governance, risk management and control processes.
The members of the Audit Committee are as follows :
Audit Committee members Executive/Non Executive/Independent
Mr.vijaya Malalasekera (Chairman)
Non-Executive, Independent (CCPLC)
Mr.Chandima Gunawardena
Non-Executive (CCPLC)
Mr. Faiz Mohideen Non-Executive, Independent (CCPLC)
Mr.vijaya Malalasekera is a Non-Executive, Independent Director of CCPLC and a former Director of Ceylon Tobacco Company PLC.
Mr.Chandima Gunawardena is a Non-Executive Director of CCPLC and in most of its Group Companies. He is a Fellow of the Chartered Institute of Management Accountants, U.K.
Mr. Faiz Mohideen, a Non-Executive, Independent Director of CCPLC, was the former Deputy Secretary to the Treasury and a former Director of Bank of Ceylon and Securities and Exchange Commission of Sri Lanka.
The audit aspects of Ceylon Investment PLC are conducted within the Agenda of CCPLC-Audit Committee.
CCPLC-Audit Committee held 05 Meetings during the financial year to discuss matters relating to the Company and the attendance of the Members of the Audit Committee was as follows :
Meetings attended (out of five)
Mr.vijaya Malalasekera (Chairman) 05
Mr.Chandima Gunawardena 05
Mr. Faiz Mohideen 05
The Chief Executive Officer-Investment Sector, Financial Controller-Carsons Management Services (Private) Limited-Managers, internal auditors and senior management staff members also attended the Audit Committee Meetings by invitation.
The Committee met the external auditors twice during the year, i.e. to discuss the audit scope and to deliberate the draft Financial Report and Accounts. The Audit Committee also met the external auditors, Messrs.KPMG and discussed the draft Financial Report and Accounts, without the management being present.
In accordance with the audit plan formulated and approved by the Audit Committee for the financial year 2012/2013, the Group Internal Audit (GIA) carried out four detailed audits on the Investment Sector companies.
The findings and contents of the Group Internal Audit reports have been discussed with the management and subsequently the audit reports were circulated to the Audit Committee and to the management.
The objectives of the GIA work was to have an independent review of the system of internal controls as established by the management, its adequacy and integrity vis-à-vis objectives served and to determine the extent of adherence to the controls by staff responsible for the function and to take corrective/preventive action where necessary.
The interim financial statements of Ceylon Investment PLC have been reviewed by the Audit Committee Members at Audit Committee Meetings.
30 CEYLON INvESTMENT PLC
For all periods up to and including the year ended 31st March 2012, the Company prepared its financial statements in accordance with the Sri Lanka Accounting Standards, which were in effect up to that date. Following the convergence of the Sri Lanka Accounting Standards with the International Financial Reporting Standards (IFRSs), all existing/new Sri Lanka Accounting Standards were prefixed as SLFRS and LKAS (referred to as “SLFRS” in these financial statements) and with effect from the financial periods beginning on or after 1st January 2012, it was mandatory for the Company to comply with the requirements of the said new / revised Sri Lanka Accounting Standards (LKAS/SLFRS). The adoption of the new/revised accounting framework required amendments to the basis of recognition, measurement and disclosure of transactions and balances in the financial statements of the Company, which are duly addressed in the financial statements for the year ended 31st March 2013. The transition and the resultant impact arising from the adoption of the new/revised accounting standards on the financial statements of the Company were audited by Messrs. KPMG, Chartered Accountants, the Auditors, during the year end audit.
The draft financial statements of Ceylon Investment PLC for the year ended 31st March 2013 were reviewed at a Meeting of the Audit Committee, together with the External Auditors, Messrs. KPMG, prior to release of same to the Regulatory Authorities and to the shareholders. The Audit Committee was provided with confirmations and declarations as required, by the Managers, Carsons Management Services (Private) Limited that the said financial statements were prepared in accordance with the Sri Lanka Accounting Standards and the information required by the Companies Act No. 7 of 2007 therein and presented a true and fair view of the Company’s state of affairs as at that date and the Company’s activities during the year under review.
The Audit Committee has determined that Messrs.KPMG, Chartered Accountants, Auditors were independent on the basis that they did not carry out any management related functions of the Company.
The Audit Committee has concurred to recommend to the Board of Directors the re-appointment of Messrs. KPMG, Chartered Accountants, as Auditors for the financial year ending 31st March 2014, subject to the approval of the shareholders of Ceylon Investment PLC at the Annual General Meeting.
(Sgd). V.P. MalalasekeraChairman – Audit CommitteeCarson Cumberbatch PLC
18th June 2013
Audit Committee Report
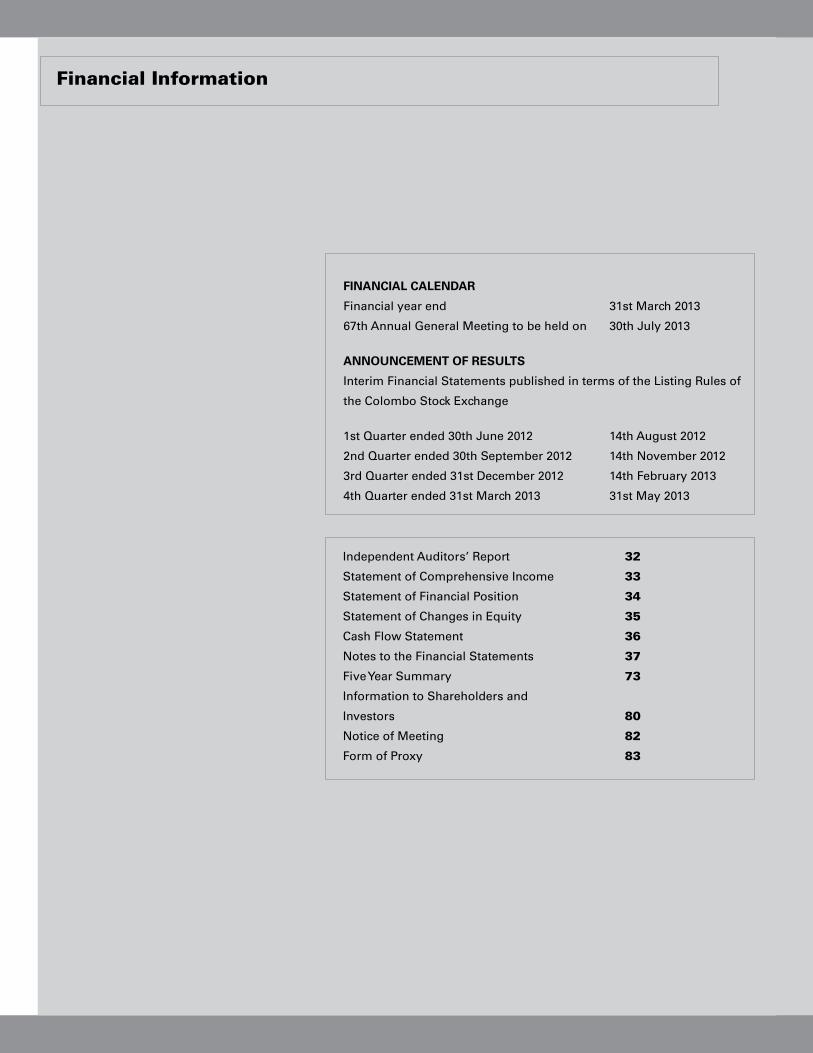
ANNUAL REPORT 2012/13 31
Independent Auditors’ Report 32
Statement of Comprehensive Income 33
Statement of Financial Position 34
Statement of Changes in Equity 35
Cash Flow Statement 36
Notes to the Financial Statements 37
Five Year Summary 73
Information to Shareholders and
Investors 80
Notice of Meeting 82
Form of Proxy 83
FINANCIAL CALENDAR
Financial year end 31st March 2013
67th Annual General Meeting to be held on 30th July 2013
ANNOUNCEMENT OF RESULTS
Interim Financial Statements published in terms of the Listing Rules of
the Colombo Stock Exchange
1st Quarter ended 30th June 2012 14th August 2012
2nd Quarter ended 30th September 2012 14th November 2012
3rd Quarter ended 31st December 2012 14th February 2013
4th Quarter ended 31st March 2013 31st May 2013
Financial Information
32 CEYLON INvESTMENT PLC
Independent Auditors’ Report
TO THE SHAREHOLDERS OF CEYLON INVESTMENT PLC Report on the Financial StatementsWe have audited the accompanying financial statements of Ceylon Investment PLC (the “Company”), which comprise the statement of financial position as at March 31, 2013, and the statements of comprehensive income, changes in equity and cash flow for the year then ended, and a summary of significant accounting policies and other explanatory information as set out on pages 33 to 72 of the Annual Report.
Management’s Responsibility for the Financial Statements Management is responsible for the preparation and fair presentation of these financial statements in accordance with Sri Lanka Accounting Standards. This responsibility includes: designing, implementing and maintaining internal control relevant to the preparation and fair presentation of financial statements that are free from material misstatement, whether due to fraud or error; selecting and applying appropriate accounting policies; and making accounting estimates that are reasonable in the circumstances.
Scope of Audit and basis of OpinionOur responsibility is to express an opinion on these financial statements based on our audit. We conducted our audit in accordance with Sri Lanka Auditing Standards. Those standards require that we plan and perform the audit to obtain reasonable assurance whether the financial statements are free from material misstatement.
An audit includes examining, on a test basis, evidence supporting the amounts and disclosures in the financial statements. An audit also includes assessing the accounting policies used and significant estimates made by management, as well as evaluating the overall financial statement presentation.
We have obtained all the information and explanations which to the best of our knowledge and belief were necessary for the purposes of our audit. We therefore believe that our audit provides a reasonable basis for our opinion.
OpinionIn our opinion, so far as appears from our examination, the Company maintained proper accounting records for the year ended March 31, 2013 and the financial statements give a true and fair view of the financial position of the Company as at March 31, 2013 and of its financial performance and its cash flows for the year then ended in accordance with Sri Lanka Accounting Standards.
Report on Other Legal and Regulatory RequirementsThese financial statements also comply with the requirements of Section 151(2) of the Companies Act No. 07 of 2007.
Chartered Accountants
18th June 2013Colombo
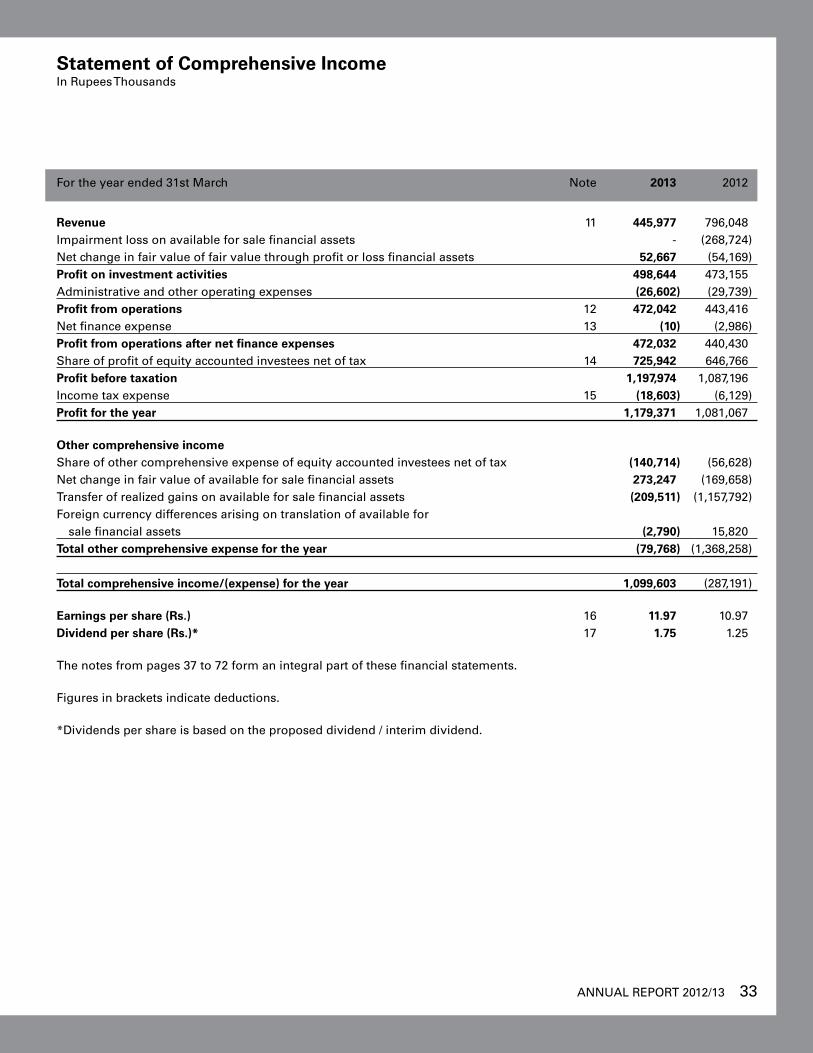
ANNUAL REPORT 2012/13 33
For the year ended 31st March Note 2013 2012
Revenue 11 445,977 796,048Impairment loss on available for sale financial assets - (268,724)Net change in fair value of fair value through profit or loss financial assets 52,667 (54,169)Profit on investment activities 498,644 473,155Administrative and other operating expenses (26,602) (29,739)Profit from operations 12 472,042 443,416Net finance expense 13 (10) (2,986)Profit from operations after net finance expenses 472,032 440,430Share of profit of equity accounted investees net of tax 14 725,942 646,766Profit before taxation 1,197,974 1,087,196Income tax expense 15 (18,603) (6,129)Profit for the year 1,179,371 1,081,067
Other comprehensive incomeShare of other comprehensive expense of equity accounted investees net of tax (140,714) (56,628)Net change in fair value of available for sale financial assets 273,247 (169,658)Transfer of realized gains on available for sale financial assets (209,511) (1,157,792)Foreign currency differences arising on translation of available for sale financial assets (2,790) 15,820Total other comprehensive expense for the year (79,768) (1,368,258)
Total comprehensive income/(expense) for the year 1,099,603 (287,191)
Earnings per share (Rs.) 16 11.97 10.97Dividend per share (Rs.)* 17 1.75 1.25
The notes from pages 37 to 72 form an integral part of these financial statements.
Figures in brackets indicate deductions.
*Dividends per share is based on the proposed dividend / interim dividend.
Statement of Comprehensive IncomeIn Rupees Thousands
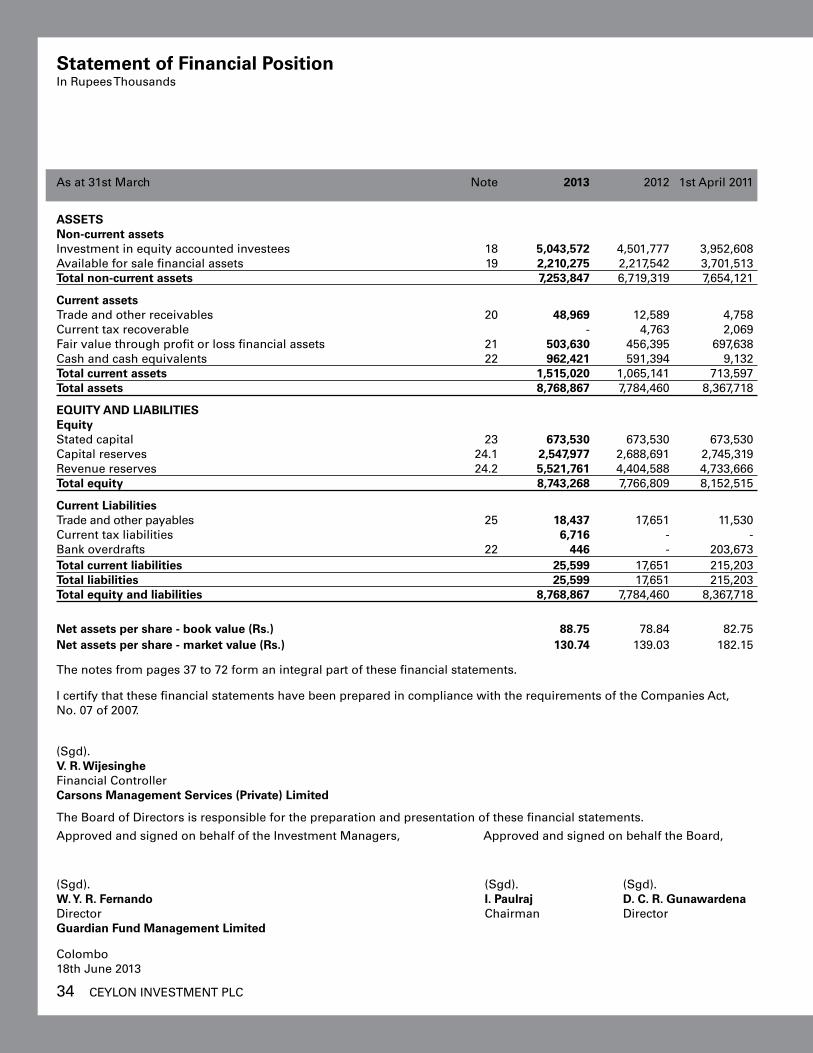
34 CEYLON INvESTMENT PLC
As at 31st March Note 2013 2012 1st April 2011
ASSETSNon-current assetsInvestment in equity accounted investees 18 5,043,572 4,501,777 3,952,608Available for sale financial assets 19 2,210,275 2,217,542 3,701,513Total non-current assets 7,253,847 6,719,319 7,654,121
Current assetsTrade and other receivables 20 48,969 12,589 4,758Current tax recoverable - 4,763 2,069Fair value through profit or loss financial assets 21 503,630 456,395 697,638Cash and cash equivalents 22 962,421 591,394 9,132Total current assets 1,515,020 1,065,141 713,597Total assets 8,768,867 7,784,460 8,367,718
EqUITY AND LIAbILITIESEquityStated capital 23 673,530 673,530 673,530Capital reserves 24.1 2,547,977 2,688,691 2,745,319Revenue reserves 24.2 5,521,761 4,404,588 4,733,666Total equity 8,743,268 7,766,809 8,152,515
Current LiabilitiesTrade and other payables 25 18,437 17,651 11,530Current tax liabilities 6,716 - -Bank overdrafts 22 446 - 203,673Total current liabilities 25,599 17,651 215,203Total liabilities 25,599 17,651 215,203Total equity and liabilities 8,768,867 7,784,460 8,367,718
Net assets per share - book value (Rs.) 88.75 78.84 82.75Net assets per share - market value (Rs.) 130.74 139.03 182.15
The notes from pages 37 to 72 form an integral part of these financial statements.
I certify that these financial statements have been prepared in compliance with the requirements of the Companies Act, No. 07 of 2007.
(Sgd). V. R. wijesinghe Financial Controller Carsons Management Services (Private) Limited
The Board of Directors is responsible for the preparation and presentation of these financial statements.
Approved and signed on behalf of the Investment Managers, Approved and signed on behalf the Board,
(Sgd). (Sgd). (Sgd). w. Y. R. Fernando I. Paulraj D. C. R. GunawardenaDirector Chairman DirectorGuardian Fund Management Limited
Colombo 18th June 2013
Statement of Financial PositionIn Rupees Thousands
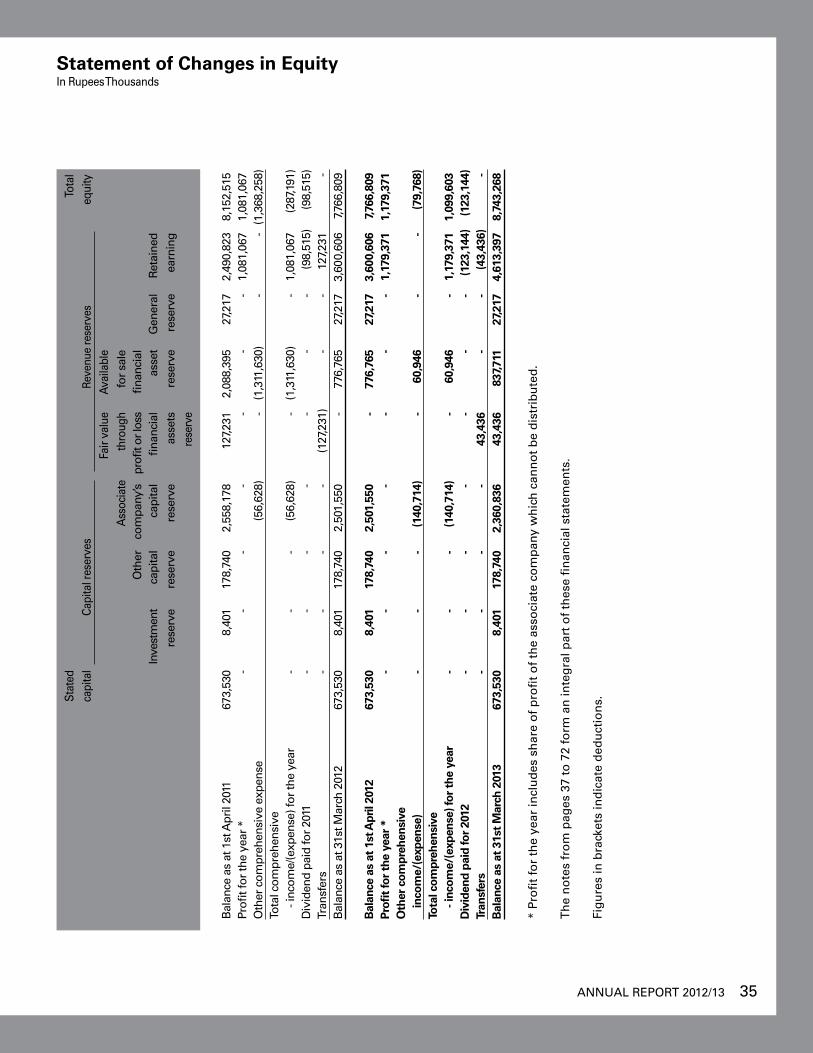
ANNUAL REPORT 2012/13 35
Statement of Changes in EquityIn Rupees Thousands
St
ated
To
tal
ca
pita
l Ca
pita
l res
erve
s R
even
ue re
serv
es
equi
ty
Fair
valu
e Av
aila
ble
Ass
ocia
te
thro
ugh
for
sale
Oth
er
com
pany
’s
profi
t or l
oss
finan
cial
Inv
estm
ent
capi
tal
capi
tal
fi
nanc
ial
asse
t G
ener
al
Ret
aine
d
re
serv
e re
serv
e re
serv
e
asse
ts
rese
rve
rese
rve
earn
ing
rese
rve
Bal
ance
as
at 1
st A
pril
2011
67
3,53
0 8,
401
178,
740
2,55
8,17
8 12
7,231
2,
088,
395
27,2
17
2,49
0,82
3 8,
152,
515
Profi
t for
the
year
*
- -
- -
- -
- 1,
081,
067
1,08
1,06
7O
ther
com
preh
ensi
ve e
xpen
se
(5
6,62
8)
- (1
,311
,630
) -
- (1
,368
,258
)To
tal c
ompr
ehen
sive
- inc
ome/
(exp
ense
) for
the
year
-
- -
(56,
628)
-
(1,3
11,6
30)
- 1,
081,
067
(287
,191
)D
ivid
end
paid
for
2011
-
- -
- -
- -
(98,
515)
(9
8,51
5)Tr
ansf
ers
- -
- -
(127
,231
) -
- 12
7,231
-
Bal
ance
as
at 3
1st M
arch
201
2 67
3,53
0 8,
401
178,
740
2,50
1,55
0 -
776,
765
27,2
17
3,60
0,60
6 7,7
66,8
09
bal
ance
as
at 1
st A
pril
2012
67
3,53
0 8,
401
178,
740
2,50
1,55
0 -
776,
765
27,2
17
3,60
0,60
6 7,
766,
809
Profi
t fo
r th
e ye
ar *
-
- -
- -
- -
1,17
9,37
1 1,
179,
371
Oth
er c
ompr
ehen
sive
in
com
e/(e
xpen
se)
- -
- (1
40,7
14)
- 60
,946
-
- (7
9,76
8)To
tal c
ompr
ehen
sive
- inc
ome/
(exp
ense
) for
the
yea
r -
- -
(140
,714
) -
60,9
46
- 1,
179,
371
1,09
9,60
3D
ivid
end
paid
for
2012
-
- -
- -
- -
(123
,144
) (1
23,1
44)
Tran
sfer
s -
- -
- 43
,436
-
- (4
3,43
6)
-b
alan
ce a
s at
31s
t M
arch
201
3 67
3,53
0 8,
401
178,
740
2,36
0,83
6 43
,436
83
7,71
1 27
,217
4,
613,
397
8,74
3,26
8
* Pr
ofi
t fo
r th
e ye
ar in
clu
des
sh
are
of
pro
fit
of
the
asso
ciat
e co
mp
any
wh
ich
can
no
t b
e d
istr
ibu
ted
.
Th
e n
ote
s fr
om
pag
es 3
7 to
72
form
an
inte
gra
l par
t o
f th
ese
fin
anci
al s
tate
men
ts.
Fig
ure
s in
bra
cket
s in
dic
ate
ded
uct
ion
s.
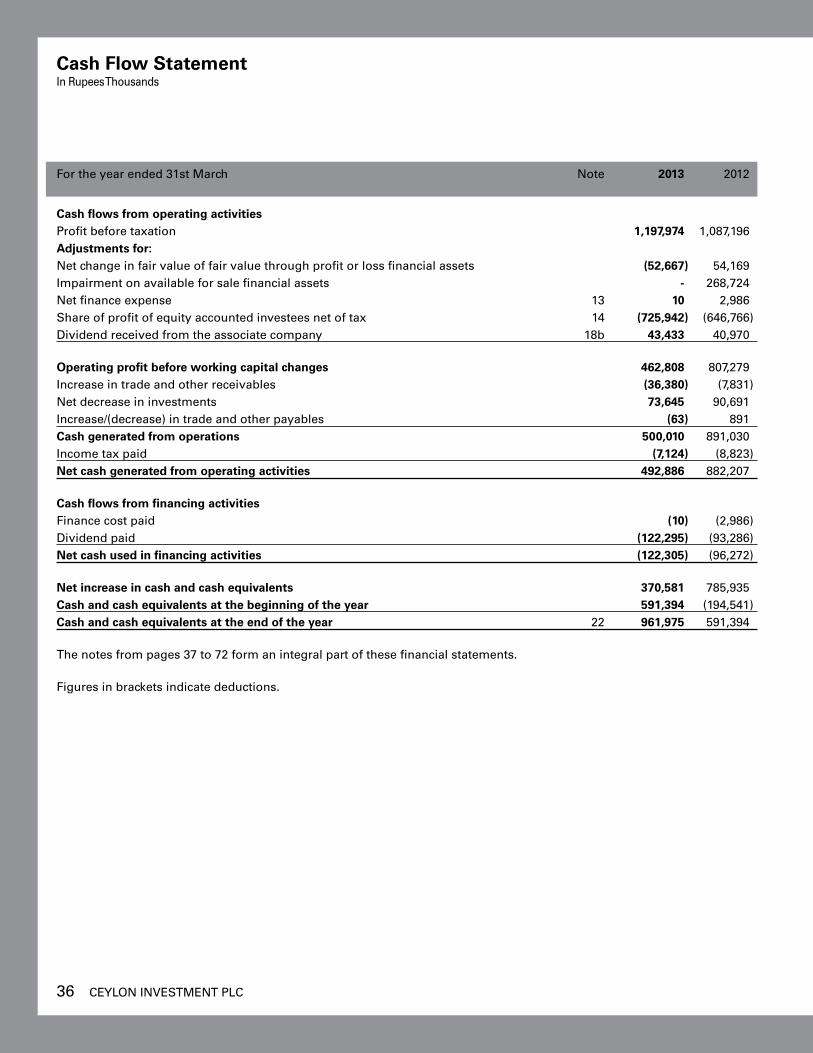
36 CEYLON INvESTMENT PLC
For the year ended 31st March Note 2013 2012
Cash flows from operating activitiesProfit before taxation 1,197,974 1,087,196Adjustments for:Net change in fair value of fair value through profit or loss financial assets (52,667) 54,169Impairment on available for sale financial assets - 268,724Net finance expense 13 10 2,986Share of profit of equity accounted investees net of tax 14 (725,942) (646,766)Dividend received from the associate company 18b 43,433 40,970
Operating profit before working capital changes 462,808 807,279Increase in trade and other receivables (36,380) (7,831)Net decrease in investments 73,645 90,691Increase/(decrease) in trade and other payables (63) 891Cash generated from operations 500,010 891,030Income tax paid (7,124) (8,823)Net cash generated from operating activities 492,886 882,207
Cash flows from financing activitiesFinance cost paid (10) (2,986)Dividend paid (122,295) (93,286)Net cash used in financing activities (122,305) (96,272)
Net increase in cash and cash equivalents 370,581 785,935Cash and cash equivalents at the beginning of the year 591,394 (194,541)Cash and cash equivalents at the end of the year 22 961,975 591,394
The notes from pages 37 to 72 form an integral part of these financial statements.
Figures in brackets indicate deductions.
Cash Flow StatementIn Rupees Thousands
ANNUAL REPORT 2012/13 37
1. Reporting entity Ceylon Investments PLC (the ‘Company’) is a
company domiciled in Sri Lanka. The shares of the Company have a primary listing on the Colombo Stock Exchange.
The registered office of the Company is located at No. 61, Janadhipathi Mawatha, Colombo 1.
The financial statements of the Company as at and for the year ended 31 March 2013 comprise the financial information of the Company and its interest in associate company.
The principal activity of the Company is to act as a specialised investment vehicle within the investment business to undertake listed, private equity and fixed income investments.
There were no significant changes in the nature of the principal activities of the Company during the financial year under review.
The Company had no employees as at the reporting date (2012 - Nil).
2. basis of preparation (a) Statement of compliance The financial statements of the Company comprise
the statement of financial position, statement of comprehensive income, statement of changes in equity and cash flows together with the notes to the financial statements.
The financial statements have been prepared in accordance with Sri Lanka Accounting Standards (LKAS/SLFRS) laid down by the Institute of Chartered Accountants of Sri Lanka and the requirements of Companies Act, No. 7 of 2007.
For all periods up to and including the year ended 31st March 2012, the Company prepared their financial statements in accordance with Sri Lanka Accounting Standards which were in effect up to that date. Following the convergence of Sri Lanka Accounting Standards with the International Financial Reporting Standards (IFRSs), all existing/ new Sri Lanka Accounting Standards were prefixed as SLFRS and LKAS (referred to as “SLFRS” in these financial statements) to represent Sri Lanka Accounting Standards corresponding to International Financial
Reporting Standards and Sri Lanka Accounting Standards corresponding to International Accounting Standards (IASs), respectively. Accordingly, the Company adopted these new Sri Lanka Accounting Standards (which are commonly known as SLFRSs) applicable for financial periods commencing from 1st April 2012.
These are the Company’s first financial statements prepared in accordance with LKAS/SLFRS and SLFRS 1 - "First time adoption of Sri Lanka Accounting Standard" has been applied.
The explanation how the transition to LKAS/ SLFRS has affected the reported financial position, financial performance and cashflows of the Company is provided in Note 29 to the financial statements.
The financial statements were authorised for issue by the Board of Directors on 18th June 2013.
(b) basis of measurement The financial statements have been prepared on the
historical cost basis and applied consistently with no adjustments being made for inflationary factors affecting the financial statements, except for the following material items in the statement of financial position:
• fairvaluethroughprofitorlossaremeasuredatfair value;
• available-for-salefinancialassetsaremeasuredatfair value
• non-derivativefinancialassets/liabilitiesclassified as ‘Loans and receivables’ and ‘Other financial liabilities’ measured at amortised cost.
These financial statements have been prepared on the basis that the Company would continue as a going concern for the foreseeable future.
(c) Functional and presentation currency Items included in the financial statements of the
Company are measured using the currency of the primary economic environment in which the Company operates (‘the functional currency’).
The financial statements are presented in Sri Lankan Rupees, which is the Company’s functional and presentation currency.
Notes to the Financial Statements
38 CEYLON INvESTMENT PLC
(d) Use of estimates and judgements The preparation of financial statements in conformity
with LKAS/SLFRS requires management to make judgements, estimates and assumptions that affect the application of accounting policies and the reported amounts of assets, liabilities, income and expenses. Actual results may differ from these estimates.
Estimates and underlying assumptions are reviewed on an ongoing basis. Revisions to accounting estimates are recognised in the period in which the estimates are revised and in any future periods affected.
Information about assumptions and estimation uncertainties that have a significant risk of resulting in a material adjustment within the next financial year are included in the following notes:
• AssessmentofImpairment-Keyassumptionsused in discounted cash flow projections
The Company assesses at each reporting date whether there is objective evidence that an asset or portfolio of assets is impaired. The recoverable amount of an asset is the greater of its value in use and its fair value less costs to sell.
In assessing value in use, the estimated future cash flows are discounted to present value using appropriate discount rates that reflects the current market assessments of the time value of money and risks specific to the asset.
• Fairvaluemeasurementofavailableforsalefinancial assets
The Company assess at each reporting date, the fair value of the available for sale financial assets, which comprise of both quoted securities and unquoted securities. The fair value measurement of such unquoted securities are primarily based on estimated future cash flows, discounted to present value using appropriate discount rates that reflects the current market assessments of the time value of money and risks specific to the asset.
At the point of realization, the amounts realized may differ from such reported values.
• Currenttaxation Current tax liabilities are provided for in the
financial statements applying the relevant tax statutes and regulations which the management believes reflect the actual liability. There can be instances where the stand taken by the Company on transactions is contested by revenue authorities. Any additional costs on account of these issues are accounted for as a tax expense at the point the liability is confirmed on the entity.
Materiality and aggregation Each material class of similar items is presented
in aggregate in the financial statements. Items of dissimilar nature or function are presented separately unless they are immaterial.
3. Significant accounting policies The accounting policies set out below have been
applied consistently to all periods presented in the financial statements of the Company and in preparing the opening LKAS/SLFRS Statement of financial position at 1st April 2011 for the purposes of the transition to LKAS/SLFRSs, unless otherwise indicated.
(a) Accounting for investments in equity-accounted investees
Associates are those entities in which the Company has significant influence, but not control or joint control, over the financial and operating policies. Significant influence is presumed to exist when the Company holds between 20 percent and 50 percent of the voting power of another entity. Investments in associates are accounted for under the equity method and are recognised initially at cost. The cost of the investment includes transaction costs. The Company’s investment in associate includes goodwill (net of any accumulated impairment loss) identified on acquisition.
The Company’s financial statements include the share of profit or loss and other comprehensive income of equity-accounted investees, after adjustments to align the accounting policies are recognized from the date that significant influence commences until the date that significant influence ceases.
When the Company’s share of losses exceeds its interest in an equity-accounted investee, the carrying amount of the investment, including any long-term interests that form part thereof, is reduced to zero,
Notes to the Financial Statements
ANNUAL REPORT 2012/13 39
and the recognition of further losses is discontinued except to the extent that the Company has an obligation or has made payments on behalf of the investee.
Unrealised gains arising from transactions with equity accounted investees are eliminated against the investment to the extent of the Company’s interest in the investee.
Unrealised losses are eliminated in the same way as unrealised gains, but only to the extent that there is no evidence of impairment.
In the Company’s standalone financial statements, the investment in associate is carried at cost, less accumulated impairment losses, if any.
The Company and its associate has a common financial year end, which ends on 31st March.
(b) Foreign currency i. Foreign currency transactions
Transactions in foreign currencies are translated to the respective functional currencies of Company at exchange rates at the dates of the transactions.
Monetary assets and liabilities denominated in foreign currencies at the reporting date are retranslated to the functional currency at the exchange rate as at that date.
The foreign currency gain or loss on monetary items is the difference between amortised cost in the functional currency at the beginning of the year, adjusted for effective interest and payments during the year, and the amortised cost in foreign currency translated at the exchange rate at the end of the year.
Non-monetary assets and liabilities that are measured at fair value in a foreign currency are retranslated to the functional currency at the exchange rate at the date that the fair value was determined. Non-monetary items that are measured based on historical cost in a foreign currency are translated using the exchange rate at the date of the transaction.
Foreign currency differences arising on retranslation are generally recognised in profit or loss. However, foreign currency differences arising from the retranslation of available-for-sale equity investments (except on impairment in which case foreign currency
differences that have been recognised in other comprehensive income are reclassified to profit or loss) are recognised in other comprehensive income:
(c) Financial instruments i. Non-derivative financial assets
The Company initially recognises loans and receivables on the date that they are originated. All other financial assets (including assets designated as at fair value through profit or loss) are recognised initially on the trade date, which is the date that the Company becomes a party to the contractual provisions of the instrument.
The Company derecognises a financial asset when the contractual rights to the cash flows from the asset expire, or it transfers the rights to receive the contractual cash flows in a transaction in which substantially all the risks and rewards of ownership of the financial asset are transferred. Any interest in such transferred financial assets that is created or retained by the Company is recognised as a separate asset or liability.
Financial assets and liabilities are offset and the net amount presented in the statement of financial position when, and only when, the Company has a legal right to offset the amounts and intends either to settle them on a net basis or to realise the asset and settle the liability simultaneously.
The Company classifies non-derivative financial assets into the following categories: financial assets at fair value through profit or loss, loans and receivables and available-for-sale financial assets. The Company do not hold financial assets categorized in to “held to maturity” classification.
Financial assets at fair value through profit or loss A financial asset is classified as at fair value through
profit or loss if it is classified as held for trading or is designated as such on initial recognition. Financial assets are designated as at fair value through profit or loss if the Company manages such investments and makes purchase and sale decisions based on their fair value in accordance with the Company’s documented risk management or investment strategy. Attributable transaction costs are recognised in profit or loss as incurred. Financial assets at fair value through profit or loss are measured at fair value and changes therein, which takes into account any dividend income, are recognised in profit or loss.
40 CEYLON INvESTMENT PLC
Financial assets classified as held for trading comprise short-term sovereign debt securities actively managed by the Company’s treasury department with due consideration on short-term liquidity needs.
Financial assets designated as at fair value through profit or loss comprise equity securities that otherwise would have been classified as available for sale.
Loans and receivables Loans and receivables are financial assets with fixed
or determinable payments that are not quoted in an active market. Such assets are recognised initially at fair value plus any directly attributable transaction costs. Subsequent to initial recognition, loans and receivables are measured at amortised cost using the effective interest method, less any impairment losses.
Loans and receivables comprise cash and cash equivalents and trade and other receivables.
Cash and cash equivalents Cash and cash equivalents comprise cash balances
and call deposits with maturities of three months or less from the acquisition date that are subject to an insignificant risk of changes in their fair value, and are used by the Company in the management of its short-term commitments.
Available-for-sale financial assets Available for sale financial assets are non-derivative
financial assets that are designated as available for sale or are not classified in any of the above categories of financial assets. Available for sale financial assets are recognised initially at fair value plus any directly attributable transaction costs.
Subsequent to initial recognition, they are measured at fair value and changes therein, other than impairment losses and foreign currency differences on available for sale debt instruments, are recognised in other comprehensive income and presented in the “Available for sale financial assets reserve” in equity. When an investment is derecognised, the gain or loss accumulated in equity is reclassified to profit or loss.
Available for sale financial assets comprise equity securities and debt securities.
ii. Non-derivative financial liabilities
The Company initially recognises subordinated liabilities on the date that they are originated. All other financial liabilities are recognised initially on the trade date, which is the date that the Company becomes a party to the contractual provisions of the instrument.
The Company derecognises a financial liability when its contractual obligations are discharged, cancelled or expire.
The Company classifies non-derivative financial liabilities into the other financial liabilities category. Such financial liabilities are recognised initially at fair value less any directly attributable transaction costs. Subsequent to initial recognition, these financial liabilities are measured at amortised cost using the effective interest method.
Other financial liabilities comprise loans and borrowings, bank overdrafts and trade and other payables.
Bank overdrafts that are repayable on demand and form an integral part of the Company’s cash management are included as a component of cash and cash equivalents for the purpose of statement of cash flows.
iii. Stated capital
Ordinary shares Ordinary shares are classified as equity. Costs
attributable to the issue of ordinary shares are recognised as an expense
(d) Impairment i. Non-derivative financial assets
A financial asset not classified as at fair value through profit or loss, including an interest in an equity accounted investee, is assessed at each reporting date to determine whether there is objective evidence that it is impaired. A financial asset is impaired if there is objective evidence of impairment as a result of one or more events that occurred after the initial recognition of the asset and that loss event(s) had an impact on the estimated future cash flows of that asset that can be estimated reliably.
Notes to the Financial Statements
ANNUAL REPORT 2012/13 41
Objective evidence that financial assets are impaired includes default or delinquency by a debtor, restructuring of an amount due to the Company on terms that the Company would not consider otherwise, indications that a debtor or issuer will enter bankruptcy, adverse changes in the payment status of borrowers or issuers, economic conditions that correlate with defaults or the disappearance of an active market for a security. In addition, for an investment in an equity security, a significant or prolonged decline in its fair value below its cost is objective evidence of impairment. The Company considers a decline of 20 percent to be significant and a period of 9 months to be prolonged.
Financial assets measured at amortised cost The Company considers evidence of impairment
for financial assets measured at amortised cost (loans and receivables) at both a specific asset and collective level. All individually significant assets are assessed for specific impairment. Those found not to be specifically impaired are then collectively assessed for any impairment that has been incurred but not yet identified. Assets that are not individually significant are collectively assessed for impairment by grouping together assets with similar risk characteristics.
An impairment loss in respect of a financial asset measured at amortised cost is calculated as the difference between its carrying amount and the present value of the estimated future cash flows discounted at the asset’s original effective interest rate. Losses are recognised in profit or loss and reflected in an allowance account against loans and receivables. Interest on the impaired asset continues to be recognised. When an event occurring after the impairment was recognised causes the amount of impairment loss to decrease, the decrease in impairment loss is reversed through profit or loss.
Available-for-sale financial assets Impairment losses on available for sale investment
securities are recognised by transferring the cumulative loss that has been recognised in other comprehensive income and presented in the fair value reserve in equity, to profit or loss. The cumulative loss that is removed from other comprehensive income and recognised in profit or loss is the difference between the acquisition cost, net of any principal repayment and amortisation, and the current fair value, less any impairment loss previously recognised in profit or loss.
If, in a subsequent period, the fair value of an impaired available for sale debt security increases and the increase can be related objectively to an event occurring after the impairment loss was recognised, then the impairment loss is reversed, with the amount of the reversal recognised in profit or loss.
However, any subsequent recovery in the fair value of an impaired available for sale equity security is recognised in other comprehensive income.
ii. Non-financial assets
The carrying amounts of the Company’s non-financial assets are reviewed at each reporting date to determine whether there is any indication of impairment. If any such indication exists, then the asset’s recoverable amount is estimated. An impairment loss is recognised if the carrying amount of an asset or cash-generating unit (CGU) exceeds its recoverable amount.
The recoverable amount of an asset or CGU is the greater of its value in use and its fair value less costs to sell. In assessing value in use, the estimated future cash flows are discounted to their present value using a pre-tax discount rate that reflects current market assessments of the time value of money and the risks specific to the asset or CGU. For impairment testing, assets are grouped together into the smallest group of assets that generates cash inflows from continuing use that are largely independent of the cash inflows of other assets or CGUs.
Impairment losses are recognised in profit or loss.
An impairment loss is reversed only to the extent that the asset’s carrying amount does not exceed the carrying amount that would have been determined, if no impairment loss had been recognised.
(e) Provisions A provision is recognised if, as a result of a
past event, the Company has a present legal or constructive obligation that can be estimated reliably, and it is probable that an outflow of economic benefits will be required to settle the obligation. Provisions are determined by discounting the expected future cash flows at a pre-tax rate that reflects current market assessments of the time value of money and the risks specific to the liability.
42 CEYLON INvESTMENT PLC
(f) Contingent liabilities and contingent assets A contingent liability is a possible obligation that
arises from past events whose existence will be confirmed by the occurrence or non-occurrence of one or more uncertain future events beyond the control of the Company or a present obligation that is not recognized because it is not probable that an outflow of resources will be required to settle the obligation.
A contingent liability also arises in extremely rare cases where there is a liability that cannot be recognized because it cannot be measured reliably. The Company does not recognize a contingent liability but discloses its existence in the financial statements.
A contingent asset is a possible asset that arises from past events whose existence will be confirmed by the occurrence or non-occurrence of one or more uncertain future events beyond the control of the Company. The Company does not recognize contingent assets but discloses its existence where inflows of economic benefits are probable, but not virtually certain.
(g) Revenue Revenue is recognized to the extent that it is probable
that the economic benefits will flow to the Company, and the revenue and associated costs incurred or to be incurred can be reliably measured. Revenue is measured at the fair value of the consideration received or receivable, net of sales taxes.
The following specific criteria are used for the purpose of recognition of revenue:
i. Dividend Income
Dividend income is recognised in profit or loss on the date that the Group’s right to receive payment is established, which in the case of quoted securities is normally the ex-dividend date.
ii. Gain on disposal of financial assets (categorized as available for sale / fair value through profit or loss)
Profit or loss on disposal of investments are accounted for in the Statement of comprehensive income on the basis of realized net profit.
iii. Interest income
Interest income comprises the amounts earned on funds invested (including available for sale financial assets), and is recognised as it accrues in profit or loss, using the effective interest method.
iv. Other Income
On accrual basis.
(h) Expenditure Recognition
Operating Expenses
All expenses incurred in day-to-day operations of the business have been charged to revenue in arriving at the profit or loss for the year. Provision has also been made for all known liabilities.
(i) Finance income and finance costs Finance costs comprise interest expense on loans and
borrowings and bank overdrafts.
Foreign currency gains and losses on financial assets and financial liabilities are reported on a net basis as either finance income or finance cost depending on whether foreign currency movements are in a net gain or net loss position.
(j) Income tax expense Income tax expense comprises current taxation,
which is recognised in profit or loss except to the extent that it relates to items recognised directly in equity or in other comprehensive income.
i. Current taxation
Current taxation is the expected tax payable or receivable on the taxable income or loss for the year, using tax rates enacted or substantively enacted at the reporting date, and any adjustment to tax payable in respect of previous years.
ii. Tax exposures
In determining the amount of current tax, the Company takes into account the impact of uncertain tax positions and whether additional taxes and interest may be due. This assessment relies on estimates and assumptions and may involve a series of judgements about future events. New information may become available that causes the Company to change its judgement regarding the adequacy of existing tax liabilities; such changes to tax liabilities
Notes to the Financial Statements
ANNUAL REPORT 2012/13 43
will impact tax expense in the period in which such a determination is made.
Economic Service Charge (ESC) As per the provisions of Economic Service Charge
Act No. 13 of 2006 and amendments thereto, ESC is payable on “Liable Turnover” and is deductible from the income tax payments. Any unclaimed ESC can be carried forward and settle against the income tax payable in the four subsequent years.
(k) Earnings per share The Company presents basic earnings per share (EPS)
data for its ordinary shares. Basic EPS is calculated by dividing the profit or loss attributable to ordinary shareholders of the Company by the weighted average number of ordinary shares outstanding during the year.
4. Statement of cash flows Interest paid, interest received and dividend received
are classified as operating cash flows, while dividend paid is classified as financing cash flows for the purpose of presentation of Cash Flow Statement which has been prepared using the “Indirect Method”
5. Related party transactions Disclosure has been made in respect of the
transactions in which one party has the ability to control or exercise significant influence over the financial and operating policies/decisions of the other, irrespective of whether a price is charged.
6. Events after the reporting period All material and important events which occur
after the reporting date have been considered and disclosed in Note 26.
7. Dividends on ordinary shares Dividends on ordinary shares are recognized as a
liability and deducted from equity when they are approved by the Company’s shareholders. Interim dividends are deducted from equity when they are declared and are no longer at the discretion of the Company.
8. Presentation Assets and liabilities are grouped by nature and listed
in an order that reflects their relative liquidity and maturity pattern.
Where appropriate, the significant accounting policies are disclosed in the succeeding notes.
Offsetting Income and Expenses Income and expenses are not offset unless required
or permitted by accounting standards.
Offsetting Assets and Liabilities Assets and liabilities are offset and the net amount
reported in the statement of financial position only where there is:
• acurrentenforceablelegalrighttooffsettheassetand the liability; and
• anintentiontosettletheliabilitysimultaneously
9. Determination of fair values The Company’s accounting policies and disclosures
require the determination of fair value, for both financial and non-financial assets and liabilities. Fair values have been determined for measurement and/or disclosure purposes based on the following methods. Where applicable, further information about the assumptions made in determining fair values is disclosed in the notes specific to that asset or liability.
(a) Equity and debt securities The fair values of investments in equity and debt
securities are determined with reference to their quoted closing bid price at the measurement date, or if unquoted, determined using a valuation technique. valuation techniques employed include market multiples and discounted cash flow analysis using expected future cash flows and a market-related discount rate.
Subsequent to initial recognition, the fair values of held-to-maturity investments are determined for disclosure purposes only.
(b) Trade and other receivables Short-term receivables with no stated interest rate are
measured at the original invoice amount if the effect of discounting is immaterial. Fair value is determined at initial recognition and, for disclosure purposes, at each annual reporting date.
(c) Other non-derivative financial liabilities Other non-derivative financial liabilities are measured
at fair value, at initial recognition and for disclosure purposes, at each annual reporting date. New Accounting Standards issued but not effective as at the reporting date.
44 CEYLON INvESTMENT PLC
10. New Accounting Standards issued but not effective as at reporting date
The Institute of Chartered Accountants of Sri Lanka has issued the following new Sri Lanka Accounting Standards which will become applicable for financial periods beginning on or after 1st January 2014/ 2015.
Accordingly, these Standards have not been applied in preparing these financial statements.
• SriLankaAccountingStandards–SLFRS10“Consolidated financial statements”
The objective of this SLFRS is to establish principles for the presentation and preparation of consolidated financial statements when an entity controls one or more other entities.
SLFRS 10 will become effective from 1 April 2014 for the Group with early adoption permitted. This SLFRS will supersede the requirements relating to consolidated financial statements in LKAS 27”Consolidated and Separate Financial Statements
• SriLankaAccountingStandards–SLFRS11“JointArrangements”
The objective of this SLFRS is to establish principles for financial reporting by entities that have an interest in arrangements that are controlled jointly (ie joint arrangements).
SLFRS 11 will become effective from 1 April 2014 for the Group with early adoption permitted. This SLFRS will supersede the requirements relating to consolidated financial statements in LKAS 31” Interests in Joint ventures
• SriLankaAccountingStandard-SLFRS12”Disclosureof Interests in Other Entities”
SLFRS 10 will become effective from 1 April 2014 for the Group with early adoption permitted
• SriLankaAccountingStandard-SLFRS13,“Fairvalue Measurement”
This SLFRS defines fair value, sets out in a single SLFRS a framework for measuring fair value; and requires disclosures about fair value measurements.
This SLFRS will become effective for the Group from 1 April 2014. Earlier application is permitted.
This SLFRS shall be applied prospectively as of the beginning of the annual period in which it is initially applied. The disclosure requirements of this SLFRS need not be applied in comparative information provided for periods before initial application of this SLFRS.
• SriLankaAccountingStandard–SLFRS9“FinancialInstruments”
The objective of this SLFRS is to establish principles for the financial reporting of financial assets and financial liabilities that will present relevant and useful information to users of financial statements for their assessment of the amounts, timing and uncertainty of an entity’s future cash flows.
An entity shall apply this SLFRS to all items within the scope of LKAS 39 Financial Instruments: Recognition and Measurement.
This SLFRS will become effective for the group from 1 April 2015. Earlier application is permitted for the financial period beginning on or after 01 January, 2013. However, if the Group elects to apply this SLFRS early, it must apply all of the requirements in this SLFRS at the same time
Notes to the Financial Statements
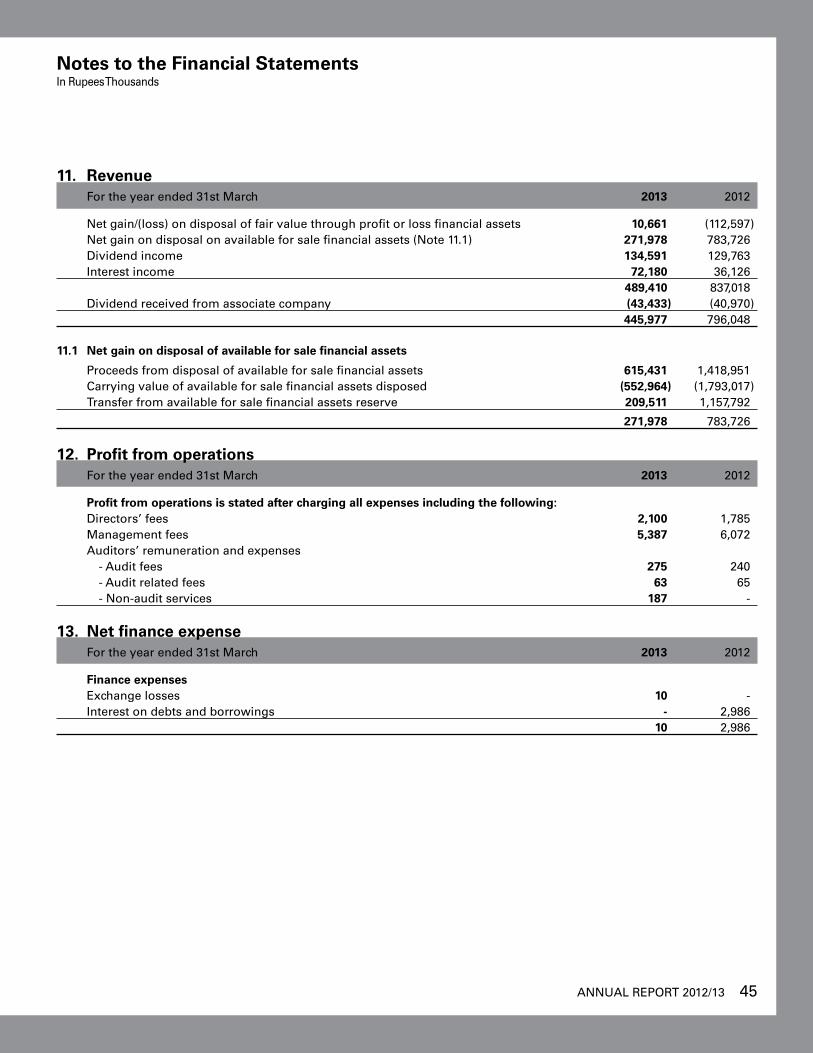
ANNUAL REPORT 2012/13 45
11. Revenue For the year ended 31st March 2013 2012
Net gain/(loss) on disposal of fair value through profit or loss financial assets 10,661 (112,597) Net gain on disposal on available for sale financial assets (Note 11.1) 271,978 783,726 Dividend income 134,591 129,763 Interest income 72,180 36,126 489,410 837,018 Dividend received from associate company (43,433) (40,970) 445,977 796,048
11.1 Net gain on disposal of available for sale financial assets
Proceeds from disposal of available for sale financial assets 615,431 1,418,951 Carrying value of available for sale financial assets disposed (552,964) (1,793,017) Transfer from available for sale financial assets reserve 209,511 1,157,792
271,978 783,726
12. Profit from operations
For the year ended 31st March 2013 2012
Profit from operations is stated after charging all expenses including the following: Directors’ fees 2,100 1,785 Management fees 5,387 6,072 Auditors’ remuneration and expenses - Audit fees 275 240 - Audit related fees 63 65 - Non-audit services 187 -
13. Net finance expense For the year ended 31st March 2013 2012
Finance expenses Exchange losses 10 - Interest on debts and borrowings - 2,986 10 2,986
Notes to the Financial StatementsIn Rupees Thousands
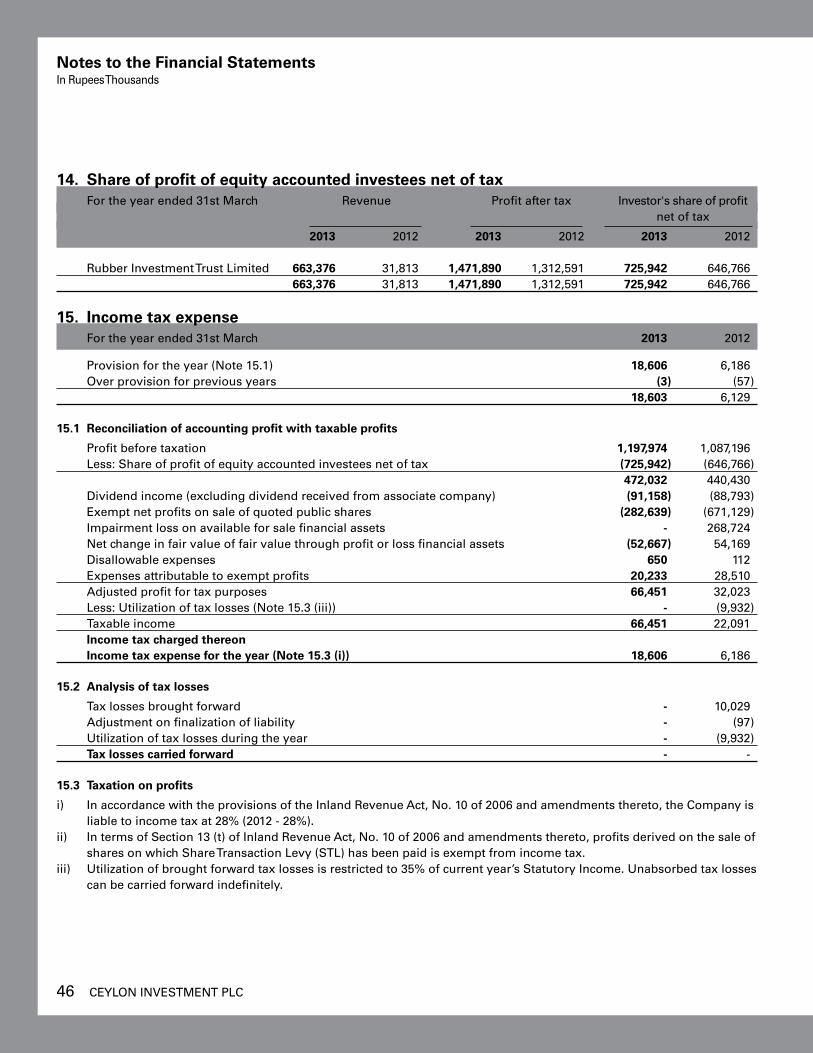
46 CEYLON INvESTMENT PLC
14. Share of profit of equity accounted investees net of tax For the year ended 31st March Revenue Profit after tax Investor's share of profit net of tax
2013 2012 2013 2012 2013 2012
Rubber Investment Trust Limited 663,376 31,813 1,471,890 1,312,591 725,942 646,766 663,376 31,813 1,471,890 1,312,591 725,942 646,766
15. Income tax expense For the year ended 31st March 2013 2012
Provision for the year (Note 15.1) 18,606 6,186 Over provision for previous years (3) (57) 18,603 6,129
15.1 Reconciliation of accounting profit with taxable profits
Profit before taxation 1,197,974 1,087,196 Less: Share of profit of equity accounted investees net of tax (725,942) (646,766) 472,032 440,430 Dividend income (excluding dividend received from associate company) (91,158) (88,793) Exempt net profits on sale of quoted public shares (282,639) (671,129) Impairment loss on available for sale financial assets - 268,724 Net change in fair value of fair value through profit or loss financial assets (52,667) 54,169 Disallowable expenses 650 112 Expenses attributable to exempt profits 20,233 28,510 Adjusted profit for tax purposes 66,451 32,023 Less: Utilization of tax losses (Note 15.3 (iii)) - (9,932) Taxable income 66,451 22,091 Income tax charged thereon Income tax expense for the year (Note 15.3 (i)) 18,606 6,186
15.2 Analysis of tax losses
Tax losses brought forward - 10,029 Adjustment on finalization of liability - (97) Utilization of tax losses during the year - (9,932) Tax losses carried forward - -
15.3 Taxation on profits
i) In accordance with the provisions of the Inland Revenue Act, No. 10 of 2006 and amendments thereto, the Company is liable to income tax at 28% (2012 - 28%).
ii) In terms of Section 13 (t) of Inland Revenue Act, No. 10 of 2006 and amendments thereto, profits derived on the sale of shares on which Share Transaction Levy (STL) has been paid is exempt from income tax.
iii) Utilization of brought forward tax losses is restricted to 35% of current year’s Statutory Income. Unabsorbed tax losses can be carried forward indefinitely.
Notes to the Financial StatementsIn Rupees Thousands
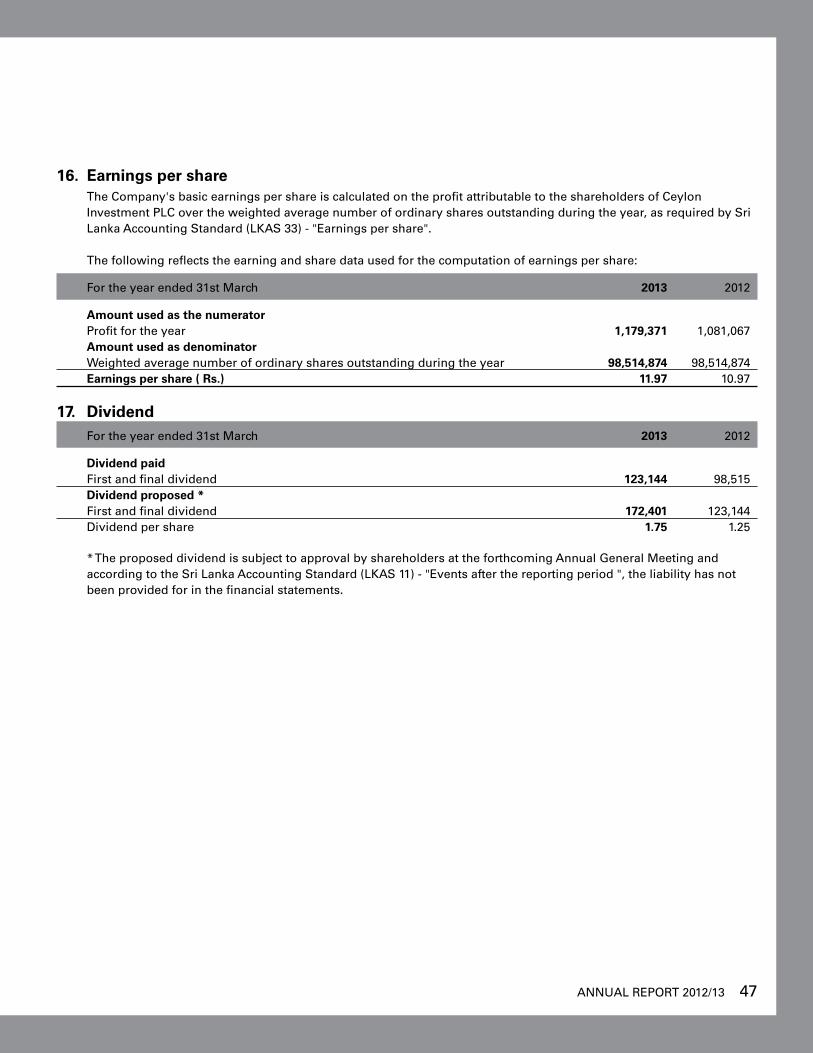
ANNUAL REPORT 2012/13 47
16. Earnings per share The Company's basic earnings per share is calculated on the profit attributable to the shareholders of Ceylon
Investment PLC over the weighted average number of ordinary shares outstanding during the year, as required by Sri Lanka Accounting Standard (LKAS 33) - "Earnings per share".
The following reflects the earning and share data used for the computation of earnings per share:
For the year ended 31st March 2013 2012
Amount used as the numerator Profit for the year 1,179,371 1,081,067 Amount used as denominator Weighted average number of ordinary shares outstanding during the year 98,514,874 98,514,874 Earnings per share ( Rs.) 11.97 10.97
17. Dividend For the year ended 31st March 2013 2012
Dividend paid First and final dividend 123,144 98,515 Dividend proposed * First and final dividend 172,401 123,144 Dividend per share 1.75 1.25
* The proposed dividend is subject to approval by shareholders at the forthcoming Annual General Meeting and according to the Sri Lanka Accounting Standard (LKAS 11) - "Events after the reporting period ", the liability has not been provided for in the financial statements.
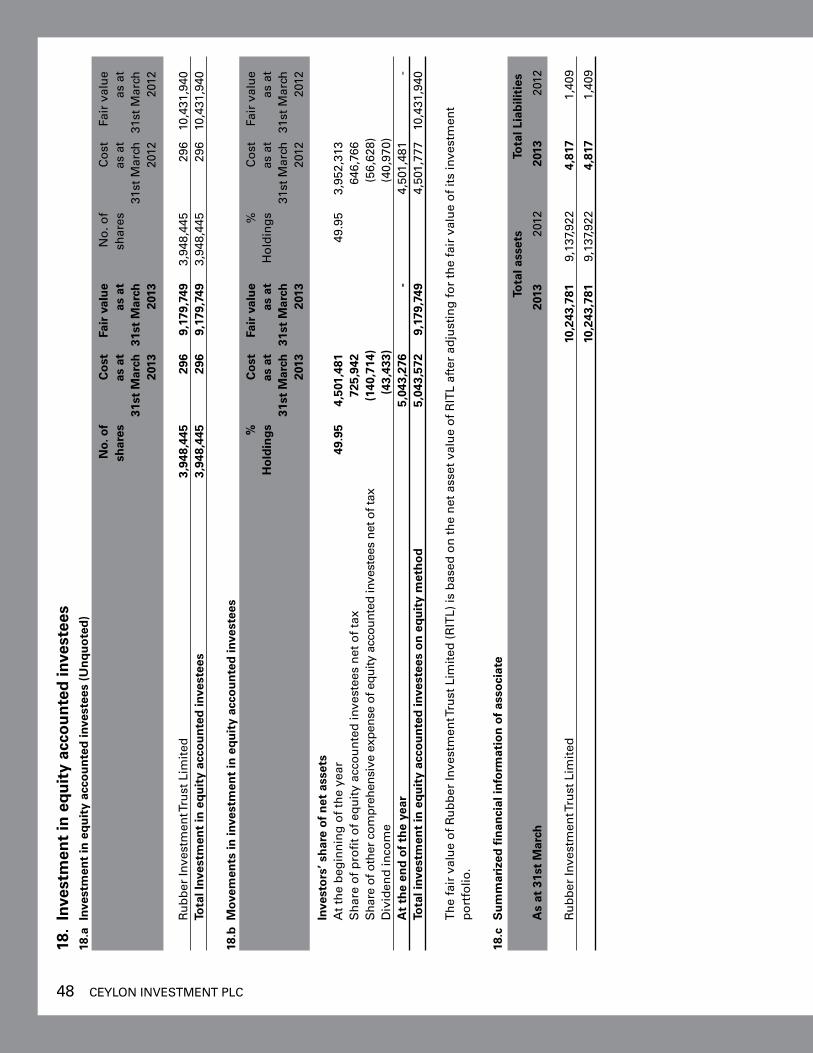
48 CEYLON INvESTMENT PLC
18.
Inve
stm
ent
in e
qu
ity
acco
un
ted
inve
stee
s18
.a I
nves
tmen
t in
eq
uit
y ac
cou
nte
d in
vest
ees
(Un
qu
ote
d)
N
o. o
f
Co
st
Fair
val
ue
No
. of
C
ost
Fa
ir v
alu
e
shar
es
as a
t as
at
sh
ares
as
at
as a
t
31
st M
arch
31
st M
arch
31st
Mar
ch
31st
Mar
ch
20
13
2013
2012
20
12
Ru
bb
er In
vest
men
t Tru
st L
imit
ed
3
,948
,445
29
6 9,
179,
749
3,94
8,44
5 29
6 10
,431
,940
To
tal I
nves
tmen
t in
eq
uit
y ac
cou
nte
d in
vest
ees
3,
948,
445
2
96
9,1
79,7
49
3,9
48,4
45
296
1
0,43
1,94
0
18.b
Mov
emen
ts in
inve
stm
ent
in e
qu
ity
acco
un
ted
inve
stee
s
%
C
ost
Fa
ir v
alu
e %
C
ost
Fa
ir v
alu
e
Ho
ldin
gs
as a
t as
at
H
old
ing
s as
at
as a
t
31
st M
arch
31
st M
arch
31st
Mar
ch
31st
Mar
ch
20
13
2013
2012
20
12
In
vest
ors
’ sh
are
of
net
ass
ets
A
t th
e b
egin
nin
g o
f th
e ye
ar
49
.95
4,5
01,4
81
4
9.95
3
,952
,313
Sh
are
of
pro
fit
of
equ
ity
acco
un
ted
inve
stee
s n
et o
f ta
x
725
,942
6
46,7
66
S
hare
of o
ther
com
preh
ensi
ve e
xpen
se o
f equ
ity a
ccou
nted
inve
stee
s ne
t of t
ax
(
140,
714)
(
56,6
28)
D
ivid
end
inco
me
(43
,433
)
(
40,9
70)
A
t th
e en
d o
f th
e ye
ar
5,0
43,2
76
-
4
,501
,481
-
Tota
l inv
estm
ent
in e
qu
ity
acco
un
ted
inve
stee
s o
n e
qu
ity
met
ho
d
5,04
3,57
2
9,1
79,7
49
4
,501
,777
1
0,43
1,94
0
T
he
fair
val
ue
of
Ru
bb
er In
vest
men
t Tru
st L
imit
ed (
RIT
L) is
bas
ed o
n t
he
net
ass
et v
alu
e o
f R
ITL
afte
r ad
just
ing
fo
r th
e fa
ir v
alu
e o
f it
s in
vest
men
t p
ort
folio
.
18.c
S
um
mar
ized
fin
anci
al in
form
atio
n o
f as
soci
ate
Tota
l ass
ets
Tota
l Lia
bili
ties
A
s at
31s
t M
arch
20
13
2012
20
13
2012
R
ub
ber
Inve
stm
ent T
rust
Lim
ited
10
,243
,781
9
,137
,922
4
,817
1
,409
10,2
43,7
81
9,1
37,9
22
4,8
17
1,4
09
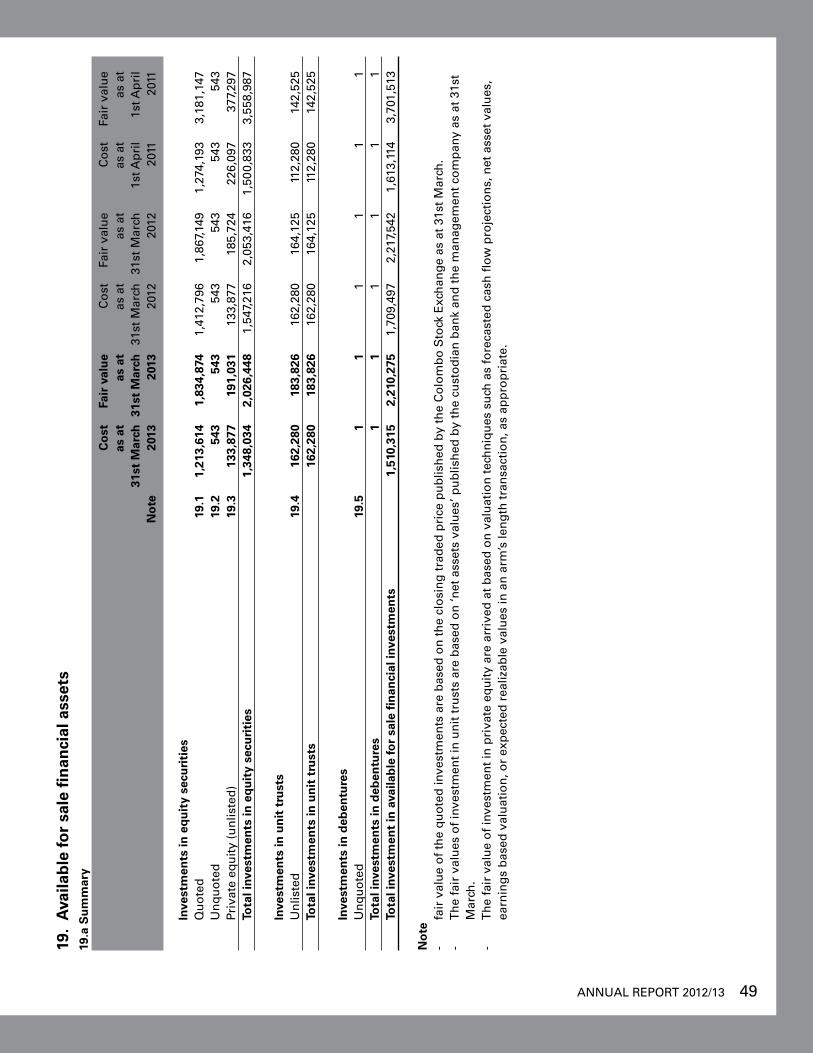
ANNUAL REPORT 2012/13 49
19.
Ava
ilab
le fo
r sa
le fi
nan
cial
ass
ets
19.a
Su
mm
ary
C
ost
Fa
ir v
alu
e C
ost
Fa
ir v
alu
e C
ost
Fa
ir v
alu
e
as a
t as
at
as a
t as
at
as a
t as
at
31
st M
arch
31
st M
arch
31
st M
arch
31
st M
arch
1s
t Ap
ril
1st A
pri
l
N
ote
20
13
2013
20
12
2012
20
11
2011
In
vest
men
ts in
eq
uit
y se
curi
ties
Qu
ote
d
19.1
1
,213
,614
1
,834
,874
1
,412
,796
1
,867
,149
1
,274
,193
3
,181
,147
Un
qu
ote
d
19.2
5
43
543
5
43
543
5
43
543
Priv
ate
equ
ity
(un
liste
d)
19.3
1
33,8
77
191
,031
1
33,8
77
185
,724
2
26,0
97
377
,297
Tota
l inv
estm
ents
in e
qu
ity
secu
riti
es
1
,348
,034
2
,026
,448
1
,547
,216
2
,053
,416
1
,500
,833
3
,558
,987
Inve
stm
ents
in u
nit
tru
sts
U
nlis
ted
19
.4
162
,280
1
83,8
26
162
,280
1
64,1
25
112
,280
1
42,5
25
To
tal i
nves
tmen
ts in
un
it t
rust
s
162
,280
1
83,8
26
162
,280
1
64,1
25
112
,280
1
42,5
25
In
vest
men
ts in
deb
entu
res
U
nq
uo
ted
19
.5
1
1
1
1
1
1
To
tal i
nves
tmen
ts in
deb
entu
res
1
1
1
1
1
1
Tota
l inv
estm
ent
in a
vaila
ble
for
sale
fin
anci
al in
vest
men
ts
1,51
0,31
5
2,2
10,2
75
1,7
09,4
97
2,2
17,5
42
1,6
13,1
14
3,7
01,5
13
N
ote
- fa
ir v
alu
e o
f th
e q
uo
ted
inve
stm
ents
are
bas
ed o
n t
he
clo
sin
g t
rad
ed p
rice
pu
blis
hed
by
the
Co
lom
bo
Sto
ck E
xch
ang
e as
at
31st
Mar
ch.
- T
he
fair
val
ues
of
inve
stm
ent
in u
nit
tru
sts
are
bas
ed o
n ‘n
et a
sset
s va
lues
’ pu
blis
hed
by
the
cust
od
ian
ban
k an
d t
he
man
agem
ent
com
pan
y as
at
31st
M
arch
.-
Th
e fa
ir v
alu
e o
f in
vest
men
t in
pri
vate
eq
uit
y ar
e ar
rive
d a
t b
ased
on
val
uat
ion
tec
hn
iqu
es s
uch
as
fore
cast
ed c
ash
flo
w p
roje
ctio
ns,
net
ass
et v
alu
es,
earn
ing
s b
ased
val
uat
ion
, or
exp
ecte
d r
ealiz
able
val
ues
in a
n a
rm’s
len
gth
tra
nsa
ctio
n, a
s ap
pro
pri
ate.
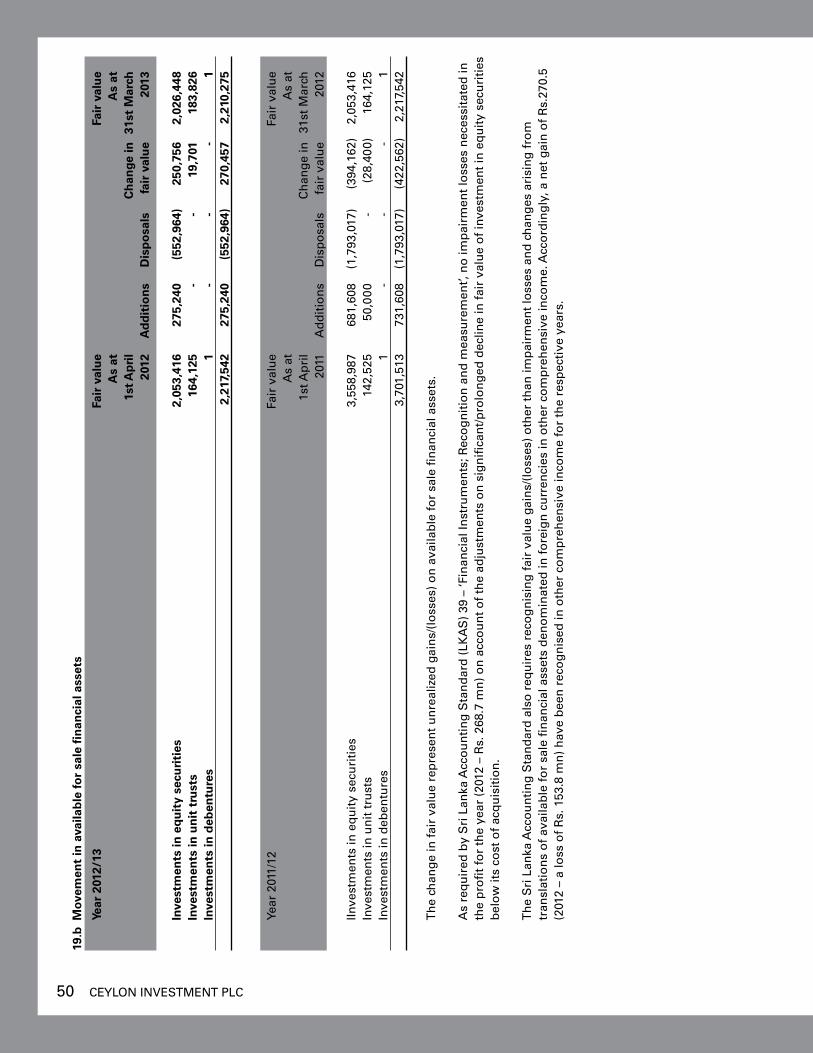
50 CEYLON INvESTMENT PLC
19.b
Mov
emen
t in
ava
ilab
le fo
r sa
le fi
nan
cial
ass
ets
Ye
ar 2
012/
13
Fair
val
ue
Fa
ir v
alu
e
As
at
A
s at
1s
t Ap
ril
Ch
ange
in
31st
Mar
ch
20
12
Ad
dit
ion
s D
isp
osa
ls
fair
val
ue
2013
In
vest
men
ts in
eq
uit
y se
curi
ties
2
,053
,416
2
75,2
40
(55
2,96
4)
250
,756
2
,026
,448
Inve
stm
ents
in u
nit
tru
sts
164
,125
-
-
19
,701
1
83,8
26
In
vest
men
ts in
deb
entu
res
1
-
-
-
1
2,2
17,5
42
275
,240
(
552,
964)
2
70,4
57
2,2
10,2
75
Ye
ar 2
011/
12
Fair
val
ue
Fa
ir v
alu
e
As
at
A
s at
1s
t Ap
ril
Ch
ang
e in
31
st M
arch
2011
A
dd
itio
ns
Dis
po
sals
fa
ir v
alu
e 20
12
IInve
stm
ents
in e
qu
ity
secu
riti
es
3,5
58,9
87
681
,608
(1
,793
,017
) (
394,
162)
2
,053
,416
Inve
stm
ents
in u
nit
tru
sts
142
,525
5
0,00
0
-
(28
,400
) 1
64,1
25
In
vest
men
ts in
deb
entu
res
1
-
-
-
1
3,7
01,5
13
731
,608
(
1,79
3,01
7)
(422
,562
) 2
,217
,542
T
he
chan
ge
in f
air
valu
e re
pre
sen
t u
nre
aliz
ed g
ain
s/(l
oss
es)
on
ava
ilab
le f
or
sale
fin
anci
al a
sset
s.
As
req
uir
ed b
y S
ri L
anka
Acc
ou
nti
ng
Sta
nd
ard
(LK
AS
) 39
– ‘F
inan
cial
Inst
rum
ents
; Rec
og
nit
ion
an
d m
easu
rem
ent’,
no
imp
airm
ent
loss
es n
eces
sita
ted
in
the
pro
fit
for
the
year
(20
12 –
Rs.
268
.7 m
n)
on
acc
ou
nt
of
the
adju
stm
ents
on
sig
nifi
can
t/p
rolo
ng
ed d
eclin
e in
fai
r va
lue
of
inve
stm
ent
in e
qu
ity
secu
riti
es
bel
ow
its
cost
of
acq
uis
itio
n.
T
he
Sri
Lan
ka A
cco
un
tin
g S
tan
dar
d a
lso
req
uir
es r
eco
gn
isin
g f
air
valu
e ga
ins/
(lo
sses
) o
ther
th
an im
pai
rmen
t lo
sses
an
d c
han
ges
ari
sin
g f
rom
tr
ansl
atio
ns
of
avai
lab
le f
or
sale
fin
anci
al a
sset
s d
eno
min
ated
in f
ore
ign
cu
rren
cies
in o
ther
co
mp
reh
ensi
ve in
com
e. A
cco
rdin
gly
, a n
et g
ain
of
Rs.
270.
5 (2
012
– a
loss
of
Rs.
153
.8 m
n)
hav
e b
een
rec
og
nis
ed in
oth
er c
om
pre
hen
sive
inco
me
for
the
resp
ecti
ve y
ears
.

ANNUAL REPORT 2012/13 51
19.
Ava
ilab
le fo
r sa
le fi
nan
cial
ass
ets
(co
nti
nu
ed)
19.1
Inv
estm
ents
in e
qu
ity
secu
riti
es -
qu
ote
d
No.
of
C
ost
Fa
ir v
alu
e N
o. o
f
Co
st
Fair
val
ue
No
. of
C
ost
Fa
ir v
alu
e
S
har
es
as a
t as
at
Sh
ares
as
at
as
at
Sh
ares
as
at
as
at
31
st M
arch
31
st M
arch
31st
Mar
ch
31st
Mar
ch
1s
t Ap
ril
1st A
pri
l
2013
20
13
20
12
2012
2011
20
11
ban
ks, F
inan
ce &
Insu
ran
ce
C
entr
al F
inan
ce C
om
pan
y P
LC
668
,698
1
16,6
79
120
,366
-
-
-
-
-
Co
mm
erci
al B
ank
of
Cey
lon
PLC
6
,682
,396
4
42,5
95
755
,111
5
,572
,342
3
29,5
36
557
,235
2
,180
,071
1
88,3
34
579
,463
Hat
ton
Nat
ion
al B
ank
PLC
-
-
-
-
-
-
1
,500
,000
2
45,2
17
570
,000
Sam
pat
h B
ank
PLC
7
07,0
23
210
,325
1
59,0
09
837
,023
2
48,9
97
150
,497
7
99,6
00
240
,882
2
30,5
25
Pe
op
le's
Lea
sin
g a
nd
Fin
ance
PLC
6
,954
,891
1
25,1
88
91,
109
9
,820
,700
1
76,7
73
113
,920
-
-
-
894
,787
1
,125
,595
755
,306
8
21,6
52
6
74,4
33
1,3
79,9
88
b
ever
age,
Fo
od
& To
bac
co
N
estl
e La
nka
PLC
-
-
-
1
44,6
00
81,
574
1
31,7
02
84,
600
2
8,70
0
54,
212
-
-
81,
574
1
31,7
02
2
8,70
0
54,
212
D
iver
sifi
ed
A
itke
n S
pen
ce P
LC
-
-
-
-
-
-
3,3
25,5
00
81,
510
5
39,7
29
Jo
hn
Kee
lls H
old
ing
s P
LC
1,6
10,6
41
68,
500
3
97,8
28
2,5
85,6
41
109
,965
5
32,6
40
1,9
57,9
81
111
,030
5
59,1
99
6
8,50
0
397
,828
109
,965
53
2,64
0
1
92,5
40
1,0
98,9
28
H
ealt
h C
are
C
eylo
n H
osp
ital
s P
LC
81
;3,3
78
45,
742
8
1,33
8
756
,915
3
9,94
2
54,
876
7
56,9
15
39,
942
7
5,69
2
Asi
ri S
urg
ical
Ho
spit
al P
LC
7,4
65,2
90
75,
951
8
5,10
4
4,6
27,1
00
45,
212
3
5,16
6
-
-
-
1
21,6
93
166
,442
85,
154
9
0,04
2
3
9,94
2
75,
692
M
anu
fact
uri
ng
Toky
o C
emen
t Com
pany
(Lan
ka) P
LC
(N
on v
otin
g)
-
-
-
6,0
66,5
00
261
,127
1
63,7
97
4,4
49,6
00
181
,332
1
95,7
82
-
-
261
,127
1
63,7
97
1
81,3
32
195
,782
Ho
tels
& Tr
avel
s
Ait
ken
Sp
ence
Ho
tel H
old
ing
s P
LC
1,9
59,5
75
128
,634
1
45,0
09
1,8
18,8
00
119
,670
1
27,3
16
3,8
42,3
00
157
,246
3
76,5
45
1
28,6
34
145
,009
119
,670
1
27,3
16
1
57,2
46
376
,545
Tota
l inv
estm
ents
in e
qu
ity
secu
riti
es -
qu
ote
d
1
,213
,614
1
,834
,874
1,4
12,7
96
1,8
67,1
49
1
,274
,193
3
,181
,147
Th
e m
arke
t va
lues
of
the
Co
mp
any’
s in
vest
men
t p
ort
folio
hav
e b
een
ob
tain
ed f
rom
th
e cl
osi
ng
tra
ded
pri
ces
as a
t 31
st M
arch
, pu
blis
hed
by
the
Co
lom
bo
S
tock
Exc
han
ge.
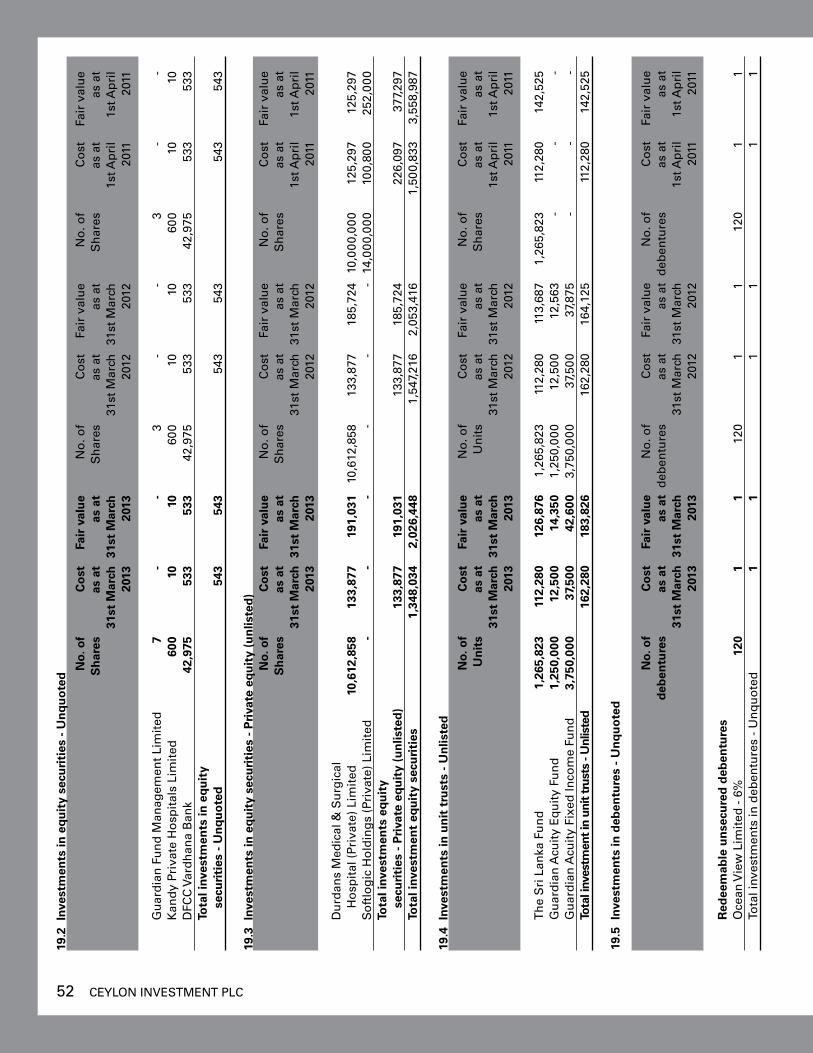
52 CEYLON INvESTMENT PLC
19.2
Inv
estm
ents
in e
qu
ity
secu
riti
es -
Un
qu
ote
d
No.
of
C
ost
Fa
ir v
alu
e N
o. o
f
Co
st
Fair
val
ue
No
. of
C
ost
Fa
ir v
alu
e
S
har
es
as a
t as
at
Sh
ares
as
at
as
at
Sh
ares
as
at
as
at
31
st M
arch
31
st M
arch
31st
Mar
ch
31st
Mar
ch
1s
t Ap
ril
1st A
pri
l
2013
20
13
20
12
2012
2011
20
11
Gu
ard
ian
Fu
nd
Man
agem
ent
Lim
ited
7
-
-
3
-
-
3
-
-
Kan
dy
Priv
ate
Ho
spit
als
Lim
ited
6
00
10
1
0
600
1
0
10
6
00
10
10
DFC
C v
ard
han
a B
ank
42,
975
5
33
533
4
2,97
5
533
5
33
42,
975
53
3 53
3
Tota
l inv
estm
ents
in e
qu
ity
secu
riti
es -
Un
qu
ote
d
5
43
543
543
5
43
5
43
543
19.3
Inv
estm
ents
in e
qu
ity
secu
riti
es -
Pri
vate
eq
uit
y (u
nlis
ted
)
N
o. o
f
Co
st
Fair
val
ue
No
. of
C
ost
Fa
ir v
alu
e N
o. o
f
Co
st
Fair
val
ue
Sh
ares
as
at
as a
t S
har
es
as a
t
as a
t S
har
es
as a
t
as a
t
31st
Mar
ch
31st
Mar
ch
31
st M
arch
31
st M
arch
1st A
pri
l 1s
t Ap
ril
20
13
2013
2012
20
12
20
11
2011
D
urd
ans
Med
ical
& S
urg
ical
H
osp
ital
(Pr
ivat
e) L
imit
ed
10,
612,
858
1
33,8
77
191
,031
1
0,61
2,85
8
133
,877
1
85,7
24
10,0
00,0
00
125
,297
1
25,2
97
S
oft
log
ic H
old
ing
s (P
riva
te)
Lim
ited
-
-
-
- -
-
14
,000
,000
1
00,8
00
252
,000
Tota
l inv
estm
ents
eq
uit
y
se
curi
ties
- P
riva
te e
qu
ity
(un
liste
d)
13
3,87
7
191
,031
133
,877
1
85,7
24
2
26,0
97
377
,297
Tota
l inv
estm
ent
equ
ity
secu
riti
es
1
,348
,034
2
,026
,448
1,5
47,2
16
2,0
53,4
16
1
,500
,833
3
,558
,987
19.4
Inv
estm
ents
in u
nit
tru
sts
- U
nlis
ted
No.
of
C
ost
Fa
ir v
alu
e N
o. o
f
Co
st
Fair
val
ue
No
. of
C
ost
Fa
ir v
alu
e
U
nit
s as
at
as a
t U
nit
s as
at
as
at
Sh
ares
as
at
as
at
31
st M
arch
31
st M
arch
31st
Mar
ch
31st
Mar
ch
1s
t Ap
ril
1st A
pri
l
2013
20
13
20
12
2012
2011
20
11
T
he
Sri
Lan
ka F
un
d
1,2
65,8
23
112
,280
1
26,8
76
1,2
65,8
23
112
,280
1
13,6
87
1,2
65,8
23
112
,280
1
42,5
25
G
uar
dia
n A
cuit
y E
qu
ity
Fun
d
1,2
50,0
00
12,
500
1
4,35
0
1,2
50,0
00
12,
500
1
2,56
3
-
-
-
G
uar
dia
n A
cuit
y Fi
xed
Inco
me
Fun
d
3,7
50,0
00
37,
500
4
2,60
0
3,7
50,0
00
37,
500
3
7,87
5
-
-
-
To
tal i
nves
tmen
t in
unit
trus
ts -
Unl
iste
d
1
62,2
80
183
,826
162
,280
1
64,1
25
1
12,2
80
142
,525
19.5
Inv
estm
ents
in d
eben
ture
s -
Un
qu
ote
d
No.
of
C
ost
Fa
ir v
alu
e N
o. o
f
Co
st
Fair
val
ue
No
. of
C
ost
Fa
ir v
alu
e
d
eben
ture
s as
at
as a
t d
eben
ture
s as
at
as
at
deb
entu
res
as a
t
as a
t
31st
Mar
ch
31st
Mar
ch
31
st M
arch
31
st M
arch
1st A
pri
l 1s
t Ap
ril
20
13
2013
2012
20
12
20
11
2011
R
edee
mab
le u
nse
cure
d d
eben
ture
s
Oce
an v
iew
Lim
ited
- 6
%
120
1
1
1
20
1
1
120
1
1
Tota
l inv
estm
ents
in d
eben
ture
s -
Un
qu
ote
d
1
1
1
1
1
1
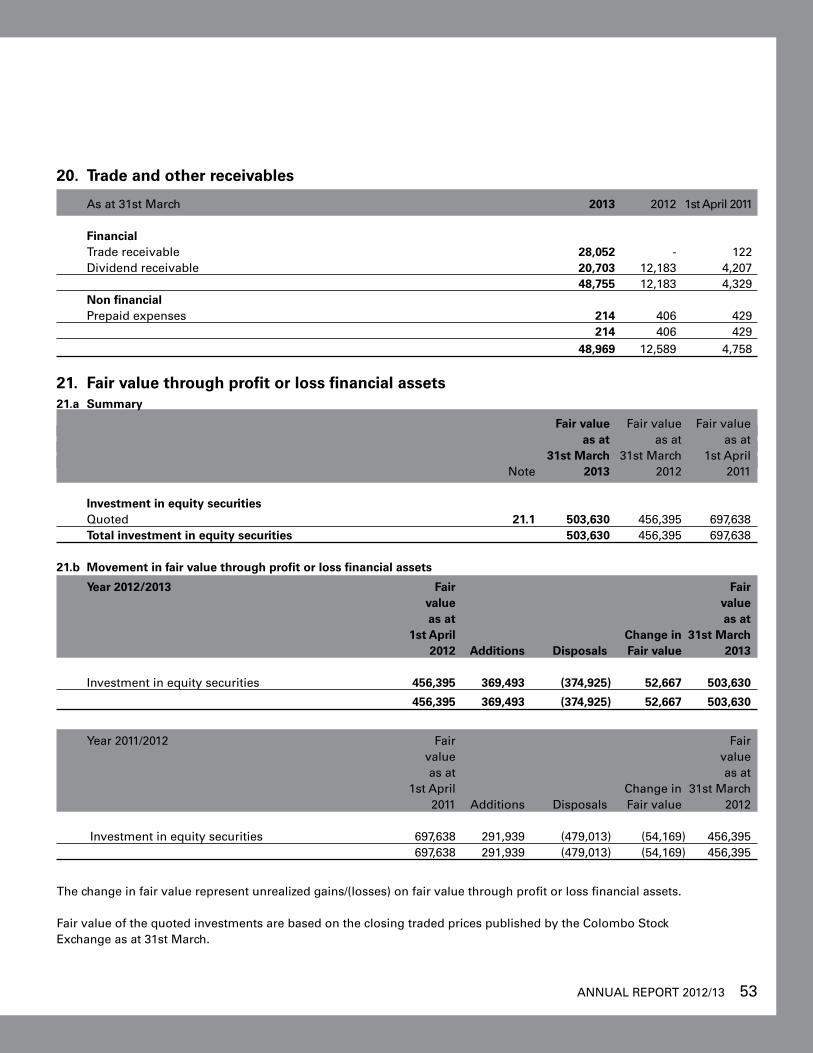
ANNUAL REPORT 2012/13 53
20. Trade and other receivables
As at 31st March 2013 2012 1st April 2011
Financial Trade receivable 28,052 - 122
Dividend receivable 20,703 12,183 4,207 48,755 12,183 4,329 Non financial
Prepaid expenses 214 406 429 214 406 429 48,969 12,589 4,758
21. Fair value through profit or loss financial assets21.a Summary
Fair value Fair value Fair value as at as at as at 31st March 31st March 1st April Note 2013 2012 2011
Investment in equity securities Quoted 21.1 503,630 456,395 697,638
Total investment in equity securities 503,630 456,395 697,638 21.b Movement in fair value through profit or loss financial assets
Year 2012/2013 Fair Fair value value as at as at 1st April Change in 31st March
2012 Additions Disposals Fair value 2013
Investment in equity securities 456,395 369,493 (374,925) 52,667 503,630
456,395 369,493 (374,925) 52,667 503,630
Year 2011/2012 Fair Fair value value as at as at 1st April Change in 31st March
2011 Additions Disposals Fair value 2012
Investment in equity securities 697,638 291,939 (479,013) (54,169) 456,395 697,638 291,939 (479,013) (54,169) 456,395
The change in fair value represent unrealized gains/(losses) on fair value through profit or loss financial assets.
Fair value of the quoted investments are based on the closing traded prices published by the Colombo Stock Exchange as at 31st March.
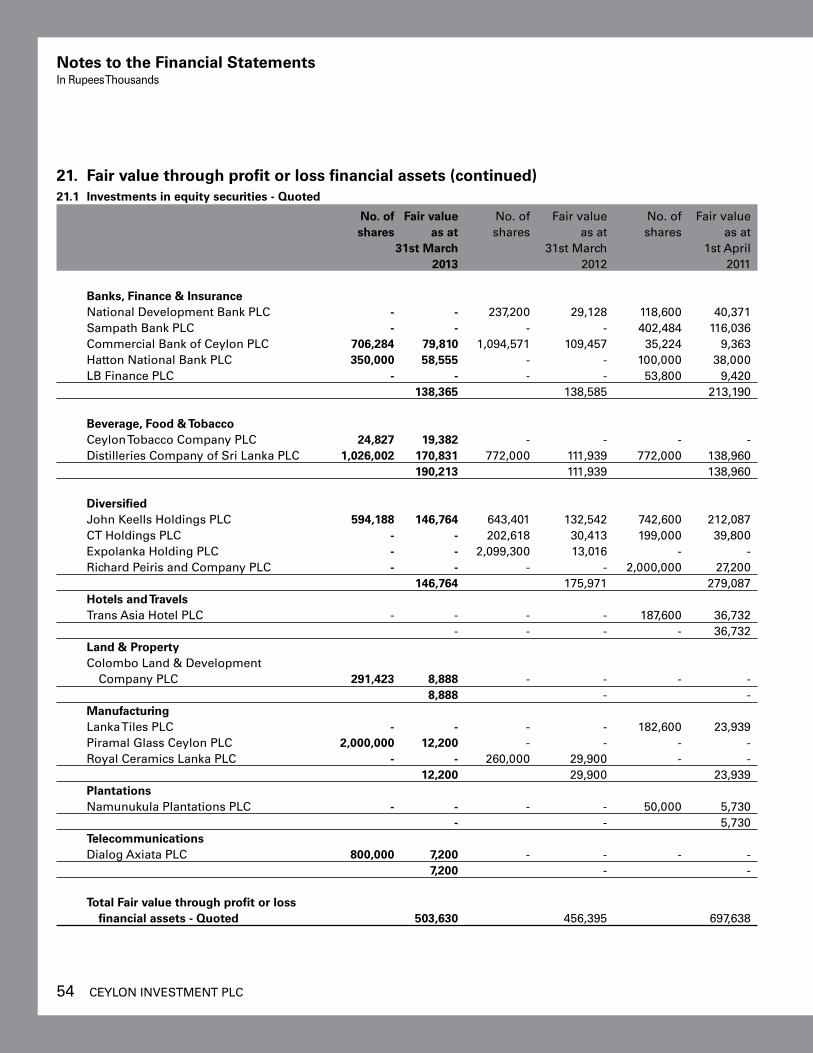
54 CEYLON INvESTMENT PLC
21. Fair value through profit or loss financial assets (continued)21.1 Investments in equity securities - quoted
No. of Fair value No. of Fair value No. of Fair value shares as at shares as at shares as at 31st March 31st March 1st April 2013 2012 2011
banks, Finance & Insurance National Development Bank PLC - - 237,200 29,128 118,600 40,371
Sampath Bank PLC - - - - 402,484 116,036 Commercial Bank of Ceylon PLC 706,284 79,810 1,094,571 109,457 35,224 9,363 Hatton National Bank PLC 350,000 58,555 - - 100,000 38,000 LB Finance PLC - - - - 53,800 9,420 138,365 138,585 213,190 beverage, Food & Tobacco
Ceylon Tobacco Company PLC 24,827 19,382 - - - - Distilleries Company of Sri Lanka PLC 1,026,002 170,831 772,000 111,939 772,000 138,960 190,213 111,939 138,960 Diversified
John Keells Holdings PLC 594,188 146,764 643,401 132,542 742,600 212,087 CT Holdings PLC - - 202,618 30,413 199,000 39,800 Expolanka Holding PLC - - 2,099,300 13,016 - - Richard Peiris and Company PLC - - - - 2,000,000 27,200 146,764 175,971 279,087 Hotels and Travels
Trans Asia Hotel PLC - - - - 187,600 36,732 - - - - 36,732 Land & Property
Colombo Land & Development Company PLC 291,423 8,888 - - - - 8,888 - - Manufacturing
Lanka Tiles PLC - - - - 182,600 23,939 Piramal Glass Ceylon PLC 2,000,000 12,200 - - - - Royal Ceramics Lanka PLC - - 260,000 29,900 - - 12,200 29,900 23,939 Plantations
Namunukula Plantations PLC - - - - 50,000 5,730 - - 5,730 Telecommunications Dialog Axiata PLC 800,000 7,200 - - - - 7,200 - - Total Fair value through profit or loss financial assets - quoted 503,630 456,395 697,638
Notes to the Financial StatementsIn Rupees Thousands
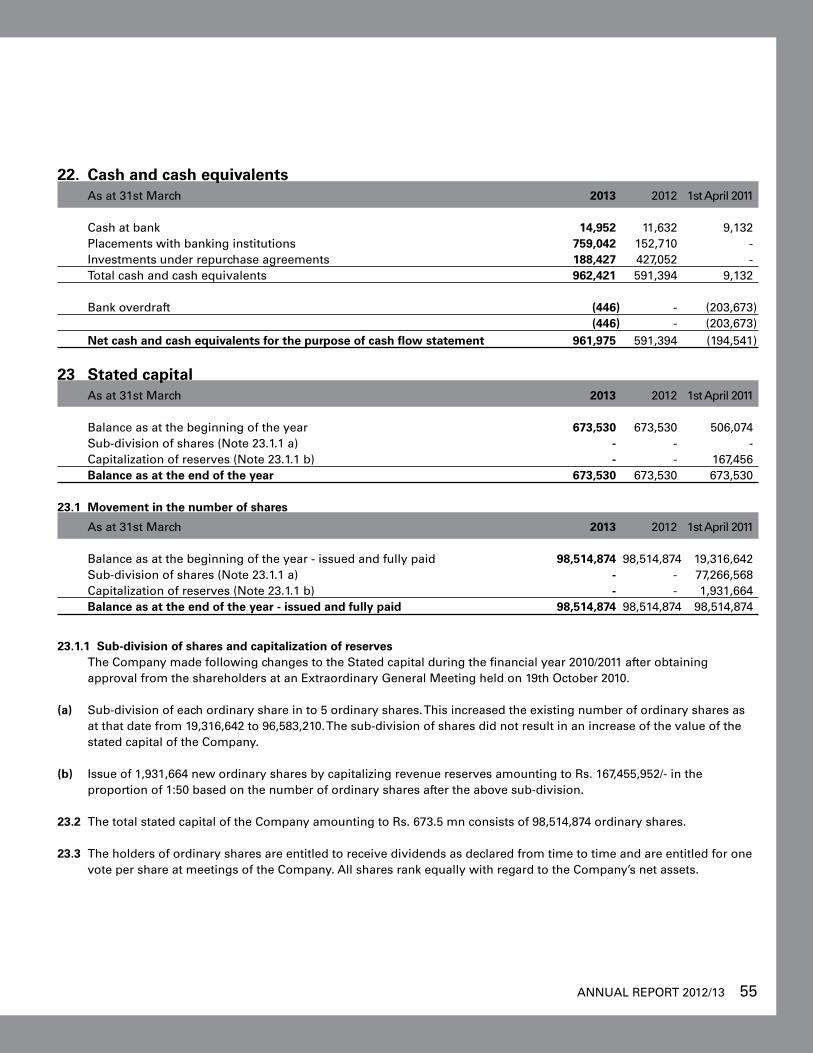
ANNUAL REPORT 2012/13 55
22. Cash and cash equivalents As at 31st March 2013 2012 1st April 2011
Cash at bank 14,952 11,632 9,132 Placements with banking institutions 759,042 152,710 - Investments under repurchase agreements 188,427 427,052 - Total cash and cash equivalents 962,421 591,394 9,132 Bank overdraft (446) - (203,673) (446) - (203,673) Net cash and cash equivalents for the purpose of cash flow statement 961,975 591,394 (194,541)
23 Stated capital As at 31st March 2013 2012 1st April 2011
Balance as at the beginning of the year 673,530 673,530 506,074 Sub-division of shares (Note 23.1.1 a) - - - Capitalization of reserves (Note 23.1.1 b) - - 167,456 balance as at the end of the year 673,530 673,530 673,530
23.1 Movement in the number of shares
As at 31st March 2013 2012 1st April 2011
Balance as at the beginning of the year - issued and fully paid 98,514,874 98,514,874 19,316,642 Sub-division of shares (Note 23.1.1 a) - - 77,266,568 Capitalization of reserves (Note 23.1.1 b) - - 1,931,664 balance as at the end of the year - issued and fully paid 98,514,874 98,514,874 98,514,874
23.1.1 Sub-division of shares and capitalization of reserves The Company made following changes to the Stated capital during the financial year 2010/2011 after obtaining approval from the shareholders at an Extraordinary General Meeting held on 19th October 2010.
(a) Sub-division of each ordinary share in to 5 ordinary shares. This increased the existing number of ordinary shares as at that date from 19,316,642 to 96,583,210. The sub-division of shares did not result in an increase of the value of the stated capital of the Company.
(b) Issue of 1,931,664 new ordinary shares by capitalizing revenue reserves amounting to Rs. 167,455,952/- in the proportion of 1:50 based on the number of ordinary shares after the above sub-division.
23.2 The total stated capital of the Company amounting to Rs. 673.5 mn consists of 98,514,874 ordinary shares.
23.3 The holders of ordinary shares are entitled to receive dividends as declared from time to time and are entitled for one vote per share at meetings of the Company. All shares rank equally with regard to the Company’s net assets.
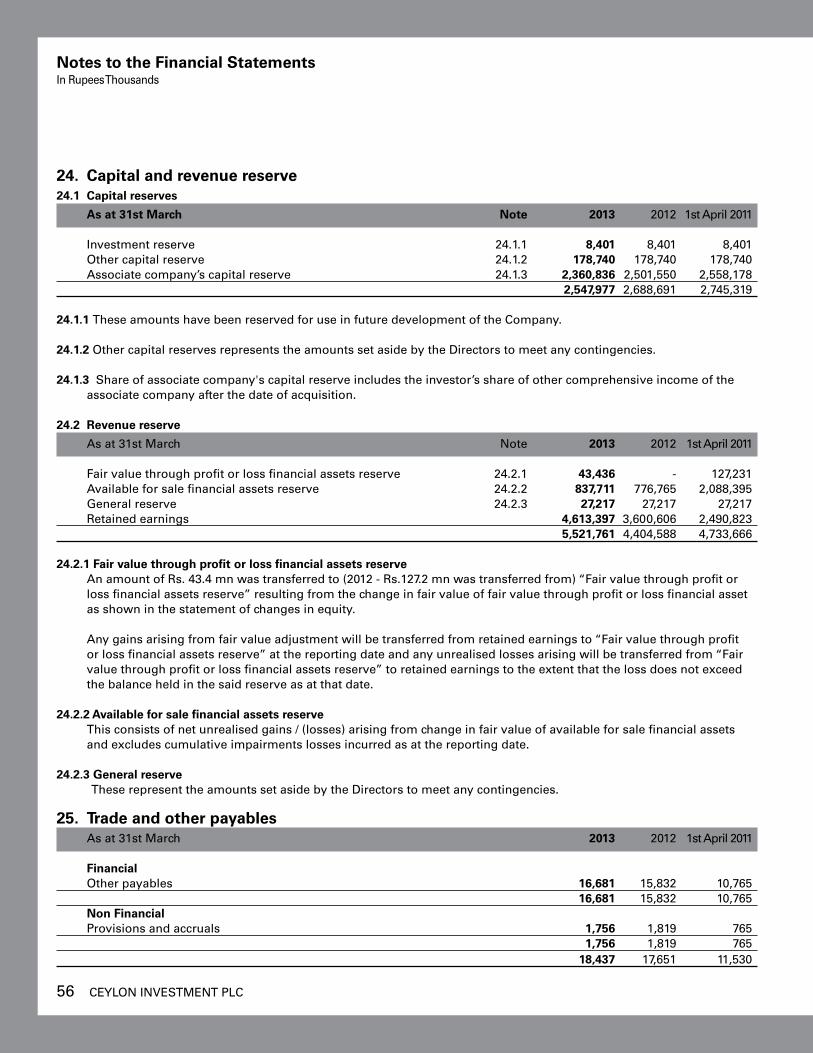
56 CEYLON INvESTMENT PLC
24. Capital and revenue reserve24.1 Capital reserves
As at 31st March Note 2013 2012 1st April 2011 Investment reserve 24.1.1 8,401 8,401 8,401 Other capital reserve 24.1.2 178,740 178,740 178,740 Associate company’s capital reserve 24.1.3 2,360,836 2,501,550 2,558,178 2,547,977 2,688,691 2,745,319
24.1.1 These amounts have been reserved for use in future development of the Company.
24.1.2 Other capital reserves represents the amounts set aside by the Directors to meet any contingencies.
24.1.3 Share of associate company's capital reserve includes the investor’s share of other comprehensive income of the associate company after the date of acquisition.
24.2 Revenue reserve
As at 31st March Note 2013 2012 1st April 2011 Fair value through profit or loss financial assets reserve 24.2.1 43,436 - 127,231 Available for sale financial assets reserve 24.2.2 837,711 776,765 2,088,395 General reserve 24.2.3 27,217 27,217 27,217 Retained earnings 4,613,397 3,600,606 2,490,823 5,521,761 4,404,588 4,733,666 24.2.1 Fair value through profit or loss financial assets reserve An amount of Rs. 43.4 mn was transferred to (2012 - Rs.127.2 mn was transferred from) “Fair value through profit or
loss financial assets reserve” resulting from the change in fair value of fair value through profit or loss financial asset as shown in the statement of changes in equity.
Any gains arising from fair value adjustment will be transferred from retained earnings to “Fair value through profit or loss financial assets reserve” at the reporting date and any unrealised losses arising will be transferred from “Fair value through profit or loss financial assets reserve” to retained earnings to the extent that the loss does not exceed the balance held in the said reserve as at that date.
24.2.2 Available for sale financial assets reserve This consists of net unrealised gains / (losses) arising from change in fair value of available for sale financial assets
and excludes cumulative impairments losses incurred as at the reporting date.
24.2.3 General reserve These represent the amounts set aside by the Directors to meet any contingencies.
25. Trade and other payables As at 31st March 2013 2012 1st April 2011
Financial Other payables 16,681 15,832 10,765 16,681 15,832 10,765 Non Financial Provisions and accruals 1,756 1,819 765 1,756 1,819 765 18,437 17,651 11,530
Notes to the Financial StatementsIn Rupees Thousands
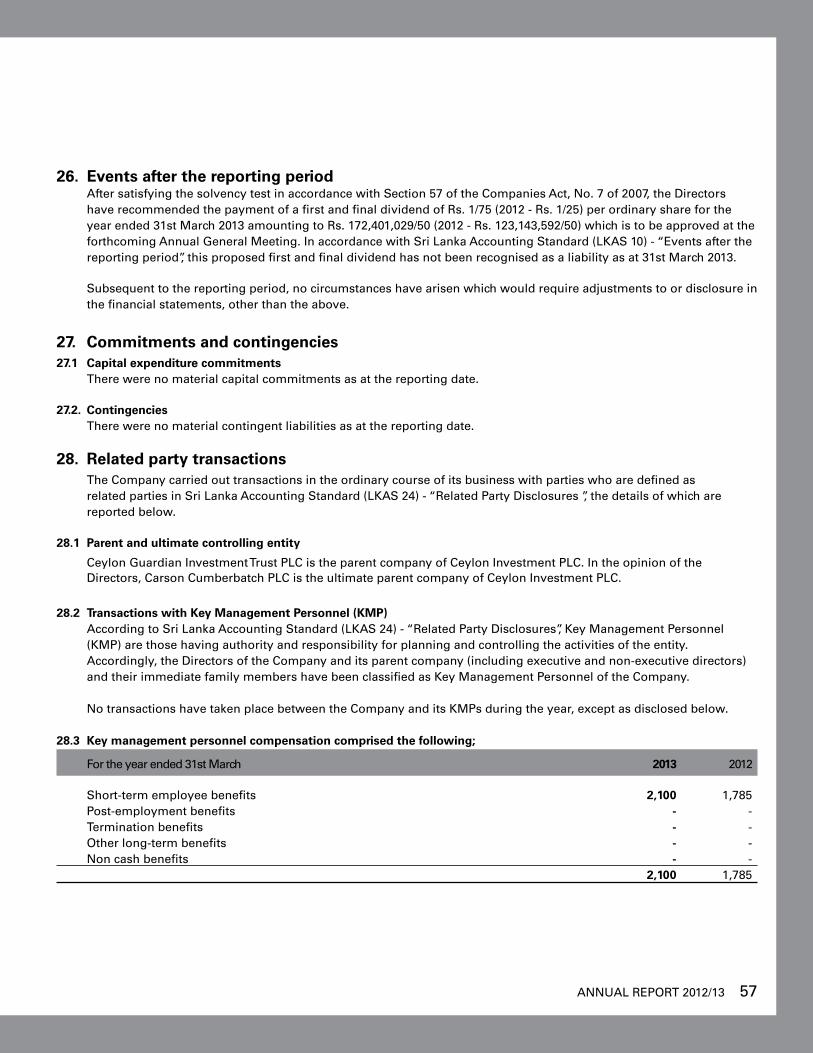
ANNUAL REPORT 2012/13 57
26. Events after the reporting period After satisfying the solvency test in accordance with Section 57 of the Companies Act, No. 7 of 2007, the Directors have recommended the payment of a first and final dividend of Rs. 1/75 (2012 - Rs. 1/25) per ordinary share for the year ended 31st March 2013 amounting to Rs. 172,401,029/50 (2012 - Rs. 123,143,592/50) which is to be approved at the forthcoming Annual General Meeting. In accordance with Sri Lanka Accounting Standard (LKAS 10) - “Events after the reporting period”, this proposed first and final dividend has not been recognised as a liability as at 31st March 2013.
Subsequent to the reporting period, no circumstances have arisen which would require adjustments to or disclosure in the financial statements, other than the above.
27. Commitments and contingencies 27.1 Capital expenditure commitments
There were no material capital commitments as at the reporting date.
27.2. Contingencies There were no material contingent liabilities as at the reporting date.
28. Related party transactions The Company carried out transactions in the ordinary course of its business with parties who are defined as related parties in Sri Lanka Accounting Standard (LKAS 24) - “Related Party Disclosures ”, the details of which are reported below.
28.1 Parent and ultimate controlling entity
Ceylon Guardian Investment Trust PLC is the parent company of Ceylon Investment PLC. In the opinion of the Directors, Carson Cumberbatch PLC is the ultimate parent company of Ceylon Investment PLC.
28.2 Transactions with key Management Personnel (kMP) According to Sri Lanka Accounting Standard (LKAS 24) - “Related Party Disclosures”, Key Management Personnel
(KMP) are those having authority and responsibility for planning and controlling the activities of the entity. Accordingly, the Directors of the Company and its parent company (including executive and non-executive directors) and their immediate family members have been classified as Key Management Personnel of the Company.
No transactions have taken place between the Company and its KMPs during the year, except as disclosed below.
28.3 key management personnel compensation comprised the following;
For the year ended 31st March 2013 2012
Short-term employee benefits 2,100 1,785 Post-employment benefits - - Termination benefits - - Other long-term benefits - - Non cash benefits - - 2,100 1,785
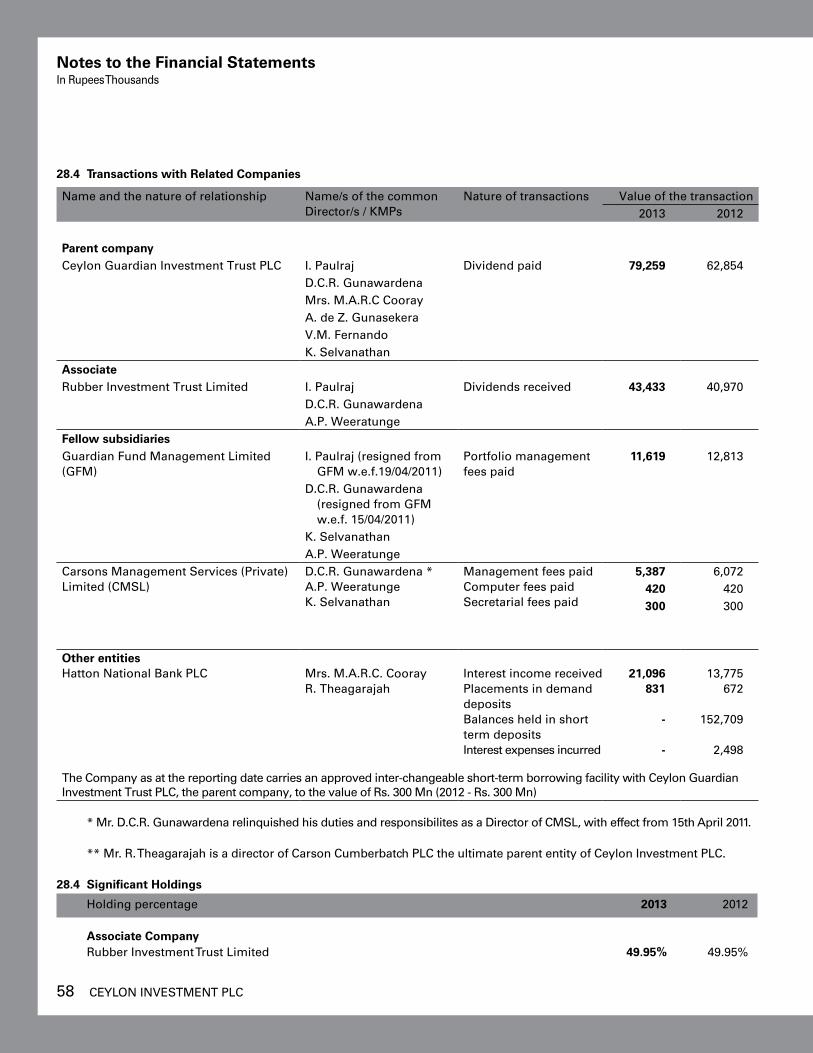
58 CEYLON INvESTMENT PLC
28.4 Transactions with Related Companies
Name and the nature of relationship Name/s of the common Director/s / KMPs
Nature of transactions value of the transaction2013 2012
Parent companyCeylon Guardian Investment Trust PLC I. Paulraj Dividend paid 79,259 62,854
D.C.R. GunawardenaMrs. M.A.R.C CoorayA. de Z. Gunasekerav.M. FernandoK. Selvanathan
AssociateRubber Investment Trust Limited I. Paulraj Dividends received 43,433 40,970
D.C.R. GunawardenaA.P. Weeratunge
Fellow subsidiariesGuardian Fund Management Limited (GFM)
I. Paulraj (resigned from GFM w.e.f.19/04/2011)
Portfolio management fees paid
11,619 12,813
D.C.R. Gunawardena (resigned from GFM w.e.f. 15/04/2011) K. Selvanathan A.P. Weeratunge
Carsons Management Services (Private) Limited (CMSL)
D.C.R. Gunawardena *A.P. WeeratungeK. Selvanathan
Management fees paidComputer fees paidSecretarial fees paid
5,387 6,072 420 420 300 300
Other entities Hatton National Bank PLC
Mrs. M.A.R.C. CoorayR. Theagarajah
Interest income receivedPlacements in demand depositsBalances held in short term depositsInterest expenses incurred
21,096
831
-
-
13,775
672
152,709
2,498
The Company as at the reporting date carries an approved inter-changeable short-term borrowing facility with Ceylon Guardian Investment Trust PLC, the parent company, to the value of Rs. 300 Mn (2012 - Rs. 300 Mn)
* Mr. D.C.R. Gunawardena relinquished his duties and responsibilites as a Director of CMSL, with effect from 15th April 2011.
** Mr. R. Theagarajah is a director of Carson Cumberbatch PLC the ultimate parent entity of Ceylon Investment PLC.
28.4 Significant Holdings
Holding percentage 2013 2012 Associate Company Rubber Investment Trust Limited 49.95% 49.95%
Notes to the Financial StatementsIn Rupees Thousands
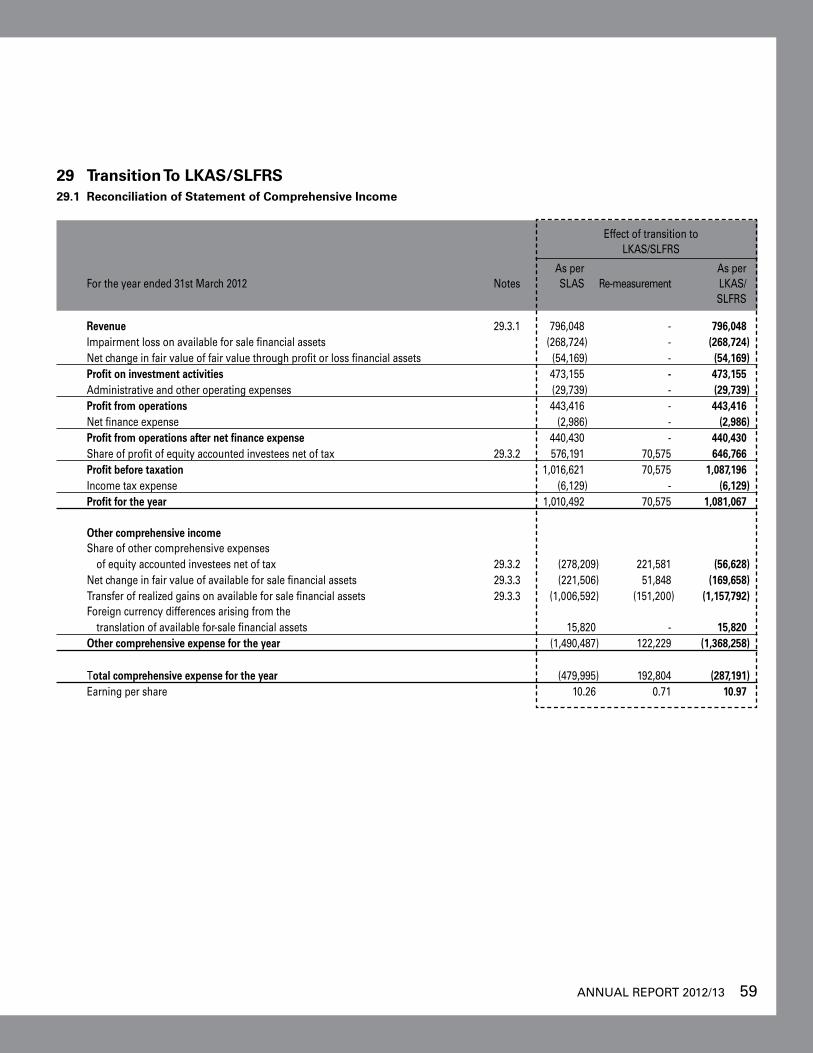
ANNUAL REPORT 2012/13 59
29 Transition To LkAS/SLFRS29.1 Reconciliation of Statement of Comprehensive Income
Effect of transition to LKAS/SLFRS
As per As per For the year ended 31st March 2012 Notes SLAS Re-measurement LKAS/
SLFRS
Revenue 29.3.1 796,048 - 796,048 Impairment loss on available for sale financial assets (268,724) - (268,724) Net change in fair value of fair value through profit or loss financial assets (54,169) - (54,169) Profit on investment activities 473,155 - 473,155 Administrative and other operating expenses (29,739) - (29,739) Profit from operations 443,416 - 443,416 Net finance expense (2,986) - (2,986) Profit from operations after net finance expense 440,430 - 440,430 Share of profit of equity accounted investees net of tax 29.3.2 576,191 70,575 646,766 Profit before taxation 1,016,621 70,575 1,087,196 Income tax expense (6,129) - (6,129) Profit for the year 1,010,492 70,575 1,081,067 Other comprehensive income Share of other comprehensive expenses of equity accounted investees net of tax 29.3.2 (278,209) 221,581 (56,628) Net change in fair value of available for sale financial assets 29.3.3 (221,506) 51,848 (169,658) Transfer of realized gains on available for sale financial assets 29.3.3 (1,006,592) (151,200) (1,157,792) Foreign currency differences arising from the translation of available for-sale financial assets 15,820 - 15,820 Other comprehensive expense for the year (1,490,487) 122,229 (1,368,258)
Total comprehensive expense for the year (479,995) 192,804 (287,191) Earning per share 10.26 0.71 10.97
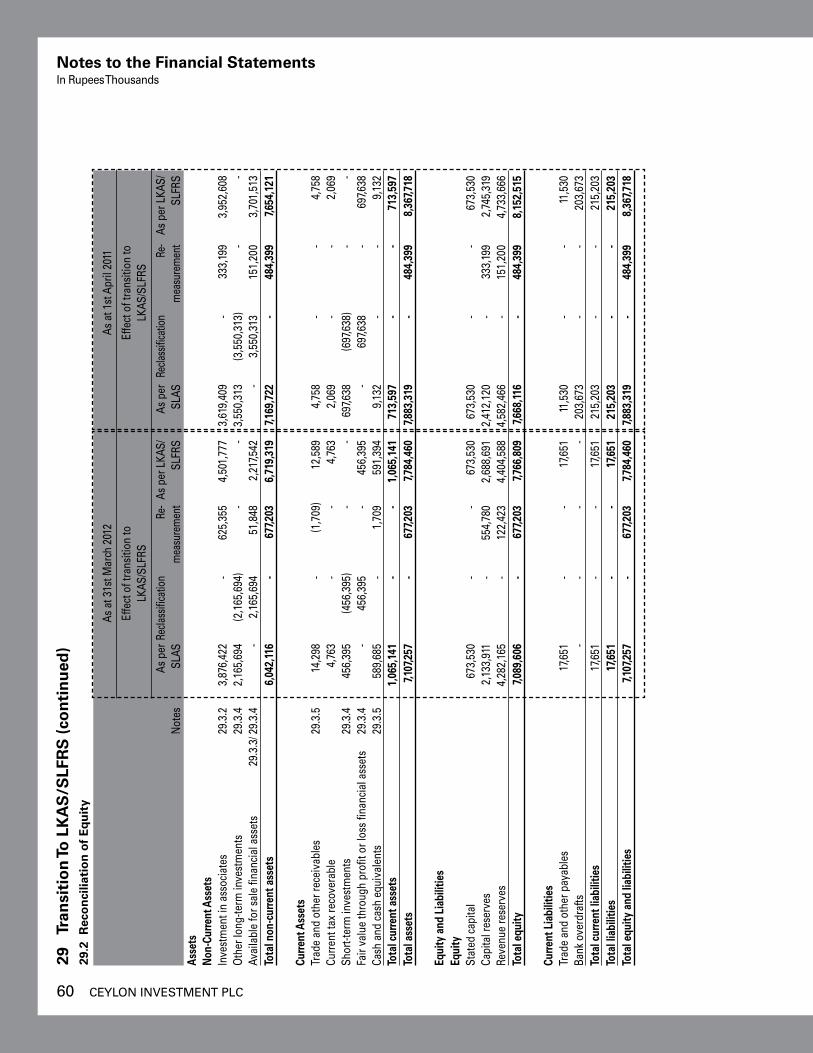
60 CEYLON INvESTMENT PLC
29
Tran
siti
on
To L
kA
S/S
LFR
S (
con
tin
ued
)29
.2 R
eco
nci
liati
on
of
Eq
uit
y
As
at 3
1st M
arch
201
2 As
at 1
st A
pril
2011
Ef
fect
of t
rans
ition
to
Effe
ct o
f tra
nsiti
on to
LKAS
/SLF
RS
LKAS
/SLF
RS
As p
er R
ecla
ssifi
catio
n Re
- As
per
LKA
S/
As p
er R
eclas
sifica
tion
Re-
As p
er L
KAS/
N
otes
SL
AS
m
easu
rem
ent
SLFR
S SL
AS
m
easu
rem
ent
SLFR
SAs
sets
Non
-Cur
rent
Ass
ets
In
vest
men
t in
asso
ciat
es
29.3
.2
3,87
6,42
2
-
625
,355
4
,501
,777
3
,619
,409
-
3
33,1
99
3,9
52,6
08
Oth
er lo
ng-te
rm in
vest
men
ts
29.3
.4
2,1
65,6
94
(2,1
65,6
94)
-
-
3,55
0,31
3
(3,5
50,3
13)
-
-
Avai
labl
e fo
r sal
e fin
anci
al a
sset
s 2
9.3.
3/ 2
9.3.
4 -
2
,165
,694
5
1,84
8
2,2
17,5
42
-
3,55
0,31
3
151
,200
3,
701,
513
Tota
l non
-cur
rent
ass
ets
6,0
42,11
6
-
677
,203
6
,719
,319
7,
169,
722
-
4
84,3
99
7,65
4,12
1
Cu
rrent
Ass
ets
Trad
e an
d ot
her r
ecei
vabl
es
29.3
.5
14,
298
-
(1
,709
) 1
2,58
9
4,7
58
-
-
4,7
58
Curr
ent t
ax re
cove
rabl
e
4,7
63
-
-
4,7
63
2,0
69
-
-
2,0
69
Shor
t-ter
m in
vest
men
ts
29.3
.4
456
,395
(4
56,3
95)
-
-
697,6
38
(697
,638
) -
-
Fair
valu
e th
roug
h pr
ofit o
r los
s fin
anci
al a
sset
s 29
.3.4
-
4
56,3
95
-
456
,395
-
6
97,6
38
-
697
,638
Ca
sh a
nd c
ash
equi
vale
nts
29.3
.5
589
,685
-
1
,709
5
91,3
94
9,1
32
-
-
9,1
32
Tota
l cur
rent
ass
ets
1,0
65,1
41
-
-
1,0
65,1
41
713
,597
-
-
7
13,5
97
Tota
l ass
ets
7,
107,2
57
-
677
,203
7,
784,
460
7,
883,
319
-
4
84,3
99
8,3
67,7
18
Equi
ty a
nd L
iabi
litie
s
Equi
ty
Stat
ed c
apita
l
673
,530
-
-
6
73,5
30
673
,530
-
-
6
73,5
30
Capi
tal r
eser
ves
2
,133
,911
-
5
54,7
80
2,6
88,6
91
2,4
12,1
20
-
333
,199
2
,745
,319
Re
venu
e re
serv
es
4
,282
,165
-
1
22,4
23
4,4
04,5
88
4,5
82,4
66
-
151
,200
4
,733
,666
To
tal e
quity
7,08
9,60
6
-
677
,203
7,
766,
809
7,
668,
116
-
4
84,3
99
8,1
52,5
15
Curre
nt L
iabi
litie
s
Trad
e an
d ot
her p
ayab
les
1
7,651
-
-
1
7,651
11
,530
-
-
11
,530
Ba
nk o
verd
rafts
-
-
-
-
203
,673
-
-
2
03,6
73
Tota
l cur
rent
liab
ilitie
s
17,6
51
-
-
17,6
51
215
,203
-
-
2
15,2
03
Tota
l lia
bilit
ies
1
7,651
-
-
1
7,651
2
15,2
03
-
-
215
,203
To
tal e
quity
and
liab
ilitie
s
7,10
7,257
-
6
77,2
03
7,78
4,46
0
7,88
3,31
9
-
484
,399
8
,367
,718
Notes to the Financial StatementsIn Rupees Thousands
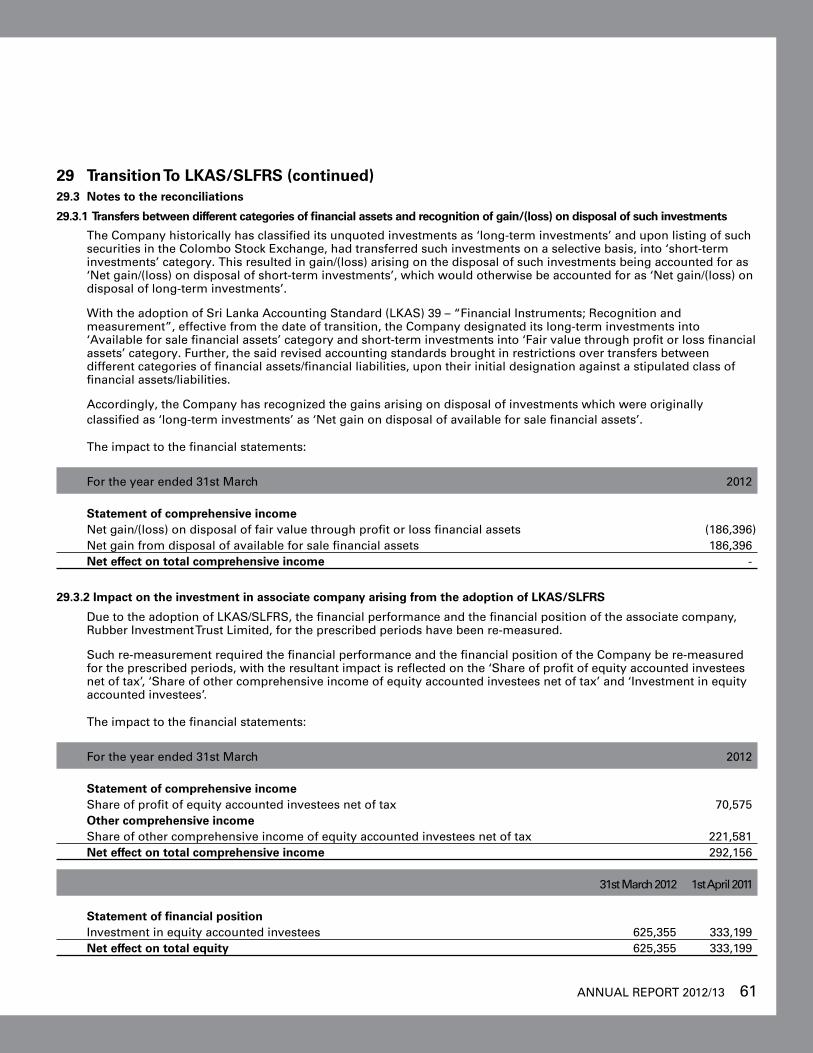
ANNUAL REPORT 2012/13 61
29 Transition To LkAS/SLFRS (continued)29.3 Notes to the reconciliations
29.3.1 Transfers between different categories of financial assets and recognition of gain/(loss) on disposal of such investments
The Company historically has classified its unquoted investments as ‘long-term investments’ and upon listing of such securities in the Colombo Stock Exchange, had transferred such investments on a selective basis, into ‘short-term investments’ category. This resulted in gain/(loss) arising on the disposal of such investments being accounted for as ‘Net gain/(loss) on disposal of short-term investments’, which would otherwise be accounted for as ‘Net gain/(loss) on disposal of long-term investments’.
With the adoption of Sri Lanka Accounting Standard (LKAS) 39 – “Financial Instruments; Recognition and measurement”, effective from the date of transition, the Company designated its long-term investments into ‘Available for sale financial assets’ category and short-term investments into ‘Fair value through profit or loss financial assets’ category. Further, the said revised accounting standards brought in restrictions over transfers between different categories of financial assets/financial liabilities, upon their initial designation against a stipulated class of financial assets/liabilities.
Accordingly, the Company has recognized the gains arising on disposal of investments which were originally classified as ‘long-term investments’ as ‘Net gain on disposal of available for sale financial assets’.
The impact to the financial statements:
For the year ended 31st March 2012
Statement of comprehensive income Net gain/(loss) on disposal of fair value through profit or loss financial assets (186,396)
Net gain from disposal of available for sale financial assets 186,396 Net effect on total comprehensive income -
29.3.2 Impact on the investment in associate company arising from the adoption of LkAS/SLFRS
Due to the adoption of LKAS/SLFRS, the financial performance and the financial position of the associate company, Rubber Investment Trust Limited, for the prescribed periods have been re-measured.
Such re-measurement required the financial performance and the financial position of the Company be re-measured for the prescribed periods, with the resultant impact is reflected on the ‘Share of profit of equity accounted investees net of tax’, ‘Share of other comprehensive income of equity accounted investees net of tax’ and ‘Investment in equity accounted investees’.
The impact to the financial statements:
For the year ended 31st March 2012 Statement of comprehensive income
Share of profit of equity accounted investees net of tax 70,575 Other comprehensive income Share of other comprehensive income of equity accounted investees net of tax 221,581 Net effect on total comprehensive income 292,156
31st March 2012 1st April 2011
Statement of financial position Investment in equity accounted investees 625,355 333,199
Net effect on total equity 625,355 333,199
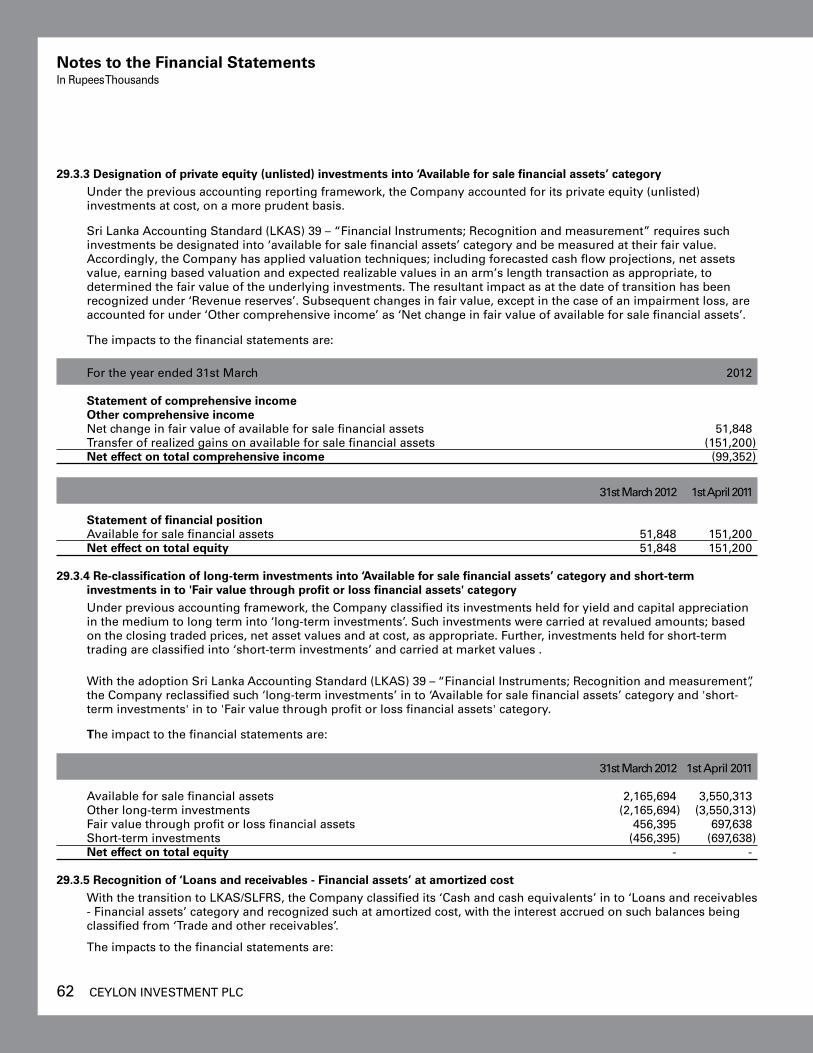
62 CEYLON INvESTMENT PLC
29.3.3 Designation of private equity (unlisted) investments into ‘Available for sale financial assets’ category Under the previous accounting reporting framework, the Company accounted for its private equity (unlisted)
investments at cost, on a more prudent basis.
Sri Lanka Accounting Standard (LKAS) 39 – “Financial Instruments; Recognition and measurement” requires such investments be designated into ‘available for sale financial assets’ category and be measured at their fair value. Accordingly, the Company has applied valuation techniques; including forecasted cash flow projections, net assets value, earning based valuation and expected realizable values in an arm’s length transaction as appropriate, to determined the fair value of the underlying investments. The resultant impact as at the date of transition has been recognized under ‘Revenue reserves’. Subsequent changes in fair value, except in the case of an impairment loss, are accounted for under ‘Other comprehensive income’ as ‘Net change in fair value of available for sale financial assets’.
The impacts to the financial statements are:
For the year ended 31st March 2012 Statement of comprehensive income
Other comprehensive income Net change in fair value of available for sale financial assets 51,848
Transfer of realized gains on available for sale financial assets (151,200) Net effect on total comprehensive income (99,352)
31st March 2012 1st April 2011 Statement of financial position
Available for sale financial assets 51,848 151,200 Net effect on total equity 51,848 151,200
29.3.4 Re-classification of long-term investments into ‘Available for sale financial assets’ category and short-term investments in to 'Fair value through profit or loss financial assets' category Under previous accounting framework, the Company classified its investments held for yield and capital appreciation
in the medium to long term into ‘long-term investments’. Such investments were carried at revalued amounts; based on the closing traded prices, net asset values and at cost, as appropriate. Further, investments held for short-term trading are classified into ‘short-term investments’ and carried at market values .
With the adoption Sri Lanka Accounting Standard (LKAS) 39 – “Financial Instruments; Recognition and measurement”, the Company reclassified such ‘long-term investments’ in to ‘Available for sale financial assets’ category and 'short-term investments' in to 'Fair value through profit or loss financial assets' category.
The impact to the financial statements are:
31st March 2012 1st April 2011
Available for sale financial assets 2,165,694 3,550,313 Other long-term investments (2,165,694) (3,550,313) Fair value through profit or loss financial assets 456,395 697,638 Short-term investments (456,395) (697,638) Net effect on total equity - -
29.3.5 Recognition of ‘Loans and receivables - Financial assets’ at amortized cost With the transition to LKAS/SLFRS, the Company classified its ‘Cash and cash equivalents’ in to ‘Loans and receivables
- Financial assets’ category and recognized such at amortized cost, with the interest accrued on such balances being classified from ‘Trade and other receivables’.
The impacts to the financial statements are:
Notes to the Financial StatementsIn Rupees Thousands
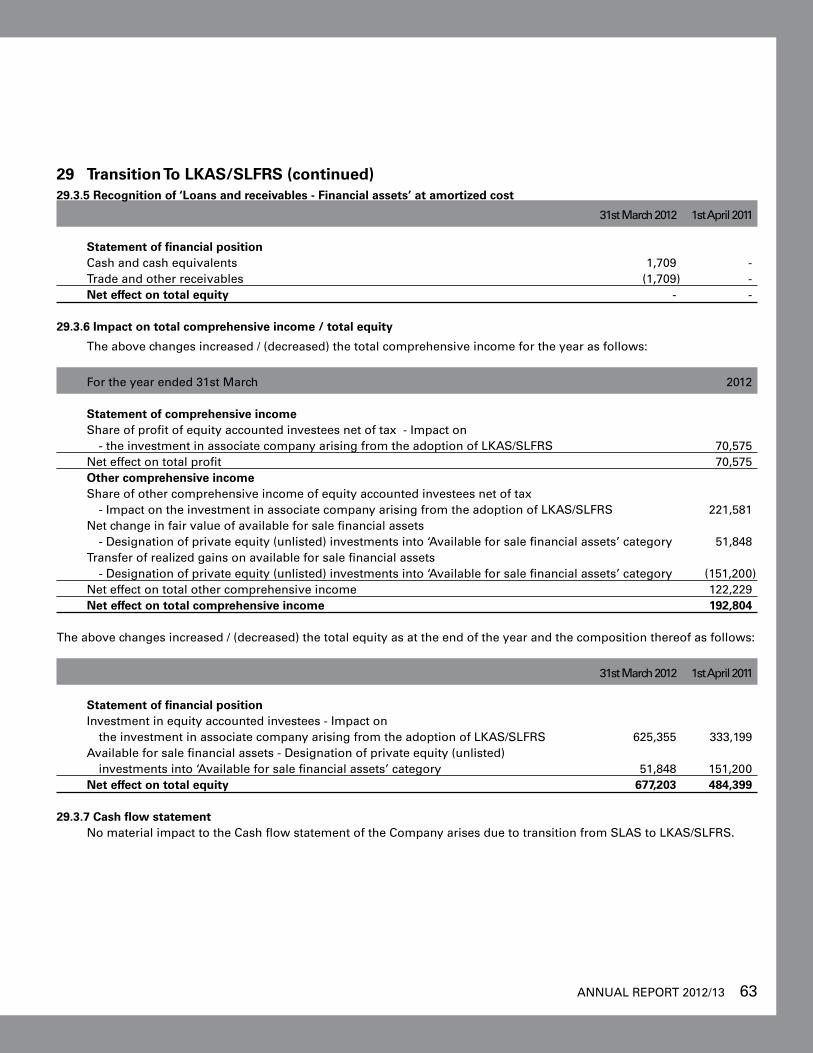
ANNUAL REPORT 2012/13 63
29 Transition To LkAS/SLFRS (continued)29.3.5 Recognition of ‘Loans and receivables - Financial assets’ at amortized cost
31st March 2012 1st April 2011 Statement of financial position Cash and cash equivalents 1,709 - Trade and other receivables (1,709) - Net effect on total equity - - 29.3.6 Impact on total comprehensive income / total equity
The above changes increased / (decreased) the total comprehensive income for the year as follows:
For the year ended 31st March 2012 Statement of comprehensive income Share of profit of equity accounted investees net of tax - Impact on - the investment in associate company arising from the adoption of LKAS/SLFRS 70,575 Net effect on total profit 70,575 Other comprehensive income Share of other comprehensive income of equity accounted investees net of tax - Impact on the investment in associate company arising from the adoption of LKAS/SLFRS 221,581
Net change in fair value of available for sale financial assets - Designation of private equity (unlisted) investments into ‘Available for sale financial assets’ category 51,848
Transfer of realized gains on available for sale financial assets - Designation of private equity (unlisted) investments into ‘Available for sale financial assets’ category (151,200)
Net effect on total other comprehensive income 122,229 Net effect on total comprehensive income 192,804 The above changes increased / (decreased) the total equity as at the end of the year and the composition thereof as follows:
31st March 2012 1st April 2011 Statement of financial position
Investment in equity accounted investees - Impact on the investment in associate company arising from the adoption of LKAS/SLFRS 625,355 333,199
Available for sale financial assets - Designation of private equity (unlisted) investments into ‘Available for sale financial assets’ category 51,848 151,200
Net effect on total equity 677,203 484,399 29.3.7 Cash flow statement
No material impact to the Cash flow statement of the Company arises due to transition from SLAS to LKAS/SLFRS.
64 CEYLON INvESTMENT PLC
30 Financial instruments Financial risk management - Overview The Company has exposure to the following risks arising from financial instruments:
Credit risk Liquidity risk Market risk.
This note presents information about the Company’s exposure to each of the above risks, the Company’s objectives, policies and processes for measuring and managing such risks.
Risk management framework The Company’s Board of Directors has overall responsibility for the establishment and supervision of the Company’s
risk management framework. The Board of Directors has delegated this function to the Chief Executive Officer of Guardian Fund Management Limited, the Fund Managers and Carsons Management Services (Private) Limited, the Managers; who are responsible for developing and monitoring the Group’s risk management policies and reports regularly to the Board of Directors on its activities.
The Company’s risk management policies are established to identify and analyse the risks faced by the Company, to set appropriate risk limits and controls, and to monitor risks and adherence to limits. Risk management policies and systems are reviewed regularly to reflect changes in market conditions and the Company’s activities. The Company, through its training and management standards and procedures, aims to develop a disciplined and constructive control environment in which all employees understand their roles and obligations, and thereby have the risk management measures incorporated with these functions.
The Audit Committee of Carson Cumberbatch PLC, the ultimate parent company, oversees how management monitors compliance with the Company’s risk management policies and procedures, and reviews the adequacy of the risk management framework in relation to the risks faced by the Company. The Audit Committee is assisted in its supervision role by the Internal Audit function. Internal Audit function undertakes both regular and ad - hoc reviews of risk management controls and procedures, the results of which are reported to the Audit Committee. In keeping with the best practices in an investment business, the Company has an Independent Compliance Officer, who has supervision over the regulatory, compliance aspects and operational procedures, and reports to the Audit Committee.
Further, an Investment Committee drawn from across the Carsons Group directorate provide advice and insights to the fund management team to further sharpen and refine their decision making process. This comprehensive management structure determines the objectives and policies of the Company’s risk management framework and promotes a culture of risk awareness and balanced risk-taking within the Company.
Notes to the Financial StatementsIn Rupees Thousands
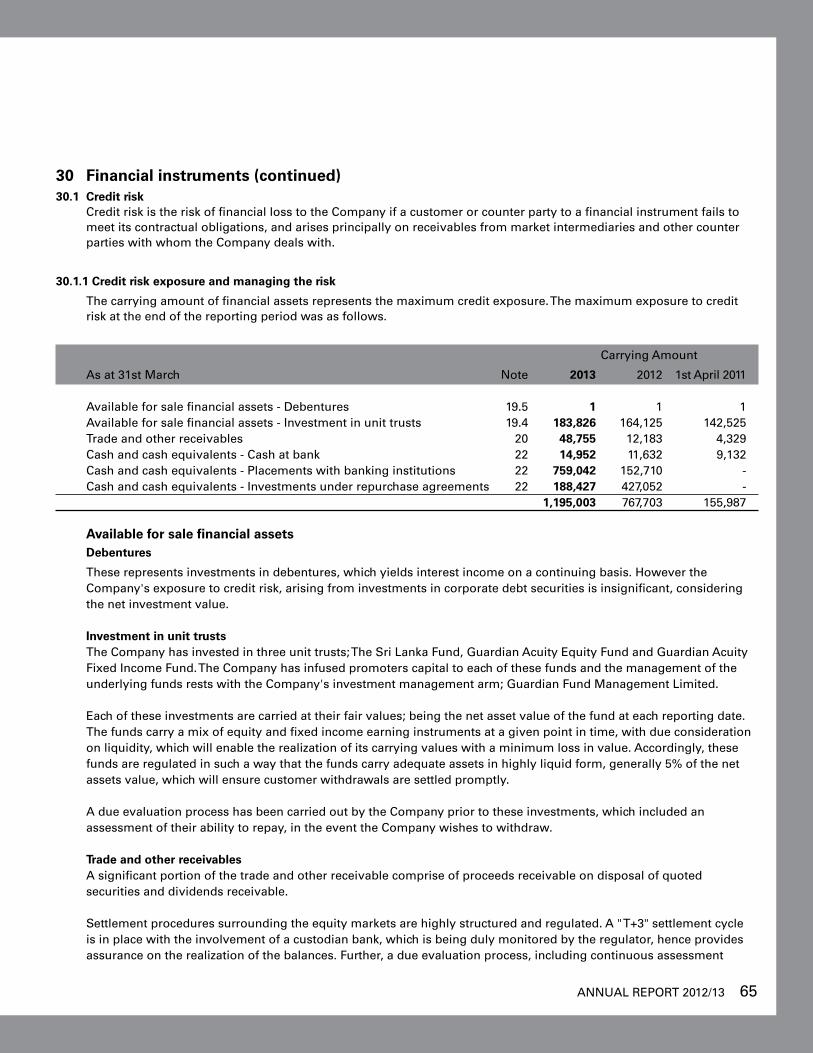
ANNUAL REPORT 2012/13 65
30 Financial instruments (continued)30.1 Credit risk
Credit risk is the risk of financial loss to the Company if a customer or counter party to a financial instrument fails to meet its contractual obligations, and arises principally on receivables from market intermediaries and other counter parties with whom the Company deals with.
30.1.1 Credit risk exposure and managing the risk
The carrying amount of financial assets represents the maximum credit exposure. The maximum exposure to credit risk at the end of the reporting period was as follows.
Carrying Amount
As at 31st March Note 2013 2012 1st April 2011
Available for sale financial assets - Debentures 19.5 1 1 1 Available for sale financial assets - Investment in unit trusts 19.4 183,826 164,125 142,525 Trade and other receivables 20 48,755 12,183 4,329 Cash and cash equivalents - Cash at bank 22 14,952 11,632 9,132 Cash and cash equivalents - Placements with banking institutions 22 759,042 152,710 - Cash and cash equivalents - Investments under repurchase agreements 22 188,427 427,052 - 1,195,003 767,703 155,987
Available for sale financial assets Debentures
These represents investments in debentures, which yields interest income on a continuing basis. However the Company's exposure to credit risk, arising from investments in corporate debt securities is insignificant, considering the net investment value.
Investment in unit trusts The Company has invested in three unit trusts; The Sri Lanka Fund, Guardian Acuity Equity Fund and Guardian Acuity Fixed Income Fund. The Company has infused promoters capital to each of these funds and the management of the underlying funds rests with the Company's investment management arm; Guardian Fund Management Limited.
Each of these investments are carried at their fair values; being the net asset value of the fund at each reporting date. The funds carry a mix of equity and fixed income earning instruments at a given point in time, with due consideration on liquidity, which will enable the realization of its carrying values with a minimum loss in value. Accordingly, these funds are regulated in such a way that the funds carry adequate assets in highly liquid form, generally 5% of the net assets value, which will ensure customer withdrawals are settled promptly.
A due evaluation process has been carried out by the Company prior to these investments, which included an assessment of their ability to repay, in the event the Company wishes to withdraw.
Trade and other receivables A significant portion of the trade and other receivable comprise of proceeds receivable on disposal of quoted securities and dividends receivable.
Settlement procedures surrounding the equity markets are highly structured and regulated. A " T+3" settlement cycle is in place with the involvement of a custodian bank, which is being duly monitored by the regulator, hence provides assurance on the realization of the balances. Further, a due evaluation process, including continuous assessment
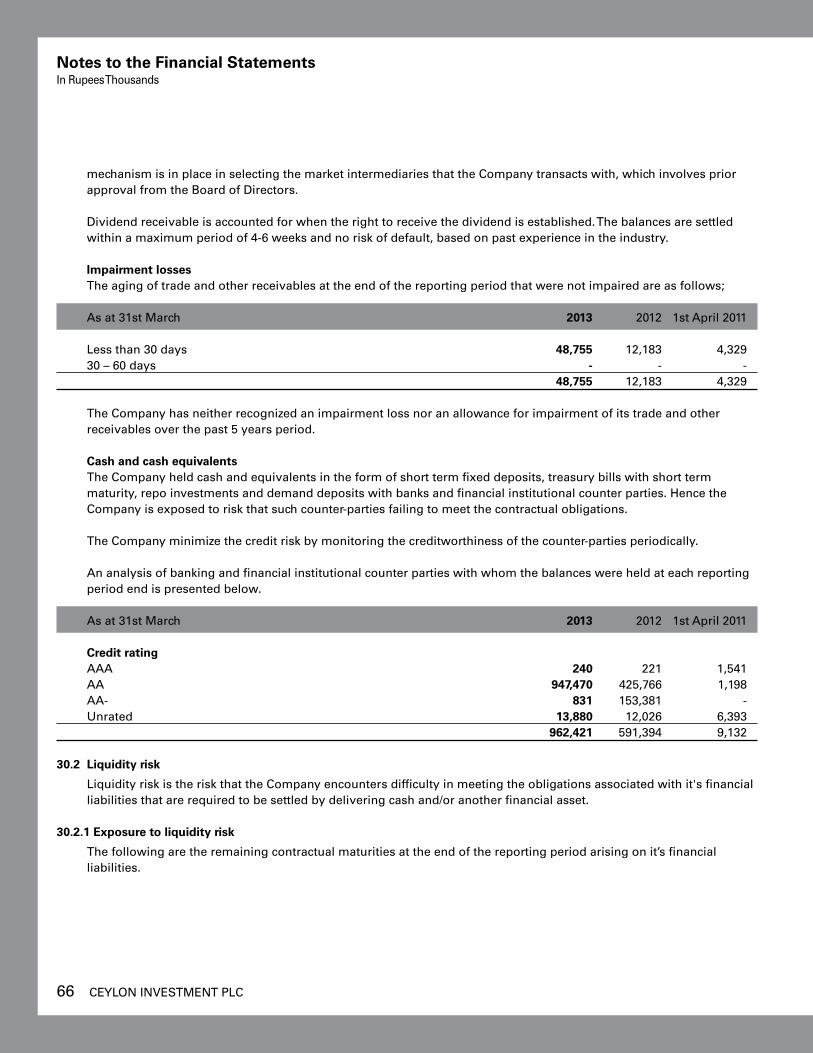
66 CEYLON INvESTMENT PLC
mechanism is in place in selecting the market intermediaries that the Company transacts with, which involves prior approval from the Board of Directors.
Dividend receivable is accounted for when the right to receive the dividend is established. The balances are settled
within a maximum period of 4-6 weeks and no risk of default, based on past experience in the industry.
Impairment losses The aging of trade and other receivables at the end of the reporting period that were not impaired are as follows;
As at 31st March 2013 2012 1st April 2011
Less than 30 days 48,755 12,183 4,329 30 – 60 days - - - 48,755 12,183 4,329
The Company has neither recognized an impairment loss nor an allowance for impairment of its trade and other receivables over the past 5 years period.
Cash and cash equivalents The Company held cash and equivalents in the form of short term fixed deposits, treasury bills with short term maturity, repo investments and demand deposits with banks and financial institutional counter parties. Hence the Company is exposed to risk that such counter-parties failing to meet the contractual obligations.
The Company minimize the credit risk by monitoring the creditworthiness of the counter-parties periodically.
An analysis of banking and financial institutional counter parties with whom the balances were held at each reporting period end is presented below.
As at 31st March 2013 2012 1st April 2011 Credit rating
AAA 240 221 1,541 AA 947,470 425,766 1,198 AA- 831 153,381 - Unrated 13,880 12,026 6,393 962,421 591,394 9,132
30.2 Liquidity risk
Liquidity risk is the risk that the Company encounters difficulty in meeting the obligations associated with it's financial liabilities that are required to be settled by delivering cash and/or another financial asset.
30.2.1 Exposure to liquidity risk
The following are the remaining contractual maturities at the end of the reporting period arising on it’s financial liabilities.
Notes to the Financial StatementsIn Rupees Thousands
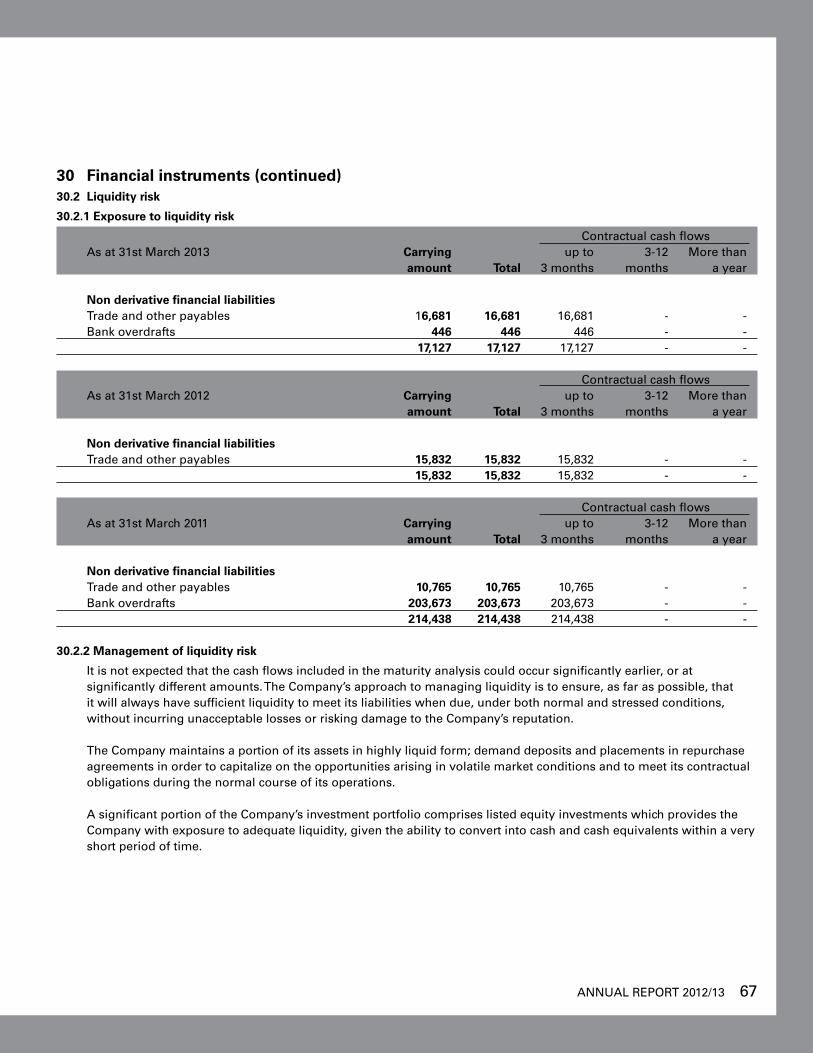
ANNUAL REPORT 2012/13 67
30 Financial instruments (continued)30.2 Liquidity risk
30.2.1 Exposure to liquidity risk
Contractual cash flows As at 31st March 2013 Carrying up to 3-12 More than
amount Total 3 months months a year
Non derivative financial liabilities Trade and other payables 16,681 16,681 16,681 - - Bank overdrafts 446 446 446 - - 17,127 17,127 17,127 - -
Contractual cash flows As at 31st March 2012 Carrying up to 3-12 More than
amount Total 3 months months a year
Non derivative financial liabilities Trade and other payables 15,832 15,832 15,832 - -
15,832 15,832 15,832 - -
Contractual cash flows As at 31st March 2011 Carrying up to 3-12 More than
amount Total 3 months months a year
Non derivative financial liabilities Trade and other payables 10,765 10,765 10,765 - - Bank overdrafts 203,673 203,673 203,673 - - 214,438 214,438 214,438 - -
30.2.2 Management of liquidity risk
It is not expected that the cash flows included in the maturity analysis could occur significantly earlier, or at significantly different amounts. The Company’s approach to managing liquidity is to ensure, as far as possible, that it will always have sufficient liquidity to meet its liabilities when due, under both normal and stressed conditions, without incurring unacceptable losses or risking damage to the Company’s reputation.
The Company maintains a portion of its assets in highly liquid form; demand deposits and placements in repurchase agreements in order to capitalize on the opportunities arising in volatile market conditions and to meet its contractual obligations during the normal course of its operations.
A significant portion of the Company’s investment portfolio comprises listed equity investments which provides the Company with exposure to adequate liquidity, given the ability to convert into cash and cash equivalents within a very short period of time.
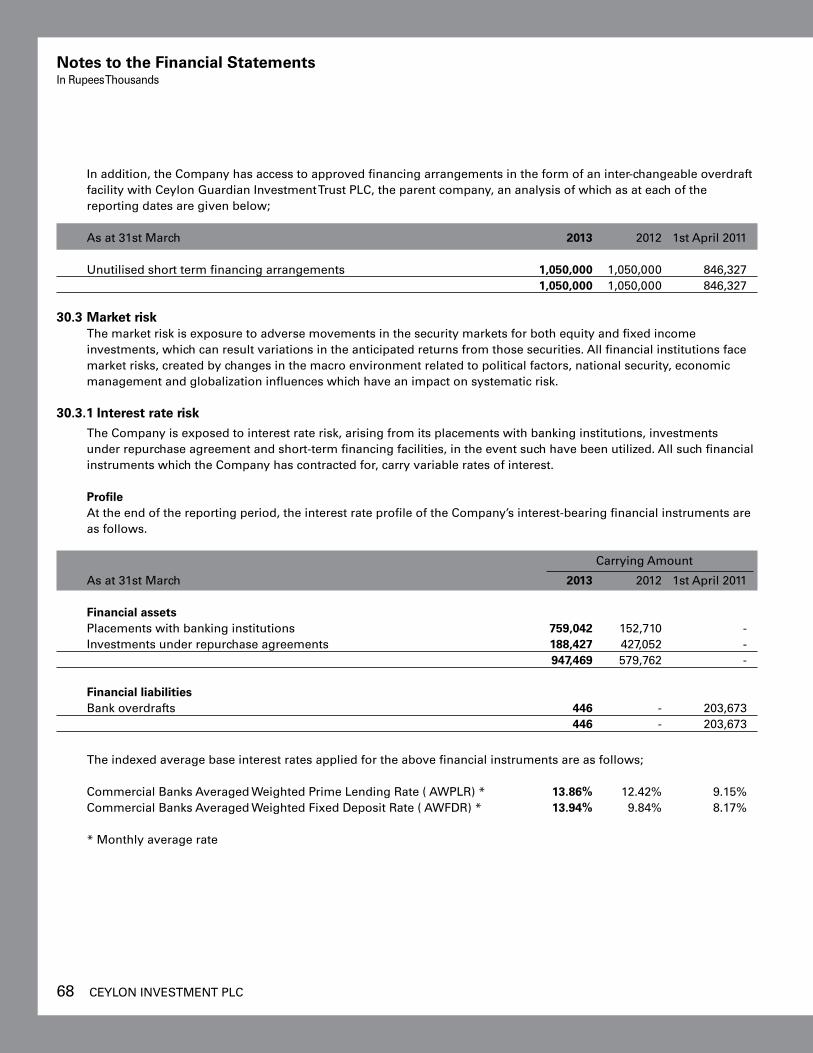
68 CEYLON INvESTMENT PLC
In addition, the Company has access to approved financing arrangements in the form of an inter-changeable overdraft facility with Ceylon Guardian Investment Trust PLC, the parent company, an analysis of which as at each of the reporting dates are given below;
As at 31st March 2013 2012 1st April 2011
Unutilised short term financing arrangements 1,050,000 1,050,000 846,327 1,050,000 1,050,000 846,327
30.3 Market risk The market risk is exposure to adverse movements in the security markets for both equity and fixed income
investments, which can result variations in the anticipated returns from those securities. All financial institutions face market risks, created by changes in the macro environment related to political factors, national security, economic management and globalization influences which have an impact on systematic risk.
30.3.1 Interest rate risk The Company is exposed to interest rate risk, arising from its placements with banking institutions, investments
under repurchase agreement and short-term financing facilities, in the event such have been utilized. All such financial instruments which the Company has contracted for, carry variable rates of interest.
Profile At the end of the reporting period, the interest rate profile of the Company’s interest-bearing financial instruments are as follows.
Carrying Amount
As at 31st March 2013 2012 1st April 2011 Financial assets
Placements with banking institutions 759,042 152,710 - Investments under repurchase agreements 188,427 427,052 - 947,469 579,762 - Financial liabilities Bank overdrafts 446 - 203,673 446 - 203,673
The indexed average base interest rates applied for the above financial instruments are as follows;
Commercial Banks Averaged Weighted Prime Lending Rate ( AWPLR) * 13.86% 12.42% 9.15% Commercial Banks Averaged Weighted Fixed Deposit Rate ( AWFDR) * 13.94% 9.84% 8.17% * Monthly average rate
Notes to the Financial StatementsIn Rupees Thousands

ANNUAL REPORT 2012/13 69
30 Financial instruments (continued)30.3.1 Interest rate risk
Sensitivity Analysis A change of 1% in interest rates at the end of the reporting period would have increased/ (decreased) profit or loss by the amounts shown below.
Profit or loss
Movement in interest rate Increase in 1% Decrease in 1% As at 31st March 2013 - On interest earning assets 9,475 (9,475) - On interest bearing liabilities (4) 4 9,471 (9,471)
As at 31st March 2012 - On interest earning assets 5,798 (5,798) - On interest bearing liabilities - - 5,798 (5,798)
30.3.2 Other market risks
Equity price risk The Company operate as an investment house, where the principal activity being to act as specialized investment vehicle to undertake, among others; listed and private equity investments. The Company is categorically exposed to equity price risk, having a substantial portion of 64% (2012 – 71%) of its discretionary investment portfolio designated as listed investments in the Colombo Stock Exchange and private equity investments. Market volatilities bring in substantial volatility to the Company's earnings and value of its asset base at the reporting date.
Listed equity investments
Management of the Company monitors the debt and equity securities in its investment portfolio based on market indices, where decisions concerned with the timing of buy / sell decisions are well supported with structured in-house research recommendations. Transactions of major magnitude are subject to review and approval by the Investment Committee.
Private equity investments Due evaluations are carried out before-hand, extending to both financial and operational feasibility of the private equity projects that the Company ventures into, with a view to ascertain the Company’s investment decision and the risks involved.
Continuous monitoring of the operations against the budgets and the industry standards ensure that the projects meet
the desired outcome, and thereby the returns. Further, the Company generally carries investment agreements with the parties concerned, which carry specific ‘exit clauses’ to private equity projects typically an ‘Initial Public Offering’ or a ‘Buy-out’ at a specified pre agreed price or price formulae, which provides cover against movements in market conditions.
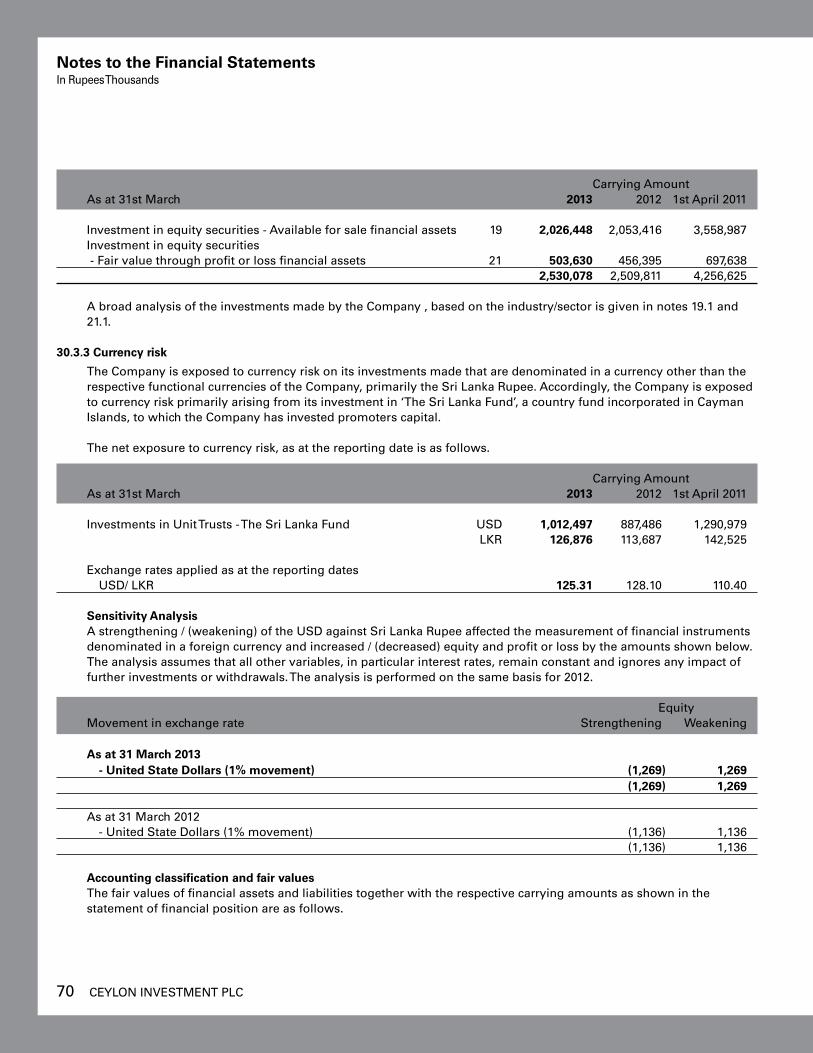
70 CEYLON INvESTMENT PLC
Carrying Amount As at 31st March 2013 2012 1st April 2011 Investment in equity securities - Available for sale financial assets 19 2,026,448 2,053,416 3,558,987 Investment in equity securities - Fair value through profit or loss financial assets 21 503,630 456,395 697,638 2,530,078 2,509,811 4,256,625
A broad analysis of the investments made by the Company , based on the industry/sector is given in notes 19.1 and 21.1.
30.3.3 Currency risk
The Company is exposed to currency risk on its investments made that are denominated in a currency other than the respective functional currencies of the Company, primarily the Sri Lanka Rupee. Accordingly, the Company is exposed to currency risk primarily arising from its investment in ‘The Sri Lanka Fund’, a country fund incorporated in Cayman Islands, to which the Company has invested promoters capital.
The net exposure to currency risk, as at the reporting date is as follows.
Carrying Amount As at 31st March 2013 2012 1st April 2011 Investments in Unit Trusts - The Sri Lanka Fund USD 1,012,497 887,486 1,290,979 LKR 126,876 113,687 142,525
Exchange rates applied as at the reporting dates USD/ LKR 125.31 128.10 110.40
Sensitivity Analysis A strengthening / (weakening) of the USD against Sri Lanka Rupee affected the measurement of financial instruments
denominated in a foreign currency and increased / (decreased) equity and profit or loss by the amounts shown below. The analysis assumes that all other variables, in particular interest rates, remain constant and ignores any impact of further investments or withdrawals. The analysis is performed on the same basis for 2012.
Equity Movement in exchange rate Strengthening Weakening As at 31 March 2013 - United State Dollars (1% movement) (1,269) 1,269 (1,269) 1,269 As at 31 March 2012
- United State Dollars (1% movement) (1,136) 1,136 (1,136) 1,136 Accounting classification and fair values
The fair values of financial assets and liabilities together with the respective carrying amounts as shown in the statement of financial position are as follows.
Notes to the Financial StatementsIn Rupees Thousands
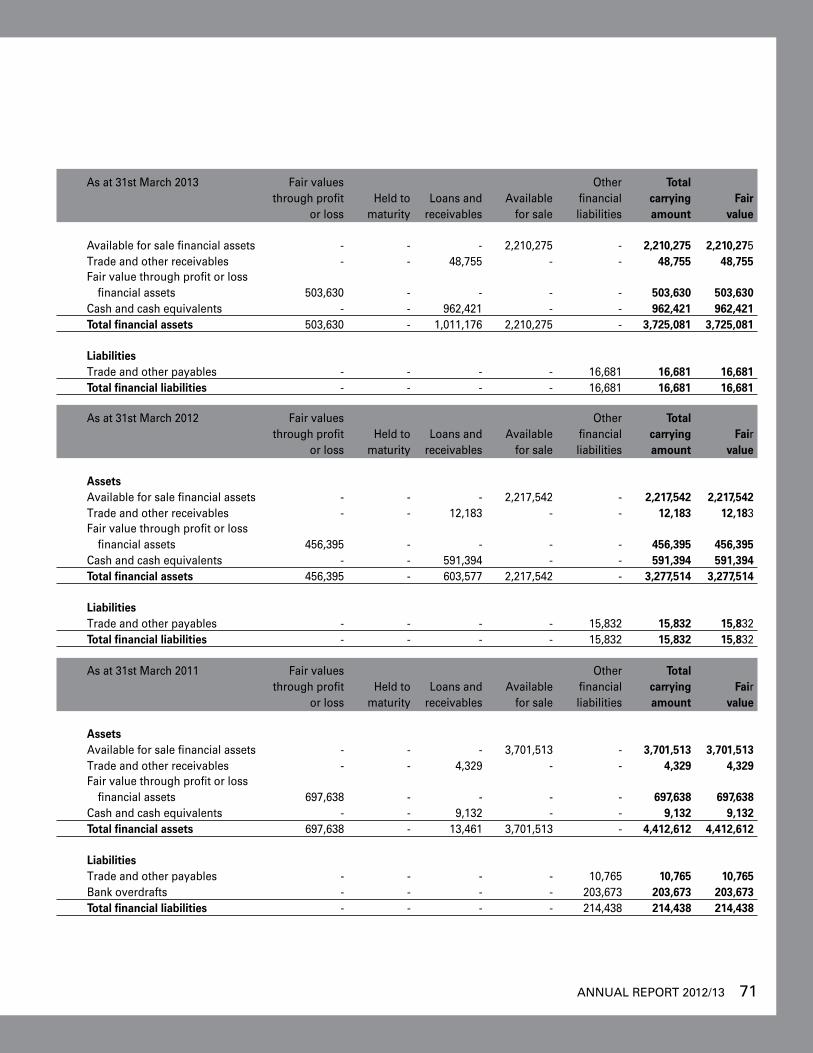
ANNUAL REPORT 2012/13 71
As at 31st March 2013 Fair values Other Total through profit Held to Loans and Available financial carrying Fair or loss maturity receivables for sale liabilities amount value Available for sale financial assets - - - 2,210,275 - 2,210,275 2,210,275 Trade and other receivables - - 48,755 - - 48,755 48,755 Fair value through profit or loss financial assets 503,630 - - - - 503,630 503,630 Cash and cash equivalents - - 962,421 - - 962,421 962,421 Total financial assets 503,630 - 1,011,176 2,210,275 - 3,725,081 3,725,081
Liabilities Trade and other payables - - - - 16,681 16,681 16,681 Total financial liabilities - - - - 16,681 16,681 16,681
As at 31st March 2012 Fair values Other Total through profit Held to Loans and Available financial carrying Fair or loss maturity receivables for sale liabilities amount value Assets Available for sale financial assets - - - 2,217,542 - 2,217,542 2,217,542 Trade and other receivables - - 12,183 - - 12,183 12,183 Fair value through profit or loss financial assets 456,395 - - - - 456,395 456,395 Cash and cash equivalents - - 591,394 - - 591,394 591,394 Total financial assets 456,395 - 603,577 2,217,542 - 3,277,514 3,277,514 Liabilities Trade and other payables - - - - 15,832 15,832 15,832 Total financial liabilities - - - - 15,832 15,832 15,832
As at 31st March 2011 Fair values Other Total through profit Held to Loans and Available financial carrying Fair or loss maturity receivables for sale liabilities amount value Assets Available for sale financial assets - - - 3,701,513 - 3,701,513 3,701,513 Trade and other receivables - - 4,329 - - 4,329 4,329 Fair value through profit or loss financial assets 697,638 - - - - 697,638 697,638 Cash and cash equivalents - - 9,132 - - 9,132 9,132 Total financial assets 697,638 - 13,461 3,701,513 - 4,412,612 4,412,612 Liabilities Trade and other payables - - - - 10,765 10,765 10,765 Bank overdrafts - - - - 203,673 203,673 203,673 Total financial liabilities - - - - 214,438 214,438 214,438
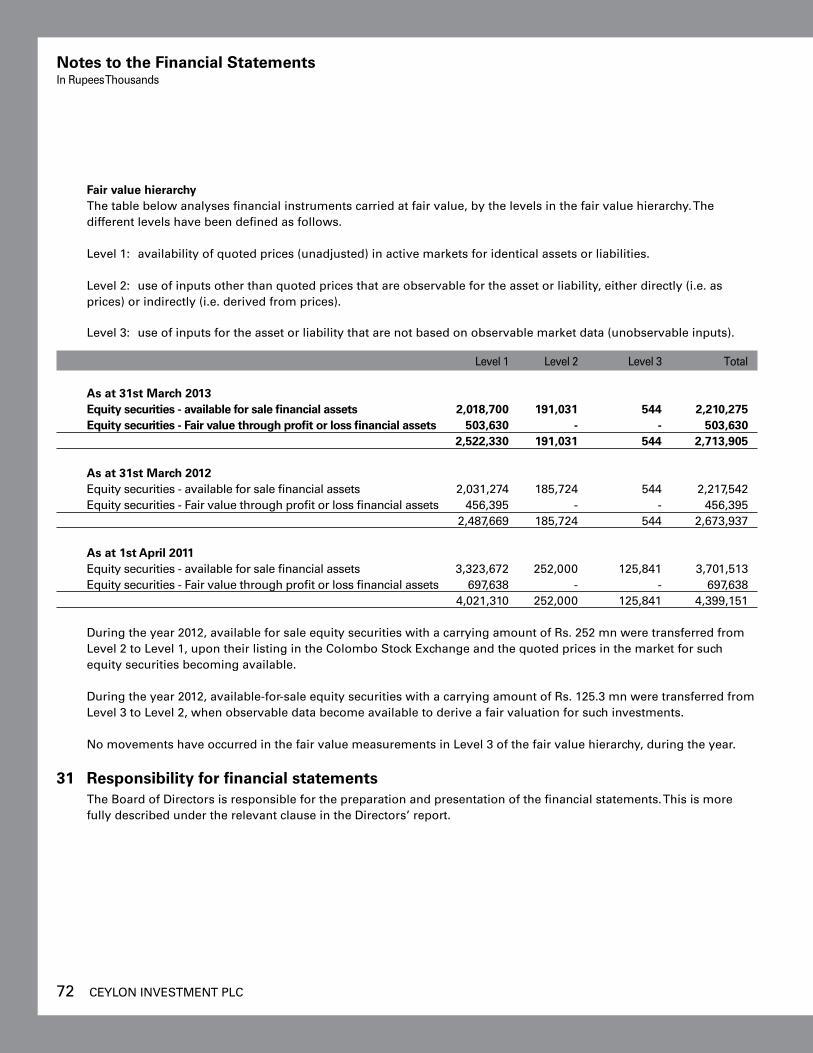
72 CEYLON INvESTMENT PLC
Fair value hierarchy The table below analyses financial instruments carried at fair value, by the levels in the fair value hierarchy. The different levels have been defined as follows.
Level 1: availability of quoted prices (unadjusted) in active markets for identical assets or liabilities.
Level 2: use of inputs other than quoted prices that are observable for the asset or liability, either directly (i.e. as prices) or indirectly (i.e. derived from prices).
Level 3: use of inputs for the asset or liability that are not based on observable market data (unobservable inputs).
Level 1 Level 2 Level 3 Total As at 31st March 2013
Equity securities - available for sale financial assets 2,018,700 191,031 544 2,210,275 Equity securities - Fair value through profit or loss financial assets 503,630 - - 503,630 2,522,330 191,031 544 2,713,905 As at 31st March 2012
Equity securities - available for sale financial assets 2,031,274 185,724 544 2,217,542 Equity securities - Fair value through profit or loss financial assets 456,395 - - 456,395 2,487,669 185,724 544 2,673,937 As at 1st April 2011
Equity securities - available for sale financial assets 3,323,672 252,000 125,841 3,701,513 Equity securities - Fair value through profit or loss financial assets 697,638 - - 697,638 4,021,310 252,000 125,841 4,399,151
During the year 2012, available for sale equity securities with a carrying amount of Rs. 252 mn were transferred from Level 2 to Level 1, upon their listing in the Colombo Stock Exchange and the quoted prices in the market for such equity securities becoming available.
During the year 2012, available-for-sale equity securities with a carrying amount of Rs. 125.3 mn were transferred from Level 3 to Level 2, when observable data become available to derive a fair valuation for such investments. No movements have occurred in the fair value measurements in Level 3 of the fair value hierarchy, during the year.
31 Responsibility for financial statements The Board of Directors is responsible for the preparation and presentation of the financial statements. This is more
fully described under the relevant clause in the Directors’ report.
Notes to the Financial StatementsIn Rupees Thousands
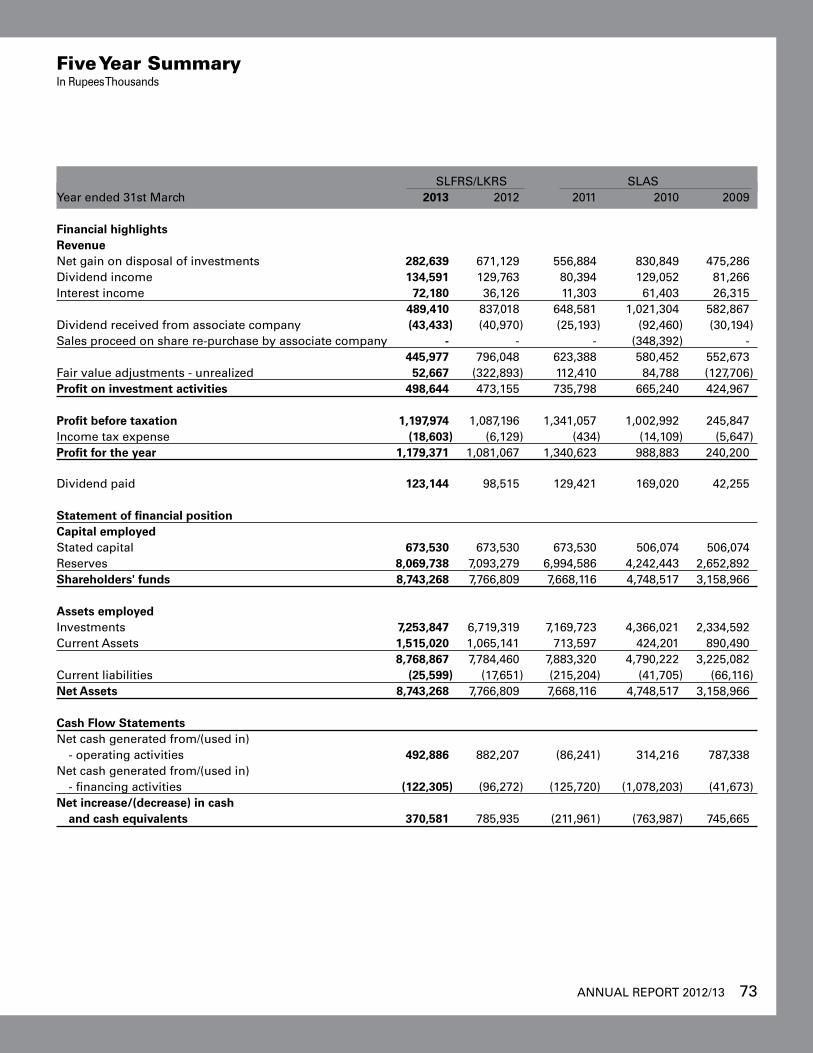
ANNUAL REPORT 2012/13 73
SLFRS/LKRS SLASYear ended 31st March 2013 2012 2011 2010 2009 Financial highlights Revenue Net gain on disposal of investments 282,639 671,129 556,884 830,849 475,286 Dividend income 134,591 129,763 80,394 129,052 81,266 Interest income 72,180 36,126 11,303 61,403 26,315 489,410 837,018 648,581 1,021,304 582,867 Dividend received from associate company (43,433) (40,970) (25,193) (92,460) (30,194)Sales proceed on share re-purchase by associate company - - - (348,392) - 445,977 796,048 623,388 580,452 552,673 Fair value adjustments - unrealized 52,667 (322,893) 112,410 84,788 (127,706)Profit on investment activities 498,644 473,155 735,798 665,240 424,967 Profit before taxation 1,197,974 1,087,196 1,341,057 1,002,992 245,847 Income tax expense (18,603) (6,129) (434) (14,109) (5,647)Profit for the year 1,179,371 1,081,067 1,340,623 988,883 240,200
Dividend paid 123,144 98,515 129,421 169,020 42,255 Statement of financial position Capital employed Stated capital 673,530 673,530 673,530 506,074 506,074 Reserves 8,069,738 7,093,279 6,994,586 4,242,443 2,652,892 Shareholders' funds 8,743,268 7,766,809 7,668,116 4,748,517 3,158,966 Assets employed Investments 7,253,847 6,719,319 7,169,723 4,366,021 2,334,592 Current Assets 1,515,020 1,065,141 713,597 424,201 890,490 8,768,867 7,784,460 7,883,320 4,790,222 3,225,082 Current liabilities (25,599) (17,651) (215,204) (41,705) (66,116)Net Assets 8,743,268 7,766,809 7,668,116 4,748,517 3,158,966 Cash Flow Statements Net cash generated from/(used in) - operating activities 492,886 882,207 (86,241) 314,216 787,338 Net cash generated from/(used in) - financing activities (122,305) (96,272) (125,720) (1,078,203) (41,673)Net increase/(decrease) in cash and cash equivalents 370,581 785,935 (211,961) (763,987) 745,665
Five Year SummaryIn Rupees Thousands
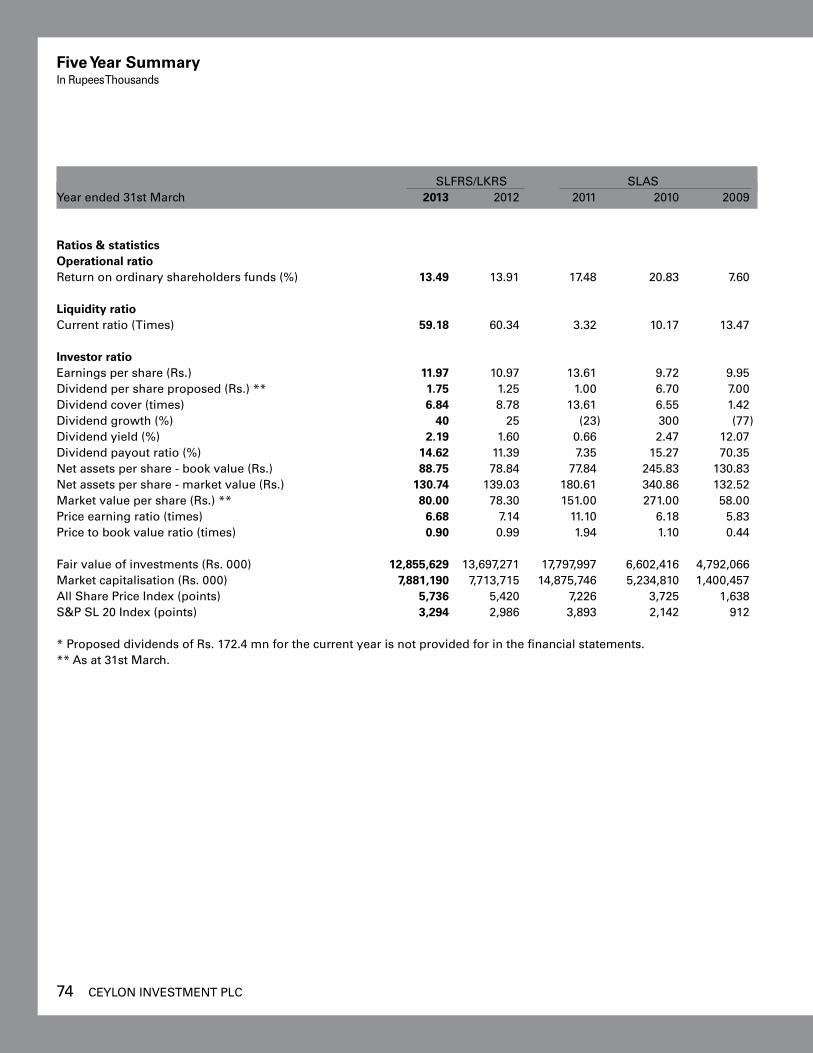
74 CEYLON INvESTMENT PLC
SLFRS/LKRS SLAS Year ended 31st March 2013 2012 2011 2010 2009 Ratios & statistics Operational ratio Return on ordinary shareholders funds (%) 13.49 13.91 17.48 20.83 7.60 Liquidity ratio Current ratio (Times) 59.18 60.34 3.32 10.17 13.47 Investor ratio Earnings per share (Rs.) 11.97 10.97 13.61 9.72 9.95 Dividend per share proposed (Rs.) ** 1.75 1.25 1.00 6.70 7.00 Dividend cover (times) 6.84 8.78 13.61 6.55 1.42 Dividend growth (%) 40 25 (23) 300 (77)Dividend yield (%) 2.19 1.60 0.66 2.47 12.07 Dividend payout ratio (%) 14.62 11.39 7.35 15.27 70.35 Net assets per share - book value (Rs.) 88.75 78.84 77.84 245.83 130.83 Net assets per share - market value (Rs.) 130.74 139.03 180.61 340.86 132.52 Market value per share (Rs.) ** 80.00 78.30 151.00 271.00 58.00 Price earning ratio (times) 6.68 7.14 11.10 6.18 5.83 Price to book value ratio (times) 0.90 0.99 1.94 1.10 0.44 Fair value of investments (Rs. 000) 12,855,629 13,697,271 17,797,997 6,602,416 4,792,066 Market capitalisation (Rs. 000) 7,881,190 7,713,715 14,875,746 5,234,810 1,400,457 All Share Price Index (points) 5,736 5,420 7,226 3,725 1,638 S&P SL 20 Index (points) 3,294 2,986 3,893 2,142 912 * Proposed dividends of Rs. 172.4 mn for the current year is not provided for in the financial statements. ** As at 31st March.
Five Year SummaryIn Rupees Thousands
ANNUAL REPORT 2012/13 75
US$ Financials
Preparation of US DollarFinancial Statements
The Financial Statements of the Company are
stated in Sri Lankan Rupees. The translation of
Sri Lankan Rupee amounts into US Dollar
amounts is included solely for the convenience
of Shareholders, Investors, Bankers and other
users of Financial Statements. US Dollar
Financials do not form part of the audited
Financial Statements of the Company.
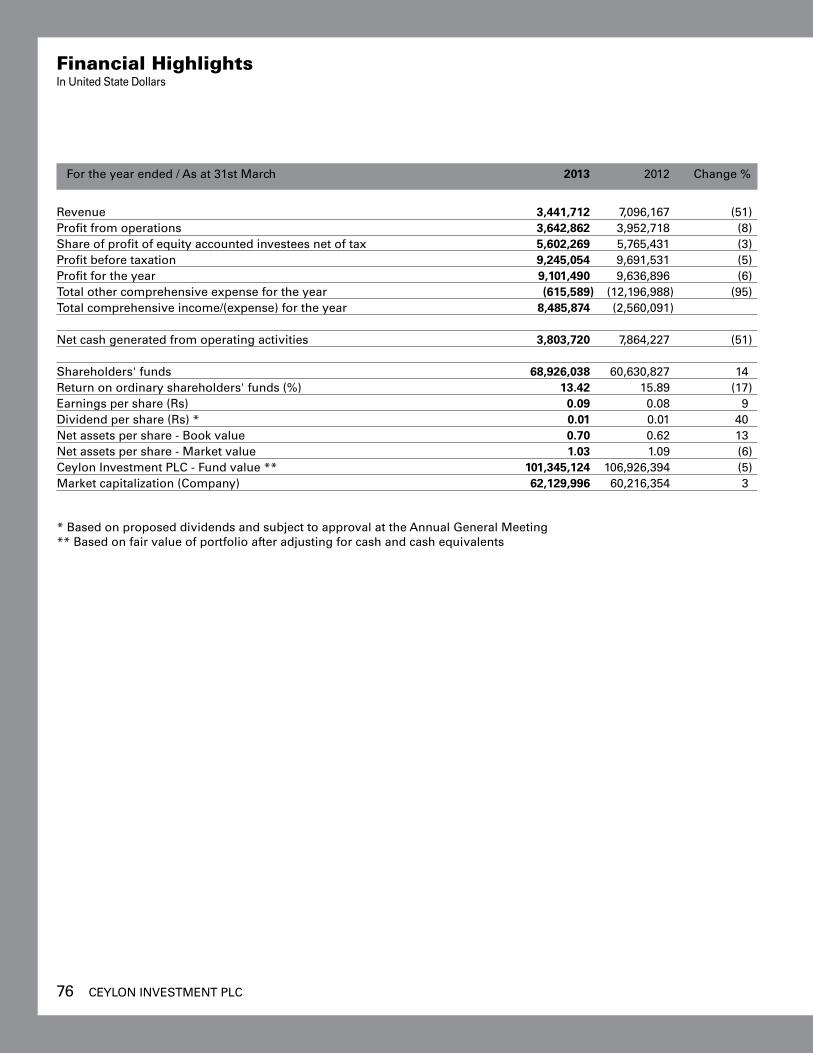
76 CEYLON INvESTMENT PLC
For the year ended / As at 31st March 2013 2012 Change %
Revenue 3,441,712 7,096,167 (51)Profit from operations 3,642,862 3,952,718 (8)Share of profit of equity accounted investees net of tax 5,602,269 5,765,431 (3)Profit before taxation 9,245,054 9,691,531 (5)Profit for the year 9,101,490 9,636,896 (6)Total other comprehensive expense for the year (615,589) (12,196,988) (95)Total comprehensive income/(expense) for the year 8,485,874 (2,560,091) Net cash generated from operating activities 3,803,720 7,864,227 (51) Shareholders' funds 68,926,038 60,630,827 14 Return on ordinary shareholders' funds (%) 13.42 15.89 (17)Earnings per share (Rs) 0.09 0.08 9 Dividend per share (Rs) * 0.01 0.01 40 Net assets per share - Book value 0.70 0.62 13 Net assets per share - Market value 1.03 1.09 (6)Ceylon Investment PLC - Fund value ** 101,345,124 106,926,394 (5)Market capitalization (Company) 62,129,996 60,216,354 3
* Based on proposed dividends and subject to approval at the Annual General Meeting** Based on fair value of portfolio after adjusting for cash and cash equivalents
Financial HighlightsIn United State Dollars
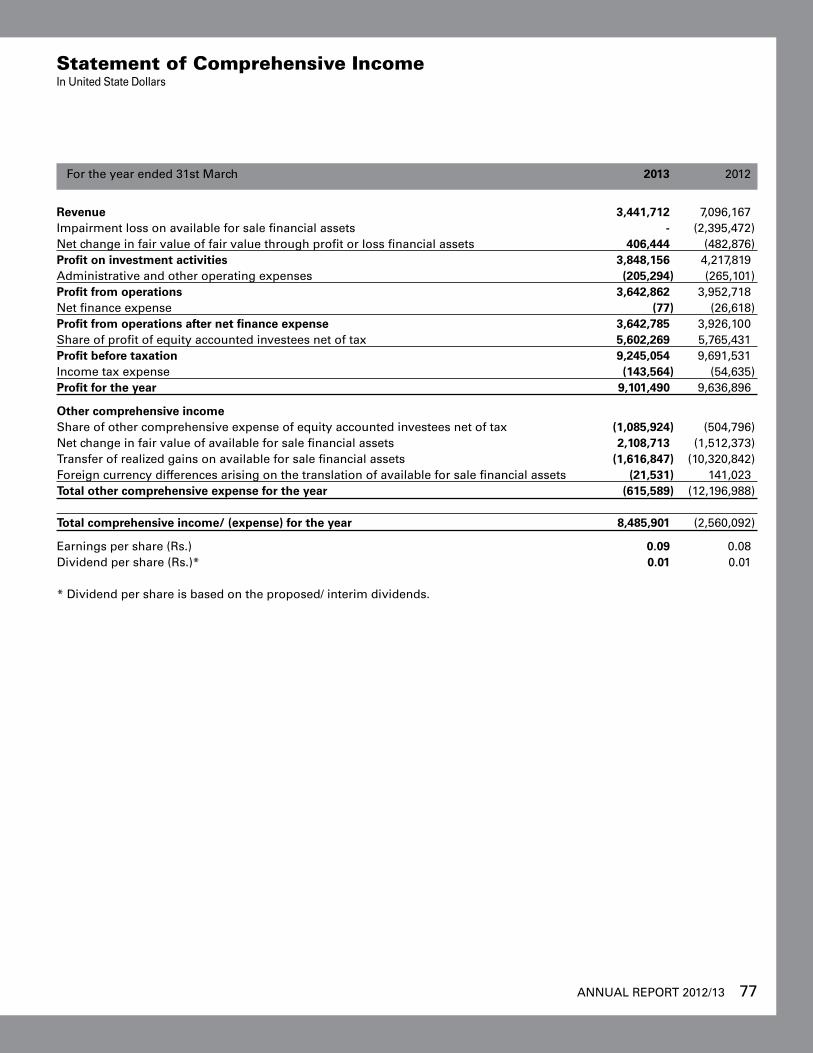
ANNUAL REPORT 2012/13 77
For the year ended 31st March 2013 2012
Revenue 3,441,712 7,096,167 Impairment loss on available for sale financial assets - (2,395,472)Net change in fair value of fair value through profit or loss financial assets 406,444 (482,876)Profit on investment activities 3,848,156 4,217,819 Administrative and other operating expenses (205,294) (265,101)Profit from operations 3,642,862 3,952,718 Net finance expense (77) (26,618)Profit from operations after net finance expense 3,642,785 3,926,100 Share of profit of equity accounted investees net of tax 5,602,269 5,765,431 Profit before taxation 9,245,054 9,691,531 Income tax expense (143,564) (54,635)Profit for the year 9,101,490 9,636,896
Other comprehensive income Share of other comprehensive expense of equity accounted investees net of tax (1,085,924) (504,796)Net change in fair value of available for sale financial assets 2,108,713 (1,512,373)Transfer of realized gains on available for sale financial assets (1,616,847) (10,320,842)Foreign currency differences arising on the translation of available for sale financial assets (21,531) 141,023 Total other comprehensive expense for the year (615,589) (12,196,988) Total comprehensive income/ (expense) for the year 8,485,901 (2,560,092)
Earnings per share (Rs.) 0.09 0.08 Dividend per share (Rs.)* 0.01 0.01
* Dividend per share is based on the proposed/ interim dividends.
Statement of Comprehensive IncomeIn United State Dollars
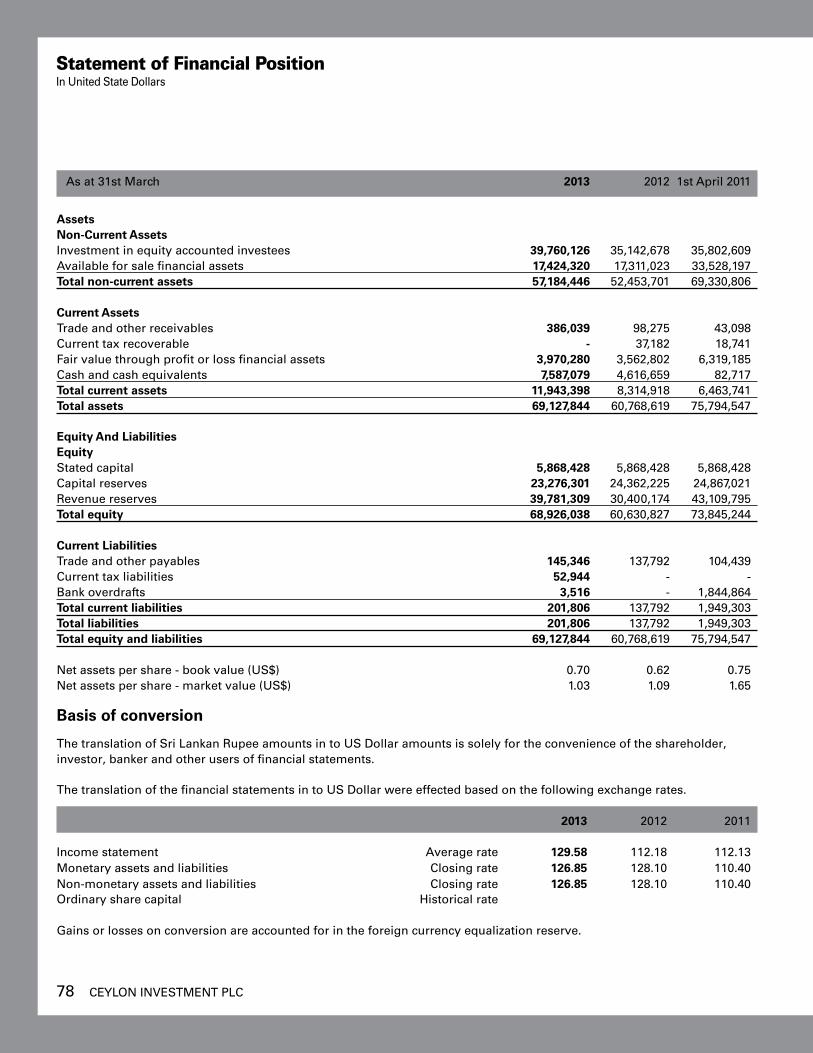
78 CEYLON INvESTMENT PLC
As at 31st March 2013 2012 1st April 2011
Assets Non-Current Assets Investment in equity accounted investees 39,760,126 35,142,678 35,802,609 Available for sale financial assets 17,424,320 17,311,023 33,528,197 Total non-current assets 57,184,446 52,453,701 69,330,806 Current Assets Trade and other receivables 386,039 98,275 43,098 Current tax recoverable - 37,182 18,741 Fair value through profit or loss financial assets 3,970,280 3,562,802 6,319,185 Cash and cash equivalents 7,587,079 4,616,659 82,717 Total current assets 11,943,398 8,314,918 6,463,741 Total assets 69,127,844 60,768,619 75,794,547
Equity And Liabilities Equity Stated capital 5,868,428 5,868,428 5,868,428 Capital reserves 23,276,301 24,362,225 24,867,021 Revenue reserves 39,781,309 30,400,174 43,109,795 Total equity 68,926,038 60,630,827 73,845,244
Current Liabilities Trade and other payables 145,346 137,792 104,439 Current tax liabilities 52,944 - - Bank overdrafts 3,516 - 1,844,864 Total current liabilities 201,806 137,792 1,949,303 Total liabilities 201,806 137,792 1,949,303 Total equity and liabilities 69,127,844 60,768,619 75,794,547
Net assets per share - book value (US$) 0.70 0.62 0.75Net assets per share - market value (US$) 1.03 1.09 1.65
basis of conversion
The translation of Sri Lankan Rupee amounts in to US Dollar amounts is solely for the convenience of the shareholder, investor, banker and other users of financial statements.
The translation of the financial statements in to US Dollar were effected based on the following exchange rates. 2013 2012 2011
Income statement Average rate 129.58 112.18 112.13Monetary assets and liabilities Closing rate 126.85 128.10 110.40Non-monetary assets and liabilities Closing rate 126.85 128.10 110.40 Ordinary share capital Historical rate Gains or losses on conversion are accounted for in the foreign currency equalization reserve.
Statement of Financial Position In United State Dollars
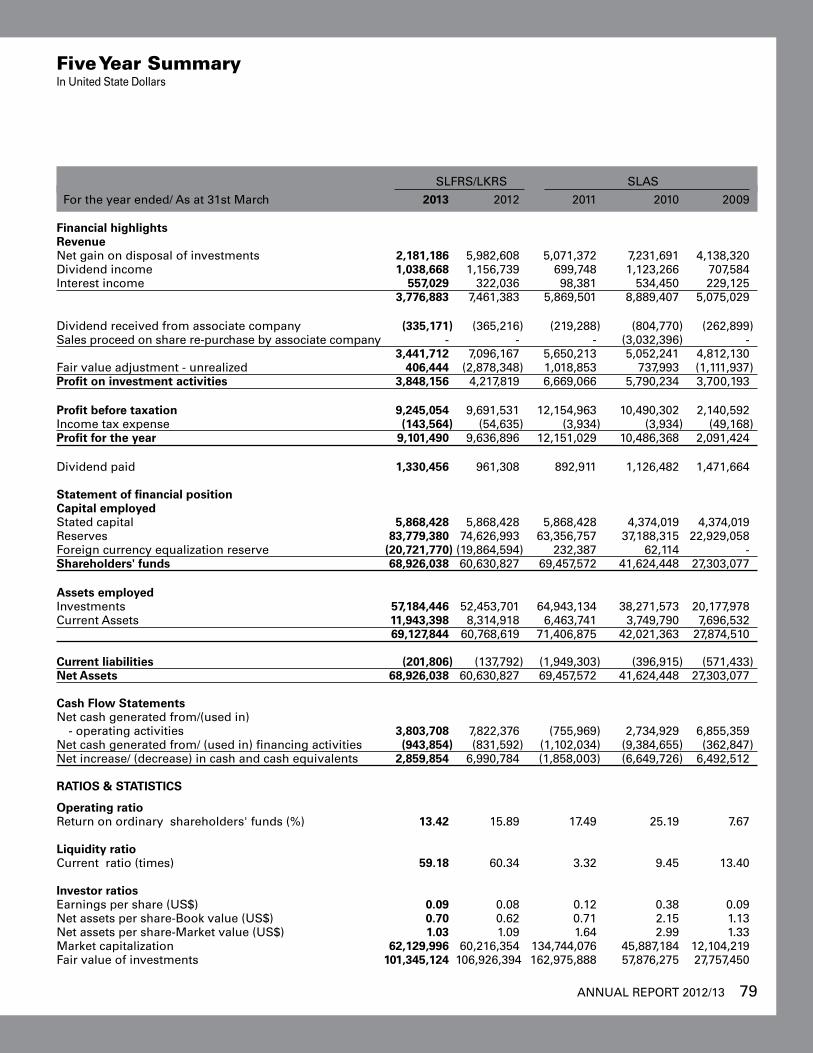
ANNUAL REPORT 2012/13 79
SLFRS/LKRS SLAS
For the year ended/ As at 31st March 2013 2012 2011 2010 2009 Financial highlights Revenue Net gain on disposal of investments 2,181,186 5,982,608 5,071,372 7,231,691 4,138,320 Dividend income 1,038,668 1,156,739 699,748 1,123,266 707,584 Interest income 557,029 322,036 98,381 534,450 229,125 3,776,883 7,461,383 5,869,501 8,889,407 5,075,029
Dividend received from associate company (335,171) (365,216) (219,288) (804,770) (262,899)Sales proceed on share re-purchase by associate company - - - (3,032,396) - 3,441,712 7,096,167 5,650,213 5,052,241 4,812,130 Fair value adjustment - unrealized 406,444 (2,878,348) 1,018,853 737,993 (1,111,937)Profit on investment activities 3,848,156 4,217,819 6,669,066 5,790,234 3,700,193
Profit before taxation 9,245,054 9,691,531 12,154,963 10,490,302 2,140,592 Income tax expense (143,564) (54,635) (3,934) (3,934) (49,168)Profit for the year 9,101,490 9,636,896 12,151,029 10,486,368 2,091,424
Dividend paid 1,330,456 961,308 892,911 1,126,482 1,471,664 Statement of financial position Capital employed Stated capital 5,868,428 5,868,428 5,868,428 4,374,019 4,374,019 Reserves 83,779,380 74,626,993 63,356,757 37,188,315 22,929,058 Foreign currency equalization reserve (20,721,770) (19,864,594) 232,387 62,114 - Shareholders' funds 68,926,038 60,630,827 69,457,572 41,624,448 27,303,077
Assets employed Investments 57,184,446 52,453,701 64,943,134 38,271,573 20,177,978 Current Assets 11,943,398 8,314,918 6,463,741 3,749,790 7,696,532 69,127,844 60,768,619 71,406,875 42,021,363 27,874,510
Current liabilities (201,806) (137,792) (1,949,303) (396,915) (571,433)Net Assets 68,926,038 60,630,827 69,457,572 41,624,448 27,303,077 Cash Flow Statements Net cash generated from/(used in) - operating activities 3,803,708 7,822,376 (755,969) 2,734,929 6,855,359 Net cash generated from/ (used in) financing activities (943,854) (831,592) (1,102,034) (9,384,655) (362,847)Net increase/ (decrease) in cash and cash equivalents 2,859,854 6,990,784 (1,858,003) (6,649,726) 6,492,512 RATIOS & STATISTICS
Operating ratio Return on ordinary shareholders' funds (%) 13.42 15.89 17.49 25.19 7.67 Liquidity ratio Current ratio (times) 59.18 60.34 3.32 9.45 13.40 Investor ratios Earnings per share (US$) 0.09 0.08 0.12 0.38 0.09 Net assets per share-Book value (US$) 0.70 0.62 0.71 2.15 1.13Net assets per share-Market value (US$) 1.03 1.09 1.64 2.99 1.33Market capitalization 62,129,996 60,216,354 134,744,076 45,887,184 12,104,219 Fair value of investments 101,345,124 106,926,394 162,975,888 57,876,275 27,757,450
Five Year SummaryIn United State Dollars

80 CEYLON INvESTMENT PLC
Information to shareholders and investors
1. Stock Exchange Listing Ceylon Investment PLC is a public quoted company, the ordinary shares of which are listed on the main board of the
Colombo Stock Exchange of Sri Lanka.
Stock Exchange code for Ceylon Investment PLC shares is “CINv”.
2. Share valuation The market price of the Company’s shares as at 31st March 2013 was Rs.80/- per share (2012 – Rs.78/30).
3. Ordinary shareholders
As at 31st March 2013 2012
Number of shareholders 2,442 2,602
The number of shares held by non-residents as at 31st March, 2013 was 4,060,531 which amounts to 4.12% (2012 – 3,972,978 / 4.03%).
Residents Non-Residents Total
Distribution of Shares
No. of share-
holders
No. of Shares
% No. of share-
holders
No. of Shares
% No. of share-
holders
No. of Shares
%
1 - 1,000 1,494 421,045 0.43 08 3,260 0.00 1,502 424,305 0.43
1,001 - 10,000 649 2,293,952 2.33 23 112,299 0.11 672 2,406,251 2.44
10,001 - 100,000 175 5,328,691 5.41 28 813,080 0.83 203 6.141,771 6.23
100,001 - 1,000,000 52 16,225,885 16.47 06 1,207,886 1.23 58 17,433,771 17.70
Above 1,000,000 06 70,184,770 71.24 01 1,924,006 1.95 07 72,108,776 73.20
Total 2,376 94,454,343 95.88 66 4,060,531 4.12 2,442 98,514,874 100.00
Categories of shareholders No. of shareholders No. of Shares %
Individuals 2,234 19,792,034 20.09
Institutions 208 78,722,840 79.91
Total 2,442 98,514,874 100.00
4. Market performance - ordinary shares
For the year ended 31 March 2013 2012
Share price as at 31 March (Rs.) 80.00 78.30
Highest price (Rs.) 115.00 172.50
Lowest price (Rs.) 58.10 78.00
value of shares traded (Rs. ‘000) 160,211,091 428,516,812
No. of shares traded 1,853,360 3,221,062
volume of transactions (Nos.) 2,410 4,289
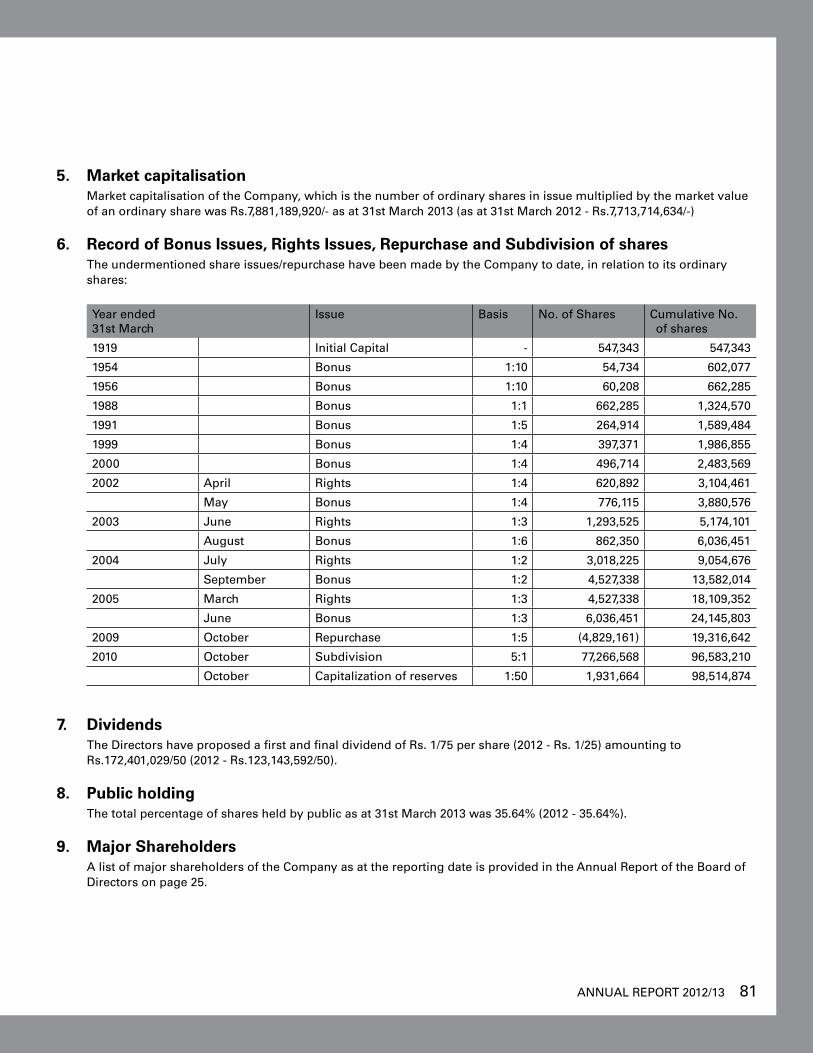
ANNUAL REPORT 2012/13 81
5. Market capitalisation Market capitalisation of the Company, which is the number of ordinary shares in issue multiplied by the market value
of an ordinary share was Rs.7,881,189,920/- as at 31st March 2013 (as at 31st March 2012 - Rs.7,713,714,634/-)
6. Record of bonus Issues, Rights Issues, Repurchase and Subdivision of shares The undermentioned share issues/repurchase have been made by the Company to date, in relation to its ordinary
shares:
Year ended 31st March
Issue Basis No. of Shares Cumulative No. of shares
1919 Initial Capital - 547,343 547,343
1954 Bonus 1:10 54,734 602,077
1956 Bonus 1:10 60,208 662,285
1988 Bonus 1:1 662,285 1,324,570
1991 Bonus 1:5 264,914 1,589,484
1999 Bonus 1:4 397,371 1,986,855
2000 Bonus 1:4 496,714 2,483,569
2002 April Rights 1:4 620,892 3,104,461
May Bonus 1:4 776,115 3,880,576
2003 June Rights 1:3 1,293,525 5,174,101
August Bonus 1:6 862,350 6,036,451
2004 July Rights 1:2 3,018,225 9,054,676
September Bonus 1:2 4,527,338 13,582,014
2005 March Rights 1:3 4,527,338 18,109,352
June Bonus 1:3 6,036,451 24,145,803
2009 October Repurchase 1:5 (4,829,161) 19,316,642
2010 October Subdivision 5:1 77,266,568 96,583,210
October Capitalization of reserves 1:50 1,931,664 98,514,874
7. Dividends The Directors have proposed a first and final dividend of Rs. 1/75 per share (2012 - Rs. 1/25) amounting to
Rs.172,401,029/50 (2012 - Rs.123,143,592/50).
8. Public holding The total percentage of shares held by public as at 31st March 2013 was 35.64% (2012 - 35.64%).
9. Major Shareholders A list of major shareholders of the Company as at the reporting date is provided in the Annual Report of the Board of
Directors on page 25.
82 CEYLON INvESTMENT PLC
Notice of Meeting
NOTICE IS HEREbY GIVEN that the Sixty Seventh Annual General Meeting of Ceylon Investment PLC will be held on Tuesday, the 30th day of July 2013 at 9.30 a.m. at The Kingsbury Hotel, "The Balmoral” Ballroom, No.48, Janadhipathi Mawatha, Colombo 1 for the following purposes :
1. To receive and adopt the Annual Report of the Board of Directors and the Financial Statements for the year ended 31st March 2013, together with the Independent Auditors’ Report thereon.
2. To declare a dividend as recommended by the Directors.
3. To re-elect Mr.D.C.R. Gunawardena who retires by rotation in terms of Articles 89, 90 and 91 of the Articles of Association of the Company.
4. To re-elect Mr.K. Selvanathan who retires by rotation in terms of Articles 89, 90 and 91 of the Articles of Association of the Company.
5. To re-appoint Mr.I. Paulraj as a Director of the Company who is over Seventy years of age and to consider and if deemed fit to pass the following resolution:
“IT IS HEREBY RESOLvED that the age limit stipulated in Section 210 of the Companies Act No. 07 of 2007 shall not be applicable to Mr.I. Paulraj who is 76 years of age and that he be re-appointed a Director of the Company from the conclusion of the Annual General Meeting for a further period of one year”.
6. To re-appoint Mr.A de Z. Gunasekera as a Director of the Company who is over Seventy years of age and to consider and if deemed fit to pass the following resolution:
“IT IS HEREBY RESOLvED that the age limit stipulated in Section 210 of the Companies Act No. 07 of 2007 shall not be applicable to Mr.A. de Z. Gunasekera who is 73 years of age and that he be re-appointed a Director of the Company from the conclusion of the Annual General Meeting for a further period of one year”.
7. To re-appoint Messrs. KPMG, Chartered Accountants as Auditors of the Company as set out in Section 154(1) of the Companies Act No. 07 of 2007 and to authorize the Directors to determine their remuneration.
By Order of the Board
(Sgd).k.D.de Silva (Mrs.)DirectorCARSONS MANAGEMENT SERVICES (PRIVATE) LIMITEDSecretaries
Colombo, 18th June 2013
Notes :
1. A member is entitled to appoint a proxy to attend and vote instead of him/herself. A proxy need not be a member of the Company. A Form of Proxy accompanies this Notice.
2. The completed Form of Proxy must be deposited at the Registered Office, No.61, Janadhipathi Mawatha, Colombo 1, not later than 9.30 a.m. on 28th July 2013.
3. A person representing a Corporation is required to carry a certified copy of the resolution authorizing him/ her to act as the representative of the Corporation. A representative need not be a member.
4. The transfer books of the Company will remain open.
5. Security Check - We shall be obliged if the shareholders/proxies attending the Annual General Meeting, produce their National Identity Card to the security personnel stationed at the entrance lobby.
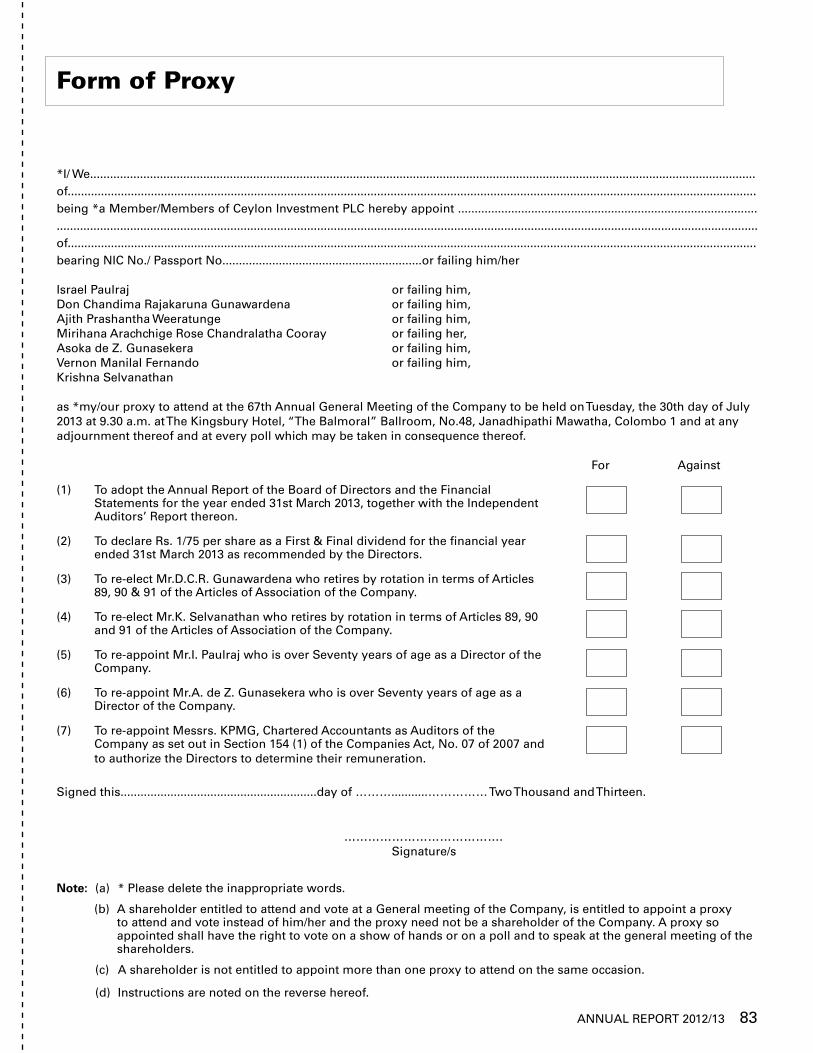
ANNUAL REPORT 2012/13 83
Form of Proxy
*I/ We........................................................................................................................................................................................................of...............................................................................................................................................................................................................being *a Member/Members of Ceylon Investment PLC hereby appoint ............................................................................................................................................................................................................................................................................................................ of...............................................................................................................................................................................................................bearing NIC No./ Passport No............................................................or failing him/her
Israel Paulraj or failing him,Don Chandima Rajakaruna Gunawardena or failing him,Ajith Prashantha Weeratunge or failing him,Mirihana Arachchige Rose Chandralatha Cooray or failing her,Asoka de Z. Gunasekera or failing him,vernon Manilal Fernando or failing him,Krishna Selvanathan
as *my/our proxy to attend at the 67th Annual General Meeting of the Company to be held on Tuesday, the 30th day of July 2013 at 9.30 a.m. at The Kingsbury Hotel, “The Balmoral” Ballroom, No.48, Janadhipathi Mawatha, Colombo 1 and at any adjournment thereof and at every poll which may be taken in consequence thereof. For Against
(1) To adopt the Annual Report of the Board of Directors and the Financial Statements for the year ended 31st March 2013, together with the Independent Auditors’ Report thereon.
(2) To declare Rs. 1/75 per share as a First & Final dividend for the financial year ended 31st March 2013 as recommended by the Directors.
(3) To re-elect Mr.D.C.R. Gunawardena who retires by rotation in terms of Articles 89, 90 & 91 of the Articles of Association of the Company.
(4) To re-elect Mr.K. Selvanathan who retires by rotation in terms of Articles 89, 90 and 91 of the Articles of Association of the Company.
(5) To re-appoint Mr.I. Paulraj who is over Seventy years of age as a Director of the Company.
(6) To re-appoint Mr.A. de Z. Gunasekera who is over Seventy years of age as a Director of the Company.
(7) To re-appoint Messrs. KPMG, Chartered Accountants as Auditors of the Company as set out in Section 154 (1) of the Companies Act, No. 07 of 2007 and to authorize the Directors to determine their remuneration.
Signed this...........................................................day of ………...........…………… Two Thousand and Thirteen.
…………………………………. Signature/s
Note: (a) * Please delete the inappropriate words.
(b) A shareholder entitled to attend and vote at a General meeting of the Company, is entitled to appoint a proxy to attend and vote instead of him/her and the proxy need not be a shareholder of the Company. A proxy so appointed shall have the right to vote on a show of hands or on a poll and to speak at the general meeting of the shareholders.
(c) A shareholder is not entitled to appoint more than one proxy to attend on the same occasion.
(d) Instructions are noted on the reverse hereof.

84 CEYLON INvESTMENT PLC
INSTRUCTIONS AS TO COMPLETION
1. Kindly perfect the form of proxy after filling in legibly your full name and address, by signing in the space provided. Please fill in the date of signature.
2. If you wish to appoint a person other than the Directors as your proxy, please insert the relevant details in the space provided overleaf.
3. In terms of Article 71 of the Articles of Association of the Company:
The instrument appointing a proxy shall be in writing and :
(i) in the case of an individual shall be signed by the appointor or by his attorney; and
(ii) in the case of a corporation shall be either under its common seal or signed by its attorney or by an officer on behalf of the corporation.
The Company may, but shall not be bound to, require evidence of the authority of any such attorney or officer. A proxy need not be a member of the Company.
4. In terms of Article 66 of the Articles of Association of the Company:
In the case of joint-holders of a share, the senior who tenders a vote, whether in person or by proxy or by attorney or by representative, shall be accepted to the exclusion of the votes of the other joint-holders and for this purpose seniority shall be determined by the order in which the names stand in the Register of members in respect of the joint holding.
5. To be valid the completed form of proxy should be deposited at the Registered Office of the Company situated at No. 61, Janadhipathi Mawatha, Colombo 1 not later than 9.30 a.m. on 28th July 2013.
Please fill in the following details:
Name : ………………………………………………………….……….
Address : ………………………………………………………….……….
………………………………………………………….……….
Jointly with : ………………………………………………………….……….
Share Folio No. : ………………………………………………………….……….
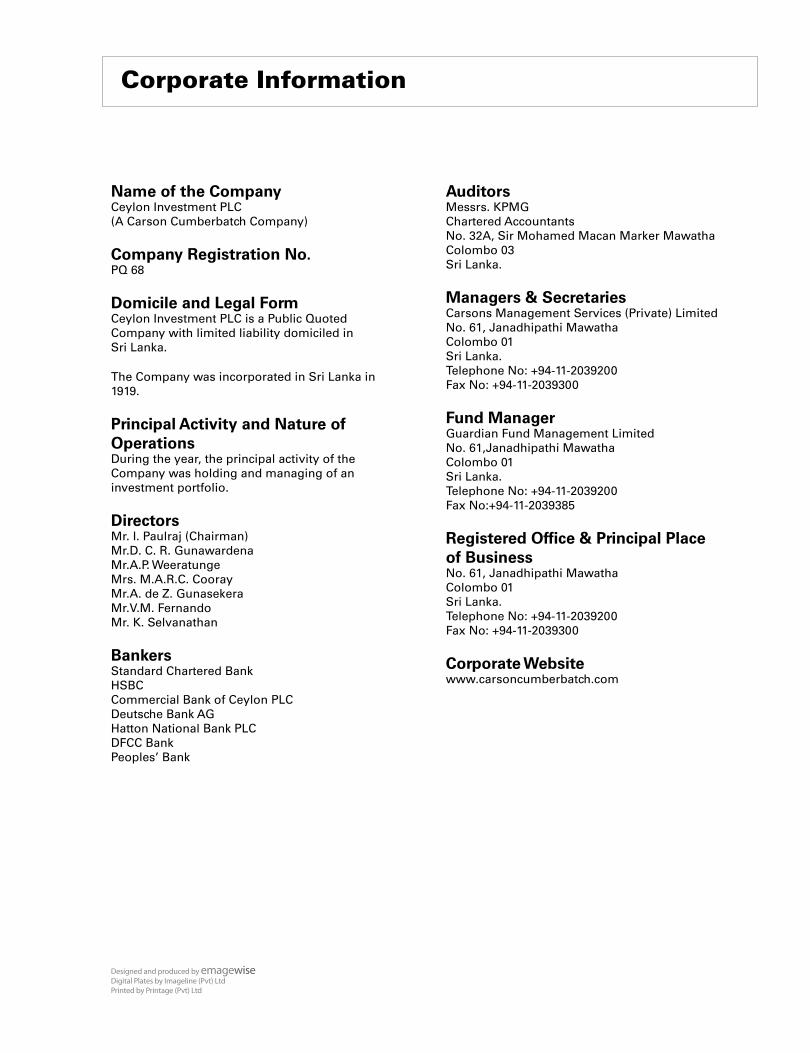
Contents Corporate Information
Name of the CompanyCeylon Investment PlC(A Carson Cumberbatch Company)
Company Registration No.PQ 68
Domicile and Legal Form Ceylon Investment PlC is a Public Quoted Company with limited liability domiciled in sri lanka.
the Company was incorporated in sri lanka in 1919.
Principal Activity and Nature of OperationsDuring the year, the principal activity of the Company was holding and managing of an investment portfolio.
Directorsmr. I. Paulraj (Chairman) mr.D. C. R. Gunawardenamr.A.P. Weeratungemrs. m.A.R.C. Cooray mr.A. de Z. Gunasekeramr.v.m. Fernando mr. K. selvanathan
Bankersstandard Chartered Bank HsBCCommercial Bank of Ceylon PlC Deutsche Bank AGHatton national Bank PlCDFCC Bank Peoples’ Bank
Auditors messrs. KPmG Chartered Accountantsno. 32A, sir mohamed macan marker mawatha Colombo 03sri lanka.
Managers & SecretariesCarsons management services (Private) limited no. 61, Janadhipathi mawathaColombo 01 sri lanka.telephone no: +94-11-2039200 Fax no: +94-11-2039300
Fund ManagerGuardian Fund management limited no. 61,Janadhipathi mawatha Colombo 01sri lanka.telephone no: +94-11-2039200Fax no:+94-11-2039385
Registered Office & Principal Place of Businessno. 61, Janadhipathi mawatha Colombo 01sri lanka.telephone no: +94-11-2039200 Fax no: +94-11-2039300
Corporate Websitewww.carsoncumberbatch.com
Designed and produced by emagewiseDigital Plates by Imageline (Pvt) Ltd Printed by Printage (Pvt) Ltd
Financial Highlights 1
Chairman’s statement 2
managers’ Review 4
Risk management 14
Annual Report of the Board of Directors on the
Affairs of the Company 19
Profiles of the Directors 26
management team Profile 28
Audit Committee Report 29
Financial Information 31
Independent Auditors’ Report 32
statement of Comprehensive Income 33
statement of Financial Position 34
statement of Changes in equity 35
Cash Flow statement 36
notes to the Financial statements 37
Five year summary 73
Us$ Financials 75
Information to shareholders and Investors 80
notice of meeting 82
Form of Proxy 83

Annual Report 2012/13
Ceylon Investment PlC
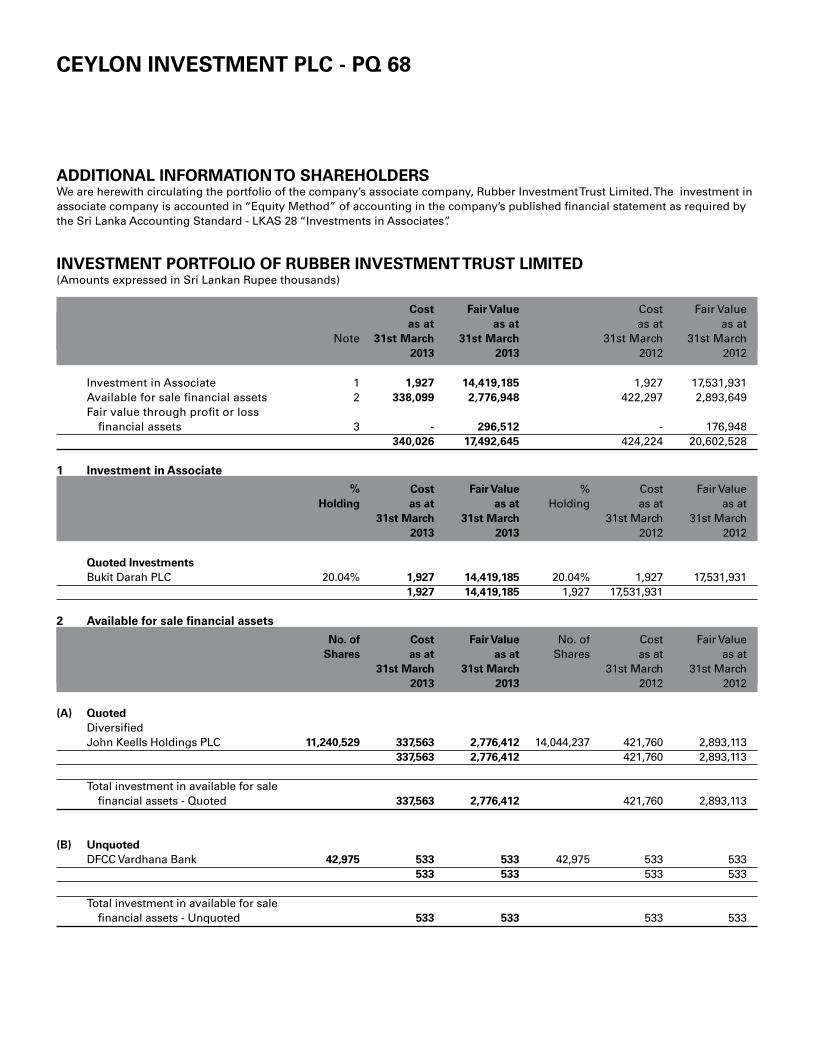
CEYLON INVESTMENT PLC - PQ 68
ADDITIONAL INFORMATION TO SHAREHOLDERS We are herewith circulating the portfolio of the company’s associate company, Rubber Investment Trust Limited. The investment in associate company is accounted in “Equity Method” of accounting in the company’s published financial statement as required by the Sri Lanka Accounting Standard - LKAS 28 “Investments in Associates”.
INVESTMENT PORTFOLIO OF RUBBER INVESTMENT TRUST LIMITED (Amounts expressed in Sri Lankan Rupee thousands)
Cost Fair Value Cost Fair Value as at as at as at as at Note 31st March 31st March 31st March 31st March 2013 2013 2012 2012
Investment in Associate 1 1,927 14,419,185 1,927 17,531,931 Available for sale financial assets 2 338,099 2,776,948 422,297 2,893,649 Fair value through profit or loss
financial assets 3 - 296,512 - 176,948 340,026 17,492,645 424,224 20,602,528 1 Investment in Associate
% Cost Fair Value % Cost Fair Value Holding as at as at Holding as at as at 31st March 31st March 31st March 31st March 2013 2013 2012 2012
Quoted Investments Bukit Darah PLC 20.04% 1,927 14,419,185 20.04% 1,927 17,531,931 1,927 14,419,185 1,927 17,531,931 2 Available for sale financial assets
No. of Cost Fair Value No. of Cost Fair Value Shares as at as at Shares as at as at 31st March 31st March 31st March 31st March 2013 2013 2012 2012
(A) Quoted Diversified John Keells Holdings PLC 11,240,529 337,563 2,776,412 14,044,237 421,760 2,893,113 337,563 2,776,412 421,760 2,893,113 Total investment in available for sale
financial assets - Quoted 337,563 2,776,412 421,760 2,893,113 (B) Unquoted DFCC Vardhana Bank 42,975 533 533 42,975 533 533 533 533 533 533 Total investment in available for sale
financial assets - Unquoted 533 533 533 533
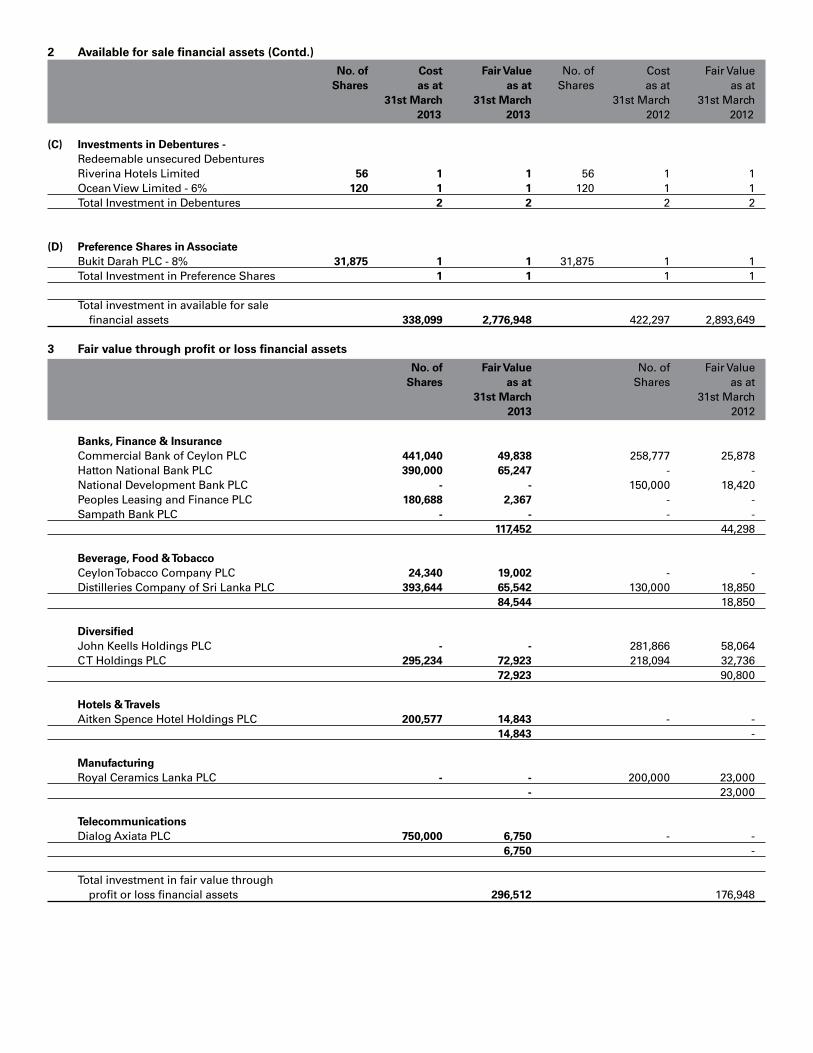
2 Available for sale financial assets (Contd.)
No. of Cost Fair Value No. of Cost Fair Value Shares as at as at Shares as at as at 31st March 31st March 31st March 31st March 2013 2013 2012 2012
(C) Investments in Debentures - Redeemable unsecured Debentures Riverina Hotels Limited 56 1 1 56 1 1 Ocean View Limited - 6% 120 1 1 120 1 1 Total Investment in Debentures 2 2 2 2 (D) Preference Shares in Associate Bukit Darah PLC - 8% 31,875 1 1 31,875 1 1 Total Investment in Preference Shares 1 1 1 1 Total investment in available for sale
financial assets 338,099 2,776,948 422,297 2,893,649 3 Fair value through profit or loss financial assets
No. of Fair Value No. of Fair Value Shares as at Shares as at 31st March 31st March 2013 2012
Banks, Finance & Insurance Commercial Bank of Ceylon PLC 441,040 49,838 258,777 25,878 Hatton National Bank PLC 390,000 65,247 - - National Development Bank PLC - - 150,000 18,420 Peoples Leasing and Finance PLC 180,688 2,367 - - Sampath Bank PLC - - - - 117,452 44,298 Beverage, Food & Tobacco Ceylon Tobacco Company PLC 24,340 19,002 - - Distilleries Company of Sri Lanka PLC 393,644 65,542 130,000 18,850 84,544 18,850 Diversified John Keells Holdings PLC - - 281,866 58,064 C T Holdings PLC 295,234 72,923 218,094 32,736 72,923 90,800 Hotels & Travels Aitken Spence Hotel Holdings PLC 200,577 14,843 - - 14,843 - Manufacturing Royal Ceramics Lanka PLC - - 200,000 23,000 - 23,000 Telecommunications Dialog Axiata PLC 750,000 6,750 - - 6,750 - Total investment in fair value through
profit or loss financial assets 296,512 176,948