Embed Size (px)
Citation preview
CERN PS BOOSTER TRANSVERSE DAMPER: 10 kHZ - 200 MHZ
RADIATION TOLERANT AMPLIFIER FOR CAPACITIVE PU SIGNAL
CONDITIONING
A. Meoli∗, A. Blas, R. Louwerse, CERN, Geneva, Switzerland
Abstract
After connection to the LINAC4, the beam intensity in
the PS Booster is expected to double and thus, an upgrade
of the head electronics of the transverse feedback BPM is
necessary. In order to cover the beam spectrum for an ef-
fective transverse damping, the pickup (PU) signal should
have a large bandwidth on both the low and high frequency
sides. Furthermore, in order to extend the natural low fre-
quency cut-off from 6 MHz (50 � load) down to the required
10 kHz, with no modification of the existing PUs, a high
impedance signal treatment is required. The electronic parts
should withstand the radiation dose received during at least
a year of service. This constraint implies the installation
of the amplifier at a remote location. A solution was found
inspired by the technique of oscilloscopes’ high impedance
probes that mitigates the effect of transmission line mismatch
using a lossy coaxial cable with an appropriate passive cir-
cuitry. A new large bandwidth, radiation tolerant amplifier
has been designed. The system requirements, the analysis,
the measurements with the present PUs, the design of the
amplifier and the experimental results are described in this
contribution.
INTRODUCTION
New pick-up (PU) head amplifiers are needed in the CERN
PSB (Proton Synchrotron Booster) for the specific needs of
the transverse feedback (TFB) system. This latter feedback
was installed in order to damp transverse instability of the
beam and it is fully operational with the present beam as
injected from the LINAC2 (linear accelerator).
As shown in the Table 1, in 2018 a higher beam intensity
(factor 2.5 increase) is expected from the new LINAC4. This
will mean a higher voltage on the beam position pick-up
installed in the ring and a potential saturation or destruction
of the head amplifiers presently installed.
The beam spectrum, as sensed by the beam PUs, is pop-
ulated at the harmonics of the revolution frequency and at
so-called betatron side bands (amplitude modulation) around
the revolution lines. The transverse betatron motion is in-
herently due to the architecture of a synchrotron where the
beam experiences a certain number of transverse oscilla-
tions at each turn (revolution). This number of oscillations
is called the tune and it is a non-integer value (Q.q) with a
fractional part q. The side-bands observed in the transverse
error signal, calculated as the difference of signals from two
opposite pick-up up electrodes of a given H or V plane, are
located q·f rev apart from each of the revolution harmonics.
f rev is the beam revolution frequency. With minimum values
of q = 0.1 and frev = 1 MHz, the lowest frequency betatron
band is located at 100 kHz.
In order to have a good damping rate at 100 kHz, the phase
error at this frequency should be minimal; this is why a low-
frequency −3 dB cut-off pole is requested at 10 kHz. On the
higher end of the spectrum, the limit is mainly technological.
The head amplifier is required to have the widest possible
bandwidth considering the potential high frequency insta-
bilities. Nevertheless, our present limited knowledge of the
machine impedance does not allow for precise specifications
in that direction, so we are aiming at amplifiers having a
bandwidth equivalent to what the PU itself can supply.
Table 1: CERN PSB Machine Parameters with LINAC4
Proton kinetic energy, Ek 160 MeV→ 2 GeV
Velocity factor, β 0.533→ 0.948
Revolution frequency, f rev 1 MHz→ 1.8 MHz
Maximum protons per bunch, Np 2.5 · 1013 ppb
Minimum bunch length, 4σ ≈150 ns
PICK-UP
The pick-up is using 4 conductive plates engraved on the
inner surface of a ceramic tube inside which the beam will
flow. This ceramic tube is enshrined inside a cylindrical
stainless steel tube. The capacitance between each plate of
the PU and its grounded support is measured to be around
630 pF. Under the presence of beam, the PU plate can be
represented as a current generator [1] feeding the electrode
capacitance in parallel with the monitoring circuit load.
Figure 1: CST PU Model.
Proceedings of IBIC2016, Barcelona, Spain TUPG04
BPMs and Beam Stability
ISBN 978-3-95450-177-9
315 Cop
yrig
ht©
2016
CC
-BY-
3.0
and
byth
ere
spec
tive
auth
ors

PU Bandwidth Estimation
The lowest cut-off (high-pass) frequency of the pickup,
depends on its load impedance. On the high frequency side,
the bandwidth is more difficult to predict. The bandwidth
depends on the detailed dimensions and impedances of the
setup together with the beam velocity (β).
A practical way to measure the PU response is to use
the so-called stretched wire technique that reproduces a
TEM field [2] representing, with enough precision, an ultra-
relativistic beam (β ≈ 1). A conductive wire is placed inside
the pick-up along the supposed beam trajectory, and is fed by
a swept sine-wave from a Vector Network Analyzer (VNA)
as shown in Figure 2. The induced signal is taken from the
PU electrode to the 50Ω measurement port of the VNA.
Figure 2: Test bench set-up.
In this measurement one gets the amplitude and phase
response of the PU. Both parameters are important, but the
phase is most critical as the PU is embedded in a feedback
loop where a total 90◦ phase shift corresponds to a lack
of damping and 180◦ to an unstable behaviour. From the
phase response with respect to frequency, the pure delay
contribution can be cancelled in order to focus on the non-
linear phase error that should be within ±45◦.
The PU has also been simulated with a numeric solver
(CST studio [3]) using a simplified model. As shown in Fig-
ure 3, the PU gain is flat and identical on both the measure-
ment and simulation up to 220 MHz and the measured non-
linear phase is within the ±45◦ boundaries up to 320 MHz
when β = 1.
Figure 3: PU frequency response.
PU Signal Amplitude Estimation
Taking into account a high impedance loading in order to
limit the natural differentiating behaviour of the PU, one can
assume within the obtained bandwidth that a centred beam
will induce a voltage [4]:
VPU(t) =1
βcC·
A
2πr· Ibeam(t) (1)
Where VPU is the voltage on the PU electrode, β is the ve-
locity beam factor, c is the speed of light, C is the electrode
capacitance, r is the beam pipe radius, A is the PU electrode
surface and Ibeam is the beam current.
Table 2: Signal Amplitude Estimations
Beam parameters Radial offset VPU
4σ=150 ns, 0 mm ≈25 Vpp
Np = 2.5 · 1013 ppb 10 mm ≈30 Vpp
80 mm ≈80 Vpp
The PU sensitivity (defined as the variation of the differ-
ence signal of two opposite electrodes, due to a beam trans-
verse displacement) has been measured using the stretched
wire technique and has been found to be ≈0.2 dB/mm. This
value has been used in Figure 4 to estimate the voltage on
one PU electrode depending on the beam position expressed
in polar coordinates. The radius is the distance from the
centre trajectory and the angle is expressed with respect to
the considered electrode azimuth.
Figure 4: PU’s electrode signal amplitude estimation.
As shown in the Figure 5, up to a 20 mm beam position
offset the PU response was measured to be linear.
Figure 5: PU Sensitivity.
TUPG04 Proceedings of IBIC2016, Barcelona, Spain
ISBN 978-3-95450-177-9
316Cop
yrig
ht©
2016
CC
-BY-
3.0
and
byth
ere
spec
tive
auth
ors
BPMs and Beam Stability
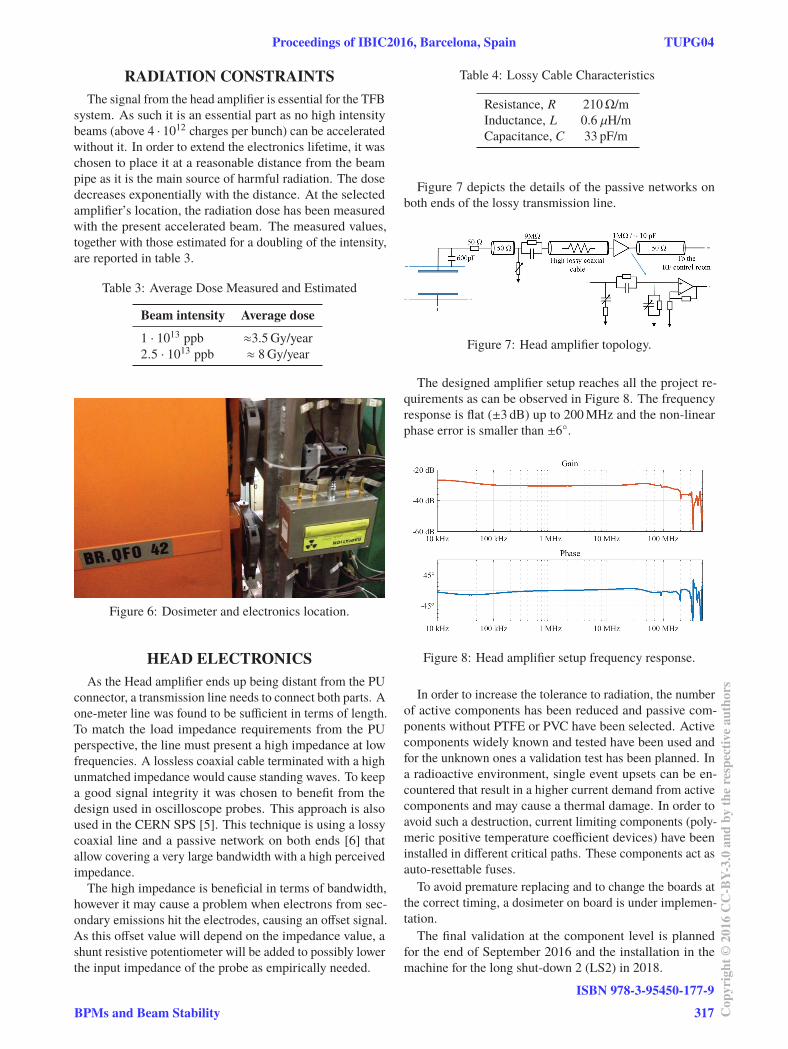
RADIATION CONSTRAINTS
The signal from the head amplifier is essential for the TFB
system. As such it is an essential part as no high intensity
beams (above 4 · 1012 charges per bunch) can be accelerated
without it. In order to extend the electronics lifetime, it was
chosen to place it at a reasonable distance from the beam
pipe as it is the main source of harmful radiation. The dose
decreases exponentially with the distance. At the selected
amplifier’s location, the radiation dose has been measured
with the present accelerated beam. The measured values,
together with those estimated for a doubling of the intensity,
are reported in table 3.
Table 3: Average Dose Measured and Estimated
Beam intensity Average dose
1 · 1013 ppb ≈3.5 Gy/year
2.5 · 1013 ppb ≈ 8 Gy/year
Figure 6: Dosimeter and electronics location.
HEAD ELECTRONICS
As the Head amplifier ends up being distant from the PU
connector, a transmission line needs to connect both parts. A
one-meter line was found to be sufficient in terms of length.
To match the load impedance requirements from the PU
perspective, the line must present a high impedance at low
frequencies. A lossless coaxial cable terminated with a high
unmatched impedance would cause standing waves. To keep
a good signal integrity it was chosen to benefit from the
design used in oscilloscope probes. This approach is also
used in the CERN SPS [5]. This technique is using a lossy
coaxial line and a passive network on both ends [6] that
allow covering a very large bandwidth with a high perceived
impedance.
The high impedance is beneficial in terms of bandwidth,
however it may cause a problem when electrons from sec-
ondary emissions hit the electrodes, causing an offset signal.
As this offset value will depend on the impedance value, a
shunt resistive potentiometer will be added to possibly lower
the input impedance of the probe as empirically needed.
Table 4: Lossy Cable Characteristics
Resistance, R 210Ω/m
Inductance, L 0.6 μH/m
Capacitance, C 33 pF/m
Figure 7 depicts the details of the passive networks on
both ends of the lossy transmission line.
Figure 7: Head amplifier topology.
The designed amplifier setup reaches all the project re-
quirements as can be observed in Figure 8. The frequency
response is flat (±3 dB) up to 200 MHz and the non-linear
phase error is smaller than ±6◦.
Figure 8: Head amplifier setup frequency response.
In order to increase the tolerance to radiation, the number
of active components has been reduced and passive com-
ponents without PTFE or PVC have been selected. Active
components widely known and tested have been used and
for the unknown ones a validation test has been planned. In
a radioactive environment, single event upsets can be en-
countered that result in a higher current demand from active
components and may cause a thermal damage. In order to
avoid such a destruction, current limiting components (poly-
meric positive temperature coefficient devices) have been
installed in different critical paths. These components act as
auto-resettable fuses.
To avoid premature replacing and to change the boards at
the correct timing, a dosimeter on board is under implemen-
tation.
The final validation at the component level is planned
for the end of September 2016 and the installation in the
machine for the long shut-down 2 (LS2) in 2018.
Proceedings of IBIC2016, Barcelona, Spain TUPG04
BPMs and Beam Stability
ISBN 978-3-95450-177-9
317 Cop
yrig
ht©
2016
CC
-BY-
3.0
and
byth
ere
spec
tive
auth
ors

Figure 9: Prototypes boards.
CONCLUSION
A head amplifier setup has been designed to measure the
beam position in the CERN PSB even when loaded with the
maximum beam intensity expected after the PSB connection
to LINAC 4. Its bandwidth extends from 10 kHz to 200
MHz thanks, at the low frequency end, to a passive probe
setup as used in commercial oscilloscopes, and on the high
frequency side, to high frequency commercial operational
amplifiers.
The distance from PU to amplifier allowed by the high
impedance probe allows for the reduction of radiation doses.
Selected radiation hardening components should further ex-
tend the circuit lifetime.
ACKNOWLEDGEMENT
The authors wish to acknowledge W. Hofle, H. Damerau,
L. Soby and J. Belleman for helpful discussions and con-
structive comments, F.G. Guillot-Vignot for the assistance
and the numerous tips concerning the stretched wire mea-
surements, S. Danzeca for the radiation level measurements
and components tests, P. Vulliez and TS-DEM for the PCB
design and manufacturing.
REFERENCES
[1] R. E. Shafer, “Beam Position Monitoring”, in Proc. AIP Con-
ference, Upton, NY, USA, Oct 1989, paper 212, 26.
[2] A. Argan, L. Palumbo, M.R. Masullo, V.G. Vaccaro, “On
the Sands and Rees Measurement Method of the Longitu-
dinal Coupling Impedance”, in Proc. Particle Accelerator
Conference, New York, USA, 1999, Volume 3, 1599.
[3] CST Studio, http://www.cst.com
[4] P. Forck, P. Kowina and D. Liakin, “Beam Position Monitors”
in CAS, CERN Accelerator School, Dourdan, France, 2008,
pp. 187.
[5] W. Hofle, R. Louwerse, private communication, Jan. 2016.
[6] J. Weber, Oscilloscope Probe Circuits. Beaverton, OR, USA:
Tektronix, 1969.
TUPG04 Proceedings of IBIC2016, Barcelona, Spain
ISBN 978-3-95450-177-9
318Cop
yrig
ht©
2016
CC
-BY-
3.0
and
byth
ere
spec
tive
auth
ors
BPMs and Beam Stability


![ACATacat.or.th/download/acat_or_th/journal-4/04 - 04.pdf · APmin APmax Appendix G [1] AP APmax Overpressure Relief Damper Damper 12 Relief Damper Relief Damper (Vent) Fire Damper](https://img.dokumen.tips/doc/110x75/5f7cb481641db55595223717/-04pdf-apmin-apmax-appendix-g-1-ap-apmax-overpressure-relief-damper-damper.jpg)