Embed Size (px)
Citation preview
Center for Turbulence ResearchAnnual Research Briefs 2015
103
Large-eddy simulation of fuel effect on leanblow-out in gas turbines
By L. Esclapez, P. C. Ma AND M. Ihme
1. Motivation and objectives
Motivated by the need for fuel-security and rising concerns regarding the impact ofpollutant emissions on the environment, significant research efforts have been made onutilizing alternative fuels for aviation (Maurice et al. 2001; Edwards 2007; Blakey et al.2011). Due to the long life of commercial aircraft and the required compatibility withthe present supply infrastructures, research efforts focus on the development of ‘drop-in”fuels which can be used in the existing fleet (Blakey et al. 2011). The certification ofcandidate fuels then requires to demonstrate the capability of the fuel to ensure safe andreliable ignition at altitude and the stable combustion at very lean combustions (ASTM2014). In particular, the lean blow-out (LBO) performance is especially important dueto recent emphasis on lean-combustion strategies for emission reduction.
Most of the early work on LBO focused on bluff-body flameholder configurations (Bal-lal & Lefebvre 1979). Due to limited optical access and absence of high-speed imaging,experiments were used to support the development of semi-empirical correlations to re-late LBO-criteria to equivalence ratio and other operating conditions. The review byShanbhogue et al. (2009) describes the blow-off mechanism as a two-stage stochasticprocess: as the overall equivalence ratio approaches the LBO-limit local flame extinctionoccurrences increase, and very near blow-off the flame behavior is mainly dominatedby auto-ignition with successive extinction and re-ignition of the recirculation bubble.However, studies of LBO-limits in swirl-stabilized burners, relevant for aviation gas tur-bines, are limited. Correlations have been developed for gas turbine combustors (Lefebvre1985) including the effect of swirl (Feikema et al. 1990), combustor design (Ateshkadiet al. 2000) and two-phase flow. Indeed, studies in academic swirling burners (Marinovet al. 2012; Cavaliere et al. 2013) emphasized the sensitivity of the LBO-behavior of liq-uid fueled combustor. Recently, high-speed imaging of OH∗ (Muruganandam & Seitzman2005) and simultaneous high-speed stereo-PIV and OH-PLIF measurements (Stohr et al.2011) revealed that the LBO-behavior in swirled combustors is closely related to thetemperature of the recirculation zone and the flame root dynamics. Blow-out was shownto have several precursor events, in which cold gases were captured by the recirculationzone, resulting in a reduction of heat release and a change in the flame shape. LBOwas found to occurs when the flame root was extinguished by its interaction with theprecessing-vortex core (PVC) for a duration that exceeds a PVC-period. Several studieshave been performed to quatify the effect of fuel properties on the LBO-limit in modelcombustors (Moses & Naegeli 1979; Lefebvre 1985; Lieuwen et al. 2008). These stud-ies indicate the beneficial effect of lowering the flash point and the adverse effect of anincrease in viscosity on the LBO-performance.
Since LBO is a stochastic process, comparatively few attempts have been made toevaluate the blow-out behavior through numerical simulations even though large eddysimulations (LES) have been proven relevant for the study of transient processes such

104 Esclapez, Ma & Ihme
as thermo-acoustic instabilities (Selle et al. 2004) and gas turbine ignition (Esclapezet al. 2015). LES of blow-out in a swirl-stabilized spray flame (Cavaliere et al. 2013) wasperformed by Tyliszczak et al. (2014) using the LES-CMC model. LES was shown to beable to capture the local flame extinction and the subsequent blow-out process followinga step increase of the air mass flow rate.
The objectives of the present work is to investigate the sensitivity of LBO triggered byfuel depletion to fuel properties in a well controlled but realistic referee-combustor usingLES. To this end, three fuels are selected and the effect of their properties on relevantphysicochemical processes is analyzed. Then, two fuels are used to perform transientsimulations of LBO induced by a progressive reduction of the fuel mass flow rate. Thenumerical setup is described in Section 2, followed by a description and an analysis ofthree selected fuels in Section 3. Section 4 presents numerical results of LBO and adescription of the flame dynamics close to blow-out. The paper finishes with conclusions.
2. Large-eddy simulation setup
2.1. Configuration
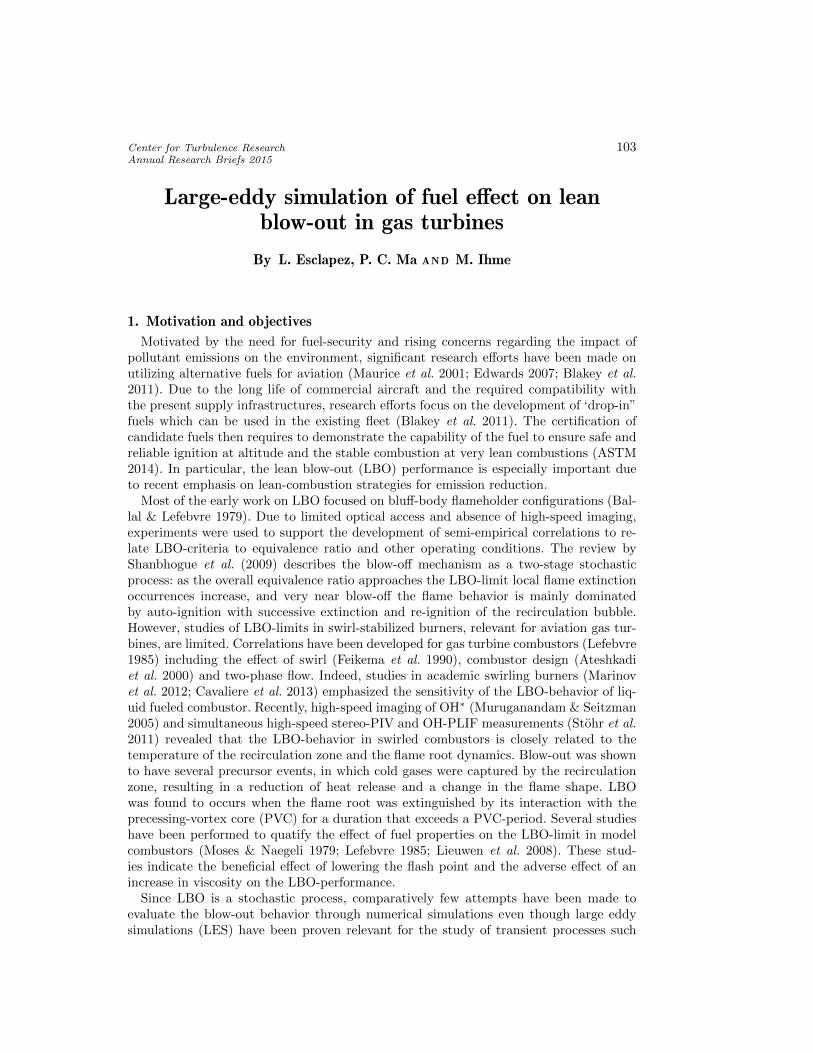
The referee-rig combustor studied in this work is installed at Air Force Research Labo-ratory (AFRL) and is designed to reproduce the main features of a realistic gas turbinecombustion chamber. The combustor is operated in a pressurized vessel with large opticalaccess to allow direct visualization of the flame. The four main components of the exper-imental configuration are included in the simulation: the large pressurized plenum, thecomplex injection system, the combustion chamber and the exhaust plenum. As shownin Figure 1 the injection system comprises two outer axial swirlers and an inner radialswirler with a pressure-swirl atomizer nested in the center. The combustor liner consistsof multi-perforated plates and 2 rows of dilution hole are located at two axial positions.The domain is discretized using 20 million elements with regular hexahedral elementsinside the combustor and tetrahedral elements are used to represent a portion of theinjector geometry. The characteristic mesh size ranges from 0.15 mm in the swirlerspassages to 0.9 mm in the downstream part of the combustor.
Near blow-out condition, the burner is fed with air at 394 K and a relative pressuredrop of 3% at a total pressure of 2.07 atms corresponding to an air mass flow rate of 392g/s. An initial fuel mass flow rate of 2.5 g/s at 322 K is supplied though the pressure-swirlatomizer, corresponding to an overall equivalence ratio φ = 0.1.
2.2. Computational parameters
Simulations are performed with the low-Mach LES-solver Vida†. The instantaneousFavre-averaged conservation equations for mass and momentum are solved on the LESgrid with a fourth/second-order accurate spacial discretization scheme on regular andunstructured meshes, respectively. A second-order predictor-corrector scheme is used fortemporal integration. Turbulent subgrid stresses are modeled with the eddy-viscositymodel of Vreman (2004). Walls are considered adiabatic non-slip and the effusive coolingis modeled through a homogeneous approach in which the effusive gas-phase velocity isdetermined from the experimentally measured mass flow rates.
The spray is modeled using a Lagrangian approach where the droplet motion is de-scribed by the Basset-Boussinesq-Oseen (BBO) equation and the evaporation rate isbased on equilibrium calculations of isolated droplets (Miller et al. 2001). Secondary
† http://www.cascadetechnologies.com/pdf/VIDA.pdf
LES of fuel effect on lean blow-out in gas turbines 105
z
x
y1
43
2
110 mm
45 mm 87 mm
1
4
3
45 mm 87 mm 135 mm
110 mmFuel
Swirlers
2
(a)
(b)
Figure 1. Computational domain (a) and details of the injection system in a x-normal centralcut plane (b). Main components: 1. Pressurized plenum, 2. Injection system, 3. Combustionchamber, 4. Exhaust plenum.
droplet break-up of Lagrangian particles into smaller drops was found to be importantsince the low injection velocity and the high flow velocity issued by the swirler resultin a large droplet Weber number (ranging between 2 and 20). Secondary breakup ismodeled by a stochastic approach where the radius of the droplets is assumed to bea time-dependent stochastic variable with a given initial-size distribution (Apte et al.2003). The critical Weber number is set to a numerical value of 6 based on experimentalobservations (Kim et al. 2014).
Combustion is modeled with the flamelet/progress-variable (FPV) approach (Pierce &Moin 2004; Ihme et al. 2005) in which the thermochemical properties are parameterize asa function of filtered mixture fraction Z, filtered reaction progress variable C and mixturefraction variance. The progress variable is defined as (Ihme et al. 2012) C = YCO2
+YCO+YH2O + YH2
. The flame structure is obtained from the solution of steady laminar non-premixed flamelet equations, which are solved along the entire S-shaped curve. Coolingeffect of the liquid phase on the flamelet solution is considered by computing an effectivegaseous fuel temperature (Moin & Apte 2006) Tfuel,g = Tfuel,l−∆hv(Tevap)/cp,l(Tevap),where ∆hv is the latent heat of evaporation and cp,l is the specific heat capacity of theliquid.
3. Fuel description
The present study considers three fuels, namely a conventional petroleum-derived Jet-A fuel (Designation: Cat-A2, POSF 10325) and two test fuels: a fuel with a very narrowboiling characteristic (Cat-C5, POSF 12345) and a fuel with low cetane number (Cat-C1,POSF 11498). Key properties and composition of the three fuels are given in Table 1.Compared to Cat-A2, Cat-C5 and Cat-C1 have a similar and higher H/C ratio respec-tively. All three fuels differ in term of molecular weight where Cat-C5 is low than theconventional fuel while Cat-C1 is significantly higher.
Chemically, Cat-C5 has a significantly higher content of branched hydrocarbons andaromatics than Cat-A2, but has almost no cycloparaffins. Cat-C1 is composed only ofiso-Paraffins with about 16% of highly branched-chain hydrocarbon (isocetane). The
106 Esclapez, Ma & Ihme
MW H/C LHV Composition (mass fraction [%])[kg/kmol] [MJ/kg] Aromatics iso-Paraffins n-Paraffins Cycloparaffins
Cat-A2 159 1.90 43.1 18.66 29.45 20.03 31.86Cat-C5 135 1.93 43.0 30.68 51.58 17.66 <0.001Cat-C1 178 2.16 43.8 <0.001 99.63 <0.001 <0.001
Table 1. Properties of fuels studied.
70
60
50
40
30
20
SM
D [
µm
]
480440400360320
Temperature [K]
SMDCat-A2 = 56 µm
SMDCat-C5 = 48 µm
SMDCat-C1 = 54 µm
Cat-A2
Cat-C5
Cat-C1
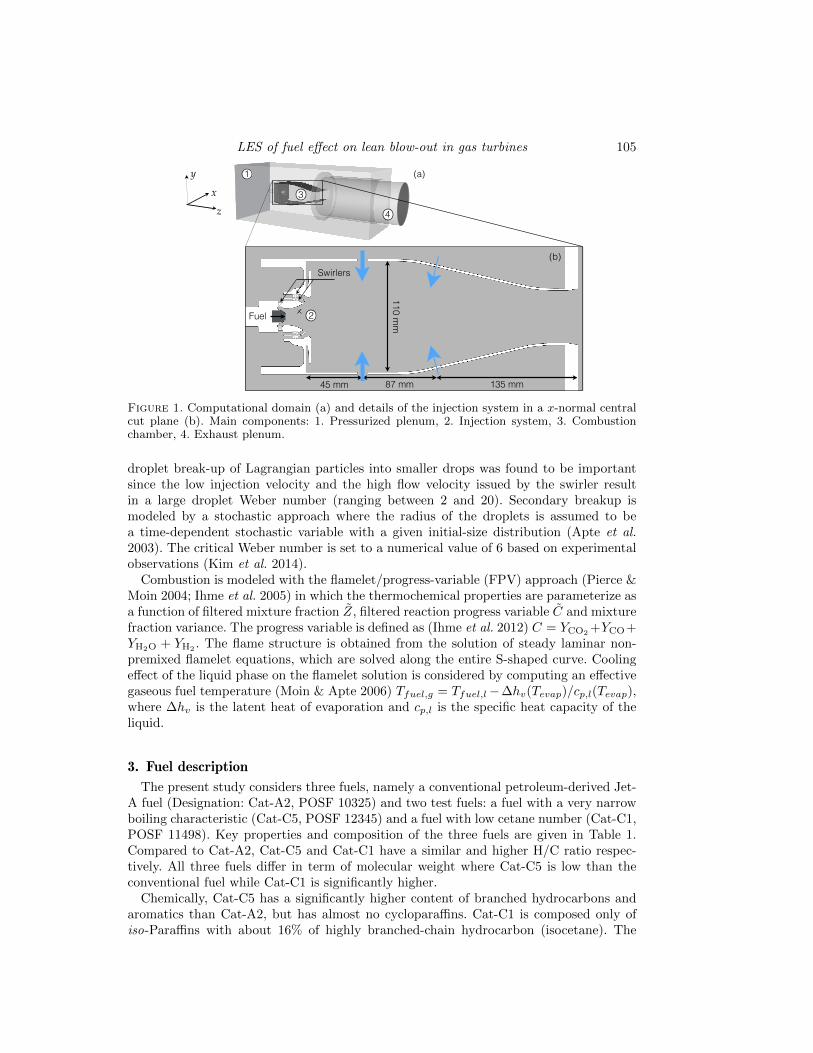
Figure 2. Comparison of injection SMD given by Lefebvre (1989) as function of liquidtemperature.
physicochemical properties and combustion chemistry models for all fuels are obtainedfrom studies conducted within the context of the National Jet Fuel Combustion Program(NJFCP) and implemented in the LES solver.
An a-priori analysis is performed to examine effects of fuel properties on droplet,combustion characteristics and LBO-behavior. Viscosity and surface tension of the liquidfuel affect the spray preparation during the primary and secondary breakup. To assess theeffect of fuel properties on the spray characteristics we employ the dimensional correlationof Lefebvre (1989) for the Sauter mean diameter (SMD)
dSMD = 2.25σ0.25L µ0.25
L m0.25L ∆P−0.5
L ρ−0.25air , (3.1)
where σL is the liquid surface tension, µL is the liquid viscosity, mL is the liquid massflow rate, ∆PL is pressure drop across the injector nozzle and ρair is the surroundinggas density. The results are provided for both fuels as a function of temperature inFigure 2. In the conditions of the present study, the lower viscosity of the Cat-C5 resultsin a smaller SMD while Cat-C1 is very close to the reference fuel. Note that for higherinjection temperature, Cat-C1 progressively diverges from Cat-A2, resulting in a lowerSMD.
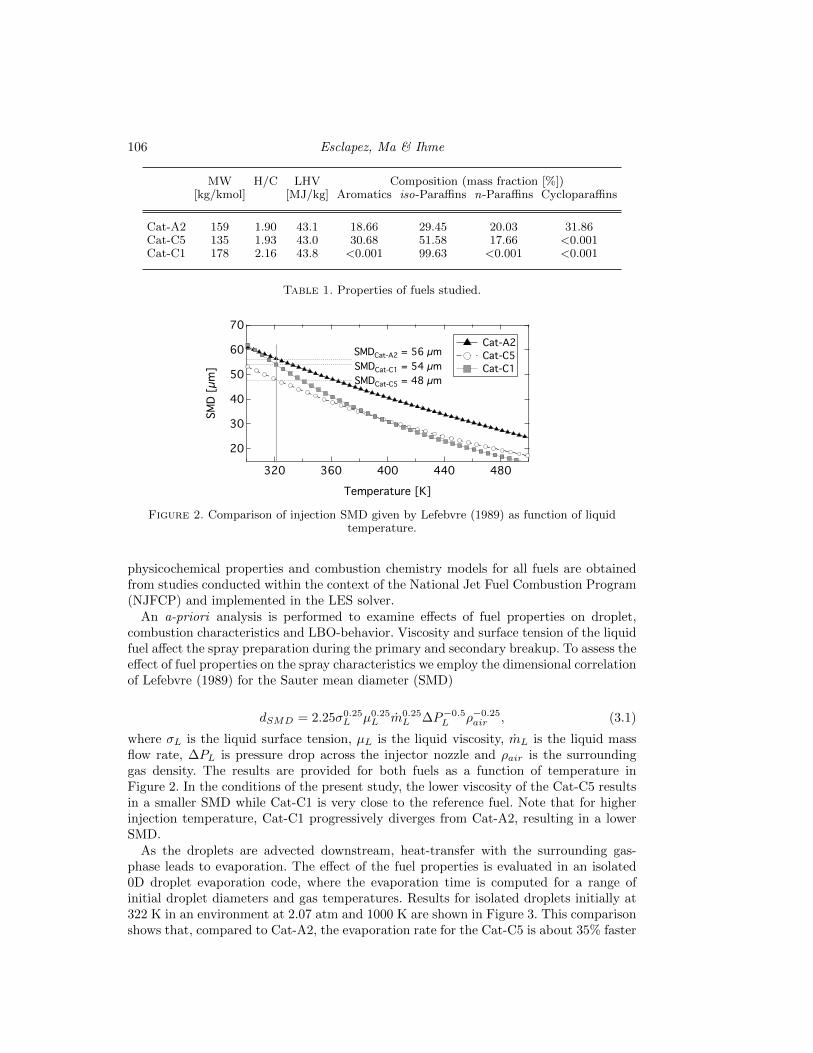
As the droplets are advected downstream, heat-transfer with the surrounding gas-phase leads to evaporation. The effect of the fuel properties is evaluated in an isolated0D droplet evaporation code, where the evaporation time is computed for a range ofinitial droplet diameters and gas temperatures. Results for isolated droplets initially at322 K in an environment at 2.07 atm and 1000 K are shown in Figure 3. This comparisonshows that, compared to Cat-A2, the evaporation rate for the Cat-C5 is about 35% faster

LES of fuel effect on lean blow-out in gas turbines 107
[ht!]
16
12
8
4
0
Evap
orat
ion
time
[ms]
80706050403020Initial droplet diameter [µm]
Cat-A2 Cat-C5 Cat-C1
Figure 3. Comparison of evaporation time at various initial droplet diameter for a dropletinitially at 322 K in a P = 2.07 atms and Tg = 1000 K environment.
2400
2000
1600
1200
800Max
imum
tem
pera
ture
[K]
0.0001 0.01 1 100 Scalar dissipation rate [s
-1]
Cat-A2 Cat-C5 Cat-C1
Figure 4. Comparison of maximum temperature in counterflow diffusion flamelets as functionof scalar dissipation rate.
while the difference is only 16% for Cat-C1. Similar differences are observed over a [700K-1400K] temperature range.
The combustion chemistry models are developed following a hybrid approach (Wanget al. 2015), in which fuel pyrolysis is described by six lumped reaction steps yieldingprimary pyrolysis products. The kinetics of these pyrolysis products are obtained fromtime-history data of shock tube and flow reactor studies. A foundational fuel chemistrymodel (USC Mech II) (Wang et al. 2010) is used to describe the oxidation kinetics of thepyrolysis products. By considering a counterflow diffusion flame configuration, relevantto the FPV-combustion model adopted in this study, chemical effects are evaluated bycomparing the S-shaped curves for the three fuels as reported in Figure 4. Throughthis study, only marginal differences on the flamelet response to strain are evidencedbetween Cat-A2 and Cat-C5 where both fuels have an extinction scalar dissipation rateof χext = 105 s−1. In contrast, a significant difference is observed between Cat-A2 andCat-C1 with the extinction rate of the latter around χext = 18 s−1.
In summary, the analysis indicates that the difference of physicochemical propertiesbetween the reference fuel Cat-A2 and the candidate test fuels primarily affects thephysical processes and the chemical kinetics for Cat-C5 and Cat-C1, respectively.

108 Esclapez, Ma & Ihme
Effusion plates Dilution holes SwirlerRow 1 Row 2 Total Radial Axial int. Axial ext.
Experiments 61.6 10.5 11.9 16.0 3.3 5.9 6.6Simulation 58.3 10.9 11.9 18.9 3.6 6.3 9.0
Table 2. Comparison of measured and computed flow split [%] between swirler, effusion platesand dilution holes.
4. Results
LES-calculation of the referee-rig are performed with Cat-A2 and Cat-C5 at a stableoperating point and during LBO triggered by fuel depletion. Before investigating thereactive flow in the referee combustor rig, statistics of velocity are collected from a non-reacting flow simulation during two flow-through-times in the primary zone and theflow split between the swirler, the dilution holes and the effusive plates is comparedto experiments. Results are summarized in Table 2, showing that the LES is able toaccurately reproduce the flow split between the primary zone and the secondary zone.
4.1. Flow characteristics at stable operating condition
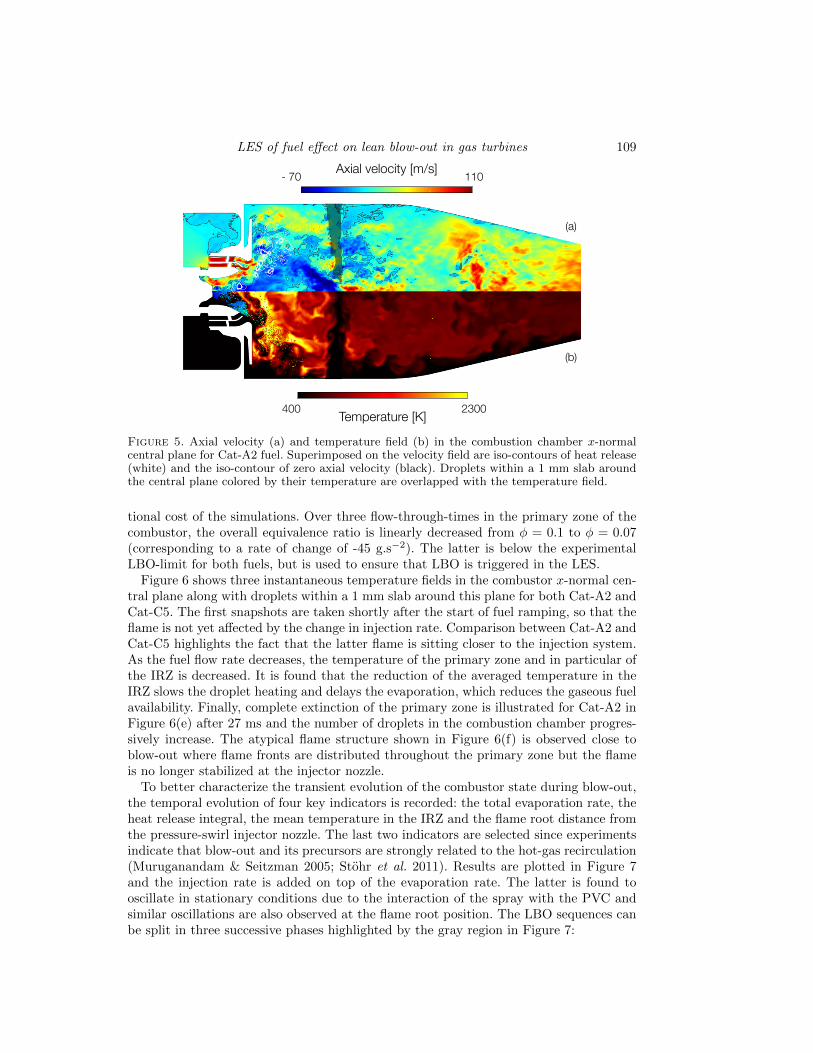
The flow field showed in Figure 5 is typical for modern combustor designs where thestrong swirl induced by the injection system results in a large inner recirculation zone(IRZ), which extends upstream within the injection system and interacts downstreamwith the first row of the dilution holes (highlighted in dark in Figure 5(a)). The flow-through-time in the primary zone (upstream of the first dilution row) is evaluated as6 ms. The IRZ advects hot gases toward the injection nozzle acting as a strong flamestabilization mechanism, but the lack of pre-vaporized fuel and the high velocity withinthe injection system result in a lifted flame. The low boiling temperature of the Cat-C5is found to allow evaporation within the injection system resulting in a global shift of theflame front toward the injector nozzle. The flame mostly lies in the shear layer betweenthe hot recirculating gases of the IRZ and the incoming fresh gases where the dropletevaporation is enhanced by the flame temperature (as shown by the white iso-contour ofheat release in Figure 5(a)). The flame is found to be significantly longer for the Cat-A2,with droplets penetrating further downstream in the primary zone as a result of theextended droplet life time. The temperature of the IRZ is much lower than the flametemperature due to the lean equivalence ratio of the primary zone (φprim = 0.18) andthe intermittent emission of fresh gases from the dilution holes.
The flame root, defined as the most upstream reacting flame front, undergoes a periodicoscillation due to the presence of the PVC. Because of the very low liquid mass flowrate near the LBO limit, the droplet injection velocity is low and droplets are rapidlyentrained by the swirling air. The spray then interacts with the PVC forming clusters ofdroplets, which leads to a periodic variation of the evaporation rate. The PVC frequency,fPV C = 1056 Hz, is evaluated using a probe (see cross in Figure 1) and this frequency isinsensitive to the fuel or equivalence ratio.
4.2. Lean blow-out
Similarly to the experimental procedure, LBO is induced by progressive fuel depletion.However, the reduction of the fuel mass flow rate in the experiments extends over tensof seconds and a larger fuel reduction rate is adopted in the LES, owing to the computa-
LES of fuel effect on lean blow-out in gas turbines 109
302520151050
x10-3
Temperature [K]
Axial velocity [m/s]
400 2300
- 70 110
(a)
(b)
Figure 5. Axial velocity (a) and temperature field (b) in the combustion chamber x-normalcentral plane for Cat-A2 fuel. Superimposed on the velocity field are iso-contours of heat release(white) and the iso-contour of zero axial velocity (black). Droplets within a 1 mm slab aroundthe central plane colored by their temperature are overlapped with the temperature field.
tional cost of the simulations. Over three flow-through-times in the primary zone of thecombustor, the overall equivalence ratio is linearly decreased from φ = 0.1 to φ = 0.07(corresponding to a rate of change of -45 g.s−2). The latter is below the experimentalLBO-limit for both fuels, but is used to ensure that LBO is triggered in the LES.
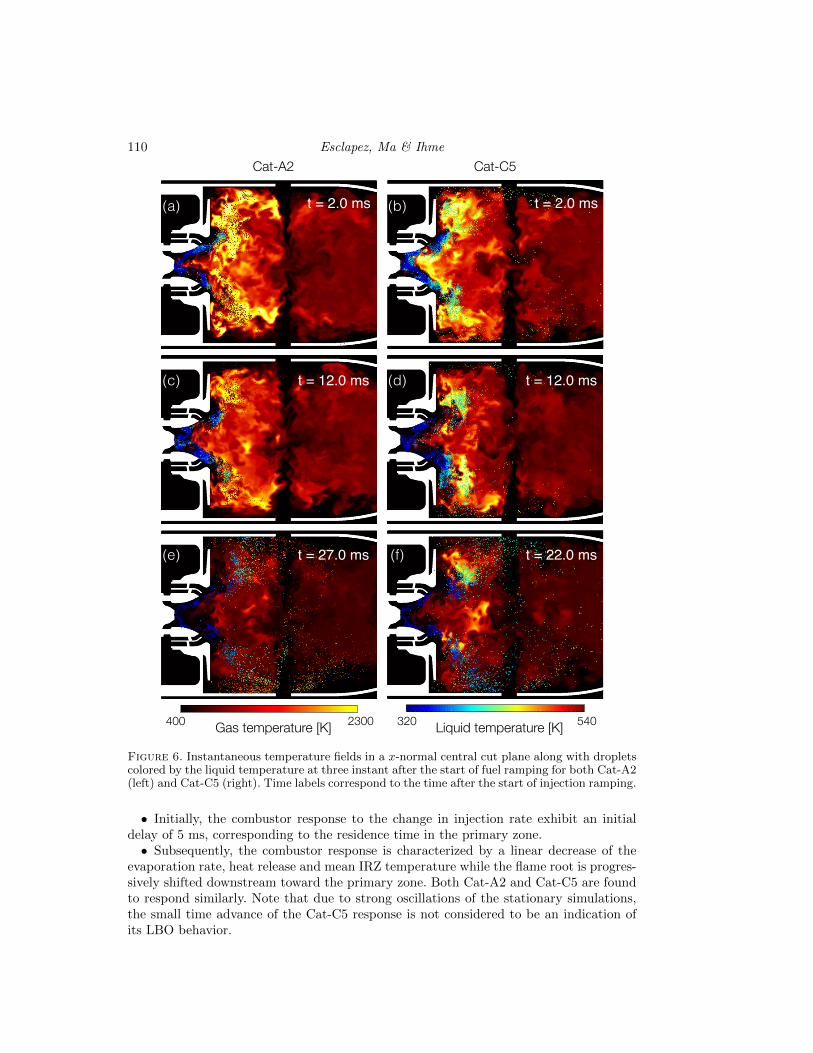
Figure 6 shows three instantaneous temperature fields in the combustor x-normal cen-tral plane along with droplets within a 1 mm slab around this plane for both Cat-A2 andCat-C5. The first snapshots are taken shortly after the start of fuel ramping, so that theflame is not yet affected by the change in injection rate. Comparison between Cat-A2 andCat-C5 highlights the fact that the latter flame is sitting closer to the injection system.As the fuel flow rate decreases, the temperature of the primary zone and in particular ofthe IRZ is decreased. It is found that the reduction of the averaged temperature in theIRZ slows the droplet heating and delays the evaporation, which reduces the gaseous fuelavailability. Finally, complete extinction of the primary zone is illustrated for Cat-A2 inFigure 6(e) after 27 ms and the number of droplets in the combustion chamber progres-sively increase. The atypical flame structure shown in Figure 6(f) is observed close toblow-out where flame fronts are distributed throughout the primary zone but the flameis no longer stabilized at the injector nozzle.
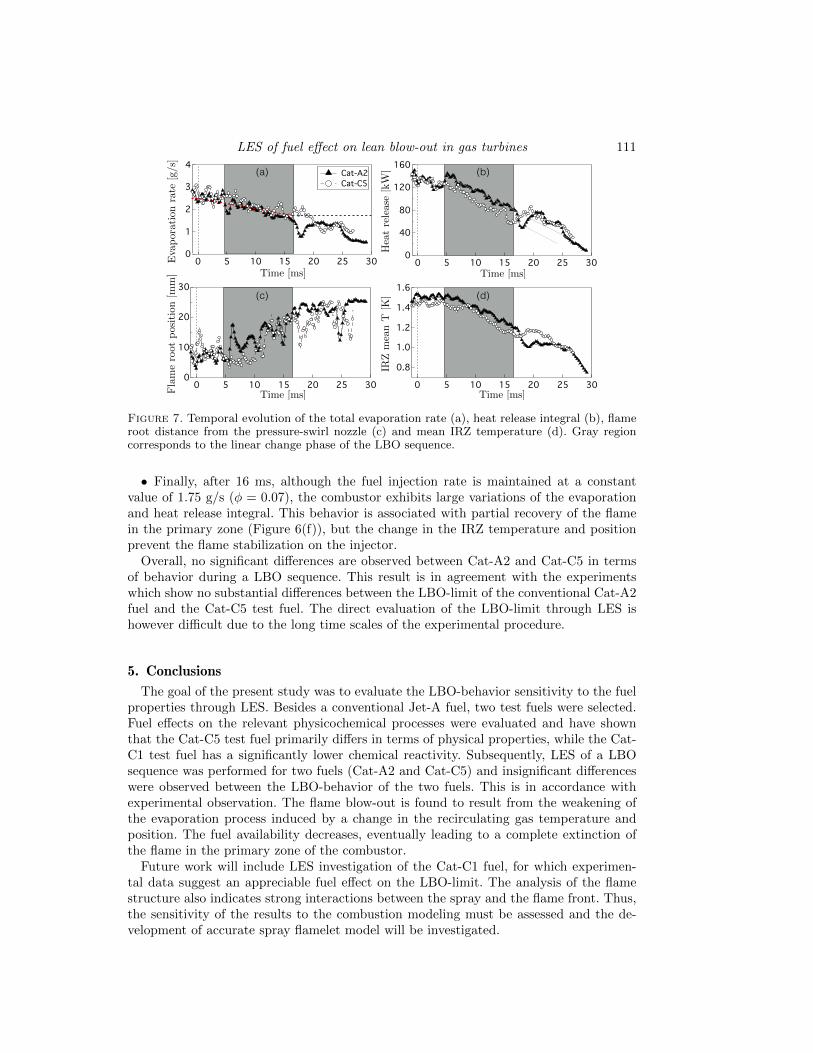
To better characterize the transient evolution of the combustor state during blow-out,the temporal evolution of four key indicators is recorded: the total evaporation rate, theheat release integral, the mean temperature in the IRZ and the flame root distance fromthe pressure-swirl injector nozzle. The last two indicators are selected since experimentsindicate that blow-out and its precursors are strongly related to the hot-gas recirculation(Muruganandam & Seitzman 2005; Stohr et al. 2011). Results are plotted in Figure 7and the injection rate is added on top of the evaporation rate. The latter is found tooscillate in stationary conditions due to the interaction of the spray with the PVC andsimilar oscillations are also observed at the flame root position. The LBO sequences canbe split in three successive phases highlighted by the gray region in Figure 7:
110 Esclapez, Ma & Ihme
302520151050
x10-3
2300400 Gas temperature [K]
Cat-A2 Cat-C5
320 540Liquid temperature [K]
(a) (b)
(c) (d)
(e) (f)
t = 2.0 ms t = 2.0 ms
t = 12.0 mst = 12.0 ms
t = 27.0 ms t = 22.0 ms
Figure 6. Instantaneous temperature fields in a x-normal central cut plane along with dropletscolored by the liquid temperature at three instant after the start of fuel ramping for both Cat-A2(left) and Cat-C5 (right). Time labels correspond to the time after the start of injection ramping.
• Initially, the combustor response to the change in injection rate exhibit an initialdelay of 5 ms, corresponding to the residence time in the primary zone.• Subsequently, the combustor response is characterized by a linear decrease of the
evaporation rate, heat release and mean IRZ temperature while the flame root is progres-sively shifted downstream toward the primary zone. Both Cat-A2 and Cat-C5 are foundto respond similarly. Note that due to strong oscillations of the stationary simulations,the small time advance of the Cat-C5 response is not considered to be an indication ofits LBO behavior.
LES of fuel effect on lean blow-out in gas turbines 111
160
120
80
40
0
Heat
rele
ase
[kW
]
302520151050Time [ms]Time [ms]
Hea
tre
leas
e[k
W]4
3
2
1
0Evap
orat
ion
rate
[g/
s]
302520151050Time [ms]
Cat-A2 Cat-C5
Time [ms]
Eva
pora
tion
rate
[g/s
]
1.6
1.4
1.2
1.0
0.8
IRZ
mea
n te
mpe
ratu
re x
103 [
K]302520151050
Time [ms]Time [ms]IR
Zm
ean
T[K
]Time [ms]F
lam
ero
otposi
tion
[mm
]
30
20
10
0
Dist
ance
from
the
noz
zle
[mm
]
302520151050Time [ms]
(c)
(a) (b)
(d)
Figure 7. Temporal evolution of the total evaporation rate (a), heat release integral (b), flameroot distance from the pressure-swirl nozzle (c) and mean IRZ temperature (d). Gray regioncorresponds to the linear change phase of the LBO sequence.
• Finally, after 16 ms, although the fuel injection rate is maintained at a constantvalue of 1.75 g/s (φ = 0.07), the combustor exhibits large variations of the evaporationand heat release integral. This behavior is associated with partial recovery of the flamein the primary zone (Figure 6(f)), but the change in the IRZ temperature and positionprevent the flame stabilization on the injector.
Overall, no significant differences are observed between Cat-A2 and Cat-C5 in termsof behavior during a LBO sequence. This result is in agreement with the experimentswhich show no substantial differences between the LBO-limit of the conventional Cat-A2fuel and the Cat-C5 test fuel. The direct evaluation of the LBO-limit through LES ishowever difficult due to the long time scales of the experimental procedure.
5. Conclusions
The goal of the present study was to evaluate the LBO-behavior sensitivity to the fuelproperties through LES. Besides a conventional Jet-A fuel, two test fuels were selected.Fuel effects on the relevant physicochemical processes were evaluated and have shownthat the Cat-C5 test fuel primarily differs in terms of physical properties, while the Cat-C1 test fuel has a significantly lower chemical reactivity. Subsequently, LES of a LBOsequence was performed for two fuels (Cat-A2 and Cat-C5) and insignificant differenceswere observed between the LBO-behavior of the two fuels. This is in accordance withexperimental observation. The flame blow-out is found to result from the weakening ofthe evaporation process induced by a change in the recirculating gas temperature andposition. The fuel availability decreases, eventually leading to a complete extinction ofthe flame in the primary zone of the combustor.
Future work will include LES investigation of the Cat-C1 fuel, for which experimen-tal data suggest an appreciable fuel effect on the LBO-limit. The analysis of the flamestructure also indicates strong interactions between the spray and the flame front. Thus,the sensitivity of the results to the combustion modeling must be assessed and the de-velopment of accurate spray flamelet model will be investigated.
112 Esclapez, Ma & Ihme
Acknowledgments
This work was funded by the US Federal Aviation Administration (FAA) Office ofEnvironment and Energy as a part of ASCENT Project National Jet Fuel CombustionProgram under FAA Award Number: 13-C-AJFE-SU-005. Any opinions, findings, andconclusions or recommendations expressed in this material are those of the authors anddo not necessarily reflect the views of the FAA and ASCENT Sponsors. The authorsgratefully acknowledge financial support from SAFRAN as well as Prof. H. Wang forproviding the chemical mechanisms, Dr. T. Edwards for the physical properties of thefuels, Dr. N. Rizk for the spray correlation and Dr. V. Sankaran for the mesh generation.
REFERENCES
Apte, S., Gorokhovski, M. & Moin, P. 2003 LES of atomizing spray with stochasticmodeling of secondary breakup. Int. J. Multiphase Flow 29 (9), 1503–1522.
Astm 2014 Standard practice for qualification and approval of new aviation turbine fuelsand fuel additives. Tech. Rep. ASTM.
Ateshkadi, A., McDonel, V. & Samuelsen, G. S. 2000 Lean blowout model for aspray-fired swirl-stabilized combustor. Proc. Comb. Inst. 28, 1281–1288.
Ballal, D. R. & Lefebvre, A. H. 1979 Ignition and flame quenching of flowingheterogeneous fuel-air mixtures. Combust. Flame 35, 155–168.
Blakey, S., Rye, L. & Wilson, C. W. 2011 Aviation gas turbine alternative fuels: Areview. Proc. Comb. Inst. 33 (2), 2863–2885.
Cavaliere, D., Kariuki, J. & Mastorakos, E. 2013 A comparison of the blow-off behaviour of swirl-stabilized premixed, non-premixed and spray flames. Flow.Turbul. Combust. 91, 347–372.
Edwards, T. 2007 Advancements in gas turbine fuels from 1943 to 2005. J. Eng. GasTurb. Power 129 (1), 13–20.
Esclapez, L., Riber, E. & Cuenot, B. 2015 Ignition probability of a partially pre-mixed burner using LES. Proc. Comb. Inst. 35 (3), 3133–3141.
Feikema, D., Chen, R.-H. & Driscoll, J. 1990 Enhancement of flame blowout limitsby the use of swirl. Combust. Flame 80 (2), 183–195.
Ihme, M., Cha, C. M. & Pitsch, H. 2005 Prediction of local extinction and re-ignitioneffects in non-premixed turbulent combustion using a flamelet/progress variable ap-proach. Proc. Combust. Inst. 30, 793–800.
Ihme, M., Shunn, L. & Zhang, J. 2012 Regularization of reaction progress variable forapplication to flamelet-based combustion models. J. Comp. Phys. 231, 7715–7721.
Kim, D., Ham, F., Le, H., Herrman, M., Li, X., Soteriou, C. & Kim, W. 2014High-fidelity simulation of atomization in a gas turbine injector high shear nozzle.In ILASS Proceedings Americas 26th Liquid Atomization and Spray Systems.
Lefebvre, A. H. 1985 Fuel effects on gas turbine combustion - ignition, stability, andcombustion efficiency. J. Eng. Gas Turb. Power 105, 24–37.
Lefebvre, A. H. 1989 Atomization and sprays, 1989. Hemisphere, New York .
Lieuwen, T., McDonell, V., Petersen, E. & Santavicca, D. 2008 Fuel flexibilityinfluences on premixed combustor blowout, flashback, autoignition, and stability. J.Eng. Gas Turb. Power 130 (1), 011506.
Marinov, S., Kern, M., Zarzalis, N., Habisreuther, P., Peschiulli, A., Tur-rini, F. & Sara, O. N. 2012 Similarity issues of kerosene and methane confined
LES of fuel effect on lean blow-out in gas turbines 113
flames stabilized by swirl in regard to the weak extinction limit. Flow. Turbul.Combust. 89, 73–95.
Maurice, L. Q., Lander, H., Edwards, T. & Harrison, W. 2001 Advanced aviationfuels: a look ahead via a historical perspective. Fuel 80 (5), 747–756.
Miller, R. S., Harstad, K. G. & Bellan, J. 2001 Direct numerical simulations ofsupercritical fluid mixing layers applied to heptane-nitrogen. J. Fluid Mech. 436,1–39.
Moin, P. & Apte, S. V. 2006 Large-eddy simulation of realistic gas turbine combustors.AIAA J. 44 (4), 698–708.
Moses, C. & Naegeli, D. 1979 Fuel property effects on combustor performance. InASME 1979 International Gas Turbine Conference and Exhibit and Solar EnergyConference.
Muruganandam, T. & Seitzman, J. 2005 Origin of lean blowout precursors in swirledgas turbine combustors. AIAA Paper 2005-1163.
Pierce, C. D. & Moin, P. 2004 Progress-variable approach for large-eddy simulationof non-premixed turbulent combustion. J. Fluid Mech. 504, 73–97.
Selle, L., Lartigue, G., Poinsot, T., Koch, R., Schildmacher, K.-U., Krebs,W., Prade, B., Kaufmann, P. & Veynante, D. 2004 Compressible large-eddysimulation of turbulent combustion in complex geometry on unstructured meshes.Combust. Flame 137 (4), 489–505.
Shanbhogue, S., Husain, S. & Lieuwen, T. 2009 Lean blowoff of bluff body stabilizedflames: Scaling and dynamics. Prog. Energy Comb. Sci. 35, 98–120.
Stohr, M., Boxx, I., Carter, C. & Meier, W. 2011 Dynamics of lean blowout ofa swirl-stabilized flame in a gas turbine model combustor. Proc. Comb. Inst. 33,2953–2960..
Tyliszczak, A., Cavaliere, D. & Mastorakos, E. 2014 LES/CMC of blow-off in aliquid fueled swirl burner. Flow. Turbul. Combust. 92, 237–267.
Vreman, A. W. 2004 An eddy-viscosity subgrid-scale model for turbulent shear flow:Algebraic theory and applications. Phys. Fluids 16 (3670).
Wang, H., Dames, E., Sirjean, B., Sheen, D. A., Tangko, R., Violi, A., Lai,J. Y. W., Egolfopoulos, F. N., Davidson, D. F., Hanson, R. K., Bow-man, C. T., Law, C. K., Tsang, W., Cernansky, N. P., Miller, D. L. &Lindstedt, R. P. 2010 A high-temperature chemical kinetic model of n-alkane (upto n-dodecane), cyclohexane, and methyl-, ethyl-, n-propyl and n-butyl-cyclohexaneoxidation at high temperatures.
Wang, H., Xu, R., Hanson, R., Davidson, D. & Bowman, C. 2015 A HyChemmodel of jet fuel combustion. Unpublished.