Embed Size (px)
Citation preview
社会经济研究中心
SOCIO-ECONOMIC
RESEARCH CENTRE
Part 3:
Carey Island’s port: Is it a “Need” or “Want” ?

Socio-Economic Research Centre
• The idea of developing Carey Island’s port was conceptualised following the remarks that
existing ports in the Port Klang area will hit maximum capacity. In early 2017, Port Klang
Authority (PKA) had announced existing ports in the area will reach maximum capacity by
2025.
• In April 2017, MMC Corporation Bhd has signed two agreements: (1) The first one with
Adani Ports and Special Economic Zone Ltd (APSEZ) to conduct a feasibility study of Carey
Island as an extension of Port Klang; and (2) Second MoU with Sime Darby Property Bhd
and APSEZ to study the feasibility of developing an integrated maritime city in Carey Island.
• In July 2018, another feasibility study under new administration will be independently
conducted and commissioned by Port Klang Authority (PKA). As of now, previous
government had not issued approval for the Carey Port. Transport Minister Anthony Loke
indicated that the project will be private initiative-driven if the Parliament approved.
• The objectives of this working paper are to provide an overview of the port development in
Carey Island and also to assess the potential of the Carey Island project that can enhance
the surrounding development.
1
Statement of objectives
Socio-Economic Research Centre 2
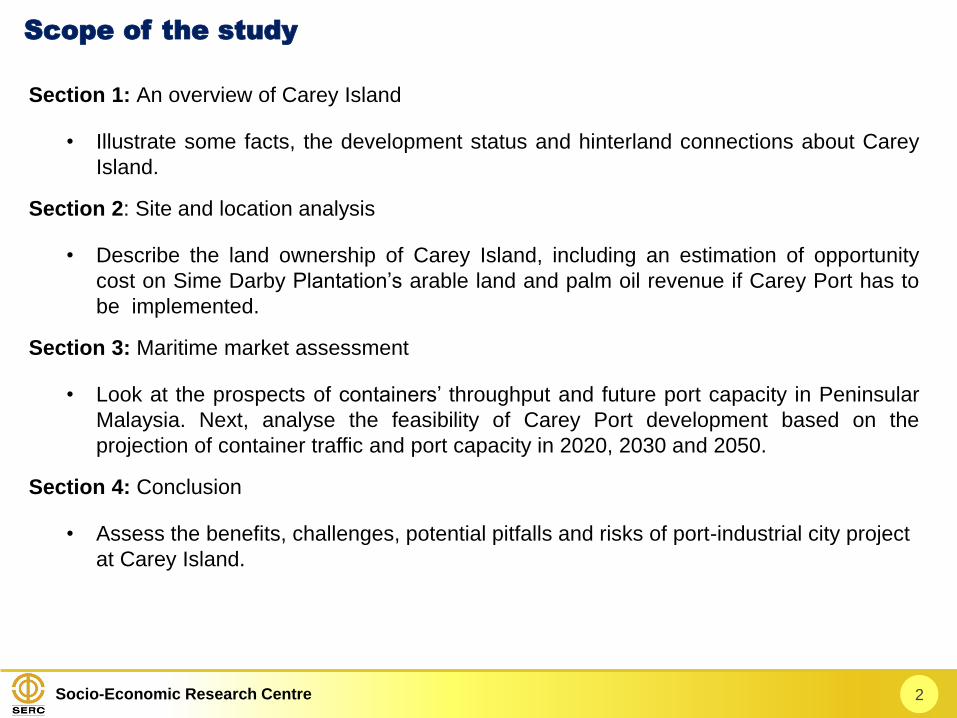
Scope of the study
Section 1: An overview of Carey Island
• Illustrate some facts, the development status and hinterland connections about Carey
Island.
Section 2: Site and location analysis
• Describe the land ownership of Carey Island, including an estimation of opportunity
cost on Sime Darby Plantation’s arable land and palm oil revenue if Carey Port has to
be implemented.
Section 3: Maritime market assessment
• Look at the prospects of containers’ throughput and future port capacity in Peninsular
Malaysia. Next, analyse the feasibility of Carey Port development based on the
projection of container traffic and port capacity in 2020, 2030 and 2050.
Section 4: Conclusion
• Assess the benefits, challenges, potential pitfalls and risks of port-industrial city project
at Carey Island.
Socio-Economic Research Centre 3
Section 1
An Overview of Carey Island
Socio-Economic Research Centre
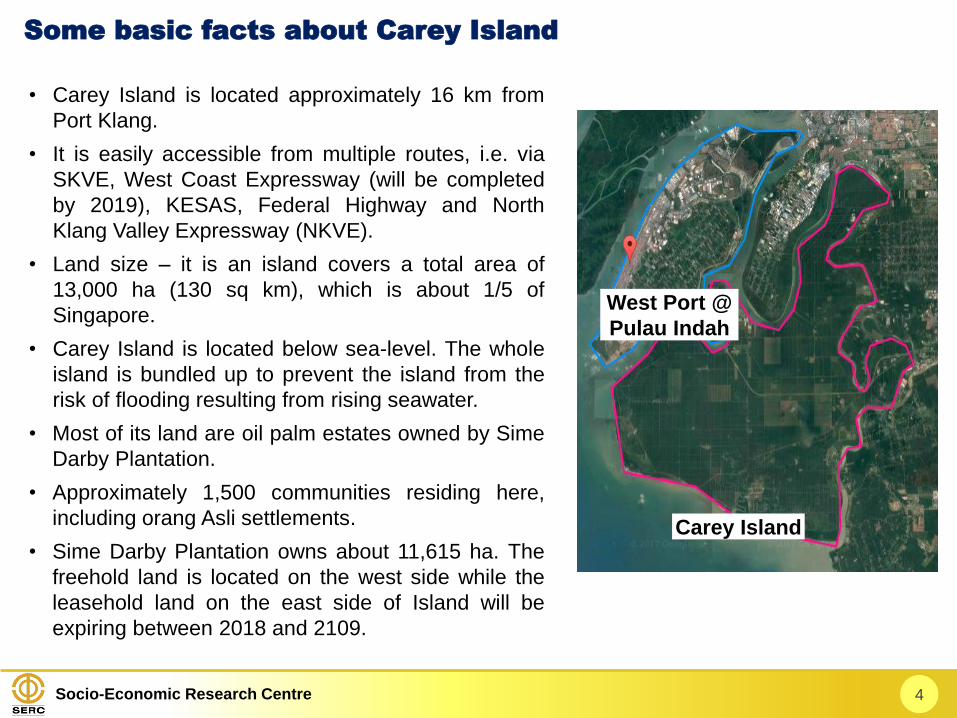
• Carey Island is located approximately 16 km from
Port Klang.
• It is easily accessible from multiple routes, i.e. via
SKVE, West Coast Expressway (will be completed
by 2019), KESAS, Federal Highway and North
Klang Valley Expressway (NKVE).
• Land size – it is an island covers a total area of
13,000 ha (130 sq km), which is about 1/5 of
Singapore.
• Carey Island is located below sea-level. The whole
island is bundled up to prevent the island from the
risk of flooding resulting from rising seawater.
• Most of its land are oil palm estates owned by Sime
Darby Plantation.
• Approximately 1,500 communities residing here,
including orang Asli settlements.
• Sime Darby Plantation owns about 11,615 ha. The
freehold land is located on the west side while the
leasehold land on the east side of Island will be
expiring between 2018 and 2109.
4
Some basic facts about Carey Island
Carey Island
West Port @
Pulau Indah
Socio-Economic Research Centre
• The idea of 3rd port for Port Klang was brought up in 2010 as part of Port Klang Master Plan
(2010-2013). Carey Island was one of the five locations identified. The other four are Pulau
Che Mat Zin, Klang Bar Channel, Old Klang Bar Channel and Kampung Batu Laut.
• The Carey Island project is aimed to create additional capacity to cater for future needs. It is
seen as a port development to overcome the nearing full capacity of West Port as well as to
develop Port Klang as a regional maritime hub on par with the dominant Singapore port.
• The 3rd port ideally would be within Port Klang area where existing Northport and Westport
are already operating. The West Port at Pulau Indah currently handles about 80% of the
TEUs cargoes of Port Klang. North Port is located next to industrial area of Bandar Sultan
Suleiman. West Port is managed by Westports Malaysia while Northport is operated by
MMC Corp Bhd.
• The Carey Island port project development has a 20-year time frame, covering an area of
over 100sq km. There are 3 phases: (i) integrated port and related infrastructure; (ii)
industrial and free trade zone; and (iii) commercial and residential buildings. The project’s
gross development value could exceed RM1 trillion.
• Two MoUs were signed in April 2017. The first one was with Adani Ports and Special
Economic Zone Ltd (APSEZ) and MMC Corporation to study the feasibility of Carey Island
as an extension of Port Klang while the second MoU was with Sime Darby Property Bhd
and APSEZ to conduct the feasibility study of developing an integrated maritime city in
Carey Island.
5
Carey Island - New port-industrial city plan
Socio-Economic Research Centre 6
• In July 2018. Port Klang Authority (PKA) was appointed as an independent consultant to
carry the study on the need for a third port. Transport Minister Anthony Loke indicated that
the port development will be driven by private initiative if Parliament approves the proposal.
• Total ballpark investment value is estimated at RM200 billion (US$45.24 billion).
Construction of port alone is expected to cost RM39.1 billion (US$9.39 billion).
• According to MMC Corporation Berhad Annual Report 2017, the port development
comprises three phases, covering 2,500 acres (1011.74ha) reclaimed area*. First phase
development plan is to build a capacity of 10 million TEUs for container operations and up
to 30 million FWTs for conventional cargo operations with the cost of RM12 billion. It is
targeted to be operational by 2028.
• The port is envisaged to have an annual capacity of 30 million TEUs. By comparison, Port
Klang port handled 11.97 million TEUs in 2017 while Singapore handled 33.6 million TEUs.
• The Annual Report also highlighted the integrated maritime city will be built on Carey’s land
with 11,000 hectares. Upon completion, the Carey Island project is expected to generate a
total of 600,000 job opportunities**, to attract RM50 billion of foreign direct investment and
to boost up RM600 billion of national trade value.
• Is developing a new third port (Carey Island) a must? Is Port Klang port’s capacity
hitting bottleneck? Northport and Westport are already in operations and Westports Bhd has
recently been given the approval to expand its container terminal. In addition, there is an
addition 20 TEUs capacity coming up from Singapore’s Tuas by 2020.
Note: * The area will has a depth of 17 metres at a distance of 2 to 3 km from the coast. ; **600,000 job opportunities consist of 100,000 direct and 500,000 indirect job
opportunities.
Socio-Economic Research Centre 7
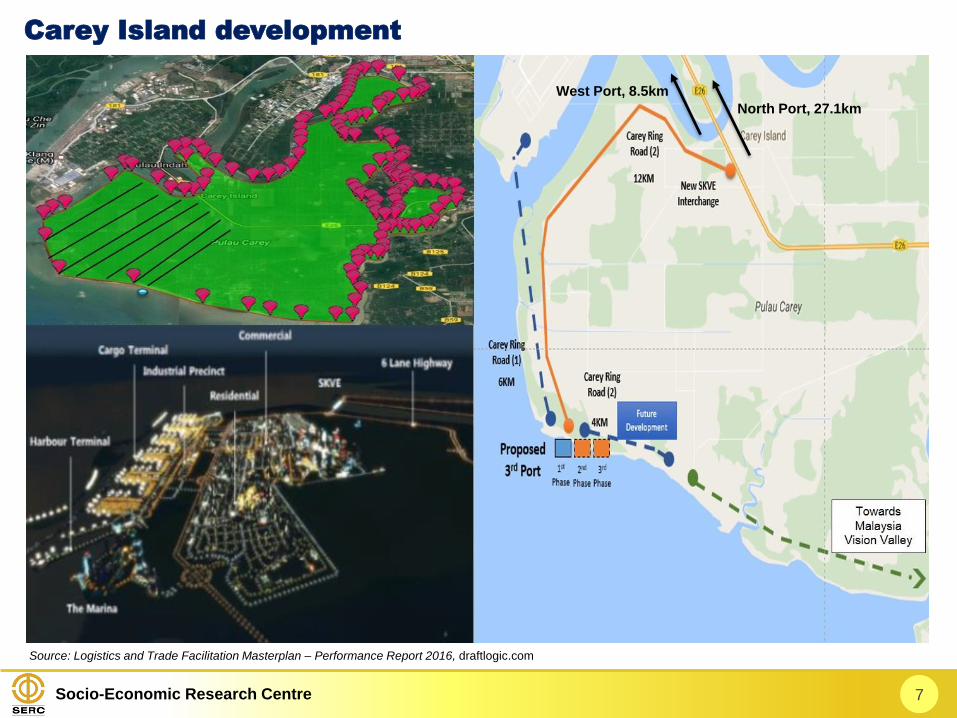
Carey Island development
Source: Logistics and Trade Facilitation Masterplan – Performance Report 2016, draftlogic.com
North Port, 27.1km
West Port, 8.5km
Socio-Economic Research Centre 8
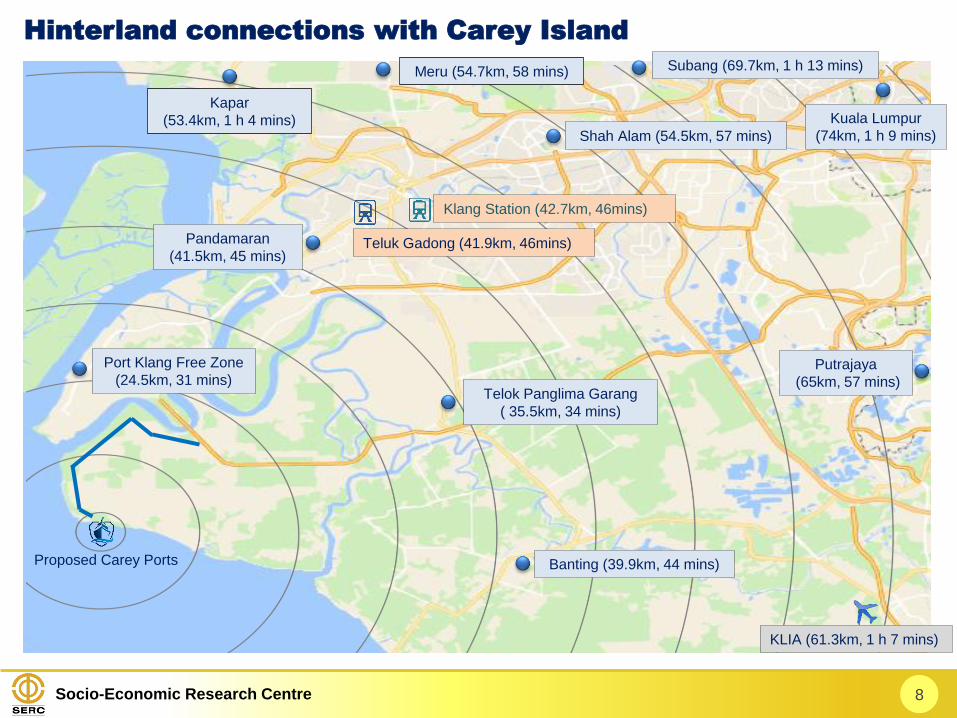
Hinterland connections with Carey Island
Klang Station (42.7km, 46mins)
Teluk Gadong (41.9km, 46mins)
Proposed Carey Ports
KLIA (61.3km, 1 h 7 mins)
Kuala Lumpur
(74km, 1 h 9 mins)
Kapar
(53.4km, 1 h 4 mins)
Meru (54.7km, 58 mins)
Shah Alam (54.5km, 57 mins)
Banting (39.9km, 44 mins)
Pandamaran
(41.5km, 45 mins)
Subang (69.7km, 1 h 13 mins)
Port Klang Free Zone
(24.5km, 31 mins)Putrajaya
(65km, 57 mins)Telok Panglima Garang
( 35.5km, 34 mins)
Socio-Economic Research Centre 9
Section 2
Site and Location Analysis

Socio-Economic Research Centre 10
Mega size Carey Island project versus Putrajaya
Putrajaya
Hectare 4,581.1
Cost US$9 billion
Carey Island
Hectare 13,000
Port-industrial city
Cost US$45 billion
Population = 330,000
Housing Units = 67,000
Population (1995-2017) = 86,900
Residential units (2017 Q4) = 10,849
1995
• Almost all Carey Island’s lands are dedicated to
oil palm plantation.
• The idea of a new port city development in Carey
Island is akin to the development of Putrajaya,
whereby the new administrative centre was
transformed from the oil palm estate of Prang
Besar in October 1996.
• The size of Carey Island is three times of
Putrajaya. Putrajaya took 22 years to boost the
population to nearly 90,000 persons today.
• The concept between these two is quite different.
The Carey Island port city is based on multiplying
economic activities such as maritime services,
trading, industries, services and property
development while Putrajaya was conceptualised
as a new administrative centre, moving Federal
administrative capital from the congested KL.
• Demand for housing and commercial properties
during the pre and post development. The
development of well connected infrastructure and
affordable housing are critical success factors for
this ambitious port-city development plan.
Achieved :
26.3% of planned population
16.1% of planned house units
Every 5 year:
19,750 population
2,465 houses
Source: Putrajaya Holding 2005, DOSM, NAPIC, Google map
Socio-Economic Research Centre
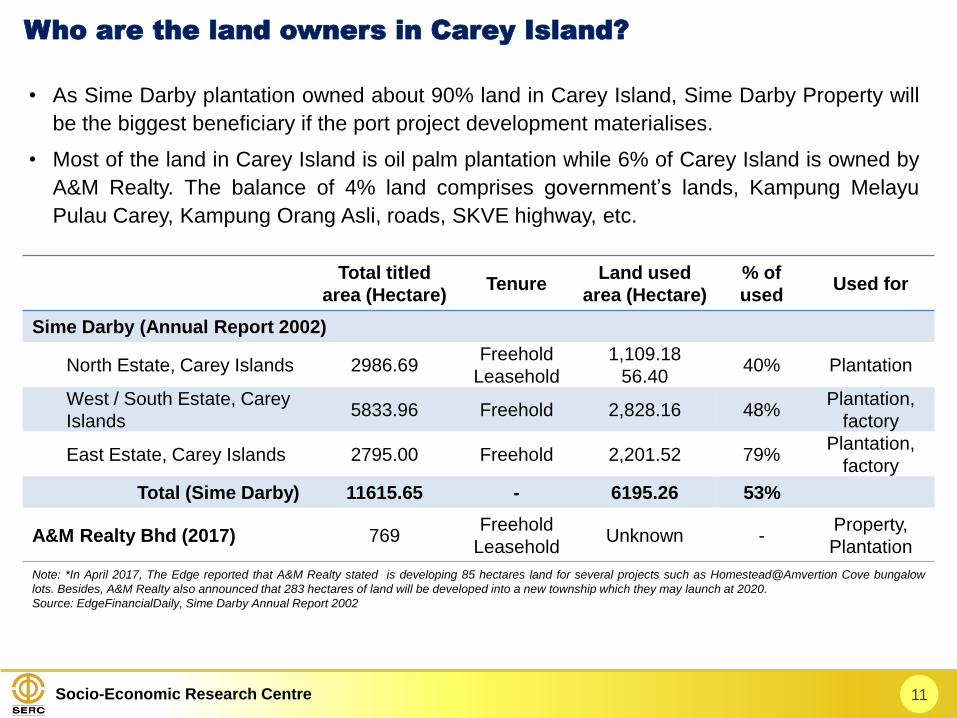
• As Sime Darby plantation owned about 90% land in Carey Island, Sime Darby Property will
be the biggest beneficiary if the port project development materialises.
• Most of the land in Carey Island is oil palm plantation while 6% of Carey Island is owned by
A&M Realty. The balance of 4% land comprises government’s lands, Kampung Melayu
Pulau Carey, Kampung Orang Asli, roads, SKVE highway, etc.
11
Who are the land owners in Carey Island?
Total titled
area (Hectare)Tenure
Land used
area (Hectare)
% of
usedUsed for
Sime Darby (Annual Report 2002)
North Estate, Carey Islands 2986.69Freehold
Leasehold
1,109.18
56.4040% Plantation
West / South Estate, Carey
Islands5833.96 Freehold 2,828.16 48%
Plantation,
factory
East Estate, Carey Islands 2795.00 Freehold 2,201.52 79%Plantation,
factory
Total (Sime Darby) 11615.65 - 6195.26 53%
A&M Realty Bhd (2017) 769Freehold
LeaseholdUnknown -
Property,
Plantation
Note: *In April 2017, The Edge reported that A&M Realty stated is developing 85 hectares land for several projects such as Homestead@Amvertion Cove bungalow
lots. Besides, A&M Realty also announced that 283 hectares of land will be developed into a new township which they may launch at 2020.
Source: EdgeFinancialDaily, Sime Darby Annual Report 2002
Socio-Economic Research Centre
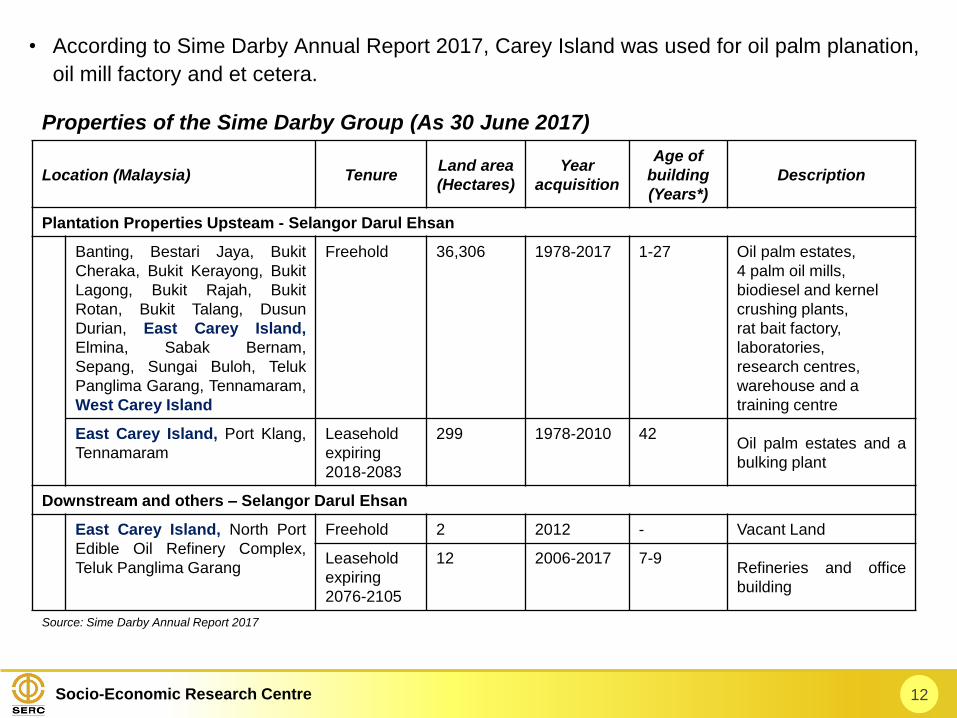
• According to Sime Darby Annual Report 2017, Carey Island was used for oil palm planation,
oil mill factory and et cetera.
12
Properties of the Sime Darby Group (As 30 June 2017)
Location (Malaysia) TenureLand area
(Hectares)
Year
acquisition
Age of
building
(Years*)
Description
Plantation Properties Upsteam - Selangor Darul Ehsan
Banting, Bestari Jaya, Bukit
Cheraka, Bukit Kerayong, Bukit
Lagong, Bukit Rajah, Bukit
Rotan, Bukit Talang, Dusun
Durian, East Carey Island,
Elmina, Sabak Bernam,
Sepang, Sungai Buloh, Teluk
Panglima Garang, Tennamaram,
West Carey Island
Freehold 36,306 1978-2017 1-27 Oil palm estates,
4 palm oil mills,
biodiesel and kernel
crushing plants,
rat bait factory,
laboratories,
research centres,
warehouse and a
training centre
East Carey Island, Port Klang,
Tennamaram
Leasehold
expiring
2018-2083
299 1978-2010 42Oil palm estates and a
bulking plant
Downstream and others – Selangor Darul Ehsan
East Carey Island, North Port
Edible Oil Refinery Complex,
Teluk Panglima Garang
Freehold 2 2012 - Vacant Land
Leasehold
expiring
2076-2105
12 2006-2017 7-9Refineries and office
building
Source: Sime Darby Annual Report 2017
Socio-Economic Research Centre 13
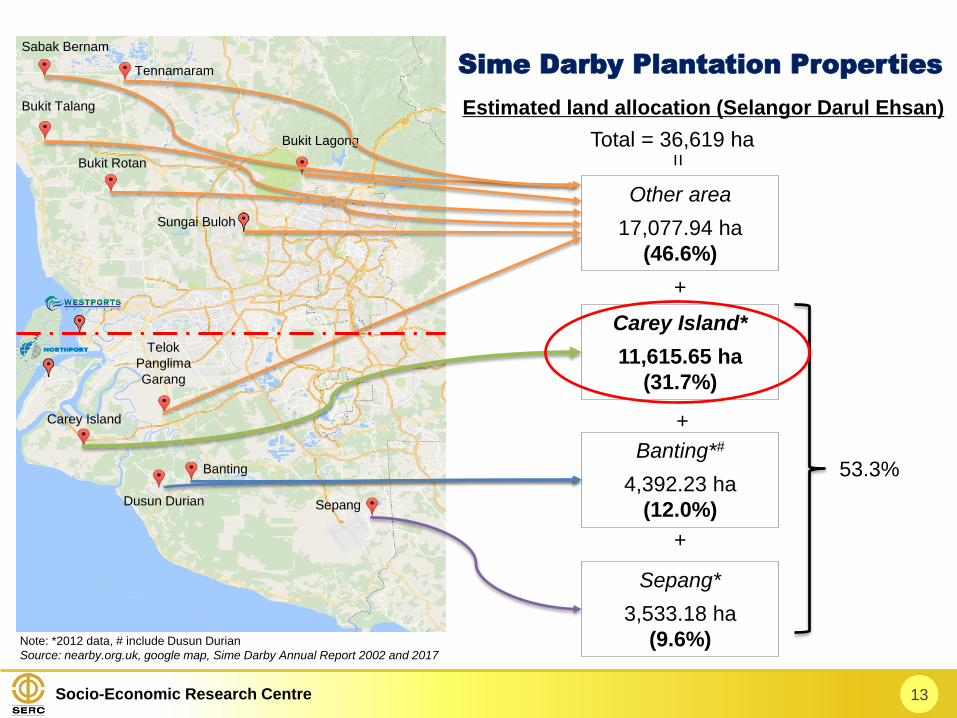
Sime Darby Plantation Properties
Other area
17,077.94 ha
(46.6%)
Carey Island
Telok
Panglima
Garang
Dusun Durian
Bukit Lagong
Bukit Rotan
Sabak Bernam
Bukit Talang
Tennamaram
Estimated land allocation (Selangor Darul Ehsan)
Total = 36,619 ha
Carey Island*
11,615.65 ha
(31.7%)
Banting*#
4,392.23 ha
(12.0%)
Sepang*
3,533.18 ha
(9.6%)Note: *2012 data, # include Dusun Durian
Source: nearby.org.uk, google map, Sime Darby Annual Report 2002 and 2017
+
+
+
=
53.3%Banting
Sungai Buloh
Sepang
Socio-Economic Research Centre 14
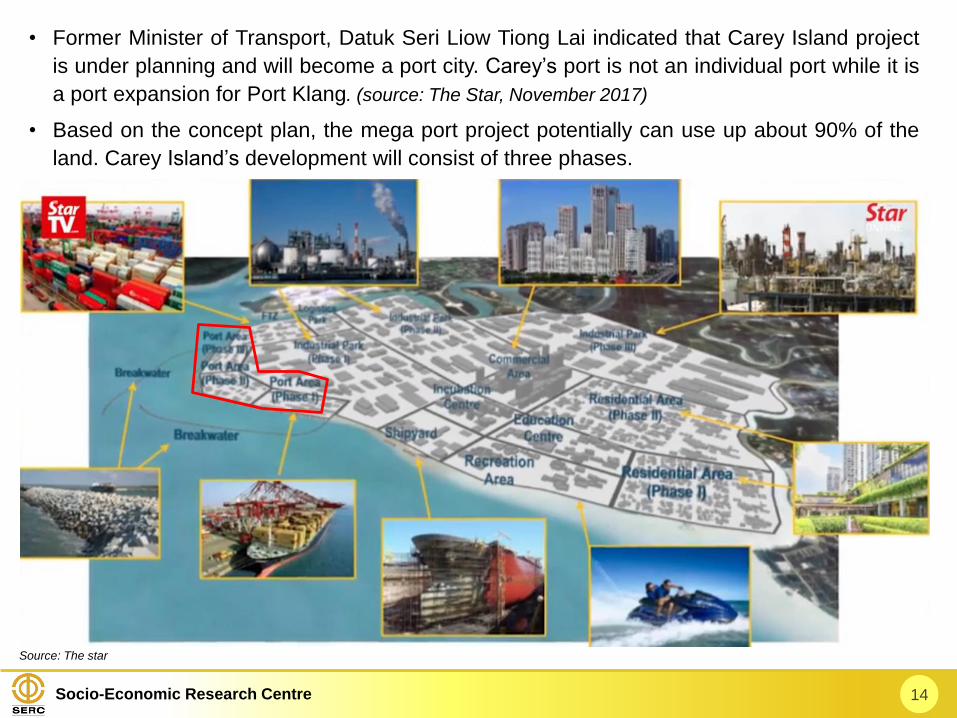
• Former Minister of Transport, Datuk Seri Liow Tiong Lai indicated that Carey Island project
is under planning and will become a port city. Carey’s port is not an individual port while it is
a port expansion for Port Klang. (source: The Star, November 2017)
• Based on the concept plan, the mega port project potentially can use up about 90% of the
land. Carey Island’s development will consist of three phases.
Source: The star
Socio-Economic Research Centre
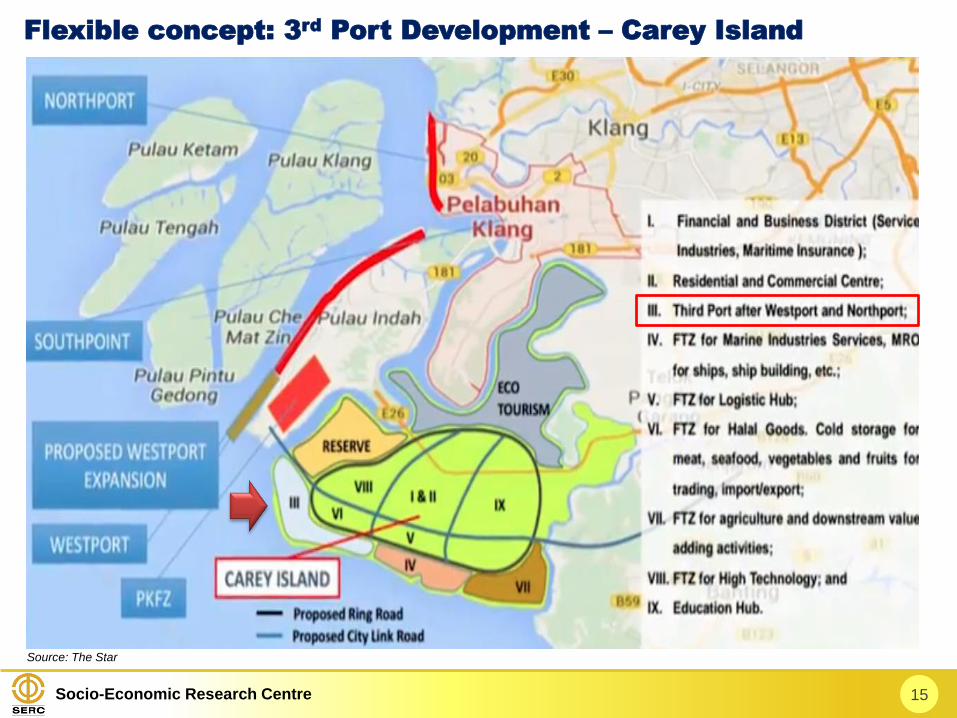
Source: The Star
15
Flexible concept: 3rd
Port Development – Carey Island
Socio-Economic Research Centre
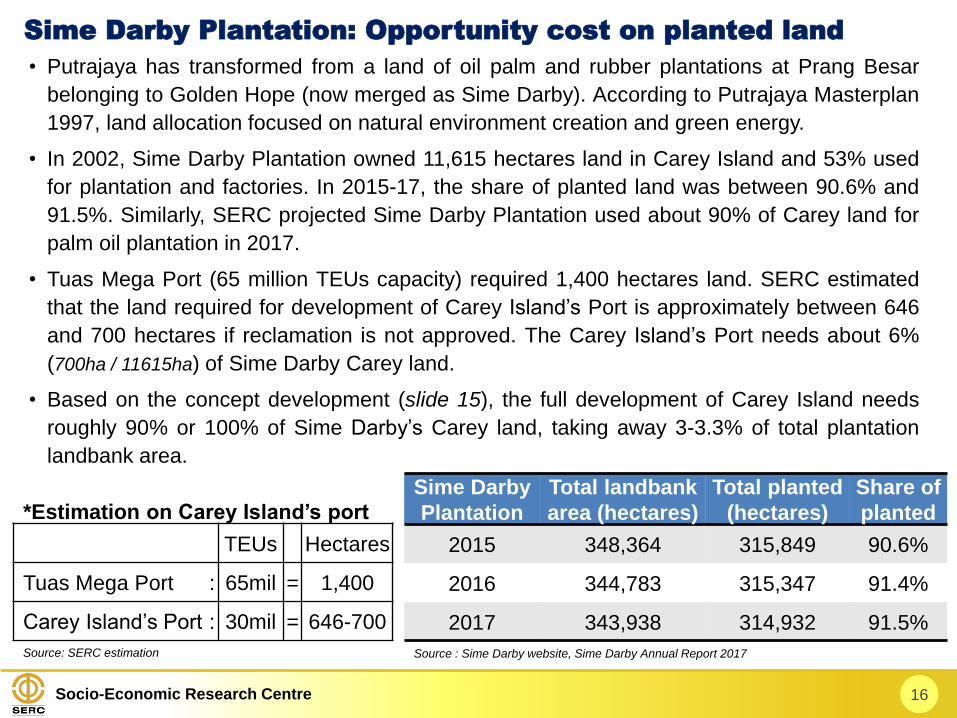
• Putrajaya has transformed from a land of oil palm and rubber plantations at Prang Besar
belonging to Golden Hope (now merged as Sime Darby). According to Putrajaya Masterplan
1997, land allocation focused on natural environment creation and green energy.
• In 2002, Sime Darby Plantation owned 11,615 hectares land in Carey Island and 53% used
for plantation and factories. In 2015-17, the share of planted land was between 90.6% and
91.5%. Similarly, SERC projected Sime Darby Plantation used about 90% of Carey land for
palm oil plantation in 2017.
• Tuas Mega Port (65 million TEUs capacity) required 1,400 hectares land. SERC estimated
that the land required for development of Carey Island’s Port is approximately between 646
and 700 hectares if reclamation is not approved. The Carey Island’s Port needs about 6%
(700ha / 11615ha) of Sime Darby Carey land.
• Based on the concept development (slide 15), the full development of Carey Island needs
roughly 90% or 100% of Sime Darby’s Carey land, taking away 3-3.3% of total plantation
landbank area.
16
Sime Darby Plantation: Opportunity cost on planted land
Sime Darby
Plantation
Total landbank
area (hectares)
Total planted
(hectares)
Share of
planted
2015 348,364 315,849 90.6%
2016 344,783 315,347 91.4%
2017 343,938 314,932 91.5%
Source : Sime Darby website, Sime Darby Annual Report 2017
*Estimation on Carey Island’s port
TEUs Hectares
Tuas Mega Port : 65mil = 1,400
Carey Island’s Port : 30mil = 646-700
Source: SERC estimation
Socio-Economic Research Centre
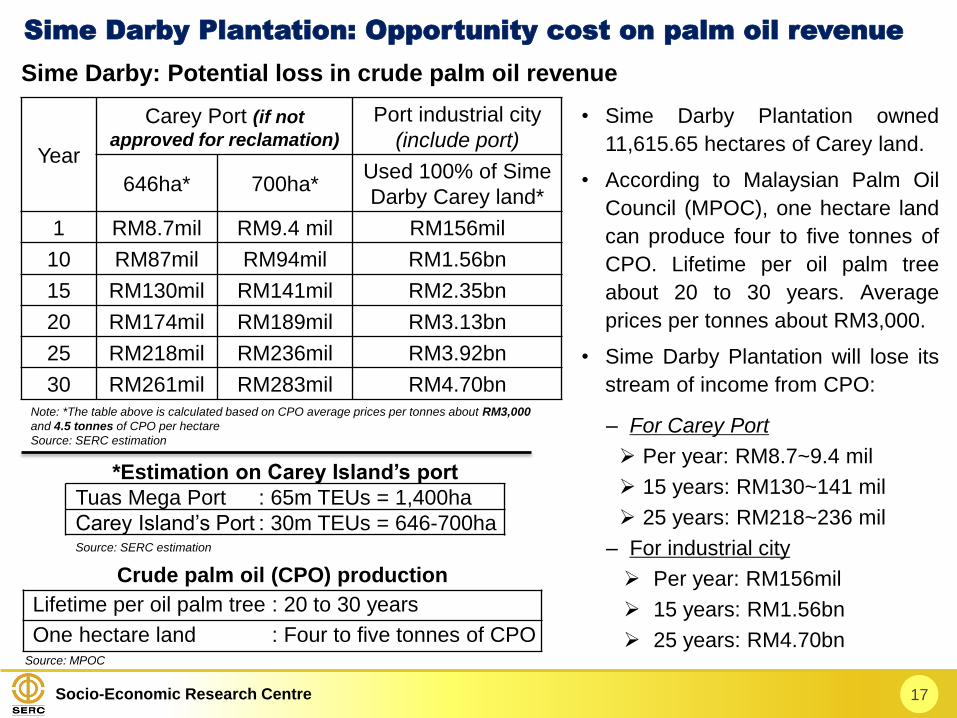
• Sime Darby Plantation owned
11,615.65 hectares of Carey land.
• According to Malaysian Palm Oil
Council (MPOC), one hectare land
can produce four to five tonnes of
CPO. Lifetime per oil palm tree
about 20 to 30 years. Average
prices per tonnes about RM3,000.
• Sime Darby Plantation will lose its
stream of income from CPO:
– For Carey Port
Per year: RM8.7~9.4 mil
15 years: RM130~141 mil
25 years: RM218~236 mil
– For industrial city
Per year: RM156mil
15 years: RM1.56bn
25 years: RM4.70bn
17
Sime Darby Plantation: Opportunity cost on palm oil revenue
Crude palm oil (CPO) production
Lifetime per oil palm tree : 20 to 30 years
One hectare land : Four to five tonnes of CPOSource: MPOC
*Estimation on Carey Island’s port
Tuas Mega Port : 65m TEUs = 1,400ha
Carey Island’s Port : 30m TEUs = 646-700haSource: SERC estimation
Year
Carey Port (if not
approved for reclamation)
Port industrial city
(include port)
646ha* 700ha*Used 100% of Sime
Darby Carey land*
1 RM8.7mil RM9.4 mil RM156mil
10 RM87mil RM94mil RM1.56bn
15 RM130mil RM141mil RM2.35bn
20 RM174mil RM189mil RM3.13bn
25 RM218mil RM236mil RM3.92bn
30 RM261mil RM283mil RM4.70bnNote: *The table above is calculated based on CPO average prices per tonnes about RM3,000
and 4.5 tonnes of CPO per hectare
Source: SERC estimation
Sime Darby: Potential loss in crude palm oil revenue
Socio-Economic Research Centre 18
Section 3
Maritime Market Assessment
Socio-Economic Research Centre 19
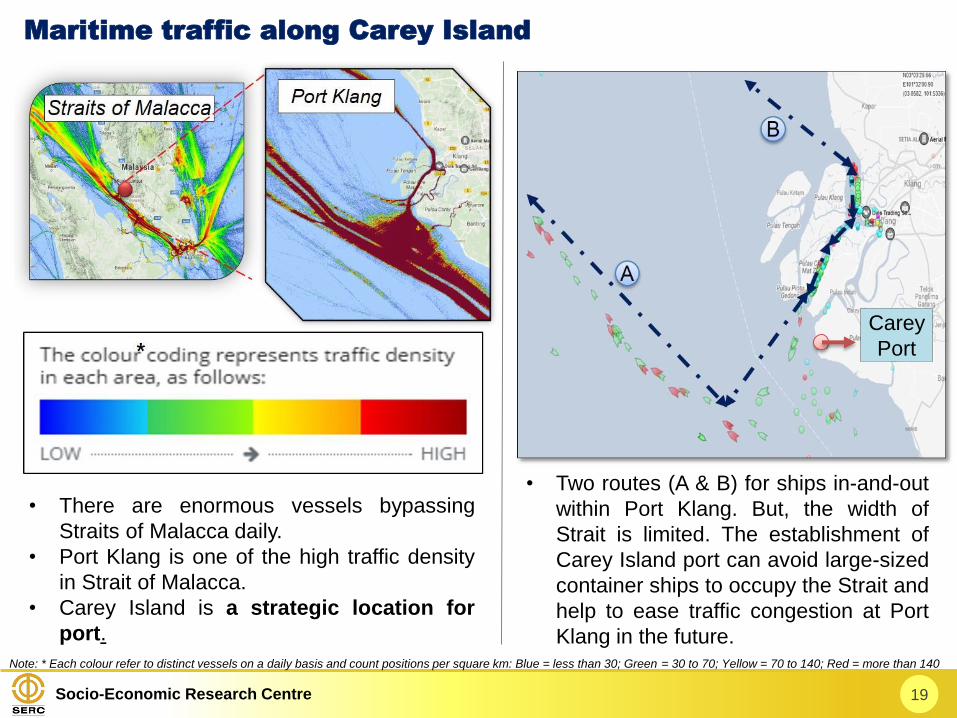
Maritime traffic along Carey Island
Note: * Each colour refer to distinct vessels on a daily basis and count positions per square km: Blue = less than 30; Green = 30 to 70; Yellow = 70 to 140; Red = more than 140
• There are enormous vessels bypassing
Straits of Malacca daily.
• Port Klang is one of the high traffic density
in Strait of Malacca.
• Carey Island is a strategic location for
port.
• Two routes (A & B) for ships in-and-out
within Port Klang. But, the width of
Strait is limited. The establishment of
Carey Island port can avoid large-sized
container ships to occupy the Strait and
help to ease traffic congestion at Port
Klang in the future.
Carey
Port
Socio-Economic Research Centre 20
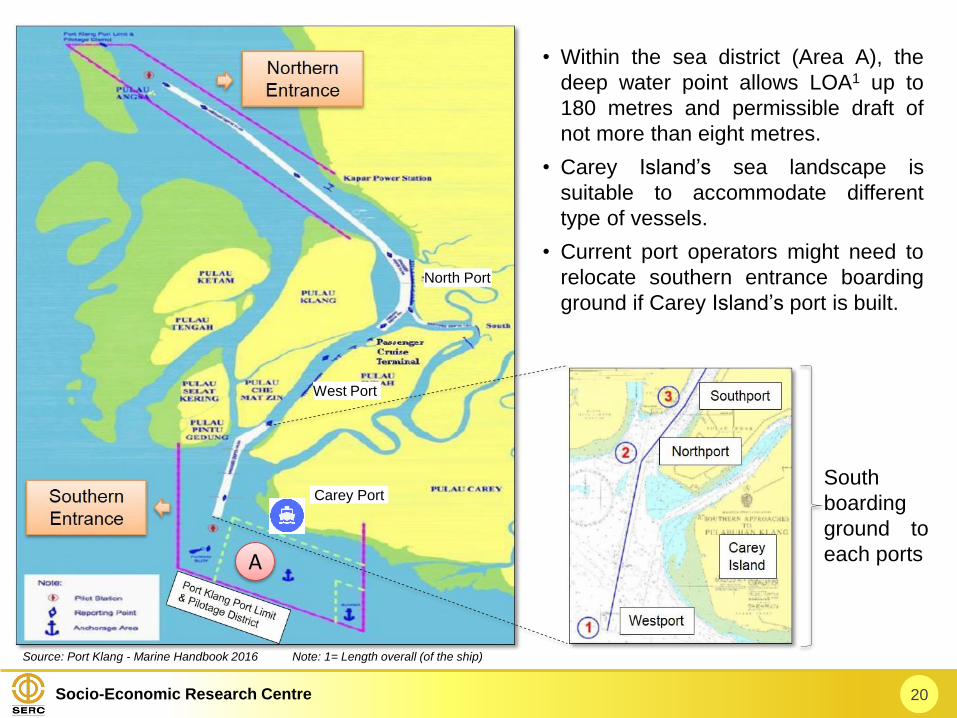
• Within the sea district (Area A), the
deep water point allows LOA1 up to
180 metres and permissible draft of
not more than eight metres.
• Carey Island’s sea landscape is
suitable to accommodate different
type of vessels.
• Current port operators might need to
relocate southern entrance boarding
ground if Carey Island’s port is built.
Source: Port Klang - Marine Handbook 2016
South
boarding
ground to
each ports
Note: 1= Length overall (of the ship)
West Port
North Port
A
Carey Port
Socio-Economic Research Centre 21
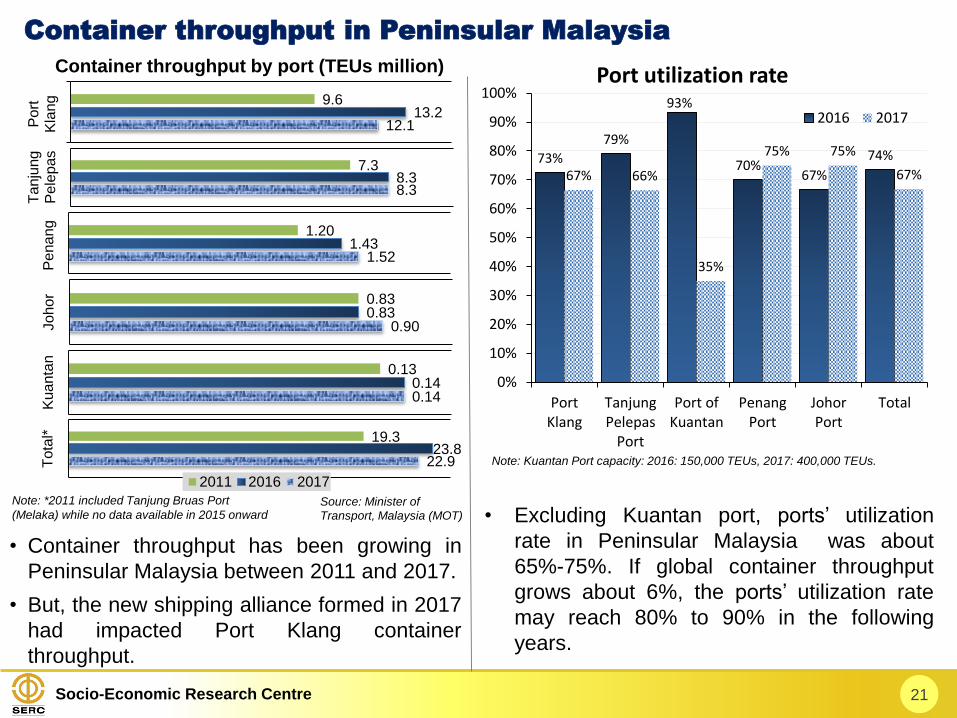
Container throughput in Peninsular Malaysia
73%
79%
93%
70%67%
74%
67% 66%
35%
75% 75%
67%
0%
10%
20%
30%
40%
50%
60%
70%
80%
90%
100%
PortKlang
TanjungPelepas
Port
Port ofKuantan
PenangPort
JohorPort
Total
Port utilization rate
2016 2017
Container throughput by port (TEUs million)
12.113.2
9.6
Po
rtK
lang
1.521.43
1.20
Pe
na
ng
0.900.830.83
Jo
ho
r
0.140.14
0.13
Kua
nta
n
8.38.3
7.3
Tan
jung
Pele
pas
22.923.8
19.3
Tota
l*
2011 2016 2017
• Container throughput has been growing in
Peninsular Malaysia between 2011 and 2017.
• But, the new shipping alliance formed in 2017
had impacted Port Klang container
throughput.
• Excluding Kuantan port, ports’ utilization
rate in Peninsular Malaysia was about
65%-75%. If global container throughput
grows about 6%, the ports’ utilization rate
may reach 80% to 90% in the following
years.
Note: *2011 included Tanjung Bruas Port
(Melaka) while no data available in 2015 onward
Note: Kuantan Port capacity: 2016: 150,000 TEUs, 2017: 400,000 TEUs.
Source: Minister of
Transport, Malaysia (MOT)
Socio-Economic Research Centre 22
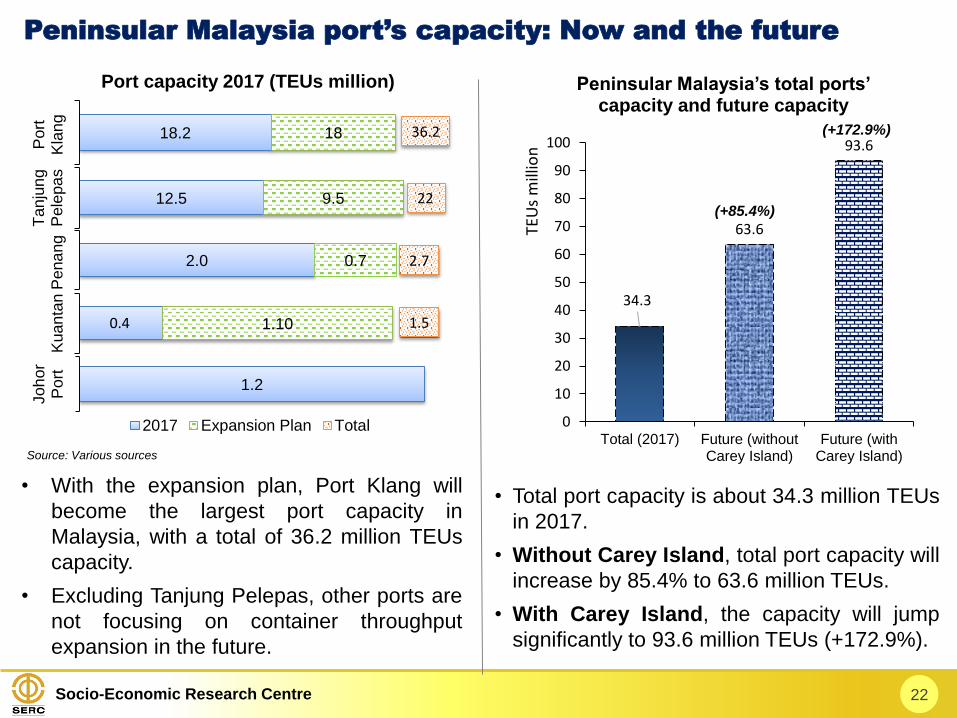
Peninsular Malaysia port’s capacity: Now and the future
Port capacity 2017 (TEUs million)
12.5 9.5
Tan
jun
gP
ele
pa
s
1.2
Joh
or
Port
2017 Expansion Plan Total
18.2 18
Port
Kla
ng
1.10
Kuan
tan
0.4
2.0 0.7
Pena
ng
22
1.5
34.3
63.6
93.6
0
10
20
30
40
50
60
70
80
90
100
Total (2017) Future (withoutCarey Island)
Future (withCarey Island)
TEU
s m
illio
n
Peninsular Malaysia’s total ports’ capacity and future capacity
• With the expansion plan, Port Klang will
become the largest port capacity in
Malaysia, with a total of 36.2 million TEUs
capacity.
• Excluding Tanjung Pelepas, other ports are
not focusing on container throughput
expansion in the future.
• Total port capacity is about 34.3 million TEUs
in 2017.
• Without Carey Island, total port capacity will
increase by 85.4% to 63.6 million TEUs.
• With Carey Island, the capacity will jump
significantly to 93.6 million TEUs (+172.9%).
36.2
2.7
(+85.4%)
(+172.9%)
Source: Various sources
Socio-Economic Research Centre 23
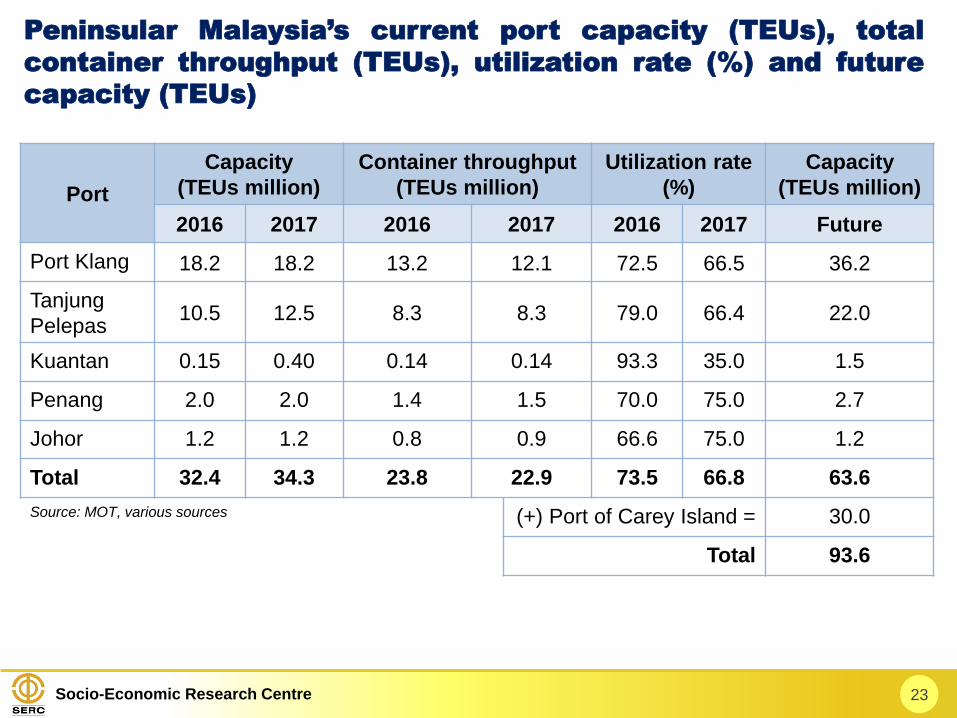
Peninsular Malaysia’s current port capacity (TEUs), total
container throughput (TEUs), utilization rate (%) and future
capacity (TEUs)
Port
Capacity
(TEUs million)
Container throughput
(TEUs million)
Utilization rate
(%)
Capacity
(TEUs million)
2016 2017 2016 2017 2016 2017 Future
Port Klang 18.2 18.2 13.2 12.1 72.5 66.5 36.2
Tanjung
Pelepas10.5 12.5 8.3 8.3 79.0 66.4 22.0
Kuantan 0.15 0.40 0.14 0.14 93.3 35.0 1.5
Penang 2.0 2.0 1.4 1.5 70.0 75.0 2.7
Johor 1.2 1.2 0.8 0.9 66.6 75.0 1.2
Total 32.4 34.3 23.8 22.9 73.5 66.8 63.6
Source: MOT, various sources (+) Port of Carey Island = 30.0
Total 93.6
Socio-Economic Research Centre 24
A comparison of container throughput / port capacity
between Malaysia and Singapore (Supply)
13.0
19.3
23.822.9
24.8
29.9 30.933.7
0
5
10
15
20
25
30
35
40
2006 2011 2016 2017
TE
Us m
illio
n
Container Throughput
Peninsular Malaysia Singapore
34
64
50
65
94
0
10
20
30
40
50
60
70
80
90
100
2017 Future Capacity
TE
Us m
illio
n
Container Capacity (TEUs)
Peninsular MalaysiaSingaporePeninsular Malaysia (with Carney Island)
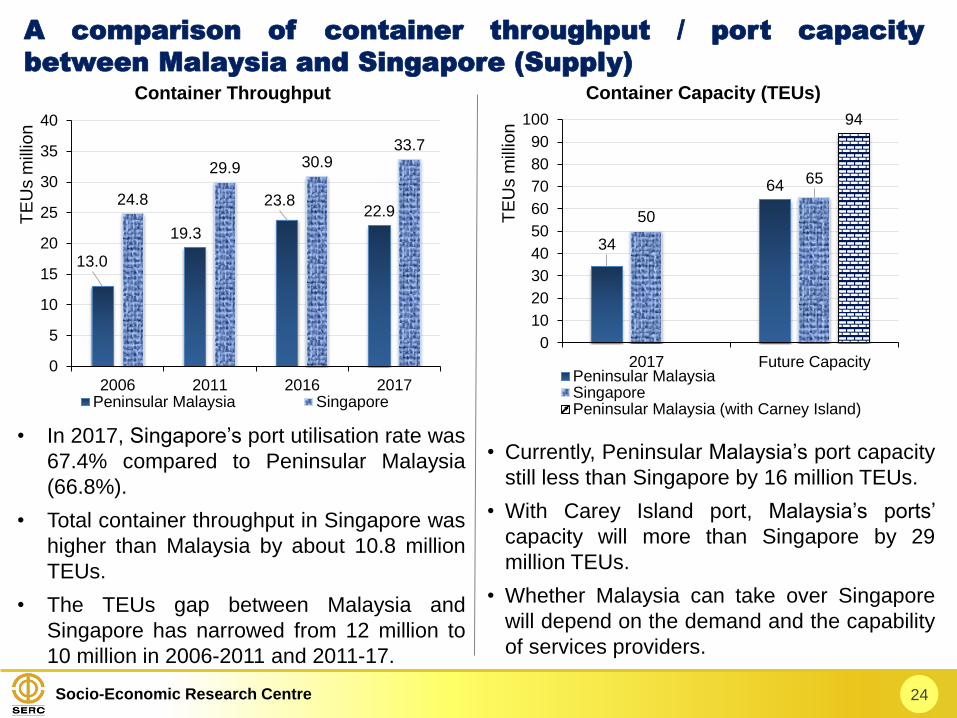
• In 2017, Singapore’s port utilisation rate was
67.4% compared to Peninsular Malaysia
(66.8%).
• Total container throughput in Singapore was
higher than Malaysia by about 10.8 million
TEUs.
• The TEUs gap between Malaysia and
Singapore has narrowed from 12 million to
10 million in 2006-2011 and 2011-17.
• Currently, Peninsular Malaysia’s port capacity
still less than Singapore by 16 million TEUs.
• With Carey Island port, Malaysia’s ports’
capacity will more than Singapore by 29
million TEUs.
• Whether Malaysia can take over Singapore
will depend on the demand and the capability
of services providers.
Socio-Economic Research Centre
2031-20502021-20302018-2020
Port Klang
Tanjung Pelepas
Kuantan
Penang
Johor
Melaka Gateway
Tanjung Bruas
Carey Island (Proposed)
25
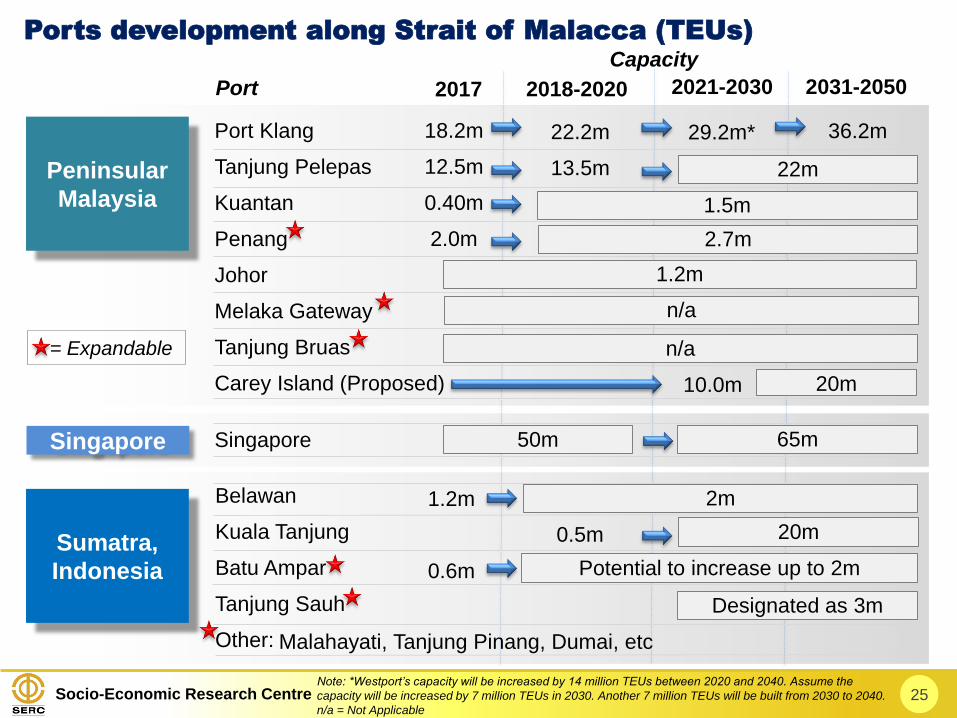
Ports development along Strait of Malacca (TEUs)
Peninsular
Malaysia
Singapore
2017
18.2m
12.5m
0.40m
2.0m
Sumatra,
Indonesia
Singapore
1.2m
0.6m
Belawan
Kuala Tanjung
Batu Ampar
Tanjung Sauh
Other:
2m
0.5m
22.2m
13.5m
36.2m29.2m*
10.0m
Note: *Westport’s capacity will be increased by 14 million TEUs between 2020 and 2040. Assume the
capacity will be increased by 7 million TEUs in 2030. Another 7 million TEUs will be built from 2030 to 2040.
n/a = Not Applicable
= Expandable
n/a
Designated as 3m
65m
2.7m
1.2m
20m
1.5m
22m
50m
2m
20m
Potential to increase up to 2m
Capacity
Port
Malahayati, Tanjung Pinang, Dumai, etc
n/a
Socio-Economic Research Centre
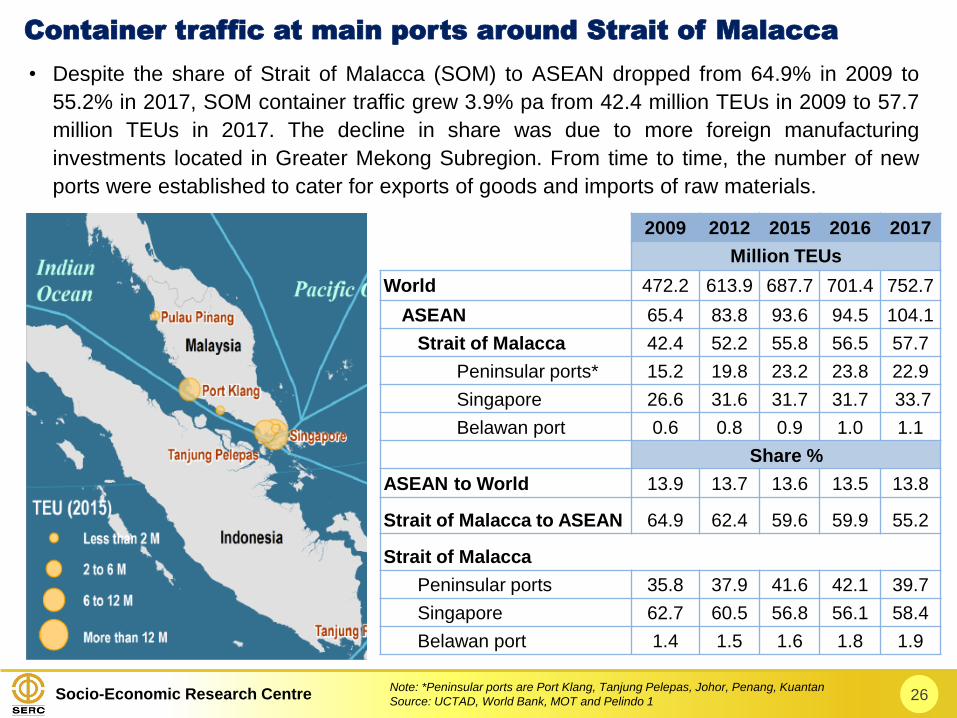
• Despite the share of Strait of Malacca (SOM) to ASEAN dropped from 64.9% in 2009 to
55.2% in 2017, SOM container traffic grew 3.9% pa from 42.4 million TEUs in 2009 to 57.7
million TEUs in 2017. The decline in share was due to more foreign manufacturing
investments located in Greater Mekong Subregion. From time to time, the number of new
ports were established to cater for exports of goods and imports of raw materials.
26
Container traffic at main ports around Strait of Malacca
2009 2012 2015 2016 2017
Million TEUs
World 472.2 613.9 687.7 701.4 752.7
ASEAN 65.4 83.8 93.6 94.5 104.1
Strait of Malacca 42.4 52.2 55.8 56.5 57.7
Peninsular ports* 15.2 19.8 23.2 23.8 22.9
Singapore 26.6 31.6 31.7 31.7 33.7
Belawan port 0.6 0.8 0.9 1.0 1.1
Share %
ASEAN to World 13.9 13.7 13.6 13.5 13.8
Strait of Malacca to ASEAN 64.9 62.4 59.6 59.9 55.2
Strait of Malacca
Peninsular ports 35.8 37.9 41.6 42.1 39.7
Singapore 62.7 60.5 56.8 56.1 58.4
Belawan port 1.4 1.5 1.6 1.8 1.9
Note: *Peninsular ports are Port Klang, Tanjung Pelepas, Johor, Penang, Kuantan
Source: UCTAD, World Bank, MOT and Pelindo 1

Socio-Economic Research Centre
• Based on “ITF Transport Outlook 2017”, ASEAN’s sea traffic is expected to register strong
positive growth over the next decade. The Strait of Malacca will remain the main bridge to
connect between the Indian Ocean and Pacific. In 2017, Strait of Malacca accounted for
about 55% share of ASEAN container throughput. This share is used to calculate Strait of
Malacca’s projected container throughput in 2020, 2030, and 2050.
• With the existing port facility, Malaysia and Singapore are handling almost all the containers’
traffic in Strait of Malacca. We caution that Sumatra’s port development will be an added
pressure in maritime industry in the years ahead. Kuala Tanjung International Hub Seaport
started operation in March 2018 (local company collaborated with Rotterdom Port Authrority
and DP World). Indonesian government has planned to build a transhipment containers in
Tanjung Sauh and hence, will pose competition to Strait of Malacca.
• In the past, Singapore held at least 55% share of container throughput in Strait of Malacca.
Malaysia held approximately 40~45% share whereas Indonesia (Ports in Sumatra)
accounted less than 5% share.
• In SERC’s viewpoint, some container volume will be diverted from Malaysia and Singapore
to Sumatra’s ports in the future. SERC analysis assumed that Strait of Malacca’s container
traffic ratio of Singapore, Peninsular Malaysia and Indonesia (Sumatra) at 50%:40%:10%
respectively.
27
Analysing the position of Carey Port
Socio-Economic Research Centre 28
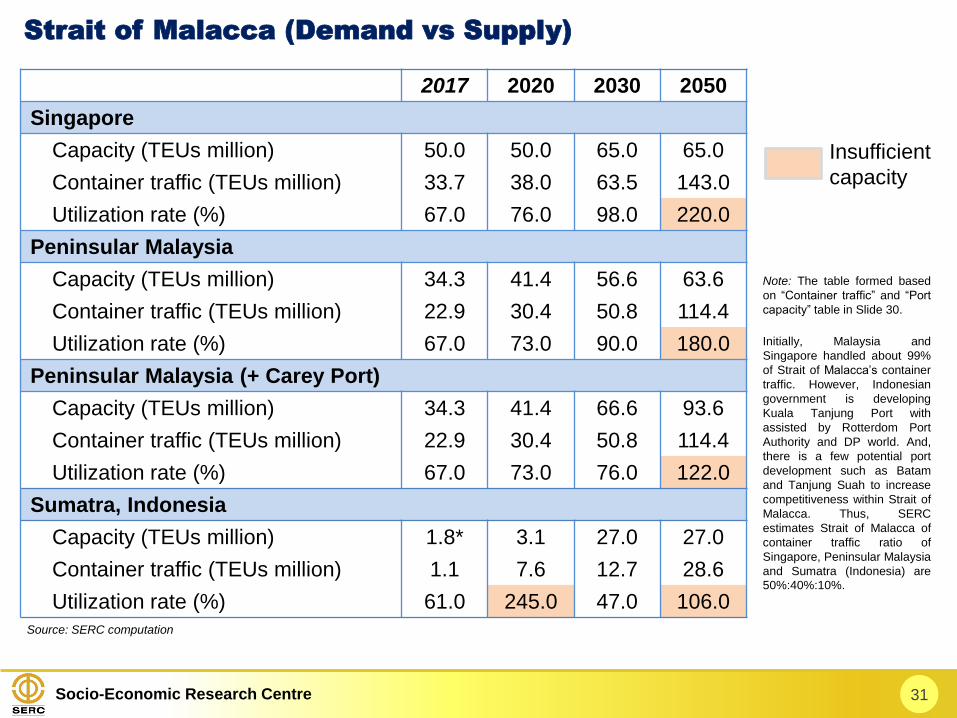
• Our analysis of future port capacity and container throughput demand within Strait of
Malacca are as follows (refer to Slide 30):
– By 2020
Ports capacity in Peninsular Malaysia and Singapore would achieve 73-76% utilization
rate. Sumatra may not have sufficient capacity but is ready to service the container
traffic. Extra containers from Sumatra will be diverted to either Peninsular Malaysia or
Singapore.
– By 2030
Port expansions in Singapore and Indonesia will be completed. Singapore port almost
reaching 100% utilisation rate or possible overcapacity. Sumatra’s ports will continue to
build up their customer base and enhance their shipping linear connectivity with the
world.
Without Carey’s Port, Peninsular Malaysia would achieve about 90% port utilization rate.
However, with Carey’s Port, port utilization rate will drop to 76.0% and 15.8 million TEUs
capacity will be available. Meanwhile, Melaka deep seaport and Tanjung Bruas Port have
yet to announce the port capacity masterplan. Peninsular Malaysia’s ports would suffer
underutilize capacity if all ports expansion or development are completed at the same
time. A price war will occur within domestic market.
– By 2050
Ports capacity in Singapore and Sumatra are not sufficient to cope with increased
container traffic. Peninsular Malaysia with or without Carey Port also faces insufficient
port capacity. Before 2050, Strait of Malacca would require a new port or an alternative
sea route is developed to ease the traffic congestion in Strait of Malacca.
Socio-Economic Research Centre 29
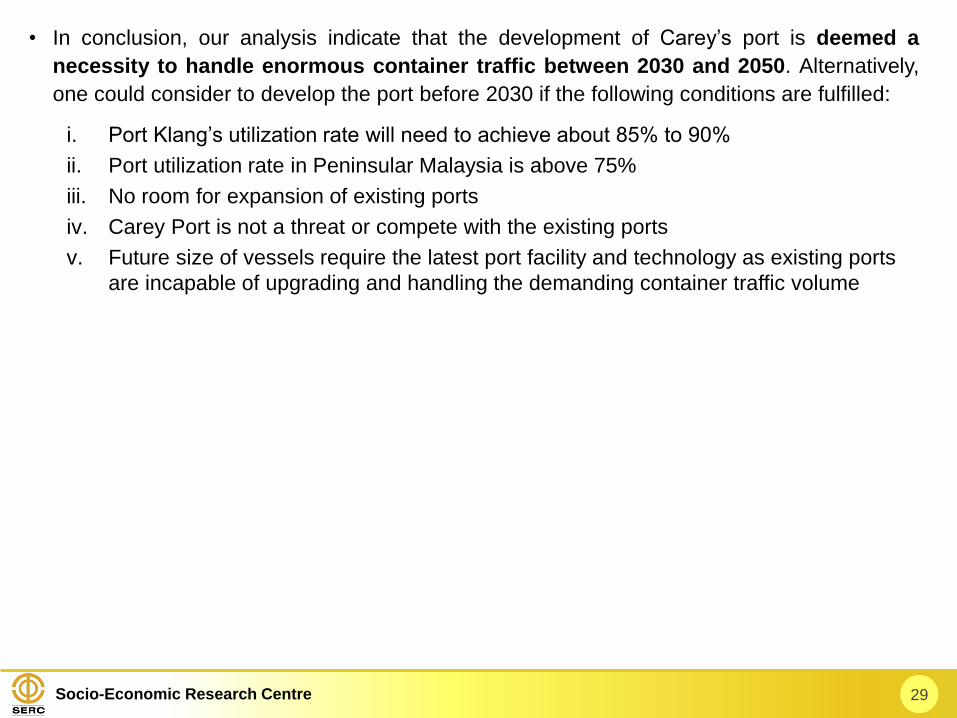
• In conclusion, our analysis indicate that the development of Carey’s port is deemed a
necessity to handle enormous container traffic between 2030 and 2050. Alternatively,
one could consider to develop the port before 2030 if the following conditions are fulfilled:
i. Port Klang’s utilization rate will need to achieve about 85% to 90%
ii. Port utilization rate in Peninsular Malaysia is above 75%
iii. No room for expansion of existing ports
iv. Carey Port is not a threat or compete with the existing ports
v. Future size of vessels require the latest port facility and technology as existing ports
are incapable of upgrading and handling the demanding container traffic volume
Socio-Economic Research Centre 30
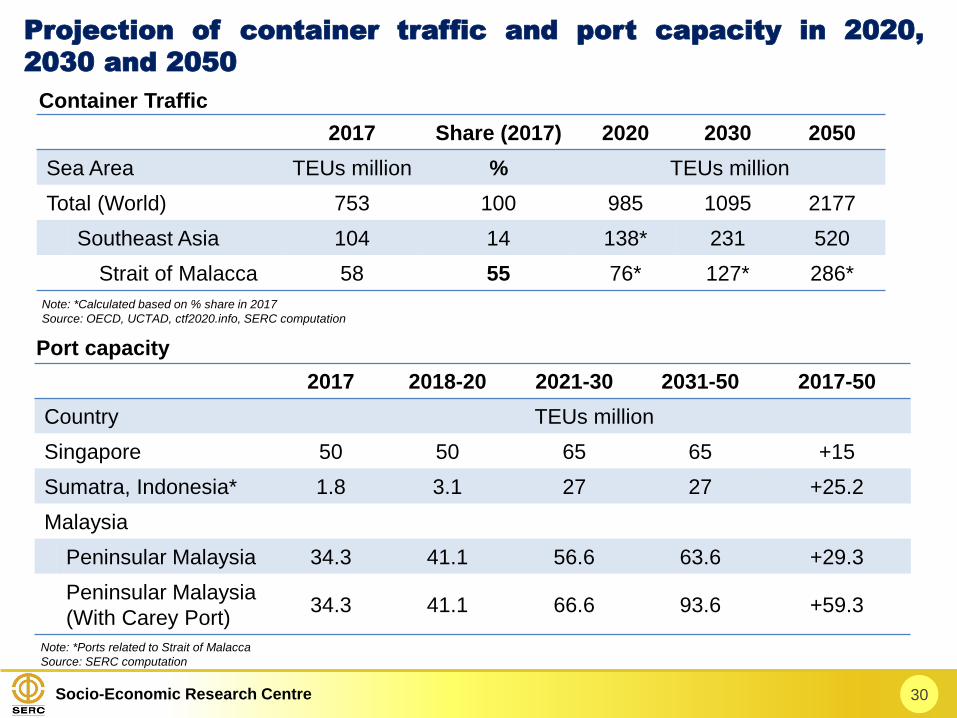
Projection of container traffic and port capacity in 2020,
2030 and 2050
Port capacity
2017 2018-20 2021-30 2031-50 2017-50
Country TEUs million
Singapore 50 50 65 65 +15
Sumatra, Indonesia* 1.8 3.1 27 27 +25.2
Malaysia
Peninsular Malaysia 34.3 41.1 56.6 63.6 +29.3
Peninsular Malaysia
(With Carey Port)34.3 41.1 66.6 93.6 +59.3
Container Traffic
2017 Share (2017) 2020 2030 2050
Sea Area TEUs million % TEUs million
Total (World) 753 100 985 1095 2177
Southeast Asia 104 14 138* 231 520
Strait of Malacca 58 55 76* 127* 286*
Note: *Calculated based on % share in 2017
Source: OECD, UCTAD, ctf2020.info, SERC computation
Note: *Ports related to Strait of Malacca
Source: SERC computation
Socio-Economic Research Centre 31
Strait of Malacca (Demand vs Supply)
2017 2020 2030 2050
Singapore
Capacity (TEUs million) 50.0 50.0 65.0 65.0
Container traffic (TEUs million) 33.7 38.0 63.5 143.0
Utilization rate (%) 67.0 76.0 98.0 220.0
Peninsular Malaysia
Capacity (TEUs million) 34.3 41.4 56.6 63.6
Container traffic (TEUs million) 22.9 30.4 50.8 114.4
Utilization rate (%) 67.0 73.0 90.0 180.0
Peninsular Malaysia (+ Carey Port)
Capacity (TEUs million) 34.3 41.4 66.6 93.6
Container traffic (TEUs million) 22.9 30.4 50.8 114.4
Utilization rate (%) 67.0 73.0 76.0 122.0
Sumatra, Indonesia
Capacity (TEUs million) 1.8* 3.1 27.0 27.0
Container traffic (TEUs million) 1.1 7.6 12.7 28.6
Utilization rate (%) 61.0 245.0 47.0 106.0
Note: The table formed based
on “Container traffic” and “Port
capacity” table in Slide 30.
Insufficient
capacity
Source: SERC computation
Initially, Malaysia and
Singapore handled about 99%
of Strait of Malacca’s container
traffic. However, Indonesian
government is developing
Kuala Tanjung Port with
assisted by Rotterdom Port
Authority and DP world. And,
there is a few potential port
development such as Batam
and Tanjung Suah to increase
competitiveness within Strait of
Malacca. Thus, SERC
estimates Strait of Malacca of
container traffic ratio of
Singapore, Peninsular Malaysia
and Sumatra (Indonesia) are
50%:40%:10%.

Socio-Economic Research Centre 32
Section 4
Socio-Economic Research Centre
Port
• Some of the important socio-economic benefits of ports are as follows:
a) Fuels economic and commercial activities as it is an important link of hinterlands to
facilitate movement of goods to and from hinterland. Positive spillovers and multiplier
effects on more than 140 sub-sectors. It increases international trade (both exports
and import), contributing to industrialization in the hinterland as well as around ports;
b) Development of port city surrounding the port, spurring the economic activities like
banking, finance, Insurance, logistic etc;
c) Increase in employment both directly and indirectly in port-related activities and
supporting services such as transportation, logistics, banking and insurance; and
d) Development of infrastructure enhances good accessibility to major transportation
network, including railways and roads. Such infrastructure would make our exports
more competitive and as a spillover effect provide world class infrastructure to
businesses and exporters.
33
Benefits of port-industrial city project at Carey Island
Socio-Economic Research Centre
Port-industrial city
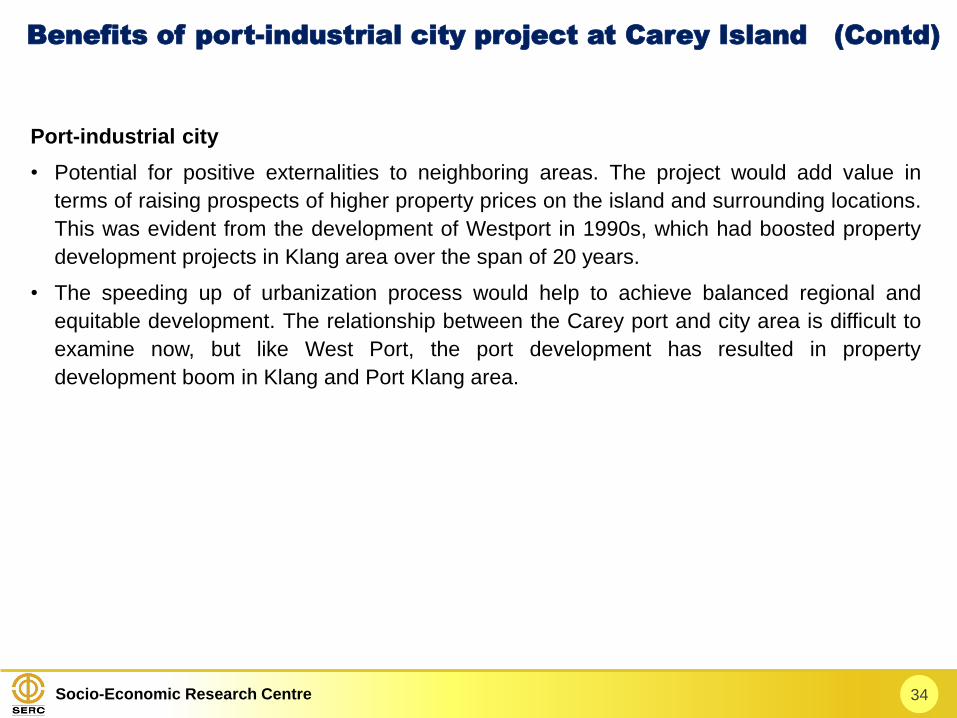
• Potential for positive externalities to neighboring areas. The project would add value in
terms of raising prospects of higher property prices on the island and surrounding locations.
This was evident from the development of Westport in 1990s, which had boosted property
development projects in Klang area over the span of 20 years.
• The speeding up of urbanization process would help to achieve balanced regional and
equitable development. The relationship between the Carey port and city area is difficult to
examine now, but like West Port, the port development has resulted in property
development boom in Klang and Port Klang area.
34
Benefits of port-industrial city project at Carey Island (Contd)
Socio-Economic Research Centre
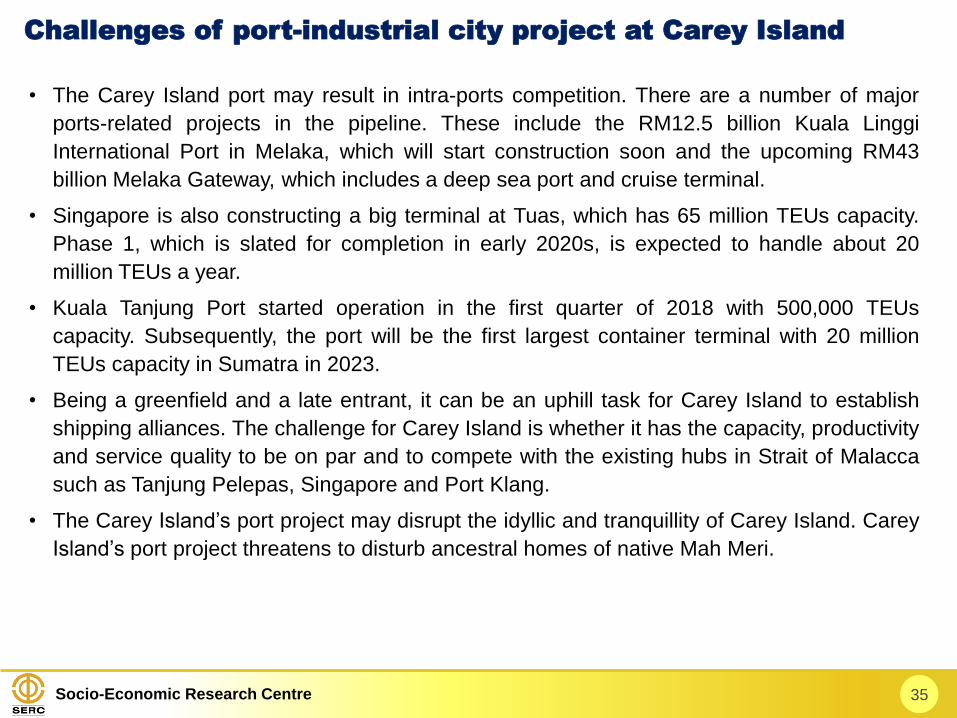
• The Carey Island port may result in intra-ports competition. There are a number of major
ports-related projects in the pipeline. These include the RM12.5 billion Kuala Linggi
International Port in Melaka, which will start construction soon and the upcoming RM43
billion Melaka Gateway, which includes a deep sea port and cruise terminal.
• Singapore is also constructing a big terminal at Tuas, which has 65 million TEUs capacity.
Phase 1, which is slated for completion in early 2020s, is expected to handle about 20
million TEUs a year.
• Kuala Tanjung Port started operation in the first quarter of 2018 with 500,000 TEUs
capacity. Subsequently, the port will be the first largest container terminal with 20 million
TEUs capacity in Sumatra in 2023.
• Being a greenfield and a late entrant, it can be an uphill task for Carey Island to establish
shipping alliances. The challenge for Carey Island is whether it has the capacity, productivity
and service quality to be on par and to compete with the existing hubs in Strait of Malacca
such as Tanjung Pelepas, Singapore and Port Klang.
• The Carey Island’s port project may disrupt the idyllic and tranquillity of Carey Island. Carey
Island’s port project threatens to disturb ancestral homes of native Mah Meri.
35
Challenges of port-industrial city project at Carey Island
Socio-Economic Research Centre
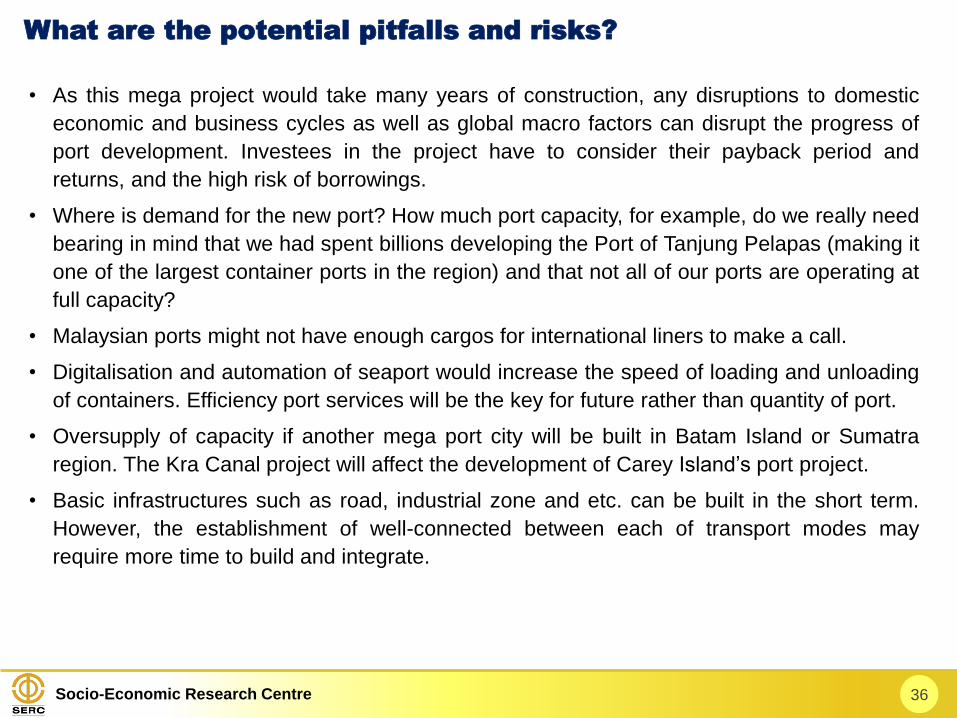
• As this mega project would take many years of construction, any disruptions to domestic
economic and business cycles as well as global macro factors can disrupt the progress of
port development. Investees in the project have to consider their payback period and
returns, and the high risk of borrowings.
• Where is demand for the new port? How much port capacity, for example, do we really need
bearing in mind that we had spent billions developing the Port of Tanjung Pelapas (making it
one of the largest container ports in the region) and that not all of our ports are operating at
full capacity?
• Malaysian ports might not have enough cargos for international liners to make a call.
• Digitalisation and automation of seaport would increase the speed of loading and unloading
of containers. Efficiency port services will be the key for future rather than quantity of port.
• Oversupply of capacity if another mega port city will be built in Batam Island or Sumatra
region. The Kra Canal project will affect the development of Carey Island’s port project.
• Basic infrastructures such as road, industrial zone and etc. can be built in the short term.
However, the establishment of well-connected between each of transport modes may
require more time to build and integrate.
36
What are the potential pitfalls and risks?
Socio-Economic Research Centre 37
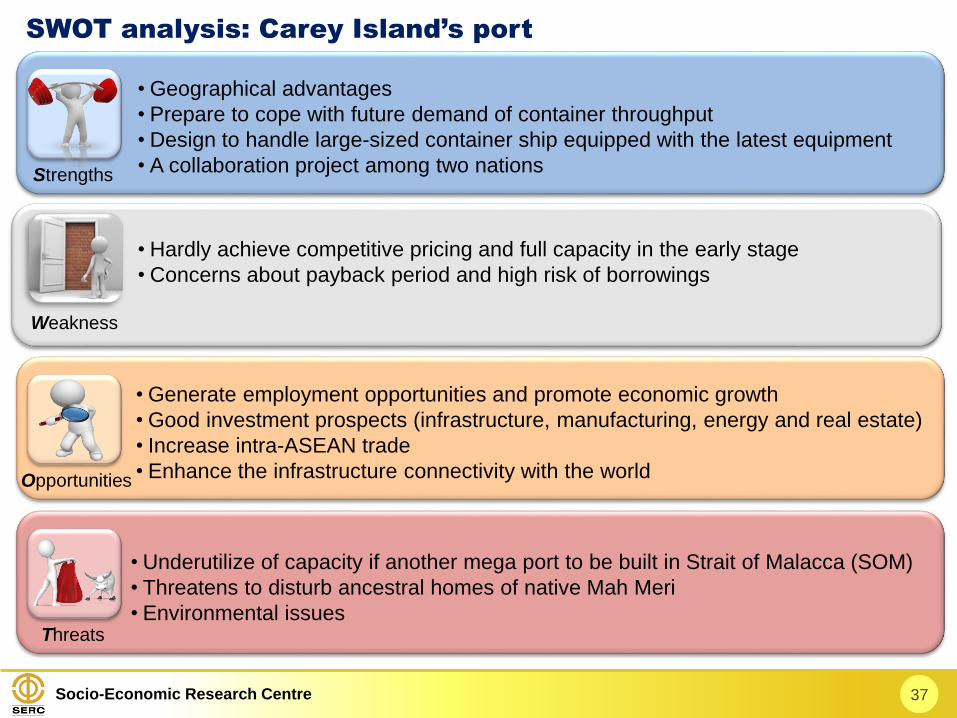
SWOT analysis: Carey Island’s port
Strengths
Weakness
Opportunities
Threats
• Hardly achieve competitive pricing and full capacity in the early stage
• Concerns about payback period and high risk of borrowings
• Generate employment opportunities and promote economic growth
• Good investment prospects (infrastructure, manufacturing, energy and real estate)
• Increase intra-ASEAN trade
• Enhance the infrastructure connectivity with the world
• Underutilize of capacity if another mega port to be built in Strait of Malacca (SOM)
• Threatens to disturb ancestral homes of native Mah Meri
• Environmental issues
• Geographical advantages
• Prepare to cope with future demand of container throughput
• Design to handle large-sized container ship equipped with the latest equipment
• A collaboration project among two nations
Socio-Economic Research Centre
• A new 3rd port at Carey Island would require huge infrastructure based on its existing
landscape that requires massive dredging works or construction of breakwater structures. It
is extremely capital-intensive project. Do both APSEZ and MCC have sufficient funding? If
not, who will finance the project? Carey Island’s Port is estimated to cost RM39.1 billion
investment. How possible MMC or the partners going to raise funding and from where?
• APSEZ is the biggest Indian port operator and had the 2nd highest container traffic
(FY2016-17: 4.2 million TEUs) in India. From business perspective, Carey Island’s port
project is part of business expansion for APSEZ since they are planning to become top
container port operator in India. Indian Prime Minister Narendra Modi is promoting “Made in
India” campaign, which is aimed at making India an international manufacturing hub. Thus,
will Carey Island’s port project support India’s “go out strategy” in future?
• Why China is not involved in the Carey Island’s port project? China has invested in Kuantan
Port and East Coast Rail Line (ECRL)* which connects Kuantan Port and Port Klang.
Malaysia-China Kuantan Industrial Park (MCKIP) is established to promote China’s
manufacturing investment in Malaysia. Carey Island’s port should be an indispensable
project to secure China’s seaborne trade between eastern and western region.
38
The myth and scepticism about Carey Island’s port project
Note: *refer to appendix
Socio-Economic Research Centre
• Seaborne trade is hardly can be substituted with either air or land transport. Strait of
Malacca (SOM) will has enormous traffic over next few decades as world trade and intra-
ASEAN trade are expected to grow at rapid rate annually.
• Most of Carey Island’s lands are owned by Sime Darby Plantation. Carey port development
would require about 700 hectare land, which makes up about 6% of 11,615.65 hectare
Carey land from Sime Darby Plantation. For Port Industrial City (include port), Sime Darby
Plantation ought to sacrifice entire palm oil plantation in Carey Island. Sime Darby
Plantation’s total landbank area will reduce by 3-3.3%.
• The development of Carey Port is to cater for future needs as West Port and North Port
have almost reached the maximum port expansion.
• Since the formation of a new shipping alliance, Port Klang’s container volume has declined
by 9.8% from 13.2 million TEUs in 2016 to 11.9 million TEUs in 2017. Overall, Peninsular
Malaysia’s port utilization rate was 66.8% in 2017.
• From maritime perspective, it is not economical viable for the construction of Carey
Island’s port to be ready by 2025 or 2028 on account of the following reasons: (a) A
number of existing ports expansion will be completed by 2030. Peninsular Malaysia’s ports
capacity will expand to roughly 56.6 million TEUs in 2030 (34.3 million TEUs in 2017); (b)
Melaka deep seaport and Tanjung Bruas Port would be participating in transhipment
industry between 2018 and 2030; and (c) Ports’ capacity will be underutilized in Peninsular
Malaysia, triggering a stiff domestic competition.
39
Summary: Carey Island’s port
Socio-Economic Research Centre 40
• In contrast, it cannot be denied that Carey Island’s port would create positive spillovers
and multiplier effects to businesses and people. Most importantly, it can reduce the
traffic congestion in Port Klang. With its strategic location geographically, Carey Island’s
port can be realized faster than our expectations if the port integrates with innovation, latest
technology, efficient services and competitive pricing.
• Alternatively, it will be interesting to see how developments projects such as Singapore’s
Tuas, Myanmar’s Dawei, Thailand’s Laem Chabang, and other smaller ports development
plans will complement or pose a threat to the Carey Island in the process of transforming
South-East Asia into a massive regional hub (Please refer to previous research paper on
“Strait of Malacca”).
• Lastly, new mega ports or hubs being developed along Strait of Malacca are likely to
benefit the shipping lines, and to some extent the importers/exporters in the future.
Socio-Economic Research Centre 41
Appendix
• East Coast Rail Line (ECRL)
• Alternative scenario for SOM
Socio-Economic Research Centre 42
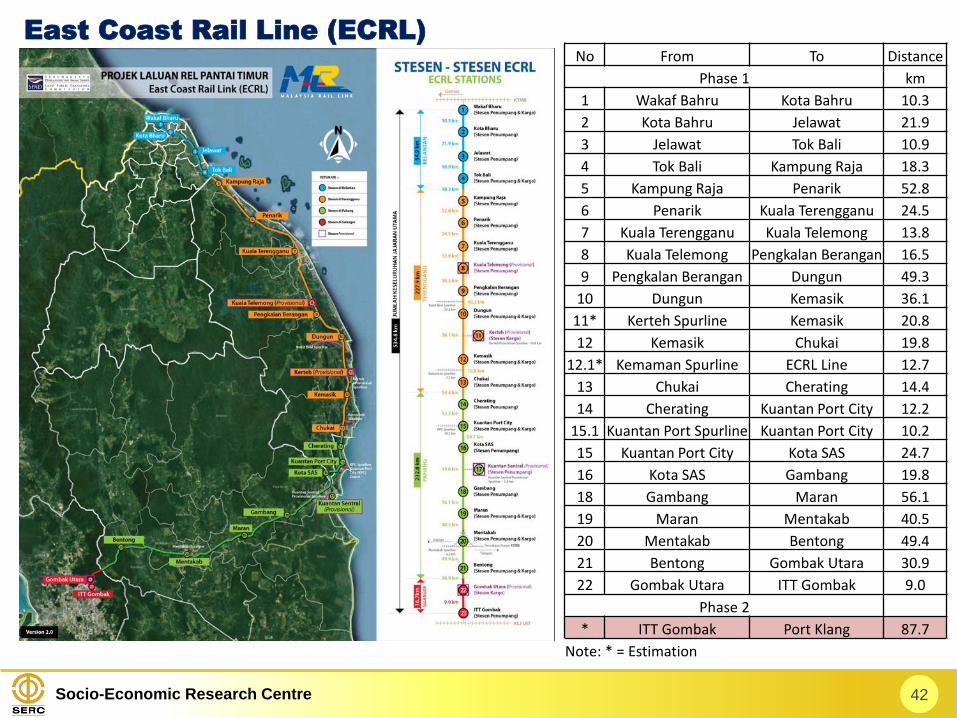
East Coast Rail Line (ECRL)
No From To Distance
Phase 1 km
1 Wakaf Bahru Kota Bahru 10.3
2 Kota Bahru Jelawat 21.9
3 Jelawat Tok Bali 10.9
4 Tok Bali Kampung Raja 18.3
5 Kampung Raja Penarik 52.8
6 Penarik Kuala Terengganu 24.5
7 Kuala Terengganu Kuala Telemong 13.8
8 Kuala Telemong Pengkalan Berangan 16.5
9 Pengkalan Berangan Dungun 49.3
10 Dungun Kemasik 36.1
11* Kerteh Spurline Kemasik 20.8
12 Kemasik Chukai 19.8
12.1* Kemaman Spurline ECRL Line 12.7
13 Chukai Cherating 14.4
14 Cherating Kuantan Port City 12.2
15.1 Kuantan Port Spurline Kuantan Port City 10.2
15 Kuantan Port City Kota SAS 24.7
16 Kota SAS Gambang 19.8
18 Gambang Maran 56.1
19 Maran Mentakab 40.5
20 Mentakab Bentong 49.4
21 Bentong Gombak Utara 30.9
22 Gombak Utara ITT Gombak 9.0
Phase 2
* ITT Gombak Port Klang 87.7
Note: * = Estimation
Socio-Economic Research Centre 43
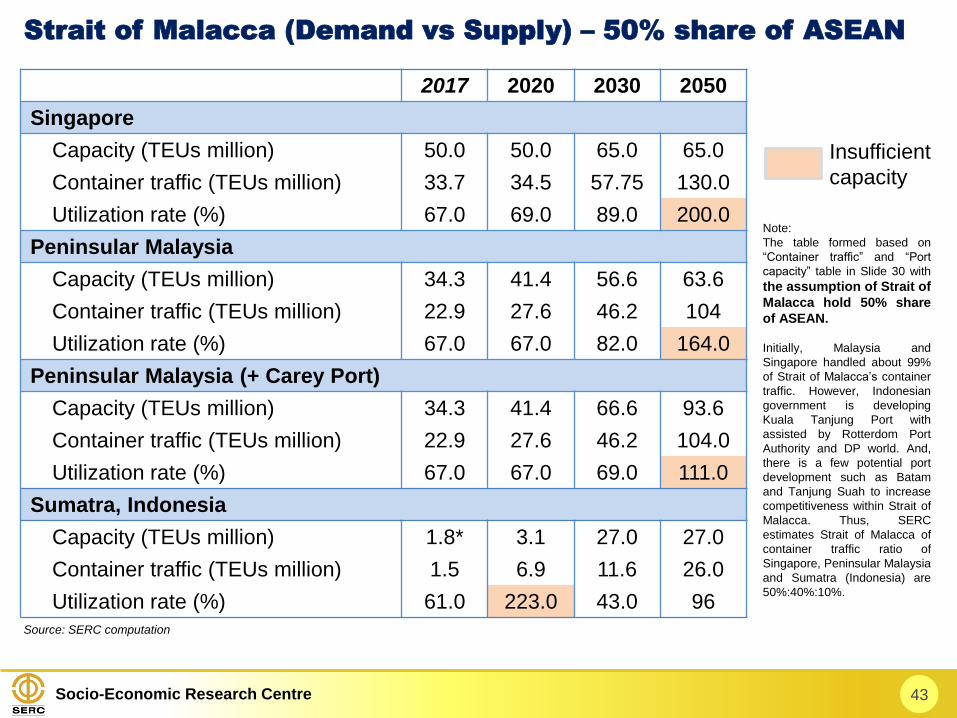
Strait of Malacca (Demand vs Supply) – 50% share of ASEAN
2017 2020 2030 2050
Singapore
Capacity (TEUs million) 50.0 50.0 65.0 65.0
Container traffic (TEUs million) 33.7 34.5 57.75 130.0
Utilization rate (%) 67.0 69.0 89.0 200.0
Peninsular Malaysia
Capacity (TEUs million) 34.3 41.4 56.6 63.6
Container traffic (TEUs million) 22.9 27.6 46.2 104
Utilization rate (%) 67.0 67.0 82.0 164.0
Peninsular Malaysia (+ Carey Port)
Capacity (TEUs million) 34.3 41.4 66.6 93.6
Container traffic (TEUs million) 22.9 27.6 46.2 104.0
Utilization rate (%) 67.0 67.0 69.0 111.0
Sumatra, Indonesia
Capacity (TEUs million) 1.8* 3.1 27.0 27.0
Container traffic (TEUs million) 1.5 6.9 11.6 26.0
Utilization rate (%) 61.0 223.0 43.0 96
Insufficient
capacity
Source: SERC computation
Note:
The table formed based on
“Container traffic” and “Port
capacity” table in Slide 30 with
the assumption of Strait of
Malacca hold 50% share
of ASEAN.
Initially, Malaysia and
Singapore handled about 99%
of Strait of Malacca’s container
traffic. However, Indonesian
government is developing
Kuala Tanjung Port with
assisted by Rotterdom Port
Authority and DP world. And,
there is a few potential port
development such as Batam
and Tanjung Suah to increase
competitiveness within Strait of
Malacca. Thus, SERC
estimates Strait of Malacca of
container traffic ratio of
Singapore, Peninsular Malaysia
and Sumatra (Indonesia) are
50%:40%:10%.
社会经济研究中心
SOCIO-ECONOMIC
RESEARCH CENTRE
谢 谢THANK YOU
Address : 6th Floor, Wisma Chinese Chamber,258, Jalan Ampang, 50450 Kuala Lumpur, Malaysia.
Tel : 603 - 4260 3116 / 3119
Fax : 603 - 4260 3118
Email : [email protected]
Website : http://www.acccimserc.com