Embed Size (px)
Citation preview

Cathay Financial Holdings
2003 1H Financial Results Updates

2
Cathay FHC - Strong Financial Performance
Income & EPS
13.8
21.0
13.110.6
1.85
2.23
2.83
1.81
0.0
5.0
10.0
15.0
20.0
25.0
2001 2002 2003E 2003 1H
0.0
0.5
1.0
1.5
2.0
2.5
3.0
Net income EPS
NT$bn
Total Shareholders’ Equity & ROAE
Total Assets & ROAA
151
75 136151
19.2%14.7%12.4%
0
50
100
150
200
2001 2002 2003E 2003 1H
0%
5%
10%
15%
20%
25%Total assets ROAA
113.4124.5110.974.8
24.6%17.9%14.1%
0
50
100
150
2001 2002 2003E 2003 1H
0%5%10%15%20%25%30%
Book value ROE
Note: Non-consolidated basis
Source: Company reports
NT$bn
NT$bn

3
Cathay FHC – Operational Results
Financial Figures ($NT bn) 2002 FY 2002 1H 2003 1H
Insurance Premiums $ 286.7 $ 141.6 $ 123.3
Investment Income $ 11.0 $ 6.0 $ 6.2
Net Policy Reserve $ 157.2 $ 82.7 $ 59.2
Commission & Fee Income $ 3.6 $ 1.6 $ 2.6
Interest Income $ 82.3 $ 41.4 $ 39.2
Interest Expense $ 15.1 $ 8.5 $ 5.3
Benefits & Claims $ 125.9 $ 59.3 $ 66.8
Net Income (after tax) $ 13.1 $ 5.3 $ 13.8
EPS (NT $) $ 2.23 $ 0.92 $ 1.85

4
NT$bn
0.29
1.3
6.5
13.1
21.0
0.23 (78%)
0.9 (64.3%)
3.6 (55%)
9.4 (71.8%)
13.8 (65.5%)
Cathay Century
CUB
UWCCB
Cathay Life
Cathay CFH
2003 1H Achievement Ratio
2003 FY Proforma Target
2003 2Q - Performance Achievement
5
Subsidiary Contribution Analysis – 2003 1H
Earning Contribution 2003 1H Asset Allocation 2003 1H
Total Earning of subsidiaries: NT$14.0Bn Total Revenue: NT $247.8Bn Total Asset: NT$2,214Bn
Revenue Contribution 2003 1H
CUB7.0%
UWCCB25.1%
Cathay Century
1.5%Cathay
Life 66.4%
CUB2.4%
UWCCB5.7%
Cathay Century
3.2%
CathayLife
88.7%
CUB8.6%
UWCCB30.1%
CathayCentury
0.5%
CathayLife
60.8%

6
19.2%
1.4%
4.7%
1.1%0.9%
CFH CathayLife
CathayCentury
CUB UWCCB
Profit Analysis – 2003 1H
ROAE Analysis
ROAA Analysis
24.6%26.5%
17.0%
12.9%12.7%
CFH CathayLife
CathayCentury
CUB UWCCB
Note: ROA, ROE have been annualized.

7
81.4 76.2
48.6 44.1 35.5
1999 2000 2001 2002 2003 1H
42.3 37.7 36.8 34.2 33.3
1999 2000 2001 2002 2003 1H
18.6 17.6 16.614.6 13.6
1999 2000 2001 2002 2003 1H
% Expense Ratio of Cathay Life
% Expense Ratio of UWCCB
93.6
70.3
95.0
62.7 57.9
1999 2000 2001 2002 2003 1H
%
Combined Ratio of Cathay Century
Source: Company Report
Expense Ratio of CUB
Cathay FHC has been focusing on improving operation efficiency
%

8
Appendix
2003 1H Subsidiary Performance
Cathay Life Cathay Century UWCCB CUB

9
Cathay Life – Operational Results
Financial Figures ($NT Bn) 2002 FY 2002 1H 2003 1H
Total Premium Income $ 280.6 $ 138.6 119.9$ FYP $ 84.5 $ 43.2 28.3$
Claim & Benefit Expense $ 122.9 $ 57.9 65.2$
Net Commission Expense $ 21.5 $ 11.5 10.9$ Net Provision in Policy Reserve $ 156.8 $ 82.5 58.9$ General & Admin Expense $ 14.2 $ 5.6 5.5$
Net Income (after tax) 12.9$ 5.7$ 9.4$
Financial Ratio 2002 FY 2002 1H 2003 1H13 mo. Persistency Ratio 90.1% 90.8% 90.7%25 mo. Persistency Ratio 84.1% 83.1% 84.6%Expense Ratio 14.6% 14.0% 13.6%ROAE (after tax) 17.9% 15.7% 26.5%ROAA (after tax) 1.1% 1.0% 1.4%NPL ratio 1.9% 1.9% 1.8%
Note 1: 2003 1H FYP’s $28.3bn, compared with 2001 1H FYP’s $23.7bn has exhibited growth. 2002 1H FYP’s $43.2bn is mostly attributed to the phenomenal sales of single premium products. 2: Net Provision in Policy Reserve = policy reserve – policy reserve writeback. 3: ROA, ROE have been annualized.
1
2
33
10
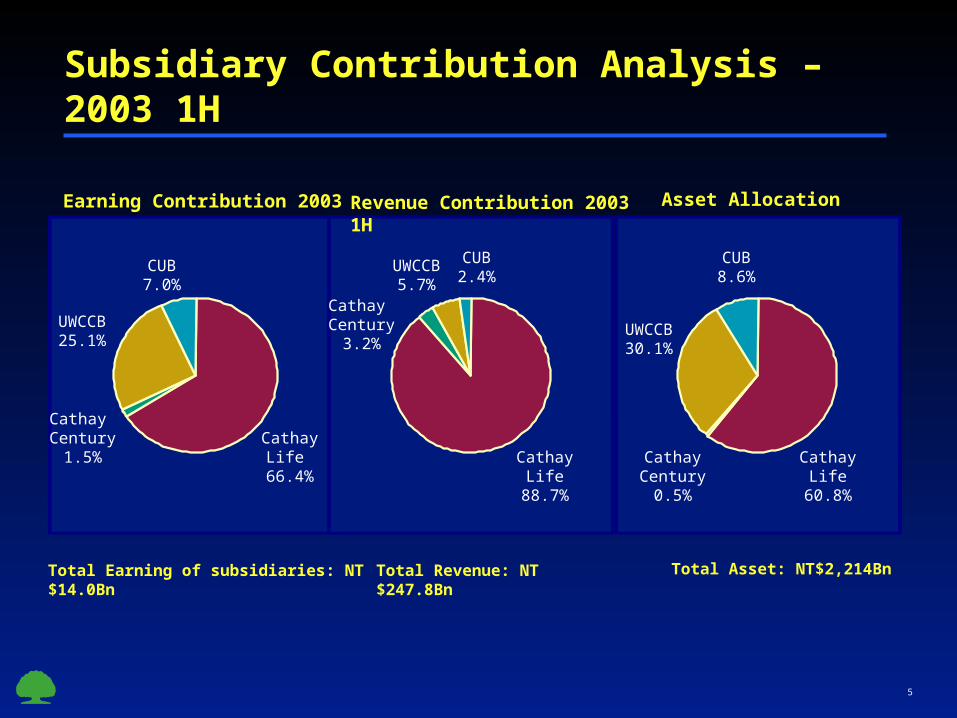
Cathay Century – Operational Results
Note 1: Other operating cost include general & admin expense. 2: ROA, ROE have been annualized.
Financial Figure (NT$ mm) 2002 FY 2002 1H 2003 1H
Premium income $ 6,184 $ 3,053 $ 3,547
Recovered reserve $ 3,337 $ 1,684 $ 3,572
Other operating revenues $ 1,630 $ 754 $ 720
Insurance claims payment $ 3,056 $ 1,380 $ 1,542
Provision for reserve $ 3,728 $ 1,945 $ 3,830
Other operating costs $ 4,019 $ 1,936 $ 2,164
Net Income (after tax) $ 235 $ 156 $ 233
Financial Ratio 2002 FY 2002 1H 2003 1H
Net Expense Ratio 25.0% 24.7% 25.6%
Net Combined Ratio 62.7% 58.7% 57.9%
Solvency Margin 125.9% 123.1% 106.2%
Retention Ratio 60.9% 61.8% 63.1%
ROAA (after tax) 2.6% 3.5% 4.7%
ROAE (after tax) 8.6% 11.6% 17.0%
1
22

11
UWCCB – Operational Results
Note 1: Gross Loans = Loans + Revolving - Credit Card 2: ROA, ROE have been annualized.
Financial Figure (NT$ mm) 2002 FY 2002 1H 2003 1H
Interest Income $ 29,256 15,354$ 11,832$
Interest Expense 11,124$ 6,434$ 3,416$
Net Interest Income 18,132$ 8,920$ 8,416$
Provision for loan losses 24,736$ 20,477$ 2,215$
Non Interest Income 3,591$ 2,186$ 2,345$
Non Interest Expense 7,756$ 3,779$ 3,737$
Net Income (after tax) -$ 8,807 9,831-$ 3,586$
Financial Ratio 2002 FY 2002 1H 2003 1H
Net Interest Margin 3.9% 2.9% 2.8%
Gross Loan / Deposit Ratio 76.3% 68.9% 74.9%
Fee Income to Revenue Ratio 5.9% 4.8% 8.6%
Efficiency Ratio (Cost / Income) 34.2% 29.5% 33.3%
ROAA (after tax) -1.3% -2.8% 1.1%
ROAE (after tax) -14.8% -33.3% 12.9%
NPL Ratio (6mo.) 3.0% 6.1% 2.3%
NPL Ratio (3mo.) 5.0% 9.2% 4.5%
Coverage Ratio 52.2% 62.4% 58.4%
BIS Ratio 11.4% 10.0% 11.0%
1
22

12
Cathay United Bank – Operational Results
Note 1: ROA, ROE have been annualized.
Financial Figure (NT$ mm) 2002 FY 2002 1H 2003 1H
Interest Income 8,839 4,343 4,570
Interest Expense 3,877 2,107 1,521
Net Interest Income 4,961 2,236 3,049
Provision for loan losses 2,041 725 1,756
Non Interest Income 1,665 610 1,431
Non Interest Expense 3,230 1,385 1,799
Net Income (after tax) 1,118 583 854
Financial Ratio 2002 FY 2002 1H 20031H
Net Interest Margin 3.4% 3.1% 3.7%
Gross Loan / Deposit Ratio 78.5% 79.7% 80.7%
Fee Income to Revenue Ratio 12.5% 10.7% 14.5%
Efficiency Ratio (Cost / Income) 44.1% 44.7% 35.5%
ROAA (after tax) 0.7% 0.7% 0.9%
ROAE (after tax) 9.0% 9.8% 12.7%
NPL Ratio (6mo.) 4.4% 4.9% 3.6%
NPL Ratio (3mo.) 10.2% 12.3% 8.5%
Coverage Ratio 40.5% 36.2% 45.1%
BIS Ratio 9.1% 9.2% 10.1%
11