Embed Size (px)
Citation preview

Paper # 345 Topic: Heterogeneous Combustion
1
8th U. S. National Combustion Meeting Organized by the Western States Section of the Combustion Institute
and hosted by the University of Utah May 19-22, 2013
Catalytic Oxidation of Alkanes over Palladium Oxide
Y. X. Xin,1,* H. Wang,2 C. K. Law1
1 Department of Mechanical and Aerospace Engineering Princeton University, Princeton, NJ 08544, USA
2 Department of Aerospace and Mechanical Engineering
University of Southern California, Los Angeles, California 90089, USA
Abstract
Catalytic oxidation of methane, ethane and propane over a palladium oxide (PdO) surface was investigated experimentally by wire microcalorimetry. The oxidation rate was determined for each reactant at the atmospheric pressure in the temperature range of 600 to 800K. The kinetic parameters were extracted from the experimental observation. It is shown that the oxidation of these hydrocarbons over the PdO surface proceeds with a similar mechanism: they undergo dissociative oxidation followed by conversion of the surface fragments to combustion products. The catalytic oxidation rates were found to increase in the order of methane < ethane < propane. The observation can be explained by the C-H bond energies of the corresponding surface intermediates. A detailed surface reaction model was proposed on the basis of literature rate data and the present experimental observation. Keywords: catalytic combustion, Pd-based catalyst, alkane oxidation, mechanism
* Corresponding author: [email protected]

Paper # 345 Topic: Heterogeneous Combustion
2
1. Introduction In hypersonic flight, the supersonic flow through the combustion chamber typically results in
a residence time of milliseconds. The combustion process requires to be completed within this short time period. At the prevailing temperature, the characteristic time scale of the homogeneous, induction time chemistry of flame ignition is usually longer than several miliseconds. Recently, catalytic combustion enhanced by free suspended nanoparticles was shown to be an promising solution to this problem: Shimizu et al. (Shimizu, Abid, Poskrebyshev, Wang, Nabity, Engel, Yu, Wickham, Van Devener, Anderson & Williams 2010; Shimizu & Wang 2010) examined the ignition of methane/air mixture assisted by PdO nanoparticles generated in-situ from a soluble precursor in a flow reactor, and reported a two to three order of magnitude decrease in ignition delay compared to homogeneous ignitions. The catalytic combustion of methane has been extensively studied for the purpose of power generation from natural gas and pollution emission control. Numerous reviews are available in literature (Ciuparu, Lyubovsky, Altman, Pfefferle & Datye 2002; Gelin & Primet 2002; Choudhary, Banerjee & Choudhary 2002). Several surface reaction models have been proposed for methane oxidation over a Pd catalyst (Deutschmann, Schmidt, Behrendt & Warnatz 1996; Sidwell, Zhu, Kee, Wickham, Schell & Jackson 2002). Pd-based catalyst is recognized as the most active for methane combustion, and a few key issues have been identified (Ciuparu, Lyubovsky, Altman, Pfefferle & Datye 2002). Critical to an efficient utilization of palladium as a catalyst include Pd/PdO equilibrium, methane activation, water desorption and catalyst-support interaction. The rate-determining step for the catalytic oxidation of methane is generally considered to be the initial cleavage of the C-H bond over a Pd surface site surrounded Pd-O sites (Aryafar& Zaera 1997; Maillet, Solleau, Barbier & Duprez 1997; Boehman& Niksa 1996). Oxygen desorption and adsorption plays a critical role also since the subsequent surface oxidation reactions rely on the availability of these Pd-O sites. Over the temperature range of interest (600 to 800 K) and the fuel lean condition of this work, the oxidized state is thermodynamically favored for the Pd catalyst (Mallika, Sreedharan & Gnanamoorthy1983), and the current study is limited to the mostly oxidized Pd surface.
The kinetics of catalytic oxidation of ethane and propane have been examined over a Pd foil (Aryafar & Zaera 1997) and supported Pd catalysts (Maillet, Solleau, Barbier & Duprez 1997). The reaction rates generally exhibit approximately zeroth and first order with respect to the partial pressures of oxygen and the hydrocarbon fuel, respectively, especially under the fuel-lean conditions. This observation suggests the similarity between the oxidation of methane and higher alkanes: the initial activation of alkanes over the catalyst surface behaves as the rate controlling step. Unfortunately, there is no direct experimental observation that could be made on the initial activation of ethane or propane over a PdO surface, possibly because the surface intermediates are quickly converted to combustion products. Recently, a series of Density Function Theory (DFT) studies were reported by Weaver et al. (Weaver, Hinojosa, Hakanoglu, Antony, Hawkins & Asthagiri 2011; Antony, Asthagirib & Weaver 2012; Weaver, Hakanoglu, Hawkins & Asthagiri

Paper # 345 Topic: Heterogeneous Combustion
3
2010). The reactions of C1-C3 alkanes over a PdO (101) surface were examined in details. They identified a precursor-mediated mechanism and reported the energy barriers for the various alkane molecules.
Previously, catalytic oxidation of methane was examined experimentally over a PdO surface by wire microcalorimetry ( Zhang, Zhu, Yao, Qi, & Law 2011; Zhang, Xin, Ren, Qi & Law 2012). The experiment allows for a surface reaction model to be examined in some details. The objective of the present study was to extend the work of (Zhang, Xin, Ren, Qi & Law 2012) from methane to ethane and propane. This paper is organized as follows. In Sections 2 and 3, the specifics of the experiment and simulation are discussed. The experimental data as well as simulation results are reported and discussed in Section 4. Main conclusions are summarized in Section 5.
2. Experimental and Simulation Specifications 2.1 Wire Microcalorimetry
Wire microcalorimetry method has been described in detail elsewhere (Zhang, Zhu, Yao, Qi, & Law 2011; Zhang, Xin, Ren, Qi & Law 2012; Hiam, Wise& Chaikin, 1968; Cho & Law 1986). Briefly, the method measures the surface reaction rate by following the heat generated by surface reactions. The experiment is performed over a metallic wire of catalytic material. The wire is connected to an electrical power, which allows for resistive heating. The wire temperature is first increased to a certain value in a non-reactive gas environment, e.g., nitrogen. When the system reaches the steady state, the power input compensates the heat loss from the wire to the environment, and is recorded as the reference value for the subsequent experiment. A reactive mixture is introduced in the reaction chamber and the wire is heated to the same temperature. Because the same thermal energy is lost from the wire to the environment, the difference in the power input between the reactive and non-reactive cases is the heat generated by the surface reaction. The heat release rate could be converted to the reaction rate by considering enthalpy change of the surface reaction.
In the present study, a palladium wire 10 cm in length and 0.1 mm in diameter (99.99%, Aldrich) was used as a catalyst and gases of methane, ethane, propane, oxygen and nitrogen (industrial grade, Airgas) were used as the reagents. For each type of fuel, three reactive mixtures are prepared in a 5.0 liter stainless steel chamber with the compositions of 1-3% CH4, 0.5-1.5% C2H6 and 0.4-1.0% C3H8, all in air. The chosen gas mixtures cover the typical fuel-lean conditions with equivalent ratios ranging from 0.1 to 0.3, well below the flammable limit under atmosphere pressure. Under this condition, homogeneous gas-phase reactions are suppressed.
2.2 Simulations
A well-defined, simple natural convection flow field was generated for the wire microcalorimetry experiment. Simulation was carried out using FLUENT. Since the wire has a

Paper # 345 Topic: Heterogeneous Combustion
4
length much longer than its diameter, the gas phase compositions and surface temperatures are assumed to be constant along the length of the wire. The simulation employs a two-dimensional model on the cross section of the wire, which is illustrated in Fig. 1. Because of the axisymmetric nature of the problem, only half of the wire was considered. Sides of top, right and bottom refer to the gas phase environments immediately adjacent to the wire. They were assigned with room temperature (T0), atmosphere pressure (P0) and fresh reactive mixtures (C0) as the boundary conditions. The catalytic wire was treated as a smooth cylinder with certain surface temperature (TS), where surface reaction occurs leading to heat release. The real wire surface is in fact far from smooth, and the increase in the surface area will be quantified, as will be discussed later. The computational domain size was chosen to be 70 times the wire diameter by a convergence test. Additional details on computations can be found in Ref. (Zhang, Xin, Ren, Qi & Law 2012).
Figure 1. Schematic illustration of the simulation domain.
Gas phase chemistry, thermochemical and transport properties of gas-phase species is
described by USC Mech II (Wang, You, Joshi, Davis, Laskin, Egolfopoulos & Law 2007), which
has 111 species and 784 reactions and is capable of predicting the combustion behaviors of C1-C4

Paper # 345 Topic: Heterogeneous Combustion
5
hydrocarbons. The surface chemistry for methane oxidation over PdO was extended from a
model reported in Ref. (Xin, Lieb, Wang & Law 2013). Relevant reactions were proposed for
ethane and propane. The thermochemical properties of the surface species were derived from
statistical mechanical principles (McQuarrie 1976) with the vibrational frequencies of surface
species used as the input (Simmons, Wang, Marcos & Kller 1991;Yoshinobu, Onchi &
Nishijima1988).
3. Surface Characterization In the oxidizing environment under the surface temperature of interest, the Pd wire becomes
fully oxidized. The oxidation process leads to a significant change in the morphology and compositions of the wire surface. Various techniques may be applied to probe the catalyst surface (Zhang, Zhu, Yao, Qi, & Law 2011), including Scanning Electron Microscopy (SEM) and Energy-dispersive X-ray spectroscopy (EDX). Typical wire surfaces after experiments are shown in Fig. 2 and are well-characterized as a porous PdO layer 1~2 micron in thickness. The wire was pre-treated by a standard procedure (Zhang, Zhu, Yao, Qi, & Law 2011): heated at 923K in nitrogen followed by 2% CH4/air for one hour. After this treatment, the morphology of the wire surfaces remains the same, allowing experimental data being generated in a reproducible manner. The surface area of the wire is larger than that of a smooth cylinder, because of the surface bumpiness and the formation of porous layer. The ratio between these two surface areas was quantified to be 3.5 by Atom Force Microscope (AFM) and wire microcalorimetry in (Xin, Lieb, Wang & Law 2013).
Figure 2. Scanning electron microscopy (SEM) and energy dispersive X-ray (EDX) spectrum of a porous PdO surface after used as a catalyst.

Paper # 345 Topic: Heterogeneous Combustion
6
4. Results and Discussion 4.1 Heat Release Rate and Kinetic Parameters
Fig. 3 presents the heat release rates measured for the oxidation of methane, ethane and propane over the PdO surface. Measurements were conducted over the temperature of 540 to 800 K. Within this temperature range, the surface reaction rate is large enough to be probed by wire microcalorimetry and gas-phase reactions are suppressed. For each fuel, three equivalent ratios were investigated. Fig 3 also provides a comparison of the reactivity of the three fuels with a similar carbon concentration. Fig. 4 shows the fuel disappearance rates derived from the heat release rate measured and the enthalpy of combustion of the fuel. The fuels tested show the same temperature (550K) where the onset of heat release was observed. The heat release rates quickly increase above this temperature. The reactivity of the fuels considered decreases in the order of propane> ethane > methane.
Figure 3. Heat release rates measured for the oxidation of methane, ethane and propane in air over a PdO surface. Symbols are experimental data; lines are drawn to guide the eye.
Paper # 345 Topic: Heterogeneous Combustion
7
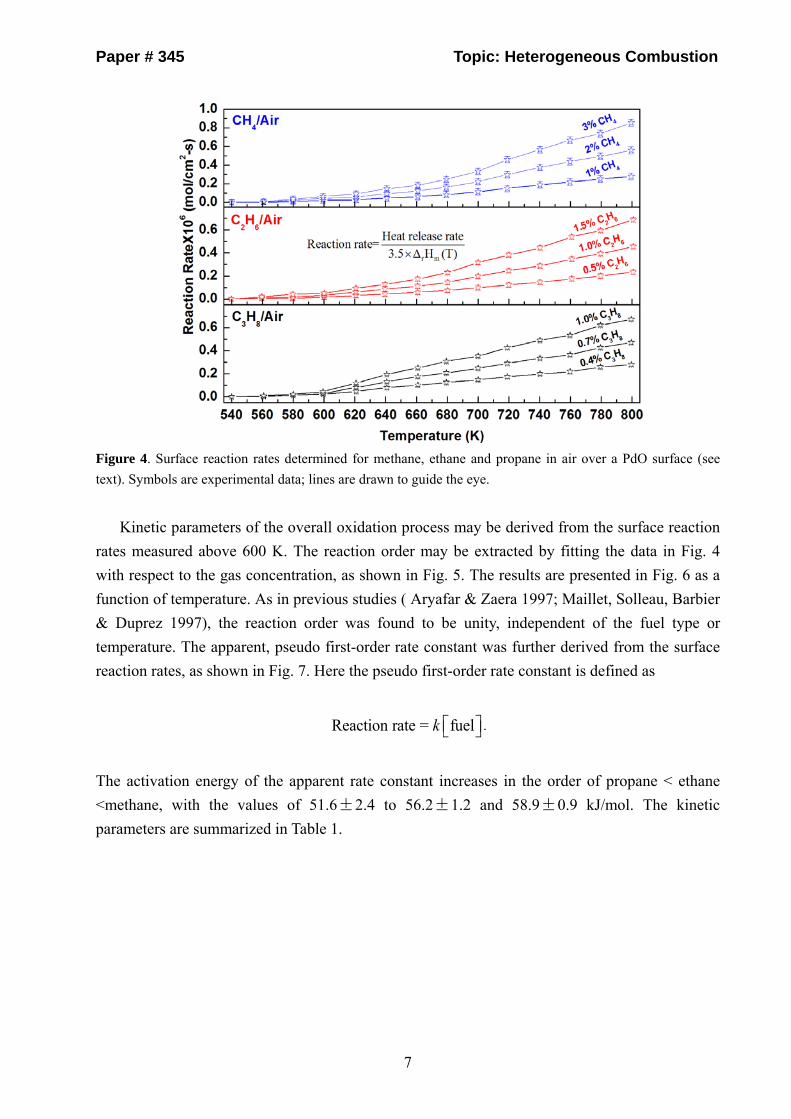
Figure 4. Surface reaction rates determined for methane, ethane and propane in air over a PdO surface (see text). Symbols are experimental data; lines are drawn to guide the eye.
Kinetic parameters of the overall oxidation process may be derived from the surface reaction
rates measured above 600 K. The reaction order may be extracted by fitting the data in Fig. 4 with respect to the gas concentration, as shown in Fig. 5. The results are presented in Fig. 6 as a function of temperature. As in previous studies ( Aryafar & Zaera 1997; Maillet, Solleau, Barbier & Duprez 1997), the reaction order was found to be unity, independent of the fuel type or temperature. The apparent, pseudo first-order rate constant was further derived from the surface reaction rates, as shown in Fig. 7. Here the pseudo first-order rate constant is defined as
Reaction rate = k fuel⎡⎣ ⎤⎦ .
The activation energy of the apparent rate constant increases in the order of propane < ethane <methane, with the values of 51.6±2.4 to 56.2±1.2 and 58.9±0.9 kJ/mol. The kinetic parameters are summarized in Table 1.

Paper # 345 Topic: Heterogeneous Combustion
8
Figure 5. Overall reaction order observed for methane, ethane and propane at 700 K. r is the mole consumption rate of fuels, while c is the mole concentration of fuels in gas phase. Symbols are experimental data; lines are Arrhenius fits to data.
Figure 6. Overall reaction order with respect to the fuel concentration over a PdO surface. Symbols are experimental data; lines are drawn to guide the eye.

Paper # 345 Topic: Heterogeneous Combustion
9
Figure 7. Rate coefficient of the overall reaction of methane, ethane and propane over a PdO catalyst. Symbols are experimental data; lines are Arrhenius fits to data.
Table 1. Global kinetic parameters of alkane oxidation over PdO above 600 K.
Alkane Reaction Order Activation Energy (kJ/mol)
Pre-exponent Factor × 10-4 (cm/s)
Methane 1.00±0.06 58.9±0.9 1.5±0.02 Ethane 0.99±0.05 56.2±1.2 2.9±0.1
Propane 0.98±0.04 51.6±2.4 3.3±0.2
4.2 Gas-Surface Model
The similarity of the global reaction behavior observed for methane, ethane and propane over a PdO surface suggests that the surface reaction mechanism is similar among the three fuels. This hypothesis is also supported by DFT studies of Weaver et al. (Weaver, Hinojosa, Hakanoglu, Antony, Hawkins & Asthagiri 2011; Antony, Asthagirib & Weaver 2012; Weaver, Hakanoglu, Hawkins & Asthagiri 2010). In the present work, a surface reaction model is proposed for the oxidation of ethane and propane, on the basis of a prior work on methane oxidation (Xin, Lieb, Wang & Law 2013). The reaction model is presented in Table 2. The model is comprised of three components: the adsorption of the fuel, the adsorption and desorption of oxygen, and reactions describing the oxidation of surface intermediates, which lead to the formation of the final products: CO2 and H2O. As shown earlier (Shimizu, Abid, Poskrebyshev, Wang, Nabity, Engel, Yu, Wickham, Van Devener, Anderson & Williams 2010; Shimizu & Wang 2010; Xin, Lieb,

Paper # 345 Topic: Heterogeneous Combustion
10
Wang & Law 2013), the predictions of the catalytic activities were largely sensitive to only three reactions: oxygen adsorption/desorption and dissociative adsorption of the fuel molecule.
Table 2. Surface reaction model of methane, ethane and propane oxidation over PdO above 600 K.
No. Reactiona Rate Parametersb A β µ E300K 1f H2+2Pd(S)→2H(S) 1.0c −0.5 0.25 0 1b 2H(S)→H2+2Pd(S) 5.33×10¹⁶ 0.992 0.25 87.4 2f O2+8Pd(S)→2O4(S) 1.0 c −0.5 0.5 0 2b 2O4(S)→O2+8Pd(S) 5.01×10¹⁵ 1.336 0.5 241.1−120θd 3f H(S)+O4(S)→OH4(S)+Pd(S) 2.91×10¹⁸ 1.264 0 94.6−60θd 3b OH4(S)+Pd(S)→H(S)+O4(S) 2.29×10¹⁹ 1.156 0 120.3−30θd 4f H(S)+OH4(S)→H2O4(S)+Pd(S) 6.56×10¹⁵ 1.403 0 31.8 4b H2O4(S)+Pd(S)→H(S)+OH4(S) 2.11×10¹⁸ 1.134 0 83.8+30θd 5f 2OH4(S)→H2O4(S)+O4(S) 3.89×10¹⁷ 1.244 0 14.5+60θd 5b H2O4(S)+O4(S)→2OH4(S) 1.40×10¹⁹ 1.1 0 40.7+60θd 6f H+ Pd(S)→H(S) 1.0 c 0 0 0.0 6b H(S)→H+Pd(S) 1.32×10¹⁰ 1.1 0 261.7 7f O+Pd(S)→O4(S) 1.0 c 0 0 0.0 7b O4(S)→O+Pd(S) 1.64×10¹⁰ 1.1 0 369.7−60θd 8f OH+Pd(S)→OH4(S) 1.0 c 0 0 0.0 8b OH4(S)→OH+Pd(S) 1.60×10¹⁰ 1.1 0 227.5−30θd 9f H2O+Pd(S)→H2O4(S) 1.0 c 0 0 0.0 9b H2O4(S)→H2O+Pd(S) 1.62×10¹⁰ 1.1 0 43.8 10 CO(S)+O4(S)→CO2+5Pd(S) 1.00×10¹⁹ 1.115 0 59.8 11 C(S)+O4(S)→CO(S)+4Pd(S) 1.01×10¹⁹ 1.115 0 62.8 12f CO+Pd(S)→CO(S) 1.0 c 0 0 0.0 12b CO(S)→CO+Pd(S) 1.65×10¹¹ 1.1 0 134 13 CH3(S)+3Pd(S)→C(S)+3H(S) 1.07×10¹⁹ 1 0 85.1 14 CH3(S)+3O4(S)→C(S)+3OH4(S) 1.07×10¹⁹ 1 0 25.1 15 CH4+2Pd(S)→CH3(S)+H(S) 4.00×10⁵ 0 0 196 16 CH4+Pd(S)+O4(S)→CH3(S)+OH4(S) 2.16×10⁴ 0 0 52.7 17 CH2(S)+2O4(S)→C(S)+2OH4(S) 1.07×10¹⁹ 1 0 25.1 18 C2H5(S)+Pd(S)→CH3(S)+CH2(S) 1.07×10¹⁹ 1 0 25.1 19 C2H6+Pd(S)+O4(S)→C2H5(S)+OH4(S) 2.33×10⁴ 0 0 50.1 20 C3H7(S)+2Pd(S)→CH3(S)+2CH2(S) 1.07×10¹⁹ 1 0 25.1 21 C3H8+Pd(S)+O4(S)→C3H7(S)+OH4(S) 1.56×10⁴ 0 0 44.5 a Pd site occupancy of O(S), OH(S) and H2O(S) is set to 4. Surface site density is 1.95×10⁻⁹ mol/cm2. b Rate constant is written in the form k =ATβexp(−E/RT)×10µθPd. Unit of A are given in terms of mol, cm, and s. E is in kJ/mol. c Sticking coefficient. d θ is the total site fraction, i.e., θ = 1− θPd.

Paper # 345 Topic: Heterogeneous Combustion
11
The rate parameter of oxygen adsorption is described in the form of sticking coefficient:
kO2 ,ads =γRT
2πmO2
where γ is the sticking coefficient, R is the gas constant, T is the temperature and mO2 is the molecular weight of molecular oxygen. In the current model, the sticking coefficient considers the influences of surface temperature and coverage and is given as
γ T ,θ( ) = γ 0 T( )F θ( )
where γ 0 T( ) is the sticking coefficient at zero coverage, and F θ( ) is the coverage dependence invariant of surface temperature. Quantitatively, the temperature dependency may be extracted from the molecule beam experiment reported by Engel et al. (Engel 1978),
γ 0 T( ) = exp −0.00185T( )
and the coverage dependency was determined from a Monte Carlo simulation (Xin, Lieb, Wang & Law 2013) as
F θ( ) = exp −8.8θ( )
The rate parameters of oxygen desorption are determined from the equilibrium constant of oxygen adsorption and desorption, which was calculated from thermochemical properties of species involved in this process.
The enthalpy change of oxygen adsorption at the reference temperature of 900 K was taken as 230 kJ/mol (Shimizu, Abid, Poskrebyshev, Wang, Nabity, Engel, Yu, Wickham, Van Devener, Anderson & Williams 2010; Shimizu & Wang 2010), and the heat capacity (cp) and entropy (s) of surface oxygen were derived from statistical mechanical principles (McQuarrie 1976). Fig. 8 shows the equilibrium constant adopted in the present work and that of Deutschmann et al. (Deutschmann, Schmidt, Behrendt & Warnatz 1996). The wire microcalorimetry experiment was then used to determine the rate constant for the dissociative adsorption of the fuel molecule. Fig. 9 presents the Arrhenius plot for the dissociative adsorption rate constants determined from wire microcalorimetry at 2% methane, 1% ethane and 0.7% propane. The activation energy was found to be 52.7±1.3, 50.1±1.8 and 44.5±3.7 kJ/mol, and the pre-exponent factor is (2.2±0.1)×104, (2.3±0.1) ×104 and (1.6±0.1)×104 (cm/s) for methane, ethane and propane, respectively.

Paper # 345 Topic: Heterogeneous Combustion
12
Figure 8. Equilibrium constant of oxygen adsorption on a bare Pd surface.
Figure 9. Rate coefficient of methane, ethane and propane adsorption on Pd(s) over a PdO surface. Symbols are experimental data; lines are Arrhenius fits to data.
4.3 Model Validation and Analysis The proposed model is further applied to the various fuel/air mixtures examined in the
present work. Comparison between experimental data and model prediction is presented in Fig. 10. As expected, the rate constant derived for a particular fuel/air mixture is applicable to all fuel

Paper # 345 Topic: Heterogeneous Combustion
13
concentrations tested. A sensitivity analysis was conducted by examining the oxidation rates by perturbing the pre-exponent factor of the surface reactions. The adsorption/desorption of oxygen and the dissociative adsorption of the fuel are again the only rate-controlling steps as shown in Fig. 11.
Figure 10. Measured (symbols) and predicted (lines) heat release rates for the oxidation of 1-3% CH4, 0.5-1.5% C2H6, and 0.4-1.0% C3H8 in air over a PdO surface.
The oxidation rate of the fuel over a PdO surface is controlled by breaking the C-H bond through dissociative adsorption,
R-H +O4(S)+ Pd(S) kads,RH⎯ →⎯⎯ RH3(S)+OH4(S) ,
For the present work with the surface temperature below 800 K and there is an abundant amount of free molecular oxygen, the oxidation rate of fuel can be expressed basically as
r=kads,RH RH⎡⎣ ⎤⎦θO4 (S)θPd(S) ≅ kads,RH RH⎡⎣ ⎤⎦θO4 (S)
1−θO4 (S)( )
In the previous study on methane catalytic oxidation (Xin, Lieb, Wang & Law 2013) over a PdO surface, the surface coverage of oxygen was shown to be determined by the competition between oxygen adsorption and desorption. This coverage is insensitive to the concentration of the fuel in the gas phase. The same conclusion still holds for ethane and propane. Fig. 12 shows that, the dissociative adsorption rate of the fuel is nearly three orders of magnitude lower than that of oxygen adsorption.

Paper # 345 Topic: Heterogeneous Combustion
14
Figure 11. Sensitivity spectrum of selected reactions critivcal to methane, ethane and propane oxidation over a PdO surface.
The reactivity of an alkane on the PdO surface is related to its ability to undergo adsorption.
This issue has been investigated by Weaver et al. (Weaver, Hinojosa, Hakanoglu, Antony, Hawkins & Asthagiri 2011; Antony, Asthagirib & Weaver 2012; Weaver, Hakanoglu, Hawkins & Asthagiri 2010). The dissociation of alkanes on PdO(101) was shown to occur through a precursor-mediated mechanism. Upon adsorption, an alkane molecule forms dative bonds with coordinatively unsaturated Pd atoms. A kinetic competition between dissociation and desorption of the precursor determines the net probability for dissociation. The energy barriers of methane and propane dissociation have been reported as 64.2 and 51.8 kJ/mol (Weaver, Hinojosa, Hakanoglu, Antony, Hawkins & Asthagiri 2011; Weaver, Hakanoglu, Hawkins & Asthagiri 2010), respectively. These are consistent with the order of reactivity observed for these fuels. In fact, these energy barriers are close to the activation energies measured in the present work.

Paper # 345 Topic: Heterogeneous Combustion
15
Figure 12. Adsorption rate of molecule oxygen compared to those of methane, ethane and propane. Symbols are simulated values; lines are drawn to guide the eye.
5. Conclusions
Catalytic oxidation of methane, ethane and propane on a PdO surface was investigated by wire microcalorimetry over the surface temperature of 600 to 800K, equivalent ratio from 0.1 to 0.3 at the atmosphere pressure. , The global reaction order was found to be close to unity, which indicates the dissociative adsorption of the fuel molecule on the catalyst surface to be the rate determining step for the three fuels tested. The reactivity increases with the carbon number of the fuel with the activation energy increases from propane at 44.5±3.7 kJ/mol to methane at 52.7±1.3 kJ/mol. A detailed gas-surface model is proposed. The activation of the fuel molecule on the catalyst surface may be described by dissociative adsorption and their rate coefficients are quantified by the experimental data. The reactivity of the various alkanes tested is correlated with their ability to undergo adsorption as explained by earlier DFT calculations. Acknowledgements The authors gratefully acknowledge support for this work by the Air Force Office of Scientific Research through a MURI program on Nanocatalysts in Propulsion under the technical monitoring of Dr. Michael R. Berman.

Paper # 345 Topic: Heterogeneous Combustion
16
Reference Antony A., Asthagirib A., Weaver J.F., Phys. Chem. Chem. Phys. 14 (2012), 12202.
Aryafar M., Zaera F., Catal. Lett. 48 (1997) 173.
Boehman A.L., S. Niksa S., Appl. Catal., B 8 (1996) 41.
Cho P., Law C.K., Combust. Flame 66 (1986) 159.
Choudhary T.V., Banerjee S., Choudhary V.R., Appl. Catal., A 234 (2002) 1.
Ciuparu D., Lyubovsky M.R., Altman E., Pfefferle L.D., Datye A., Cat. Rev. - Sci. Eng.44 (2002)
593.
Deutschmann O., Schmidt R., Behrendt F., Warnatz J., Proc. Combust. Inst. 26 (1996) 1747
Engel T., J. Chem. Phys. 69 (1978) 373.
Gelin P., Primet M., Appl. Catal., B 39 (2002) 1.
Hiam L., Wise H., Chaikin S., J. Catal. 10 (1968) 272.
Maillet T., Solleau C., Barbier J., Duprez D., Appl. Catal., B 14 (1997) 85.
Mallika C., Sreedharan O.M., Gnanamoorthy J.B., J. Less-Common Met. 95 (1983) 213.
McQuarrie D.A., Statistical Mechanics; Harper and Row, New York, 1976.
Shimizu T, Abid A.D., Poskrebyshev G., Wang H., Nabity J., Engel J., Yu J.,
Wang H., You X.Q., Joshi A.V., Davis S.G., Laskin A., Egolfopoulos F., Law C.K., USC Mech
Version II. High-Temperature Combustion Reaction Model of H2/CO/C1-C4 Compounds.
http://ignis.usc.edu/USC_Mech_II.htm, May 2007.
Weaver J.F., Hinojosa Jr. J.A., Hakanoglu C., Antony A., Hawkins J.M.,
Asthagiri A., Catalysis Today 160 (2011) 213
Weaver J.F., Hakanoglu C., Hawkins J.M., Asthagiri A., J. Chem. Phys. 132 (2010), 24709.
Wickham D., Van Devener B., Anderson S.L., Williams S., Combust. Flame 157 (2010) 421.
Shimizu T., Wang H., Proc. Combust. Inst. 33 (2010) 1859.
Sidwell R.W., Zhu H.Y., Kee R.J., Wickham D.T., Schell C., Jackson G.S., Proc.

Paper # 345 Topic: Heterogeneous Combustion
17
Combust. Inst. 29 (2002) 1013.
Simmons G.W., Wang Y.N., Marcos J., Kller K., J. Phys. Chem., 95 (1991) 4522.
Xin Y.X., Lieb S., Wang H., Law C.K, in preparation to submit to Combustion and Flame.
Yoshinobu J., Onchi M., Nishijima M., Phys. Rev. B, 38 (1988) 1520.
Zhang T.C., Zhu D.L., Yao N., Qi F., Law C.K., Proc. Combust. Inst. 33 (2011) 1819.
Zhang T.C., Xin Y.X., Ren Z.Y., Qi F., Law C.K., Combust. Flame 160 (2012)14.


![UvA-DARE (Digital Academic Repository) Development of catalytic microreactors … · “packed-bed” microreactors [270], the insertion of palladium membranes inside microreactors](https://img.dokumen.tips/doc/110x75/5f38c6061a204d19f85d9277/uva-dare-digital-academic-repository-development-of-catalytic-microreactors-aoepacked-beda.jpg)