Embed Size (px)
Citation preview

IN7644021813
Catalog No. AP7644
Publication No. 7644
Kinetics of Crystal Violet FadingAP* Chemistry Big Idea 4, Investigation 11
An Advanced Inquiry LabIntroduction
Crystal violet is a common, beautiful purple dye. In strongly basic solutions, the bright color of the dye slowly fades and the solution becomes colorless. The kinetics of this “fading” reaction can be analyzed by measuring the color intensity or absorbance of the solution versus time to determine the rate law.
Concepts
• Kinetics • Ratelaw • Spectroscopy
• Reactionrate • Orderofreaction • Beer’slaw
Background
Crystal violet belongs to a class of intensely colored organic compounds called triphenylmethane dyes. The structure and color of crystal violet depend on pH, making it a valuable acid−base indicator as well as an excellent dye. The major structural form of crystal violet is the monovalent cation, abbreviated CV+, which is shown in Figure 1a. CV+ is the predominant form of crystal violet in the solid state and in aqueous solution across a broad range of pH values from pH 1 to 13. The positive charge shownonthecentralcarbonatominFigure1aisdelocalizedviaresonancetothethreenitrogenatoms.SeeFigure1bforoneofthe three additional resonance forms with the positive charge on a nitrogen atom. Delocalization of the charge across the system of double bonds in the benzene rings stabilizes the carbocation and is responsible for the vibrant purple color of the dye.
Figure 1a. Figure 1b.
C+
N NCH3
CH3CH3
CH3
N NCH3
CH3CH3
CH3
OH+ OH
-
C+
N
N
N
CH3
CH3
CH3 CH3
CH3
CH3
N
N+
N
CH3 CH3
CH3
CH3CH3
CH3
Figure 1a. Figure 1b
Crystal Violet, Pg. 1
Malachite Green, Pg. 6
Figure 1.
C+
N
N
N
CH3
CH3
CH3 CH3
CH3
CH3
N
N+
N
CH3 CH3
CH3
CH3CH3
CH3
N
N
N
CH3 CH3
CH3
CH3CH3
CH3
OH
N
N
N
CH3
CH3
CH3 CH3
CH3
CH3
H
Figure 1a. Figure 1b
Figure 2 Figure 2.
*APisaregisteredtrademarkoftheCollegeBoard,whichwasnotinvolvedintheproductionof,anddoesnotendorse,thisproduct.
CHEM-FAX . . .makes science teaching easier.

– 2 – IN7644
©2013FlinnScientific,Inc.AllRightsReserved.ReproductionpermissionisgrantedonlytoscienceteacherswhohavepurchasedKineticsofCrystalVioletFading,CatalogNo.AP7644,fromFlinnScientific,Inc.Nopartofthismaterialmaybereproducedortransmittedinanyformorbyanymeans,electronicormechanical,including,butnotlimitedtophotocopy,recording,oranyinformationstorageandretrievalsystem,withoutpermissioninwritingfromFlinnScientific,Inc.
In strongly basic solutions the purple CV+cationslowlycombineswithhydroxide ions to formaneutralproduct,CVOH,which is colorless (see Figure 2). The rate of this reaction (Equation 1) is slower than typical acid–base proton transfer reactions and depends on the initial concentration of both crystal violet and hydroxide ions.
CV+ + OH– → CVOH Equation 1
Purple Colorless
Exactly how much the rate changes as the reactant concentration is varied depends on the rate law for the reaction. In the case of the reaction of CV+withOH– ion, the rate law has the general form
Rate = k [CV+]n[OH–]m Equation 2
The exponents n and m are defined as the order of reaction for each reactant and k is the rate constant for the reaction at a particular temperature. The values of the exponents n and m must be determined by experiment. If the reaction is carried out under certain conditions then Equation 2 will reduce to the form
Rate = kʹ [CV+]n Equation 3
where kʹ = k[OH–]m Equation 4
The constant kʹ is a new “pseudo” rate constant incorporating both the “true” rate constant kandthe[OH–]m term. Equation 3 is referred to as a pseudo-rate law because it is a simplification of the actual rate law, Equation 2.
Thepseudo-ratelawisvalidwhentheconcentrationofOH− ions is much greater than the concentration of CV+ ions. Under theseconditionsthe[OH−]m term in Equation 2 will not change much over the course of the reaction and may be treated as a con-stant in the rate equation.
Recallthattheabsorbanceforaspecificconcentrationofasolutionwithafixedpathlengthvariesdirectlywiththeabsorptiv-itycoefficientofthesolution.ThisrelationshipisknownasBeer’slaw.
A = abc Equation 5
where A is absorbance, a is the molar absorptivity coefficient, b is the path length in cm, corresponding to the distance light trav-els through the solution, and cistheconcentrationofthesolution.Beer’slawprovidesthebasisofusingspectroscopyinquantita-tive analysis. Using this relationship, concentration and absorbance may be calculated if one variable is known while keeping a and b constant. This relationship is also extremely valuable in kinetics experiments, making it possible to follow the rate of disap-pearance of a colored substance by measuring its absorbance as a function of time.
Experiment Overview
The purpose of this advanced inquiry lab activity is to use spectroscopy and graphical analysis to determine the rate law for the color-fading reaction of crystal violet with sodium hydroxide. The lab begins with an introductory activity (laboratory tech-nique) for constructing a calibration curve of absorbance versus concentration for the dye crystal violet. A series of known or standard solutions is prepared from a stock solution of crystal violet and the absorbance of each solution is measured at an opti-mumwavelength.ABeer’slawplotofabsorbanceasafunctionofconcentrationmaybeusedtocalculatetheconcentrationofany “unknown” solution of the dye in a rate law experiment. The procedure provides a model for guided-inquiry design of experi-ments to determine the order of reaction with respect to both crystal violet and sodium hydroxide. Additional triphenylmethane dyes, malachite green and phenolphthalein, are also available for optional extension or cooperative class studies.

– 3 – IN7644
©2013FlinnScientific,Inc.AllRightsReserved.ReproductionpermissionisgrantedonlytoscienceteacherswhohavepurchasedKineticsofCrystalVioletFading,CatalogNo.AP7644,fromFlinnScientific,Inc.Nopartofthismaterialmaybereproducedortransmittedinanyformorbyanymeans,electronicormechanical,including,butnotlimitedtophotocopy,recording,oranyinformationstorageandretrievalsystem,withoutpermissioninwritingfromFlinnScientific,Inc.
Pre-Lab Questions
The visible absorption spectrum for crystal violet, CV+, is shown in Figure 3. The concentration of the dye was 12.5 μM (12.5 × 10⁻⁶ M).
0
0.2
0.4
0.6
0.8
1
1.2
1.4
1.6
1.8
350 400 450 500 550 600 650 700 750
Ab
sorb
ance
Wavelength (nm)
Absorption Spectrum for Crystal Violet
Figure 3.
1. Whatwouldbe theoptimumwavelength forgeneratingaBeer’s lawcalibrationcurve for crystalviolet andmeasuringabsorbance versus time for the reaction of CV+withOH–?Explainyouranswer.Recallthatabsorbancemeasurementsaremost accurate and sensitive in the range 0.2–1.0.
2. A calibration curve requires the use of several concentrations of the test solution. Using 25 μM CV solution as the stock solution, complete the following table to show how you would prepare 2.5, 5, 7.5, 10, and 12.5 μM solutions of CV+. Assume that the final solution volume should be 10.0 mL in all cases.
Table 1
CV Stock Solution
A B C D E
Concentration (micromolar, μM)
25 μM 2.5 μM 5.0 μM 7.5 μM 10.0 μM 12.5 μM
Water (mL) 0 5.0 mL
StockSolution(mL)
10.0 5.0 mL
3. Using your optimum wavelength for the experiment, predict the estimated absorbance value for each solution in Table 1. Recordthesevaluesinthetable.Hint:KeepinmindBeer’slawfromEquation5andthefactthatthepathlength(b)andwavelength are constant.
Materials
Crystal violet solution, 25 μM (2.5 × 10⁻⁵ M), 50 mL Cuvets or test tubes
Sodiumhydroxidesolution,NaOH,0.02M,30mL Pipet,serological,10-mL
Water, distilled or deionized Pipet bulb filler
Beaker,borosilicate,50-mL Stirringrod
Spectrophotometerorcolorimeter
Safety Precautions
Dilute sodium hydroxide solution is irritating to eyes and skin. Crystal violet is a strong dye and will stain clothes and skin. Clean up all spills immediately. Wear chemical splash goggles, chemical-resistant gloves, and a chemical-resistant apron. Avoid contact of all chemicals with eyes and skin and wash hands thoroughly with soap and water before leaving the laboratory. Please follow all laboratory safety guidelines.
– 4 – IN7644
©2013FlinnScientific,Inc.AllRightsReserved.ReproductionpermissionisgrantedonlytoscienceteacherswhohavepurchasedKineticsofCrystalVioletFading,CatalogNo.AP7644,fromFlinnScientific,Inc.Nopartofthismaterialmaybereproducedortransmittedinanyformorbyanymeans,electronicormechanical,including,butnotlimitedtophotocopy,recording,oranyinformationstorageandretrievalsystem,withoutpermissioninwritingfromFlinnScientific,Inc.
Laboratory Technique
Constructing a Calibration Curve for Crystal Violet
1. Turn on the spectrophotometer and allow it to warm up for 15–20 minutes before use. Adjust the wavelength setting to the optimum wavelength determined in the Pre-Lab section.
2. Read the entire procedure before beginning and construct an appropriate data table to record measurements. Note: As part of a cooperative laboratory activity, your instructor may assign different groups to prepare different solutions. Each group will need to transcribe and analyze data for all of the solutions and resulting measurements in order to complete the guided-inquiry activity.
3. Using a serological pipet for accuracy, prepare the series of standard dilutions of the crystal violet stock solution. Use the amounts calculated in the Pre-Lab assignment. Lab Hint: To avoid contaminating the stock solution, first use the pipet to addtherequiredamountofdistilledwatertoeachtesttube.Rinsethepipetthreetimeswiththestocksolution,andthenmeasure and add the required amount of stock solution to each test tube. Mix as needed.
4. Measure and record the absorbance (A) of the stock solution and each standard solution (dilution) at the selected wavelength.
5. PrepareaBeer’slawcalibrationcurveofabsorbanceversusconcentrationforcrystalviolet.
Guided-Inquiry Design and Procedure
A. Rate of Reaction of Crystal Violet with Sodium Hydroxide
Form a working group with other students and discuss the following questions.
1. Assume that the reaction of CV+withOH− ions (Equation 1) proceeds to completion, that is, the solution turns colorless. WhatpercentageofOH− ions will remain at the end of reaction if the initial crystal violet to sodium hydroxide mole ratio is 1:1? What if the initial ratio is 1:1000?
2. Reviewtheconditionsforapseudo-ratelawintheBackground section. Which mole ratio described above should be used to ensure that the reaction between CV+andOH− ions can be treated using a pseudo-rate law to determine the reaction order n with respect to [CV+]?
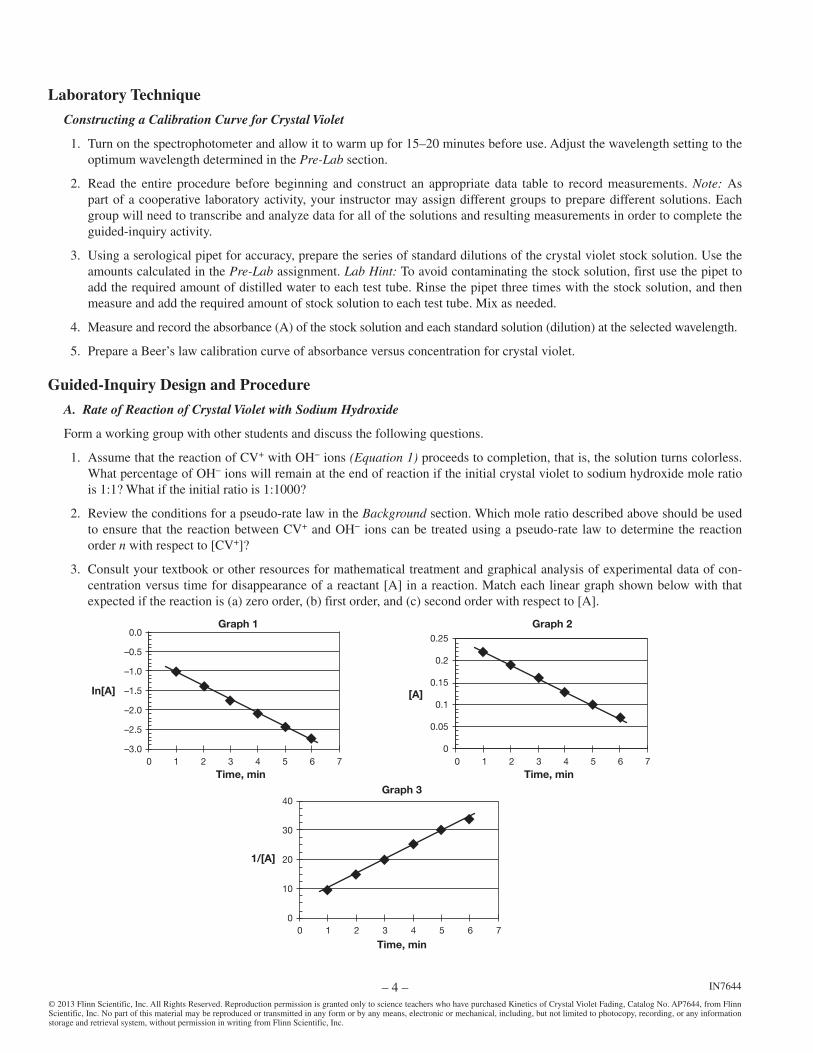
3. Consult your textbook or other resources for mathematical treatment and graphical analysis of experimental data of con-centration versus time for disappearance of a reactant [A] in a reaction. Match each linear graph shown below with that expected if the reaction is (a) zero order, (b) first order, and (c) second order with respect to [A].
Time, min
Graph 20.0
–0.5
–1.0
–1.5
–2.0
–2.5
–3.0
0.25
0.2
0.15
0.1
0.05
0
40
30
20
10
0
0 1 2 3 4 5 6 7Time, min
0 1 2 3 4 5 6 7
Time, min0 1 2 3 4 5 6 7
In[A] [A]
1/[A]
Graph 1
Graph 3

– 5 – IN7644
©2013FlinnScientific,Inc.AllRightsReserved.ReproductionpermissionisgrantedonlytoscienceteacherswhohavepurchasedKineticsofCrystalVioletFading,CatalogNo.AP7644,fromFlinnScientific,Inc.Nopartofthismaterialmaybereproducedortransmittedinanyformorbyanymeans,electronicormechanical,including,butnotlimitedtophotocopy,recording,oranyinformationstorageandretrievalsystem,withoutpermissioninwritingfromFlinnScientific,Inc.
4. Explain how the value of the pseudo-rate constant kʹ can be calculated from the appropriate linear graph shown above for a first-order reaction.
5. Write a detailed step-by-step procedure for a kinetics experiment between crystal violet and sodium hydroxide to deter-mine the order of reaction with respect to CV+. Include the materials, glassware and equipment that will be needed, safety precautions that must be followed, the concentrations of reactants, total volume of solution, order of mixing, timing, accu-racy, etc.
6. Reviewadditionalvariablesthatmayaffectthereproducibilityoraccuracyoftheexperimentandhowthesevariableswillbe controlled.
7. Carry out the experiment and record results in an appropriate data table.
Analyze the results: Use the calibration curve to determine the concentration of CV+ over the course of the rate trial. Calculate the values of ln[CV+] and 1/[CV+] and perform the graphical analysis described in Question 3 to determine the order of reaction n and the value of the pseudo-rate constant kʹ.
B. Order of Reaction with Respect to Sodium Hydroxide
1. The experiment can be extended to determine the order of reaction mwithrespectto[OH−] by varying the concentration ofhydroxideions[OH−]. Assume that the value of the pseudo-rate constant kʹ was measured for two different concentra-tionsof[OH−]. The value of kʹ wasfoundtobe0.13at[OH−]=0.2M,and0.061when[OH−]=0.1M.Showhowyoucanrearrange and combine the following two equations (see Equation 4) to solve for m.
0.13 = kʹ = k[0.2]m and 0.061 = kʹ = k[0.1]m
2. Propose or recommend the concentration of [CV+] that should be used in this part of the experiment when varying the hydroxide ion concentration. Explain.
3. Working cooperatively with other student groups, identify appropriate concentrations of sodium hydroxide for two addi-tional rate trials of the color-fading reaction between crystal violet and hydroxide ions. If needed, carry out some rough trial-and-errorexperimentstomakesurethenewconcentrationsof[OH−] will give reactions that occur at convenient rates, that is, neither too fast nor too slow.
4. Reviewadditionalvariablesthatmayinfluencetheresultsandwriteadetailedstep-by-stepprocedureforPartB.
Analyze the results: Combine the class data as needed. Graph the results as in Part A to determine the values of kʹ at the new hydroxide ion concentrations. Use the mathematical treatment derived in the answer to Question 1 to calculate the reaction order mwithrespecttohydroxideions[OH−].
Opportunities for InquiryDye-Fading Reactions of Phenolphthalein and Malachite Green
Phenolphthalein, which is one of the most common acid−base indicators in general chemistry, belongs to the same general class of compounds as crystal violet. It is a triphenylmethane derivative. Malachite green, a beautiful green dye, also has the same general structure (see Figures 4 and 5). Delocalization of the charge from the central carbon atom in these structures across the system of pi bonds in the attached benzene rings stabilizes the ions and gives rise to intense absorption bands in the visible spec-trum. At high pH values both phenolphthalein and malachite green undergo slow combination reactions with sodium hydroxide to formcolorlessproducts,similartothereactionofcrystalviolet.Stocksolutionsofphenolphthaleinandmalachitegreenareavail-ablefromyourteacher.Obtainthespectraofthesedyesanddesignexperimentstoverifythekineticsoftheirdecolorizationreac-tions at an appropriate wavelength and pH value.
O O-
CO2-
N+
NCH3
CH3CH3
CH3
N NCH3
CH3CH3
CH3
OH
O-
O-
OHCO2
-+ OH
-
+ OH-
Malachite Green
Phenolphthlein
Magenta ColorlessFigure 4. Phenolphthalein

– 6 – IN7644
©2013FlinnScientific,Inc.AllRightsReserved.ReproductionpermissionisgrantedonlytoscienceteacherswhohavepurchasedKineticsofCrystalVioletFading,CatalogNo.AP7644,fromFlinnScientific,Inc.Nopartofthismaterialmaybereproducedortransmittedinanyformorbyanymeans,electronicormechanical,including,butnotlimitedtophotocopy,recording,oranyinformationstorageandretrievalsystem,withoutpermissioninwritingfromFlinnScientific,Inc.
C+
N NCH3
CH3CH3
CH3
N NCH3
CH3CH3
CH3
OH+ OH
-
C+
N
N
N
CH3
CH3
CH3 CH3
CH3
CH3
N
N+
N
CH3 CH3
CH3
CH3CH3
CH3
Figure 1a. Figure 1b
Crystal Violet, Pg. 1
Malachite Green, Pg. 6
Green ColorlessFigure 5. Malachite Green
AP Chemistry Review Questions
Integrating Content, Inquiry and Reasoning
Collision theory offers a simple explanation for how reactions occur—reacting molecules must first collide. In order for col-liding molecules to be converted into products, they must collide with enough energy and with a suitable orientation to break existing bonds in the reactants and form new bonds in the products. Any factor that changes either the total number of collisions or the average energy of the colliding molecules should affect the reaction rate.
1. Usingcollisiontheory,predicthowincreasingthetemperatureshouldaffecttherateofachemicalreaction.Statethepre-diction in the form of an hypothesis and explain your reasoning.
2. Using collision theory, predict how increasing the concentration of a reactant should affect the rate of a chemical reaction. Statethepredictionintheformofanhypothesisandexplainyourreasoning.
Two general methods may be used to determine the rate law for a reaction. The graphical method used in this lab is an inte-grated rate law experiment—it shows how the concentration of a reactant or product depends on time. An alternative method for determining the rate law relies on measuring the initial rate of a reaction for different initial concentrations of reactants. This alter-native method may be called a differential rate law experiment. Consider a classic iodine clock reaction between iodide ions and persulfate ions (Equation 6).
2I−(aq) + S2O82−(aq) → I2(aq) + 2SO4
2−(aq) Equation 6
The following rate data was collected for different initial concentrations of iodide and persulfate ions.
Trial [I−] [S2O82−] Initial rate (mole/Lzsec)
1 0.040 M 0.040 M 7.4 × 10⁻⁶
2 0.080 M 0.040 M 1.5 × 10⁻⁵
3 0.040 M 0.080 M 1.4 × 10⁻⁵
3. Compare trials 1 and 2: How did the concentration of iodide ions change in these two trials, and how did the rate change accordingly? What is the reaction order for iodide ions?
4. Which two trials should be compared to determine the order of reaction with respect to persulfate ions? What is the reac-tion order for persulfate?
5. Write the combined rate law for this version of an iodine clock reaction. Could the rate law have been predicted using the coefficients in the balanced chemical equation? Explain.

– 7 –
©2013FlinnScientific,Inc.AllRightsReserved. IN7644
Teacher’s NotesKinetics of Crystal Violet Fading
Materials Included in Kit (for 24 students working in pairs, or 12 pairs)
Crystalviolet,1%alcoholic,25mL Sodiumhydroxidesolution,NaOH,0.02M,500mL
Malachite green, 1% aqueous, 25 mL Pipets, serological, 10-mL, 12
Phenolphthalein, 1% alcoholic, 35 mL
Additional Materials Needed (for each lab group)
Water, distilled or deionized Pipet bulb filler
Beaker,50-mL Spectrophotometerorcolorimeter*
Computerinterfacesystem* Stirringrod
Computerorcalculatorfordatacollection* Stopwatch(ifnotusingdatacollectionsoftware)
Cuvets or test tubes Tissue or lens paper, lint-free
Data collection software (LoggerPro)
*For use with colorimeter option.
Additional Materials Needed (for Pre-Lab Preparation)
Water, distilled or deionized Pipet, serological, 1-mL
Flask, borosilicate, volumetric, 1000-mL Pipet bulb filler
Pre-Lab Preparation
Crystal Violet solution, 2.5 × 10⁻⁵ M, 1000 mL
To prepare 1000 mL of 2.5 × 10⁻⁵ M crystal violet solution:
1. Fill the volumetric flask about one-half full with distilled or deionized water.
2. Withdraw 1 mL of 1% crystal violet solution using a 1-mL serological pipet. Add this to the 1-liter volumetric flask.
3. Dilute the crystal violet solution to the 1-liter mark. Mix well before dispensing.
Malachite Green solution, 2.7 × 10⁻⁵ M, 1000 mL (optional)
To prepare 1000 mL of 2.7 × 10⁻⁵ M malachite green solution:
1. Fill the volumetric flask about one-half full with distilled or deionized water.
2. Withdraw 1 mL of 1% malachite green solution using a 1-mL serological pipet. Add this to the 1-liter volumetric flask.
3. Dilute the malachite green solution to the 1-liter mark. Mix well before dispensing.
Phenolphthalein solution, 3.1 × 10⁻⁵ M, 1000 mL (optional)
To prepare 1000 mL of 3.1 × 10⁻⁵ M phenolphthalein solution:
1. Fill the volumetric flask about one-half full with distilled or deionized water.
2. Withdraw 1 mL of 1% phenolphthalein solution using a 1-mL serological pipet. Add this to the 1-liter volumetric flask.
3. Dilute the phenolphthalein solution to the 1-liter mark. Mix well before dispensing.

– 8 –
©2013FlinnScientific,Inc.AllRightsReserved. IN7644
Teacher’s Notes continued
Safety Precautions
Dilute sodium hydroxide solution is irritating to eyes and skin. The crystal violet stock solution is flammable. Crystal violet is a strong dye and will stain clothes and skin. Clean up all spills immediately. Wear chemical splash goggles, chemical-resistant gloves, and a chemical-resistant apron. Avoid contact of all chemicals with eyes and skin and wash hands thoroughly with soap and water before leaving the laboratory. Please follow all laboratory safety guidelines. Please review current Material Safety Data Sheets for additional safety, handling, and disposal information.
Disposal
Please consult your current Flinn Scientific Catalog/Reference Manual for general guidelines and specific procedures, and review all federal, state and local regulations that may apply, before proceeding. The crystal violet and sodium hydroxide reaction mixture should be collected and may be neutralized with acid and rinsed down the drain with plenty of water according to Flinn SuggestedDisposalMethod#10.Theleftoversodiumhydroxidemaybestoredforfutureuseorneutralizedwithacidpriortodis-posalaccordingtoFlinnSuggestedDisposalMethod#10.TheexcesscrystalvioletsolutionmaybestoredforfutureuseorrinseddownthedrainwithplentyofexcesswateraccordingtoFlinnSuggestedDisposalMethod#26b.
Alignment to AP* Chemistry Curriculum Framework
Enduring Understanding and Essential Knowledge
Atoms are so small that they are difficult to study directly; atomic models are constructed to explain experimental data on collections of atoms.
1D3: The interaction of electromagnetic waves or light with matter is a powerful means to probe the structure of atoms and molecules, and to measure their concentration.
Chemical changes are represented by a balanced chemical equation that identifies the ratios with which reactants react and products form.
3A2: Quantitative information can be derived from stoichiometric calculations that utilize the mole ratios from the balanced chemical equations. The role of stoichiometry in real-world applications is important to note, so that it does not seem to be simply an exercise done only by chemists.
Reactionratesthatdependontemperatureandotherenvironmentalfactorsaredeterminedbymeasuringchangesinconcen-trations of reactants or products over time.
4A2: The rate law shows how the rate depends on reactant concentrations.
Learning Objectives
4.2 The student is able to analyze concentration versus time data to determine the rate law for a zeroth-, first-, or second-order reaction.
4.1 The student is able to design and/or interpret the results of an experiment regarding the factors (i.e., temperature, concen-tration, surface area) that may influence the rate of a reaction.
Science Practices
1.4 The student can use representations and models to analyze situations or solve problems qualitatively and quantitatively.
2.1 The student can justify the selection of mathematical routine to solve problems.
2.2 The student can apply mathematical routines to quantities that describe natural phenomena.
4.2 The student can design a plan for collecting data to answer a particular scientific question.
5.1 The student can analyze data to identify patterns or relationships.
6.4 The student can make claims and predictions about natural phenomena based on scientific theories and models.
– 9 –
Teacher’s Notes continued
©2013FlinnScientific,Inc.AllRightsReserved. IN7644
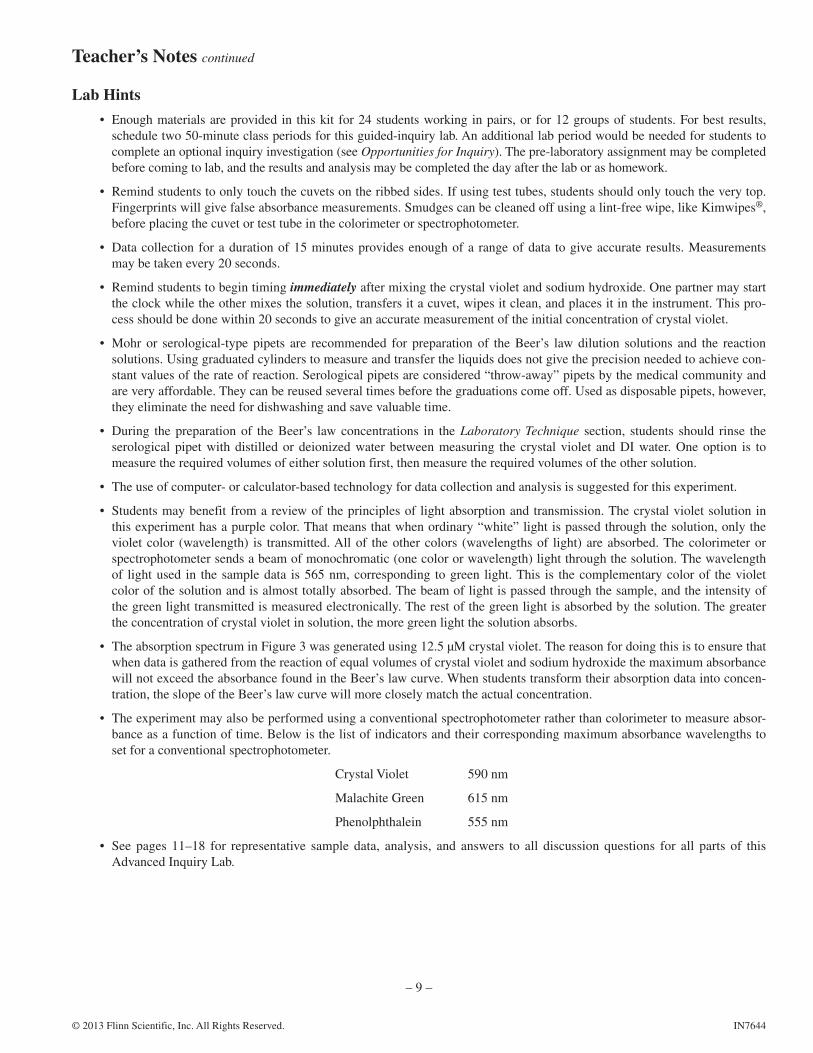
Lab Hints
• Enoughmaterialsareprovided in thiskit for24studentsworking inpairs,or for12groupsofstudents.Forbest results,schedule two 50-minute class periods for this guided-inquiry lab. An additional lab period would be needed for students to complete an optional inquiry investigation (see Opportunities for Inquiry). The pre-laboratory assignment may be completed before coming to lab, and the results and analysis may be completed the day after the lab or as homework.
• Remindstudentstoonlytouchthecuvetsontheribbedsides.Ifusingtesttubes,studentsshouldonlytouchtheverytop.Fingerprintswillgivefalseabsorbancemeasurements.Smudgescanbecleanedoffusingalint-freewipe,likeKimwipes®, before placing the cuvet or test tube in the colorimeter or spectrophotometer.
• Datacollectionforadurationof15minutesprovidesenoughofarangeofdata togiveaccurateresults.Measurementsmay be taken every 20 seconds.
• Remindstudentstobegintimingimmediatelyaftermixingthecrystalvioletandsodiumhydroxide.Onepartnermaystartthe clock while the other mixes the solution, transfers it a cuvet, wipes it clean, and places it in the instrument. This pro-cess should be done within 20 seconds to give an accurate measurement of the initial concentration of crystal violet.
• Mohror serological-typepipets are recommended for preparationof theBeer’s lawdilution solutions and the reactionsolutions. Using graduated cylinders to measure and transfer the liquids does not give the precision needed to achieve con-stantvaluesoftherateofreaction.Serologicalpipetsareconsidered“throw-away”pipetsbythemedicalcommunityandare very affordable. They can be reused several times before the graduations come off. Used as disposable pipets, however, they eliminate the need for dishwashing and save valuable time.
• During thepreparationof theBeer’s lawconcentrations in theLaboratory Technique section, students should rinse the serologicalpipetwithdistilledordeionizedwaterbetweenmeasuring the crystal violet andDIwater.Oneoption is tomeasure the required volumes of either solution first, then measure the required volumes of the other solution.
• Theuseofcomputer-orcalculator-basedtechnologyfordatacollectionandanalysisissuggestedforthisexperiment.
• Studentsmaybenefitfromareviewoftheprinciplesof lightabsorptionandtransmission.Thecrystalvioletsolutioninthis experiment has a purple color. That means that when ordinary “white” light is passed through the solution, only the violet color (wavelength) is transmitted. All of the other colors (wavelengths of light) are absorbed. The colorimeter or spectrophotometer sends a beam of monochromatic (one color or wavelength) light through the solution. The wavelength of light used in the sample data is 565 nm, corresponding to green light. This is the complementary color of the violet color of the solution and is almost totally absorbed. The beam of light is passed through the sample, and the intensity of the green light transmitted is measured electronically. The rest of the green light is absorbed by the solution. The greater the concentration of crystal violet in solution, the more green light the solution absorbs.
• TheabsorptionspectruminFigure3wasgeneratedusing12.5μMcrystalviolet.Thereasonfordoingthisistoensurethatwhen data is gathered from the reaction of equal volumes of crystal violet and sodium hydroxide the maximum absorbance willnotexceedtheabsorbancefoundintheBeer’slawcurve.Whenstudentstransformtheirabsorptiondataintoconcen-tration,theslopeoftheBeer’slawcurvewillmorecloselymatchtheactualconcentration.
• Theexperimentmayalsobeperformedusingaconventionalspectrophotometerratherthancolorimetertomeasureabsor-banceasafunctionoftime.Belowisthelistofindicatorsandtheircorrespondingmaximumabsorbancewavelengthstoset for a conventional spectrophotometer.
Crystal Violet 590 nm
Malachite Green 615 nm
Phenolphthalein 555 nm
• See pages 11–18 for representative sample data, analysis, and answers to all discussion questions for all parts of thisAdvanced Inquiry Lab.

– 10 –
©2013FlinnScientific,Inc.AllRightsReserved. IN7644
Teacher’s Notes continued
Teaching Tips
• CrystalvioletispurpleinaqueoussolutionacrossabroadrangeofpHvaluesfrompH1to13.Inhighlyacidicsolutions(pH <1), crystal violet does behave as an acid−base indicator. As shown in Figure 1b on page 1, there are two very weakly basic nitrogen atoms in the structure of CV+. In solutions of concentrated strong acids, pH <0, both of the nitrogen atoms can be protonated to give a diacid, CVH2
3+, which is yellow. As the pH slowly increases, CVH23+ undergoes stepwise
deprotonation to form first CVH2+, which is greenish blue (pH 1), and then CV+ (purple) at pH 1.8.
• Thisexperimentmaybeusedtoexploretheeffectsofchemicalbuildupintheenvironment.Theenvironmentalimpactofchemicals is a widely studied subject. The build-up of slow-decomposing molecules poses health risks to plant and animal life. Experiments to determine the decomposition rate provide scientists with key insight into the short- and long-term effects of certain chemicals.
Answers to Pre-Lab Questions (Student answers will vary.)
The visible absorption spectrum for crystal violet, CV+, is shown in Figure 3. The concentration of the dye was 12.5 μM (12.5 × 10⁻⁶ M).
0
0.2
0.4
0.6
0.8
1
1.2
1.4
1.6
1.8
350 400 450 500 550 600 650 700 750
Ab
sorb
ance
Wavelength (nm)
Absorption Spectrum for Crystal Violet
Figure 3.
1. Whatwouldbe theoptimumwavelength forgeneratingaBeer’s lawcalibrationcurve for crystalviolet andmeasuringabsorbance versus time for the reaction of CV+withOH–?Explainyouranswer.Recallthatabsorbancemeasurementsaremost accurate and sensitive in the range 0.2–1.0.
There is a maximum absorbance value of about 1.56 at 590 nm. This wavelength would not be optimal because the absor-bance is too high and will yield inaccurate results. An absorbance value of 1.0 is near 540 nm and 610 nm. Either wave-length would be an option because the absorbance is high enough for the stock solution and that more dilute solutions would not have very low absorbance values.
2. A calibration curve requires the use of several concentrations of the test solution. Using 25 μM CV solution as the stock solution, complete the following table to show how you would prepare 2.5, 5, 7.5, 10, and 12.5 μM solutions of CV+. Assume that the final solution volume should be 10.0 mL in all cases.
Table 1
CV Stock Solution
A B C D E
Concentration (micromolar, μM)
25 μM 2.5 μM 5.0 μM 7.5 μM 10.0 μM 12.5 μM
Water (mL) 0 9.0 8.0 7.0 6.0 5.0 mL
StockSolution(mL)
10.0 1.0 2.0 3.0 4.0 5.0 mL
Measure the required volume of distilled water using a serological pipet. Add this to a clean 50-mL beaker or test tube. Rinse the pipet with the dye solution and then measure the required amount of dye in a serological pipet and add to the bea-ker. Mix each solution and then transfer to a cuvet for measuring. Rinse the serological pipet thoroughly before each use.

– 11 –
Teacher’s Notes continued
©2013FlinnScientific,Inc.AllRightsReserved. IN7644
3. Using your optimum wavelength for the experiment, predict the estimated absorbance value for each solution in Table 1. Recordthesevaluesinthetable.Hint:KeepinmindBeer’slawfromEquation6andthefactthatthepathlength(b)andwavelength are constant.
Concentration (μM) Predicted Absorbance*
12.5 0.95
10 0.76
7.5 0.57
5 0.38
2.5 0.19
* Wavelength chosen was 540 nm.
Sample Data, Results, and Analysis
Calibration Curve for Crystal Violet
Concentration (μM) Absorbance*
12.5 0.742
10 0.639
7.5 0.508
5 0.332
2.5 0.159
* Measurement wavelength was 565 nm.
y = 0.0626x R2 = 0.99104
0.9
0.8
0.7
0.6
0.5
0.4
0.3
0.2
0.1
00 2 4 6 8 10 12 14
Ab
sorb
ance
Concentration (micromolar)
Crystal Violet Calibration Curve*
* Measurement wavelength was 565 nm.

– 12 –
©2013FlinnScientific,Inc.AllRightsReserved. IN7644
Teacher’s Notes continued
Part A. Rate of Reaction of Crystal Violet with Sodium Hydroxide
Discussion Questions
1. Assume that the reaction of CV+withOH− ions (Equation 1) proceeds to completion, that is, the solution turns colorless. WhatpercentageofOH− ions will remain at the end of reaction if the initial crystal violet to sodium hydroxide mole ratio is 1:1? What if the initial ratio is 1:1000?
Reaction 1 Reaction 2
CV+ + OH– → CVOH CV+ + OH– → CVOH
I 1 1 0
C –1 –1 +1
E 0 0 1
% CV+ = 0/1 × 100 = 0% % CV+ = 0/1 × 100 = 0%
% OH– = 0/1 × 100 = 0% % OH– = 999/1000 × 100 = 99.9%
2. Reviewtheconditionsforapseudo-ratelawintheBackground section. Which mole ratio described above should be used to ensure that the reaction between CV+andOH− ions can be treated using a pseudo-rate law to determine the reaction order n with respect to [CV+]?
In reaction 1, there will be 0% of both reactants remaining. The mole ratio of CV+:OH– is 1:1, therefore, all of the reac-tants would be consumed in the reaction. In reaction 2, there will be 0% of CV+ remaining and 99.9% OH– remaining. The mole ratio remains the same but with the large excess of OH– in reaction 2, the amount changes very little. Reaction 2 fits the criterion to be used to find the pseudo-rate law because the concentration of hydroxide ions is effectively constant in the reaction.
3. Consult your textbook or other resources for mathematical treatment and graphical analysis of experimental data of con-centration versus time for disappearance of a reactant [A] in a reaction. Match each linear graph shown below with that expected if the reaction is (a) zero order, (b) first order, and (c) second order with respect to [A].
Graph 1 is a first order reaction. Graph 2 is a zero order reaction. Graph 3 is a second order reaction.
4. Explain how the value of the pseudo-rate constant kʹ can be calculated from the appropriate linear graph shown above for a first-order reaction.
The pseudo-rate constant kʹ can be calculated from Graph 1 by adding a line of best-fit to the data points and taking the negative of the slope.
5. Write a detailed step-by-step procedure for a kinetics experiment between crystal violet and sodium hydroxide to deter-mine the order of reaction with respect to CV+. Include the materials, glassware and equipment that will be needed, safety precautions that must be followed, the concentrations of reactants, total volume of solution, order of mixing, timing, accu-racy, etc.
Set the colorimeter or spectrophotometer to 565 nm and zero the instrument using a “blank” of equal volumes of DI water and 0.02 M NaOH. Measure 10.0 mL of 25 μm crystal violet in a serological pipet and add it to a clean 50-mL beaker. Rinse the pipet with distilled water several times and also with the sodium hydroxide solution. Measure 10.0 mL of 0.02 M sodium hydroxide in a serological pipet. Add the sodium hydroxide into the 50-mL beaker with crystal violet. Mix and immediately press “Collect” to begin timing. Transfer the reacting solutions to a cuvet and clean the outside with a lint-free wipe. Place into the colorimeter and close the lid. Record absorbance measurements every 20 seconds for 15 minutes.
I 1 1000 0
C –1 –1 +1
E 0 999 1

– 13 –
Teacher’s Notes continued
©2013FlinnScientific,Inc.AllRightsReserved. IN7644
Part A. Reaction Order with Respect to Crystal Violet
Time (s) Abs [CV] (micromolar) ln[CV] 1/[CV] 0* —— —— —— —— 20* —— —— —— —— 40 0.761 12.164 2.499 0.082 60 0.746 11.917 2.478 0.084 80 0.727 11.615 2.452 0.086100 0.710 11.350 2.429 0.088120 0.695 11.094 2.406 0.090140 0.676 10.801 2.380 0.093160 0.661 10.565 2.358 0.095180 0.644 10.283 2.330 0.097200 0.630 10.063 2.309 0.099220 0.614 9.811 2.283 0.102240 0.598 9.557 2.257 0.105260 0.587 9.377 2.238 0.107280 0.572 9.130 2.212 0.110300 0.557 8.900 2.186 0.112320 0.543 8.669 2.160 0.115340 0.529 8.445 2.134 0.118360 0.515 8.220 2.107 0.122380 0.500 7.995 2.079 0.125400 0.487 7.784 2.052 0.128420 0.475 7.587 2.026 0.132440 0.463 7.402 2.002 0.135460 0.451 7.201 1.974 0.139480 0.439 7.007 1.947 0.143500 0.428 6.830 1.921 0.146520 0.417 6.664 1.897 0.150540 0.406 6.489 1.870 0.154560 0.396 6.319 1.844 0.158580 0.384 6.141 1.815 0.163600 0.375 5.985 1.789 0.167620 0.364 5.821 1.762 0.172640 0.355 5.667 1.735 0.176660 0.345 5.515 1.708 0.181680 0.336 5.362 1.679 0.186700 0.327 5.217 1.652 0.192720 0.318 5.085 1.626 0.197740 0.310 4.946 1.599 0.202760 0.301 4.814 1.572 0.208780 0.294 4.694 1.546 0.213800 0.286 4.567 1.519 0.219820 0.278 4.447 1.492 0.225840 0.271 4.329 1.465 0.231860 0.263 4.208 1.437 0.238880 0.257 4.098 1.411 0.244900 0.250 3.986 1.383 0.251
* The absorbance values for time = 0 and 20 seconds are omitted because the cuvet was not in place during those times and no measurements were taken. Wavelength = 565 nm.

– 14 –
©2013FlinnScientific,Inc.AllRightsReserved. IN7644
Teacher’s Notes continued
14.00
12.00
10.00
8.00
6.00
4.00
2.00
0.00
[CV]
(mic
rom
olar
)
Time (s)
[CV] vs. Time (0.02 M NaOH)*
Not linear
0 100 200 300 400 500 600 700 800 900
ln[C
V]
ln[CV] vs. Time (0.02 M NaOH)*
Time (s)
y = –0.0013x + 2.5737 R2 = 0.99976
3.00
2.50
2.00
1.50
1.00
0.50
0.000 100 200 300 400 500 600 700 800 900
1/[C
V]
Time (s)
0.40
0.35
0.30
0.25
0.20
.015
0.10
0.05
0.00
1/[CV] vs. Time (0.02 M NaOH)*
0 100 200 300 400 500 600 700 800 900
Ab
sorb
ance
Time (s)
Absorbance vs. Time (0.02 M NaOH)* 0.8
0.7
0.6
0.5
0.4
0.3
0.2
0.1
00 100 200 300 400 500 600 700 800 900
Not linear
*This is the initial concentration of the sodium hydroxide.
Based on the shapes of the graphs and lines of best-fit, the order of reaction with respect to crystal violet is first-order. The graph of ln[CV] vs. Time provided a straight line which indicates a first-order reaction. Therefore, the value of kʹ = –slope of the graph: kʹ = 0.0013.
Part B. Order of Reaction with Respect to Sodium Hydroxide
Discussion Questions
1. Theexperimentcanbeextendedtodeterminetheorderofreactionmwithrespectto[OH−] by varying the concentration ofhydroxideions[OH−]. Assume that the value of the pseudo-rate constant kʹ was measured for two different concentra-tionsof[OH−]. The value of kʹwasfoundtobe0.13at[OH−]=0.2M,and0.061when[OH−]=0.1M.Showhowyoucanrearrange and combine the following two equations (see Equation 4) to solve for m.
At [OH–] = 0.02 M At [OH–] = 0.01 M
0.13 = kʹ = k[0.2]m 0.061 = kʹ = k[0.1]m
kʹ = k[OH–]m kʹ = k[OH–]m
0.13 = k[0.02]m 0.061 = k[0.01]m
A ratio of the pseudo-rate constants of Trial 1:Trial 2:
0.13 k[0.02]m
——– = ———— 0.061 k[0.01]m
2.13 = 2m
m = approx. 1 (1.09)
When the concentration of sodium hydroxide was reduced by half, the value of the pseudo-rate constant decreased by half; therefore the order of reaction with respect to sodium hydroxide is first-order.

– 15 –
Teacher’s Notes continued
©2013FlinnScientific,Inc.AllRightsReserved. IN7644
2. Propose or recommend the concentration of [CV+] that should be used in this part of the experiment when varying the hydroxide ion concentration. Explain.
The concentration of CV+ should be the same in both sets of experiments, Parts A and B. Only one variable should be changed at a time in order to determine the effect each has on the reaction rate. If the concentrations of both CV+ and OH– are changed, it would be impossible to determine which reactant caused a change in the rate.
3. Working cooperatively with other student groups, identify appropriate concentrations of sodium hydroxide for two addi-tional rate trials of the color-fading reaction between crystal violet and hydroxide ions. If needed, carry out some rough trial-and-errorexperimentstomakesurethenewconcentrationsof[OH−] will give reactions that occur at convenient rates, that is, neither too fast nor too slow.
Two possible concentrations of sodium hydroxide that can be used are 0.01 M and 0.005 M. These concentrations give convenient concentration ratios to determine the change in the value of kʹ.
4. Reviewanyadditionalvariablesthatmayinfluencetheresultsandwriteadetailedstep-by-stepprocedureforPartB.
In order to determine the order of reaction with respect to NaOH, the concentration of NaOH needs to be changed and the effect on the kʹ calculated. The concentration of crystal violet needs to remain unchanged.
First the colorimeter will be zeroed using a “blank” of equal volumes of DI water and 0.01 M NaOH.
To make10 mL of 0.01 M NaOH, measure 5.0 mL of 0.02 M sodium hydroxide in a serological pipet and add it to a clean 50-mL beaker. Rinse the pipet several times with DI water. Measure 5.0 mL of DI water with the pipet and add to the bea-ker. Mix. This will give 0.01 M NaOH (half of the initial reaction).
Clean the pipet with small portions of the crystal violet solution. Measure 10.0 mL of 25 μm crystal violet solution in the pipet. Transfer this to the 50-mL beaker containing 0.01 M NaOH, mix, and immediately press “Collect” to begin timing. Transfer the mixture from the beaker to a cuvet and clean the outside with a lint-free wipe. Place the cuvet into the color-imeter and close the lid. Record absorbance values every 20 seconds for 15 minutes.
After the absorbance values have been recorded, the values need to be converted to concentration of crystal violet by using the Beer’s law curve. The concentration versus time data will be manipulated and graphed to determine the value of kʹ.

– 16 –
©2013FlinnScientific,Inc.AllRightsReserved. IN7644
Teacher’s Notes continued
Part B. Reaction Order with Respect to Sodium Hydroxide
Time (s) Abs [CV] (micromolar) ln[CV] 1/[CV]
0* —— —— —— ——
20* —— —— —— ——
40 0.783 12.507 2.526 0.080
60 0.776 12.391 2.517 0.081
80 0.767 12.248 2.505 0.082
100 0.759 12.123 2.495 0.082
120 0.750 11.985 2.484 0.083
140 0.739 11.810 2.469 0.085
160 0.733 11.706 2.460 0.085
180 0.724 11.563 2.448 0.086
200 0.716 11.437 2.437 0.087
220 0.707 11.300 2.425 0.088
240 0.700 11.190 2.415 0.089
260 0.692 11.058 2.403 0.090
280 0.684 10.929 2.391 0.092
300 0.677 10.813 2.381 0.092
320 0.670 10.699 2.370 0.093
340 0.661 10.565 2.358 0.095
360 0.653 10.434 2.345 0.096
380 0.646 10.315 2.334 0.097
400 0.637 10.177 2.320 0.098
420 0.630 10.063 2.309 0.099
440 0.623 9.951 2.298 0.100
460 0.616 9.841 2.287 0.102
480 0.609 9.732 2.275 0.103
500 0.602 9.615 2.263 0.104
520 0.594 9.481 2.249 0.105
540 0.588 9.387 2.239 0.107
560 0.581 9.276 2.227 0.108
580 0.574 9.166 2.216 0.109
600 0.566 9.049 2.203 0.111
620 0.560 8.952 2.192 0.112
640 0.553 8.839 2.179 0.113
660 0.547 8.737 2.168 0.114
680 0.539 8.610 2.153 0.116
700 0.534 8.535 2.144 0.117
720 0.528 8.437 2.133 0.119
740 0.522 8.339 2.121 0.120
760 0.517 8.252 2.110 0.121
780 0.510 8.149 2.098 0.123
800 0.504 8.049 2.086 0.124
820 0.497 7.942 2.072 0.126
840 0.491 7.844 2.060 0.127
860 0.485 7.747 2.047 0.129
880 0.479 7.659 2.036 0.131
900 0.474 7.572 2.025 0.132
* The absorbance values for time = 0 and 20 seconds are omitted because the cuvet was not in place during those times and no measurements were taken. Wavelength = 565 nm.

– 17 –
Teacher’s Notes continued
©2013FlinnScientific,Inc.AllRightsReserved. IN7644
Because the order of reaction is first-order with respect to crystal violet and the concentration of sodium hydroxide will still remain relatively unchanged, only a graph for ln[CV] vs. time is needed.
0.90
0.80
0.70
0.60
0.50
0.40
0.30
0.20
0.10
0.000 100 200 300 400 500 600 700 800 900
Ab
sorb
ance
Time (s)
Absorbance vs. Time (0.01 M NaOH)*
y = –0.0006x + 2.5544 R2 = 0.99986
3.0
2.5
2.0
1.5
1.0
0.5
0
ln([
CV
])
Time (s)
ln[CV] vs. Time (0.01 M NaOH)*
0 100 200 300 400 500 600 700 800 900
*This is the initial concentration of the sodium hydroxide.
Opportunities for InquiryDye-Fading Reactions of Phenolphthalein and Malachite Green
The absorption spectra below are for reference if students will be required to complete this section of the experiment.
0
0.1
0.2
0.3
0.4
0.5
0.6
350 400 450 500 550 600 650 700
Ab
sorb
ance
Wavelength (nm)
Absorption Spectrum of Malachite GreenConcentration = 13.5 micromolar
0
0.1
0.2
0.3
0.4
0.5
0.6
350 400 450 500 550 600 650 700
Ab
sorb
ance
Wavelength (nm)
Absorption Spectrum of Phenolphthaleinat pH 12.0
Concentration = 15.5 micromolar
Answers to AP Chemistry Review Questions
Collision theory offers a simple explanation for how reactions occur—reacting molecules must first collide. In order for col-liding molecules to be converted into products, they must collide with enough energy and with a suitable orientation to break existing bonds in the reactants and form new bonds in the products. Any factor that changes either the total number of collisions or the average energy of the colliding molecules should affect the reaction rate.
1. Usingcollisiontheory,predicthowincreasingthetemperatureshouldaffecttherateofachemicalreaction.Statethepre-diction in the form of an hypothesis and explain your reasoning.
If the temperature of a reaction increases, then the rate of the reaction should also increase. This hypothesis is based on the idea that increasing the temperature increases the average speed of the molecules, which should in turn, increase both the number of collisions and, more importantly, the average energy of the collisions.
2. Using collision theory, predict how increasing the concentration of a reactant should affect the rate of a chemical reaction. Statethepredictionintheformofanhypothesisandexplainyourreasoning.
If the concentration of reactants increases, then the rate of the reaction should also increase. This hypothesis is based on the idea that increasing the number of molecules present in solution should increase the rate of collisions between molecules.

– 18 –
©2013FlinnScientific,Inc.AllRightsReserved. IN7644
Teacher’s Notes continued
Two general methods may be used to determine the rate law for a reaction. The graphical method used in this lab is an inte-grated rate law experiment—it shows how the concentration of a reactant or product depends on time. An alternative method for determining the rate law relies on measuring the initial rate of a reaction for different initial concentrations of reactants. This alter-native method may be called a differential rate law experiment. Consider a classic iodine clock reaction between iodide ions and persulfate ions (Equation 6).
2I−(aq) + S2O82−(aq) → I2(aq) + 2SO4
2−(aq) Equation 6
The following rate data was collected for different initial concentrations of iodide and persulfate ions.
Trial [I−] [S2O82−] Initial rate (mole/Lzsec)
1 0.040 M 0.040 M 7.4 × 10⁻⁶
2 0.080 M 0.040 M 1.5 × 10⁻⁵
3 0.040 M 0.080 M 1.4 × 10⁻⁵
3. Compare trials 1 and 2: How did the concentration of iodide ions change in these two trials, and how did the rate change accordingly? What is the reaction order for iodide ions?
In trials 1 and 2, the concentration of persulfate ions was held constant, while the concentration of iodide ions was doubled. The rate increased by a factor of two when [I–] was doubled. Therefore, the reaction is first order with respect to iodide.
4. Which two trials should be compared to determine the order of reaction with respect to persulfate ions? What is the reac-tion order for persulfate?
Comparing the rates of trials 1 and 3 will show how the rate of the reaction depends on the concentration of persulfate ions. In trials 1 and 3, the concentration of iodide ions was held constant while the concentration of persulfate ions was doubled. The rate increased by a factor of two when [S2O8
2–] was doubled. Therefore, the reaction is first order with respect to persulfate.
5. Write the combined rate law for this version of an iodine clock reaction. Could the rate law have been predicted using the coefficients in the balanced chemical equation? Explain.
Rate = k[I–][S2O82–]
The rate law cannot be predicted simply by looking at the balanced chemical equation. The exponents are not the same as the coefficients in the balanced equation.
Reference
AP* Chemistry Guided-Inquiry Experiments, published by the College Board (2013).
Kinetics of Crystal Violet Fading and supporting supplies are available from Flinn Scientific, Inc.
Catalog No. Description
AP7644 Kinetics of Crystal Violet FadingAP1887 Pipet FillerAP1141 Kimwipes, 4½ʺ × 8½ʺGP7056 Serological Pipet, 1-mLAP1082 Test Tubes, 13 mm × 100 mm, Box/12AP9149 Cuvets, ½ʺ, Square Disposable, Pkg./100
Consult your Flinn Scientific Catalog/Reference Manual for current prices.