Embed Size (px)
Citation preview
Food Quality and Preference 30 (2013) 114–127
Contents lists available at SciVerse ScienceDirect
Food Quality and Preference
journal homepage: www.elsevier .com/locate / foodqual
CATA questions for sensory product characterization: Raising awarenessof biases
0950-3293/$ - see front matter � 2013 Elsevier Ltd. All rights reserved.http://dx.doi.org/10.1016/j.foodqual.2013.04.012
⇑ Corresponding author. Tel.: +64 9 925 7000.E-mail address: [email protected] (S.R. Jaeger).
Gastón Ares a, Sara R. Jaeger b,⇑, Christina M. Bava b, Sok L. Chheang b, David Jin b, Ana Gimenez b,Leticia Vidal b, Susana M. Fiszman c, Paula Varela c
a Departamento de Ciencia y Tecnología de Alimentos, Facultad de Química, Universidad de la República, Gral. Flores 2124, C.P. 11800 Montevideo, Uruguayb The New Zealand Institute for Plant & Food Research Ltd., 120 Mt Albert Road, Private Bag 92169, Victoria Street West, Auckland, New Zealandc Instituto de Agroquímica y Tecnología de Alimentos (CSIC), Agustín Escardino, 7, 46980 Paterna, Valencia, Spain
a r t i c l e i n f o
Article history:Received 22 December 2012Received in revised form 22 April 2013Accepted 24 April 2013Available online 7 May 2013
Keywords:Check-all-that apply questionsSensory characterizationConsumersOrder effectsPrimacy bias
a b s t r a c t
Research into sensory product characterizations by consumers using CATA (check-all-that-apply) meth-odology is entering the stage where better understanding is required of ways that CATA question imple-mentation influences sensory profiles and product discrimination. With this aim, five studies wereconducted. Focusing on strategies that have been suggested as ways to reduce primacy and order biasin CATA data, this research explored the effect of these initiatives on the elicited sensory product profilesand conclusions drawn with regards to sample differences. The use of within-subjects randomization ofCATA terms did not significantly affect frequency of use of CATA terms but significantly affected conclu-sions regarding differences among samples, compared to the evaluation of multiple samples with CATAballots where terms are presented in the same order. The use of multiple shorter CATA questions definedby sensory modality also yielded results that significantly differed from when single longer CATA ques-tions with terms from multiple sensory modalities were used. CATA question length and the use of single/mixed sensory modalities both appeared to be contributing factors to these differences. ‘Dynamics of sen-sory perception’, which refers to effects on CATA results arising when CATA terms are assessed in the sen-sory evaluation process (during/after sample consumption) was confirmed as a source of bias. A keylearning from this research was that sensory product characterization and differences among samplesare subject to multiple minor biases related to how the question is formulated and that the exact exper-imental conditions under which CATA data are generated should be reported.
� 2013 Elsevier Ltd. All rights reserved.
1. Introduction 2012). Check-all-that-apply (CATA) questions are one of these
Product characterization is a key activity in sensory science, tra-ditionally performed using descriptive sensory analysis (Meilgaard,Civille, & Carr, 1999; Stone & Sidel, 2004). It is a thorough processthat requires significant resource investment through maintaininga group of assessors that, after undergoing adequate training andassessment of performance, evaluate products (Lawless &Heymann, 2010). Standardization is the dominant paradigm asso-ciated with this method, which aims at balancing the influenceof external factors that cannot be controlled and creating acontrolled environment that is optimal for the objective assess-ment of the sensory characteristics of the focal sample (Lawless& Heymann, 2010; Murray, Delahunty, & Baxter, 2001).
Although traditional product characterization techniques pro-vide accurate and reliable information, new methods for sensoryproduct characterization continue to be developed (Varela & Ares,
(Adams, Williams, Lancaster, & Foley, 2007), and several studieshave shown that results from CATA questions used with consum-ers are very similar to those obtained from trained panels (Ares,Barreiro, Deliza, Giménez, & Gámbaro, 2010; Bruzzone, Ares, &Giménez, 2012; Dooley, Lee, & Meullenet, 2010). It has also beenfound that consumers consider CATA questions an easy task (Ares,Varela, Rado, & Giménez, 2011).
Considering that the use of CATA questions by consumers forsensory product characterization could likely increase, a need isemerging for development of guidelines regarding best practices.It would probably be consensual to say that the method has passedthrough the first stage-gate on the road to gaining widespreadacceptance/popularity. Now, the time has come for ‘‘Stage 2’’,which represents the need to understand pros/cons of sensoryCATA data elicited by consumers in much greater detail. The pres-ent work contributes to this ‘‘Stage 2’’ research by building insightsinto ways that the implementation of CATA influences sensory pro-files and product discrimination. Specifically, we focus on the influ-ence of ways of implementing CATA questions on results andpossible strategies for mitigating these.

G. Ares et al. / Food Quality and Preference 30 (2013) 114–127 115
To inform this work we draw on extant literature from cogni-tive psychology and survey research. Several cognitive processesrelated to information processing are involved when respondentsanswer survey questions. First, respondents have to use text com-prehension and interpretation strategies to understand what thequestion means. Then, they formulate an opinion by accessingrelevant information from memory, and finally they have to usejudgment to provide and edit the response (Strack & Martin,1987). Each of these cognitive processes can be carried out usingtwo types of information processing: systematic or heuristic(Kahneman, 2000). The first type of processing is analytical, slowand effortful, entailing a systematic and comprehensive evalua-tion of relevant information (Evans, 2008). Meanwhile, heuristicprocessing is characterized by automatic, simple and efficientmechanisms that are learned and stored in memory (Gilovich &Griffin, 2002). Considering that heuristic processing requires lessmental effort, when confronted with a survey question, respon-dents will use heuristic processing to reach a default answerbased on automatic processing of salient characteristics of thequestion and background knowledge. After this initial step, sys-tematic processing may occur, depending on a wide range of vari-ables, including the type of task, the instructions given, timeavailable, motivational concerns and personal characteristics(Evans, 2006). Therefore, even if participants are motivated to ex-ert as much cognitive effort as needed to provide accurate re-sponses, systematic processing usually follows heuristicprocessing of salient task features and therefore responses arelikely to be biased by salient characteristics of the task (Chen &Chaiken, 1999).
Applied to CATA questions, this dual-processing of informationwould mean that when consumers have to answer a CATA ques-tion for characterizing the sensory characteristics of a set of prod-ucts, their responses might be biased by heuristic and automaticprocessing of information related to the instructions given forcompleting the task and also to the terms included as responseoptions. One of the consistent findings in the survey/marketingresearch literature on CATA questions is that the order in whichthe response terms are positioned on the list can significantly af-fect the results (Krosnick, 1999; Sudman & Bradburn, 1992). Forexample, terms positioned at the top of a list are commonly usedmore frequently than those at the bottom of the list. To give asensory example, imagine an apple being assessed via a CATAquestion. In a list of 20 terms, ‘juicy’ may appear as the first.When it does, it will be used more often than when it is placedas the last term on the CATA list. This effect has already been re-ported for the application of CATA questions to sensory character-ization of food products (Ares & Jaeger, 2013; Castura, 2009; Lee,Findlay, & Meullenet, 2012). Further, Ares and Jaeger, 2013 re-ported that the order in which attributes are placed within aCATA question can also influenced conclusions regarding differ-ences among samples. This effect can be explained consideringthat respondents seek to minimize cognitive burden and rely onheuristic processing of information for completing the task, rely-ing on primacy or ‘‘ease of recall’’ bias (Tversky & Kahneman,1973), i.e. respondents select the terms of the CATA question thateasily catch their attention and that are easily found within thelist of response options (Krosnick, 1999; Krosnick & Alwin,1987). It is unlikely that primary bias can be eliminated (Schwarz,Hippler, & Noelle-Neumann, 1992). Rather, its existence must beacknowledged and ways to minimize and balance it across partic-ipants and samples developed.
Between-subjects randomization of the order in which theterms are presented in the CATA question has been suggested asa useful strategy to balance primacy bias (Jacoby, 1984; Krosnick,1992). Returning to the apple example, the 20 terms on the listwould remain unchanged, but different assessors would use ballots
where juicy was positioned at the top, the bottom and everywherein between. In the original application of CATA questions in surveyresearch each participant answers the question only once andtherefore randomization only occurs between participants. How-ever, when CATA questions are used for sensory characterizationparticipants usually assess multiple samples. Since each personuses the CATA question more than once, it may therefore be opti-mal if randomization also occurs within participants. Study 1examines the use of within-subjects randomization of sensoryCATA terms.
The extent to which respondents rely on heuristic processingdepends on the characteristics of the task and motivational aspects(Chen & Chaiken, 1999). Primacy bias is more frequent when thetask requires more cognitive effort, i.e. when the list of terms with-in a CATA question is long and when many of them seem equallysuitable (Krosnick & Alwin, 1987). Therefore, a possible option insensory research to mitigate primacy bias would be to divide thetotal number of terms in a CATA question to several shorter modal-ity-specific lists. It is expected that by using separate CATA ques-tions, consumers would pay more attention to all the terms on ashort list and therefore select more terms. This is in contrast tothe situation in which only a single long list of terms is used.Although this approach has been implemented by Castura (2009)and Lee, Findlay, and Meullenet (2013), no comparison with resultsobtained using a single CATA question has been reported to date.Study 2 addresses this gap by comparing a single longer CATAquestion with several shorter modality specific CATA questions.Study 3 extends this comparison by using CATA questions of thesame length featuring either a single or multiple sensory modali-ties. Hereby insight is gained into the origin of observed effectsbeing due primarily to list length or focusing on one sensorymodality at a time.
Studies 4 and 5 advance knowledge about order bias in appli-cations of CATA questions for sensory product characterization.Ares and Jaeger (2013) suggested the existence of an order biaslinked to the dynamics of sensory perception. This was offeredas a competing explanation to primacy bias and was thoughtto have greater potential for some sensory attributes than others.If the terms included in a CATA question are processed in the or-der in which they are presented it would be expected that someterms would be perceived differently depending on whether con-sumers processed them at the beginning or at the end of masti-cation. Juicy was one of the sensory characteristics of apples forwhich this explanation was offered. Specifically, it was suggestedthat when juicy was placed at the bottom of the list and partic-ipants completed the CATA question as they were eating thesample, then it would not be perceived to be quite as juicy asit would have been if juiciness was assessed at first bite (i.e.at the top of the list). Study 4 sought to confirm dynamics ofsensory perception as a source of bias in sensory CATA data. Itreplicated Ares and Jaeger (2013) by using apples as the productcategory of interest, and also extended this work by examining ifthis bias was influenced by the instructions given to participantsregarding sample evaluation. The purpose of Study 5 was to ex-plore if ‘dynamics of sensory perception’ as an explanation fororder effects in sensory CATA data would extend to other prod-uct categories.
In summary, five consumer studies were conducted and to-gether these deliver insight of the influence of the implementationof CATA methodology on sensory product characterizations elicitedby consumers. For practical reasons, the empirical work used mul-tiple product categories and was conducted in three countries,which contributes to the generalization of the findings. Becausethe contribution made by this research is methodological, atten-tion will not be given to product/population specific aspects ofthe results.
116 G. Ares et al. / Food Quality and Preference 30 (2013) 114–127
2. Methodology
2.1. Study 1: Within-subjects randomization of sensory CATA terms(milk chocolate)
Study 1 implemented within-subjects randomization of sensoryCATA terms and compared this approach with the practice of usingCATA questions where terms are presented in the same orderacross multiple product evaluations.
2.2. Participants
Consumers (n = 180) completed Study 1 as part of a larger studyon sensory odour acuity and food preferences. They were aged 18–65 years old (62% female) and self-identified as Caucasian. All par-ticipants lived in Auckland, New Zealand. The sample comprisedvarying household compositions, income levels, education levels,etc. but was not representative of the general population in Auck-land. Participants gave written informed consent and were com-pensated in cash.
2.2.1. SamplesTwo types of milk chocolate from the same manufacturer were
used (Whittaker’s creamy milk chocolate and Whittaker’s Mada-gascar milk chocolate 33% cocoa solids). The two samples lookedidentical and were served (at room temperature) as one ‘square’(�5 g) of chocolate in a 120 ml plastic cup labelled with a 3-digitcode.
2.2.2. Experimental design, CATA lexicon and data collectionThree experimental treatments were implemented in a be-
tween-subjects design to which participants in groups of 10 wererandomly assigned. In Treatment A, 15 CATA terms were presentedin a fixed order (R1) determined at random and this order was usedfor both sample 1 and sample 2 (counter-balanced sample presen-tation order). Treatment B used two CATA ballots with two differ-ent fixed orders of the 15 sensory terms, which were determined atrandom. One order of terms was that used in Treatment A (R1); theother order of CATA terms was denoted R2. The presentation orderof ballot versions (R1 and R2) was counter-balanced and interlock-ing with counter-balanced sample presentation order. In Treat-ment C the two ballot versions were R1 and a third fixedordering (R3), randomly selected. Again, the presentation orderof ballot versions (R1 and R3) was counter-balanced and interlock-ing with counter-balanced sample presentation order.
The 15 sensory terms were selected on the basis of bench toptesting with sensory staff at Plant & Food Research (PFR) and pre-vious CATA sensory profiling of the creamy milk chocolate sample(Jaeger et al., 2013). The terms were: aftertaste, bittersweet, choc-olate:strong, chocolate:weak, creamy, crumbly, dry, fruity, hard,melting, mouth coating, silky/velvety, smooth, sticks to teeth andsweet.
Once the CATA assessments were complete, participants an-swered two questions about the task: ease of selecting words fordescribing samples and difficulty of completing the sensory ques-tionnaire, both on 7-point Likert scales (strongly disagree; stronglyagree).
Participants completed Study 1 subsequent to other taste tests,but following a �10 min break to minimize sensory fatigue. Thetwo chocolate samples were assessed with a one-minute break inwhich rinsing with water was compulsory. Data collection tookplace in standard sensory booths under controlled temperatureand airflow conditions. Artificial white lighting was used.
2.3. Study 2: Multiple shorter modality-specific CATA questions (icecreams)
Study 2 examined whether results obtained from a single CATAquestion differed from those where the list of CATA terms was di-vided into multiple shorter modality-specific CATA questions.
2.4. Participants
Participants in Study 2 (n = 84, 23–68 years old, �30% male),who were consumers of vanilla ice cream were recruited in cafete-rias and public areas of the scientific park of the University ofValencia. The consumer sample comprised varying householdcompositions, income levels, education levels, etc. but was not rep-resentative of the general population in Valencia, Spain.
2.4.1. SamplesThe reference ice cream formulation was: fluid skimmed milk
(36%), 30% whipping cream (36%), white sugar (11.5%), pasteurizedegg yolk (14%) and hydrocolloid mix stabilizer (0.5%, Lygomme1005, Cargill). By changing the formulation to include/exclude sta-bilizer, egg and/or cream, six ice creams that had very differentsensory properties were created. Where ingredients were elimi-nated from the reference formulation, additional fluid skimmedmilk was used to reach the same final volume of ice cream mix (be-fore whipping). All samples contained the same amount of sugarand were flavoured with vanilla.
Ice cream samples were prepared by mixing all ingredients withthe pre-heated milk (60 �C) to maximize the solubilisation, thenthe temperature was rapidly lowered by up to 4 �C in an ice-bath.The base-mix was then stored overnight under refrigeration for24 h and it was whipped in a domestic ice cream maker for20 min and stored at �27 �C in individual containers until analysis.The day before the consumer test, samples were transferred to�17 �C, and were served at �10 �C to consumers in capped isother-mal polypropylene containers.
2.4.2. Experimental design, CATA lexicon and data collectionThe experimental design defined two treatments, which were
used in a between-subjects approach. One group of participants(n = 42 consumers) received a single CATA question featuring 26attributes, which had been previously selected on the basis ofavailable literature and informal tasting by researchers and a sen-sory descriptive panel. The instruction given to participants in thisgroup was: ‘‘Please, check all that applies to the vanilla ice creamyou tasted.’’ The 26 selected attributes were randomized betweenproducts and across consumers, the second group of participants(42 consumers) described the ice cream samples using the same26 terms. However, instead of a single CATA questions, they an-swered four CATA questions by modality, as follows: ‘‘Please, checkall that applies to the appearance of the vanilla ice cream you aretasting’’, comprising the attributes: rough surface, creamy appear-ance, white colour, yellow colour, crystallized; and the same ques-tion for flavour (sweet, creamy flavour, egg flavour, vanilla flavour,milky flavour), texture (soft, hard, smooth, creamy, rough, gummy,springy, cold, it melts quickly, it melts slowly, greasy, airy, dense,easy to take a spoonful), and residual sensation (greasy coating,aftertaste). The attributes were randomized within each modalitybetween products and across consumers.
Participants completed the task after scoring four hedonicterms (overall liking, appearance liking, texture liking and flavourliking). Samples were assessed in a sequential monadic seriesaccording to a balanced random design (Williams’ design). Samplescould be tasted more than once. The test took place in computer-ized standard sensory booths, under white lighting, controlledtemperature (23 �C) and airflow conditions.
G. Ares et al. / Food Quality and Preference 30 (2013) 114–127 117
2.5. Study 3. Single and mixed modality sensory CATA questions(crackers)
Study 3 extended Study 2 by comparing CATA questions of sim-ilar length that featured CATA terms from only one or from multi-ple sensory modalities.
2.6. Participants
Consumers (n = 120), who completed Study 3 as part of a largerstudy on bakery products, were recruited from the consumer data-base of Departamento de Ciencia y Tecnología de Alimentos (Mon-tevideo, Uruguay) based on their consumption of bakery productsand crackers, as well as their interest and availability to participatein the study. They were aged 18–60 years old (64% female). Thesample comprised varying household compositions, income levels,education levels, etc. but was not representative of the generalpopulation in Montevideo. Participants gave written informed con-sent and were compensated with a small gift.
2.6.1. SamplesThree samples of crackers (named A–C) were evaluated. The
samples, which were commercial brands available in the Uru-guayan market, were purchased from local supermarkets. Onecracker of each sample was served in a plastic plate labelled witha 3-digit code.
2.6.2. Experimental design, CATA lexicon and data collectionThe experimental design defined three treatments, which were
used in a between-subjects approach to which participants wererandomly assigned.
One group of participants (n = 40) received a single CATA ques-tion featuring 21 attributes, which were selected on the basis ofavailable literature (Vázquez, Curia, & Hough, 2009) and previousconsumer studies. The instruction given to participants in thisgroup was: ‘‘Check all the terms that you consider appropriate todescribe this cracker’’. The terms were: hard, toasted colour,greasy, salty, big, adhesive, dry, toasted flavour, thin, heteroge-neous colour, crunchy, sour, tasteless, homogeneous colour, soft,off-flavour, thick, small, aftertaste, brittle, oily flavour. The secondgroup of participants (n = 40) answered three CATA questions com-prising 7 of the 21 terms, for multiple modalities. The third groupof participants (n = 40) answered three CATA questions by modal-ity, as follows: ‘‘Check all the terms you consider appropriate to de-scribe the appearance of this cracker’’, comprising the attributes:toasted colour, big, thin, heterogeneous colour, homogeneous col-our, thick and small; and the same question for texture (hard,greasy, adhesive, dry, crunchy, soft, brittle) and flavour (salty,toasted flavour, sour, tasteless, off-flavour, aftertaste and oilyflavour).
Participants completed the task after scoring their overall likingusing a 9-point hedonic scale. Once the CATA assessments werecomplete, participants answered two questions about the task: dif-ficulty of completing the task and tediousness of the task, both on9-point scales (from ‘not at all’ to ‘very’).
Samples were assessed monadically according to a balancedrandom design (Williams’ design). Samples could be tasted morethan once. The test took place in standard sensory booths, underwhite lighting, controlled temperature (23 �C) and airflowconditions.
2.7. Study 4: ‘Dynamics of sensory perception’ as a contributing factorto order effects in sensory CATA responses (apples)
Study 4 first sought to replicate Ares and Jaeger (2013) whosuggested ‘dynamics of sensory perception’ as an explanation for
order effects in sensory CATA data, and secondly it explored if thisbias was influenced by the instructions given to participantsregarding sample evaluation.
2.8. Participants
Participants (n = 113) were from the Auckland general popula-tion (18–65 years old, 61% female). They self-identified as Chineseand had lived in New Zealand for less than 3 years. The data werecollected as part of a larger study on preferences for apples. All par-ticipants were compensated in cash.
A majority of participants (77%) had taken part in a near identi-cal study a few months prior (see Study 3 in Ares and Jaeger(2013)). There were no systematic differences in responses be-tween these subject groups.
2.8.1. SamplesSamples were five cultivars of apples. Four were commercially
available (Tentation™, ‘Cripps Pink’ (Pink Lady�), ‘Fuji’ and ‘Bosko-op’) and one was a pre-commercial advanced selection. All fruitwas grown at research orchards in Hawke’s Bay, New Zealand,and harvested at commercial maturity. Apples were transportedto Auckland and stored at 1 �C until required. On the day of testing,apples were removed from cool store, washed and left to dry atroom temperature. Ten minutes prior to serving, apples were cutinto quarters and cored. If any bruising was observed, the samplewas replaced or slightly trimmed to remove discoloured tissue.During testing, red lighting was used to mask differences in enzy-matic browning between the tested cultivars.
2.8.2. Experimental design, CATA lexicon and data collectionThe experimental design defined two treatments, which were
used in a between-subjects design. The CATA ballot was un-changed in the two treatments, but the instructions given to par-ticipants varied. One group was instructed to: ‘‘Please take a biteof this apple and immediately start completing this form. Selectall of the words that describe this apple as you are eating it’’. Inthe second group the instructions were: ‘‘Please taste this appleand focus on its sensory characteristics while eating it. Whenyou have finished eating, complete this form taking into accountall of the sensory sensations you experienced while eating the ap-ple. Please do not try the sample again while completing thisform.’’
A total of 16 sensory terms were included, developed from pre-vious literature (e.g. Andani, Jaeger, Wakeling, & MacFie, 2001;Daillant-Spinnler, MacFie, Betys, & Hedderley, 1996; Jaeger, Anda-ni, Wakeling, & MacFie, 1998), discussion with colleagues and pilottesting with staff at Plant & Food Research. They were a combina-tion of flavour and texture terms (presented in two columns): che-wy, bland, tart/sour, spongy, citrus, floral, off-flavour, crisp/crunchy, sweet, dry/mealy, earthy, tropical, soft, firm, juicy andtough skin. Seeking to determine that ‘dynamics of sensory percep-tion’ bias can occur depending on when a sensory attribute is as-sessed, the CATA terms were deliberately listed on the ballot inan order anticipated to promote such effects.
The study was conducted using a two-part ballot that firstelicited the sensory product characterization and secondlyproduct-elicited emotions and overall liking. Only data from CATAevaluations are considered here. Testing was conducted in stan-dard sensory booths, where temperature and air circulation wascontrolled. Samples were presented monadically, in a 120 mlplastic cup coded with a 3-digit label. Water was available forrinsing. The presentation order of samples was randomized acrossparticipants.
118 G. Ares et al. / Food Quality and Preference 30 (2013) 114–127
2.9. Study 5: ‘Dynamics of sensory perception’ as a contributing factorto order effects in sensory CATA responses (flavoured water)
Study 5 sought to obtain evidence that ‘dynamics of sensoryperception’ as a contributing factor to order effects in sensory CATAresponses extends beyond the product category of apples.
2.10. Participants
Participants were the same group of individuals who took partin Study 1 of this research.
2.10.1. SamplesTwo samples were used: plain water and water containing b-io-
none (151 ppb; CAS 79-77-6; food grade, 85% purity). To increasesolubility of b-ionone in water it was initially dissolved in a smallamount of 96% food-grade ethanol. Aliquots of 15 ml were placedin 60 ml transparent plastic cups. These were covered with a lidthrough which a straw was inserted. Samples were presented thusto prevent orthonasal stimulation. Three-digit random codes wereused to identify samples.
2.10.2. Experimental design, CATA lexicon and data collectionThe participants’ task was to drink the samples (presented
monadically) and complete a CATA question by selecting alldescriptors they considered to be applicable from a list of 13terms: rose/floral/violets, fragrant/aromatic, perfume-like, soap-like, sweet, salty, sour/acid, natural, bland, chemical/disinfectant,earthy/mouldy and aftertaste. These descriptors were based on ex-tant literature (Dravnieks, 1985; Plotto, Barnes, & Goodner, 2006)and pilot work by PFR sensory team staff and trained panellists.Participants were randomly assigned to one of two treatments(i.e., between-subjects design), which differed only with respectto the order that sensory descriptors appeared within the CATAquestion. In one of the treatments, CATA terms were listed in theabove order (hereafter referred to as ‘perception’ order), whereasthey were listed in the reverse order in the other treatment (i.e.,aftertaste, earthy/mouldy, chemical/disinfectant, bland, natural,sour/acid, salty, sweet, soap-lie, perfume-like, fragrant/aromatic,floral/rose/violets) (hereafter referred to as ‘reverse perception’ or-der). The ordering of terms in the ‘perception order’ ballot wasdecided by discussion among PFR sensory team staff experiencedin working with b-ionone.
Data collection took place in sensory booths under white light.Temperature and positive airflow was controlled. Presentation or-der of samples was fixed, always presenting the water samplewithout b-ionone first. This was done to avoid carry-over effectsassociated with b-ionone perception. Any bias caused by thisempirical decision was assumed to have similar effects on partici-pants in the two experimental treatments groups.
2.11. Data analysis
Similar analyses were performed on the data from each of thefive studies.
Chi-square tests were used to compare participants in the treat-ment groups with respect to socio demographic and backgroundcharacteristics. This was used to confirm that differences in CATAresponses between the treatment groups could be linked to exper-imental treatments (ballot versions or instructions), as opposed tobeing due to sample group differences.
For each experimental condition, frequency of use of each sen-sory attribute was determined by counting the number of consum-ers that used that term to describe each sample.
Fisher’s exact test (Fisher, 1954) was used to determine signif-icant differences between experimental treatments in the total
number of terms mentioned by consumers to describe the wholesample set, and differences in the frequency of mention of eachterm. Fisher’s exact test was also used to test, on a sample-by-sam-ple basis whether the frequency of use for a term differed acrossballot versions.
In Studies 1 and 3, the change of frequency of use of CATA termsin the three experimental treatments was determined using chi-square test. This analysis was also performed at the level of eachindividual term of the CATA question.
Cochran’s Q test (Manoukian, 1986) was carried out separatelyon data from each ballot version in order to identify significant dif-ferences between samples for each of the terms included on theCATA question. Comparison of results from this test across exper-imental treatments (ballot versions or instructions) answered thequestion of whether they affected conclusions regarding differ-ences between samples.
In Studies 2 and 4 the effect of experimental treatments onsample configuration was assessed using Correspondence Analysis(CA) on CATA counts (Pagès, 2004). The regression vector (RV)coefficient (Robert & Escoufier, 1976) was calculated between thefirst two axes of the partial configurations from CA to analyze sim-ilarity between sample configurations from different experimentalconditions.
Easiness to select words, as well as difficulty and tediousness oftest scores from Studies 1 and 3 were compared across experimen-tal treatments using Kruskal–Wallis test.
All statistical analyses were performed using XLStat 2009(Addinsoft, Paris, France) and R language (R Development CoreTeam, 2007) using FactoMineR (Lê, Josse, & Husson, 2008).
3. Results
3.1. Study 1: Within-subject randomization of CATA terms (milkchocolate)
The purpose of Study 1 was to compare within-subjects ran-domization of sensory CATA terms with keeping the order of CATAterms constant across multiple samples. Assigned to one of threegroups, participants assessed two chocolate samples, for whichthe sensory terms were listed in same or different order (R1/R1,R1/R2 or R1/R3).
3.1.1. Frequency of use of CATA termsA chi-square test revealed that the frequency of use of CATA
terms to characterize the two milk chocolate samples did not de-pend on which set of ballots (i.e., R1/R1, R1/R2 or R1/R3) was used(v2 = 14.5, p = 0.98). This result extended to analysis at the level ofindividual CATA terms (p > 0.24). Therefore, within-subjects ran-domization of CATA terms appears not to have an impact on fre-quency of use of terms, relative to when participants assess twosamples using CATA ballots where the order of terms is unchanged.
3.1.2. Differences between samplesWhen Cochran’s Q test was used to test for differences between
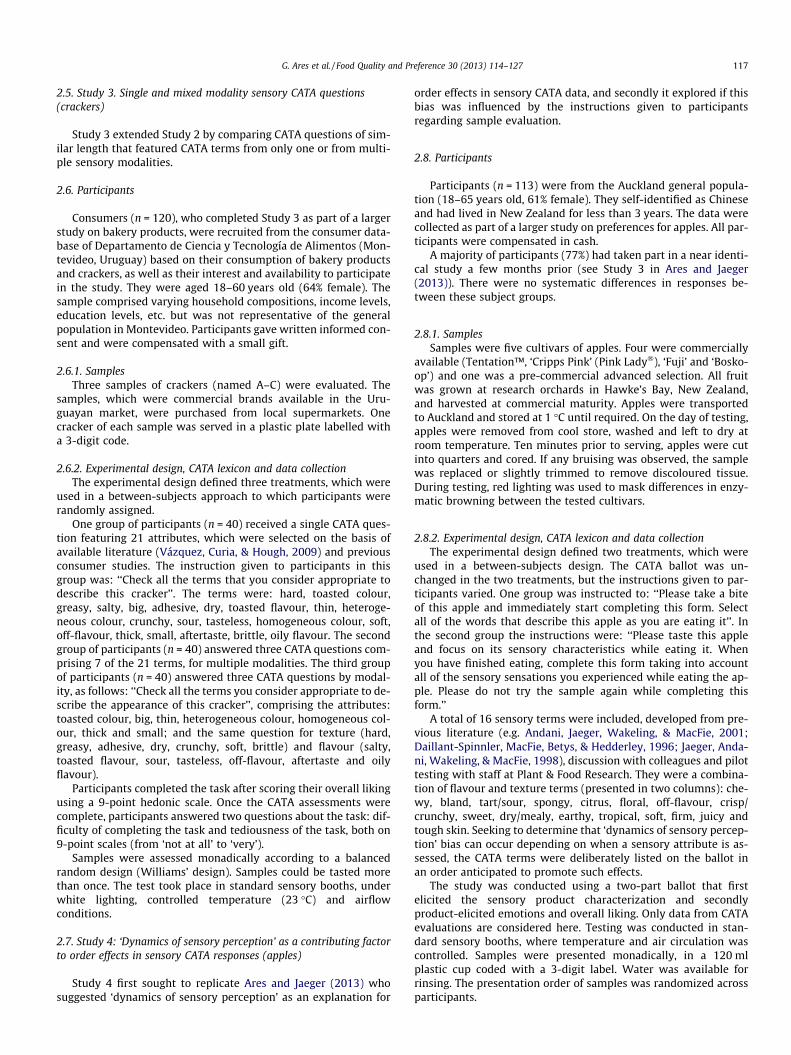
the two milk chocolate samples, the conclusions drawn dependedon the ballot versions used (i.e., R1/ R1, R1/R2 or R1/R3). Whilethere was agreement across the three treatment groups that thesamples differed on ‘chocolate:strong’ and ‘chocolate:weak’, anddid not differ on Aftertaste, Fruity and Hard, divergence in resultswas evident for the remaining 10 CATA terms (Table 1). Table 1also shows that when consumers used ballot version R1 for evalu-ating both samples, significant differences between samples wereidentified for six sensory terms, whereas for consumers who usedballot version R1 and R2 the number of significant attributes was
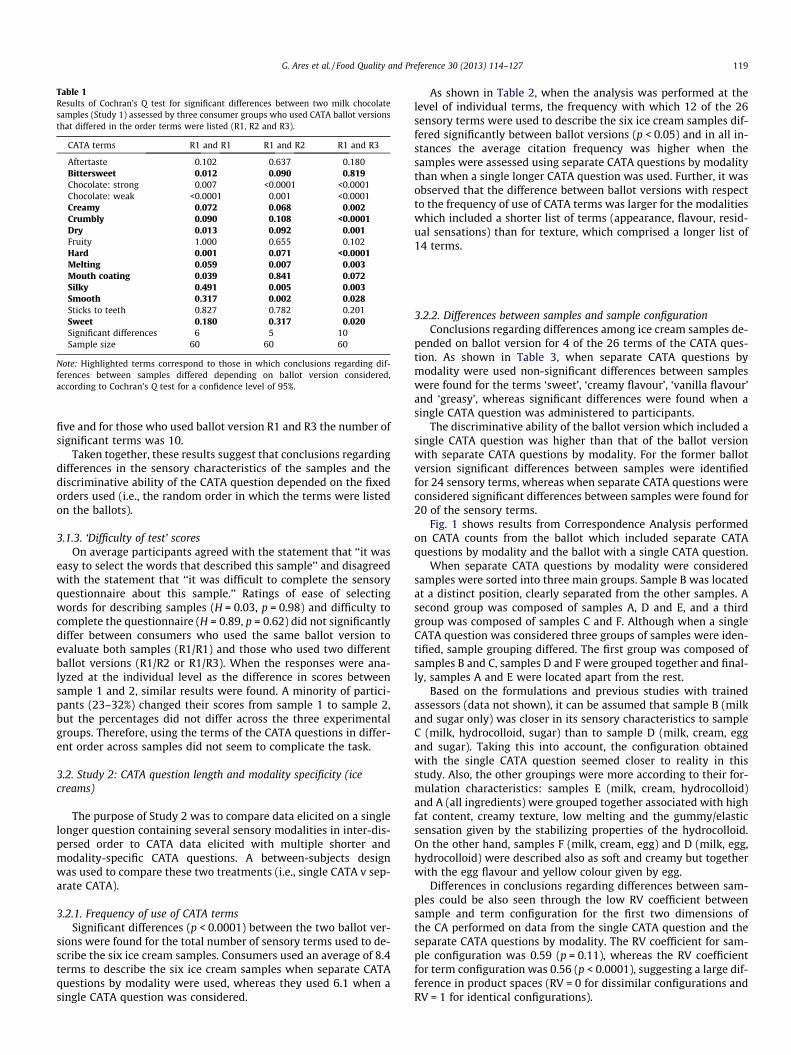
Table 1Results of Cochran’s Q test for significant differences between two milk chocolatesamples (Study 1) assessed by three consumer groups who used CATA ballot versionsthat differed in the order terms were listed (R1, R2 and R3).
CATA terms R1 and R1 R1 and R2 R1 and R3
Aftertaste 0.102 0.637 0.180Bittersweet 0.012 0.090 0.819Chocolate: strong 0.007 <0.0001 <0.0001Chocolate: weak <0.0001 0.001 <0.0001Creamy 0.072 0.068 0.002Crumbly 0.090 0.108 <0.0001Dry 0.013 0.092 0.001Fruity 1.000 0.655 0.102Hard 0.001 0.071 <0.0001Melting 0.059 0.007 0.003Mouth coating 0.039 0.841 0.072Silky 0.491 0.005 0.003Smooth 0.317 0.002 0.028Sticks to teeth 0.827 0.782 0.201Sweet 0.180 0.317 0.020Significant differences 6 5 10Sample size 60 60 60
Note: Highlighted terms correspond to those in which conclusions regarding dif-ferences between samples differed depending on ballot version considered,according to Cochran’s Q test for a confidence level of 95%.
G. Ares et al. / Food Quality and Preference 30 (2013) 114–127 119
five and for those who used ballot version R1 and R3 the number ofsignificant terms was 10.
Taken together, these results suggest that conclusions regardingdifferences in the sensory characteristics of the samples and thediscriminative ability of the CATA question depended on the fixedorders used (i.e., the random order in which the terms were listedon the ballots).
3.1.3. ‘Difficulty of test’ scoresOn average participants agreed with the statement that ‘‘it was
easy to select the words that described this sample’’ and disagreedwith the statement that ‘‘it was difficult to complete the sensoryquestionnaire about this sample.’’ Ratings of ease of selectingwords for describing samples (H = 0.03, p = 0.98) and difficulty tocomplete the questionnaire (H = 0.89, p = 0.62) did not significantlydiffer between consumers who used the same ballot version toevaluate both samples (R1/R1) and those who used two differentballot versions (R1/R2 or R1/R3). When the responses were ana-lyzed at the individual level as the difference in scores betweensample 1 and 2, similar results were found. A minority of partici-pants (23–32%) changed their scores from sample 1 to sample 2,but the percentages did not differ across the three experimentalgroups. Therefore, using the terms of the CATA questions in differ-ent order across samples did not seem to complicate the task.
3.2. Study 2: CATA question length and modality specificity (icecreams)
The purpose of Study 2 was to compare data elicited on a singlelonger question containing several sensory modalities in inter-dis-persed order to CATA data elicited with multiple shorter andmodality-specific CATA questions. A between-subjects designwas used to compare these two treatments (i.e., single CATA v sep-arate CATA).
3.2.1. Frequency of use of CATA termsSignificant differences (p < 0.0001) between the two ballot ver-
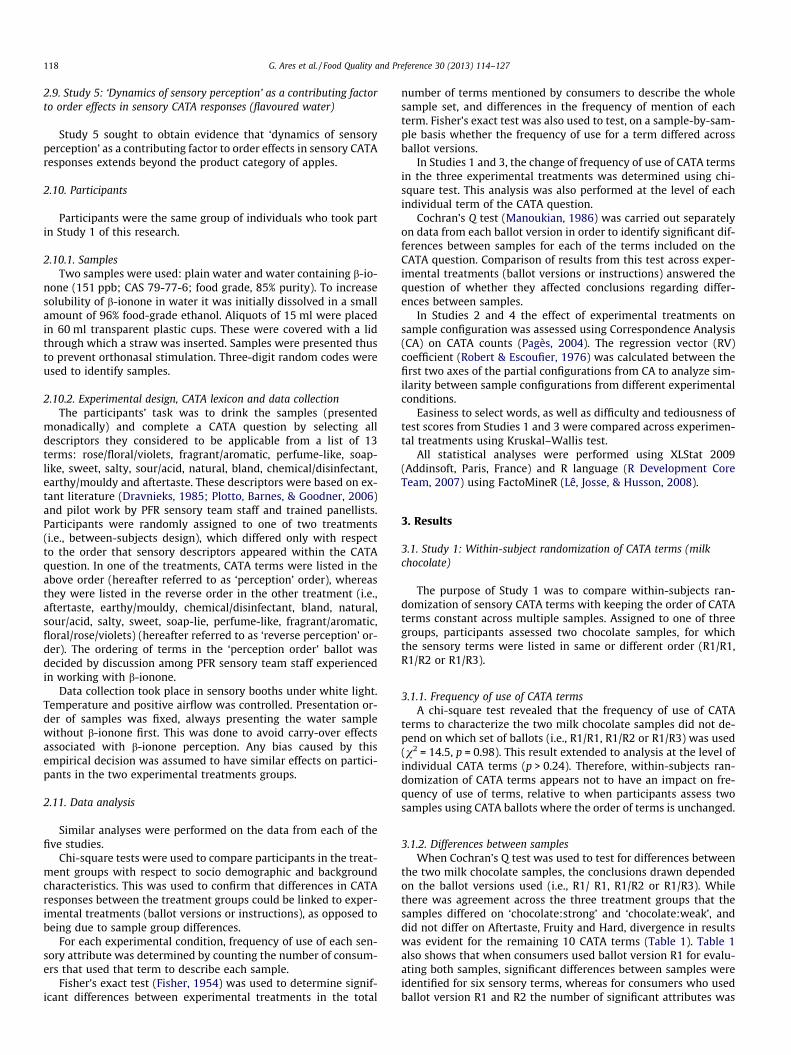
sions were found for the total number of sensory terms used to de-scribe the six ice cream samples. Consumers used an average of 8.4terms to describe the six ice cream samples when separate CATAquestions by modality were used, whereas they used 6.1 when asingle CATA question was considered.
As shown in Table 2, when the analysis was performed at thelevel of individual terms, the frequency with which 12 of the 26sensory terms were used to describe the six ice cream samples dif-fered significantly between ballot versions (p < 0.05) and in all in-stances the average citation frequency was higher when thesamples were assessed using separate CATA questions by modalitythan when a single longer CATA question was used. Further, it wasobserved that the difference between ballot versions with respectto the frequency of use of CATA terms was larger for the modalitieswhich included a shorter list of terms (appearance, flavour, resid-ual sensations) than for texture, which comprised a longer list of14 terms.
3.2.2. Differences between samples and sample configurationConclusions regarding differences among ice cream samples de-
pended on ballot version for 4 of the 26 terms of the CATA ques-tion. As shown in Table 3, when separate CATA questions bymodality were used non-significant differences between sampleswere found for the terms ‘sweet’, ‘creamy flavour’, ‘vanilla flavour’and ‘greasy’, whereas significant differences were found when asingle CATA question was administered to participants.
The discriminative ability of the ballot version which included asingle CATA question was higher than that of the ballot versionwith separate CATA questions by modality. For the former ballotversion significant differences between samples were identifiedfor 24 sensory terms, whereas when separate CATA questions wereconsidered significant differences between samples were found for20 of the sensory terms.
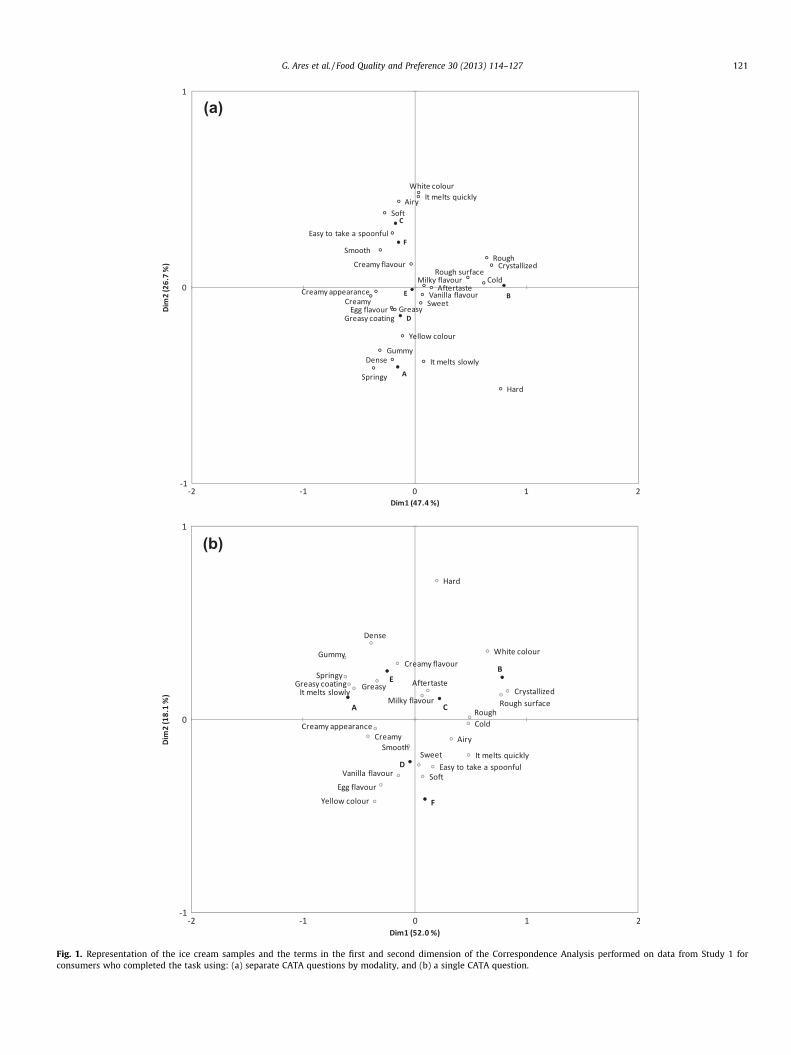
Fig. 1 shows results from Correspondence Analysis performedon CATA counts from the ballot which included separate CATAquestions by modality and the ballot with a single CATA question.
When separate CATA questions by modality were consideredsamples were sorted into three main groups. Sample B was locatedat a distinct position, clearly separated from the other samples. Asecond group was composed of samples A, D and E, and a thirdgroup was composed of samples C and F. Although when a singleCATA question was considered three groups of samples were iden-tified, sample grouping differed. The first group was composed ofsamples B and C, samples D and F were grouped together and final-ly, samples A and E were located apart from the rest.
Based on the formulations and previous studies with trainedassessors (data not shown), it can be assumed that sample B (milkand sugar only) was closer in its sensory characteristics to sampleC (milk, hydrocolloid, sugar) than to sample D (milk, cream, eggand sugar). Taking this into account, the configuration obtainedwith the single CATA question seemed closer to reality in thisstudy. Also, the other groupings were more according to their for-mulation characteristics: samples E (milk, cream, hydrocolloid)and A (all ingredients) were grouped together associated with highfat content, creamy texture, low melting and the gummy/elasticsensation given by the stabilizing properties of the hydrocolloid.On the other hand, samples F (milk, cream, egg) and D (milk, egg,hydrocolloid) were described also as soft and creamy but togetherwith the egg flavour and yellow colour given by egg.
Differences in conclusions regarding differences between sam-ples could be also seen through the low RV coefficient betweensample and term configuration for the first two dimensions ofthe CA performed on data from the single CATA question and theseparate CATA questions by modality. The RV coefficient for sam-ple configuration was 0.59 (p = 0.11), whereas the RV coefficientfor term configuration was 0.56 (p < 0.0001), suggesting a large dif-ference in product spaces (RV = 0 for dissimilar configurations andRV = 1 for identical configurations).
Table 2Frequency (%) of CATA term usage across six ice cream samples in Study 2 shown by ballot versions (separate CATA questions by modality vs. single question; between-subjectsdesign) and results from Fisher’s exact test.
Modality CATA terms Separate CATA questions by modality (n = 42) Single CATA question (n = 42) p
Appearance Rough surface 25 14 0.0025Creamy appearance 53 33 <0.0001White colour 29 24 0.312Yellow colour 55 26 <0.0001Crystallized 27 11 0.010
Flavour Sweet 30 18 <0.0001Creamy flavour 25 26 0.919Egg flavour 28 16 0.0025Vanilla flavour 43 28 0.0005Milky flavour 38 29 0.023
Texture Soft 28 27 0.765Hard 24 10 <0.0001Smooth 32 28 0.437Creamy 37 35 0.577Rough 18 16 0.554Gummy 27 22 0.213Springy 18 19 1.000Cold 31 35 0.297It melts quickly 29 28 0.844It melts slowly 20 18 0.649Greasy 20 12 0.014Airy 21 19 0.656Dense 27 23 0.355Easy to take a spoonful 34 35 0.851
Residual sensations Greasy coating 33 13 <0.0001Aftertaste 41 17 <0.0001
Note: Terms highlighted in bold correspond to those for which significant differences between ballot versions were identified according to Fisher’s exact test, for a 95%confidence level.
Table 3Results of Cochran’s Q test for significant differences between ice cream samples for the sensory terms of the CATA question for the two ballot versions (separate CATA questionsby modality vs. a single CATA question) used in Study 2.
Modality CATA terms Separate CATA questions by modality (n = 42) Single CATA question (n = 42)
Appearance Rough surface 0.008 <0.0001Creamy appearance <0.0001 <0.0001White colour <0.0001 <0.0001Yellow colour <0.0001 <0.0001Crystallized <0.0001 <0.0001
Flavour Sweet 0.247 <0.0001Creamy flavour 0.267 0.004Egg flavour <0.0001 0.010Vanilla flavour 0.119 <0.0001Milky flavour 0.061 0.247
Texture Soft <0.0001 0.004Hard <0.0001 0.002Smooth <0.0001 0.007Creamy <0.0001 <0.0001Rough <0.0001 0.009Gummy <0.0001 <0.0001Springy <0.0001 <0.0001Cold <0.0001 <0.0001It melts quickly <0.0001 <0.0001It melts slowly 0.046 <0.0001Greasy 0.268 0.007Airy 0.002 <0.0001Dense <0.0001 <0.0001Easy to take a spoonful <0.0001 0.006
Residual sensations Greasy coating 0.041 0.001Aftertaste 0.502 0.093
Note: Terms highlighted in bold correspond to those in which different conclusions regarding differences between samples differed depending on ballot version considered,according to Cochran’s Q test for a confidence level of 95%.
120 G. Ares et al. / Food Quality and Preference 30 (2013) 114–127
3.3. Study 3: Single vs. mixed modality CATA questions (crackers)
Study 3 sought to explore whether CATA question length or sen-sory modality specificity was the more salient contributor to the
effects observed in Study 2. Hence, data from three experimentalgroups were compared: mixed modality CATA questions vs. CATAquestions by modality v. single modality CATA questions, keeping
(a)
(b)
Fig. 1. Representation of the ice cream samples and the terms in the first and second dimension of the Correspondence Analysis performed on data from Study 1 forconsumers who completed the task using: (a) separate CATA questions by modality, and (b) a single CATA question.
G. Ares et al. / Food Quality and Preference 30 (2013) 114–127 121

Table 4Results of Cochran’s Q test for significant differences between cracker samples for the sensory terms of the CATA question for the three ballot versions (single CATA question vs.separate CATA questions vs. separate CATA questions by modality) used in Study 3.
Modality CATA terms Single CATA question(n = 40)
Separate mixed modality CATA questions(n = 40)
Separate CATA questions by modality(n = 40)
Appearance Toasted colour 0.002 0.438 0.048Big 0.174 0.135 0.006Thin 0.145 0.015 0.002Heterogeneouscolour
0.801 0.678 0.513
Homogeneous colour 0.211 0.054 0.340Thick 0.008 0.097 0.012Small 0.607 0.497 0.005
Texture Hard <0.0001 <0.0001 0.001Greasy 0.301 0.223 0.005Adhesive 0.920 0.148 0.846Dry 0.341 1.000 0.878Crunchy 0.001 0.431 0.229Soft 0.016 0.072 0.050Brittle 0.001 0.838 0.692
Flavour Salty 0.0002 0.001 <0.0001Toasted flavour 0.129 0.135 0.861Sour 0.039 0.846 1.000Tasteless <0.0001 0.008 0.001Off-flavour 0.311 0.717 0.529Aftertaste 0.165 0.128 0.670Oily flavour 0.236 0.311 0.311
Significant differences 9 4 10
Note: Terms highlighted in bold correspond to those in which different conclusions regarding differences between samples differed depending on ballot version considered,according to Cochran’s Q test for a confidence level of 95%.
122 G. Ares et al. / Food Quality and Preference 30 (2013) 114–127
the total number of terms and the number of terms by modalityconstant.
3.3.1. Frequency of use of CATA termsSignificant differences (p < 0.0001) between the two ballot ver-
sions were found for the total number of sensory terms used to de-scribe the three crackers. Consumers used an average of 12.1 termsto describe the crackers when a single CATA question was used,while they used 14.6 when three mixed modality CATA questionswere considered and 17.4 terms when separate CATA questionsby modality were used.
A chi-square test revealed that the frequency of use of CATAterms to characterize the three crackers significantly dependedon which ballot version was used (v2 = 94.0, p < 0.0001). Signifi-cant differences among ballot versions were found in the frequencyof use of 10 terms: ‘toasted colour’, ‘heterogeneous colour’, ‘thin’,‘big’, ‘thick’, ‘big’, ‘sour’, ‘toasted flavour’, ‘salty’ and ‘oily flavour’.Frequency of term use was higher for the ballot version which in-cluded three separate CATA questions by modality.
3.3.2. Differences between samplesConclusions regarding differences between cracker samples de-
pended on ballot version for 10 of the 21 terms of the CATA ques-tion. As shown in Table 4, the discriminative ability of the ballotversion in which separate mixed modality CATA questions were in-cluded was lower than those of the other ballot versions. Whenseparate mixed modality CATA questions were used, significantdifferences among samples were found for only four terms: ‘thin’,‘hard’, ‘tasteless’ and ‘salty’. On the other hand, when separateCATA questions by modality were used significant differencesamong samples were identified for 10 of the 21 terms, and whena single CATA question was considered the number of significantterms was nine.
3.3.3. Difficulty and tediousness of the taskNo significant differences among experimental conditions were
found for difficulty (H = 1.11, p = 0.526) and tediousness (H = 1.13,
p = 0.49) scores. On average, participants considered that the diffi-culty and tediousness of the task were low (average scores were2.8 and 2.0 in 9-point scales, respectively). These results suggestthat using several CATA questions did not seem to complicatethe task.
3.4. Study 4: ‘Dynamics of sensory perception’ and the influence ofparticipant instruction (apples)
Study 4 extended Ares and Jaeger (2013) by exploring ‘dynam-ics of sensory perception’ as an explanation of order effects in CATAquestions and the extent to which such bias can be mitigatedthrough participant instruction. Participants were divided in twogroups that were either instructed to: (i) complete the CATA ques-tion while eating the sample or (ii) only complete it subsequent toeating the sample and focusing on the overall sensory experience.
3.4.1. Frequency of use of CATA termsThe instructions given to participants for completing the CATA
questions did not significantly affect the number of terms usedfor describing the apple samples (p = 0.14). Consumers who com-pleted the question while eating the samples used an average of3.0 terms, whereas those who completed the question after eatingthe sample used 2.9 terms.
Instructions given to participants did not have a large impact onthe frequency of use of the sensory terms. At the aggregate level,significant differences were only found for the frequency in whichthey used 1 of the 16 sensory terms. When consumers were in-structed to complete the CATA question after eating the samplesthey used the term ‘dry/mealy’ with a higher frequency than whenthey completed the question while eating the samples.
Differences in the frequency of use of the term ‘dry/mealy’ didnot remain significant when the Fisher exact test was performedfor each apple cultivar in turn. It is important to highlight thatwhen analysing the data by sample the number of consumers isclose to 50, which makes significant differences harder to establishgiven the small sample size. On the other hand, significant effects
Table 5Results of Cochran’s Q test for significant differences between apple samples (Study 4)for the sensory terms of the CATA question for consumers who completed the CATAtask while and after eating the samples.
CATA terms Completing CATA task whileeatinga
Completing CATA task aftereatingb
Chewy 0.013 <0.0001Bland 0.543 0.112Tart/Sour <0.0001 <0.0001Spongy <0.0001 0.016Citrus 0.450 0.535Floral 0.037 0.076Off-flavour <0.0001 0.006Crisp/
Crunchy<0.0001 <0.0001
Sweet <0.0001 <0.0001Dry/Mealy <0.0001 <0.0001Earthy 0.003 0.189Tropical 0.006 0.067Soft <0.0001 <0.0001Firm 0.027 <0.0001Juicy <0.0001 <0.0001Tough skin 0.002 0.012
Highlighted terms correspond to those in which different conclusions regardingdifferences between samples differed depending on ballot version considered,according to Cochran’s Q test for a confidence level of 95%.
a The instructions given to participants were the following: ‘‘Please take a bite ofthis apple and immediately start completing this form. Select all of the words thatdescribe this apple as you are eating it’’.
b The instructions given to participants were the following: ‘‘Please taste thisapple and focus on its sensory characteristics while eating it. When you have fin-ished eating, complete this form taking into account all of the sensory sensationsyou experienced while eating the apple. Please do not try the sample again whilecompleting this form’’.
Table 6Results of Cochran’s Q test for significant differences between water samples (Study5) for the sensory terms of the CATA question for the two ballot versions in which theterms were included in perception order or reverse perception order.
CATA terms CATA terms listed in‘perception’ order
CATA terms listed in ‘reverseperception’ ordera
G. Ares et al. / Food Quality and Preference 30 (2013) 114–127 123
for some terms which were not observed at the aggregate levelwere identified. The term ‘soft’ was significantly more frequentlyused to describe Tentation™ cultivar when consumers completedthe CATA question after eating the sample compared with whenthey completed it while eating the sample (56% vs. 19%, respec-tively). A similar effect was seen for the term ‘spongy’ for ‘CrippsPink’ (Pink Lady�) cultivar, which was not used when consumerscompleted the CATA question while eating the sample but wasused by 29% of the consumers who completed the question aftereating the sample. These results suggest that instructions affectedthe way in which consumers used some of the texture terms to de-scribe the apple cultivars. The observed significance of some attri-butes could have been affected by the increase in the chance ofType I error due to the large number of statistical tests performed.However, it should be noted that differences in the frequency ofuse of some attributes between experimental treatments werehigher than 25%.
Floral/rose/violets
<0.0001 <0.0001
Fragrant/aromatic
<0.0001 <0.0001
Perfume-like <0.0001 <0.0001Soap-like 0.336 0.102Sweet 0.132 <0.0001Salty 1.000 1.000Sour/acid 0.206 0.014Natural <0.0001 <0.0001Light 0.095 0.194Bland <.0001 <0.0001Chemical/ disinfectant 0.593
0.157Earthy/
mouldy0.071 0.012
Aftertaste 0.050 0.001
Highlighted terms correspond to those in which different conclusions regardingdifferences between samples differed depending on ballot version considered,according to Cochran’s Q test for a confidence level of 95%.
a Terms were listed in order from aftertaste to floral/rose/violets.
3.4.2. Differences between samples and sample configurationsConclusions regarding differences between apple samples de-
pended on the instructions given to participants used for three ofthe 16 terms of the CATA question. As shown in Table 5, when con-sumers completed the CATA question while eating the samples sig-nificant differences were found for the terms ‘floral’, ‘earthy’ and‘tropical’, whereas no significant differences were found when con-sumers completed the question after eating the apple samples.‘Floral’, ‘earthy’ and ‘tropical’ are subtle flavour notes which aremost perceptible at the beginning of mastication. Therefore, it isreasonable that when consumers went through the list of CATAterms while eating the samples they were better able to perceivedifferences between samples in those sensory characteristics com-pared with when they thought of the global impression of the sam-ples after eating the samples.
The discriminative ability of the CATA question was higherwhen consumers completed the question while eating the samples
than after eating them. For the former instructions, significant dif-ferences between samples were found for 14 of the 16 terms, com-pared with the significant differences in 11 terms found whenconsumers completed the question after eating the samples.
The RV coefficient between sample configuration in the firsttwo dimensions of the CA performed on data from the CATA ques-tions completed using different instructions was 0.84, suggestingthat instructions had a relatively low impact on product spaces.However, the agreement between the configurations of the termswas not that high (RV = 0.58, p = 0.0001), suggesting that theinstructions given to participants affected the way in which partic-ipants used the terms to describe the apple samples.
Together these findings support Ares and Jaeger (2013) whosuggested that the ‘dynamics of sensory perception’ affects con-sumer descriptions of food products using CATA questions. Evi-dence was also obtained that the instructions given toparticipants regarding sample evaluation (i.e., while eating v. aftereating) has an impact on sensory product characterizations anddifferences between samples that are established.
3.5. Study 5: ‘Dynamics of sensory perception’ in flavoured water
The purpose of Study 5 was to establish whether ‘dynamics ofsensory perception’ as an order effect in sensory CATA evaluationsextended beyond the product category of apples. The results fromtwo ballot versions were compared, in which CATA terms werelisted in two different orders referred to as ‘perception’ order and‘reverse perception’ order.
3.5.1. Frequency of use of CATA termsNo significant differences (p = 0.27) between ballot versions
were found for the total number of sensory terms used by consum-ers to describe the water samples. Consumers used an average of2.8 terms in the ‘perception order’ ballot and 3.0 in the ‘reverseperception order’ ballot.
The frequency with which two of the 13 sensory terms wereused by consumers to describe the two water samples differed sig-nificantly between ballot versions (p < 0.05). The frequency of useof the terms ‘natural’ and ‘earthy/mouldy’ was significantly higherfor the ballot version in which the terms were included in ‘reverse
124 G. Ares et al. / Food Quality and Preference 30 (2013) 114–127
perception’ order. Differences in the frequency of use of the termswere not observed when the Fisher exact tests for ballot differ-ences were performed for each water sample in turn. The effectestablished in the aggregate analysis was significant for only oneof the samples. The frequency of use of the term ‘natural’ to de-scribe plain water was higher for the ballot which included theterms in ‘reverse perception order’ compared with the ballot ver-sion which included the terms in ‘perception order’.
3.5.2. Differences among samplesConclusions regarding differences between water samples de-
pended on the ballot version used for three of the 13 terms onthe CATA question. As shown in Table 6, when the terms were in-cluded in ‘reverse perception’ order significant differences betweensamples were identified for the terms ‘sweet’, ‘sour/acid’, and‘earthy/natural’, whereas no significant differences between sam-ples were identified when the terms were included in ‘perception’order.
The discriminative ability of the ballot version which includedthe sensory terms in reverse perception order was higher than thatof the ballot version in which the terms were included in percep-tion order. For the former ballot version significant differences be-tween samples were identified for nine of the 13 sensory terms,whereas for the latter significant differences between sampleswere found for only six of the sensory terms. Evidence supporting‘dynamics of sensory perception’ as a source bias was evident inthe form of significant differences between samples beyond thedominant characteristics of floral/rose/violets, fragrant/aromaticand perfume-like being more frequently uncovered in the ‘reverseperception’ order ballot. Tentatively, drawing participants’ atten-tion to these minor flavour characteristics, by placing them atthe top of the ballot enabled participants using this ballot to morereadily detect differences between the two samples.
4. Discussion
4.1. Influence of attribute order on consumer responses to CATAquestions
A key learning from the five studies reported in this paper isthat the way in which CATA questions are implemented affects re-sults from sensory characterizations performed using CATA ques-tions. In particular, the order in which the terms are listed in thequestion affected the results in different ways, hereby confirmingresults reported by Ares and Jaeger (2013) This effect can likelybe explained by heuristic information processing (Chen & Chaiken,1999) and suggests that strategies aiming at encouraging system-atic processing may be useful when using CATA questions for sen-sory characterization.
Conclusions regarding differences in the sensory characteris-tics of two milk chocolate samples used in Study 1 differeddepending on the ballot version that consumers used to evaluatesamples. In particular, when consumers used ballots where termswere listed in different order (R1/R2 or R1/R3) to evaluate thetwo samples, conclusions regarding differences between sampleslargely differed depending on which ballots were used (Table 1).Although differences among experimental treatments were af-fected by the three specific orders considered, results show thatrandomization should be used to balance biases that cannot becontrolled. Randomization should be performed within consum-ers and also between consumers by product. Considering thatconsumers did not find it more difficult to use ballots with theterms in different order, it might be recommended to balancethe order of presentation of terms between products in order toeven out effects linked to differences in how consumers complete
the CATA question for describing a sample. A limitation of Study 1was that only two samples were evaluated. Tentatively, whenconsumers are presented with a larger number of samples orCATA questions with a large number of terms, changing orderof the terms for each new sample may be perceived as increas-ingly burdensome.
In previous work the ‘dynamics of sensory perception’ washypothesized as an effect responsible for the influence of the or-der of CATA terms on results from sensory characterizations (Ares& Jaeger, 2013). Results from the present work (Studies 4 and 5)confirmed the existence of this phenomenon when consumerscomplete CATA questions for sensory characterization. The orderin which the terms were included in the CATA question affectedresults for sensory characterization of two water samples (Study5). When the terms were included in ‘reverse perception’ orderthe discrimination capacity of the CATA question was higher thanwhen the terms were included in ‘perception order’. The differ-ence between ballot versions was observed for the terms ‘sweet’,‘sour/acid’, and ‘earthy/mouldy’. By focusing on taste/aftertastebefore odour, participants might have concentrated on the tasteof less dominant sensory sensations, such as sweetness and sour-ness, leading to a better discrimination between samples. Theodour differences between samples may have been bigger andtherefore more ‘easy to spot’ regardless of the order in whichthe sensory terms were listed in the CATA question. Reverse orderof perception seemed to have drawn attention to minor differ-ences between samples, enabling these differences to be exposed.Big differences between samples were exposed regardless of theorder in which the terms were listed within the CATA question.Results from the present work suggest that if terms in whichsmall differences between samples are included at the top ofthe list, their discriminative ability between samples mightincrease.
Extrapolating the current results, it seems that primary bias canbe harnessed to ‘‘force’’ differences between samples for minorattributes by placing them earlier in the lists. Large differences willbe detected regardless of where in the list they are positioned, butminor differences may not. An associated perspective is that theCATA terms are very important and must be carefully chosen. GoodCATA results may be as much due to this as empirical implemen-tation (order effects, sample position/carry over, etc.). This is nodifferent from traditional sensory profiling and the need to ‘‘knowyour products’’ still holds. However, further research is needed totest this notion.
4.2. Separate CATA questions by modality vs. separate mixed modalityCATA questions vs. single random CATA question
Results from Studies 2 and 3 showed that the use of separateCATA questions with few terms encouraged consumers to usemore terms and to select them more frequently to describe sam-ples due to their higher saliency. When separate CATA questionswere considered all the terms were more salient due to shorterlist of terms compared with the ballot version which included alonger single CATA question. Therefore, consumers might havefocused their attention for a longer period of time on the termswhen separate CATA questions were used and therefore thoseterms might have been subjected to deeper cognitive processingthan the terms in the longer list, which could have made themmore relevant when characterizing the products.
Furthermore, in Study 3 when separate CATA questions bymodality were considered consumers used more terms to describethe products compared with separate mixed modality CATA ques-tions. This suggests that asking consumers specific CATA questions
G. Ares et al. / Food Quality and Preference 30 (2013) 114–127 125
by modality encouraged consumers to use systematic processing,being more analytical and processing the question more deeply.
The use of shorter lists of terms affected the discriminative abil-ity of the CATA question. The use of separate CATA questions bymodality in Study 2 and the use of separate mixed modality CATAquestions in Study 3, negatively impacted sample discrimination.In Study 2, this difference in the discriminative ability of the ballotswas higher for the modalities with a smaller number of sensoryterms (appearance, flavour and residual sensations) than for themodality with a larger number of terms (texture). However, thisdifference could also be related to the fact that texture was themodality responsible for the largest differences before samplesand therefore, consumers might have focused their attention to alarger extent on texture terms regardless of the length of the list.
Therefore, the use of separate short CATA questions increasedthe saliency of sensory terms and consumer attention to thembut might have encouraged heuristic instead of systematic pro-cessing, i.e. consumers tended to use more terms just becausethe list contained few terms that could be applicable to the sample.On the other hand, the use of a single CATA question with a longlist of terms seems to have encouraged consumers to select theterms that most clearly apply to the sample, i.e. the ones that reallydiscriminated among the samples.
The fact that differences between ballot versions depended onthe number of terms suggests a need for further studying the influ-ence of the length of the list of terms on the results from sensorycharacterizations using CATA questions. Results suggest that theremight be an optimum range for the number of terms. Using fewterms might encourage consumers to use them all, decreasing theirability to discriminate between samples. On the other hand, largelists of terms might encourage satisficing strategies makingconsumers choose the first alternatives from the list (Krosnick &Alwin, 1987; Rasinski, Mingay, & Bradburn, 1994; Smyth, Dillman,Melani Christian, & Stern, 2006), without thinking carefully aboutthe product’s sensory characteristics.
Studies 2 and 3 provided contradictory information regardingthe influence of using separate CATA questions by modalityon the discriminative ability of the task, which could be related tothe specific characteristics of the studies, such as the product cat-egory, the degree of difference between samples and the type ofterms considered. In applications in which samples are very similarand many terms using separate CATA questions by modality couldincrease the discriminative ability of the task by making them pro-cess more deeply the terms by focusing their attention to a largerextent. Further research on this topic is needed. Besides, the factthat a fixed presentation order of the CATA terms was includedin Study 3 could have affected the results. Further studies compar-ing separate CATA questions by modality in which the terms arerandomized across samples and consumers should be carried out.
Within a single CATA question, terms could be organized as onecolumn of terms or as separate columns by modality. It remains tobe explored if the impact of using separate columns of terms bymodality on consumer responses to CATA questions for sensorycharacterization is similar to the impact of using separate ques-tions. In this sense it is important to highlight that the cognitive ef-fort required to process sensory attributes in a CATA questions isstrongly affected by the order in which the terms are listed. Aresand Jaeger (2013) reported that CATA questions structured bymodality encouraged consumers to select more terms thanunstructured questions. Similarly, Meullenet et al. (2009) reportedthat time to complete a CATA ballot was longer when sensoryterms were listed randomly as opposed to alphabetically. There-fore, considering that higher cognitive effort could reduce primacybias (Krosnick, 1992), when designing CATA questions it is recom-mended sensory terms be included in random order, even if theyare listed by modality.
4.3. ‘Dynamics of sensory perception’ and instructions for completingthe CATA question (Studies 4 and 5)
While Study 4 replicated Ares and Jaeger (2013) who suggested‘dynamics of sensory perception’ as an explanation for order bias insensory CATA evaluations, Study 5 using simple water samples, ex-tended this finding beyond apples. Together, these studies showthat effects other than primacy bias influence sensory productcharacterizations elicited using CATA methodology. Several vari-ables seem to affect the degree to which consumers rely on sys-tematic processing when using CATA questions for sensorycharacterization. The studies were conducted using consumers asparticipants and it is uncertain whether ‘dynamics of sensory per-ception’ effects also occur when CATA questions are used bytrained sensory panellists. This questions warrants attention sinceconsumers may not be alone in being influenced by these effects,adding further evidence to the feasibility of using them for sensoryproduct characterizations.
The second aspect to Study 4 was a comparison of CATA dataelicited when consumers were instructed to complete the questionwhile eating the sample or completing it only after they had fin-ished eating the sample. Building on Ares and Jaeger (2013), itwas suggested that if consumers complete a CATA question whileeating the sample they might evaluate each term at a specific mo-ment of consumption instead of providing an overall evaluation ofthe whole sensory experience. The results obtained showed this tobe the case and that instructing consumers to complete the CATAquestion while or after eating the samples affected conclusionsregarding the sensory characteristics of the apples and differencesbetween them. When consumers were instructed to complete theCATA question while eating the samples better discrimination be-tween samples were found for subtle and not persistent flavourssuch as ‘floral’, ‘tropical’ and ‘earthy’. When consumers completedthe question after eating the samples these flavours might not havebeen salient compared to other characteristics such as sweetness,sourness or texture characteristics. Besides, when consumers com-pleted the CATA question after eating the samples the frequency ofuse of texture terms related to structure breakdown was higher forthe whole sample set or for one of the samples. The terms ‘soft’,‘spongy’ and ‘dry/mealy’ were significantly when consumers com-pleted the CATA question after eating the sample, which could beexplained. Considering the influence of instructions on conclusionsregarding the sensory characteristics of the apples, it could beadvisable to use exact wording that instruct consumers to considerthe whole sensory experience with the product and to answer theCATA question considering their global impression of the product.This could prevent consumers from selecting terms at specific mo-ments of mastication. In this sense, it would be interesting to testthis hypothesis by asking consumers to try a single bite of sampleand to answer yes/no to specific sensory attributes presented atdifferent moments of mastication.
5. Conclusions
Through five consumer studies, the research reported here hasconfirmed that different types of order effects significantly influ-ence sensory product characterizations and conclusions regardingproduct differences from data elicited by consumers using CATAmethodology. The use of within-subjects randomization of CATAterms was found to impact sensory product characterizations andconclusions drawn regarding sample differences relative to whenmultiple samples were assessed using the CATA ballots where or-der of terms was unchanged. For participants, changing attributeorder from sample to sample was not found to be burdensome.However, it should be taken into account that this approach was
126 G. Ares et al. / Food Quality and Preference 30 (2013) 114–127
only tested for only two samples. The use of shorter and modalityspecific CATA questions was also found to have an impact on theproduct characterizations/sample differences established relativeto longer CATA questions of with terms from several sensorymodalities. Finally, ‘dynamics of sensory perception’ was con-firmed as a source of bias. A key learning from this research wasthat sensory product characterization and differences betweensamples are subject to multiple minor biases and that the exactexperimental conditions under which CATA data are generatedshould be specified. Having confirmed the existence of bias in con-sumer elicited sensory product characterizations by CATA ques-tions, a new question to be explored emerged: ‘‘To what extentare similar biases present when trained sensory panellists performsensory product characterization using CATA or descriptive sen-sory methodology?’’
Although inspiration for this research was found in marketingresearch/survey research as to ways in which primacy bias in CATAquestions may be reduced, this work has not directly addressedwhether or not primacy bias was reduced and if so to what extent.Instead focus was directed to effects on sensory product character-izations and conclusions drawn regarding differences betweensamples. However, scope exists for future research to address thequestion of how big is the effect of initiatives such as randomiza-tion of CATA terms and use of shorter CATA lists on primacy bias.
6. Author contributions
SRJ and GA conceived the research and wrote the paper togetherwith PV. GA, LV and PV analysed the data. All other authors con-tributed to data collection.
Acknowledgements
Staff members from the Sensory & Consumer Science Team atPlant & Food Research in Auckland are thanked for assistance withStudies 1, 4 and 5. Financial assistance by the New Zealand Minis-try of Science & Innovation for Studies 1, 4 and 5 is acknowledged.The authors are indebted to Comisión Sectorial de InvestigaciónCientífica (CSIC, Universidad de la República, Uruguay) for financialsupport for conducting Study 3. The authors from the Instituto deAgroquímica y Tecnología de Alimentos (CSIC) are grateful to theSpanish Ministry of Science and Innovation for financial support(AGL 2006–11653-C02-01) and for the contract awarded to theauthor P. Varela (Juan de la Cierva Program). They would also liketo thank Aurora Pintor for sample preparation and data collectionfor Study 2.
References
Adams, J., Williams, A., Lancaster, B., & Foley, M. (2007). Advantages and uses ofcheck-all-that-apply response compared to traditional scaling of attributes forsalty snacks. In 7th Pangborn sensory science symposium, August 12–16.Minneapolis, USA.
Andani, Z., Jaeger, S. R., Wakeling, I. N., & MacFie, H. J. H. (2001). Mealiness in apples:Towards a multilingual consumer vocabulary. Journal of Food Science, 66,872–879.
Ares, G., Barreiro, C., Deliza, R., Giménez, A., & Gámbaro, A. (2010). Application of acheck-all-that-apply question to the development of chocolate milk desserts.Journal of Sensory Studies, 25, 67–86.
Ares, G., & Jaeger, S. R. (2013). Check-all-that-apply questions: Influence of attributeorder on sensory product characterization. Food Quality and Preference, 28,141–153.
Ares, G., Varela, P., Rado, G., & Giménez, A. (2011). Are consumer profilingtechniques equivalent for some product categories? The case of orange-flavoured powdered drinks. International Journal of Food Science andTechnology, 46, 1600–1608.
Bruzzone, F., Ares, G., & Giménez, A. (2012). Consumers’ texture perception of milkdesserts. II – Comparison with trained assessors’ data. Journal of Texture Studies,43, 214–226.
Castura, J. C. (2009). Do Panellists donkey vote in sensory choose-all-that-applyquestions? In 8th pangborn sensory science symposium, July 26–30. Florence,Italy.
Chen, S., & Chaiken, S. (1999). The heuristic-systematic model in its broader context.In S. Chaiken & Y. Trope (Eds.), Dual-process theories in social psychology(pp. 73–96). New York, NY: Guilford.
Daillant-Spinnler, B., MacFie, H. J. H., Betys, P. K., & Hedderley, D. (1996).Relationships between perceived sensory properties and major preferencedirections of 12 varieties of apples from the Southern Hemisphere. Food Qualityand Preference, 7, 113–126.
Dooley, L., Lee, Y. S., & Meullenet, J. F. (2010). The application of check-all-that-apply (CATA) consumer profiling to preference mapping of vanilla ice creamand its comparison to classical external preference mapping. Food Quality andPreference, 21, 394–401.
Dravnieks, A. (1985). Atlas of odor character profiles. Philadelphia: ASTM.Evans, J. St. B. T. (2006). The heuristic-analytic theory of reasoning: extension and
evaluation. Psychonomic Bulletin & Review, 13, 378–395.Evans, J. St. B. T. (2008). Dual-processing accounts of reasoning, judgement and
social cognition. Annual Review of Psychology, 59, 255–278.Fisher, R. A. (1954). Statistical methods for research workers. Edinburgh: Oliver and
Boyd.Gilovich, T., & Griffin, D. W. (2002). Heuristics and biases then and now. In T.
Gilovich, D. W. Griffin, & D. Kahneman (Eds.), The psychology of intuitivejudgment: Heuristic and biases (pp. 1–18). Cambridge: Cambridge UniversityPress.
Jacoby, L. L. (1984). Incidental vs. intentional retrieval: Remembering andawareness as separate issues. In L. R. Squire & N. Butters (Eds.),Neuropsychology of memory. New York, NY: Guilford Press.
Jaeger, S. R., Andani, Z., Wakeling, I. N., & MacFie, H. J. H. (1998). Consumerpreferences for fresh and aged apples: A cross-cultural comparison. Food Qualityand Preference, 9, 355–366.
Jaeger, S. R., Chheang, S. L., Jin, D., Bava, C. M., Gimenez, A., Vidal, L., & Ares, G.(2013). Check-all-that-apply (CATA) responses elicited by consumers: within-assessor reproducibility and stability of sensory product characterizations. FoodQuality and Preference, 30, 50–67
Kahneman, D. (2000). A psychological point of view: Violations of rational rulesas a diagnostic of mental processes. Behavioral and Brain Sciences, 23,681–683.
Krosnick, J. A. (1999). Survey research. Annual Review of Psychology, 50, 537–567.Krosnick, J. A., & Alwin, D. F. (1987). An evaluation of a cognitive theory of response
order effects in survey measurement. Public Opinion Quarterly, 51, 201–219.Krosnick, J. (1992). The impact of cognitive sophistication and attitude importance
on response-order and question-order effects. In N. Schwarz & S. Sudman (Eds.),Context effects in social and psychological research (pp. 203–218). New York, NY:Springer-Verlag.
Lawless, H. T., & Heymann, H. (2010). Sensory evaluation of food. Principles andpractices. New York, NY: Springer.
Lê, S., Josse, J., & Husson, F. (2008). FactoMineR: An R package for multivariateanalysis. Journal of Statistical Software, 25(1), 1–18.
Lee, Y., Findlay, C., & Meullenet, J. F. (2013). Experimental consideration for the useof check-all-that-apply questions to describe the sensory properties of orangejuices. International Journal of Food Sciences and Technology, 48(1), 215–219.
Manoukian, E. B. (1986). Mathematical nonparametric statistics. New York, NY:Gordon & Breach.
Meilgaard, M. C., Civille, G. V., & Carr, B. T. (1991). Sensory evaluation techniques (2nded.). Boca Raton, FL: CRC Press.
Meullenet, J. -F., Findlay, C. J., Tubbs, J. K., Laird, M., Kuttappan, V. A., Tokar, T., Over,K., & Lee, Y. S. (2009). Experimental consideration for the use of check-all-that-apply (CATA) questions to describe the sensory properties of orange juices. In8th Pangborn sensory science symposium, July 26–30. Florence, Italy.
Murray, J. M., Delahunty, C. M., & Baxter, I. A. (2001). Descriptive sensory analysis:Past, present and future. Food Research International, 34, 461–471.
Pagès, J. (2004). Multiple factor analysis: Main features and application to sensorydata. Revista Colombiana de Estadística, 27, 1–26.
Plotto, A., Barnes, K. W., & Goodner, K. L. (2006). Specific anosmia observed for b-ionone, but not for a-ionone: Significance for flavor research. Journal of FoodScience, 71, S401–S406.
R Development Core Team (2007). R: A language and environment for statisticalcomputing, ISBN 3-900051-07-0. Vienna, Austria: R Foundation for StatisticalComputing.
Rasinski, K. A., Mingay, D., & Bradburn, N. M. (1994). Do respondents really ‘‘markall that apply’’ on self-administered questions? Public Opinion Quarterly, 58,400–408.
Robert, P., & Escoufier, Y. (1976). A unifying tool for linear multivariate statisticalmethods: The RV coefficient. Applied Statistics, 25, 257–265.
Schwarz, N., Hippler, H.-J., & Noelle-Neumann, E. (1992). A cognitive model ofresponse-order effects in survey measurement. In N. Schwarz & S. Sudman(Eds.), Context effects in social and psychological research (pp. 187–220). NewYork, NY: Springer-Verlag.
Smyth, J. D., Dillman, D. A., Melani Christian, L., & Stern, M. J. (2006). Comparingcheck-all and forced-choice question formats in web surveys. Public OpinionQuarterly, 70, 66–77.
Stone, H., & Sidel, J. L. (2004). Sensory evaluation practices. San Diego, USA: Elsevier,Academic Press.
Strack, F., & Martin, L. L. (1987). Thinking, judging, and communicating: A processaccount of context effects in attitude surveys. In H. Hippler, N. Schwarz, & S.

G. Ares et al. / Food Quality and Preference 30 (2013) 114–127 127
Sudman (Eds.), Social information processing and survey methodology(pp. 123–145). New York, NY: Springer-Verlag.
Sudman, S., & Bradburn, N. M. (1992). Asking questions. San Francisco, CA: Jossey-Bass.
Tversky, A., & Kahneman, D. (1973). Availability: A heuristic for judging frequencyand probability. Cognitive Psychology, 5, 207–232.
Varela, P., & Ares, G. (2012). Sensory profiling, the blurred line between sensory andconsumer science. A review of novel methods for product characterization. FoodResearch International, 48, 893–908.
Vázquez, M. B., Curia, A., & Hough, G. (2009). Sensory descriptive analysis, sensoryacceptability and expectation studies on biscuits with reduced added salt andincreased fibre. Journal of Sensory Studies, 24, 498–511.