Embed Size (px)
Citation preview

Learning with Cases
INTRODUCTION
The case study method of teaching used in management education is quite different
from most of the methods of teaching used at the school and undergraduate course
levels. Unlike traditional lecture-based teaching where student participation in the
classroom is minimal, the case method is an active learning method, which requires
participation and involvement from the student in the classroom. For students who
have been exposed only to the traditional teaching methods, this calls for a major
change in their approach to learning.
This introduction is intended to provide students with some basic information about
the case method, and guidelines about what they must do to gain the maximum benefit
from the method. We begin by taking a brief look at what case studies are, and how
they are used in the classroom. Then we discuss what the student needs to do to
prepare for a class, and what she can expect during the case discussion. We also
explain how student performance is evaluated in a case study based course. Finally,
we describe the benefits a student of management can expect to gain through the use
of the case method.
WHAT IS A CASE STUDY?
There is no universally accepted definition for a case study, and the case method
means different things to different people. Consequently, all case studies are not
structured similarly, and variations abound in terms of style, structure and approach.
Case material ranges from small caselets (a few paragraphs to one-two pages) to short
cases (four to six pages) and from 10 to 18 page case studies to the longer versions (25
pages and above).
A case is usually a “description of an actual situation, commonly involving a decision,
a challenge, an opportunity, a problem or an issue faced by a person or persons in an
organization.”1 In learning with case studies, the student must deal with the situation
described in the case, in the role of the manager or decision maker facing the situation.
An important point to be emphasized here is that a case is not a problem. A problem
usually has a unique, correct solution. On the other hand, a decision-maker faced with
the situation described in a case can choose between several alternative courses of
action, and each of these alternatives may plausibly be supported by logical argument.
To put it simply, there is no unique, correct answer in the case study method.
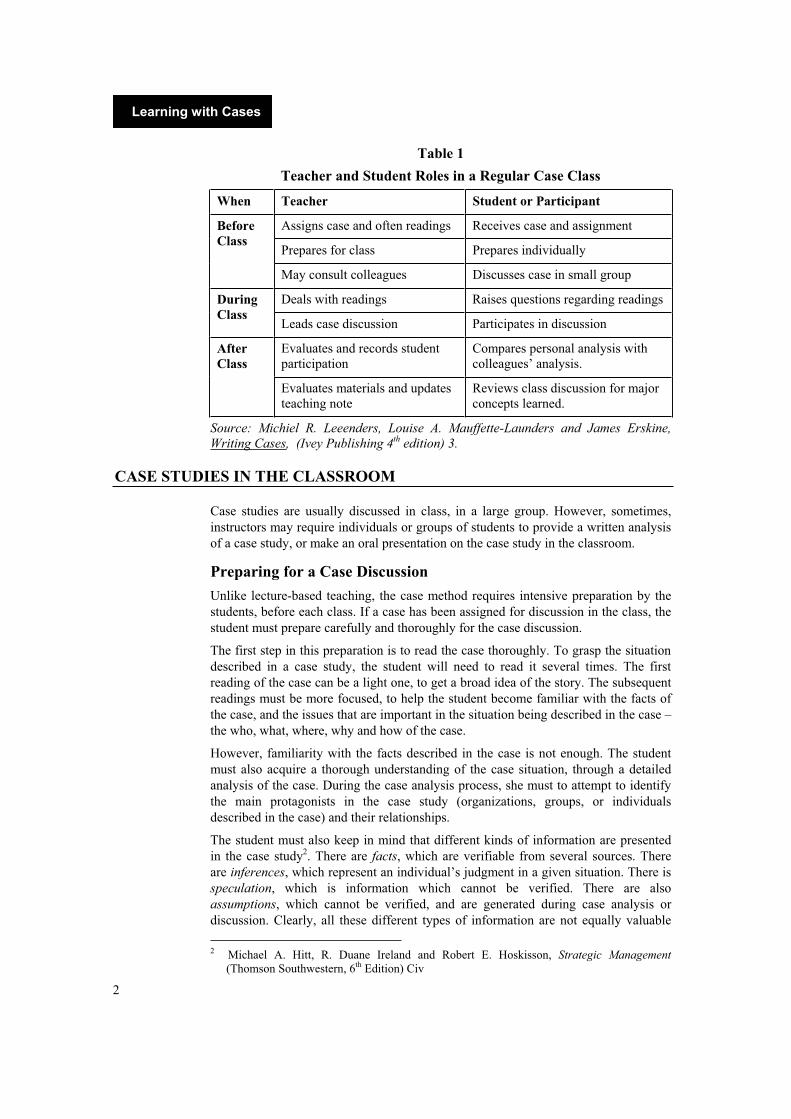
The case study method usually involves three stages: individual preparation, small
group discussion, and large group or class discussion. While both the instructor and
the student start with the same information, their roles are clearly different in each of
these stages, as shown in Table 1.
1 Michiel R. Leeenders, Louise A. Mauffette-Launders and James Erskine, Writing Cases,(Ivey Publishing, 4th edition) 3.
l
2
Learning with Cases
Table 1
Teacher and Student Roles in a Regular Case Class
When Teacher Student or Participant
Assigns case and often readings Receives case and assignment
Prepares for class Prepares individually
BeforeClass
May consult colleagues Discusses case in small group
Deals with readings Raises questions regarding readings During Class
Leads case discussion Participates in discussion
Evaluates and records student participation
Compares personal analysis with colleagues’ analysis.
AfterClass
Evaluates materials and updates teaching note
Reviews class discussion for major concepts learned.
Source: Michiel R. Leeenders, Louise A. Mauffette-Launders and James Erskine,
Writing Cases, (Ivey Publishing 4th edition) 3.
CASE STUDIES IN THE CLASSROOM
Case studies are usually discussed in class, in a large group. However, sometimes,
instructors may require individuals or groups of students to provide a written analysis
of a case study, or make an oral presentation on the case study in the classroom.
Preparing for a Case Discussion
Unlike lecture-based teaching, the case method requires intensive preparation by the
students, before each class. If a case has been assigned for discussion in the class, the
student must prepare carefully and thoroughly for the case discussion.
The first step in this preparation is to read the case thoroughly. To grasp the situation
described in a case study, the student will need to read it several times. The first
reading of the case can be a light one, to get a broad idea of the story. The subsequent
readings must be more focused, to help the student become familiar with the facts of
the case, and the issues that are important in the situation being described in the case –
the who, what, where, why and how of the case.
However, familiarity with the facts described in the case is not enough. The student
must also acquire a thorough understanding of the case situation, through a detailed
analysis of the case. During the case analysis process, she must to attempt to identify
the main protagonists in the case study (organizations, groups, or individuals
described in the case) and their relationships.
The student must also keep in mind that different kinds of information are presented
in the case study2. There are facts, which are verifiable from several sources. There
are inferences, which represent an individual’s judgment in a given situation. There is
speculation, which is information which cannot be verified. There are also
assumptions, which cannot be verified, and are generated during case analysis or
discussion. Clearly, all these different types of information are not equally valuable
2 Michael A. Hitt, R. Duane Ireland and Robert E. Hoskisson, Strategic Management
(Thomson Southwestern, 6th Edition) Civ

3
Learning with Cases
for managerial decision-making. Usually, the greater your reliance on facts (rather
than speculation or assumptions), the better the logic and persuasiveness of your
arguments and the quality of your decisions.
Broadly speaking, the different stages in the case analysis process could be as
follows3:
1. Gaining familiarity with the case situation (critical case facts, persons, activities,
contexts)
2. Recognizing the symptoms (what are the things that are not as expected, or as
they should be?)
3. Identifying goals/objectives
4. Conducting the analysis
5. Making the diagnosis (identifying problems, i.e., discrepancies between goals and
performance, prioritizing problems etc.)
6. Preparing the action plan (identifying feasible action alternatives, selecting a
course of action, implementation planning, plan for monitoring implementation)
3 Adapted from: 1993, C. C. Lundberg and C. Enz, ‘A framework for student case preparation’, Case Research Journal, 13 (Summer):144/Michael A. Hitt, R. Duane Ireland and Robert E. Hoskisson, Strategic Management (Thomson Southwestern, 6th Edition) Ciii
Exhibit 1
Components of a Situation Analysis
1. Corporate level situation analysis
- Corporate mission and objectives
- Resources and competencies
- Environmental problems and opportunities
- Demographic
- Social-cultural
- Economic
- Technological
- Legal and regulatory
- Competition
- Portfolio analysis
2. Product level situation analysis
- Market analysis
- Describe the product-market structure
- Find out who buys
- Assess why buyers buy
- Determine how buyers make choices
- Determine bases for market segmentation

l
4
Learning with Cases
Source: Developed from Joseph Guiltinan and Gordon Paul, ‘Marketing
Management: Strategies and Programs’, Fourth Edition (New York: McGraw-Hill, 1990), Chapters 2-6/ Joseph Guiltinan and Gordon Paul, Cases in Marketing
Management (McGraw-Hill, International Edition 1992) 2.
The components of a situation analysis for a typical marketing case are given
in Exhibit 1. This consists of situation analyses at the corporate and product
levels and a summary of the results of the analysis. Cases in other functional
areas such as strategy can also be analyzed using similar frameworks. As
mentioned earlier, the situation analysis should be followed by problem
diagnosis and action plan recommendations. While preparing for the case discussion, the student can also make notes with respect
to the key aspects of the situation and the case analysis. These could include points
such as the following:
Which company (or companies) is being talked about? Which industry is referred
to?
What are the products/services mentioned?
How/Why did the company land in problems (or became successful)?
What decision issues/problems/challenges are the decision makers in the case
faced with?
- Identify potential target markets
- Competitive analysis
- Identify direct competitors
- Assess likelihood of new competitors
- Determine stage in product life cycle
- Assess pioneer advantages
- Assess intensity of competition
- Determine the competitors’ advantages and disadvantages
- Market measurement
- Estimate market potential
- Determine relative potential of each geographic area
- Track industry sales trends
- Assess company or brand trends in sales and market share
- Make forecasts
- Profitability and productivity analysis
- Determine the cost structure
- Identify cost-volume-profit relationships
- Perform break-even and target profit analysis
- Make projections of sales or market share impact of marketing
expenditures
3. Summary - Assess performance (identification of symptoms)
- Define problems and opportunities

5
Learning with Cases
Case Discussions in the Classroom
A classroom case discussion is usually guided by the instructor. Students are expected
to participate in the discussion and present their views. In some cases, the instructor
may adopt a particular view, and challenge the students to respond. During the
discussion, while a student presents his point of view, others may question or
challenge him. Case instructors usually encourage innovative ways of looking at and
analyzing problems, and arriving at possible alternatives.
The interaction among students, and between the students and the instructor, must
take place in a constructive and positive manner. Such interactions help to improve
the analytical, communication, and interpersonal skills of the students.
Students must be careful that the contributions they make to the discussion are
relevant, and based on a sound analysis of the information presented in the case.
Students can also refer to the notes they have prepared during the course of their
preparation for the case discussion.
The instructor may ask questions to the class at random about the case study itself or
about the views put forward by an individual student. If a student has some new
insights about the issues at hand, she is usually encouraged to share them with the
class.
Students must respond when the instructor asks some pertinent questions. The
importance of preparing beforehand cannot be emphasized enough – a student will be
able to participate meaningfully in the case discussion only if he is knowledgeable
about the facts of the case, and has done a systematic case analysis. A case discussion
may end with the instructor (or a student) summarizing the key learning points (or
‘takeaways’) of the session.
Student performance in case discussions is usually evaluated, and is a significant
factor in assessing overall performance in the course. The extent of participation is
never the sole criterion in the evaluation – the quality of the participation is an equally
(or more) important criterion.
Working in a Group
If a group of students is asked to analyze a case, they must ensure that they meet to
discuss and analyze the case, by getting together for a group meeting at a suitable time
and location. Before the meeting, all the team members must read the case and come
with their own set of remarks/observations.
The group must ensure that all the group members contribute to the preparation and
discussion. It is important that the group is able to work as a cohesive team –
problems between team members are likely to have an adverse impact on the group’s
overall performance.
PREPARING A WRITTEN CASE ANALYSIS
Quite often, a written analysis of the case may be a part of the internal evaluation
process. When a written analysis of a case is required, the student must ensure that the
analysis is properly structured.
An instructor may provide specific guidelines about how the analysis is to be
structured. However, when submitting an analysis, the student must ensure that it is
neat and free from any factual, language and grammar errors. In fact, this is a
requirement for any report that a student may submit – not just a case analysis.

l
6
Learning with Cases
MAKING A CASE PRESENTATION
The instructor may ask a group of students to present their analysis and
recommendations to the class. Alternatively, an individual student can also be asked
to make a presentation.
The key to a good presentation is good preparation. If the case has been studied and
analyzed thoroughly, the content of the presentation should present no problems.
However, a presentation is more than the content. Some of points that need to be kept
in mind when making a case presentation are:
As far as possible, divide the content uniformly so that each team member gets an
opportunity to speak.
Use visual aids such as OHP slides, Power Point presentations,
advertisement/press clippings etc., as much as possible.
Be brief and to-the-point. Stick to the time limits set by the instructor.
Be well prepared.
EVALUATING STUDENT PERFORMANCE
The evaluation of a student’s performance in a case-driven course can be based on
some or all of the following factors:
Written case analyses (logical flow and structuring of the content, language and
presentation, quality of analysis and recommendations, etc.).
Case presentations (communication skills, logical flow and structuring of the
content, quality of analysis and recommendations, etc.).
Participation in classroom case discussions (quality and extent of participation).
Case writing assignments or similar projects.
Case-based examinations.
BENEFITS FROM THE CASE METHOD
The case benefit has several advantages over traditional teaching methods. The skills
that students develop by being exposed to this method are listed in Exhibit 2. The
consequences to the student from involvement in the method are listed in Exhibit 3.
Some of the advantages of using case studies are given below:
Cases allow students to learn by doing. They allow students to step into the shoes
of decision-makers in real organizations, and deal with the issues managers face,
with no risk to themselves or the organization involved.
Cases improve the students ability to ask the right questions, in a given problem
situation. Their ability to identify and understand the underlying problems rather
than the symptoms of the problems is also enhanced.
Case studies expose students to a wide range of industries, organizations,
functions and responsibility levels. This provides students the flexibility and
confidence to deal with a variety of tasks and responsibilities in their careers. It
also helps students to make more informed decisions about their career choices.

7
Learning with Cases
Source: Michiel R. Leeenders, Louise A. Mauffette-Launders and James Erskine, Writng Cases (Ivey Publishing, 4th edition) 7.
Source: 1993, C. C. Lundberg and C. Enz, ‘A framework for student case
preparation’, Case Research Journal, 13 (Summer) 134/ Michael A. Hitt, R. Duane
Ireland and Robert E. Hoskisson, Strategic Management (Thomson Southwestern, 6th
Edition) Cii.
Cases studies strengthen the student’s grasp of management theory, by providing real-life examples of the underlying theoretical concepts. By providing rich, interesting information about real business situations, they breathe life into conceptual discussions.
Exhibit 2
Inventory of Skills Developed by the Case Method
1. Qualitative and quantitative analytical skills, including problem identification
skills, data handling skills and critical thinking skills.
2. Decision making skills, including generating different alternatives, selecting
decision criteria, evaluating alternatives, choosing the best one, and
formulating congruent action and implementation plans.
3. Application skills, using various tools, techniques and theories.
4. Oral communication skills, including speaking, listening and debating skills.
5. Time management skills, dealing with individual preparation, small group
discussion and class discussion.
6. Interpersonal or social skills, dealing with peers, solving conflicts and
practicing the art of compromise, in small or large groups.
7. Creative skills, looking for and finding solutions geared to the unique
circumstances of each case.
8. Written communications skills, involving regular and effective note-taking,
case reports and case exams.
Exhibit 3
Consequences of Student Involvement with the Case Method
1. Case analysis requires students to practice important managerial skills-
diagnosis, making decisions, observing, listening, and persuading – while
preparing for a case discussion.
2. Cases require students to relate analysis and action, to develop realistic and
concrete actions despite the complexity and partial knowledge characterizing
the situation being studied.
3. Students must confront the intractability of reality-complete with absence of
needed information, an imbalance between needs and available resources,
and conflicts among competing objectives.
4. Students develop a general managerial point of view – where responsibility is
sensitive to action in a diverse environmental context.

l
8
Learning with Cases
Cases provide students with an exposure to the actual working of business and other organizations in the real world.
Case studies reflect the reality of managerial decision-making in the real world, in that students must make decisions based on insufficient information. Cases reflect the ambiguity and complexity that accompany most management issues.
When working on a case study in a group, students must also be able to understand and deal with the different viewpoints and perspectives of the other members in their team. This serves to improve their communication and interpersonal skills.
Case studies provide an integrated view of management. Managerial decision-making involves integration of theories and concepts learnt in different functional areas such as marketing and finance. The case method exposes students to this reality of management.

Lessons in Customer Service from Wal-Mart
“We are agents for our customers. We want to sell them what they want to buy, and
the name of the game is who can most efficiently deliver that merchandise from raw materials to the customer.” 1
- David Glass, former President, CEO and CFO, Wal-Mart.
“The secret of successful retailing is to give your customers what they want. And
really, if you think about it from your point of view as a customer, you want
everything: a wide assortment of good quality merchandise; the lowest possible prices; guaranteed satisfaction with what you buy; friendly, knowledgeable service;
convenient hours; free parking; a pleasant shopping experience.”2
- Sam Walton, founder of Wal-Mart.
INTRODUCTION
In March 2003, Fortune magazine ranked Wal-Mart as the world’s largest and America’s most admired company (Refer Exhibit I for awards and recognitions conferred on Wal-Mart). Fortune’s Managing Editor, Rik Kirkland, commented, “Eleven years after Sam Walton’s death, Wal-Mart, the company he founded, not only has grown tenfold to become the world’s biggest but also is now the world’s and America’s most admired. Best of all, Walton’s successors have achieved this unprecedented feat by preserving the unpretentious, relentlessly customer-focused culture.”3 In November 2002, Wal-Mart was ranked #1 by the customers in the 2002 department store customer satisfaction study, conducted by a leading consultancy firm, JD Power & Associates4 (Refer Exhibit II).
Since its inception, Sam Walton (Walton) had cultivated a customer-focused culture at Wal-Mart. In his autobiography “Sam Walton – Made in America: My Story,” Walton stated ten rules that he followed in managing his company (Refer Exhibit III). One of the rules said, “Exceed your customer’s expectations. If you do they’ll come back over and over. Give them what they want – and a little more. Let them know you appreciate them. Make good on all your mistakes, and don’t make excuses – apologize. Stand behind everything you do. ‘Satisfaction guaranteed’ will make all the difference.” The rule reflected Walton’s commitment to his customers.
Apart from being one of the core elements of its culture, Wal-Mart’s pursuit to
provide the best customer service had its effect on the pricing and purchasing policies
of the company. On the importance of providing customers value for their money,
Walton said, “We believe in the value of the dollar. We exist to provide value to our
customer, which means that in addition to quality and service, we have to save them
money. Every time Wal-Mart spends one dollar foolishly, it comes right of our
1 As quoted in the article, “In retailing, the rich are getting richer, and many of the poor will fall by the wayside”, by Sawaya, Z., in Forbes dated January 6, 1992.
2As quoted in the article, “Walmart.com, background information”, posted on www.walmart.com.
3 As quoted in the article, “The World's Most Admired Companies” by Paola Hjelt, Fortune,March 3, 2003.
4 Headquartered in California, JD Power and Associates is a global marketing information services firm that helps businesses and consumers make better decisions through credible and easily accessible customer-based information.

12
Marketing Management
customers’ pockets. Every time we save them a dollar, that puts us one more step
ahead of the competition – which is where we always plan to be.”5
Wal-Mart was one of the first few companies in the retailing industry to use IT to
offer value-added services to customers. Commenting on Wal-Mart’s venture into e-
business through the launch of its site, Wal-Mart spokeswoman, Melissa Brown, said,
“It is yet another way for us to take care of our customers.”6
WALTON – A CUSTOMER-FOCUSED LEADER
In July 1962, Walton – an economics graduate from the University of Missouri, established the first Wal-Mart Discount City in Rogers, a small town in the state of Arkansas, USA. He laid down three principles that later became an integral part of Wal-Mart’s culture. The principles were – respect for the individual, striving for excellence, and service to customers.
Wal-Mart’s employees, also known as associates, were given a place of importance in Walton’s scheme. Walton believed that if employees were respected and treated well, they would in turn treat the customers with respect, and satisfied customers would continue their relationship with Wal-Mart. Associates were encouraged to come up with innovative ideas to solve their day-to-day problems, set new performance goals, make their work enjoyable and strive for excellence. They conducted meetings, known as “grassroots”, where they discussed ways and means to improve their performance. Walton emphasized the importance of keeping overall operating expenses low, so that the benefits could be reaped by both the company, through enhanced profitability, and by the customers, through reduced prices.
Customers were the focus of all activities at Wal-Mart. To highlight the significance of customers, Walton had laid down rules for employees which read as follows:
Rule # 1: The customer is always right.
Rule # 2: If the customer happens to be wrong, refer to Rule # 1.
He used to say to his employees, “There is only one boss – the customer. And he can fire everybody in the company, from the chairman down, simply by spending his money elsewhere.”7
In his efforts to maximize customer satisfaction, Walton implemented several innovative practices in Wal-Mart. The employees were asked to display ‘aggressive hospitality,’ that is, the employees were encouraged to provide customer service which was beyond their expectations.
Such displays of aggressive hospitality enhanced Wal-Mart’s reputation as a customer-focused company. In one instance, Dremia Meier, an associate saved the life of a customer by conducting cardiopulmonary resuscitation (CPR).8 When she noticed that a customer in the parking lot had suffered a mild stroke, she immediately rushed to him and performed CPR, with the help of another associate, until the ambulance arrived. The customer’s life was saved and the manager of the Wal-Mart store later called on the customer at the hospital to enquire about his health.
5 As quoted in the book, “Sam Walton, Made in America: My Story”, by Sam Walton and John Huey, Page 13.
6 As quoted in the article, “A leader beyond bricks and mortar,” in Discount Store News, dated October 1999.
7 As quoted in the article “CRM's Not Just a Buzzword, It’s a Sound Business Principle,” by Aljosja Van Dorssen, Business Times, April 1, 2002.
8 CPR involves external cardiac massage and artificial respiration. This exercise attempts to restore circulation of the blood and prevents death/brain damage due to lack of oxygen in a person who has collapsed and has no pulse/stopped breathing.
13
Lessons in Customer Service from Wal-Mart
The customers were viewed and treated as guests at Wal-Mart. The company was known for its ‘greeters’ who greeted the customers with a warm welcome and a friendly smile, the moment they entered a store. They offered the customers shopping carts and conveyed them that Wal-Mart was glad to have them at the store. Regular customers at Wal-Mart were made to feel special by being addressed by name. Whenever Walton or any other noted dignitary visited a store, or on any occasion (like company meetings), the employees greeted them with the famous ‘Wal-Mart Cheer’ (Refer Exhibit IV), which ended by addressing the customer as “#1 at Wal-Mart.”
As soon as customers entered the store, the store associates looked after them completely. If customers asked where a product could be found, they were not merely shown the way, but were actually accompanied to the correct location. Even customers making low-value transactions were treated with the same respect and courtesy. All customers were allowed to exchange products or seek refunds for products if they wished.
Other practices at Wal-Mart for the benefit of customers were the “Sundown rule” and the “10-foot attitude rule.” According to the Sundown rule, associates had to resolve all service-related requests made by customers before the sun set. The rule aimed to induce a sense of urgency in meeting customer service requests. The quick response to customer calls demonstrated Wal-Mart’s dedication to better customer service. In most cases, the customers’ problems were dealt with immediately. In case they were not put right the same day, the associates kept the customers informed about the action being taken.
Employees followed the Sundown rule with complete dedication as could be seen on several occasions. In one particular instance, Jeff, a pharmacist at one of the Wal-Mart stores got a late night call from one of his customers, who was a diabetic patient. The customer said that she had mistakenly dropped her insulin in her garbage disposal bin. Conscious that it would be risky for a diabetic to be without insulin, Jeff immediately rushed to the store and saw to it that the insulin was delivered to the customer.
Employees also followed the ‘ten-foot attitude’ rule which stated that whenever an employee was within a distance of 10 feet from a customer, he had to look into the customer’s eyes, greet him/her, and ask if he could be of any help. The employees practiced this rule without slacking. To encourage employees to provide the best customer service, Walton would say, “Let’s be the most friendly – offer a smile of welcome and assistance to all who do us a favor by entering our stores. Give better service – over and beyond what our customers expect. Why not? You wonderful, caring associates can do it, and do it better than any other retailing company in the world . . . exceed your customers’ expectations. If you do, they’ll come back over and over again.”9
WAL- MART’S CUSTOMER- CENTRIC POLICIES
Since the very beginning, Wal-Mart’s pricing policies were based on the recognition that consumers always wanted the best bargain on the products purchased by them without compromising on the quality. Walton had used the captions –“We Sell for Less” and “Satisfaction Guaranteed” on the very first Wal-Mart signboard.
Wal-Mart followed what it called the Every Day Low Price (EDLP) policy. The policy was that Wal-Mart would always provide a wide variety of high quality, branded and unbranded products at the lowest possible price, offering better value for the customer’s money. A Wal-Mart advertisement explained: “Because you work hard for every dollar, you deserve the lowest price we can offer every time you make a
9 As quoted in the article, “Exceeding customer expectations,” posted on www.walmart.com.

14
Marketing Management
purchase. You deserve our Every Day Low Price. It’s not a sale; it’s a great price you can count on every day to make your dollar go further at Wal-Mart.”10
EDLP was extremely attractive to customers and emerged as the key contributor to Wal-Mart’s success over the years. Several initiatives the company took were based on the EDLP policy. For instance, Wal-Mart made heavy investments in technology to improve efficiency in distribution. Tim Crane, regional buyer for Wal-Mart said, “I’m proud to say EDLP has always been the philosophy of Wal-Mart. We offer value every day. Customers don’t have to wait for sales. We distribute 13 circulars a year, two during the Christmas period, one a month otherwise, and it is a rare day that we do any off-price advertising. We are not interested in co-op monies, exchanging terms, guaranteed sales, or any other deals which we feel add to the cost of the merchandise. We simply want the lowest net cost – we call that net down pricing. For EDLP to be successful, you must drive all the unnecessary costs out of the equation. When vendors work with the appropriate Wal-Mart buyers, they will, I assure you, work to achieve that.”11
Wal-Mart also introduced ideas like “rollback” of prices and “special buys” to
enhance customer satisfaction. Under the “rollback” program, Wal-Mart made a
commitment to its customers to reduce prices, whenever and wherever it could, and
pass on the maximum savings to them. Whenever the company was able to reduce the
procurement costs of products due to greater efficiency in its operations and supply
chain management practices, it cut prices, passing on the benefits to customers. When
prices were rolled back, a yellow “rollback smiley” logo appeared on the products in
the store racks. Under the “special buy” pricing program, products marked with the
‘special buy’ logo, had extra quantity of the same product or a new product, offered
for a limited period.
Offering the best price to its customers formed the basis for Wal-Mart’s purchasing
policies. Wal-Mart sourced merchandise directly from manufacturers. By eliminating
the middlemen, Wal-Mart was able to sell to customers at lower prices, and in turn
benefited from the large volumes of business generated. When Wal-Mart emerged as
the leading company in the retailing industry, manufacturers actually competed with
each other to offer Wal-Mart the best prices. Wal-Mart’s relationship with
manufacturers later evolved from a normal transaction-oriented relationship to a more
comprehensive vendor-retailer relationship, in which they became partners in their
drive to serve the customer in the best possible manner.
At the store level, customer service was a highly focused activity. Each Wal-Mart
store was required to cover the customers in the surrounding area. The store managers
were regularly updated on which products were moving and which were not. Based on
this information and an assessment of the tastes and preference of the consumers in
the vicinity of the store, Wal-Mart’s employees decided which goods to stock and
how to arrange them inside the store. Commenting on the importance of customer
service at Wal-Mart, Tom Coughlin, President and Chief Executive Officer, Wal-Mart
Stores division, said, “Wal-Mart's culture has always stressed the importance of
customer service. Our associate base across the country is as diverse as the
communities in which we have Wal-Mart stores. This allows us to provide the
customer service expected from each individual customer that walks into our stores.”12
The customer friendly policies of Wal-Mart, coupled with its major expansion drive
enabled the company to register significant growth rates during the 1970-2000 period.
10 As quoted in the article, “Pricing Philosophy,” posted on www.walmart.com. 11 As quoted in the article, “Wal-Mart’s top ten” by Loretta Roach, in Discount Merchandiser,
dated August 1993. 12 As quoted in the heading titled, “Three Basic Beliefs,” posted on www.walmart.com.

15
Lessons in Customer Service from Wal-Mart
During the 1970s, Wal-Mart’s sales increased from $31 million to $1.2 billion, a
significant growth rate of 287%. In the same period, the number of Wal-Mart stores
increased from 32 to 276. The growth continued in the 1980s with Wal-Mart’s sales
increasing at a compounded annual rate of over 36%. Wal-Mart’s growth in the 1980s
was fuelled by the introduction of the Sam’s Wholesale Clubs13 in 1983, and the
Hypermart (which was later known as Super Center14) in 1987.
In Wal-Mart’s annual report (1986-87), Walton again stressed on providing the best customer service in order to maintain its past successes. He said, “The key to success must be that we will all truly embrace the philosophy that our sole reason for being is to serve, even spoil those wonderful customers. To keep this focus on customer service despite our continuous change is just as critical today as it was in those dine stores thirty years ago.”
USING IT FOR CUSTOMER DELIGHT
Wal-Mart made heavy investments in IT in the 1980s. In the early 1980s, the
company began to use Electronic Data Interchange (EDI) systems. EDI linked the
computers at the stores and the distribution centers. It helped the company track the
movement of goods in real-time and quickly replenish the stock at the stores. EDI
helped in minimizing the incidences of stock-outs and enabled better inventory
management. The system eliminated the inconvenience to customers due to the non-
availability of products.
In 1987, Wal-Mart installed a satellite communication system, costing an estimated
$700 million. The system connected the stores, distribution centers and the suppliers’
systems and automated the entire distribution process of the company. The system
also connected all the stores of the company with the General Office with 2-way voice
and data communication, and one-way video communication.
Although logistical systems were installed earlier, it was only in the late 1980s that
Wal-Mart started thinking seriously of using IT to get more customer-related
information. Wal-Mart’s management realized that the rapid rate, at which the
company was expanding, was making it increasingly difficult to cater effectively to
the diverse needs of millions of consumers. Consumers’ buying habits, needs and
preferences differed from one area to another. Goods that were popular in one store
were not as popular in others. Wal-Mart therefore began investing in data
warehousing systems.
In 1989, Wal-Mart started building a huge database of customer information in its
data warehouse systems located at its headquarters at Bentonville, Arkansas. The
company collected sales and customer related information for each store and fed that
information into the warehouse systems. The data warehouse served as a storehouse of
data, but a proper analysis of the data was required to gain insights into consumers’
needs and preferences and their buying patterns. For this purpose, the company used
13 Sam’s Club was a club chain with a large store in warehouse-type buildings targeted at small business owners and bulk merchandise buyers. At low prices and with an annual membership fee, customers could make huge savings on the merchandise at Sam’s Clubs. The club provided branded merchandise and around 4,000 items like tires, cameras, batteries, watches, office supplies, cocktail sausages, soft drinks, clothing, home furnishings, auto supplies, etc.
14 A Supercenter was smaller than the hypermart and was an extension of the discount store. It was a combination of discount and grocery stores under one roof. It stocked food products and other necessities in a single retail outlet as a one-stop shopping facility. Each Supercenter was between 97,000 to 211,000 square feet and employed 200 to 550 associates.

16
Marketing Management
data mining15 tools that could be used to analyze information relating to the products
being sold upto the store level, and to determine the demographic and ethnic profile of
customers within the vicinity of a store, how frequently each product had to be
replenished and so on.
In the early 1990s, Wal-Mart continued to employ new technologies to facilitate better analysis of customer data as they became available. Wal-Mart’s IT experts used 3-D visualization tools to make accurate estimates of products most likely to be bought by customers on the basis of parameters such as ethnicity, geographic location, weather patterns, local sports affiliations, and around 10,000 other varied parameters. Wal-Mart made around 90% of its stock replenishments every month, based on the analysis of customer data generated through the data warehouse.
To make shopping at Wal-Mart a pleasant experience, Wal-Mart installed customer information kiosks16 in its stores in 1996. The kiosks helped customers find out the price of any product and get a brief description of it. Each Wal-Mart store had between two and five kiosks. To help customers locate a product which was out of stock in a particular store, Wal-Mart introduced an innovative hand-held product-locating devise called 960. If a customer found that a particular item was not available at a store, the store associate would enter the item number in the 960. The 960 would then indicate the nearest Wal-Mart store (within a 30-40 mile radius) that had the item, the location of the store, its telephone number and the quantity of the items left at the store. This helped customers find out where the item was available. The store associate also arranged for the product to be brought to the store, if needed urgently. The 960 device got a very positive response from customers.
In 1996, Wal-Mart launched its website – www.walmart.com – to provide information to its customers on all the products it stocked and to enable online sales. The online sales site had plenty of user-friendly features. For prompt delivery of the goods ordered online, Wal-Mart tied up with Fingerhut, a US-based direct marketing company. The customers who registered themselves at the site could access the features on the site directly. The site contained a store map. On entering their local zip code, the customers were linked to a Wal-Mart store in their area. They could make an online enquiry regarding the availability of a particular product in that store and order it.
The site also had advance features to ensure the security of online credit card transactions. It was also connected to a call centre, through which the customers could place their enquiries and grievances. The customers registered on the site were kept informed about in-store events such as sales promotions, price rollbacks, or ‘special buys’ in the Wal-Mart store in their area.
The website also had some customer service tools, such as Netflix, which enabled customers to report a package lost in the mail. The customer had to click on the relevant icon on the screen, and Wal-Mart would send the required product to the customer.
IT played an important role in improving the efficiency of operations at Wal-Mart. The benefits which accrued were passed on to customers, as per Wal-Mart’s policy. Wal-Mart’s Annual Report 1999 said, “The first and the most important thing about Wal-Mart’s information systems is precisely that the customer’s needs come first. By using technology to reduce inventory, expenses and shrinkage, we can create lower prices for our customers and better returns for our shareholders.”
15 Data mining means the extraction and analysis of data from a data warehouse. It has applications in many areas of business. Buyers can use it to keep store shelves adequatelystocked, marketers can use it in store design and advertising, and business analysts can use it for stock projections.
16 Computer terminals installed at several locations in the stores.

17
Lessons in Customer Service from Wal-Mart
RECENT CUSTOMER SERVICE INITIATIVES
At the dawn of the new millennium, Wal-Mart was one of the world’s largest companies, with revenues of $165 billion in fiscal 2000. Banking on its past success, Wal-Mart renewed its emphasis on customers and launched new initiatives to serve its customers better. One such initiative was the ‘store of the community’ program, launched in 2001. Under the program, Wal-Mart began remodeling its discount stores and super centers in the US to fulfill the needs of customers they served, in line with what the customers wanted. Explaining the program, Tom Coughlin, President and CEO of Wal-Mart Stores Division, said, “The one-size-fits-all concept simply doesn’t work anymore in the retail industry. Customers tell us what they want and it is our responsibility to meet those needs. Our store associates live and work in each store’s community and interact with over 100 million customers each week. If we utilize information from all available resources including customers, associates and suppliers, our store will reflect the interests of its community. We will sell merchandise the customers want to buy, not merchandise we want to sell. By accomplishing this goal, we create happy, satisfied customers because they can now complete all of their shopping in one location - our store.”17
Wal-Mart’s ‘store of the community’ program made effective use of bar code technology18 and advanced data mining techniques. The bar-code on each product sold in Wal-Mart’s stores was scanned at the time of billing. This enabled Wal-Mart to capture sales and customer details such as the product being purchased, its price, when it was purchased and by whom, and the other products in a customer’s shopping cart. This information was taken together with the demographics of the communities in the vicinity of the store, consumer feedback on various products, and the suggestions on various products made by the store associates.
A direct consequence of the ‘store of the community’ program was that the merchandize mix of a Wal-Mart store in one region differed substantially from that of another. For instance, a Wal-Mart store in a middle-income area in Decatur, Georgia, east of Atlanta, with a majority black population stocked African-American angels and ethnic Santas, as part of its Christmas decoration display. The music department in the store had more albums of black pop stars. In contrast, another Wal-Mart store, located in the high-income suburbs of Northern Atlanta, an area with a majority of white population, stocked pop-albums of popular country stars, and its music section had costlier items.
Similarly, the manner in which the products were displayed differed from one store to another. For instance, a Wal-Mart store located in Mountain View, California, which served the predominantly young and adventurous Silicon Valley population, had attractive displays of mountain bikes and had health supplements on offer. In contrast, a Wal-Mart store in Union city, California, surrounded by blue-collar employees stocked more of electronic items like home theater systems.
The program benefited Wal-Mart by increasing its sales to existing customers significantly and also attracting new customers. By stocking all the products likely to be purchased by customers at one time and one place, Wal-Mart also reaped the benefits of cross selling. For example, a store at Glen Ellyn, a suburb to the west of Chicago sold toys, batteries, stationary products, snacks and popular children VCDs for its kid customers.
17 As quoted in the article, “This store is your store,” in Wal-Mart Annual Report 2001. 18 Invented by Joseph Woodland and Bernard Silver in 1949, barcode technology was first used
commercially in 1974. The technology is used to identify the product and its price (among other details). A scanner transmits the information to a cash register or computer for action (such as printing out a receipt).

18
Marketing Management
The ‘store of the community’ program was a very successful initiative by Wal-Mart, which contributed to increased customer loyalty. By 2003, Wal-Mart was the world’s largest company, with revenues in fiscal 2002 amounting to $244.5 billion (Refer Exhibit V).
However, despite its widespread recognition and success owing to its customer-centric culture, Wal-Mart was criticized by a few of its customers, particularly for its overcrowded stores. Analysts felt that its continued focus on policies like EDLP might harness its growth prospects in the future. Expressing her dissatisfaction with Wal-Mart, a customer said, “The kind of crowd that Wal-Mart brings in can be a little scary. If I had a choice, I’d go somewhere else.”19
Questions for Discussion
1. Walton encouraged his employees by saying, “Give better service – over and beyond what our customers expect. Why not? You wonderful, caring associates can do it, and do it better than any other retailing company in the world.” Explain the role of Walton’s leadership in developing a customer-centric culture at Wal-Mart? Do you think that in order to provide the best customer-service, organizations must always follow a top-down approach? Discuss.
2. Wal-Mart’s focus on customers led to the development of several customer-centric policies. Explain how these policies benefited both the customers and the company. Do you think that providing the best customer-service is always a win-win proposition? Discuss.
3. Wal-Mart was one of the first few retailing companies to use IT in its operations as early as the 1980s. Explain how Wal-Mart used IT for the benefit of its customers.
© ICFAI Center for Management Research. All rights reserved.
19 As quoted in the article, “Meet Your Neighborhood Grocer,” by Brian O’Keefe, in Fortune, dated May 13, 2002.

19
Lessons in Customer Service from Wal-Mart
Exhibit I
Walmart’s Awards and Recognitions
Year Awards & Recognition Awarder
17th most respected company in the world and #1 most respected retailer in North America
Financial Times and PriceWaterhouse Coopers
1999
Retailer of the Century Discount Store News and Mass Market Retailers
5th most admired company in America Fortune2000
Ranked No. 5* on Fortune’s Global Most Admired Companies list – up from No. 7 in 1999
Fortune
3rd most admired company in America Fortune2001
Ranked as 8th most admired company in the world
Financial Times and Price/Waterhouse
Awarded the ‘Ron Brown’ Award for Corporate Leadership’
President of US 2002
Named #1 on the Fortune 500 list of world’s largest companies (2001)
Fortune
2003 Named the most admired company in America
Named #1 in the Fortune 500 list of world’s largest companies(2002)
Fortune
Source: www.walmartstores.com
NB:*Ranking was based on parameters like leadership selection, people-centric values and teamwork.
Exhibit II
Department Store Customer Satisfaction Study (2002)
In November 2002, J.D. Power and Associates, released the 2002 department store customer satisfaction study. The study attempted to measure the extent to which the largest moderate price and discount department stores in the US were satisfying the customers. The study was based on 2,100 telephone interviews from a representative sample of US households. Respondents include the adult in each household who most often shops in department stores and who had shopped the surveyed store in the past two months. The stores were ranked using a customer satisfaction index scale that ranged from 100 to 1,000. The parameters used to measure customer satisfaction, arranged in the order of their significance included:
Value
Sales and service associates
Services
Store environment
Merchandise
Reputation
Sales and promotion
Store location

20
Marketing Management
The top three companies in the discount department store category were:
COMPANY RANK NO.OF POINTS TOP RATINGS FROM THE CUSTOMERS FOR:
Wal-Mart 1 756 Value, Sales and service associates, Merchandise, and Sales and promotions
Target 2 744 Services, Store environment and Reputation.
Kmart 3 681 N.A
The top four companies in the moderate price category included:
COMPANY RANK NO.OF POINTS
Kohl’s 1 750
JC Penney 2 736
Mervyn’s 3 735
Sears 4 733
Adapted from the press release, “2002 Department Store Customer Satisfaction Study,” posted on www.jdpa.com, dated November 12, 2002.
Exhibit III
Walton's Rules for Building a Business
Rule 1
Commit to your business. Believe in it more than anybody else. I think I overcame
every single one of my personal shortcomings by the sheer passion I brought to my
work. I don't know if you're born with this kind of passion, or if you can learn it. But
I do know you need it. If you love your work, you'll be out there every day trying to
do it the best you possibly can, and pretty soon everybody around will catch the
passion from you - like a fever.
Rule 2
Share your profits with all your Associates, and treat them as partners. In turn,
they will treat you as a partner, and together you will all perform beyond your
wildest expectations. Remain a corporation and retain control if you like, but behave
as a servant leader20 in a partnership. Encourage your Associates to hold a stake in
the company. Offer discounted stock, and grant them stock for their retirement. It's
the single best thing we ever did.
Rule 3
Motivate your partners. Money and ownership alone aren't enough. Constantly,
day-by-day, think of new and more interesting ways to motivate and challenge your
partners. Set high goals, encourage competition, and then keep score. Make bets with
outrageous payoffs. If things get stale, cross-pollinate; have managers switch jobs
with one another to stay challenged. Keep everybody guessing as to what your next
trick is going to be. Don't become too predictable.
20 The term servant leader was used by Robert Greenleaf in his book Servant Leadership. According to Greenleaf, “The servant leader is servant first…… It begins with the natural feeling that one wants to serve, to serve first………”

21
Lessons in Customer Service from Wal-Mart
Rule 4
Communicate everything you possibly can to your partners. The more they know, the more they'll understand. The more they understand, the more they'll care. Once they care, there's no stopping them. If you don't trust your Associates to know what's going on, they'll know you don't really consider them partners. Information is power, and the gain you get from empowering your Associates more than offsets the risk of informing your competitors.
Rule 5
Appreciate everything your Associates do for the business. A paycheck and a stock option will buy one kind of loyalty. But all of us like to be told how much somebody appreciates what we do for them. We like to hear it often, and especially when we have done something we're really proud of. Nothing else can quite substitute for a few well-chosen, well-timed, sincere words of praise. They're absolutely free - and worth a fortune.
Rule 6
Celebrate your successes. Find some humor in your failures. Don't take yourself so seriously. Loosen up, and everybody around you will loosen up. Have fun. Show enthusiasm - always. When all else fails, put on a costume and sing a silly song. Then make everybody else sing with you. Don't do a hula on Wall Street. It's been done. Think up your own stunt. All of this is more important, and more fun, than you think, and it really fools the competition. "Why should we take those cornballs at Wal-Mart seriously?"
Rule 7
Listen to everyone in your company. And figure out ways to get them talking. The folks on the front lines - the ones who actually talk to the customer - are the only ones who really know what's going on out there. You'd better find out what they know. This really is what total quality is all about. To push responsibility down in your organization, and to force good ideas to bubble up within it, you must listen to what your Associates are trying to tell you.
Rule 8
Exceed your customers' expectations. If you do, they'll come back over and over. Give them what they want - and a little more. Let them know you appreciate them. Make good on all your mistakes, and don't make excuses - apologize. Stand behind everything you do. The two most important words I ever wrote were on that first Wal-Mart sign, "Satisfaction Guaranteed." They're still up there, and they have made all the difference.
Rule 9
Control your expenses better than your competition. This is where you can always find the competitive advantage. For 25 years running - long before Wal-Mart was known as the nation's largest retailer - we ranked No. 1 in our industry for the lowest ratio of expenses to sales. You can make a lot of different mistakes and still recover if you run an efficient operation. Or you can be brilliant and still go out of business if you're too inefficient.
Rule 10
Swim upstream. Go the other way. Ignore the conventional wisdom. If everybody else is doing it one way, there's a good chance you can find your niche by going in exactly the opposite direction. But be prepared for a lot of folks to wave you down and tell you you're headed the wrong way. I guess in all my years, what I heard more often than anything was: a town of less than 50,000 populations cannot support a discount store for very long.
Source: “Sam Walton, Made in America: My Story,” page nos 314-317.

22
Marketing Management
Exhibit IV
The Wal-Mart Cheer
Give me a W!
Give me an A!
Give me an L!
Give me a Squiggly!
Give me an M!
Give me an A!
Give me an R!
Give me a T!
What’s that spell?
Wal-Mart!
What’s that spell?
Wal-Mart!
Who’s number one?
THE CUSTOMER
Source: The book, “Sam Walton Made in America”, by Sam Walton and John Huey, Page 200.
Exhibit V
Wal-Mart’s Performance Milestones
YEAR SALES NET INCOME STORES
1970 31 mn 1.2 mn 32
1980 1.2 bn 41 mn 276
1990 26 bn 1 bn 1528
2000 165 bn 5 bn 2960
2003 244.5 bn 8 bn 3400
Source: Wal-Mart Annual Reports 1980, 1990, 2003.

23
Lessons in Customer Service from Wal-Mart
Additional Readings & References: 1. Weiner, S, Retailing, Forbes, January 8, 1990.
2. Edgerton, J, Netzer, B, The Biggest Blue Chips, Money, October 1990.
3. Sawaya, Z, In Retailing, The Rich are Getting Richer, and Many of the Poor Will Fall by the Wayside, Forbes, January 6, 1992.
4. Stalk Jr., G, Evans-Clark, P, Competing on Capabilities: The New Rules of Corporate Strategy, Harvard Business Review, March/April 1992.
5. Charan, Ram, Capabilities-Based Competition, Harvard Business Review, May/June 1992.
6. Life of a Salesman, Time, June 15, 1992.
7. Moore, James F, The Evolution of Wal-Mart: Savvy Expansion and Leadership,Harvard Business Review, May/June 1993.
8. Roach, Loretta, Wal-Mart's Top Ten, Discount Merchandiser, August 1993.
9. Scans Provide `Goods' For Data Warehouse, Automatic I.D. News, May 1996.
10. Schwartz, Ela, Helping Customers Help Themselves, Discount Merchandiser, January 1997.
11. Through the Eyes of a Customer, Discount Store News, March 3, 1997.
12. Harrison, Denise, Wal-Mart Taps NCR for Data Warehouse Expansion, ENT, March 19, 1997.
13. Verity, John W, Coaxing Meaning out of Raw Data, www.businessweek.com, February 3, 1997.
14. CIO Forum: Knowledge Payback, www.informationweek.com, September 14, 1998.
15. Wilcox, Joe, Torode, Christina, What CIO’s want, Computer Reseller News, September 28, 1998.
16. Holstein, William J, Sieder, Jill Jordan, Svetcov, Danielle, Data-crunching Santa, US.News & World Report, December 21, 1998.
17. Newsome, Dwight, What's the World's Largest Retailer's Customer Service Secret? Think Small. One Customer at a Time. One Associate at a Time. Business Perspectives, Summer 2000.
18. Guglielmo, Connie, Attention Shoppers, Inter@ctive Week, June 28, 1999.
19. A Leader beyond Bricks and Mortar, Discount Store News, October 1999.
20. Online, Chain Store Age, October 1999.
21. Blankenhorn, Dana, Marketers Hone Targeting, Advertising Age, June 18, 2001.
22. Johnson, Bradford C, Retail: The Wal-Mart Effect, The McKinsey Quarterly, 2002 Number 1.
23. Schoenberger, Chana R, The Internet of Things, www.forbes.com, March 18, 2002.
24. Hospel, Holly, Down the Rabbit Hole, Chase down Meetings Data for Fun and Profit,www.gwsae.org, March 2001.
25. Blankenhorn, Dana, Marketers Hone Targeting, Advertising Age, June 18, 2001.
26. Foote, Paul Sheldon, Krishnamurthi, Malini, Forecasting Using Data Warehousing Model: Wal-Mart's Experience, Journal of Business Forecasting Methods & Systems,Fall 2001.
27. Smarter, Faster, More Profitable, www.intelligententerprise.com, October 4, 2001.
28. Stankevich, Debby Garbato, Sizing the Market, Retail Merchandiser, March 2002.
29. Evans, Bob, Business Technology: The Customer's Always Right, www.informationweek.com, April 22, 2002.
30. Newman, Christine, Growing Your Revenue and Profitability: It’s All about Your Data, www.teradatamagazine.com, Third Quarter 2002.
31. 2002 Department Store Customer Satisfaction Study, www.jdpa.com, November 12, 2002.
32. Tsao, Amy, Online Retailing Finds its Legs, BusinessWeek Online, December 20, 2002.
33. Hjelt, Paola, The World's Most Admired Companies, Fortune, March 3, 2003.

24
Marketing Management
34. Sarah Marcisz, New Self Check-Out Systems in at Marion. Wal-Mart Store Has Eight Do-It-Yourself Computer Lanes, www.chronicle-tribune.com, March 8, 2003.
35. Zellner, Wendy; Sager, Ira, Fewer Smiles in the Aisles, Business Week, April 28, 2003.
36. Walmart.com., PC Magazine, May 6, 2003.
37. Kalakota, Ravi, Robinson, Marcia, From e-Business to Services: Why and Why Now?, www.informit.com, August 15, 2003.
38. Port, Otis, Arndt, Michael, Carey, John, Smart Tools, Business Week, spring 2003.
39. Bianco, Anthony, Zellner, Wendy, Brady, Diane, France, Mike, Lowry, Tom, Byrnes, Nanette, Zegel, Susan, Arndt, Michael, Berner, Robert, Palmer, Ann Therese, Is Wal-Mart Too Powerful? Business Week, October 6, 2003.
40. Kesler, Kerry, Angels' save man's life at Asheboro Wal-Mart, www.courier-tribune.com.
41. Wal-Mart, www.walmart.com.
42. Showing the Value, www.wal-mart.com.
43. www.wal-martchina.com.

The Tasty Bite Story “Tasty Bite is a company that has virtually risen from the dead.”
- A & M, in October 2000.
THE TURNAROUND
In September 1998, stock market followers were surprised when the scrip of Tasty Bite Eatables Limited (TBEL), a small Ready-to-Serve (RTS)1 food company, reached Rs 36. This was a 930% increase over its 1996 price of Rs 3.50. What was even more surprising was the fact that till September 1998, TBEL was a Board for Industrial and Financial Reconstruction (BIFR)2 case.
Launched in the early 1990s, TBEL products were rejected by Indian consumers. Analysts said that the products had been launched ‘ahead of their time’ in the Indian markets. (TBEL products were made available in a pouch, which had to be boiled before serving.)3 Moreover, the fact that the products were priced very high added to their lackluster performance.
However, TBEL not only became the first Indian company to get itself de-registered from BIFR within a year, it also emerged as the largest brand in the US ethnic foods market. In 1999, the company posted its first ever profit of Rs 4.71 million. By the end of 2000, TBEL had become a $ 5 million brand in the US retail market and its products were available in 6,000 stores across the US.
THE BACKGROUND
TBEL was formed in 1986 by Ravi Ghai (Ghai) and Ravi Kiran Aggarwal. Ghai was
also the owner of the ice-cream brand Kwality, which was the market leader with a
market share of over 50%. TBEL set up a unit to process 10,000 tonnes per annum
(tpa) of frozen vegetables and 5000 tpa of RTS foods at Khutbao and Bhandgoan
villages of Maharashtra at a cost of Rs 55.5 million. In February 1987, TBEL brought
a public issue of Rs 7.5 million. The company commenced production in February
1989 and launched its first RTS products in 1990. Following a lukewarm response in
the Indian markets, in 1991, TBEL introduced its products in the Middle East, Russia,
and the US. The company did not fare well in these markets either. The lack of a
focussed marketing approach was considered to be the main reason for its failure.
In 1992, TBEL entered into a collaboration with the beverage company Pepsi. Pepsi was interested in collaborating with TBEL because government regulations required it to generate one dollar in export sales for every dollar it earned in India. Pepsi agreed to distribute TBEL’s RTS products abroad and help TBEL upgrade its facilities. In 1994, when the government abolished the export requirement norms for MNCs, Pepsi
1 The RTS food market can be categorized into ready-to-eat foods, mixes and powders, salted snacks and sweets.
2 The Board for Industrial and Financial Reconstruction (BIFR) is responsible for the revival of companies declared sick. A company is declared sick if it has incurred losses continuously for 3 years and its networth turns negative.
3 TBEL products were cooked and pasteurized in a multi-layer pouch, using high temperature and pressure for a short period of time. This technique, called Retort Pouch Packaging, protected the food from contamination and spoilage. As a result, there was no need to refrigerate the products.

26
Marketing Management - I
decided to walk out on TBEL, claiming that it would rather concentrate on its core business of soft drinks.
In 1995, ex-Pepsi executives Ashok Vasudevan (Vasudevan) and Kartik Kilachand
(Kilachand), who had been involved with TBEL earlier while they were in Pepsi,
decided to market TBEL’s products in the US. Their US based natural food marketing
and distribution company, Preferred Brands International (PBI), acquired the
exclusive marketing rights for TBEL’s products. In 1995, PBI launched five TBEL
products in Southern California, and later expanded the business to other parts of the
country also.
By the end of 1995, TBEL was in serious financial trouble due to excessive
borrowings. Poor response to its products and poor capacity utilization took a heavy
toll on the company’s financial health. In 1996, HLL acquired the Kwality ice-cream
brand and took over Grand Foods, the holding company of Kwality Frozen Foods.
Grand Foods happened to be the holding company of TBEL as well, so TBEL now
became an HLL company. However, TBEL continued to perform badly and by March
1997, the accumulated losses touched Rs 96 million. TBEL was declared a sick unit
and referred to BIFR.
Vasudevan, who had worked with HLL for about a decade before joining Pepsi,
convinced HLL’s management to get TBEL de-registered from BIFR by providing
financial assistance. While TBEL’s equity capital remained Rs 20 million, the HLL
group turned its Rs 120 million unsecured loans into preference capital at a premium
of Rs 19.50 per share. As a result, TBEL’s net worth turned positive and the company
was de-registered from BIFR. HLL began using TBEL’s idle capacity to process its
own products and also initiated efforts to make TBEL more market savvy to survive
in the competitive markets.
THE TURNAROUND STORY
In 1997, HLL decided against venturing into the frozen foods business. Consequently, it sold TBEL to PBI. PBI appointed Ravi Nigam (Nigam) of Britannia Industries as the President. The new management worked out a strategic initiative, which was named the ‘4C approach,’ for reviving the company and turning the business around (Refer Figure I).
The four Cs strategy divided the core business into areas that needed to be focused on: Concentration, Conversion, Collaboration and Cultivation. As part of “Concentration, TBEL decided to invest in intensive research for its RTS products. The company also planned to expand its business globally as well as in India. A decision to enhance the business through e-business was also taken. The second ‘C’ of the strategy - conversion - concerned entering into conversion contracts with the National Dairy Development Board (NDDB) and the Maharashtra Agricultural Development and Fertilizer Promotion Corporation (MAFCO) for utilizing TBEL’s individual quick freezing (IQF)4 facility at its plant.
The third ‘C’- collaboration – addressed the necessity of attaining optimum utilization of TBEL plant capacities through collaborations. TBEL’s 2,000-tonne cold storage facility for storing ice cream, pulp and vegetables was leased out to HLL and Tropicana (a juice brand from Pepsi). As a result of this, capacity utilization of the plant reached 90% in 1998-99. The fourth ‘C’ - cultivation – was reflected in the initiatives taken at Bhandgaon, Maharashtra, where the company’s 25-acre farm was situated. TBEL employed the local farmers and trained them in hi-tech methods of
4 A cold storage technology, freezes cooked or raw food products at certain temperatures for retaining the texture, nutrition and good taste.

27
The Tasty Bite Story
cultivation for producing high quality vegetables. This in-house sourcing of raw material enabled TBEL to maintain quality standards besides reducing its dependence on others.
The company’s expansion plans required a considerable amount of money. Payments
for placing a product in just one store of a chain in US ranged between $ 5000 and $
10,000. Even with a narrower base of natural food store chains, it was difficult for PBI
to pay $10,000 to each of the 200 stores it had shortlisted. To overcome this problem,
the company undertook a cluster analysis study5 in various US cities and generated a
demographic profile6 of the customers they needed to concentrate on. The company
found that its potential customer’s age group was between 25-54, with average
earnings of $ 75,000 a year. This helped the company narrow its focus and reduce its
list of stores from 200 to 80. This reduced the amount of payments to be made to
stores from $ 2 million to a more manageable $ 800,000. A smaller list of stores also
led to a more focussed distribution strategy.
Unlike other Indian food companies, PBI worked very hard to offer its customers products beyond pickles, spices and papads.7 The company thus decided to launch a wider range of products specifically targeted towards local US customers. After some
5 Cluster Analysis is an analytical statistical technique that arranges research data into mutually exclusive and collectively exhaustive groups (or clusters) where the contents of each cluster are similar to each other, but different to the other clusters in the analysis.
6 Demographic Profile is based on the age, gender, life-cycle stage and occupation of consumers.
7 An Indian side dish generally made of black gram flour.
TASTY BITE
Concentration Conversion Collaboration Cultivation
RTS New Products
US Expansion
New Global Markets
India
E business
Maximize Asset Utilization
Converting existing relation-ships into long-
term contracts.
Contract Farming
Global Demo Farm
Integrated
Grading Center
Partner with Key national and Global Players
Manufacturing
Figure I
Tasty Bite’s 4 ‘C’ Strategy
The 4 C Approach
Source: A&M, October 15, 2000.

28
Marketing Management - I
intensive research, it decided to launch the Tasty Bite range in the $5 billion natural food category8 through mainstream retail chains in the US.
PBI also began advertising through sweepstakes9 at the retail level and in-store
demonstrations, thus enhancing awareness and encouraging customers to experiment.
This also helped in lowering advertising costs significantly. The company also
focused on increasing the Americans’ understanding of Indian food. PBI realized that
the average American customer was not able to understand the products being offered
and their Hindi language names did not make sense to the customers. The company
thus decided to slash the product portfolio from 25 to 8 and retained only those
products that were familiar to the American consumer. Also, products were renamed
in English for instant identification and easy understanding. Thus, ‘Palak Paneer’
became ‘Kashmir Spinach,’ ‘Navratan Korma’ became ‘Jaipur Vegetables’ and ‘Alu
Chole’ became ‘Bombay Potatoes,’ and so on. The recipes were also modified to suit
the western palate. PBI also modified the packaging to suit customer requirements.
Earlier, products were sold in pack sizes that ranged from 200 gms to 1 Kg. This was
replaced with a standard size of 300 gms, as unlike mainstream food in the US, Indian
food was not consumed in large quantities. The smaller pack size motivated the
consumers to give the products a try. By August 2001, the pack size was changed to
285 gms (10 ounces) to bring it in line with American standards of measurement. This
also meant that a store shelf now accommodated nine packs as compared to the seven
earlier.
By 1998-99, TBEL began reaping the benefits of its turnaround efforts and recorded a
net profit of Rs 4.7 million. By the end of 2000, its products were available in 27 US
states through 33 leading natural food stores and mainstream supermarkets. By 2001,
TBEL’s profits increased nearly three fold to Rs 13.42 million (Refer Table I).
According to SPINS, an agency that tracked the market shares and consumer
preferences of natural food brands in the US, TBEL was the largest brand in the
category. Bombay Potatoes (Alu Chole) had become a common side dish for many
Americans. TBEL’s entry into Holland, Switzerland and UK was also showing
positive results
Table I
Growth of Revenues and Profits
YEAR REVENUES ( Rs Million)
PROFIT (LOSS) (Rs Million)
1996-97 23.6 (17)
1997-98 36.0 (2.6)
1998-99 54.7 4.7
1999-00 90.24 10.03
2000-01 131.07 13.42
Source: Business World, August 20, 2001.
8 The natural foods category consists of products that are minimally processed and are free from artificial ingredients, preservatives and other chemicals that do not occur naturally in food.
9 Sweepstakes includes any procedure in which a person is required to purchase something, pay something of value or make a donation as a condition of awarding a prize or receiving, using, competing for, or obtaining information about a prize.

29
The Tasty Bite Story
FUTURE PLANS
In September 2000, TBEL began working towards repeating its export market success in the domestic market. TBEL divided the Indian market into two broad segments: the domestic segment focusing on working women, and the institutional segment comprising fast food restaurants, hotel chains, airline flight kitchens and the Indian Army and Navy. Nigam said, “Although Tasty Bite is the No. 1 selling Indian food brand in the US, the task in India is daunting. The challenge, therefore, is to first establish the category and then associate it with the brand.”
TBEL was optimistic that its earlier dismal performance in the domestic market would not be repeated. A national study on the food and grocery sector GROFAST (Grocery and Food Advantage Study), conducted by KSA Technopak,10 showed that 73% of Indian consumers preferred to have traditional Indian meals in the RTS format rather than western food. This attitude was mainly attributed to the shift in the preferences of consumers and readiness of Indian consumers to experiment with food. A TBEL source remarked, “In India there is a paradigm shift among women. The Indian woman is no longer just a housewife, but is more the manager of the household. Also, the working woman is not guilty about eating outside food at home. Tasty Bite products, therefore, are designed to collaborate and not compete with the new Indian woman.” TBEL management felt that the Indian market had become mature enough to appreciate the convenience and value of RTS foods.
TBEL launched its products in Pune, Mumbai, Bangalore, Chennai and Hyderabad without much advertisement and promotion support. Encouraged by the good sales reports, TBEL decided to launch the products nationally by the end of 2001. The company also decided to spend 40% of its domestic revenues to launch a billion brand-building campaign during 2001-02. TBEL also started conducting research for launching RTS sweets and non-vegetarian food.
By 2001, HLL, Dabur Foods, MTR and Amul had also entered the Rs 10 billion Indian RTS food market. TBEL planned to increase its turnover to Rs 1 billion by 2003. The company seemed to be working hard to fulfil Kilachand’s vision of becoming ‘the most respected food company in India.’
Questions for Discussion:
1. Examine Pepsi’s and HLL’s involvement with TBEL. Do you think that their fleeting interest in TBEL was disadvantageous for the company? Give reasons to support your answer.
2. A renewed focus on customer service was one of the key components in TBEL’s turnaround. Prepare a detailed note outlining the major components of TBEL’s turnaround strategy and comment on their efficacy.
© ICFAI Center for Management Research. All rights reserved.
10 Kurt Salmon Associates (KSA Technopak) is a Management Consulting firm, offering integrated strategy, process and technology deployment solutions to the Retail, Fashion, Food & Grocery and Healthcare industries.

30
Marketing Management - I
Additional Readings and References: 1. Tasty Bite in Limelight, January 26, 1998, Business Standard.
2. Sule Surekha, Tasty Bite turns savory, January 30, 1998, Indian Express.
3. Gupta Shalini, Avoid the offer, September 21, 1998, Business Standard.
4. Fernando V S, Investors begin to taste the turnaround of Tasty Bite, October 2 1999, Express India.
5. Jordan Miriam, A Pune company turns hot favorite on dining tables in US, February 28, 2000, Financial Express.
6. Jordan Miriam, Tasty Bite Eatables spices up its marketing to serve top US ethnic brand, March 1, 2000, Expressindia.com
7. Joseph K Mini, Tasty Bite eyes Nasdaq listing via ADR float, June 28, 2000, Financial Express.
8. Pande Shamni, Retailing Mother’s Recipe, July 22, 2000, Business Today.
9. Tasty Bite targets Rs 100 crore turnover by 2003, September 1, 2000. Expressindia.com
10. Krishnan Aarti, Tasty Bite Eatables: Avoid/Hold fresh Exposures, December 31, 2000, Hindu Business Line
11. Kaul Pummy, Tasty Bite's sales, ad initiatives to go national, March 22, 2001, Financial Express.
12. Tasty Bite to sink teeth into regional specialties market, April 1, 2001, The Economic Times.
13. Tasty Bite tickles southern palate, July 4, 2001, Business Standard.
14. Kohli Vanita, A Taste of India, August 20, 2001, Business World.
15. www.aandm.com
16. www.dhan.com
17. www.indiainfoline.com
18. www.tastybite.com

Unilever in India: Building the Ice Cream Business
If you remain with the same strategy for a long time and it doesn't deliver, there is no risk in changing the strategy, as long as you are doing some sensible thing. This is a major shift from the last five/six years. What we used to do was change flavours in the Max range, as we were looking at the mass market. This year, we are trying to bring innovation in a different plane. In the past we were afraid of charging a price, now we are saying that the product is so good that people will see a value for their money. What we are trying to bring is more excitement around the category. We did a lot of packaging change, for a more harmonized look.
-J. H. Mehta, Executive Director (Ice Creams), HLL1
INTRODUCTION
In January 2000, in one of the profit center review meetings, the board of Hindustan Lever Ltd, Unilever’s Indian subsidiary, gave an ultimatum to the Ice Cream Executive Committee (ICEX) to break even by the end of 2001. It had been six years since the company had entered the ice cream business. During this period, despite its best efforts the division continued to be in the red.
Responding to the board’s directive, J.H. Mehta, Executive Director, Ice Creams with
his core ICEX team, embarked on a new business strategy to revive the loss making
ice-cream business. HLL sold ice creams in 40,000 outlets countrywide. But seven
cities -Mumbai, Delhi, Kolkata, Hyderabad, Bangalore, Chennai and Pune -
represented two-thirds of the organized 80 million litres ice cream market. HLL
decided to concentrate only on these seven cities for its ‘Kwality Wall’s’ brand. The
number of manufacturing units was cut down to six from 40 that were present in 1995.
HLL also decided to launch a range of new products backed by advertisements and
innovative promotional offers. The company decided to promote Kwality Wall’s as an
umbrella brand. The ice cream division made profits of Rs. 9.74 crores for the first
time during January – June 2003, compared to losses of Rs. 2.86 crores and Rs. 9
crores in the first six months of 2002 and 2001. But HLL realized there were
formidable challenges ahead in a fragmented market, where competition was
intensifying.
BACKGROUND NOTE
HLL’s origin went back to 1885 when the Lever Brothers set up “William Hesketh
Lever”, in England. In 1888, the company entered India by exporting ‘Sunlight’, its
laundry soap. In 1930, the company merged with ‘Margarine Unie’ (a Netherlands
based company which exported vanaspati to India), to form Unilever. In 1931,
Unilever set up its first Indian subsidiary, the Hindustan Vanaspati Manufacturing
Company for production of vanaspati. This was followed by the establishment of
Lever Brothers India Ltd. in 1933 and United Traders Ltd. in 1935, for distribution of
personal products. In November 1956, the three Indian subsidiaries merged to form
Hindustan Lever Ltd. (HLL).
1 “Kwality Wall’s hopes to make the ‘right connection’ now”, The Hindu Business Line, 3rd
April 2002.

32
Marketing Management - I
In 2003, HLL was India’s largest Fast Moving Consumer Goods (FMCG) company with a turnover of over Rs. 10,000 crores, an employee strength of 40,000 and more than 110 brands. It was well ahead of all the other players in the industry. HLL was a market leader in almost all the product categories in which it had a presence - soaps and detergents, hair care, skin care, household products, dental products and foods and beverages. HLL classified 30 of its brands as power brands. These were the best selling brands that contributed about 80% of the revenues. Examples were Surf, Fair & Lovely, Kissan, Pepsodent, Close-up, Sunsilk, Clinic, Lux, Lifebuoy, Wheel, Lakme, and Kwality Wall’s. All these brands had become household names.
HLL’s ice-cream business had evolved through a number of acquisitions of ice cream brands and strategic tie-ups with Indian groups. Unilever, HLL’s parent company had experienced a phenomenal success in its food business in Europe in the early 1990s. This prompted Unilever to expand its food portfolio worldwide. India was identified as a promising market. Unilever entered the food business through group company Brooke Bond Lipton India Ltd. (BBLIL)2, which had acquired Kissan from the UB group and Dollops ice cream from Cadbury India in the early 1990s. In the mid-1990s, BBLIL launched Unilever’s international Wall’s range of ice creams in India. BBLIL also entered into a strategic alliance with the Kwality Ice cream Group to sell ice creams under the Kwality Wall’s brand name. In 1995, BBLIL acquired the marketing and distribution rights of ‘Milkfood 100%’, a brand of ice creams from Jagatjit Industries. In January 1996, BBLIL merged with HLL. Eventually all the smaller brands were phased out and Kwality Wall’s emerged as the mother brand.
The Indian Ice Cream Market
In 2004, the Indian ice-cream market was valued at around Rs 1,000 crore of which the organised sector accounted for Rs 600 crore. When HLL entered the market in 1994, the segment was reserved for the small-scale industry. The market was dominated by a large number of small sized, local and regional manufacturers. Government regulations discouraged excessive capital investments in the sector. HLL classified its products as ‘frozen desserts’ (which used vegetable fat as opposed to milk fat used in ice creams), as these did not come under the purview of the reservation. After the Indian government liberalized the rules for the ice cream industry in 1997, the sector grew at a rate ranging from 15 to 20% per annum. In contrast, market growth in the 1980s and the early 1990s had been 2 – 3% per annum. With a low per capita consumption of ice cream at 200 ml, opportunities in India for ice-cream marketers were abundant.
In the late 1990s and early 2000s, with the liberalization of the Indian ice cream market, multinational companies with their premium ice cream brands entered the scene. The new players included Baskin Robbins from the US based Allied Domecq International, Haagen-Dazs (owned by the Pillsbury Company), the Iowa based Blue Bunny and the Swiss major Movenpick. However, the international premium brands could not make much success out of their ventures. Baskin Robbins, which operated in India through a joint venture with Maharashtra Dairy Products Manufacturing Company Pvt. Ltd., managed to capture a market share of just under 5% of the Rs 600-crore organized ice-cream market, growing at only 3% in volume terms and showing a negligible value growth. 30 Baskin Robbins outlets were closed down across the country. The $600-million Iowa-based Wells Dairy Inc-owned Blue Bunny ice-cream, which commenced operations in 2000 through distribution and marketing
2 Brooke Bond’s presence in India dated back to 1903, when Brooke Bond Red Label tea was introduced. Brooke Bond joined the Unilever fold in 1984 through an international acquisition. Lipton’s links with India dated back to 1898. Unilever acquired Lipton in 1972, and Lipton Tea (India) Ltd. was incorporated in 1977. Brooke Bond and Lipton India merged in July 1993 to form BBLIL.

33
Unilever in India: Building the Ice Cream Business
company Sno Shack Frozen Foods, withdrew from India in 2002. Nestle SA acquired Swiss ice-cream player Movenpick, in January 2003. Movenpick had parted ways with its local franchisee, Ravi Jaipuria, in mid-2002. Steep operating costs coupled with high prices, were the roadblocks which Movenpick faced in the Indian market.
Many reasons had been cited for the failure of global brands in India. With the high import duties on ice cream, most of these new brands targeted the premium ice cream segment, which accounted for only the top 3-4% of the population. Not only were these brands expensive, but many flavours were also not palette-friendly to Indians. Given that local ice-cream options were much cheaper and extensively distributed, global brands obviously did not generate the required volumes.3
Among the important regional players there were Ahmedabad based Vadilal Industries Ltd. (VIL), Mother Dairy and southern stalwart Hatsun Agro Products Ltd., which marketed Arun ice creams. VIL had three manufacturing bases – two in Gujarat and one in Uttar Pradesh (UP) and had a strong foothold in Gujarat, Rajasthan, UP and Madhya Pradesh through its Happinezz parlours. Vadilal's plans included setting up an additional five, franchisee-operated ice-cream parlours (branded Happinezz) by 2004, in Delhi alone.
Hatsun Agro was a strong contender in the south with an estimated 34% market share in the south and a 56% market share in Tamil Nadu alone. Hatsun had 1,100 exclusive ice-cream parlours, 60% of which were in Tamil Nadu. The company's cold storages existed in Chennai, Vijayawada, Anantapur, Bangalore and Salem. Hatsun Agro however did not have plans to go national with its Arun ice creams, owing to logistics difficulties.4 Another major contender was National Dairy Development Board's (NDDB) Mother Dairy, which had a major presence in Delhi. NDDB was engaged in a battle with the erstwhile associate Gujarat Co-operative Milk Marketing Federation (GCMMF)5. NDDB was in expansion mode on the product front for Mother Dairy ice creams and had undertaken a large-scale exercise to revamp its ice-cream distribution through pushcarts.
But the main battle in the ice cream market was between Kwality Wall’s and Amul, owned by GCMMF. GCMMF had startled the industry by claiming that it had become the country's leading ice-cream seller in both value and volume terms. HLL disputed this by quoting A.C. Nielsen data, which reported Kwality Wall's overall market share at 38.3% in 2002, against Amul's 16.7%. In individual cities, HLL’s share was 36.9% in Mumbai (against 35% for Amul), 36.3% in Delhi (Amul at 9.7%), 30.5% in Bangalore (15.2%) and 54.1% in Hyderabad (13.2%). GCMMF however, contested the data on the grounds that it was limited to seven cities. Besides, ice cream was sold through exclusive Deep Freezer Outlets (DFOs). A retailer who sold one brand, say, Kwality Wall's, would not stock rival brands. Prasanna Shah, head of GCMMF's ice-cream division, explained,
"Market surveys are based on sales reported by the same sample of outlets year after year. A.C. Nielsen's panel has not been updated for the last four years and during this period we have been adding around 10,000 DFOs annually, the sales from which are not captured in the survey data. Further,
3 Ratna Bhushan, “Ice cream MNCs’ plans melt in India”, www.blonnet.com, 8th October 2002. 4 Hatsun Agro’s ice cream plant was located at Chennai. 5 National Dairy Development Board (NDDB), was set up in 1965 and declared an institution of
national importance by an Act of Parliament in 1987 for replicating the Amul success across the country. GCMMF’s tussle with NDDB was over ownership of the Mother Dairy trademark. This move questioned the raison d’etre of NDDB’s thrust into the realm of marketing, as it was under the Mother Dairy brand that it had routed various businesses and achieved volumes close to Rs 1,000 crore. GCMMF had applied for the ownership of the Mother Dairy brand on August 1, 2000 with the Registrar of Trade Marks, Government of India. Against this, the NDDB application made for the same was put up on August 14, 2000.

34
Marketing Management - I
during this period, HLL has withdrawn its ice-cream from virtually every market, barring six cities from where A.C. Nielsen's sample is drawn."6
HLL’S STRATEGY
In 1994, HLL had launched its ice creams on the back of a string of acquisitions and strategic alliances. By 1995, HLL had captured more than 50% of the organized Indian ice cream market. In the early 2000s, the consumption of ice creams per head in India was still very low at 250 ml compared with 300, 700 and 1,200 ml in Pakistan, Sri Lanka and China respectively.7 HLL desired not just to increase its market share but to grow the entire segment. It wished to entice traditional consumers of products like sweets into the ice-cream eating habit through new flavours catering to ethnic tastes. HLL’s ice cream portfolio included Cornetto, targeted at young adults and older people, Feast for teenagers, Sundaes for the entire family and Max, targeted at children.
Product Range
Feast
The Feast range of ice creams and frozen desserts, launched in 1995, was positioned as a 'youth ice cream brand with an attitude'. Over the years, Feast expanded its 'chocolate only' portfolio by including refreshment products like Mango Zap, Calypso Punch and Jaljeera Blast. In 2001, Kwality Wall’s launched the Feast Snacko priced at Rs. 15. It was a three-layered chocolate product available in the stick format.
Cornetto
Launched in 1996, with the tag line ‘Bite bite main pyar’, Cornetto targeted young adults and was positioned as the product for romantic and special moments (Exhibit: II). In 2002, to the range of Chocolate, Butterscotch and Strawberry Cornettos, HLL added the Super Cornetto range, which came in two combinations - Jamaican Magic and Hawaiian Bliss. Jamaican Magic was a combination of Rum & Raisin and Coffee, with a core of chocolate sauce cone topped with nuts. Hawaiian Bliss was a combination of the black currant and strawberry flavours with a strawberry sauce cone and a cherry topping. Both the Super Cornettos, which were substantially larger than the ordinary Cornetto, were priced at Rs 30.
Max
Targeted solely at children, Max was launched in the year 1999 as the 'masti' ice cream. Max’s punch line said, 'Masti kar Befikar' and encouraged all kids to go ahead and have lots of fun (Exhibit: III). All Max products were fortified with extra vitamins. Max Cups and Max 123 had Vitamin A while Max Orange and Max Joos had real fruit juices and Vitamin C. HLL claimed that a single Max Orange candy offered a child 15% of his daily requirement of Vitamin C.
In 1999, HLL launched Max Uno, the one rupee ice candy. The product was the result of a market survey, which revealed children’s preferences for locally manufactured ice candy, popularly known, as ‘pepcees’. But pepcees were manufactured under unhygienic conditions and caused health problems. With two variants of orange and cola, Max Uno at one rupee was affordable even to children from the lowest income groups. In 2001, Max was extended as confectioneries (candies) with MaxMasti (a plain fruit candy at 25 paise), MaxMagik (a single candy with two flavours, one inside and one outside at 50 paise) and ChocoMax (a milky chocolate candy at 50 paise). In
6 Ratna Bhushan, “Ice cream: Hot battles”, The Catalyst –Hindu Business Line, 17th April 2003. 7 “A Premium Scoop”, Business Standard, 22nd April 2002.

35
Unilever in India: Building the Ice Cream Business
2002, HLL added Maxcream and ToffyMax to its range of Max confectionaries, priced at 50 paise.
Sundaes
Kwality Wall’s Sundaes were launched in 2001 in India in Chocolate, Strawberry and Mango flavours. Later, HLL added a Black Currant8 sauce and Black Currant Dry Fruit pieces. Kwality Wall’s positioned Sundaes as an offering, which helped bring families together for fun and enjoyment, in an age when families hardly found time to spend together. It was called the 10 p.m ice cream to symbolize the coming together of family members to have ice cream at night after dinner (Exhibit: I).
Softies
HLL had been a pioneer in tapping the softy cone segment (soft ice-cream dispensed into a cone from a machine), whose size was estimated at Rs. 30 - 40 crore. After six months of test marketing in Chennai, HLL announced the launch of Softy kiosks for selling softy ice creams in 2000. Investment in each outlet, including the vending machine, worked out to Rs 7 lakh. The product was priced at Rs 5 per cone. When Kwality Wall’s launched its softy cones in Chennai for Rs 5, players like the Bangalore-based MTR foods and fast food chains like McDonalds were already operating in the market. Also, there were other local parlours selling softy cones. In 2003, the softy ice creams business accounted for less than 5% of HLL’s ice cream segment revenues.
The distribution set-up for softies was different from that of other ice cream products, which were distributed in groceries and other retail outlets. HLL pursued a different business model. The company provided the equipment, training, advertising and quality standards while the franchisee provided the place and manpower. A tamper-proof wet mix system ensured there was no human contact with the ice cream right from the factory till the consumer got the product. For pre-set ice cream varieties such as cones, cups and bricks, the cold chain had to be maintained and the products had to be transported by refrigerated trucks to the outlets. The ready mix on the other hand, could be distributed to the softy parlours with no cold chain involvement. HLL rolled out the product in the South and West of India and planned to have around 45-50 softy kiosks in each city. 9
However, HLL could not expand its distribution as rapidly as planned because the softy business was capital intensive. Initially, in 2000, when HLL had ventured into the business, a retailer had to invest Rs. 3 lakhs if he were to buy a softy machine or pay a deposit of Rs 1 lakh to lease one. HLL sold its softy mix at upwards of Rs 70, against the Rs. 62 per litre mix that other parlours got from local ice cream players. Also, the local players sold 20 cones with one litre of the cheaper mix, whereas HLL’s one-litre mix gave only 16 fillings. HLL sources explained this was due to the higher air-content in local softies. According to analysts, the break-even point for HLL’s softy ice-cream vendors was 250 cones per day. For an unorganized player who owned a machine costing Rs 1.5 lakh and used a cheaper mix, the break-even point was only 125.
HLL reacted by introducing a softy machine worth Rs 1.5 lakh and products at various price points. For instance, while a plain softy sold at Rs 7, a softy with a sauce topping sold for Rs 12 and an addition of nuts made the price Rs 17. In its quest for value
8 Black currants rich in vitamin C and minerals were grown in Europe, USA and Chile. They were used to make jellies, jams, drinks and sauces the world over. There was an interesting history to sundaes. In the 1980s, when this dish was first put together in the US, it was against the law to sell soda and consequently, ice-cream sodas on Sundays. So the trend of serving ice cream with sauces and toppings instead of soda began. Soon, ice-cream sundaes became so popular that people opted for this dessert on weekdays as well. Source: www.hll.com
9 “Kwality Wall’s steps into softy segment”, The Hindu Business Line, 21st September 2000.

36
Marketing Management - I
creation, Kwality Wall’s undertook a rejig in its product size and price points. For instance, a 100-ml cup of Max Vanilla ice cream was redesigned to 90 ml in 2001 and offered at Rs. 11. Earlier, a one-litre pack of plain vanilla cost Rs. 69. This was relaunched in 2002 as Vanilla Gold in a 750 ml pack at Rs. 65 essentially to attract the take-away segment. To induce consumer sampling and encourage feedback, HLL launched a 'dare to compare' initiative in six major cities of India. HLL blind-folded consumers and encouraged them to sample its newly launched Vanilla Gold against the next biggest competitor in the city and then rate the same. Consumer ratings indicated that Vanilla Gold was superior compared to the competing brand in terms of its taste. More than 87% of sampled customers rated it as the most preferred Vanilla.
HLL vs. Amul
In the late 1990s, GCMMF launched its value-for-money Amul ice creams. These included products like the Tricone to attack Kwality Wall’s Cornetto and the Frostik to compete with Feast — both priced nearly 25% lower. In 2000, Amul launched a full-scale attack on HLL with a new sub-brand Fundoo, in two candy flavours at Re 1 each, pitching it directly against Max Uno. While Max Uno was priced at Re 1 for 15 ml, Fundoo was pegged at Re 1 for 45 ml. Under the Fundoo range, Amul also launched ice creams at higher price-points, in four variants of vanilla (Rs 10), strawberry (Rs 12), Sundae (Rs 15) and mango (Rs 14). HLL retaliated by launching a range of Max extensions in 2000, in the price range of Re.1 to Rs. 16 - Max Joos (fruit juice with vitamin C), Max Vitameter, Biki Max (ice-cream sandwiched between two glucose biscuits) and Max Rose (with rose milk in it). The company also launched Max 123, an ice cream with three flavours - strawberry, vanilla and chocolate.10
While Amul focused on price, HLL maintained its premium positioning, emphasizing the hygienic and wholesome food value of its ice creams. Amul offered price-cuts for its existing sub-brands. It ran a scheme on its premier sub-brand ‘Tricone’, (which was pitched against Kwality Wall’s Cornetto priced at Rs. 30), by offering a price cut of Rs 5 on its normal price of Rs 15. It also offered Rs 3 off Rs. 15 on Frostik, placed against Kwality Wall's Feast, which sold for Rs 19. Similarly, in a bid to promote its five-litre bulk pack for parties, caterers and institutional buyers, GCMMF launched a campaign that said ‘Rs 4.30 only for a scoop of 100 ml’, to emphasize the price advantage. GCMMF entered the softy business in 2001 and launched its softies under the sub brand ‘Snowcap’ at Rs.5. GCMMF distributed its softies by leveraging the distribution network set up for its pizzas.11 Of the 300 outlets selling pizzas, 100 were converted into softy outlets.
According to the ‘Ice-cream Mood’ survey conducted by FCB Ulka in 2002, Amul was perceived as being superior on creaminess, taste and price, while Kwality Wall’s scored higher on its variety and range. Another finding was that Kwality Wall’s had a more contemporary image than Amul and was preferred by youngsters — especially Cornetto and Feast — while Amul was more attractively priced and appealed to families. 12
In 2002, Amul started using the added attraction of health with its Slim Scoop and
marketed it as a ‘fat-free ice cream’. It was available in vanilla and mango flavours.
The company had plans to introduce banana and pineapple flavours also. Slim Scoop
contained less than 0.5% fat and conformed to Prevention of Food Adulteration
norms. The 500-ml vanilla Slim Scoop pack cost Rs. 40, while the mango variant was
10 “Cold War”, www.agencyfaqs.com, 30th May 2000. 11 GCMMF, made a foray in fast food business in 2001 by launching its pizzas to increase Amul
cheese consumption. 12 Purvita Chatterjee, “ Amul ice creams to focus on take-away home segment”,
www.blonnet.com, 4th May 2002.

37
Unilever in India: Building the Ice Cream Business
priced at Rs 55.13 In 2003, HLL planned to introduce a low-fat ice cream. With Amul
having made a foray already, HLL geared up to enter the market by the summer of
2004. Meanwhile, Amul focused on its distribution system to ensure greater
availability of ice cream at pushcarts and small outlets. The company felt that
availability was the most important factor in ice cream sales. So Amul ice creams
were sold in nooks and corners in STD booths, local kirana shops, drug stores and
bakeries.
HLL had a clear edge over Amul with its cold chain, a critical success factor in the
business. By the late 1990s, the company had increased its reach to 35,000 retail
cabinets across the country while Amul had a total of 10,000 cabinets. One reason for
HLL’s expanded reach was the relatively low deposit that HLL charged its retailers
for refrigerated cabinets. While it was possible to install an HLL refrigerated cabinet
for a deposit of Rs 5,000 only, Amul charged anything between Rs. 10,000 and Rs.
20,000.14 When Amul was expanding its retail presence, HLL took the challenge
ahead by launching ice cream vending through carts (or “trikes”). In 1999, HLL tied
up with Voltas for retail cold-chain components. These specialized freezing systems,
which were used in HLL’s cycle vending ice cream cabinets, ensured frozen
conditions of -25 Celsius for over ten hours. This move enabled HLL to increase the
reach of its frozen desserts to over 900 towns by the end of 2001. HLL had 6,000 to
7,000 trikes across the country. The company estimated about a quarter of the
company’s sales came from cycle vendors.
New Marketing Initiatives
In the early 2000s, HLL launched a number of marketing initiatives in the light of increasing competition. The initiatives were implemented in four phases. In the first phase called the ‘Innovation’ phase, HLL introduced the Indian impulse consumer to a range of products like the Feast bar and Softies, while the Viennetta, Vanilla Gold and Black Currant Sundaes targeted the take-home segment. In mature ice-cream markets, the take-home segment accounted for more than 70% of all ice-cream consumption. In India, the take-home segment contributed to a mere 20% of the market. Even in the most affluent cities, ice cream eating at home was confined to special occasions (perhaps only when guests visited or for a party) and was by and large restricted to the three regular flavours — Vanilla, Chocolate and Butterscotch. Thus the market was limited to regular flavours and ice-cream consumption was restricted to an occasional experience. 15
In 2002, HLL decided to expand the take home segment, introducing the ‘Home Delivery Concept’ in Delhi, Chennai, Mumbai and Hyderabad. HLL entered into a strategic tie-up with Pizza Corner to use its call centres and delivery network to distribute its products. Pizza Corner had 29 retail outlets in six cities. While the strategic tie-up with HLL helped Pizza Corner increase its customer base, HLL was able to introduce an organized delivery system for its ice-cream product. HLL also explored the possibility of setting up exclusive ice-cream parlours across the country. The company's ice-cream division already had two such parlours up and running in Bangalore.
In the second ‘Communication’ phase, Kwality Wall’s was relaunched with the catch line ‘Ho jaaya dil ka connection’, to capture the fun proposition of bonding with
13 Robin Abreu, “Fight on for crème de la ice cream market”, www.domain-b.com, 13th May 2002.
14 Lalitha Srinivasan and Chandan Dubey, “Walls versus Amul: Storm in the vanilla cup”, www.financialexpress.com, 17th May 1999.
15 Purvita Chatterjee, “ Amul ice creams to focus on take-away home segment”, www.blonnet.com, 4th May 2002.

38
Marketing Management - I
family and friends, while being relevant to all target audiences right from children, teenagers, adults to families. Kwality Wall’s also introduced the international heart logo, as a symbol of warmth, togetherness and happiness, to maintain a common identity across the globe (Figure (i)).
Figure I
Kwality Wall’s International Heart Logo
Source: www.hll.com
The third initiative called ‘Activation and Visibility’ featured various innovative promotional campaigns to increase the brand’s visibility. In 2001, HLL decided to swing 20% of its total advertising budget in favour of events and other promotional activities to address a focused audience and at the same time create excitement. To leverage Cornetto’s association with romance, HLL announced a special contest during Valentine’s Day of 2001. The contest called 'Cornetto Khao Jodi Banao' invited participation from couples across the country. In order to participate, the couple had to buy two Cornetto ice creams, affix the lids on the contest form along with their pictures and send them by post. The form had the prize-winning slogan to be completed by the couple at the time of participation. The contest continued till the end of February and the winners were chosen by the end of March, by a panel of judges comprising celebrities and leading designers. The first prize was a pair of Compaq Personal Computers, the second prize was a pair of mobile phones for two couples, the third prize was a Fast Track Watch from Titan for 10 couples and the fourth prize was a Levi's pair of jeans for 100 couples. Consolation prizes were given for another 1000 couples.
In May 2001, Kwality Wall’s launched a special promotional campaign for its Feast range. The ‘What’s on your stick?’ offer required consumers to buy any of the Feast range of products and look for a special print on their sticks. If the print on the stick depicted a picture of a wave, the lucky consumer won the first prize, which was a free trip to Mauritius. If the stick had the picture of a motorbike, the consumer was entitled to the second prize, a TVS motorbike. If the print portrayed a camera, the customer was entitled to the third prize, a Canon camera. The picture of an ice candy stick won the consumer, the consolation prize of a Feast Jaljeera Blast (actual jaljeera drink, in the form of an ice candy).
In 2002, HLL launched an innovative, aggressive and the first of its kind promotional campaign called ‘Ek Din Ka Raja’ (EDKR). Unlike the previous product specific campaigns, EDKR covered the entire range of ice creams. Running from March 2002 to May 2002, EDKR was the biggest ever promotional campaign for Kwality Wall’s. The contest was awarded the 'Best Promotion Campaign in India' award at the Promotion Marketing Awards of Asia (PMAA) in Singapore. The promotion also won two more awards in Asia - a Silver for the ‘Best Idea or Concept’ and a Bronze for the ‘Best use of Direct Marketing’ out of 97 short listed entries from Singapore, India,

39
Unilever in India: Building the Ice Cream Business
Philippines, China, Japan, Taiwan, Thailand and Korea.16 The total number of redemptions was close to a million, with each consumer spending a minimum of Rs. 100 to Rs. 125 per redemption.
The EDKR contest entitled up to 10 lucky consumers to spend Rs 10 lakhs in a day's shopping with their family in Mumbai. They could opt to spend on consumer goods like cars, home appliances and furnishings but all within 24 hours. Every ice cream pack had a certain number of points. Consumers had to collect wrappers / lids till they reached 150 points to be eligible to participate in the Ek Din Ka Raja promotion. After accumulating sufficient points, when they got them redeemed at redemption centers set up for the purpose, they received a scratch card. There were assured prizes for all those who got a scratch card, ranging from microwave ovens, walkmans, and watches to video games and fun books. The bumper prize entitled ten consumers to shop for Rs. 10 lakhs in a day. The bumper prize winning consumer was flown in to Mumbai along with his family (up to four members), was provided a chauffeur driven car and a day of shopping at BPL, Hyundai, Tanishq, Westside and Wipro.
In 2002, Kwality Wall's launched the ‘Fridge mein Kwality Wall's hai kya’ promotion. Customers who stocked Kwality Wall's products in their homes were rewarded. This promotion was launched on the 15th of September and ran till the 31st of October in Delhi, Mumbai and Bangalore. The promotion was spearheaded by 23 "Cool-Men" in special Kwality Wall's vans. These Cool-Men visited households at random across the three cities. Those households that had Kwality Wall’s take-home products stocked in their refrigerators were eligible for scratch cards and prizes. Prizes included free trips to Australia, holiday packages to Goa, Ooty, Kodaikanal and Yercaud, gifts from Whirlpool Appliances, offers from Pizza Corner, games from Funskool and desserts from Kwality Wall's.17
In March 2003, Kwality Wall’s relaunched its kids' portfolio of ice creams with four new products, a new-look Max the Lion, and a summer promotion in association with Cartoon Network18. The new additions were Mango Tango, Rainbow, Twister and Super Twister, priced between Rs 7 and Rs 15, in addition to the Orange, Choberry and 123 flavours. The animated lion character, Max, was reinvented as a grown-up lion and given a new name, ‘Max, the Lion King’.
The promotion, `Bano Toonstar with Scooby-Doo and Max', ran till the end of May. Children had to collect three Max wrappers with the `Bano Toonstar' logo, and get them redeemed at `Max Jungle' centres for scratch cards. HLL set up 1000 such redemption centers. The number on the scratch card entitled them to prizes like comics, board games, cameras and tents, while the grand prize of the promotion blitz was the opportunity to become a Toonstar, in special mini animation series produced by Cartoon Network. The `Bano Toonstar' promotion was taken forward through a mix of TV, print, radio, on-ground and in-store promotions, and school contact programmes. There were 4000 spots across major TV channels with the catch line – ‘It could be you, solving adventures with Scooby Doo’.
In August 2003, HLL launched a new range of limited edition ice creams centering on the festive season of Dusshera and Diwali. In its kids’ range, Max, HLL introduced ‘Max Rocket’ (in strawberry & chocolate flavours) and ‘Max Chakri’ (in black currant & strawberry flavours), named after popular Indian crackers that kids identified the festive season with. In the Cornetto range, HLL launched Black Currant and Honey Fudge and the all-time favourite Indian flavour, Pista Kulfi, on a stick,
16 “HLL’s Ek Din Ka Raja promo gets kudos from PMAA”, www.indiantelevision.com, 7th
August 2002. 17 “Kwality Wall’s announces winner of new promo”, www.indiantelevision.com, 2nd October
2002.18“HLL relaunches kids ice cream portfolio-Ties up with Cartoon Network for promos”,
www.blonnet.com, 21st March 2003.

40
Marketing Management - I
priced at Rs. 10. The Sundae combinations included Kool Khubani (with apricot sauce and pista flavour), Kamaal Karamel (caramel with butterscotch flavour) and a chocolate offering Choco Dryfruit Dhamaka (with chocolate sauce and a mixture of dry fruits).
The new limited edition range was backed by yet another promotional offer - The Teen Vardaan Contest. Ten lucky families got the opportunity to fulfill up to three wishes each, amounting to Rs. 10 Lakhs. The promotion which built on the success of the previous promotional campaign, Ek Din Ka Raja, required consumers to collect 50 points by purchasing Kwality Wall’s ice creams. Once the 50 points were collected, consumers were entitled to a scratch card from a Vardaan Centre. Call Centres were established to direct consumers to the nearest Vardaan Centre. On the scratch card, the consumer could win assured prizes and higher-level gifts and collect them from the Vardaan centre or the call centre. Apart from the grand prize, i.e. the granting of three wishes, the assured and higher level prizes included DVD players, walkmans, video games, Batman sets, pushback cars, jigsaw puzzles, trump cards and crystal bowls.
LOOKING AHEAD
HLL believed sustainable competitive advantage would come from differentiation, not from price. The company believed that the only way to grow the ice cream market was to make the product exciting. After increasing penetration in the market with low-priced products, HLL shifted focus to the high end of the market. As a step in that direction, low priced products in the Kwality Walls portfolio such as Max Funjoos priced at Rs 2, were withdrawn and the lowest price point in the Kwality Walls range was made Rs 5.
In 2003, HLL withdrew from the institutional sales segment of the ice-cream business as part of its strategy to focus on the premium segment, which fetched greater margins and profits. While HLL continued selling its plain flavours, its advertising and marketing efforts were more focused on new launches from its international range like the Viennetta. The visual ads for the various products like Super Cornetto or the Black Currant sundaes began emphasizing a softer, creamier and natural feel to the ice cream. For instance, HLL added a sauce inside the Cornetto to give it a softer taste.
In April 2004, HLL reduced prices across some of its ice creams, particularly in the premium-end. The price for the premium Viennetta ice cream was slashed from Rs 125 to Rs 99. Meanwhile, in a bid to drive sales of its ice creams, the company planned to launch an aggressive campaign using print, outdoor as well as electronic media. Titled Dil ka dhol bajao, the campaign sought to convey to the consumer that any reason was good enough to celebrate with a Kwality Wall's ice cream.
While Amul had more volume share, Kwality Wall’s had greater value share. For its ice cream and milk business, Amul had begun investing in increasing its milk capacity. It had firmed up plans to invest Rs 100-120 crore to expand this from 1.1 million litres a day to 1.8 million litres a day at its Gandhinagar factory. The cooperative was also planning to expand its production facilities beyond Gujarat to serve other markets in India. In 2003, GCMMF bought an ice-cream manufacturing unit in Nagpur. Amul expected to generate sales of 34 million litres during 2004 laying emphasis on offering 'value for money' products. For HLL, the challenge was to maintain profitability, while keeping Amul at bay. To push Kwality Wall’s, HLL decided to focus on select outlets, innovative and exciting promotional schemes, new look vending trikes (cycle vendors), enhanced outlet level visibility and innovative signage. Globally, the company had over 200 options to choose from. To sustain the excitement, HLL had plans to launch products from Unilever’s international range at regular intervals, modified to suit Indian tastes.
© ICFAI Knowledge Center. All rights reserved.

41
Unilever in India: Building the Ice Cream Business
Exhibit I
TVC for Kwality Wall’s Sundae
A woman casts an eye around the
house and sees the family members
looking impatiently at the clock.
She then retires to the kitchen
and extracts delicious cups of ice
cream from the refrigerator.
As the clock chimes 10, the
teenage daughter waltzes into
the dining room.
The rest of the family is already
gathered there armed with their
cups and spoons.
The woman enters with the ice creams
laid on a tray. MVO: "Exotic black
currant sauce and creamy vanilla...
...make the new Kwality Wall's
Sundae simply irresistible." Super:
'Ho jaaye dil ka connection.'
Source: www.agencyfaqs.com

42
Marketing Management - I
Exhibit II
TVC for Kwality Wall's Super Cornetto
A boy says good-bye to his girl as she
boards a train. He looks around
uncertainly and spots...
...a stall selling Kwality Wall's Super
Cornetto. He snaps into action and leaps
across...
...the platform to the stall. But before
he can buy a cone, the train slowly
chugs out.
The boy grabs an unopened cone from a
man nearby and rushes up to the girl's
compartment.
But the jostling crowd does not let him
reach her and the train gathers speed.
Just then a helpful passenger offers to
pass it on to her.

43
Unilever in India: Building the Ice Cream Business
The boy lunges forward and thrusts it
into his hands. It goes to a nun who
passes it on reluctantly, her face a
plump disappointed mask.
The cone exchanges hands and finally
gets closer to its goal. The boy
meanwhile, runs alongside to make sure
his girl gets his token of love.
MVO: "New Kwality Wall's Super
Cornetto. Two exotic flavours with
sauce and nuts in a crispy cone." By
now the cone reaches where it should.
The girl digs her teeth into it, relishing the
taste. She smacks the cone as the boy
gives a whoop of joy. Super: 'Ho jaaye dil
ka connection.'
Source: www.agencyfaqs.com

44
Marketing Management - I
Exhibit III
TVC for Kwality Wall's Max
A kid spots a man at a fair trying to flex his muscles at the hammer corner.
But his efforts are not very rewarding. The kid takes a huge bite out of his Max ice cream...
...and gets ready to show his strength. Picking up the hammer, he smashes the ball to the top.
MVO: "Naya Doodh badam Max. Damdaar Max. Max from Kwality Wall's. Masti kar. Befikar."
Source: www.agencyfaqs.com

45
Unilever in India: Building the Ice Cream Business
Bibliography
1. Ratna Bhushan, “Ice cream, hot battles”, The Hindu Business Line Catalyst, 16th April 2004.
2. Harish Damodaran and Ratna Bhushan, “Amul utterly keen on creaming Hind Lever”, TheHindu Business Line, 5th April 2002.
3. “Kwality Wall’s brings you the ultimate temptation”, Company Press Release, 10th April 2003.
4. Janaki Murali, “Kwality Wall’s hopes to make the right connection now”, www.blonnet.com, 3rd April 2002.
5. “Kwality Wall’s hopes to make the right connection now”, The Hindu Business Line, 3rd
April 2002.
6. Ratna Bhushan, “Ice cream MNCs plans melt in India”, www.blonnet.com, 8th October 2002.
7. “A Premium Scoop”, Business Standard, 22nd April 2002.
8. “Kwality Wall’s steps into the softy segment”, The Hindu Business Line, 21t September 2000.
9. Purvita Chatterjee, “Amul ice creams to focus on take-away home segment”, www.blonnet.com, 4th May 2002.
10. Robin Abreu, “Fight on for crème de la ice cream market”, www.domain-b.com, 13th May 2002.
11. Lalitha Srinivasan and Chandan Dubey, “Walls versus amul: Storm in the vanilla cup”, www.financialexpress.com, 17th May 1999.
12. “HLL’s Ek Din Ka Raja promo gets kudos from PMAA”, www.indiantelevision.com, 7th
August 2002.
13. “HLL relaunches kids ice cream portfolio – Ties up with Cartoon Network for promos”, www.blonnet.com, 21st March 2003.
14. www.hll.com

Allen Solly – Entering the Indian Women’s Western Wear Market
“Women have too many different kinds of clothing. They want exclusive outfits and would not buy mass produced garments. They just want the look and do not care about the label. It is too risky. It is a headache. It just would not work.”
- Excerpt from a news article on www.BharatTextile.com, January 11, 2002.
“We feel there is a definite potential to expand the market by offering a range of western women’s wear, properly styled and cut according to body types, under the Allen Solly brand name. That will complete the whole lifestyle package – we will have both Allen Solly Men’s and Women’s wear, and have a strong retail line-up for both.”
- Vikram Rao, Director, Indian Rayon, in October 2002.
WOOING INDIAN WOMEN
In September 2002, leading Indian apparel company, Madura Garments (Madura,
Refer Exhibit I for a brief profile of the company) launched a line of readymade
women’s western wear under the brand name ‘Allen Solly Women’s Wear.’ The
launch was backed by advertisements in the national print and outdoor media. The
move attracted attention for two reasons. First, this was the first-ever nationwide
exercise by any company to offer readymade Western wear for women in India on this
large a scale. Second, Madura seemed to have taken a risk by trying to extend its
hitherto ‘exclusively for men’ brand, Allen Solly, to the women’s segment.
The nationwide launch was undertaken following the brand’s impressive performance
during the test-marketing phase in the city of Bangalore (Karnataka) in December
2001. Through Allen Solly Women’s Wear, Madura formally extended the concept of
Friday Dressing1 to women all over the country. The scope of operations and
marketing support was what set Allen Solly apart from the earlier entrants in the
branded women’s wear segment, Indus League2 and Raymond’s.3
Indus League had launched women’s wear under the ‘Scullers’ range, while
Raymond’s had entered the segment with its designer range ‘Be.’ By late-2002, many
other brands, such as Benetton, Mango, Wills Sports and Blackberrys, had either
launched (or were planning to launch) exclusive women’s wear in the country.
This rush to enter the segment was not difficult to understand, considering the fact that the market was almost completely in the hands of the unorganized sector and had very few branded players. Most of the national level branded players were present only in the men’s wear segment. In 2001, the women’s wear industry was estimated to be around Rs 161 billion4 with a growth rate of 9%, of which the women’s western wear
1 A concept that originated in the US, Friday Dressing refers to the trend of allowing employees to dress in casuals instead of formal wear on Fridays.
2 A Bangalore-based company set up with venture funding from Draper International, USA, Dalmia Cements, India and ICICI Ventures, India. Formed by the former employees of Madura Garments, it owned popular brands such as Indigo Nation, Scullers and Ironwood.
3 Raymond’s is a leading textile company in India that produces and markets a wide range of pure wool and wool-blended fabric, blankets, shawls and apparel accessories. Major Raymond textile and apparel brands include The Lineage Collection, Teral, Park Avenues, Parx and Manzoni.
4 In December 2002, Rs 48 equalled 1 US $.

47
Allen Solly – Entering the Indian Women’s…
market was estimated to be growing at 15-20% per annum, according to a study conducted by KSA-Technopak.5
Some analysts felt that these figures did not justify the pace with which companies were entering the market. And, more importantly, many analysts felt that the business did not hold too much promise, because Indian women would not be comfortable giving up their traditional attire. Around 95% of working women in India wore salwar suits (Refer Exhibit II) to work, and perhaps not many of them would be willing to shift to Western corporate wear.
Madura, however, justified its move, citing studies, which revealed that though Indian women liked to experiment with Western wear, they did not have access to styles that suited them. The company was confident that it would be able to make a success of the venture despite the increasing number of players and the threat of much cheaper unorganized sector products.
BACKGROUND NOTE
The Indian apparel industry was dominated by the unorganized sector, with market share of over 97%. The industry was divided into two segments, ready-to-wear and tailormade. The industry was also divided on demographic (men, women and kids) and geographic (each state having its own dressing style) parameters. Over the decades, the developments in men’s and women’s wear segments showed markedly different trends. While traditionally Indian men preferred to get their clothes stitched by their trusted tailors, by the early-1990s, ready-to-wear clothes had become extremely popular. However, most Indian women traditionally wore sarees and other ethnic wear (Refer Exhibit II).
Though Western wear entered the country through Hindi movies in the 1950s itself, it
remained limited only to teenage girls even by the early 1980s. This was so because
after marriage Indian women were generally expected to wear sarees. Though the
saree segment was also almost entirely in the hands of small, localized players, there
were a few national brands as well. Garden (from the house of Bombay Dyeing) was
one of the first popular brands. Over the years, many other brands such as Vimal,
Kunwar Ajay, Roop Milan and Parag emerged. Saree prices ranged from as low as Rs
50 to as high as a few million rupees.
As society became more liberal and the number of working women increased, there
was a growing need for attire that was more ‘work-friendly’ than the saree.
Consequently, salwar-suits, which were convenient and easy to wear, became popular
among women. This trend brought in a marked change in the way women bought
clothes. While sarees were almost always bought readymade, women preferred getting
their salwar suits tailored. This was because while sarees were a ‘one-size-fits-all’
kind of a garment, salwar-suits needed to be tailored according to the individual’s
requirements.
Gradually, salwar suits became popular all over the country, and women from many states replaced their traditional attire with salwar suits. Interestingly, the salwar suit segment had no national level branded players even at the beginning of the 21st
century. In the salwar suit segment ‘local’ salwar suits were available for as low as Rs 150, while designer label (purchased from high-end boutiques) salwar suits cost Rs 50,000 or more. Despite the growing popularity of salwar-suits, the saree remained the most favored and the highest selling product in the country (a KSA-Technopak study
5 Kurt Salmon Associates (KSA Technopak) is a Management Consulting firm, offering strategy, process and technology deployment solutions to the Retail, Fashion, Food & Grocery and Healthcare industries.

48
Marketing Management - I
revealed that around 197 million women purchased roughly 315 million sarees in 2001).
Gradually, ethnic wear (gagra choli and Lehangas), as a segment became a niche
segment as ethnic clothes were worn only on special occasions such as festivals and
marriages. However, the category’s growth was higher than that of salwar suits. With
many designer boutiques and exclusive showrooms entering the business, the salwar
suit segment saw some efforts towards branding, though primarily on a local scale (in
2001, around 103 million customers bought 145 million ethnic wear sets, out of which
48 million were ready-to-wear and 97 million were tailormade).
By the late 1990s, the Indian economy (and Indian society) showed clear trends of
becoming increasingly westernized in terms of lifestyles, education and vocation,
especially in urban areas. The growing number of career-oriented women resulted in a
major shift in the way certain products and services were marketed in India. The
emergence of products such as ready-to-eat/serve food, fast food joints, take-away
meals, branded jewellery and branded sarees/salwar suits was a direct result of the
above developments. The introduction of corporate, formal, western wear for women
was another step in this direction.
With cultural changes sweeping Indian society, many companies viewed branded
women’s western wear as a segment that had tremendous potential. According to a
KSA-Technopak study, of the total Indian women’s wear business valued at Rs 161
billion, the readymade segment comprised 78% (Refer Table I).
Table I
The Indian Apparel Market (2001-02)
(in Rs billion)
A B C D E
Category Tailored Readymade Total Branded Readymade*
Men 88.000 110.00 198.00 53.00
Women 35.000 126.00 161.00 31.00
Kids 9.50 62.50 72.00 6.00
Total 132.50 298.50 431.00 90.00
* Branded Readymade (E) is a subset of the readymade segment (C).
Source: KSA-Technopak
In the women’s branded readymade segment, while the premium segment (Rs 1000
and above) grew by 18% in 2001, the medium segment (Rs 500 – 1000) grew by 15%
and the lower segment (Rs 200-500) grew by around 12%. These growth figures were
expected to remain more or less constant in the future. As the table indicates, there
exists a difference of Rs 22 million between the market for men’s and women’s
branded readymades. Perhaps this is why there was a plethora of national level brands
in the men’s segment.
Since competition in the men’s segment was intense and demand was reportedly
inching towards saturation levels, the future growth was projected to come from the
women’s and kid’s wear segments. Of the Rs 31 billion branded readymade women’s
wear market, about Rs 6 billion was from women’s Western wear, and this market
was projected to grow at 25% in the future.

49
Allen Solly – Entering the Indian Women’s…
THE MARKET GETS BRANDED
Indus League was the first company to enter the branded women’s wear segment in the country. In 2000, the company launched a women’s range named ‘Scullers Woman’ as an extension of its popular men’s wear brand ‘Scullers.’ Promoted as ‘smart casuals for work and after,’ the Scullers women’s range was launched in three basic lines, Essentials, Manhattan and Chromium. Essentials offered basic knitted cotton blouses, flat front trousers, skirts and capris; Manhattan offered party and evening wear; and Chromium offered formal wear and evening wear (Refer Exhibit III).
The company also launched a silk apparel collection named Geometric, which offered
short tops, shirts and sarong sets. Scullers was marketed through exclusive ‘Scullers
Club Stores’ located in major cities across the country. The range was also made
available at major retail stores such as Shoppers Stop, Globus, Pantaloons and
Lifestyle. Since it was the pioneer in the market, Scullers Woman received an
enthusiastic response.
The next major brand to enter the market was ‘Be,’ launched by Raymond’s in July 2001. While Scullers products were marketed through existing stores (both company-owned and multi-brand stores), Raymond’s Be brand was sold through exclusive stores. Commenting on Raymond’s entry into women’s wear, Gautam Singhania (Singhania), the company’s Chairman & Managing Director, said, “After much thought, we have decided to take the plunge. The launch of the Be range is an initiative aimed at corporatizing the designer range of clothing. Be will provide a platform for designers to showcase their talents for larger number of consumers.”
The first exclusive Be showrooms were opened in Delhi and Mumbai. Leading fashion designers (such as Rohit Bal, Rajesh Pratap Singh, Raghavendra Rathore and Manish Arora) created outfits for the Be range. Priced between Rs 800 and Rs 7000, Be offered ethnic and fusion wear as well as Western wear. Taking the cue from Scullers Woman and Be, Madura decided to enter this segment. The decision was also inspired by the company’s discovery that women purchased Allen Solly men’s trousers in 26 and 28-inch waist sizes.
Madura employed leading market research agency Indian Market Research Bureau
(IMRB) to conduct a market study on the Indian work culture and the requirements of
women regarding Western readymades. The study revealed that while Indian women
loved ethnic clothes, they were not comfortable in them while working. Factors such
as increased number of women in the workplace and challenging jobs that required a
lot of traveling indicated a growing need for Western wear.
The study also revealed that though Western wear was available in the market, their
international styling was unsuitable for Indian women. Equipped with these findings,
the company decided to focus primarily on the comfort and styling aspects of its
proposed brand. The first task was to make the product suit the needs and body
proportions of Indian women. According to IMRB’s research findings, the body types
of Indian women could be divided into four broad categories: comfort – for a body
small on top, wider on the hips; straight – equal on top, waist and hips; trim – equal on
top and bottom with narrow waist; and regular – wide shouldered and narrow at waist
and hips.
To offer specialized and modern styling, the company recruited Stephen King, a
renowned UK-based designer, to create designs suitable for all four body types. And
to cater to the requirements of women who were on the heavier side, Allen Solly
trousers were offered in waist size as high as 36 inches. The company also planned to
launch a 38-inch trouser in future.

50
Marketing Management - I
Besides trousers, the Allen Solly range offered woven and knitted tops, and jackets in cottons and new fabrics like polynosic, lycra tencel, rayon blends and soft acrylic concentrating on the Autumn and Winter seasons (Refer Exhibit III). All garments were designed in line with the findings of market research. The range was available in bright as well as pastel shades, giving customer, a wide variety to mix and match from. The knitted range was priced between Rs 499 and Rs 999, woven tops were priced between Rs 599 and Rs 899, and trousers were priced between Rs 799 and Rs 1099.
By September 2002, Madura announced the launch of Allen Solly nationwide, and by October 2002, six exclusive outlets (one each in Chennai, Hyderabad, Mumbai and Kolkata and two in Bangalore) were established. In addition, the company planned to retail the range through leading retail showrooms across the country. Special attention was paid to the designing of exclusive showrooms, keeping in mind the targeted clientele (the Mumbai store was designed by well-known UK-based architect Jean Claude Pannighetti).
The stores were planned in a way that made the shopping experience a unique and
pleasant one. Garments were stacked in easy to find, fit-based categories, making it
easier for customer to locate garments of the required size. All the stores were given a
contemporary look with radiant steel, pleasant whites and Belgian glass providing a
bright and open ambience.
The target customer base for Allen Solly women’s Western wear was identified as the self assured, office going women in SEC A6 between 22-40 years of age, who wore Western outfits once or twice a week, and had an income of Rs 8,000 and above per month. Commenting on the decision to launch the range, Vasant Kumar, Vice-President (Marketing), Madura, said, “Our target is not women who already wear western clothes; we are pegging on converting the salwar-kameez category. If in the process, we manage to attract the former category, that is just a bonus.” The company reportedly sought to attract women who gave importance to ‘sophisticated professionalism’ in their lives.
To support the brand, Madura decided to go in for aggressive campaigning and earmarked a total investment of Rs 100 million. Of this, around Rs 60 million was allotted for advertising and the remaining Rs 40 million was allotted for background research, creative team, manufacturing and retailing. Promotional exercises for the brand began with a fashion show organized by the company, which displayed the entire range. The company made extensive use of mailers to reach targeted customers. The mailer contained an inch tape, with a message ‘Every body is perfect; you have just got to dress it right.’
Madura planned to promote the brand mainly through outdoor advertising and print campaigns (refer Exhibit IV for a print advertisement). The campaigns focused on the workplace success of women and how this success was handled with style and flair by the women concerned. The idea was to establish the brand as a true reflection of the attitude of women in the 21st century Indian workplace. Leading magazines and other publications that were read by women from the targeted segment carried the print advertisements, while billboards and hoardings were extensively used at prime locations in all the cities the range was launched in.
The initial response to Allen Solly women’s wear was reportedly positive, especially due to the availability of ‘comfort fit’ trousers. The brand seemed to have gained a significant amount of recognition due to advertisements and media coverage.
6 Socio-Economic Classifications (SEC) categorize urban Indian households into five segments, SEC A, SEC B, SEC C, SEC D and SEC E, on the basis of education, occupation and chief wage earner’s profile. A and B are high SEC classes, SEC C falls in the mid SEC class and SEC D and E are low SEC classes.

51
Allen Solly – Entering the Indian Women’s…
However, despite this positive response, Madura’s decision to launch the range attracted criticism from some industry observers. Doubts were expressed about the logic behind extending a successful, nine-year old men’s wear brand to the women’s wear segment.
By extending the brand, the company saved a lot of time and money that would have gone in building a new brand. However, such a move may make some men shift to a ‘pure men’s brand’ in future. Though Scullers, ColorPlus and Wills Lifestyle had also similarly extended their brands, none of these brands had a brand image as popular and well entrenched in the country as that of Allen Solly.
However, company sources disagreed that men might shift to a pure men’s brand and claimed that launching women’s wear did not make Allen Solly a unisex brand. Madura Garments’ design consultant Stephen King said, “Allen Solly is not a unisex brand for the simple reason that the shapes and sizes of garments vary between men and women.” He also added, “I do not expect men to switch over to other brands just because women’s wear is also available under the same brand.”
Madura sources claimed that there was no decline in the demand for the Allen Solly men’s range after the launch of the women’s range. The company also revealed that, according to its market study findings, many men were pleased with the decision to extend Allen Solly to women’s wear. However, some industry players felt that the sales of Allen Solly men’s wear could be negatively affected in the long run.
Perhaps to be on the safer side, Madura decided to incorporate some elements in its communication strategy that would help restrict the flight of customers from its men’s wear range. For instance, one of the visuals in an advertisement showed an Allen Solly male model welcoming an Allen Solly female model, while the ad line read, ‘Allen Solly introduces work wear for women.’ The aim was to convey the idea that the women’s wear range was a welcome development for both genders as far as the Allen Solly brand was concerned.
Analysts also pointed out that by categorizing women’s garments on the basis of body types, Madura risked investments in large inventories for itself as well as its retailers. The issue of inventory assumed greater significance considering the fact that the shelf life of women’s wear was reported to be lesser than that of men’s wear. Moreover, retailers needed to continually replenish the stocks with new styles and colors to ensure repeat visits.
FUTURE PROSPECTS
Despite the apprehensions of some analysts, many players began taking interest in the Western women’s wear segment in India. Leading textile company Arvind Mills (the market leader in the Indian denim market with brands such as Lee, Levis and Newport) planned to enter into the women’s Western wear segment by early-2003 under its popular premium brand ‘Arrow.’ Darshan Mehta, President, Arvind Brands, said, “In the US, there is a strong women’s line under Arrow, which we plan to launch in India.”
Meanwhile, existing players were also working towards the success of their brands. Raymond’s planned to extend its distribution chain to 100 exclusive Be outlets by 2003, mainly through the franchisee route. The company also considered the possibility of integrating Be with the existing Raymond’s retail outlet network. Said Singhania, “We already have 250 outlets for Raymond. Going down the line, we will certainly look at integrating Raymond with Be.” Madura announced that it would strengthen its retail network and record a turnover of Rs 500 million during 2002-2005 through the Allen Solly women’s wear range.
Even private fashion labels were entering the business, attracted by the changing market dynamics. Many leading fashion designers such as Ritu Beri and Puja Mehra

52
Marketing Management - I
Gupta (Puja) launched their range of women’s clothing through exclusive retail outlets. These clothes were not exorbitantly priced like private fashion labels usually were.
Ritu Beri’s ‘Label’ collection offered Western wear, ethnic and party wear while Puja’s Bizarre’s collection offered only Western wear. With four exclusive showrooms in Delhi, Puja planned to expand to other cities. Puja had split Western women’s wear into five categories, daywear, lounge wear, club wear, holiday wear and party wear. Catering to all the above categories, Bizarre garments were priced between Rs 500 to Rs 5000.
Though the projected growth rates were attractive, industry observers felt that there was not enough room for so many players. Moreover, they were of the opinion that companies would find it tough to figure out the perfect fit and offer the best dressing solutions for working women. However, the players seemed to be confident about their prospects as the number of working women was expected to increase in the future. One important question needed to be answered: would the projected growth rates of Western women’s wear turn into real figures?
Questions for Discussion:
1. Examine the circumstances that prompted Madura to launch women’s Western wear in the Indian readymade women’s wear industry. Why do you think companies primarily offered only men’s wear in the branded readymade apparel segment in the country? What kind of cultural and social changes led to the launch of Allen Solly Women’s Wear?
2. Critically analyze the product development, retailing and promotional strategies adopted for Allen Solly women’s wear. What are the essential differences between marketing readymade apparel to men and marketing readymade apparel to women in a developing country? How would your answer differ if the target customer base belonged to a developed country?
3. ‘Madura has taken a major risk by extending a ‘pure men’s brand’ to the women’s wear segment.’ Comment on this statement in light of observation that men might switch over to a pure male brand in the future. Do you think Madura’s move could erode Allen Solly’s brand equity?
4. With many players entering the women’s Western wear segment, do you think Allen Solly would be able to grow as planned? As part of a team responsible for managing the brand, help the company design a marketing strategy plan to attain leadership position in the women’s western wear segment.
© ICFAI Center for Management Research. All rights reserved.

53
Allen Solly – Entering the Indian Women’s…
Exhibit I
Madura – The Company
Madura Garments began functioning as a subsidiary of Madura Coats Ltd. (Madura Coats), in which Coats Viyella plc, Europe’s largest clothing supplier, held a majority stake. Coats Viyella owned internationally established brands such as Peter England, Louis Philippe, Van Heusen, Allen Solly and Byford, which were marketed in India by Madura Coats. The company was the pioneer in the branded readymade men’s wear market in India.
It launched the Louis Philippe range of shirts and trousers in 1989, which emerged as the market leader in the super premium men’s wear category in India (the range included silk printed shirts, trousers, blazers, ties, T-shirts, socks and other accessories). In 1990, the Van Heusen range targeted at corporate executives was launched. Van Heusen soon became India’s largest selling brand in the readymade shirts segment. Allen Solly, which was launched in India in 1993, introduced the concept of Friday Dressing in the country. Allen Solly also targeted corporate executives and was positioned as ‘formal wear with a relaxed attitude.’
Encouraged by the success of Louis Philippe and Allen Solly, Madura launched another brand, Peter England in 1997, which targeted the mid-segment The company also entered into the knits segment with Byford. In 1998, it launched San Frisco men’s trousers and trouser sub-brands Spiritus (of Louis Philippe) and Elements (of Peter England). Through Elements, Madura entered the casuals (trousers and jackets) segments. In December 1999, the Aditya Birla group textile company, Indian Rayon, took over Madura.
Madura continued launching innovative styles under its premium brands Uncrushables, Tencel, 7 day Fit and Citrus collection under Allen Solly; Permapress, Stretch and Monet under Louis Philippe; and Durapress, Boardroom Black, Flat Front Trousers, and Contemporary Creams under Van Heusen. Madura also launched a highly innovative brand in the form of Van Heusen’s odor-free range Durafresh. In the same year it also launched Louis Philippe’s Stretch Collection.
Madura Garments also concentrated on the export segment, and became a supplier to global players such as Tommy Hilfiger and Marks & Spencer. To improve its designs, Madura set up a full-fledged design studio at Bangalore headed by Stephen King. In 2002, the company registered a turnover of Rs 3.5 billion and its export revenues reached Rs 500 million.
Source: ICMR
Exhibit II
Traditional Clothes Worn By Indian Women
SAREE SALWAR-SUIT
Source: www.google.com Source:www.neerus.com

54
Marketing Management - I
Exhibit III
The New Western Wear Offerings for Indian Women
SCULLERS ALLEN SOLLY BE
Source: www.scullers.com Source: www.blonnet.com Source: www.raymondsindia.com
Exhibit IV
An Allen Solly Print Media Advertisement
Source: The Times of India, December 22, 2002.

55
Allen Solly – Entering the Indian Women’s…
Additional Readings & References:
1. Kurian Bobby, Womenswear to be Launched Under Indigo Nation...., Business Line, April 4, 2000.
2. Apparel Allen Solly Brand to Dress Up Women as Well, www.textileoffice.com, June 1, 2001.
3. Raymond's Be: For the ‘Complete Woman,’ The Catalyst, July 31, 2001.
4. Madura Garments: Gets into Women’s Range, Business Line, December 18, 2001.
5. Chatterjee Purvita, Raymond Wants to Be: With it, Business Line, January 10, 2002.
6. Mary Vijaya S. B., When Sally met Solly, The Hindu, April 23, 2002.
7. Begg Yusuf, Hoping for a New Wardrobe, Business Standard, June 8, 2002.
8. Who's wearing the pants? Allen Solly Launches Womenswear, Business Line, August 23, 2002.
9. Jagannathan Venkatachari, All’s Well that Sells Well, www.domain-b.com, August 31, 2002.
10. Challapalli Sravanthi, The Woman in Allen Solly, The Catalyst, September 12, 2002.
11. Chandran Praveen, Rs 10-crore Fund for Allen Solly Women’s Wear, Business Line, October 3, 2002.
12. Joseph Jaimon, Allen Solly: Now for Women, biz.yahoo.com, October 4, 2002.
13. Allen Solly Womenwear Targets Rs 10 cr, Economic Times, October 4, 2002.
14. It’s Friday Dressing for Women Now, Business Line, October 5, 2002.
15. Raymond May Take Premium Brand Global, Business Standard, October 5, 2002.
16. Raymond's First Be: in Mumbai, Business Line, October 12, 2002.
17. www.scullers.com
18. www.allensolly.com
19. www.bharattextile.com
20. www.ksa-technopak.com
21. www.imagefashion.com

Hindustan Lever – Rural Marketing Initiatives
“Consider the market, out of five lakh villages in India only one lakh have been tapped so far.”
Irfan Khan, Corporate Communications Manager, Hindustan Lever Ltd., in 2001.
TEACHING PEOPLE HOW TO WASH UTENSILS!
In June 2002, the employees of Hindustan Lever Ltd. (HLL), a subsidiary of the fast moving consumer goods (FMCG) major Unilever and India’s leading FMCG company literally took to streets. The company was undertaking a promotional exercise in the rural areas of three states – Madhya Pradesh (MP), Bihar and Orissa for its utensil-cleansing bar, ‘Vim.’ A part of HLL’s ongoing television (TV) campaign, ‘Vim Khar Khar Challenge1,’ the promotion drive involved company officials to visit rural towns and demonstrate how vessels are cleaned with Vim.
Commenting on this, Sanjay Bhel, HLL’s Marketing Manager, said, “For the purpose, we are educating the rural masses on the on-going ‘Vim Khar Khar Challenge’ TV commercial by conducting live demonstrations about vessel cleaning. Our aim is to tap the growth rate of the Rs 4 billion2 scouring bar market – although it has been growing at a rate of 15% per annum, since last year it has been decelerating.” This exercise was just one of the numerous marketing drives undertaken by HLL over the decades to increase its penetration in the Indian rural markets. The company had, in fact, earned the distinction of becoming one of the few Indian companies that had tapped the country’s vast rural population so extensively. It was therefore not mere coincidence that around 50% of its turnover came from rural markets.
With the penetration of their products reaching saturation levels in many urban markets, FMCG companies had to turn towards rural areas in order to sustain revenue growth and profitability. Since the disposable income in the hands of rural people had been increasing in the late-1990s and the early 21st century, it made sense for companies to focus their energies on this segment. Industry observers also felt that HLL was at an advantage compared to most of its competitors – thanks to its consistent, pioneering efforts towards establishing well-entrenched distribution and marketing networks to reach the vast Indian rural masses.
BACKGROUND NOTE
HLL’s origins can be traced back to the England based company, ‘William Hesketh Lever,’ established in 1885 by Lever Brothers. The company entered India in 1888 through the export of its laundry soap ‘Sunlight.’ In 1930, the company merged with the Netherlands-based Margarine Unie, [an established player in India through the export of vanaspati (hydrogenated edible fat)] to form Unilever Ltd.3 in UK. The same year, the company established the Hindustan Manufacturing Company for production
1 The campaign featured ladies struggling to scrub and clean very dirty utensils, making a rough noise (‘khar khar’ is a Hindi language term denoting this noise) with an ordinary washing bar. Vim bar was then shown as the solution to the problem.
2 In October 2002, Rs 48 equalled 1 US $. 3 In 2002, Unilever’s operations were spread across 40 countries. Its key businesses include
food, home and personal care products. Many of its brands were leaders in the respective categories in various parts of the world.

57
Hindustan Lever – Rural Marketing Initiatives
of edible oil. Initially, a majority of Unilever’s revenues came from soaps and vanaspati. In 1932, HLL’s Vanaspati accounted for almost three-fourth of India’s production of nearly 6,000 tonnes.
In October 1933, Lever Brothers (India) Pvt., Ltd. (LBIL) was incorporated as a wholly owned subsidiary of Unilever. Two years later, United Traders was set up for import and distribution of toilet products. These three subsidiaries were merged in 1956 to form HLL. HLL offered 10% of its equity to the public by an initial public offer in the same year. In the late-1950s the company undertook modernization of its facilities. It also expanded its manufacturing capacity for vanaspathi by buying factories at Trichy (Tamilnadu), Shamnagar and Ghaziabad (near Delhi). By 1960, HLL’s annual production of vanaspati had gone up to 3,36,00 tonnes.
In 1961, HLL introduced ‘Lux’ soap in a range of colors. The 1960s-1970s witnessed a series of new product launches – ‘Anik’ (clarified butter, in the early-1960s), Sunsilk (shampoo, in 1964), ‘Rin’ (washing-bar, in 1969), ‘Clinic’ (shampoo, in 1971), and ‘Liril’ (bathing soap, in 1974). In 1975, HLL entered the oral care market with a gel toothpaste called ‘Close-Up.’ In late-1970s, HLL set up 70 medium and small-scale factories in the rural areas for manufacturing soaps and detergent.
The company also diversified into manufacturing chemicals and set up chemical plants at Haldia (Calcutta, West Bengal), Taloja (Maharashtra) and Jammu (Jammu and Kashmir). In 1980, Unilever offered HLL shares for sale in order to reduce the non-resident holding in the company to 51% to comply with the Foreign Exchange Regulation Act (FERA) regulations4. The company also complied with the government’s condition of minimum 10% export and 60% turnover from priority sectors.
In 1983, a new plant for synthetic detergents was set up in Chindwara district of MP.
In 1986, HLL moved into agri-products by setting up a unit in Hyderabad (Andhra
Pradesh). In the same year, the company introduced a new variant of ‘Lux’. This was
followed by the launch of ‘Lifebouy Personal’ and ‘Breeze’ soaps in 1987. In 1988,
HLL set up a manufacturing facility at Pondicherry in collaboration with National
Starch Corporation, USA. In 1989, a synthetic detergent plant and a toilet soap plant
were established in Sumerpur and Orai (both in Uttar Pradesh) respectively.
In 1991, HLL launched Lifebuoy Plus and Le Sancy soaps in the market. In 1992, the
company came out with two more dental care products, Pepsodent and Mentadent G.
Between 1992-1996, HLL bought many companies like Tomco, Kwality, Kissan, and
Lakme. In the late 1990s, HLL formed a 50:50 joint venture with the US based
Kimberly Clark Corporation called Kimberly Clark Lever Limited (KCLL) that
manufactured diapers and sanitary napkins. HLL formed another joint venture, Lever
Johnson, with the US based S.C.Johnson & Co. to manufacture and market pest
repellants and disinfectants.
The early 1990s (1991-1994) was a period of global recession and ‘value-for-money’
became the buzzword for many FMCG companies all around the world. Even in India,
there was a paradigm shift towards value-for-money products. Growth in the urban
markets had slowed down and even the rural market showed signs of sluggishness in
terms of both value and volumes. This was evident from the fact that the growth in
volumes (in rural areas), which had been 52% in 1996, dropped steeply to 29% in
1997. In spite of the sluggish market conditions, HLL had been successful in
launching ten new brand extensions and products in 1996 alone. In early 1997 also,
the company had launched six new products and brand extensions.
4 The erstwhile Foreign Exchange Regulations Act (FERA) of 1973 was formulated to regulate dealings in foreign exchange and foreign securities. As per FERA, MNCs operating in India had to either exit the country, or dilute their stake in the companies concerned.

58
Marketing Management
In 1997, HLL had a total market share of 58-60% in the FMCG sector, which further increased to 62% in 1998. HLL launched 41 new products and re-launched around 41 product innovations. The company also took up many initiatives in the area of distribution to double its reach in the rural markets. It also set up ten new factories in India – among them two each for packet tea and personal products and one each for soaps and detergents.
The year 2001 was a tough year for the Indian FMCG sector due to the country’s economic growth slowing down to 4% from 6.4% in 2000. However, HLL was able to post significant gains despite a slowdown in both the rural markets and the industrial segment. This was because of its strategy to focus on its ‘Power Brands,’ aimed at sustaining profitable growths in slow markets. As a result, HLL’s financial results clearly depicted its leadership position in most of the product categories it operated in. From Rs 17.57 billion in 1992, sales increased to Rs 109.71 billion in 2001. Profit after tax also increased from Rs 985 million to Rs 15.4 billion in 2001 (Refer Exhibit I for the company’s key financials).
HLL was undoubtedly the company that had virtually shaped India’s FMCG market over the decades. The company had built some of the most successful brands in India and many of its advertising campaigns had become part of the country’s advertising folklore. Amongst over 110 brands that it owned, HLL called the 30 best selling brands as ‘Power Brands’ – a title well deserved. This was because brands such as Fair & Lovely, Pond’s, Pepsodent, Close-up, Sunsilk, Clinic, Lakme, Surf, Rin, Wheel, Lifebuoy, Lux, Breeze, Vim, Kwality, Brook Bond, Lipton, Annapurna, Kissan, and Dalda had become an integral part of almost every Indian household (Refer Exhibit II for HLL’s product/brand profile).
Interestingly, many of the above products, and especially those in categories like fabric wash, personal wash and beverages derived more than 50% of their sales from rural areas. HLL’s efforts to build a market for its products in these areas had started way back in the days it began operations in the country. By the 1990s, rural markets had become a significant destination for FMCG marketers like never before (Refer Exhibit III for a note on rural marketing in India).
HLL GOES TO THE VILLAGES
Traditionally, HLL used both wholesalers and retailers to penetrate the rural markets. A fleet of motor vans covered small towns and villages. These vans induced retailers to stock HLL products and display advertising material in their shops. In many towns, there were redistribution stockists who carried bulk stocks and serviced retailers. There were some 7,000 redistribution stockists who served over a million retail outlets.
In the late-1990s, HLL realized that despite its pioneering efforts to expand its rural consumer base, a large part of the market remained untapped. Thus, the company set itself a target of contacting 16 million new village households by 1999. This was to be achieved by strongly focusing on the sales, marketing, and production of the ‘Power Brands’ in the rural markets. HLL adopted a phased approach in order to meet its target and decided to address the key issues related to availability, awareness and overcoming prevalent attitudes and habits of rural consumers. Penetrative pricing was also an important factor that was addressed.
One of HLL’s initial initiatives was in the form of ‘Project Streamline’ that was introduced in select states of the country in 1998. Project Streamline addressed the problems of the rural distribution system, to enhance HLL’s control on the rural supply chain as well as to increase the number of rural retail outlets from 50,000 in 1998 to 100,000 in a time span of one year.

59
Hindustan Lever – Rural Marketing Initiatives
Project Streamline was targeted at places that had a poor market development base
thus making any kind of distribution unavailable. This project was to be carried out
with the help of a rural distributor who had 15-20 rural sub-stockists, connected to
him in villages. The sub-stockists performed the role of driving distribution in the
neighboring villages using unconventional means like bullock-carts and tractors.
As a part of the project, HLL aimed at providing higher quality services to consumers
in terms of ‘frequency,’ ‘full-line availability’ and ‘credit5.’ As a result, the number of
HLL brands and the Stock Keeping Units (SKUs)6 stocked by the village retailers
increased. This initiative helped HLL increase its reach in the rural market to 37% in
1998 from 25% in 1995.
In mid-1998, the personal products division of HLL launched another campaign called ‘Project Bharat’ to be carried out by the end of 1999. ‘Project Bharat’ was a direct marketing exercise undertaken to address the issues of awareness, attitudes and habits of rural consumers and increase the penetration level of HLL products. It was the first and the largest rural home-to-home operation to have ever been taken up by any company in India. The company carried out its direct marketing operations in the high potential districts of the country to attract first-time users.
Under ‘Project Bharat,’ HLL vans visited villages and sold small packs consisting of low-unit-price pack each of its detergent, toothpaste, face cream and talcum powder for Rs 15. During the sales, company representatives also explained to the people how to use these products with the help of a video show. The villagers were also educated about the superior benefits of using the company’s products as compared to their current habits. This was very helpful for HLL as it created awareness of its product categories and the availability of the affordable packs.
However, the company sensed that the sampling campaign was not enough to attract
first time users. Therefore, it rolled out a follow-up program called the ‘Integrated
Rural Promotion Van’ (IRPV), which further enhanced the awareness about HLL’s
products in villages with a population above 2000.
Another program targeted at villages with a population of less than 2000 was
simultaneously launched. Under this program, the company provided self-
employment opportunities to villagers through Self-Help Groups (SHG). SHG’s
operated like direct-to-home distributors wherein groups of 15-20 villagers who are
below the poverty line (those people whose monthly incomes was less than Rs 750 per
month) were provided with an opportunity to take micro-credit from banks. Using this
money, villagers could buy HLL’s products and sell them to consumers, thereby
generating income as well as employment for themselves. This activity also helped the
company increase the reach of its products.
Apart from this, in May 1999, the company tied up with various Non-Governmental
organizations (NGOs), United Nations Development Programme (UNDP) and other
voluntary organizations to increase awareness about health and hygiene in villages.
The company set a goal of reaching 2,35,000 villages from the existing 85,000 and
covering 75% of the population from the existing 43%.
To further increase the effectiveness of the campaign, the company aimed at achieving a 65% reach through the TV media up from the current reach of 33%. Starting with Maharashtra, the company encouraged primary education in villages with the help of
5 Frequency in terms of supply of stocks to the rural distributors; Full-line availability in terms of making available all the range of products belonging to a particular brand and having similar use; and credit in terms of offering credit to rural distributors and sub-stockists.
6 SKUs refer to the different brands with their different sizes and colors all counted as separate units.

60
Marketing Management
V-Sat connections7. This helped it to create greater awareness about hygiene and cleanliness thus influencing people’s behavior, which in turn would have a direct impact on its sales.
By the end of 1999, HLL had covered 13 million households through ‘Project Bharat.’ The campaign was successful in increasing penetration levels, usership and the awareness about the company’s products in the districts targeted. This also helped HLL grow at a better pace than the industry. In the shampoo market, while the urban growth rate was only 4-5%, the rural growth was at 15-16%. Similarly, in the skincare market the urban growth was only at 7-8% whereas it was 14% in the rural markets.
In August 1999, HLL launched a nationwide Community Dental Health campaign in association with the Indian Medical Association (IMA) to promote its toothpaste Pepsodent. HLL stood at the second position in terms of market share in the dental care segment (37%) that comprised of Pepsodent’s 16% and Close-Up’s 21% whereas Colgate-Palmolive was the leader with over 50% market share in the Rs 10 billion toothpaste market. The vision of the project was ‘to make every person in urban and rural India to adopt a good oral care regime.’ Company sources placed the total investment in the program between Rs 100-200 million.
The company wanted to attain the leadership status with the help of aggressive marketing initiatives. Statistics revealed that penetration levels in India were very low with the per capita consumption (of toothpaste) being only 0.75 gm. Moreover, only 47% of the Indian population used toothpaste – while 27% used toothpowder, the rest used traditional methods such as coal and neem sticks. The growth in the segment was around 3-4% in the urban market, whereas the rural market growth was projected at 9-10%.
As a part of the project several infomercials were launched to increase awareness on dental hygiene and also to highlight common dental problems and their causes. These infomercials were aired on Doordarshan (India’s national television channel). Around 200 health fairs were organized, predominantly in the rural areas. Various dental health programmes as well as education & check up modules were organized at public health centers. Representatives of IMA and local public health centers conducted educative demonstrations on good brushing habits, correct use of dentrifices and other issues related to dental hygiene. Dental checkups were also conducted in these health centers.
The Dental Health Campaign was carried out for a period of three years and targeted 100 million people across rural India. By 1999, the promotion covered 10 districts in UP and Maharashtra and by the end of 2000, the number touched 50. This campaign aimed to increase the direct reach of toothpaste in rural India to 1.25 lakh villages, up from the existing 40,000 villages by the year 2001. The IMA-Pepsodent project increased the overall dental care penetration in the country to 58-60% from the prevailing 48%.
In April 2000, the company launched another campaign called ‘Project Millennium’ wherein it targeted increasing its share in the tea market. HLL planned ways to tap the ‘chai-ki-dukan’ (tea vendors). The company provided affordable tea packets that were suitably blended to appeal to the rural taste of ‘Kadak chai’ (strong tea). The company test marketed an especially designed product ‘chai-ki-goli’, (fully soluble ball) that was dropped in boiling milk-water combination. These were priced very attractively at four for a rupee.
All these initiatives seemed to have paid off for HLL, since the increase in brand consciousness and disposable incomes had significantly altered the consumption
7 VSAT is an earthbound station used in satellite communications of data, voice and video signals.

61
Hindustan Lever – Rural Marketing Initiatives
patterns of rural people. In a survey conducted in December 2000 called the ‘Emerging Market Trends’ by the Center for Industrial and Economic Research, it was found that HLL had overtaken both Colgate-Palmolive and Nirma in creating brand awareness and penetration in rural households. The survey revealed that HLL was leading with 88% rural market penetration whereas Nirma and Colgate-Palmolive followed in that order with 56% and 33% respectively. HLL’s brands had the highest penetration in many product categories (Refer Exhibit IV).
Inspired by the success of its earlier ventures, HLL went on to participate in a rural communication programme called the ‘Grameenon ke Beech’ (Amidst villagers) in August 2001. The program was launched by the Rural Communications & Marketing Pvt Ltd, (RC&M), an agency that specialized in rural advertising and marketing. Besides HLL, the other companies that had participated in this programme included Colgate-Palmolive, automobile major Mahindra & Mahindra and foods major Parle. The first phase of the programme covered 1,000 villages and 2,000 satellite villages in 22 districts of western UP and 13 districts of central UP over a period of six months8.The program involved setting up of company stalls, product briefings and demonstrations, interactive games, lucky draws, magic shows and the screening of a hit movie interspersed with product commercials.
In late 2001, HLL launched another project called ‘Project Shakti’ in the state of Andhra Pradesh for a period of six months. Project Shakti sought to create a sustainable partnership between HLL and its low income rural consumers by providing them access to micro-credit; an opportunity to direct that credit into investment opportunities as company distributors; and reward for growth and enterprise through shared profits. During 2001, the ‘rural cell’ within HLL worked closely with self help groups, NGOs and governmental bodies in Andhra Pradesh to put in place a comprehensive experiment in training these self help groups.
At the end of six months of implementation (March 2002), HLL claimed to have achieved a 20% increase in consumption in the areas where it was carried out. This was a favorable development for the company, coming at a time of an overall economic slowdown. Having been successful in this initiative, HLL decided to expand this project to other states like Gujarat, Maharashtra and MP. The project at Gujarat was to be carried out in early-2002. HLL also planned to work with a group of NGOs to implement the project in the states of Maharashtra and MP in 2002-03.
STAYING ON IN THE VILLAGES
Continuing its focus on rural areas, HLL launched a massive rural campaign to
reposition one of its leading brands, Lifebuoy, in February 2002. Lifebuoy was the
single largest soap brand in rural India with 20 lakh soaps sold every year and had an
estimated value of Rs 5 billion. The re-launch of 107-year-old Lifebuoy was primarily
done to increase growth in the sluggish soap market.
Commenting on this Category Head, Mass Market Soaps and Detergents, Sanjay
Dube said, “It is the biggest and comprehensive re-launch of any of our brands.” HLL
decided to further highlight the concepts of health and hygiene in rural areas to
support the relaunch. The product was given a completely new look (size and shape),
formulation, fragrance, lather profile and was repositioned as a family soap rather than
a male soap. The company introduced many variations of the product including
Lifebuoy Active Red, Lifebuoy Active Orange, Lifebuoy International Plus and
Lifebuoy International Gold. HLL expected the campaign to bring the company’s
growth to double-digit levels in 2002.
8 The second phase was started in early 2002 and covered eastern UP and Bihar.
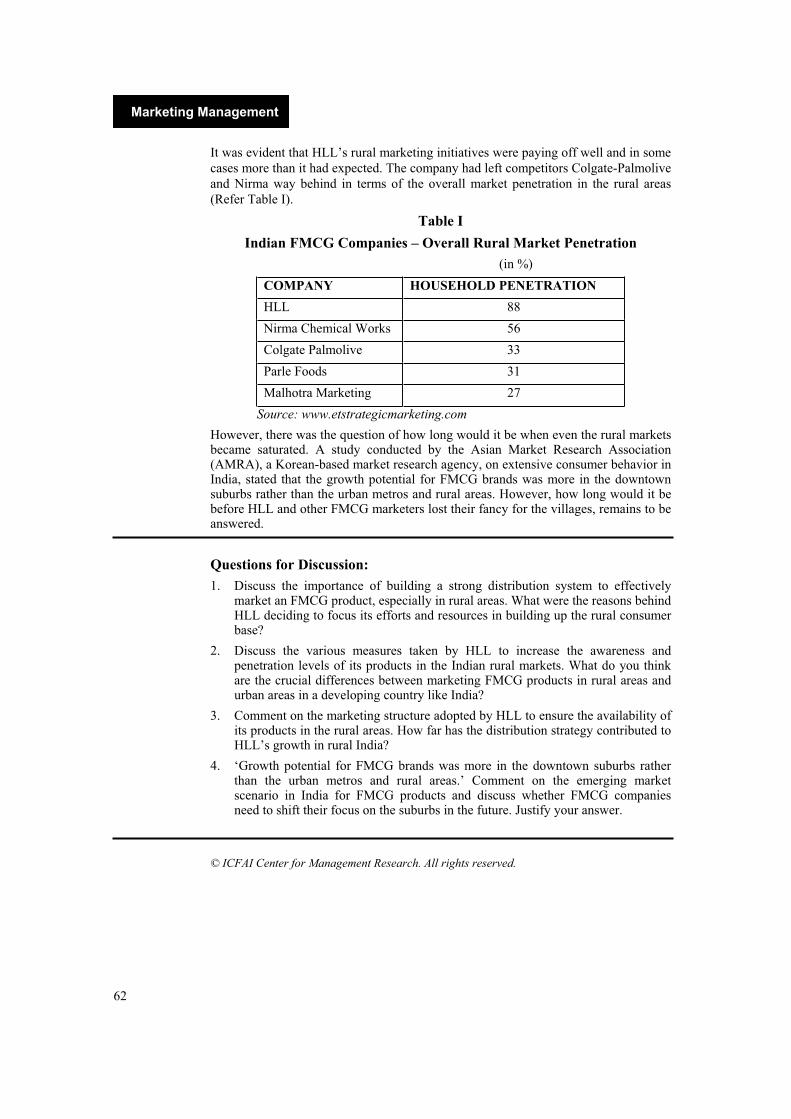
62
Marketing Management
It was evident that HLL’s rural marketing initiatives were paying off well and in some
cases more than it had expected. The company had left competitors Colgate-Palmolive
and Nirma way behind in terms of the overall market penetration in the rural areas
(Refer Table I).
Table I
Indian FMCG Companies – Overall Rural Market Penetration
(in %)
COMPANY HOUSEHOLD PENETRATION
HLL 88
Nirma Chemical Works 56
Colgate Palmolive 33
Parle Foods 31
Malhotra Marketing 27
Source: www.etstrategicmarketing.com
However, there was the question of how long would it be when even the rural markets became saturated. A study conducted by the Asian Market Research Association (AMRA), a Korean-based market research agency, on extensive consumer behavior in India, stated that the growth potential for FMCG brands was more in the downtown suburbs rather than the urban metros and rural areas. However, how long would it be before HLL and other FMCG marketers lost their fancy for the villages, remains to be answered.
Questions for Discussion:
1. Discuss the importance of building a strong distribution system to effectively market an FMCG product, especially in rural areas. What were the reasons behind HLL deciding to focus its efforts and resources in building up the rural consumer base?
2. Discuss the various measures taken by HLL to increase the awareness and penetration levels of its products in the Indian rural markets. What do you think are the crucial differences between marketing FMCG products in rural areas and urban areas in a developing country like India?
3. Comment on the marketing structure adopted by HLL to ensure the availability of its products in the rural areas. How far has the distribution strategy contributed to HLL’s growth in rural India?
4. ‘Growth potential for FMCG brands was more in the downtown suburbs rather than the urban metros and rural areas.’ Comment on the emerging market scenario in India for FMCG products and discuss whether FMCG companies need to shift their focus on the suburbs in the future. Justify your answer.
© ICFAI Center for Management Research. All rights reserved.

63
Hindustan Lever – Rural Marketing Initiatives
Exhibit I
Hll – Key Financials
(in Rs crores)
Year 1994 1995 1996 1997 1998 1999 2000 2001
Profit and Loss Account
Sales 2826.48
3366.95 6600.11 7819.71
9481.85 10142.49
10603.79
10971.90
Other Income
56.21 66.70 118.08 183.87 244.74 318.98 345.07 381.79
Interest (29.54)
(20.15) (57.00) (33.89) (29.28) (22.39) (13.15) 7.74
PBT 302.71 372.22 605.25 850.25 1130.44 1387.94 1665.09 1943.37
PAT 189.96 239.22 412.70 580.25 837.44 1069.94 1310.09 1540.95
EPS of Re.1 (adjusted for bonus)
1.30 1.64 2.08 2.81 3.67 4.86 5.95 7.46
DPS of Re.1 (adjusted for bonus)
0.80 1.00 1.25 1.70 2.20 2.90 3.50 5.00
Balance Sheet
FixedAssets
328.90 395.56 721.71 794.09 1053.77 1087.17 1203.47 1320.06
Investments 191.45 122.83 328.77 531.57 697.51 1006.11 1769.74 1635.93
Net Current Assets
342.02 457.67 378.67 122.42 226.06 187.25 (373.38) (75.04)
NetDeferred tax
- - - - - - - 246.48
862.37 976.06 1429.15 1448.08
1977.34 2280.53 2599.83 3127.43
Share Capital
146.99 145.84 199.17 199.17 219.57 220.06 220.06 220.12
Reserves & Surplus
391.27 492.44 792.36 1062.33
1493.46 1883.20 2268.16 2823.57
Share Premium Suspense Account
177.57 177.57 177.57 - - - - -
Loan Funds 146.54 160.21 260.05 186.58 264.31 177.27 111.61 83.74
862.37 976.06 1429.15 1448.08
1977.34 2280.53 2599.83 3127.43
Source: www.hll.com

64
Marketing Management
Exhibit II
Hll – Product/Brand Profile
Hll – Product/Brand Profile
PERSONAL CARE CATEGORY BRANDS
Fair &Lovely Skin Care Pond’s Pepsodent Oral Care Close-Up SunsilkHair Care Clinic
Deodorants Axe Color Cosmetics Lakme SOAPS & DETERGENTS CATEGORY PRODUCTS
SurfRin
Fabric Wash
WheelLifebuoyLux
Personal Wash
Breeze Household Care Vim FOOD & BEVERAGES
CATEGORY PRODUCTS Kwality Wall’s Cornetto Kwality Wall’s Feast Kwality Wall’s Max Kwality Wall’s Cornetto Soft
Ice Creams
Kwality Wall’s Black Current Sundae Popular Foods Annapurna Culinary Kissan
Brook Bond 3 Roses Brook Bond Red Label Brook Bond A-1 Brook Bond Taj Mahal Brook Bond Bru Lipton Taaza Lipton Yellow Label
Beverages
Lipton Green Label Oil & Fats Dalda
Source: www.hll.com
*The list is not exhaustive. Brands listed above were among the best selling brands of HLL.
Exhibit III
About Rural Marketing
The vast size and large demand base of the Indian rural market offers great opportunities to FMCG companies. A location is defined as ‘rural’ if 75% of the population is engaged in agriculture related activity. India has been classified into 450 districts and approximately 6,30,000 villages. Around 90% of the rural population was concentrated in these villages with an average population of less than 2000. These villages can be sorted depending upon

65
Hindustan Lever – Rural Marketing Initiatives
different parameters like income levels, literacy levels, penetration, accessibility and distance from nearest towns. Almost half of India’s national income is generated from these villages, thereby making rural markets an important part of the total market. In August 2002, around 700 million people, approximately 75% of the Indian population was engaged in agricultural activity and contributed to 1/3rd of the country’s GNP.
Apart from the fact that the rural population was very large in number, it had also grown richer during the 1990s, with substantial improvements in incomes and spending power. This was the direct result of a dramatic boost in crop yields due to good successive monsoons. Tax exemptions for agricultural income also contributed to the enhanced rural purchasing power.
Thus, rural India was seen as a vast market with unlimited opportunities. Therefore it is not surprising when many companies that market FMCGs of every day use, put in place parallel rural marketing strategies. The biggest brands in India belong to companies with a strong rural presence. Many FMCG companies had already hit saturation points in urban India by the mid-1990s. Thus, the late 1990s saw many FMCG companies in India shifting their emphasis on rural marketing. In late 1999, companies like HLL, Marico Industries, Colgate-Palmolive and Britannia Industries took up rural marketing in a serious manner.
However, selling FMCG products in rural India was a tough task. Analysts say that the success of a brand in the Indian rural market was very unpredictable. It has always been difficult to gauge the rural market. This was evident since many brands had not been successful in rural India. Many a times, success in the rural markets has even been attributed to luck. Therefore, it is important for a company to understand the social dynamics and attitude variations within each village. A company has to address several problems before it can successfully sell its products in the market. Some of them are:
Physical Distribution
Channel Management and
Promotion and Marketing Communication
Amongst these, problems related to physical distribution and channel management adversely affect the service and the cost of the company. Typically a market structure consists of a primary rural market and retail sales outlets. The retail sales outlets in towns act as the stock points to service the retail outlets in the villages. But maintenance of the service required for delivery of the product at retail level becomes costly as well as difficult. One way this problem could be solved is by using delivery vans that take products to the customers in the rural areas as well as facilitate direct contact with them, further accelerating sales promotion. However, only big companies can afford to undertake such initiatives. Companies that have fewer resources can opt for syndicated distribution wherein a tie-up among non-competitive marketers can be established to facilitate distribution.
Rural marketing requires more intensive personal selling as compared to urban marketing. The companies intending to penetrate rural markets must understand the psyche of the rural consumers and then act accordingly. Therefore to capture the rural market effectively, a company must relate its brand to the lifestyle of rural folk. This can be done with the help of various rural folk media to reach the villagers in their own language and in large numbers. This way the brand would be associated with the rituals, celebrations, festivals, melas (fairs) and other activities where they assemble.
Source: www.indiainfoline.com

66
Marketing Management
Exhibit IV
Indian Fmcg Market – Brand Penetration
CATEGORY WITHIN
CATEGORY
HIGHEST PENETRATION
BRAND (COMPANY)
Toilet Soap 91% Lifebuoy (HLL)
Washing Cakes/Bars 88% Wheel (HLL)
Edible Oil 84% Double Iran Mustard
Tea 77% Lipton Taaza (HLL)
Washing Powder/liquid 70% Nirma (Nirma)
Salt 64% Tata Salt (Tata)
Biscuits 61% Parle G (Parle)
Skin Cream 58% Fair & Lovely Fairness Cream (HLL)
Talcum Powders 65% Pond’s (HLL)
Source: www.etstrategicmarketing.com

67
Hindustan Lever – Rural Marketing Initiatives
Additional Readings & References: 1. Chaze Aaron, Marketing Companies to Rule the Roost, Wednesday, June 4 1997,
www.indianexpress.com.
2. Nagpal Sunitha, Buy/Sell/Hold, Wednesday, July 23 1997, www.indianexpress.com.
3. Singh Namrata, Growth Put at 24% as Suds Settle in Shampoo Market, Wednesday, April 8, 1998, www.expressindia.com.
4. Marketplace Briefing, Thursday, April 30, 1998, www.expressindia.com.
5. HLL's Q4 Net Up 54 pc to Rs 2.29 Billion; No Bonus Shares, Future Forays into Branded Fruits, Veg Products, says Dadiseth, February 15, 1999, www.rediff.com.
6. Pegu Rinku, Maya Bazaar Marketing: Companies are Looking to The Rural Market to Shore up Their Bottom Lines, May 30, 1999, www.the-week.com.
7. Singh Namrata, Pepsodent Joins IMA for Massive Oral Care Drive, Wednesday, August 25, 1999, www.financialexpress.com.
8. THE INDEX: Colgate Palmolive, Monday, September 27, 1999, www.financialexpress.com.
9. Raman Manjari, Prahalad -- Market to The Poor, Wednesday, January 12, 2000, www.expressindia.com.
10. Singh Namrata, HLL Will Have to Seek New Paradigm in Marketing', Saturday, February 19, 2000, www.financialexpress.com.
11. Jha Neeraj, Whipping Up an FMCG Excitement, Monday, June 19, 2000, www.financialexpress.com.
12. Jha Neeraj, The FMCG Advertising Matrix, Monday, June 19, 2000, www.financialexpress.com.
13. HLL Clocks 16.1% Growth in Profit, 0.42% in Sales, Saturday, October 14, 2000, www.expressindia.com.
14. HLL Reports Flat Growth, Profit Up By 16.1 pc, Saturday, October 14, 2000, www.indian-express.com.
15. HLL Edges Past Nirma, Colgate-Palmolive, Wednesday, December 27, 2000, www.financialexpress.com
16. The Bottom of The Pyramid, January 2001, www.tomorrow-web.com
17. Rural Market - A World of Opportunity, Thursday, October 11, 2001, www.hinduonnet.com.
18. Fair Deal? Cos on Mela Merry-Go-Round Seek to Grab Rural Buyers, October 16, 2001, www.financialexpress.com.
19. HLL Plans Rural Campaign to Reposition Lifebuoy -- To Pitch on Hygiene Platform,February 12, 2002, www.blonnet.com.
20. Chatterjee Purvita, HLL Plans Rural Thrust for Toothpaste Brands, February 20, 2002, www.blonnet.com.
21. Singh Namrata, Project Shakti Powers HLL Rural Sales By 20%, Saturday, March 16, 2002, www.financialexpress.com.
22. Dr Y S R Moorthi, We’re Like This Only, April 10, 2002, www.indiatimes.com.
23. Narayan Tarun ‘FMCG Growth Potential In Downtown Suburbs’, Wednesday, April 17, 2002, www.financialexpress.com.
24. Parthasarathy Venkatesh, Does the Rural Market Like It Hot or Cold?, April 25, 2002, www.blonnet.com.
25. Meheta Mona, HLL to Focus On Rural Markets to Promote Vim, Friday, June 21, 2002, www.financialexpress.com.
26. Lahari Chakravarthy Sampat, A Peek into the Rural Market, July 08, 2002, www.etstrategicmarketing.com.
27. www.hll.com.
28. www.equitymaster.com
29. www.karvy.com.
30. www.indiainfoline.com

Fairness Wars “The saffron and milk combination in Fairever clicked with the people because they were familiar with the goodness of the products. And we changed the rules by introducing saffron which had never been used in fairness creams in the past.”
C.K. Ranganathan, CEO & MD, CavinKare Ltd
“Fair & Lovely continues to grow in a healthy manner. Only two out of ten Indians use face creams. That means strong growth prospects for all brands.”
A HLL Spokesperson
WHO’S THE FAIREST OF THEM ALL?
In June 1999, the FMCG major Hindustan Lever Ltd. (HLL)1 announced that it would offer 50% extra volume on its Fair & Lovely (F&L) fairness cream at the same price to the consumers.2 This was seen by industry analysts as a combative initiative to prevent CavinKare’s3 Fairever from gaining popularity in retail markets. HLL’s scheme led to increased sales of F&L and encouraged consumers to stay with F&L and not shift to the rival brand.
In December 1999, Godrej Soaps4 created a new product category – fairness soaps – by launching its FairGlow Fairness Soap. The product was successful and reported sales of more than Rs. 700 million in the first year of its launch. Godrej extended the brand to fairness cream by launching FairGlow Fairness Cream in July 2000.
By 2001, CavinKare’s Fairever fairness cream, with the USP of ‘a fairness cream with saffron’ acquired a 15% share, and F&L’s share fell from 93% (in 1998) to 76%. Within a year of its launch, Godrej’s FairGlow cream became the third largest fairness cream brand, with a 4% share in the Rs. 6 billion fairness cream market in India. The other players, including J.L. Morrison’s Nivea Visage fairness cream and Emami Group’s Emami Naturally Fair cream, had the remaining 5% share. Clearly, the fairness cream and soaps market was witnessing a fierce battle among the three major players – HLL, CavinKare, and Godrej – each trying to woo the consumer with their attractive schemes.
BACKGROUND
In 1975, HLL launched its first fairness cream under the F&L brand. With the launch of F&L, the market, which was dominated by Ponds (Vanishing Cream and Cold Cream) and Lakme (Moisturizing Lotion), lost their dominant position. The
1 HLL, a 51.6% subsidiary of Unilever Plc, was the largest FMCG company in India, with a turnover of Rs114 billion in 2000. The company’s business ranged from personal and household care products to foods, beverages, specialty chemicals and animal feeds.
2 Initially HLL offered Rs. 5 off on F&L. This was followed by 20% extra volume for the same price, which was later increased to 50% extra volume.
3 In 1983, C.K. Ranganathan (Ranganathan) established Chik India, with an investment of Rs.15000. Chik India was later renamed Beauty Cosmetics, and then went public in 1991. In 1998, the company was renamed CavinKare Ltd.
4 Godrej Soaps’ major product lines were toilet soaps and detergents, industrial chemicals, cosmetics and men’s toiletries. It had interests in several other businesses such as real estate, agro produce, etc through its subsidiaries. In April 2001, the consumer goods business of Godrej Soaps was demerged into a new company. The chemicals division remained with Godrej Soaps, with the new name, Godrej Industries.

69
Fairness Wars
dominance of HLL's F&L continued till 1998, when CavinKare launched its Fairever cream in direct competition with F&L. Within six months of its launch, Fairever captured more than 6% of the market share. The success of Fairever attracted other players. Every product in this segment was witnessing growth higher than the overall personal care product category growth. The fairness cream market was growing at 25% p.a., as compared to the overall cosmetic products market’s growth of 15% p.a. In 2000, there were 7 main brands in the fairness product market across the country.
Table I
Major Players in the Fairness Products Market
Company Brand Product Category
HLL Fair & Lovely Cream, Soap
Emami Naturally Fair Cream
CavinKare Fairever Cream
Paras Freshia Cream
Godrej FairGlow Soap, Cream
Ponds Ponds fairness cream, Ponds cold cream Cream, Lotion
Lakme Lakme Sunscreen lotion, Lakme Sunscreen cream
Cream, Lotion
FAIR (NESS) WARS
In 1998, CavinKare launched Fairever fairness cream. The company took care to stick to the herbal platform that its consumers had come to associate with all CavinKare products. Fairever seemed to be an instant success. Fairever’s market share jumped from 1.23% in 1998 to 8.13% in 1999. The brand was expected to grow from Rs 160 million in 1999 to Rs 560 million in 2000. Its success attracted many players, including Godrej (FairGlow) and Paras Chemicals (Freshia). Existing products like Emami Naturally Fair and F&L were promoted with renewed vigor.
In December 1999, Godrej launched FairGlow fairness soap and created a new product category. The soap claimed to remove blemishes to give the user a smooth and glowing complexion. FairGlow was positioned as a twin advantage soap – a clean fresh bath and the added benefit of fairness. In early 2000, Godrej Soaps launched Nikhar, which was based on the ancient Indian formula of milk, besan and turmeric. Though Nikhar and FairGlow were positioned differently – Nikhar targeted fairness and FairGlow claimed to protect skin naturally – the objective of both was the same, get more of a stagnating market.
In April 2000, HLL introduced Lux Skincare soap, positioned on the sunscreen platform. Priced at Rs.14 for a 75gm cake, it was able to garner only a 0.5% share by 2000 end. In comparison, the mother brand Lux had a share of 14%. Retailers claimed that sales for the Lux variant were poor as it promised only protection from ultraviolet rays. While this soap prevented one from growing darker, it did not promise to enhance the complexion.
By 2000 end, F&L cream seemed to be losing ground not only to other creams but also to FairGlow soap. The switch from cream to soap was largely because soaps were perceived to be less harmful to the skin than cream. HLL did not have a product in its soap portfolio for this segment, and this was where Godrej seemed to have gained. However, in 2001, HLL followed Godrej’s footsteps and launched Fair & Lovely Fairness Soap. This intensified the competition. F&L’s extension into soaps was in tune with HLL’s strategy to develop and grow the premium segment of the market.

70
Marketing Management
Since the growth in the toilet soap market had slowed down, the industry felt that premium soaps would re-energise the market. Sangeeta Pendurkar, Marketing Manager, HLL, said, “ We are targeting the 50,000 tonne premium soaps market with F&L. We believe F&L soap will synergise with F&L cream as research reveals that the usage of both will deliver better fairness.” Analysts felt that though FairGlow had the first mover advantage, F&L soap’s growth potential could not be underestimated given the strong equity of the mother brand.
In 1999, HLL and CavinKare hiked the price of F&L and Fairever by Re. 1 from Rs.25 and Rs.26 respectively. In 2000, Fairever was back to its original price to maintain price parity. Many stockists said that this was done to push the product against F&L. A stockist commented, “The company was trying out this price to compete with F&L and other new brands that have come in. But we did not see higher sales due to this and the company reverted to its original price.” During 2000-01, while the fairness cream market was growing at an average of 15% Fairever’s growth had slowed down. Analysts felt that this was mainly because Fairever was priced higher than competing products.
Meanwhile, in January 2000, HLL filed a patent infringement suit for Rs.100 million in the Kolkata High Court against CavinKare Ltd. HLL alleged that CavinKare was using its patented F&L formula without its knowledge or permission. HLL obtained an ex-parte stay on CavinKare, but CavinKare got the stay vacated in a week’s time. It also filed a patent revocation application in the Chennai High Court and defended the suit on the grounds that HLL’s patent was not valid. CavinKare further claimed that the ingredients contained in the composition were ‘prior art’ and that the new patent was not an improvement of the earlier patent, which had expired in 1988.
In September 2000, the companies suddenly opted for an out-of-court settlement. CavinKare gave an undertaking to the court that the company would not “manufacture and/or market either by themselves or by their agents any fairness cream by using silicone compound in combination with other ingredients covered in patent no. 169917 of the plaintiff (HLL), namely Niacinamide, Parsol MCX, Parsol 1789, with effect from September 15, 2000.” HLL also gave an undertaking that it would not interfere with the sale of the cream manufactured on or before September 15, 2000, lying with the wholesalers, re-distribution stockists, and retailers.
PROMOTIONAL WARS
During 2000-01, with major players entering the market, the existing products were promoted with renewed vigor through price reductions, extra volumes, etc. Many products were marketed aggressively. While F&L advertisements projected fairness comparable to the moon’s silvery glow, FairGlow offered the added benefit of a blemish-free complexion.
But Fairever, which sold at a higher price, did not initiate any promotional activities. B. Nandakumar, President (Marketing) CavinKare, explained, “We will not tailor our product to the competition. We’ll do so for the consumer. Freebies are not the only way to garner sales.” However, analysts believed that CavinKare did not undertake any promotional activities due to lack of financial muscle.
On February 14, 2000, as a part of its promotional activities, Godrej Soaps announced the ‘Godrej FairGlow Friendship Funda’5 in various colleges in Maharashtra. In August 2000, it launched the ‘FairGlow Express,’ the first branded local train in India,
5 ‘Friendship Funda’ was a system for delivering messages on Valentine’s Day. About 50,000 cards were distributed so students could write their Valentine’s Day love messages. Special mailboxes for collecting these cards were spread out over 50 different campuses. The cards were collected, sorted, and handed over to the addressees.

71
Fairness Wars
in Mumbai, in partnership with Western Railways. In December 2000, Godrej took its FairGlow brand to the web by launching www.fairglow.com. Later, it launched a unique online promotional scheme – ‘the FairGlow Face of the Fortnight.’ Every fortnight, one winner was selected and showcased on the website. The winner also won prizes like perfume hampers, gold and pearl jewellery, holiday for two etc. In early 2001, Godrej Soaps also launched its FairGlow cream in an affordable sachet (pouch pack). The 9gm sachet was priced at Rs. 5, and claimed to give around 15-20 applications per pack. It was initially launched in South India, and was expected to enter other markets very soon.
THE WARS CONTINUE UNABATED
In early 2001, three major players – HLL, CavinKare and Godrej – competed fiercely
to penetrate the market further with their attractive schemes. A growing number of
pharma and OTC drug companies like Emami, Ayurvedic Concepts, Paras etc. also
entered this segment. Companies were also facing competition from Amway, Avon,
Modicare etc., which were into direct selling. The market was seeing a major
convergence of product categories with the emergence of more and more variants to
fill every conceivable niche.
This heightened competition forced companies to increase their advertisement spends.
HLL re-launched F&L and quadrupled its advertising expenditure. CavinKare more
than doubled its ad spends from Rs.215 million in 1999 to Rs.500 million in 2001.
Godrej and Emami too planned to raise their ad spends. But even as ad spends
increased, fakes entered the market. Fair & Lovely’s fakes were rampant with names
like Pure & Lovely and Fare & Lovely. Fairever's copies were Four Ever, For Ever or
Fare Ever.
In early 2001, HLL launched Nutririch Fair & Lovely Fairness Reviving Lotion to
protect its brand from any threat in the premium segment. The new product was
claimed to be scientifically formulated to protect the skin from harmful ultraviolet
rays and enhance natural fairness. The new formula, containing Triple UV Guard Sun
protection system and the fairness ingredients Vitamin B3 and milk proteins,
promised to restore and protect the natural skin colours from the sun’s darkening
effects. The product was also claimed to contain Niacinamide making it the only
patented formula fairness cream. It was targeted at women in the age group of 18-35
and was priced at a premium. A 50ml pack was priced at Rs.38 and a 100ml pack at
Rs.68. HLL also launched ‘Pears Naturals Fairness cream’ at the same time.
By mid 2001, the fairness concept was no longer restricted to creams and soaps, but
had expanded to talcs also. Emami was test marketing a herbal fairness talc in the
South. The rapid expansion of the fairness business had two consequences: cutthroat
competition and a flurry of copycats. Every company - from the market leader to the
new entrants – was forced to rethink its marketing strategies, spend lavishly on
advertisements, and even seek legal action against unfair claims.
Even though there was no scientific backing for the manufacturer’s claims that their
products enhanced fairness, prevented darkening of skin, or removed blemishes, sales
of fairness products continued to gallop. Dr R.K. Pandhi, Head of the Department of
Dermatology, AIIMS, Delhi, said, “I have never come across a medical study that
substantiated such claims. No externally applied cream can change your skin colour.
Indeed, the amount of melanin in an individual's skin cannot be reduced by applying
fairness creams, bathing with sun-blocking soaps or using fairness talc.”
In 2001, the organised market of branded fairness cream products was worth about Rs
6 billion. The unbranded and fakes market was estimated to be Rs 1.5 billion. The

72
Marketing Management
market was big and the potential was even bigger. In India, beauty seemed to be
associated with fairness more than with anything else. With such an attitude firmly
entrenched in the minds of millions of people, the fairness products market would see
fair days ahead.
Questions for Discussion:
1. Though CavinKare’s Fairever was an instant success, its market share stagnated
after two years of its launch. How can CavinKare increase Fairever’s market
share?
2. “In the early 1970s, fairness products were offered in the form of creams. By
2000-01, the fairness concept was no longer restricted to creams, but had
expanded to soaps and talcs also.” Discuss.
3. HLL’s Fair & Lovely was the pioneer in the fairness products segment, and ruled
the market until 1998. After 1998 it started losing its share to new entrants and
direct selling companies. Explain the steps taken by HLL to regain its position in
the fairness products market.
© ICFAI Center for Management Research. All rights reserved.

73
Fairness Wars
Additional Readings and References:
1. Sinha Shuchi, Fair & Growing, Financial Express, January 2001
2. Manjal Shilpa, Nothing’s Forever, Business Standard, July 14, 2001
3. Barua Vidisha, High Court orders in favour of Fairever, Business Standard, January 31, 2001
4. HC curbs sale of Cavinkare Product, Economic Times, January 25, 2000
5. Basu Jaya, Who’s the fairest of them all?, Business Today, July 7-21, 2000
6. HLL, CavinKare settle dispute on Fairever cream, Business Standard, September 1, 2000
7. Chandrasekaran Anupama, Overambitious?, Business Standard, March 7, 2000
8. Dua Aarti, FairGlow creates stir in soap market, Business Standard, April 7, 2000
9. Krishnamurthy Narayan, When Brands Mean the World, A&M, November 15, 2000
10. Biswas Rajorshi, CavinKare eyes Rs.200 crore sales in this fiscal, Business Standard, Novermber 16, 1999
11. Beauty Cosmetics to alter name, Financial Express, September 2, 1998
12. Rath Anamika, Who’s the fairest of them all?, Business World, March 22, 1998
13. www.fairglow.com
14. www.cavinkare.com

Ujala – The Supreme Whitener
“He wears only white and swears by white. At a time when Hindustan Lever
managing director M S Banga is busy pruning his portfolio of brands, our man is marching ahead with expansion plans in the fast moving consumer goods (FMCG)
sector. That’s MP Ramachandran, chairman and managing director of the Rs 2
billion1 Jyothi— the man behind the magic fabric whitener brand Ujala.’
- The Economic Times, July 2001.
SHAKING THE MARKET LEADER
By the end of 2002, Ujala, a fabric whitener2 from a company named Jyothi Laboratories (Jyothi) based in Andheri, Mumbai, had emerged as the market leader in the whitener segment of the Indian fabric care industry. What was noteworthy about Ujala’s achievement was the fact that it had gained most of its market share in the segment, by eating into the erstwhile leader, Robin Blue’s sales. Robin Blue was marketed by one of the country’s leading fast moving consumer goods (FMCG) companies, the Reckitt Benckiser subsidiary, Reckitt & Coleman (R&C)3.
By the beginning of 2002, Ujala had emerged as one of the few brands in the Indian FMCG sector that was posting handsome growth figures despite stagnation in the sector as a whole. A survey conducted by ORG-MARG (a market research organization) showed that the sales turnover of the consumer goods industry had fallen by 2.5% in January-February 2002 in comparison to the same period in the previous year. Of the categories analyzed by the ‘ORG-MARG All-India Retail Audit,’ only 12.5% showed positive growth.
However, the survey also showed that despite this downturn, brands owned by smaller FMCG companies fared better than their bigger counterparts. Names such as Gold Winner, Ghari, Gemini, WaghBakri, AllOut, and Ujala had found a place in the list of top brands that had successfully beaten the downturn. Their success reflected a major shift in the FMCG sector. A decade back, brands owned by multinationals had ruled the roost, and smaller brands had been content with a niche market. However, from the late-1990s onwards, smaller brands had started to threaten the bigger players in many product categories. Ujala was one of these smaller brands which had
1 In February 2003, Rs 48 equaled 1 US $. 2 Also called post wash fabric whiteners or optical whiteners, fabric whiteners are used to
brighten white clothes after they have been washed. These whiteners are available in two varieties, powder and liquid. They are dissolved in water and then clothes are soaked in the solution for a few minutes and then dried. Such whiteners are popularly known as ‘neel’ (a Hindi language term for the word ‘blue’) in India.
3 R&C (now Reckitt Benckiser India Ltd.), is a 51% subsidiary of Reckitt Benckiser Plc, a company formed by the global merger of Reckitt & Coleman Plc and Benckiser Plc in December 1998. Reckitt’s presence in India dates back to 1934 when a group company Atlantic East Ltd. (AEL), started operations in India. Initially, the Company was engaged in trading activity. Over the years, it set up manufacturing facilities. Reckitt & Coleman India (RCI) was incorporated in 1951 to take over manufacturing operations of AEL. The trading activities of RCI and the operations of AEL were merged in 1969. RCI was a wholly owned subsidiary of Reckitt & Coleman UK till 1970 when it offered shares to the Indian public to reduce the foreign holding to 70%. The parent company’s holdings were further reduced to 40% in 1977. However, the parent hiked its stake to 51% in 1994. The company’s name was changed to Reckitt Benckiser in 1999 to reflect the change in global parentage. It has a presence in several niche segments such as household cleaners, surface care, shoe care and insecticides.

75
Ujala – The Supreme Whitener
successfully overtaken the erstwhile market leader Robin Blue and caught the attention of marketing experts, the media and the public.
ABOUT FABRIC WHITENERS
Fabric whiteners, which are classified as ‘laundry aids,’ complement the use of detergents by making clothes whiter. Fabric whiteners can be further classified as bleaches and blues. Bleaches whiten and brighten fabrics and help remove stubborn stains by converting the dirt into colorless, soluble particles that can be easily removed by detergents. A variety of different bleaches, with different chemical compositions, are available in the market (Refer Table I).
Table I
Different Types of Bleaches
Type of bleach Use Best as…
Chlorine (Liquid or Gel)
Removes stains, whitens and brightens; repeated use weakens fabrics
Disinfectant, whitener
Hydrogen Peroxide Removes stains, whitens Milder solution able to whiten fabrics
Oxygen Removes stains; Safe for most colored fabrics
Color removers Reduce or completely removes colored dyes from apparel
Removing rust or dye stains from white apparel
Source: Kansas State University Agricultural Experiment Station and Cooperative Extension Service.
Blues, or optical brighteners, contain a blue dye or pigment or a solution of fine blue powder. During the washing process, the fabric picks up the blue color, which makes it ‘appear’ whiter. Optical brighteners work on the principle that ‘white with a little blue tint appears to be brighter4’ (if two similar white fabrics are kept under a spectrograph, the one with a blue tint would appear brighter).
The popularity of blues in India is rooted in the country’s societal system and cultural values. The cleanliness of clothes has traditionally been regarded as an indicator of the efficiency of the housekeeper, that is, the lady of the house. Consequently, most of the detergents in the country were sold on the ‘our product washes the whitest’ platform. A majority of the detergent and washing soap advertisements emphasized whiteness and featured literally ‘shining’ white clothes as a symbol of the housewife’s prowess.
Shombit Sengupta (Sengupta), an international brand strategist, attributed the above phenomenon to the attitude of Indians regarding laundry. According to Sengupta, washing was regarded as a chore in the West, while Indians reportedly had a ‘more holistic relationship’ with this task, as laundry was done everyday. Since blues happened to make clothes whiter, Indian households used them frequently. Also, unlike the West, where the concept of the unified detergent had emerged, in India blues continued to be used separately after clothes had been washed. Sengupta said, “The concept of a unified detergent in India would always be a problem, which is why products like Robin would always be a necessity in the marketplace.”
Despite the widespread use of blues, the Indian fabric whitener market was highly fragmented. Most of the players were small manufacturers who sold their products at
4 The human eye sees objects because of the light reflected by them. When light falls on an object, it absorbs the full spectrum of the light and throws back only a part of it. The color of an object is perceived according to the part of the spectrum reflected by it. The blue tint on white fabrics absorbs the yellow part of the spectrum, thereby making the yellowish tint invisible. This makes the cloth look whiter.

76
Marketing Management
very low prices. R&C, the first player in the organized sector, dominated the market for years with its Robin Blue powder. The brand’s popularity grew to such an extent that over time, the term ‘blue’ became synonymous with the name Robin. Though other organized sector brands like Ranipal were also available, they remained confined to limited geographical areas and posed no significant threat.
Since Robin enjoyed a smooth run, R&C did not make any major marketing efforts to promote the brand. While Robin continued to be used by a limited number of ‘brand-conscious’ urban consumers, the rural masses continued to use locally manufactured blues. The entry of Ujala into the market in 1983 did not attract much attention – perhaps, Robin saw it as ‘just another’ local brand. However, in the years to come, Ujala went from strength to strength – all due to the sustained and focused efforts of Jyothi’s promoter M P Ramchandran (MPR).
BACKGROUND NOTE
The story of Jyothi can be traced back to M P Ramchandran (MPR), an accountant in a chemical company in the suburbs of Andheri, Mumbai (Maharashtra). MPR had developed a formula for fabric whiteners in 1960 since he was not satisfied with the products available in the market at that time. For many years, he looked for an opportunity to market his formula (his whitener, unlike the blue powders available in the market, was a violet colored liquid that dissolved easily in water). In 1972, MPR set up a small factory in Guruvayoor in Kerala, with the help of one of his acquaintances at the chemical company. The first batch of whiteners, named Ujala, consisted of only 500 bottles, and was sold mostly to MPR’s friends. These customers found the whitener to be very effective and came back again and again to buy more.
MPR continued to manage his small venture along with his job for more than a decade. Finally, in 1983, he left his job to concentrate fully on the whitener business. Jyothi was thus born with a capital of Rs 5000 and just five employees. In an attempt to create a market for Ujala in Mumbai, MPR continued to work from Andheri, although the factory was located in Kerala. The initial days were hard, with no demand in sight. At one point of time, MPR had even decided to close down operations. An unexpected order of 1000 bottles from a small shopkeeper near Guruvayoor changed it all. Ujala never looked back again.
Over the years, Jyothi registered a growth rate of 50% per annum. The factory in Kerala was expanded, and in 1991 Jyothi set up another factory at Pondicherry with a capacity of 5,00,000 bottles a day.5 By that time, Ujala had become the market leader in South India, thanks to its superior product characteristics. Jyothi concentrated on the southern market until 1998, when it went national. By then it had captured 90% of the market in Kerala and Tamil Nadu. Within a year it captured 25% of the Rs 2 billion organized sector fabric whitener market in the country.
This development brought Ujala on par with Robin Blue, which also had a 25% share
of the market. Alarmed at the rapid erosion in Robin’s market share and Ujala’s
growing popularity, R&C decided to reinvigorate Robin. In 1999, the company
changed Robin’s logo, launched a liquid variant of Robin Blue named Robin
Dazzling, and invested substantially in promotion and advertising. However, Robin
Dazzling had a low sales off take. R&C then came up with another variant, Robin
Sunglow, which again received a lukewarm response in the market.
Meanwhile, the market saw more action with the Pidilite group of Industries6 (Pidilite)
purchasing the Ranipal brand, which had a market share of around 1% from IDI7 for
5 By 2002, the company had nine factories with a total capacity of 2 million bottles per day. 6 Pidilite is India’s largest manufacturer of consumer and industrial adhesives and sealants. Its
other product lines include art materials, construction/paint chemicals, industrial and textile

77
Ujala – The Supreme Whitener
Rs 40 million. Pidilite relaunched and repositioned Ranipal with a new logo and new
packaging. The company also pioneered the concept of selling fabric whiteners in
sachets.
In 2000, Jyothi transformed itself from a proprietary concern to a corporate entity.8 In 2001, the blue market was estimated to be about Rs 4 billion, of which around 75% was dominated by the liquid variety. The market for blue powder was shrinking. Interestingly, Ujala’s market share kept rising in spite of the fact that it was priced higher than Robin.9 It was able to capture more than 60% of the market, while Robin Blue, lagged behind with a mere 6% market share (the remaining 34% was in the hands of local manufacturers).
Ujala’s impressive success was clearly the result of a well-planned and executed marketing plan coupled perhaps, with a bit of luck and good timing. The whitener became one of the few small-time brands to become so popular in the intensely competitive Indian FMCG market.
MARKETING UJALA
Ujala was lucky in that the Robin brand did not receive sufficient marketing support from R&C. By the time Ujala entered the market, Robin had become an old-fashioned brand that lacked ‘visibility, readability and proximity’ in spite of its initial popularity and strong performance. Although at one point of time, Robin had become a generic name for blues, its brand equity was nearly dormant. This gave Ujala ample scope to become strong enough to be able to transfer the value of ‘blue’ to the color violet.
Ujala also owned its success to Jyothi’s management style. After comparing the management style of Jyothi with that of its nearest competitor R&C, analysts commented that the former, with ‘no share price worries’ and ‘no foreign parent to please,’ was able to connect with the ground realities. As a result, Jyothi’s products were more suited to local and regional markets.
Ujala’s liquid whitener, the first innovative product in the fabric whitener segment, offered consumers a number of advantages over its ‘powder blue’ counterparts. Unlike the powder versions, liquid whitener was easily and uniformly soluble in water, thus giving much better results. Instead of dissolving in the water, powder blues often formed clots, leading to wastage. Since Ujala was a liquid, it did not have any such disadvantage (while Robin sold ‘Ultramarine Blue,’ Ujala was an ‘Insta-Violet Concentrate’ that was essentially acid milling violet).
Another aspect, which helped Ujala gain market share, was its focus on rural markets, the primary markets for fabric whiteners. The fact that Robin had neglected this market and remained primarily an urban phenomenon worked to Ujala’s advantage. Jyothi’s rural distribution network, which made Ujala available through 4,000 distributors and 2.5 million retailers across the country, was considered to be one of the strongest in India.
Commenting on Jyothi’s ‘Indian way of doing things,’ Ullas Kamath (Ullas), Director (Finance), said, “A general manager in a multinational probably has the same function
resins, and organic pigments and preparations. Its largest brand Fevicol is synonymous with the adhesive category. The company has 40 brands spanning 400 industrial and consumer products.
7 Indian Dyestuff Industries (IDI), a Mafatlal Group company. 8 In 2000, Jyothi sold 10% of its stake in the company to ING Barings, which is a part of the
ING Group, a global financial institution of Dutch origin offering banking, insurance and asset management to over 50 million private, corporate and institutional clients in 65 countries.
9 While a 75ml pack of Ujala was priced at Rs 8, Robin sold the same volume at Rs 7.

78
Marketing Management
of a field staff in our organization.” The field staff of the organization enjoyed a close relationship with shop owners throughout the country. Ullas remarked that this strategy of direct marketing, which Jyothi had followed from the very beginning, had paid off handsomely. The company did not rely on surveys done by research firms even for market information on products. Instead, it always utilized its vast network of field staff to regularly collect information from the market. This formed its basis for market intelligence.
Ujala’s initial success came through word-of-mouth publicity. Later, the advertising account of the company was handled by the Mumbai-based advertising agency Situations Advertising and Marketing Services. Innovative radio advertisements made the brand quite popular in the states of Kerala, Tamil Nadu and Karnataka. Ujala followed a common advertisement theme for the country as a whole, but ‘regionalized’ the content of the advertisements in terms of the language used and (sometimes) the models employed.
Jyothi spent a lot on advertisements that were broadcast over FM radio channels and the state-owned All India Radio (AIR). A considerable amount was also spent on television (TV) advertising. The TV advertisements for Ujala were aired frequently on almost all the leading TV channels in the country, leading to high brand recall (Refer Exhibit I for an Ujala TV commercial). Jyothi did not set a limit on its advertising budget as long as it was found to be helping the brand. MPR said, “We do not wish to disclose our advertising budget, but we believe in going to any extent and to continue for any number of years as long as the brand clicks.”
The jingle devised for Ujala became very popular and media reports revealed that many people found themselves singing it consciously/unconsciously! The jingle ‘Aya Naya Ujala, Char Boondon Wala’ (a Hindi language phrase) literally meant, ‘Here Comes the New Ujala, Only Four Drops Are Required.’ The jingle drove home the idea that only four drops of Ujala were required to whiten clothes as compared to the higher quantity required while using other brands.
Robin countered the above claim, stating that less Robin liquid was required as compared to Ujala, to whiten clothes. Its advertisements argued that since four drops of Ujala had to be added per liter of water, 32 drops of Ujala would be required for a normal (8 liter) bucket of water, which was far more than the amount of Robin liquid required for a similar wash. However, this claim failed to make an impact on consumers.
Though its advertisements were very effective, Jyothi landed in trouble because of them quite often and had to deal with criticism from the advertisement fraternity. The company’s decision to use comparative advertising for Ujala resulted in a major controversy in 1999. The controversial TV advertisement (aired in Bengali) explained why ‘neel’ (‘blue’) should never be used and showed another whitener brand as ‘inferior’ to Ujala. The whitener shown to be inferior resembled Robin Blue. R&C filed a suit in the Kolkata high court claiming that Jyothi’s TV and print advertisements denigrated its product by claiming superiority over blues.
R&C argued that the term ‘neel’ used by Ujala referred to Robin Blue as in the local market people often referred to it as ‘Robin Neel.’ R&C also argued that Jyothi’s claim to have invented Ujala was misleading, as the ingredient (acid milling violet) was already known. On basis of these arguments, R&C filed a case under Section 36A of the Monopolies and Restrictive Trade Practices Act 1961 (MRTP).10
10 Under the MRTP act, an organization can be charged with indulging in unfair trade practices if it is found that for the purpose of promoting its sales, it gave false or misleading facts about the goods, services or trade of another person. In addition, an organization can be booked under MRTP, if it falsely represents its goods to be of a particular standard, quality, grade, composition, style or model.

79
Ujala – The Supreme Whitener
However, the court decided that there was no authenticated survey to verify that Robin Blue was also known as Robin Neel. It further stated that even if for the sake of argument it accepted that Robin Blue was indeed called Robin Neel, the word ‘neel’ used in Ujala’s advertisement could not be equated to Robin Neel. The court also decided that there had been no misrepresentation of facts by Jyothi, as it had never claimed to have invented insta-violet concentrate. Jyothi had only claimed to have developed the formula of Ujala. The court declared that such a claim could not be called misleading or regarded as a misrepresentation of facts and decided the case in favor of Jyothi.
In another advertisement, Ujala depicted a group of kids teasing a fellow student because her uniform was not dazzling white. This advertisement met with criticism from the advertising fraternity. The use of children in this advertisement was considered quite unnecessary. According to Suguna Swamy, Creative Director of leading advertising agency, Ogilvy & Mather (Chennai), “The Ujala campaign does not make any sense. No kid will ever ask his friend whether he has switched over to a whitening product such as Ujala.” Jyothi was criticized for using ‘peer group pressure’ and ‘social embarrassment’ in its advertisements.
Despite these minor problems, Jyothi continued to have a dream run with Ujala. By 2001, the company had grown significantly: it employed about 5000 people, of which 1200 were field staff distributed all over the country. In 2001, the company decided to enter the FMCG market in a big way through personal care products. In the same year, Jyothi planned to make an initial public offering to raise about Rs 1-1.2 billion to fund its expansion and diversification plans.11 Till then, it was a closely held company with only some investment from ING Barings, and Ujala was the only brand in its portfolio. Commenting on this decision, MPR said “We plan to launch at least 2-3 new brands every year and want to become a full-fledged FMCG player.”
WHAT LIES AHEAD
In the early 21st century, Jyothi launched a number of different products in the FMCG category. In 2000, it launched ‘Exo,’ a dish washing bar and soon extended it to a dish washing scrub. The company entered the mosquito repellent market in 2001, with the brand ‘Maxo’ coils. It planned to extend this brand to a liquid vaporizer in the future. In the same year, Jyothi entered the incense stick market through the ‘Maya’ brand. While Exo was made available only in a few southern states, Maxo and Maya were marketed across the country. Maxo managed to gain a 20% share of the market in its category, but the performance of Maya and Exo was reportedly much below Jyothi’s expectations.
In line with its diversification plans, Jyothi took over Tata Chemicals’ detergent unit in Pithampur, Madhya Pradesh, for about Rs 40 million in 2001. After this, it was rumored that Jyothi intended to take over Tata Chemicals’ ‘Shudh’ brand of detergent. Meanwhile, undeterred by the lackluster performance of its recent launches, Jyothi entered the very competitive bathing soaps segment with Jeeva, an Ayurvedic soap in 2001.12 As with Ujala, the new brands were promoted vigorously. For Jeeva, Jyothi turned to celebrity endorsement for the first time, using Simran, a popular South-Indian movie star.
11 The plan for raising money through an IPO was later abandoned and Jyothi decided to sustain itself on internal accruals.
12 Ayurveda is a traditional alternative medical system that was developed in India over 5000 years ago. The system works on the premise that diseases are the result of living out of harmony with the environment and seeks to heal by re-integrating an individual’s mind and spirit by tackling the various basic elements that the human body is comprised of. Ayurvedic soaps are made of herbal ingredients and are marketed on health and purity platforms.
80
Marketing Management
However, none of the new brands managed to generate as much excitement as Ujala. This prompted analysts to state that while diversification was necessary given the fact that the fabric whitener market seemed to have reached saturation point, the company could not expect to have an easy run. Many analysts felt that the company would not be able to replicate the success of Ujala in any of the new segments it had entered.
When Jyothi entered the fabric whitener segment, it had to contend with only one national-level player. But the new segments it had entered into were already dominated by many strong brands. In the dish washing segment, it had to face ‘Vim,’ which was brought out by the country’s number one FMCG company, the Unilever subsidiary Hindustan Lever Ltd. (HLL13); and in the mosquito repellent segment it had to deal with formidable brands such as ‘All-Out,’ ‘Tortoise’ and ‘Good Knight.’ In the soaps category, Jyothi seemed to have played it safe by entering a niche segment – however, even here, popular brands ‘Hamam’ and ‘Medimix’ were expected to give Jeeva a tough time.
Meanwhile, in October 2002, ARIA Investment Partners L.P, CDC Financial Services (Mauritius) Limited, and South Asia Regional Fund14 collectively invested about Rs 1.3 billion in Jyothi. The investment was one of the largest non-technology private equity transactions in India in that calendar year. The move suggested that the new investors trusted Jyothi to ‘pull off an Ujala’ in the new categories it had entered into. Whether the company would be able to do so or not was something only time would tell.
Questions for Discussion:
1. Analyze the conditions prevailing in the Indian fabric whitener market when Jyothi Laboratories entered the whitener segment. Focusing separately on each element of the marketing mix, explain how and why the company’s moves helped Ujala become the market leader.
2. With R&C planning to continue its efforts to regain Robin’s lost glory and Pidilite promoting Ranipal aggressively, what do you think the future has in store for Ujala? What measures would you recommend to help Ujala maintain its leadership status?
3. Critically comment on the rationale underlying Jyothi’s decision to diversify into other segments of the FMCG sector. Do you think Jyothi will find it difficult to replicate Ujala’s success with its new products? Justify your answer.
© ICFAI Center for Management Research. All rights reserved.
13 In 2001, HLL shifted its fabric whitener brand ‘Ala’ under one of its major fabric care brands, ‘Rin.’ This move was accompanied by the brand’s relaunch with new packaging and new promotional thrust. Though Ala was not a ‘blue’ and was classified as a ‘bleach,’ it rapidly gained popularity as a fabric whitener due to HLL’s strong marketing support.
14 ARIA Investment Partners, L.P is a pan-Asian private equity fund which backs the expansion of successful businesses across Asia. CDC Financial Services (Mauritius) Limited and South Asia Regional Fund are both affiliates of CDC Capital Partners, a leading private equity investor focusing on Indian and India-focused companies. CDC Capital Partners has a $ 250 million portfolio of over 50 investments across a wide range of companies.

81
Ujala – The Supreme Whitener
Exhibit I
An Ujala TV Commercial
The husband is disgusted with the blue spots made by ‘neel’ on his white shirt.
Two women wearing sparkling white sarees enter with a bottle of Ujala in hand. In the background the jingle ‘Aya naya Ujala, char boondon wala’ can be heard.
One of the ladies thrusts the bottle towards the viewers as she explains the benefits of using Ujala.
The advertisement goes on to explain how Ujala should be used while the camera focuses on the easy solubility of the liquid.
The wife is astounded with the results. The brightness of the clothes is reflected on her face.
The husband is very happy with his ‘sparkling’ shirt.
The ad ends with the image of a stack of sparkling white shirts and a bottle of Ujala besides them. The catch line says ‘Safedi ka naya rang’ that is, ‘the new color of brightness.’
Source: www.xposeindia.com

82
Marketing Management
Additional Readings & References:
1. Apex Court Verdict Helps Jyothi Labs Edge out Reckitt & Colman,www.expressindia.com, May 15, 1999.
2. Reckitt & Coleman Gives Robin A ‘Dazzling’ Facelift, www.expressindia.com, June 9, 1999.
3. Ujala Corners 60% Market Share, www.domain-b.com, January 2001.
4. Jyothi Labs Plans IPO to Fund Plans for New Brands, Hindu Business Line, February 15, 2001.
5. Reckitt Test-Markets One More Fabric-Care Brand in the South, Financial Express, March 21, 2001
6. No Kidding, Ads are for Kids, The Hindu Business Line, November 10, 2001
7. Jyothi Labs to Buy Tata Chemicals’ Shudh, Financial Express, January 29, 2002.
8. FMCGs Still On a Crawl, Smaller Brands Fare Better, The Economic Times, April 24, 2002.
9. Smaller FMCG Brands Make a Splash, The Economic Times, April 24, 2002.
10. ARIA & CDC Invest in Jyothi Laboratories Limited, www.clsa.com, October 16, 2002.
11. www.indiainfoline.com
12. www.pgmba.com
13. www.economictimes.com
14. www.expressindia.com

Revamping Rasna – A Marketing Overhaul Saga
“At Rasna we are constantly looking at new innovations and strategies. Today, the per capita consumption of Rasna is 15 glasses and our vision is to increase the per capita consumption to 100 glasses by 2005 and to reach out to one billion Indians every year.”
- Piruz Khambatta, Chairman and Managing Director, Rasna Ltd., in March 2002.
NO MORE ‘I LOVE YOU RASNA’
Pioma Industries Ltd. (Pioma) is perhaps not a familiar name for the average Indian consumer. However, Pioma’s brand ‘Rasna’ is very well known. In fact, the name Rasna is almost a generic name for soft drink concentrates (SDC), a segment that had been created and nurtured by the company in the Indian beverages market. Rasna’s extremely popular advertisements with the tagline, ‘I love you Rasna,’ had become an integral part of the Indian advertising folklore. In March 2002, Pioma announced a radical overhauling of its strategies for the Rasna brand. This development was rather unexpected, as the brand had been lying dormant since long.
Company sources revealed that these developments were in line with a restructuring program that had been conceptualized in mid-2001. Keeping in line with this plan, Pioma launched two new brands, Rasna Utsav (Rasna Festive) and Rasna Rozana (Rasna Daily) in March 2002. The launch was accompanied by a multi-media advertisement campaign, for which the company allocated Rs 160 million.
The television campaign that ran across all major national and regional channels featured a ‘song’ exclusively composed for the new launches. A notable feature of this commercial was the fact that it was voiced by one of the country’s most well known singers, Asha Bhonsle, who had never sung for any commercial before. Pioma soon released music cassettes and CDs featuring remixes of old, popular Hindi songs and the new Rasna song. In addition to this, the company sponsored musical events across the country.
Industry observers were however, viewing the above developments as Pioma’s desperate attempts to infuse fresh life into Rasna. There were apprehensions regarding its success given the fact that previous attempts in form of brand extensions had failed to have any significant impact on Rasna’s growth prospects. And unlike the late 70s, the average beverage consumer in India had a host of other options, such as colas, fruit juices, iced tea, tetrapacked juices and other soft drinks.
Most importantly, Rasna’s stronghold in the SDC market was facing severe competition from Coca-Cola’s newly launched ‘Sunfill’ and Dr. Morepen’s ‘C-sip’. Rasna’s fading ‘brand awareness’ and its lacklustre image had become major hurdles, capable of marring the prospects of the new marketing overhaul exercise as well.
THE MAKING OF RASNA
Pioma, an Ahmedabad (Gujarat) based company was the first to introduce the concept of SDC in India. Its proprietors, the Khambattas saw a huge untapped potential in the market with Coca-Cola, an MNC cola major, on the verge of closing all its operations in India, due to policy changes with regard to MNCs operating in India. At that point of time, there were no major players in the preparatory SDCs market. Pioma thus

84
Marketing Management
launched an SDC under the brand name ‘Jaffe’ in 1976 and marketed it with the help of Voltas. The brand name was changed to Rasna in 1979.
Rasna’s SDC, comprised a powder sachet and a small bottle of thick, coloured liquid. While the powder provided the taste, the liquid gave the flavor. These ingredients had to be mixed with a specified amount of water and sugar. The resulting syrup could then be used over a period of time by mixing it with water. Though many analysts felt that Rasna’s do-it-yourself concept would be cumbersome and hence unappealing to consumers, it became the very reason for its success. This was because Rasna was able to exploit the Indian middle class housewife’s traditional distrust for food and drink not made at home.
Not only was Rasna easy to prepare, it was reportedly the first brand in the country that provided consumers real fruit-like flavor and taste. And at only 50 paise per glass, it was easily one of the most affordable drinks available in the market. With many popular flavors such as Pineapple, Orange, Mango and Lime becoming runaway successes, Rasna soon established itself as an effective alternative to other products such as squashes, soft drinks and syrups.
Pioma had eight factories that manufactured its SDC – five in Gujarat, two in Silvassa and one in Punjab. The company had a dedicated R&D team in Ahmedabad (Gujarat) to support its policy of launching new flavors in quick succession. The division was constantly involved in monitoring new flavor developments, controlling quality, innovating new flavors at regular intervals and analyzing new flavors at regular intervals. As a result, many new flavors were launched over the years. In addition to the standard fruity flavors, Rasna was made available in many local flavors such as ‘Kala Khatta’ (tangy), ‘Khus’ and ‘Rose’ that became very popular.
To ensure high quality standards, Rasna’s products were manufactured in a totally automated environment. Advanced world-class technology was used for packaging. The packs were pilferage-proof with moisture-resistant lining, thus, retaining both flavor and freshness.
One of the major factors responsible for Rasna’s rapid sales growth was its well-entrenched, efficient sales and distribution network covering the entire country. The sales force was managed by the company’s five regional offices, which ensured availability of Rasna products to consumers in the retail outlets nearest to them. During summer, when the sales of the company soared, Pioma recruited additional sales force on a temporary basis to ensure availability of the products. The company had 24 warehouses in various parts of the country, 24 distributors and 2000 stockists. These stockists served over 2,00,000 retail outlets directly and over 2,00,000 retail outlets indirectly via wholesalers. Reportedly, Rasna’s product range was one of the world’s largest distributed food brands at that time.
To retain the interest and loyalty of its consumers, the company undertook various creative promotional activities. These included shop sampling, house-to-house calls, and live demos on the method of preparation, retail window displays, gift offers to customers and other trade schemes. The company devised innovative methods every year to sustain the element of fun and surprise. In addition, Pioma participated in various exhibitions and fairs that provided an excellent opportunity for direct interaction with the consumers. The fairs also helped the company increase its visibility in the rural markets by distributing large number of free product samples to consumers in the fairs.
Above all, Rasna’s advertisement campaigns helped it become a trusted and popular brand amongst Indian consumers. Pioma was one of the few companies that went in for large-scale advertising on the state-owned TV channel, Doordarshan. Rasna also sponsored many programs on the channel, especially the ones that appealed to children, such as the animated series, ‘Spiderman.’ The advertisements essentially revolved around cute and very-likeable children who were floored by Rasna’s

85
Revamping Rasna – A Marketing Overhaul Saga
attractive colors, taste and fruity flavors. Eventually, Rasna’s TV commercial featuring a small girl with the tagline ‘I love you Rasna,’ was adopted as the brand’s tagline for many more commercials over the next couple of years.
As a result of all the above, Rasna virtually ruled the market during the 1980s and the early-1990s. For over 17 years, it remained the undisputed market leader in the Indian SDC market. This was aided largely by the fact that there was no serious competition in the market. Soft drinks as a segment was virtually stagnant and only a few syrups (Rooh Afza, Sharbet-e-azam) and squashes (Dipy’s, Kissan) were available in the market (Refer Exhibit II for the soft drink market in India). However, most of these products were priced higher. Moreover, there was very little marketing support provided by their respective companies.
Buoyed by its success in the Indian market, in 1993 Pioma decided to market Rasna on the global platform as well. Besides the SDC, Pioma developed a whole new range of non-alcoholic beverages under the Rasna brand for in-house consumption. The company took special care to meet the specific requirements and preferences of global customers and leverage its own core competencies in terms of flavors and technology. By this time, Pioma also realized that it could tap the demand for ethnic Indian foods in global markets and cash in on the brand’s strong image. This realization led to the launch of products under two different categories – Rasna Beverages and Foods and Rasna Ethnic Basket. While the former comprised a range of drinks, the latter constituted a complete range of ready to consumer or easy to cook authentic Indian foods (Refer Exhibit I for products offered globally).
By 1995, Rasna accounted for an estimated 90% of the total SDC market in India. The brand also led the in-home soft drink consumption market in India with an estimated market share of 75%. However, Pioma’s ‘dream-run’ seemed to be coming to an end with the heightened activity in the Indian beverages market. In the early 1990s, after the markets opened up due to the liberalization a Coca-Cola and Pepsi changed the dynamics of the market. Moreover, with the advent of fruit juices in tetrapacks and aerated drinks in plastic bottles, the scope for SDC products such as Rasna that needed to be ‘prepared’ began declining. The consumers soon began turning towards colas, fruit juices and other ‘ready to drink’ products. At the same time, a large number of other national and regional players entered the market. Reportedly, Pioma found it extremely difficult to hold on to its market shares and sales figures.
According to many analysts, the decline in Pioma’s fortunes was mostly of its own making, as it failed to understand the shifting preference of the consumers towards ready-to-drink preparations. They pointed that Rasna ignored the changing trends in the market. Variations were launched only when competition had strongly established itself. Moreover, Rasna failed to sustain its stronghold in the lower-income segment as it did little to sustain the brand’s popularity among the consumers (after its initial promotional exercises).
RASNA WAKES UP TO THE CHALLENGE
Pioma finally decided to extend Rasna’s brand portfolio and launched a pre-sweetened mix-and-drink product in 1996. Targeted at the upper end of the market, Rasna International was a nutritious and vitamin-enriched version of the regular Rasna SDC version. This was followed by the launch of Rasna Royal, positioned as a vitamin-enriched version of Rasna. It was targeted at health-conscious consumers who did not prefer Rasna SDC on account of its synthetic image (that is usage of synthetic colors and artificial flavors). These two products were priced at the higher end, as against the ‘low price’ policy followed by Rasna for the other products.
The sales of Rasna Royal did not pick up from the very beginning. Analysts attributed its failure to the strong positioning of Rasna SDC as a cost-effective drink. While
86
Marketing Management
consumers were willing to bear the inconvenience of preparing the SDC version on account of its lower cost, they were unwilling to do so for Rasna Royal as they had paid a higher price for it (Rasna Royal was priced Rs 4 higher than the SDC version). Eventually, the company had to discontinue Rasna Royal.
On the other hand, Rasna International became quite successful, primarily because it
did not need any preparation. Commenting on the analysts forecasts that Rasna
International might not succeed given the high pricing of the product, Khambatta said,
“Contrary to common perception, Rasna International has done exceedingly well and
has created a market segment for pre-sweetened fortified soft drinks.” By 1999, Rasna
International’s sales accounted for an estimated 15% of the Rasna’s total turnover of
Rs 650 million, even as SDC’s contribution kept declining.
In summer 1999, Rasna also went against its tradition of launching ‘one-new-flavour
per season’ and launched two new flavours, Rasna Yorker (Yorker) and Rasna Aqua
Fun (Aqua Fun). The company launched these products in order to exploit the Cricket
World Cup fever. Kapil Dev was brought in to endorse Rasna Yorker. Though Yorker
succeeded moderately, Aqua Fun was a dismal failure. The failure of Aqua Fun was
attributed mainly to its blue color, which was not readily accepted by the Indian
consumer in the food products segment.
Pioma’s efforts at broadening its product portfolio continued with the launch of
Oranjolt in 2000, an aerated fruit drink, available in 1.5 litre PET bottles. The brand,
launched in selected outlets, failed to attract customers and soon had to be withdrawn.
Commenting on Oranjolt’s failure, Khambatta said “Oranjolt was never meant to be
an aerated drink and it was just, one in the range of innovations that Rasna constantly
did.” However, he agreed that Oranjolt’s failure was a result of certain inherent
product problems. It was common practice for many Indian retailers to switch their
shop refrigerators at night. This resulted in quality problems, as Oranjolt required
refrigeration at all times. The short shelf life of the Oranjolt also contributed to its
failure as the company failed to set up a strong distribution network for the product,
which could allow it to replace Oranjolt every three to four weeks. Following its
failure, the company sent the product for further improvement at its R&D facility.
Despite its efforts, the woes of Rasna increased through the late 1990s and 2000.
Rasna SDC’s volume continued to shrink by over 7% every year. Moreover, the
steadily increasing prices of Rasna SDC, over the years proved to be another
significant hurdle for Pioma. Initially priced between Rs 8-10, Rasna SDC was sought
by the middle-class family as an affordable hospitality drink during the 1980s. By the
late 1990s, it had gone up to Rs 22-24, which according to the analysts was
supposedly above the reach of its target audience. However, company sources argued
that the rise in prices had been in line with the inflation through the years and was
always in the affordable range.
The growing awareness among the consumers regarding the difference between
natural and artificial synthetic flavors, the increasing purchasing power and
availability of more international products in tetrapacks all resulted in the decline of
Rasna’s market. According to estimates, the tetrapack category had increased three
fold (to Rs 6 billion) between 1993 and 2001. In 2001, only 12% of the soft drinks
were consumed at home. The shift in consumer tastes towards colas and fruit juices
continued unabated. Alarmed by its failure to extend Rasna’s product portfolio, Pioma
began planning a three-year revamping program in mid-2001. The program aimed at
overhauling all its operations and creating a new brand identity for Rasna. In the fiscal
year 2001-2002, Pioma Industries changed its name to Rasna Ltd.

87
Revamping Rasna – A Marketing Overhaul Saga
FACING CHALLENGES – THE SECOND INNING
The major thrust of the company’s restructuring exercise was to reach out to the
masses and create brand awareness in towns and remote villages. Emphasis was also
laid on the availability of Rasna products in the price range of 80 paise per glass to Rs
4 per glass. Till now, Rasna was available only in two price segments – Rs 4 and Re 1.
The company’s principal focus in 2002 was to increase the number of segments to
make Rasna products more affordable to larger various sections of society. The
company also extended its strategy of Rasna being a mass drink to its global markets.
Commenting on this, Khambatta said, “We have made sure that the Rasna
International brand is placed along with the other preparatory soft drink brands such
as Tang in international retail stores, and not in the Indian foods counter in those
stores.”
Rasna’s revamping exercise included increasing the per capita consumption of Rasna
from 15 to 100 glasses, reaching across to all sectors of society and age groups.
Moreover, plans were also made to foray into related segments in the food sector in
the next two years and strengthen its global operations. Efforts were also made to
establish itself as one of India’s top 10 products in terms of brand recall and visibility
and become one of the top 20 most admired companies in the country. Rasna
announced these plans in early 2002 and called the overall exercise as the ‘Rasna for
one billion Indians’ project.
Khambatta, explaining the company’s new marketing strategy said, “We are
implementing a strategy through which we wish to make consumers drink more Rasna
as well as get new people accustomed to the brand. We have come out with more
product offerings to attract the new consumers. For those who are already used to the
Rasna taste, we have brought out value-added products. We are more aware than
anybody else about the price-centric behavior of the Indian market and have
accordingly positioned our products.”
According to its renewed distribution strategy, Rasna planned to reach an estimated
7,00,000 retailers annually. With its plans to reach the rural areas, the company began
strengthening its distribution channels in order to cover villages with a population of
up to 5,000. Following this, the company appointed 47 additional sales personnel, 350
cycle salesmen, and 145 pilot salesmen in addition to new stockists for the relevant
areas. It also engaged 500 vans for the coverage of rural areas. However, Rasna was
careful not to neglect the urban markets. According to company sources, “There are
pockets with rural consumers even in the metros and they are large in number.”
Hence, the company’s advertisements also targeted the urban and semi-urban families.
As a part of its new strategy, the company focused on multi-media advertising and
promotion, wherein an effective marketing strategy was adopted to communicate the
brand message, using the different media such as TV, radio and print. Mudra
Communications (Mudra), a leading advertising agency, undertook the advertising
and promotional activities. Mudra developed an advertisement campaign constituting
five television commercials, radio advertising and outdoor media campaigns. Special
emphasis was laid on ‘outdoor visibility’ and over 45,000 bus shelters, 5,000 pole
kiosks, 300 bus panels and over 200 billboards were used to display the brand
message across the country.
With a new, catchy brand tagline, ‘Relish a gain,’ the campaign highlighted the
affordability and easy availability of Rasna products. Speaking about the changed
corporate identity and its reflection in advertising campaigns, Khambatta said, “Our
aim is to reach out to the masses and we wanted a direct link between the brand and

88
Marketing Management
our advertising.” Commenting on the advertisement campaigns Sachin Kamath,
Accounts Director, Mudra Communications said, “We changed the advertising
strategy to include every age group and every section of the society. ‘Relish a Gain’
concept has been created in Hindi as a song, which covers the total range of products
to focus on Rasna’s values in different moments of life.” According to company
sources, the message expected to be conveyed through the advertisements was,
“Whenever you feel like celebrating, drink Rasna”. Special emphasis was laid on its
affordability and value-for-money.
Moreover, its product lines were categorized into two brands (Rasna Utsav and Rasna
Rozana) so as to effectively target different consumer segments in India. While Utsav,
an improvement over Rasna SDC, targeted the lower income group in rural markets,
Rozana, a mix and serve powdered drink (no need to add sugar) targeted the
convenience seeking semi-urban and urban consumers. Rasna relaunched Rasna
International as well under the sub-brand, Rozana Fruit Booster. Fruit Booster was
aimed at competing with Sunfill and Tang (both pre-sweetened powdered soft drinks),
serving the upper end of the market (See Table I for Rasna’s new brand profile).
Table I
Rasna’s New Brand Profile
BRAND CAPACITY PRICE (in Rs)
FLAVOURS
UTSAV (Improved Rasna SDC containing Nature Gain (powder) and Fruit Gain (liquid) that are to be mixed to prepare the drink
1 litre 5.00
6 litres 28.50
18 litres 65.50
10
ROZANA (Pre-sweetened powder/soft drink)
Rozana Amrit 1 glass 2.00
10 glasses 15.00
25 glasses 35.00
3 (Orange, Mango and Nimbu Pani)
Rozana Ras 100 ml 15.00
200 ml 28.00
3 (Orange, Mango, and Pineapple)
Rozana Fruit Boosters (International) 200 g 45.00
500 g 107.00
3 (Orange, Mango and Pineapple)
Source: ICMR
In addition, a completely new identity, a new ‘leaf’ symbol was added to the Rasna
brand name. Commenting on this, Khambatta said, “Apart from talking about the core
values of Rasna, we also wanted a symbol for Rasna so that the product gets distinct
visibility. We want the consumers to identify Rasna from the image of the leaf.” Since
the company planned to focus on rural markets, it felt that the product awareness
could be best created by means of a symbol and hence the leaf (with red and green
background) was chosen as the brand symbol.

89
Revamping Rasna – A Marketing Overhaul Saga
All the new brands were enriched with vitamins and ingredients to render instant energy. Commenting on the launches Khambatta said, “With the launch of the Rozana line, we are reiterating our commitment to providing a health gain to our consumers. The products in the Rozana line contain Fruit Powder, Glucose/lactose, Vitamin A, C, B2, B6 as well as Niacin, Folic Acid, Calcium and Phosphorus, making it one of the healthiest and most refreshing soft drinks available. Cutting across all segments, Rasna has also ensured that the Rozana line is affordable to all sections of society.”
Rasna in order to establish its Rozana line strongly in the market, priced Rozana Amrit sachets at Rs.2, while its major competitors Sunfill and Tang sachets were priced at Rs 2 and Rs 5 respectively. This was expected to help Rasna beat competition as well as increase its reach among the lower-income groups. Speaking about the launch of the Rs 2.00 Rozana Amrit sachets, Khambatta said, “At Rs 2 per sachet, it will be both a value-for-money product as well as convenient as you just have to mix it in water and drink.” It also seemed to be more convenient compared to other product offerings of Rasna, as you did not need to add sugar to the mix. According to the company sources, the launch of single-use sachets was expected to trigger the sales of powdered soft drinks in India expanding the market exponentially and increasing the share of powdered soft drinks in the total cold drinks market in India (in 2002, the powdered soft drink market accounted for less than 1% of the 12.1 billion cold drink market).
As a result of the above initiatives, Rasna was able to retain its leadership in the Rs
2.5 billion preparatory soft drink market, with an estimated 82% market share. The
other major players, Kissan and Roohafza respectively shared 8% and 7% of the
market. In 2002, Rasna was credited to be one of the most widely distributed products
in India reaching over 5,00,000 independent retail outlets throughout the country.
Rasna emerged as a mass brand appealing to all socio-economic classifications (SEC)
in both rural and urban markets. In 2002, Rasna was rated 7th in the Food and
Beverages category in India and was rated 21st among the most recalled brands in
India.
HOPING FOR A SWEET FUTURE
Although Rasna succeeded in increasing its sales in mid-2002, few analysts were
skeptical about the long-term success if revamping strategy. The entry of players like
Coca-Cola, Kraft Foods, Dr.Morepen Labs and Hindustan Lever Ltd. and their
financial muscle was expected to pose tough competition for Rasna in the future.
In 2002, Rasna was in the process of finalizing a joint venture with Del Monte, the
largest producer of canned fruits and vegetables in the US to offer convenience foods.
While Del Monte wanted to leverage Rasna’s vast and efficient distribution network,
the latter planned to access Del Monte’s technical expertise. Though the venture was
planned to take off in mid-2002, analysts felt that the decision to foray into other
segments of the food market might not yield expected results given the intense
competition in the sector. However, brushing off the apprehensions, Khambatta said,
“I believe that competition is an opportunity for growth. We will fight competition
with good quality. Our strength lies in Rasna’s nationwide distribution network. We
are not scared or nervous of the cola giant Coke.”
Analysts also commented that Rasna was making a big mistake by trying to make
Rasna ‘everything to everyone.’1 Commenting on this, Jagdeep Kapoor, Managing
Director, Samsika Marketing Consultancy, said, “If you try to be everything to
1 www.agencyfaqs.com, April 2002.

90
Marketing Management
everyone you might end up being nothing to anyone.” Kapoor said that focus on
children had significantly contributed to Rasna’s success. By broadbasing its target
audience, and by extending its product to all the sectors of the community, Rasna
brand lost its core slot, which its competitor Sunfill captured with its commercial
depicting a child on a hunger strike giving in to his temptation for a glass of Sunfill.
However, Rasna countered this argument saying that Rasna products were always
targeted at the family and never specifically for children. (However, company sources
agreed that in the past, children had been their means to get households to buy their
product). According to an advertising professional who was previously associated
with Rasna, “The problem with Rasna lies in its advertising, which is clueless about
where the brand really fits in today’s scenario. Rasna entered middle-class homes by
saying you have so many glasses from one pack, which works out to so much per
glass. However, with the colas getting belligerent and prices coming down steeply,
that advantage ceased to exist. A glass of cola would be at most 20% more expensive,
but that is offset by the cola associations – young, hip, aspirational. Increasingly, in
middle-class homes, Rasna is not seen to be ‘with it’. So what is Rasna? Where does it
fit? Is it still relevant?”
Industry observers remarked that there were three critical success factors in the
preparatory drinks segment – economy, taste and children’s affinity. And with almost
all the players focusing equally on all the three factors, Rasna indeed seems to have a
tough time ahead to retain its leadership status.
Questions for Discussion:
1. Analyze the environment in which Pioma started selling Rasna and highlight the reasons for the brand’s runaway success. Do you think Rasna is losing its stronghold in the Indian beverages market? Justify your stand.
2. Critically comment on the failure of products such as Rasna Royal, Rasna Aqua Fun and Oranjolt. What were the factors that led Rasna to go for a major revamping exercise for the brand?
3. Discuss the initiatives taken by Rasna to rejuvenate its brand with specific reference to the positioning and advertising aspects. In light of the changing market dynamics and the intensifying competition, will the current strategies help Rasna sustain its leadership position?
© ICFAI Center for Management Research. All rights reserved.
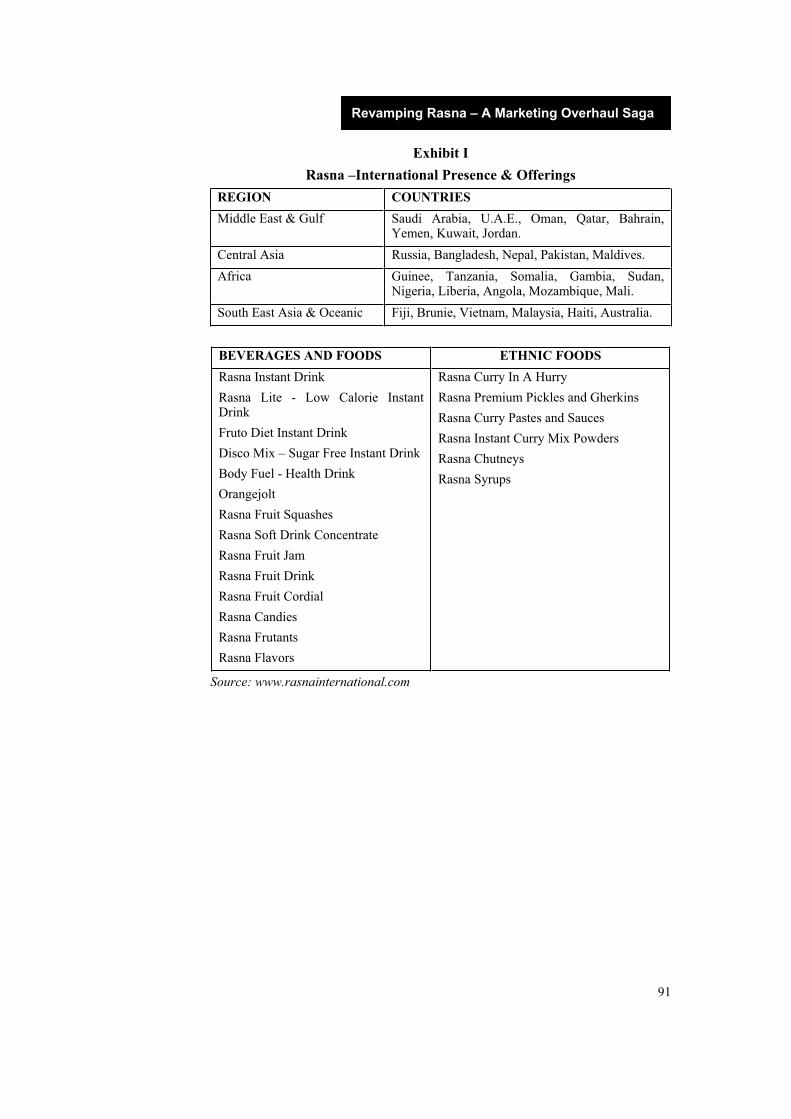
91
Revamping Rasna – A Marketing Overhaul Saga
Exhibit I
Rasna –International Presence & Offerings
REGION COUNTRIES
Middle East & Gulf Saudi Arabia, U.A.E., Oman, Qatar, Bahrain, Yemen, Kuwait, Jordan.
Central Asia Russia, Bangladesh, Nepal, Pakistan, Maldives.
Africa Guinee, Tanzania, Somalia, Gambia, Sudan, Nigeria, Liberia, Angola, Mozambique, Mali.
South East Asia & Oceanic Fiji, Brunie, Vietnam, Malaysia, Haiti, Australia.
BEVERAGES AND FOODS ETHNIC FOODS
Rasna Instant Drink
Rasna Lite - Low Calorie Instant Drink
Fruto Diet Instant Drink
Disco Mix – Sugar Free Instant Drink
Body Fuel - Health Drink
Orangejolt
Rasna Fruit Squashes
Rasna Soft Drink Concentrate
Rasna Fruit Jam
Rasna Fruit Drink
Rasna Fruit Cordial
Rasna Candies
Rasna Frutants
Rasna Flavors
Rasna Curry In A Hurry
Rasna Premium Pickles and Gherkins
Rasna Curry Pastes and Sauces
Rasna Instant Curry Mix Powders
Rasna Chutneys
Rasna Syrups
Source: www.rasnainternational.com

92
Marketing Management
Exhibit II
Soft Drink Market in India
Non-alcoholic drinks can be classified into fruit drinks and soft drinks. Fruit drinks include drinks such as fruit juices and squashes. Softdrinks can be segmented on the basis of carbonation, flavor type or place of consumption. Based on carbonation, soft drinks are principally classified into carbonated and non-carbonated drinks. While the carbonated drinks mainly include Cola, orange and lemon, the non-carbonated drinks include mango flavors. Cola products account for over 60% of the total soft drink market and include popular brands such as Coca-Cola, Pepsi, Thumps Up etc. Non-cola segment constitutes for over 35% of the market and can be divided into four sub groups based on types of available flavours that include –
*Orange: Popular brands include Fanta, Mirinda Orange etc.
*Clear lime: 7Up, Sprite
*Cloudy lime: Limca, Mirinda Lemon
*Mango: Maaza, Slice
Based on the place of consumption, the soft drink market can be classified into two segments – On –premise (at the place of purchase) consumption of soft drinks, for example railway stations, restaurants and cinemas; and In-House consumption of soft drinks purchased for consumption at home. In India on premise consumption accounts for an estimated 80% of the total soft drink market with in-house consumption accounting for the remaining 20% of the market.
Until 1990s, domestic players like Parle Group (Thumps Up, Limca, Goldspot) dominated the softdrink market in India. However, with the advent of the MNC players like Pepsi (1991) and Coke (re-entered in 1993 after it was banned in 1977) in the early 1990s, the market control shifted towards them by the late 1990s.
The per capita consumption of soft drinks in India is among the lowest in the world – 5 bottles per annum compared to the 800 bottles per annum in the USA. Delhi reports the highest per capita consumption in the country – 50 bottles per annum. The consumption of PET bottles is more in the urban areas (75% of total PET bottle [plastic bottles] consumption) whereas the sales of 200ml bottles were higher in the rural areas. According to a survey, 91% of the soft drink consumption in India is in the lower, lower middle and upper middle class section.
In 2000, the soft drink market accounted for 6480 million bottles. The market growth had reportedly slowed down during 2000 with a growth rate of 7-8% compared to 22% in 1999. This decline in growth was attributed to the rise in soft drink prices during 2000 on account of increased excise duties. Though Pepsi led the soft drink market during the mid 1990s, Coca-Cola through its constant acquisition of the major national and international brands such as Gold Spot, Limca, Thumps Up, Canada Dry and Crush during the 1990s and 2000, emerged as the new leader in the soft drink market during 2001 with Pepsi closely following it.
Apart from these segments, the soft drink market has a sub segment – the soft drink concentrate segment (SDC) or the preparatory soft drink segment. This segment includes the soft drinks that are available in concentrated forms that need to be diluted or mixed at home for consumption. The major players in the segment are Rasna, Kissan and Roohafza with Rasna ruling the roost with over 82% of the total SDC market in 2001 and Kissan and Roohafza following it with 8% and 7% of the market share respectively.
Source: www.indiainfoline.com
93
Revamping Rasna – A Marketing Overhaul Saga
Additional Readings & References: 1. Zachariah Reeba, Rasna-Maker Pioma, Del Monte Talk Joint Venture,
www.rediff.com, March 2001.
2. Asha Bhonsle Sings Jingle for Rasna, www.domain-b.com, January 1, 2002.
3. Rasna Stirs Up an Image Change, www.blonnet.com, March 3, 2002.
4. Rasna Launches Rozana, www.reachouthyderabad.com, March 2002.
5. Srinivasan Lalitha, Rasna Set To Counter Coke’s Sunfill With New Strategy,www.financialexpress.com, March 28, 2002.
6. Shastri Padmaja, Small Is Beautiful: Rasna To Launch Sachet Packets, Financial Express, March 2002.
7. Kurian Vinson, Rasna Promo Turns Over a New Leaf, www.blonnet.com, April 11, 2002.
8. Shatrujeet N & Chakraborty Aloknath, Rasna and Frooti: Caught in an Advertising Bind, April 15, 2002.
9. Srinivasan Lalitha, Mixing a Brand New Mocktail, Financial Express, May 4, 2002.
10. Rasna Booster Formula, www.business-standard.com, August 6, 2002.
11. www.rasnainternational.com
12. www.expresshotelierandcaterer.com
13. www.domain-b.com
14. www.blonnet.com
15. www.thesynergyonline.com
16. www.tribuneindia.com
17. www.agencyfaqs.com
18. www.indiainfoline.com
19. www.indiantelevision.com
20. www.aandm.com
21. www.geocities.com

Cielo – A Car in Trouble “Daewoo is good at making cars, but rotten at marketing them.”
- An automobile industry analyst, in 2000.
THE ENTRY OF DAEWOO
The entry of the Korean automobile major, Daewoo Motors India Ltd. (Daewoo) in
the Indian passenger car market was heralded as a milestone for the industry. This was
because Daewoo was the multinational to challenge the might of the market leader
Maruti Udyog Ltd. (MUL). Daewoo’s first vehicle, the 1500 cc Cielo was launched in
three versions (Cielo, Cielo GLX and Cielo GLE) in July 1995. Consumers who until
now had no other option besides the Maruti Esteem in the mid-size segment (Refer
Exhibit I), rushed to buy the Cielo. Bookings for the three models reached 114,000 in
a short span of time. With the car registering high initial volumes and its plans to
become a Rs 100 billion company by 1998-99, Daewoo seemed all set to give MUL
serious competition.
However, Daewoo was in for a major shock as around 70,000 customers cancelled
their bookings within a few months. Daewoo had predicted an annual turnover of over
Rs 10 billion and sales of 20,000 cars by March 1996 - but managed to record a
turnover of Rs 6.05 billion and sales of only 9,044 cars. During April-December 1996,
only 13,776 Cielos were sold against the targeted 52,000. During April 1997-February
1998, 9006 Cielos were sold, a decline of 41% from the corresponding period
previous year. In 1998-99, 5500 Cielos were sold, a fall of nearly 50% over the
previous year. The entry of competition in form of General Motors and Ford in 1996
and the general downturn in the mid-size car segment added to the company’s
problems. Daewoo recorded a loss of Rs 351.4 million in the six months that ended in
March 1998 as sales declined to Rs 1.22 billion from Rs 2.7 billion in the
corresponding period in the previous year. Daewoo was surprised to realize that its
globally tried and trusted formula of providing excellent service with low prices had
failed miserably in India.
Daewoo’s miseries nevertheless did not come as a surprise to the industry watchers.
Even while Daewoo had announced its targets at the time of Cielo’s launch, they were
termed ‘too ambitious and unrealistic’ by analysts. Media reports stated that Daewoo
itself was responsible for the mess it had landed itself in. A Business Standard report
mentioned, “A close look into the performance of the company from the drawing
board stage throws up a perfect case study on what an organization should not do.”
BACKGROUND NOTE
Daewoo was a part of the $ 65 billion Daewoo Group, founded in 1967 in Korea. The group, which by 2001 had operations in 123 countries, had begun by exporting readymade garments to US retailers. Over the next decade, the group diversified into general trading, construction, machinery, automotive, ship building, electronics and telecommunications, among other areas.
The group’s automotive business, Daewoo Motors was considered to be one of its most important ventures. In 1977, Daewoo Motors entered into a joint venture with the US auto major General Motors. However, the venture did not prove to be a success with frequent skirmishes between the two partners. In 1991, Daewoo bought out GM’s 50% stake in the venture for $ 50 billion.

95
Ceilo – A Car in Trouble
Daewoo Motors realized that it would have to look beyond the European and US markets, given the intense competition and higher customer expectations in terms of quality and performance in these markets. Thus, the company decided to penetrate those emerging markets where the demand for automobiles was expected to increase in the future. The markets identified were Eastern Europe, Latin America and Asia. The decision to enter the Indian car market was a part of this strategy. Daewoo Motors took over the 50% equity held by Japan’s Toyota in DCM-Toyota and renamed the company Daewoo Motors India Ltd. In January 1997, DCM Ltd. sold 24% of its shareholding to Daewoo, raising its stake in the company to 75%. By 1998, Daewoo further increased its stake to 92%.
Daewoo Motor’s overseas expansions were funded largely on borrowed money. However, the company was unable to keep up the repayment on its debts. In 2000, after the company’s labor unions refused to accept a restructuring plan for the company, Daewoo Motors was declared bankrupt and talks were initiated to look for a suitable buyer. GM again evinced interest in the venture amidst stiff opposition from the worker unions.
THE MISTAKES
The lack of a focussed approach and inconsistent policies were reported to be the two main reasons that led to the Cielo’s poor performance. However, the seeds for Cielo’s downfall had been sown when Daewoo launched the car in an extremely hurried manner - the MoU1 was signed in October 1994 and the first Cielo rolled off the assembly lines in July 1995. In its hurry to start its Indian operations, Daewoo entered the market with a high import content - thereby not being able to keep the prices lower than the competitors. The low indigenisation level also translated into high costs of spares. Experts commented that the Cielo had been launched without any detailed market survey.
Daewoo began production of the Cielo at the Surajpur factory, originally built by the DCM-Toyota venture in 1985 to manufacture light commercial vehicles (LCVs). As the scale of operations increased substantially with not much modification to the plant, quality defects could not be completely avoided. Complaints of poor fuel efficiency soon surfaced. A Daewoo official from Korea remarked, “We had problems due to bad quality of fuel.” Media reports remarked that this had happened because Daewoo did not understand the Indian market properly. Daewoo sought to tackle this problem through its sales staff. However, the sales staff was reported as not being sufficiently trained to counter such problems. They simply could not react to consumer complaints.
Like most of the other automobile companies in the mid 1990s, Daewoo had been lured by the much talked about ‘Indian middle class market boom,’ which never took off in reality. Daewoo had assumed that there was a huge pent-up demand for cars priced above Rs 0.5 million. The company also banked heavily on demand from the taxi/hotel car fleet and corporate segments. However, most of the above did not materialize the way Daewoo had planned. A Business India report revealed that most prospective Cielo buyers already owned an Esteem, and the decision to buy a second or third car could be postponed. The liquidity crunch due to the recession in the economy resulted in demand declining sharply - from the individuals as well as the taxi/hotel car fleet and corporate segments.
In late 1995, Daewoo realized that it needed to give Cielo a strong push to improve the sales. The company then devised a promotional campaign, called the ‘Diwali
1 DCM-Daewoo had signed a MoU with the Government to import CKD (completely knocked down kits). The MoU had to be signed since imports of CKD items for cars was banned and required a license.

96
Marketing Management
Bonanza scheme’ for corporates, offering one Cielo free on purchase of every ten cars. This was followed up with a lottery scheme for individuals, wherein the winner was awarded a car. It was revealed later that the promotional scheme was pushed by Daewoo’s marketing head from Korea inspite of the Indian managers vehemently opposing it. A former Daewoo executive said, “There was actually no need of the promotion. People began to look at the car with suspicion.”
The Cielo had till then been promoted as a feature-rich, luxury family car. The free Cielo scheme did immense damage to the car’s brand equity, particularly in north India, which accounted for around 80% of Cielo sales. The bonanza scheme somehow projected a picture that Daewoo had substantial non-moving Cielo stocks, thereby turning off the ‘status-conscious’ buyers. Before this scheme, Cielo was selling about 2,500 cars a month, which fell to 100 by the time the scheme ended in early 1996.
In its desperation to maintain volumes, Daewoo then began offering hitherto unheard of incentives to dealers and financiers, who in turn passed them on to customers through lower interest rates. Daewoo and its financiers were even questioned by the Monopolies & Restrictive Trade Practices authorities to explain how its finance rate could be as low as 14.33%, while the prevailing car finance rate was 23%. The company explained it by claiming that it was offering discounts of up to 10% of the car value (Rs 0.6 million) to financiers, provided they reduced the cost to the customer by keeping the interest rate low. Daewoo later claimed that these inquiries were instigated by its competitors to tarnish its image.
After the finance schemes, Cielo announced a test drive scheme to lure the buyers in April 1997. The scheme entitled all car owners to participate in a draw where 200 Cielos were given to the winners for 18 months. On completion of this period, the winners had the option of either buying the car by paying 70% of its original on-road price or returning it to Daewoo. The company claimed to have successfully tried out this scheme in the UK and Korea earlier. The scheme was intended to enhance Cielo’s credibility in the marketplace. However, the low finance rates and the test drive schemes faced the same criticism the free Cielo scheme did.
Daewoo’s positioning efforts for the Cielo were termed ‘unmemorable and poor’ by analysts - largely due to the frequent changes in the positioning. Initially the car was positioned on the ‘technology with aesthetics’ plank, which was later moved on to a ‘premium family car’ positioning. Analysts remarked that the family-car positioning did not match with the premium image Cielo was trying to project in the beginning. This premium communication began to clash with subsequent value-for-money initiatives that followed. Such moves only ended up confusing the customer. S G Awasthi, managing director, Daewoo, defended the company’s stand saying that there were no benchmarks in India when Cielo was launched and that market segmentation had not even begun to emerge. He said, “It was difficult to position the car clearly or to communicate it. So we did not position it against any product, but with the idea that Cielo will find its own niche.”
A Daewoo source commented, “Tell me one ad campaign that improved the car’s sales by even 0.1%? Cielo began on a luxury plank and ended on a ‘Val-You’ note.” Media reports remarked that Daewoo’s not being able to properly position the car proved to be the biggest reason behind Cielo’s failure. An analyst commented, “They must have tried almost every positioning.”
THE BIGGEST BLUNDER?
As all of Daewoo’s efforts seemed to be failing, the company Daewoo decided to introduce a hefty price cut of Rs 0.15 million in January 1998. After this, the GLE model cost Rs 0.49 million in Delhi showrooms compared to the earlier price of Rs 0.62 million, while the GLX model cost Rs 0.57 million compared to the earlier Rs 0.68 million.

97
Ceilo – A Car in Trouble
Daewoo’s move took the industry players as well as the customers by surprise. It was even reported that a leading Daewoo competitor sent anonymous letters to automobile dealers on ‘how the price reduction had seriously eroded customer confidence in Cielo and was done mainly for the 1996 models stuck in their stock.’ However, Awasthi preferred to call it ‘price correction,’ saying that the price slash had been possible because of the company’s achieving a higher indigenisation level (70.10%) and better foreign exchange management. He added that the decision was in line with Daewoo’s global strategy of working on lower margins.
Ten days before the price cut announcement, Daewoo had stopped delivering the Cielo to showrooms, hoping to minimize the impact of the price reduction on recent customers. To ensure that existing customers did not feel cheated, the company wrote to each customer individually. They were offered the first bookings for Daewoo’s yet to be launched small car, besides a customized package of free servicing. They were also explained how the price change did not really compromise the price they had paid. Daewoo held meetings with senior managers from its regional offices, dealers and the finance companies to explain the rationale behind the price cut. Daewoo also began monitoring the reactions to the price correction by sending out nearly 1,50,000 letters to the public. In addition to each of the existing Cielo customers, potential buyers – companies, Government and professionals like chartered accountants and doctors were targeted. Each dealership was put under watch by the regional managers to remove any feelings of ‘betrayal’ in old customers.
Immediately after the price cut, Cielo’s sales increased to 906 per month in January and February 1998 compared to 314 units in December 1997. Although Cielo became the cheapest mid-size car in the Indian market, this move almost wiped out the car’s credibility in the market. After the price reduction, Daewoo had to work very hard towards salvaging the car’s image. This was done by the new ‘value benefits’ positioning for Cielo in the mid-size segment. Daewoo launched the ‘Valyou’ campaign designed to educate the customer on the new positioning, highlighting the Cielo’s features. The idea was to convey that the Cielo now offered more value for less money and not just the same value for less money. Thus, the aspects of Technology Valyou, Comfort Valyou, and Safety Valyou were emphasized. As a result of these initiatives, in March 1998 sales went further up to 1102 cars.
For 1997-98, Daewoo increased its advertising budget substantially and released double-page advertisements in leading national dailies carrying pictures of a range of automobiles. This was done to give confidence to customers that Daewoo was not just a single-product company. Also, whereas the earlier advertising focussed on Cielo, it now focussed on the Daewoo brand in the same way as other multinational car brands did. However, these moves failed to have the desired effect and as predicted by industry analysts, the impact of the price cut and new campaigns soon wore off - by February 1999, sales fell to a low of 148 cars per month.
SHIFTING THE FOCUS TO MATIZ
In October 1998, Daewoo launched its small car ‘Matiz,’ which soon became very popular amongst the customers. Though Matiz did not fare as well as its rival Santro (from Hyundai) initially, over the next few months, its demand increased significantly. While 23,265 units were sold during April-December 1999, demand increased by 52.2% to 35,398 cars during April-December 2000.
Analysts claimed that Daewoo seemed to be neglecting Cielo after the launch of Matiz. In May 1999, Daewoo stopped production of the GLE and GLX versions of Cielo and replaced them with the Cielo Executive and the Nexia. While the former was positioned as the basic Cielo version with the best features of both GLE and GLX, the Nexia was promoted as being an upgraded version of the Cielo. The move failed badly because the dealers as well as the customers failed to see any worthwhile additions to the earlier Cielo model.

98
Marketing Management
Referring to Nexia as a slightly modified Cielo, a Daewoo dealer commented, “We
have the Rs 0.4 million Cielo and the Rs 0.6 million Cielo (i.e. the Nexia).” This was
not surprising, for while Nexia’s engine and interiors had been substantially changed,
Nexia’s exterior was very similar to Cielo. Daewoo said that it was not able to create a
perceptual difference between the two cars amongst the consumers. Nexia failed to
catch the customer’s fancy and sales never really picked up. Daewoo attributed the
low sales to the fact that the market for mid-size cars had become rather crowded.
During the pre-launch and launch period of Nexia, Daewoo completely stopped advertising for Cielo. This created the impression that the Cielo was going to be completely phased out. This prevented the company from positioning both cars independent of each other. From 2553 cars sold during April-December 1999, Cielo sales declined by 45.8% to 1385 cars during April-December 2000. Daewoo’s plans to launch a Compressed Natural Gas (CNG) version of the Cielo were yet to materialize even in mid 2001.
Matiz had a 70% market share in the Korean market and had received a good response in most of the 114 countries it was sold in. However, its performance in India was nowhere near its global success and Daewoo continued to run into losses. In 1999-00, the company had a loss of Rs 1.16 billion on gross sales of Rs 12.78 billion. The loss increased to Rs 3.4 billion on gross sales of Rs 11.84 billion in 2000-01. Daewoo’s rivals were quick to comment that the Matiz was also bearing the brunt of the company’s poor marketing skills, adding that the poor legacy of the Cielo experience would be hard to shake off.
Daewoo though, was still hopeful of succeeding in the Indian car market. The company expected the market to reach the one million mark by 2005-2006. Kim said, “Who would want to lose an opportunity to be part of that?” He added that Daewoo would break even in 2001-02. To meet this target, Daewoo was working towards enhancing its dealership and sales and servicing network as part of the restructuring programme. The company also undertook a massive cost cutting exercise, which involved cutting down on staff strength. In order to reduce the wage bill, Daewoo reduced the working hours and also reduced the number of workers from 3000 in 1998 to 1951 in 2001.
The company’s prospects however showed no signs of improving as for the first quarter of 2001-02, Daewoo posted a net loss of Rs 1.21 billion - almost double the Rs 607 million figure in the corresponding period in 2000-01. At this juncture, the company even had to postpone its plans to launch three new top-end cars, Lanos, Nubira and Magnus. In August 2001, Daewoo revealed plans to change the positioning of Cielo once more. The company’s new managing director Young-Tae Cho claimed that the Cielo in its current form could not be continued. Until Daewoo managed to boost the car’s sales, one would have to agree with the industry experts, who claimed that the company would never be able to make a success of Cielo.
Questions for Discussion:
1. Analyze the reasons behind the failure of Daewoo Cielo. Do you agree that the company itself was responsible for its problems?
2. In spite of being the first MNC player in India after MUL, Daewoo could not make its automobile venture a success. How far was the Korean parent responsible for the Cielo debacle? Discuss.
3. Was Daewoo neglecting Cielo after the launch of Matiz? Do you agree with Cho’s decision to change Cielo’s positioning once again? Justify your answer with reasons.
© ICFAI Center for Management Research. All rights reserved.
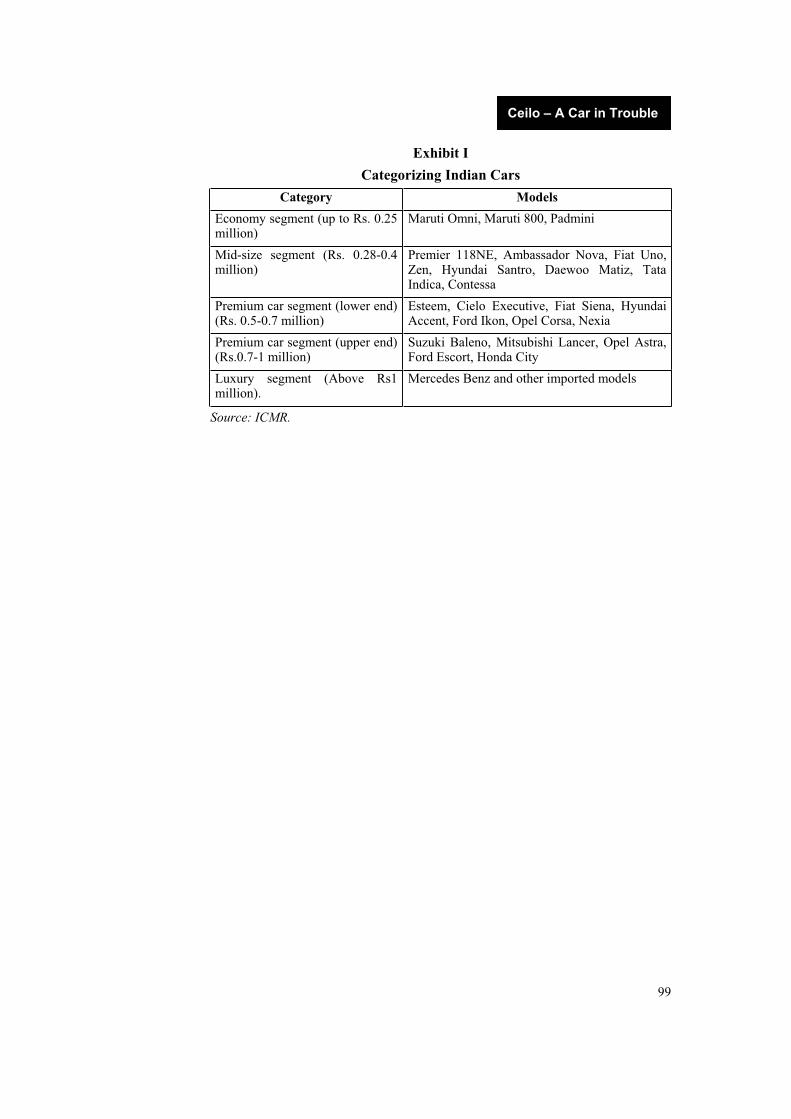
99
Ceilo – A Car in Trouble
Exhibit I
Categorizing Indian Cars
Category Models
Economy segment (up to Rs. 0.25 million)
Maruti Omni, Maruti 800, Padmini
Mid-size segment (Rs. 0.28-0.4 million)
Premier 118NE, Ambassador Nova, Fiat Uno, Zen, Hyundai Santro, Daewoo Matiz, Tata Indica, Contessa
Premium car segment (lower end) (Rs. 0.5-0.7 million)
Esteem, Cielo Executive, Fiat Siena, Hyundai Accent, Ford Ikon, Opel Corsa, Nexia
Premium car segment (upper end) (Rs.0.7-1 million)
Suzuki Baleno, Mitsubishi Lancer, Opel Astra, Ford Escort, Honda City
Luxury segment (Above Rs1 million).
Mercedes Benz and other imported models
Source: ICMR.
100
Marketing Management
Additional Readings & References: 1. First off the block, Business India, July 31, 1995.
2. Ganguli Bodhisatva, From trucks to cars, Business India, January 15, 1996.
3. Ganguli Bodhisatva, DCM-DAEWOO, Still short, Business India, June 3, 1996.
4. Ganguli Bodhisatva, Exit DCM, Business India, February 24, 1997.
5. Sorabjee Hormazd, No hand-me-downs, thank you, Business India, June 16, 1997.
6. Cielo price cut by Rs 0.13 milion, Business Standard, January 5, 1998.
7. Daewoo’s nightmare, Business India, January 26, 1998.
8. Raman Manjari, Cielo drives home the value equation, Business Standard, March 2, 1998.
9. Daewoo halts output of Cielo GLE, GLX models, Indian Express, May 8, 1999.
10. Pande Bhanu & Singh Iqbal, Will the real Daewoo stand up?, Business Standard, May 11, 1999.
11. Rajashekhar M, Generation Nexia, Business Standard, July 11, 2000.
12. Madhavan N, Things that went wrong with Daewoo's India operations, Business Standard, November 15, 2000.
13. Ganguli Bodhisatva, Can Matiz paint a new picture?, Business India.
14. Ganguli Bodhisatva, Sudden slowdown, Business India.
15. Datt Namrata, Daewoo in overdrive, Business India.
16. Ganguli Bodhisatva, Daewoo’s dilemma, Business India.

Airtel Magic – Selling a Pre-Paid Cellphone Service
“Magic’s success can be attributed to the one on one relationship that the brand has built successfully with its customers. Add to that the vibrant colours, the local language and simplicity that the brand communicates with, and the celebrity association, Magic creates a lasting bond with its customers.”
- Vivek Goyal, CEO, Bharti Mobitel Ltd., in January 2002.
CASTING THE CELEBRITY MAGIC
In 2002, the leading Indian telecommunications company, Bharti Cellular Limited
(Bharti) signed the famous cricket player Saurav Ganguly and leading movie stars,
Madhavan and Kareena Kapoor as endorsers for its brand, Airtel Magic (pre-paid
cellular card). Its objective was to create the highest recall for Magic in the pre-paid
cellular telephony segment by cashing in on the two biggest passions of India –
movies and cricket. Bharti also changed the tagline for Magic from ‘You Can Do
Magic’ to ‘Magic Hai To Mumkin Hai’ (If there is Magic, it’s possible). The move
attracted considerable media attention, as it was unusual for a company to spend so
lavishly to promote a single brand.
In October 2002, Bharti launched a television commercial (TVC), featuring Shah
Rukh Khan (leading actor, already endorsing Magic since a couple of years) and
Kareena Kapoor. The TVC, developed by one of India’s leading advertising agencies,
Percept Advertising, was the first of the series of four TVCs for Magic’s new
campaign. According to Bharti, the TVCs aimed at attracting young adults in SEC B
and C categories of the Indian market1. Commenting on the new developments,
Hemant Sachdev (Hemant), Director, Marketing and Corporate Communications,
Bharti Enterprises, said, “The aim is to be relevant to the masses and make all their
dreams, hopes and desires come true instantly, at Rs 3002 per month.”
However, industry observers felt that these actions were necessiated by the
intensifying competition in the pre-paid cellular card segment in India in the early 21st
century (Refer Exhibit I for a note on cellular telephony). Many new players (national
as well as international) had entered the segment and the competition had become
quite severe. Besides Magic, the major players in the pre-paid card segment in 2002
included Idea (Tata, AT&T and Birla Group), Speed (Essar), Hutch (Hutchison),
Wings (RPG), Cellsuvidha (Fascel) and Yes (Usha Martin).
In October 2002, Magic led the market, with 30% of the market share. Bharti claimed
that its strategies were one of the most ambitious experiments ever in the Indian pre-
paid cellular telephony market. However, given the increasing competitive pressure,
doubts were being expressed regarding the ability of Bharti’s marketing initiatives to
help Magic retain its ‘Magic’ in the future.
1 Socio-Economic Classification (SEC) categorized urban Indian households into five segments SEC A, SEC B, SEC C, SEC D and SEC E, based on education, occupation and chief wage earner’s profile. A&B are high SEC classes. Mid SEC class is SEC C and low SEC classes include D&E.
2 In November 2002, Rs 48 equaled 1 US $.

102
Marketing Management
BACKGROUND NOTE
Cellular telephony was introduced in India during the early 1990s. At that time, there were only two major private players, Bharti (Airtel) and Essar (Essar) and both these companies offered only post-paid services. Initially, the cellular services market registered limited growth. This was primarily due to the high tariff rates charged by the companies (about Rs 16 per minute for outgoing calls). Indians who were used to paying much lesser amounts (Rs 1.20 for 3 minutes) for landline telephone calls found these to be very expensive.
However, as there were only two players, a monopoly regime prevailed. The tariff rates as well as the prices of cellular phone handsets (instrument) available in that period continued to remain high. Hence, cellular phone services during that period were regarded as a luxury and companies mostly targeted the elite segment of the society. Moreover, these services were mostly restricted to the metros. Other factors such as lack of awareness among people, lack of infrastructural facilities, low standard of living, and government regulations were also responsible for the slow growth of cellular phone services in India.
Although the cellular services market in India grew during the late 1990s (as the number of players increased and tariffs and handset prices came down significantly) the growth was rather marginal. This was because the cellular service providers offered only post-paid cellular services, which were still perceived to be very costly as compared to landline communications. Following this realization, the major cellular service providers in India, launched pre-paid cellular services in the late 1990s. The main purpose of these services was to target customers from all sections of society (unlike post-paid services, which were targeted only at the premium segment). On account of the benefits they offered (Refer Exhibit I), pre-paid cellular card services gained quick popularity during the late 1990s.
Between the late 1990s and early 2000s, tariff rates declined 75%. Reportedly, Indian cellular players were offering the lowest cellular tariffs in the world (Rs 1.99 for 60 seconds). By October 2002, of the 8.5 million cellular phone users in the country, 65% belonged to the pre-paid segment. Also, an estimated 80% of the new add-ons were pre-paid card subscribers.
Bharti, being one of the early entrants in the industry, (Refer Exhibit II for a note on Bharti), launched its own pre-paid cellular service under the Magic brand in January 1999. Magic was first launched in Delhi and later in other circles3 in India (where the company offered cellular services under its flagship brand, Airtel).
Through Magic, Bharti targeted the infrequent users of mobile phone. Acquiring
Magic connection was very easy – all a customer needed to do was walk into an outlet
(selling Magic) with a handset. Here the customer was provided with a pre-activated
SIM card4 (which had to be loaded with the calling value) and a recharge card (which
was required for loading the calling value into the SIM card). These cards were valid
only for specific period (beyond which the services could not be availed), depending
on the value of the recharge card loaded. Whenever a customer utilized his Magic
3 India was divided into 21 ‘telecom circles’ (circles). These circles were divided into three categories ‘A,’ ‘B,’ and ‘C’ based on their size and importance. Category ‘A’ - Maharashtra, Gujarat, Andhra Pradesh, Karnataka and Tamil Nadu. Category ‘B’ - Kerala, Punjab, Haryana, Uttar Pradesh, Rajasthan, Madhya Pradesh and West Bengal. Category ‘C’ - Himachal Pradesh, Bihar, Orissa, Assam and North East. Cellular licenses were separately issued to the four metros in India – Delhi, Chennai, Mumbai and Kolkata.
4 Subscriber Identification Module (SIM) card is a smart card that allows cellphone users to make and receive calls. The SIM card contains a microprocessor chip, which stores unique information about the user account, including his phone number and security numbers, thus helping the network to identify the user.

103
Airtel Magic – Selling a Pre-Paid Cellphone Service
card, a specific amount was deducted as per the applicable tariff rates. Customers
were required to recharge the card before the expiry of the validity period to avail the
services (further). When the card was recharged, customers were provided with a new
calling value possessing a new validity period. The company provided a grace period
of 30-90 days based on the denomination of recharge card. However, no incoming or
outgoing calls were allowed during this period.
The attractively designed Magic cards could be activated/recharged by using a 16-
digit number. Bharti adopted the international ‘scratch system’ for Magic cards, that
is, customers were required to scratch a marked area on the card to acquire the
activation number.
To establish Magic as a brand and make it more accessible, Bharti focused on its distribution strategies. Apart from company outlets, Magic was made available at departmental stores, gift shops, retailing outlets, telephone booths and even ‘Kirana’ stores (small grocery shops). Besides the absence of rental hassles and security deposits, Magic offered features such as instant connectivity, pre-activated STD/ISD facility (customers did not have to maintain a minimum balance in the pre-paid card for utilizing the STD/ISD services), voice mail and short messaging service (SMS). To meet the requirements of varying customer groups Magic was made available in various denominations (ranging between Rs 300 to Rs 3,000). Due to its innovative and customer-friendly features, Magic came to be credited by industry observers for bringing about dynamic changes in the Indian cellular services market and expanding the cellular user base.
By providing affordable and easily accessible services to all sections of the community and maintaining strong relationship with customers, Magic was able to differentiate itself from other pre-paid cellular services. Magic soon became the market leader and was the most visible pre-paid cellular brand in the country – aided by Bharti’s (and Airtel’s) strong presence in 16 states of the country (reaching around 400 million customers).
However, Bharti was not content with sitting back and savoring the short-term success
of Magic. The company realized that the Indian cellular telephony market was
undergoing a radical transformation. With the entry of a fourth player in various
telecom circles in 2002 (until then only three players were operating in all circles), the
future was expected to be rather uncertain. The subscriber base was over 6.4 million
by March 2002 as compared to 3.5 million in March 2001. Telecom circles in the
states of Rajasthan, Haryana and Kerala posted an estimated growth rate (in
subscribers) of 179%, 151% and 151% respectively in 2002.
This growth could be primarily attributed to the introduction of pre-paid cards, which
accounted for over 55% of an operator’s revenue. In early 2002, analysts forecasted
that the number of subscribers using pre-paid cellular services in India was estimated
to reach over 25 million by the year 2004 (from 4.5 million in 2002). The immense
potential the market offered lured almost all major players to shift their focus to the
pre-paid segment to design new marketing strategies to expand their user base in this
segment. With the intensifying competition in the market, Bharti also felt the need to
revamp its own marketing strategies and retain its position as the market leader.
ALL SET TO CREATE MAGIC
In early 2002, Magic decided to revamp its marketing strategies. There were plans to launch the service in newer areas and bring about changes in pricing, positioning and advertising. The company also planned to make new value additions by providing better services. As a first step in this direction, Magic was brought under Bharti’s umbrella brand, Airtel, and was renamed Airtel Magic. Company sources said that the

104
Marketing Management
move was aimed at banking on the strengths of Airtel as a brand. While the earlier brand strategy aimed at customers interested in using mobile services, the new strategy was aimed at attracting even non-interested customers by appealing to their needs and requirements (offering them a value they did not perceive earlier).
In line with this strategy, Magic was positioned as a friendly, mass-market brand. Sources at Bharti revealed that in its repositioning exercise under the Airtel brand, Magic targeted youth and stood for simplicity and attitude that said, ‘anything is possible.’ Explaining the rationale behind the brand repositioning on the Airtel level, Hemant said, “As we grew to a 15-circle telecom network, we wanted to become generic to mobility in the country.” As a part of its revamping exercise, Bharti also changed the logo. The new Magic logo reflected the new brand values of youthfulness, energy, simplicity and friendliness (See Exhibit III for Old and New Logos of Magic).
Bharti then focused on extending its distribution base in all the circles in which it operated and therefore, ensured the availability of Magic cards in the remotest parts of its operating circles. By late 2002, the states of Kerala and A.P. had 2000 and 4,500 stores respectively. In Chennai (Tamil Nadu) and Kolkata (West Bengal) there were over 2,500 and 3,000 outlets respectively.
In mid 2002, in an innovative move, Bharti entered into a strategic tie-up with a
leading Indian private sector bank, ICICI to offer recharge facility for Magic cards
users at the bank’s ATMs5 across Andhra Pradesh, Delhi and Kolkata. Commenting
on this, Pawan Kapur, Chief Executive, Bharti Mobile (Andhra Pradesh) said, “It is
another innovative combination of customer benefit and technological advancement.”
Bharti also focused on revamping of its pricing strategies from time to time (at regular
intervals) in order to stay ahead of competition. The company charged different rates
for incoming and outgoing calls depending on the time when the call was made. For
instance, customers in Delhi were charged Rs 1.35 (per 30 seconds) and Rs 0.99 (per
30 seconds) for incoming calls in the time slot of 8.00 am and 10.00 p.m. However,
these rates were much lower at night (outgoing calls cost only Rs 0.67 for 30 seconds,
while incoming calls cost Rs 0.49). In order to increase its penetration in the market,
Magic also came up with many special offers during mid and late 2002.
In mid 2002, Magic was made available at only Rs 290 (as against Rs 300 previously),
which included Rs 90 worth free talk time valid for 7 days (as against Rs 50
previously). One of its special launch offers included providing free talk time worth
Rs 290 to new subscribers (Rs 145 worth talk time free at the end of the third month
and the balance Rs 145 worth, at the end of sixth month from the date of making the
first call from magic card). Free voice mail service was also offered to new
subscribers for a period of three months.
As a part of its efforts to expand its reach, Bharti offered and introduced many special
features for Magic subscribers. These included free caller line identification, and
innovative services like balance on screen (balance amount displayed at the end of
each call) and balance on demand (balance amount derived by pressing specific
numbers on the phone without making or receiving a call). Bharti also introduced
doorstep delivery of Magic cards in mid-2002. Although the service was initially
available only in Delhi and Gurgaon (for a recharge value of Rs 500 and above), there
were plans to extend it to other circles as well.
5 ATMs (automatic teller machines) interact with users and with the central system of the concerned bank to execute a transaction (dispense cash and print receipts). Customers wishing to recharge a Magic card were provided the 16-digit recharge pin number through a printed receipt.

105
Airtel Magic – Selling a Pre-Paid Cellphone Service
In mid 2002, Bharti launched its regional roaming6 network in Asia for Magic
subscribers. Under this offer, subscribers were able to utilize roaming services in over
66 countries across the world, underlying Europe, Australia, the Asia-Pacific region,
the Middle East and the US. This service was offered free of charge for calls placed
through any Airtel network in India. Regional roaming facility was offered to
customers within the country as well in mid 2002. Apart from this, the company also
waived airtime charges on incoming calls between Airtel cellular customers (intra-
operator calls) in some parts of the country.
New celebrity endorsers who projected a fresh and youthful image were chosen. The
idea was to reflect Magic’s brand values of energy, hope, optimism and achievement.
Explaining the rationale behind focus on celebrity endorsements, P H Rao, MD,
Bharti Mobinet Ltd., said, “Magic is a youth brand, and all these celebrities depict
exuberance and confidence to succeed, which are in synergy with the core values of
the product.” These campaigns were extensively covered by both the print and
television media.
Besides the new tagline of ‘Magic Hai To Mumkin Hai,’ Bharti devised many ad-specific taglines to take the brand closer to masses. Some of them were ‘Kabhi bhi Kahin bhi’ (Anytime, anywhere) ‘Jahan Chaho, Airtel Magic Pao’ (Wherever you want, you will find Magic), Airtel Magic gives you the max out of life, ‘Kharch aapki mutthi mein’ (Costs are under your control) and ‘Life banao ab aur bhi aasaan’ (Make life easier with Magic).
To promote the brand and retain its customers, Bharti conducted many contests for its subscribers through SMS. For instance, the ‘Khulja Sim Sim’ contest launched in April 2002, offered a treasure hunt kind of an interactive game through SMS, wherein many attractive prizes were given to the winners. Many other such contests were held, either as part of a new scheme’s promotional efforts or to coincide with some local Indian festival.
In 2002, Bharti entered into many new telecom circles as the fourth player. Due to the strong brand equity of both Airtel and Magic it picked up instant momentum. Magic was reportedly very popular with customers (especially the youth) who appreciated the (ease of operation, affordability and ready availability) the brand offered.
THE INDUSTRY STRIKES BACK
Bharti’s aggressive marketing, advertising and promotional efforts led other players to focus on their marketing efforts as well (Refer Exhibit IV for competition details). Companies resorted to price reductions, new service additions, value additions and focused advertising and promotional campaigns. For instance, in Mumbai, BPL Mobile and Hutchison Max Telecom made incoming calls (from across the country) free to counter Bharti’s waiver of airtime charges for incoming calls in Mumbai.
Apart from this, BPL and Hutchison also announced the launch of new advertising campaigns in Mumbai. Hutchison and BPL also launched their 32K7 SIM cards in order to match Bharti’s 32K SIM offer (previously, the players offered only 8-Kilobyte memory SIM cards). BPL and Hutch also waived airtime charges for incoming calls and reduced their roaming service charges. Both Hutch and BPL
6 Roaming facility denotes a cellular phone’s ability to receive and make calls outside the customer’s home calling area (service area).
7 The SIM card offered certain value-added services such as details of train/flight schedules and movie timings, check bank balance and download music tunes or pictures on their cell phones.

106
Marketing Management
announced a flat rate of Rs 1.49 (60 seconds) as roaming charges, as against the previous Rs 3 (60 seconds) on all partner networks.
In January 2002, Spice allowed national roaming named Spice Quicky on its pre-paid card. In late 2002, in the light of price slashes by Bharti, Hutch and BPL, MTNL also slashed tariff rates of its Dolphin cellular service in Mumbai and Delhi, in order to sustain its market in these circles. Escotel, one of the leading cellular service providers in UP (West) launched roaming services (both incoming and outgoing) for its pre-paid card subscribers in late 2002. It announced plans to extend these services to its other circles as well.
In mid 2002, Idea Cellular Ltd. planned to focus on creating brand awareness and launched an aggressive advertising campaign with an ad-spend of Rs 630 million (7% of its net revenues). The company developed new TVCs to highlight the company’s tagline ‘Liberation through idea.’ Apart from its advertising strategies, the company announced plans to offer various value-added services that included games on mobile, SMS in 9 languages and pre-paid roaming facility. However, the company decided against the usage of celebrity endorsements for its pre-paid cellular service, Idea ChitChat.
Bharti’s competitors launched various promotional campaigns for their brands – many of them copying those of Bharti’s. While Spice awarded free talk-time to winners of a Soccer World cup related promotional event, the subscribers of Idea ChitChat in Andhra Pradesh could win gold coins, watches and talk-time under a special scheme.
However, the most severe competition was witnessed in the area of tariff reduction. In
the Karnataka circle, Spice reduced tariff rates on its pre-paid cellular cards, Simple
and Uth in mid 2002. According to the new rates, Simple subscribers were required to
pay Rs 1.49 (30 seconds) both for incoming and outgoing calls (24 hours a day) and
Uth subscribers were required to pay only Rs 0.5 (30 seconds) at night as against Rs
0.75 charged previously. In September 2002, Spice even offered interesting and even
useful information like train timings, astrology, news, movie tickets, cricket updates,
stock market news through its brand, Genie. With Hutch Essar entering the Karnataka
cellular market as the fourth operator in 2002, both Bharti and Spice were devising
strategies to retain their respective positions in the market. The case was the same in
Andhra Pradesh (AP), where Hutch entered in August 2002.
Hutch8 was becoming a formidable competitor for Bharti in many circles. With its
aggressive marketing and promotional campaigns and a range of value added services,
Hutch had garnered considerable shares in many circles by mid 2002. Value added
services offered by Hutch (through its advanced 16K SIM) included regional roaming,
dial-in service, voice messaging (in India and even to US or Canada), voice mail,
voice response service, unified messaging service and other online menu services
(such as SMS, railway information, train timings, movie tickets, stock market news,
TV schedules). In Kolkata, Hutchison’s Command recorded over 55.03% growth
between January and August 2002, while Orange, Essar and Fascel reported growth
rates of 46%, 36.67% and 46.29% respectively for the same period.
In early August 2002, Hutchison announced a new scheme ‘Go Hutch for Rs 74’ in
Andhra Pradesh, wherein pre-paid customers were offered a talk time of worth Rs 175
on purchase of a pre-paid card of Rs 249, which made Hutch pre-paid card cheaper to
other pre-paid cellular services in the state. In response to this, Bharti introduced its
new Magic Recharge scheme, under which, subscribers could accumulate free talk
time for every fourth recharge card bought.
8 A brand belonging to the Hutchison group. Hutchison operated through the Orange, Hutchison Max (Mumbai), Celforce (Gujarat) and Hutch/Hutch Essar (Andhra Pradesh, Karnataka, Delhi and Chennai) brands.

107
Airtel Magic – Selling a Pre-Paid Cellphone Service
Bharti decided to design different marketing strategies for different circles depending on the strategies, employed by the competitors. While the company was focusing on its pricing strategies, its competitors in various sectors were concentrated on new service offerings and value additions (For instance, in the Chennai circle, the cellular war between RPG Group, Bharti and Hutch was more value and service driven). Since price reduction moves were almost immediately matched by the players, companies had begun focussing on developing value-added offerings and schemes to expand their market and gain customer loyalty. Analysts remarked that the players were coming up with new schemes or value-additions almost every week to get the better of their competitors.
Some such schemes launched in mid 2002 included Tamil SMS and Audiotimes (a
service which enabled subscribers to send song clippings to other cell phone users) by
RPG. Bharti shot back with an offer wherein new Magic subscribers were given an
audiocassette containing popular Tamil movie songs. Various value-added services
were also offered in late 2002 in Chennai such as Panchangam (SMS-based), which
informed customers about good (and bad) timings during the day. Bharti also tied up
with a leading Internet portal, indiatimes.com to offer news headlines and stock
market news through SMS.
By constantly keeping itself abreast with the moves of its competitors and launching
various proactive/reactive schemes, Bharti was able to retain its leadership position.
Despite continual attacks from Hutch, RPG, Spice, Idea Cellular and BPL, Bharti’s
cellular services received good high response in all circles during 2002. It was
reported that in Mumbai, 60-75% of customers seeking Airtel services were BPL
Mobile and Hutch subscribers. In fact, it was becoming difficult for the company to
activate cellular connections in Mumbai swiftly on account of the high rush – in some
cases, it took almost three days to activate a connection.
THE FUTURE – FAR FROM MAGICAL
While the players in the cellular market in India were focussing heavily on the pre-paid card segment due to its high potential, some analysts expressed doubts about the profitability of this segment in the long run. They said that low profit margins from the pre-paid segment (on account of low tariff and high advertising, promotional and customer service costs) could lead to losses in the long run.
As the fierce competition would make price-cuts and heavy investments in advertising and promotions inevitable, this seemed quite possible. However, it was believed such problems might be overcome by building up a vast customer base and making up for margins by increasing sales volumes (A company’s cost per subscriber decreased with the increase in the subscriber base, thereby, resulting in increased margins.)
However, the biggest challenge came in the form of CellOne, a cellular service launched by the state-owned telecom major, Bharat Sanchar Nigam Ltd. (BSNL) in October 2002. Not only were the rental charges of CellOne much lower than those of any other player, BSNL had plans to (further) reduce tariff. Given the vast reach of BSNL and years of experience in the Indian telecom sector, the new, private players were justified in their fears. Moreover, BSNL did not have to pay any license fee (8-12% of the revenue share paid by all private players) to the government. Being a major stakeholder in the fixed line telephone network (90%), it did not have to shell a large share of its revenues as interconnect charges (over 70% of the calls made from cellular network used fixed line network) for routing calls, both landline and STD.
With such control (on fixed line network) and established infrastructure, BSNL could pose a severe threat to its competitors on the pricing front. With the Department of Telecommunications announcing plans to grant International Long Distance (ILD)

108
Marketing Management
license to BSNL and BSNL planning to acquire a subscriber base of over 4 million (by late 2003 across 1,000 cities), the competition in the cellular market was expected to intensify further.
Meanwhile, true to the belief of industry observers that the cellular telecom sector would see product/service innovations, Bharti launched a two-in-one cellular card in October 2002. This product offered both the features of post-paid and pre-paid cards in one card 9. It was aimed at customers residing in places where post-paid facilities were not available. The product was available with all Magic vendors and ICICI’s ATMs.
Commenting on Bharti’s leadership position, representatives of BPL and Hutch said that Bharti might seem to have an advantage at present but it was a long-term game and it was too early to respond. As the market awaited the response of other competitors in November 2002, Indian pre-paid cellular services customers expected the future to be anything but dull. Competitive tariff plans, value-added services and to top it all, entertaining advertisement campaigns – customers, perhaps, could not have asked for more!
Questions for Discussion:
1. Explore the circumstances in which Bharti launched Magic and explain the strategies adopted by the company to establish Magic in the Indian pre-paid card market. Identify the reasons for the instant success of Magic in India.
2. Examine the need for marketing revamp and repositioning of Magic brand during early 2002. Do you think Bharti succeeded in the repositioning efforts for Magic? Discuss.
3. Discuss the strategic moves of Bharti’s competitors to counter its aggressive marketing strategies to expand its market in the early 2000s. How far were these competitors successful?
4. Critically examine Bharti’s future in the pre-paid card market, in the light of the intensified competition, entry of BSNL and low margins available in the business. Suggest how Bharti could retain its leading position in the pre-paid cellular card market.
© ICFAI Center for Management Research. All rights reserved.
9 The starter pack of the product costed Rs 999, which included an airtime worth Rs 499 and which carried an additional charge of Rs 10 as rental charge every day. For both, incoming and outgoing calls, customers were charged at Rs 1.15 (30 seconds) between 8 am and 9 pm and Rs 0.25 between 9pm and 8am.

109
Airtel Magic – Selling a Pre-Paid Cellphone Service
Exhibit I
Cellular Telephony & the Pre-Paid/Post-Paid Issue
The basic concept of cellular phones originated in 1947 in the US, when researchers at Bell Laboratories got the idea of cellular communications from the mobile car phone technology used by the police department of the country. However, it took over three decades for the first cellular communication system to evolve. The public trials of the first cellular system began in Chicago during the late 1970s and the cellular telephone services were introduced in the US in the early 1980s, and gained popularity in a short span of time. By the late 1980s, cellular services had become popular in many developed countries across the world. Over the years, on account of dynamic technological advancements in the sector there was an improvement in the number and quality of services provided.
There were mainly, two types of cellular services offered by operators – post-paid and prepaid:
Post paid cellular services, also called billing card services, required the customers to pay for the cellular services utilized by them at the end of a specific period (generally, every month). These services also included fixed rental charges for the services provided. Post-paid cards were just like telephone bills and electricity bills, which have to be paid at regular intervals.
Prepaid cellular services required the customers to pay in advance for the services they were to use. These cards were available in different denominations, and the customer could choose one keeping in mind his/her call requirements and budget. The services were withdrawn when the customers exhausted the call time they were entitled to.
Pre-paid cellular services drastically increased cellular penetration across the world, redefined the subscriber segments and operator market shares, and resulted in the creation of new sales channels and service processes. As per a report on www.cellphones.about.com, the pre-paid cellular user base was drastically increasing across the world in the early 21st century. In Europe, more than 57% of cellular users were reportedly planning to shift to prepaid card services, while in Canada, the prepaid subscriber base was posting double growth rate as compared to post-paid services.
In Japan, China and Singapore, the pre-paid segment grew at a considerable pace in 2002. In the US, though the prepaid cellular market amounted to only 10% of the total cellular market, the number of subscribers opting for pre-paid card services increased significantly during the early 2000s.
The reasons for the above were not difficult to understand – pre-paid cellular services were much cheaper compared to post-paid services as there was no monthly rentals involved. Unlike the post-paid services, where the user was required to pay for the services used (plus rental charges) at the end of every month, pre-paid services require users to prepay for the airtime chosen. Pre-paid cards eliminated the risk of exceeding the spending limits as the card ‘expired’ on completion of the air time allotted.
Apart from these, prepaid cards offered other benefits like increased convenience due to elimination of credit checks/security checks/real identity disclosures/ security deposits and signing contracts. However, few disadvantages were also associated with pre-paid cards. Pre-paid cards proved expensive on a per minute basis. In general, a minute cost doubles in case of a pre-paid service as against a post-paid service. Moreover, the range of services offered in a post-paid cellular connection was generally more as compared to pre-paid card services. Value added services were charged at a higher price for pre-paid card owners.
Source: ICMR

110
Marketing Management
Exhibit II
About The Bharti Group
The Bharti Group has been a leading player in the Indian telecom industry ever since its entry into the sector during the early 1990s. Bharti Tele-Ventures, a part of Bharti telecom, offered various telecom services such as cellular, fixed line, V-SAT and the Internet. The operations of Bharti Tele-Ventures were managed by four wholly owned subsidiaries. These included Bharti Cellular Ltd. (Cellular), Bharti Telenet Ltd. (Access), Bharti Telesonic Ltd. (Long Distance) and Bharti Broadband Networks Ltd. (Broadband Solutions). The flagship services of the Bharti group in different telecommunication markets included Airtel (cellular), Mantra (Internet Services) and Beetel (telephone instruments).
Bharti Cellular Ltd. was one of the first private players that entered the cellular telephony sector in India. Bharti launched Airtel, a post-paid cellular service in Delhi in November 1995. Bharti laid the foundations of the Indian cellular business and Airtel became a popular brand due to its innovative marketing strategies, continuous technological upgradations, new value-added service offerings and efficient customer service. Initially, confined only to the Delhi circle, Airtel services were extended to other places as well. Bharti revolutionized the cellular market in India. It was the first cellular operator to set cellular showrooms – Airtel Connect, a one stop cellular shop where the customers could purchase handsets, get new connections, subscribe to various value-added services and pay their mobile bills. Bharti was also the first player to provide roaming cellular services and other services such as Smart mail, Fax facility, Call hold, Call waiting and Webmessage. On account of such initiatives, Airtel was even voted the ‘Best Cellular Service’ in the country for four consecutive years (1997-2000).
Bharti acquired fourth operator license in eight circles in India during July 2001, following which it launched its services in Mumbai, Maharashtra, Gujarat, Haryana, Uttar Pradesh (West), Kerala, Tamilnadu and Madhya Pradesh in 2002. Bharti also launched its services in Punjab in early 2002, when the Department of telecommunication re-allotted the license to Bharti empowering it to operate in Punjab. In 2002, Bharti along with the other two leading cellular players, Hutchison and BATATA-BPL accounted for over 67% of the total Indian cellular services market. The remaining market was shared by Escotel, Aircel, Koshika, Spice Communications, Reliance Telecom, BSNL and MTNL.
In the early 21st century, many leading players were seen entering into partnerships with one another to sustain the increasing competitive pressures and achieve higher economies of scale. A series of mergers and acquisitions followed. In June 2002, Idea Cellular (consolidated cellular services of Birla, AT &T and Tata) merged with BPL cellular in order to consolidate their position. Hutchison acquired complete control of Fascel. Bharti also followed this trend and acquired Skycell Communications Ltd., a leading player in Chennai in mid 2002 and renamed it as Bharti Mobinet Ltd. It also acquired Spice Cell in Kolkata.
Source: ICMR
Exhibit III
OLD LOGO OF MAGIC NEW LOGO OF MAGIC
Source: www.rayandkeshav.com

111
Airtel Magic – Selling a Pre-Paid Cellphone Service
Exhibit IV
Post-Paid & Pre-Paid Cellular Brands in India (Late 2002)
Telecom Circle Post-Paid Brands Pre-Paid Brands
Himachal Pradesh
AirTel, Reliance Telecom, Escortel
NA
Delhi Airtel, Idea, Hutchison, Dolphin Airtel Magic, Idea ChitChat, Hutch
Punjab Spice Communications, Airtel Spice, AirTel Magic
Haryana Escotel, Aircel, Airtel Escotel, AirTel Magic
UP West Escotel, Airtel Airtel Magic, Escotel
UP East Aircel, Escotel Aircel and Escotel
Madhya Pradesh RPG Cellular, Airtel, Reliance telecom
RPG
Gujarat Fascel, Idea, Airtel, Celforce Fascel, Idea ChitChat, Airtel Magic, Celforce
Kolkatta Airtel, Usha Martin, Hutchison Airtel Magic, Hutch
Mumbai BPL, Hutchison Max, Airtel BPL, Hutch, Airtel Magic
Maharashtra BPL Mobile cellular, Idea, Airtel Airtel Magic, Idea ChitChat, BPL
Andhra Pradesh Idea, Airtel, Hutch Essar Idea ChitChat, Airtel Magic and Hutch
Karnataka Spice Communications, Airtel, Hutch Essar
Spice, Airtel Magic, Hutch
Chennai RPG Cellular, Airtel, Hutch Essar
Airtel Magic, RPG, Hutch
Kerala BPL Cellular, Escotel Mobile, Airtel
BPL, Escotel, Airtel Magic
Tamil Nadu BPL Mobile, Aircel, Airtel BPL, Airtel Magic, Aircel
Source: ICMR
Cellular Service Subscriber Base in India
Circle Jan-02 Feb-02 Growth/decline *m-o-m (in %)
Feb-01 Growth/decline *y-o-y(in %)
All Metros 2.260 2.374 5.05 1.304 82.0
A Circle 1.965 2.065 5.10 1.101 87.5
B Circle 1.306 1.391 6.54 0.903 54.0
C Circle 0.207 0.218 5.14 0.109 99.8
All India 5.738 6.048 5.41 3.417 77.0
Source: www.geocities.com/mabaalaji/wn2.html

112
Marketing Management
Additional Readings & References:
1. Pre-paid Wireless – Buy Now, Talk Later, www.commercetimes.com, April 12, 2001.
2. Value-adds To Drive Chennai Cell Market Post 4th Operator Entry, Financial Express, June 2002.
3. Bharti to Roll Out Services Today, http://in.biz.yahoo.com, July 2002.
4. AirTel Magic Goes Roaming in South, www.deccanherald.com, July 26, 2002.
5. Panchal Salil, Cellular Phones War Hots Up Again, www.rediff.com, August 2002.
6. Joseph Jaimon, Airtel: Magic in the Making, http://in.biz.yahoo.com, August 2002.
7. Hutch Offers New Pre-paid Scheme in AP, www.blonnet.com, August 9, 2002.
8. Panchal Salil, The Cellular Arena: How do the Gladiators Stand, www.rediff.com, August 2002.
9. Mo Crystyl, Growth at all Costs, www.asiaweek.com, August 31, 2002.
10. CellOne May Trigger Rate War, http://autofeed.msn.co.in, October 5, 2002.
11. AirTel Hopes To Create Magic In This Segment, www.agencyfaqs.com, October 10, 2002.
12. Cellular Operators at War –Consumers Set to Win, http://server1.msn.co.in, October 2002.
13. Das Gupta Surajeet, Taking a Call on Branding, www.business-standard.com, 2002.
14. www.blonnet.com
15. http://cal.airtelworld.com
16. www.airtelworld.com
17. www.spicetele.com
18. www.spicecorpltd.com
19. www.coai.com
20. http://inventors.about.com
21. www.geocities/mabaalaji/awn2001.html
22. http://www.geocities.com/mabaalaji/wn2.html
23. www.deccanherald.com

L’ oréal – Building a Global Cosmetic Brand “It is a strategy based on buying local cosmetics brands, giving them a facelift and exporting them around the world.”
- One Brand at a Time: The Secret of L’Oréal’s Global Makeover, www.fortune.com, August 12, 2002.
L’ORÉAL MAKES WAVES
In November 2002, L’Oréal, the France-based leading global cosmetics major, received the ‘Global Corporate Achievement Award 2002,’ for Europe by ‘The Economist Group.’ Awarded by the publisher of the world’s leading weekly business and current affairs journal ‘The Economist,’ the honor was given in appreciation and recognition of the ‘depth, breadth, and diversity of L’Oréal’s management team.’
In the same month, L’Oréal’s Chairman and CEO, Lindsey Owen Jones (Jones) was honored with the ‘Best Manager of the Last 20 Years’ title by the French Minister of Finance and Economy, Francis Mer. This award instituted by the leading French business publication, Challenges, was in recognition of Jones’ outstanding achievements in transforming L’Oréal from a French company into a global powerhouse. Jones also received the prestigious ‘Manager of the Year 2002’ award from the French Prime Minister, Jean-Pierre Raffarin. Jones was the first foreign head of any French company to receive this award, which was sponsored by the leading French business publication, Le Nouvel Economiste.
These honors were not just a ‘cosmetic’ eulogy; L’Oréal deserved them, for it was the only company in its industry to post a double-digit profit for 18 consecutive years (Refer Exhibit I for L’Oréal’s key financials). L’Oréal, which had operations in 130 countries in the world, posted a turnover of € 13.7 billion1 in 2001. The company recorded a 19.6% and 26% growth in profit in 2001 and 2002 (half-yearly results), respectively. Commenting on L’Oréal’s performance, Jones said, “At L’Oréal, we are 50,000 people who share the same desire; because it is not just about business but about a dream we have to realize, perfection.”
Known for its diverse mix of brands (from Europe, America and Asia), like L’Oréal Paris, Maybelline, Garnier, Soft Sheen Carson, Matrix, Redken, L’Oréal Professionnel, Vichy, La Roche-Posay, Lancôme, Helena Rubinstein, Biotherm, Kiehl’s, Shu Uemura, Armani, Cacharel and Ralph Lauren, L’Oréal was the only cosmetics company in the world to own more than one brand franchise and have a presence in all the distribution channels of the industry (Refer Exhibit II for a note on the global cosmetics industry).
BACKGROUND NOTE
In 1907, Eugene Schueller (Schueller), a French chemist, developed an innovative
hair color formula. The uniqueness of this formula, named Aureole, was that it did not
damage hair while coloring it, unlike other hair color products that used relatively
harsh chemicals. Schueller formulated and manufactured his products on his own and
sold them to Parisian hairdressers. Two years later, in 1909, Schueller set up a
company and named it ‘Societe Francaise de Teintures inoffensives pour Cheveux.’
From the very beginning, Schueller gave a lot of importance to research and
innovation to develop new and better beauty care products. By 1920, the company
1 April 2003 exchange rate: $ 1.08569 = 1 €.

114
Marketing Management
employed three in-house chemists and made brisk business selling hair color in
various countries like Holland, Austria and Italy. Schueller used advertising in a major
way to market his products. He used promotional posters made by famous graphic
artists like Paul Colin, Charles Loupot, and Raymond Savignac to promote his
company’s products.
In 1933, Schueller, created and launched a beauty magazine for women named, Votre Beaute. In 1937, he started the ‘clean children’ campaign and created a jingle ‘Be nice and clean, smell good’ for Dop shampoo, which went on to become one of the most famous jingles in France. In the early 1940s, the company’s name was changed to L’Oréal, which was an adaptation of one of the brands ‘L’Aureole’ (the halo).
In 1957, after Schueller’s death, Francois Dalle (Dalle), Shueller’s deputy, took over as the company’s Chairman and CEO. During the 1950s, the company pioneered the concept of advertising products through film commercials screened at movie theaters. The first movie advertisement was for L’Oréal’s ‘Amber Solaire’ (sun care cream) with the tagline, “Just as it was before the war, Amber Solaire is back.”2
In 1963, L’Oréal became a publicly traded company. This posed a threat to its existence as it could easily come under the state’s control,3 which in turn could affect its international growth plans. Dalle therefore began taking steps to internationalize L’Oréal’s ownership structure to prevent it from coming under the control of the government. His efforts bore fruit a decade later in 1973, when he persuaded Liliane Bettencourt (Bettencourt), Schueller’s daughter and the company’s main shareholder, to dilute her majority stake. Later, half of L’Oréal’s stock was sold to Gesparal, a France-based manufacturer of personal care products, while the other half was publicly traded. Later, 49% of Gesparal’s stock was sold to Nestlè, the Swiss food products giant, while the remaining 51% was held by Bettencourt.
In 1972, the company launched the legendry advertisement campaign ‘Because I’m worth it’ to promote the ‘Preference’ line of hair color. The slogan summed up the company’s philosophy of providing the most innovative, high-quality and advanced products at an affordable price. The campaign was considered as brilliant by many marketing gurus. The slogan seemed to cleverly differentiate L’Oréal’s products from others and proved to be a ‘winning’ factor.
In the cosmetics business, profit margins tend to be generally low as there was not much differentiation between the products offered by various companies. L’Oréal’s decision to differentiate its products by attaching an emotional quality to its brands thus worked very well. The emotional pitch, ‘Because I’m worth it,’ indirectly conveyed the message that “I’m willing to pay more”. According to a www.republic.org article, it conveyed that, “I will prove that I value myself by paying more than I have to.” This translated directly into profits for the company. Commenting on the campaign, an analyst stated, “The extra 50% L’Oréal charges for nothing other than your warm glow of self-satisfaction, goes from your pocket right to theirs, and everyone’s happy. Genius.”
Over the next few years, the company’s business expanded considerably. It started distributing its products through agents and consignments to the US, South America,
2 Initially launched in 1936, Amber Solaire was withdrawn from the market during the war period due to production hitches. It was re-launched in 1957.
3 The French people were attached to the notion of having a special identity called the ‘l’exception française’, which was nurtured by all French politicians. It was rooted in two beliefs: the threat from the outside world (global trade and Anglo-Saxon economics) and the role of the French state in preventing such threat. The French political system was attached to the idea of a strong French state, which could provide security to the French community and its trade. Therefore, the French state played a central role in subsidizing, managing and directing the ways in which France’s publicly owned businesses were managed. L’Oréal being a publicly traded company was easily susceptible to come under the state’s influence.
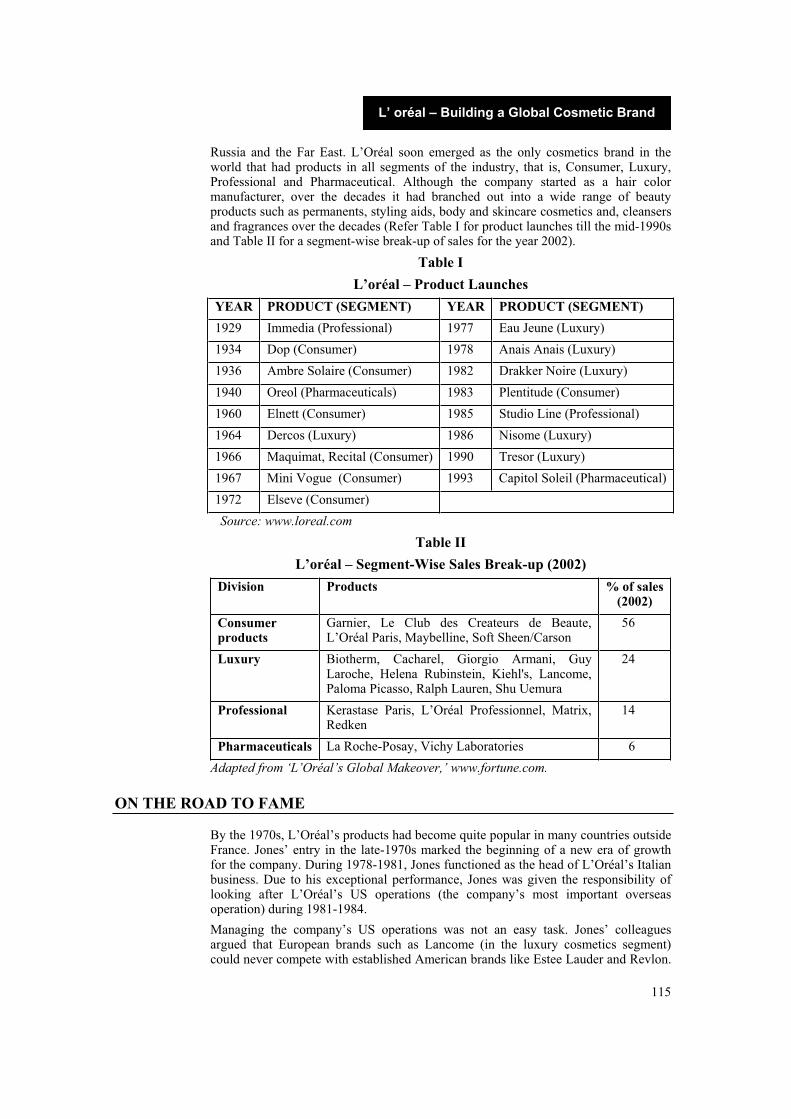
115
L’ oréal – Building a Global Cosmetic Brand
Russia and the Far East. L’Oréal soon emerged as the only cosmetics brand in the world that had products in all segments of the industry, that is, Consumer, Luxury, Professional and Pharmaceutical. Although the company started as a hair color manufacturer, over the decades it had branched out into a wide range of beauty products such as permanents, styling aids, body and skincare cosmetics and, cleansers and fragrances over the decades (Refer Table I for product launches till the mid-1990s and Table II for a segment-wise break-up of sales for the year 2002).
Table I
L’oréal – Product Launches
YEAR PRODUCT (SEGMENT) YEAR PRODUCT (SEGMENT)
1929 Immedia (Professional) 1977 Eau Jeune (Luxury)
1934 Dop (Consumer) 1978 Anais Anais (Luxury)
1936 Ambre Solaire (Consumer) 1982 Drakker Noire (Luxury)
1940 Oreol (Pharmaceuticals) 1983 Plentitude (Consumer)
1960 Elnett (Consumer) 1985 Studio Line (Professional)
1964 Dercos (Luxury) 1986 Nisome (Luxury)
1966 Maquimat, Recital (Consumer) 1990 Tresor (Luxury)
1967 Mini Vogue (Consumer) 1993 Capitol Soleil (Pharmaceutical)
1972 Elseve (Consumer)
Source: www.loreal.com
Table II
L’oréal – Segment-Wise Sales Break-up (2002)
Division Products % of sales (2002)
Consumer products
Garnier, Le Club des Createurs de Beaute, L’Oréal Paris, Maybelline, Soft Sheen/Carson
56
Luxury Biotherm, Cacharel, Giorgio Armani, Guy Laroche, Helena Rubinstein, Kiehl's, Lancome, Paloma Picasso, Ralph Lauren, Shu Uemura
24
Professional Kerastase Paris, L’Oréal Professionnel, Matrix, Redken
14
Pharmaceuticals La Roche-Posay, Vichy Laboratories 6
Adapted from ‘L’Oréal’s Global Makeover,’ www.fortune.com.
ON THE ROAD TO FAME
By the 1970s, L’Oréal’s products had become quite popular in many countries outside France. Jones’ entry in the late-1970s marked the beginning of a new era of growth for the company. During 1978-1981, Jones functioned as the head of L’Oréal’s Italian business. Due to his exceptional performance, Jones was given the responsibility of looking after L’Oréal’s US operations (the company’s most important overseas operation) during 1981-1984.
Managing the company’s US operations was not an easy task. Jones’ colleagues argued that European brands such as Lancome (in the luxury cosmetics segment) could never compete with established American brands like Estee Lauder and Revlon.

116
Marketing Management
In spite of their doubts and the reluctance of retailers to carry European brands, Jones persuaded Macy’s, one of the leading retail stores in the US, to give Lancome the same shelf space that it gave to Estee Lauder. Not surprisingly, Lancome’s sales increased by 25% in the US in 1983.
Jones, a company insider with good management skills, succeeded Dalle as L’Oréal’s Chairman in 1988. He was aware that Dalle had begun the work of internationalizing L’Oréal to prevent it from remaining as ‘just a French cosmetics company.’ As he tried to continue Dalle’s work, he realized that he had to tackle the situation created by L’Oréal’s image.
During the late 1980s and early 1990s, almost 75% of the company’s sales were in Europe, mainly in France. L’Oréal’s image was so closely tied to Parisian sophistication, it was difficult to market its brands internationally. Jones thus decided to take a series of concrete steps to make L’Oréal a globally recognized brand and the leading cosmetics company in the world. In what proved to be a major advantage later on, he decided to acquire brands of different origins.
In the cosmetics industry, companies did not acquire diverse brands; they generally homogenized their brands to make them acceptable across different cultures. By choosing to work with brands from different cultures, Jones deliberately took L’Oréal down a different road. Commenting on his decision, Jones said, “We have made a conscious effort to diversify the cultural origins of our brands.” The rationale for the above decision was to ‘make the brands embody their country of origin.’ The reason Jones had so much conviction in this philosophy was his own multicultural background (he was born in Wales, studied at Oxford and Paris, married an Italian, and had a French-born daughter). Many analysts were of the opinion that Jones had turned what many marketing Gurus had considered a ‘narrowing factor’ into a ‘marketing virtue’.
MAY BE? NO, IT ‘IS’ MAYBELLINE
One of the first brands that L’Oréal bought in line with the above strategy was the Memphis (US) based Maybelline.4 The company acquired Maybelline in 1996 for $ 758 million. Buying Maybelline was a risky decision because the brand was well known for bringing out ordinary, staid color lipsticks and nail polishes. In 1996, Maybelline had a 3% share in the US nail enamel market. Maybelline was not a well-known brand outside the US. In 1995-96, only 7% of its revenues ($350 million) came from outside the US. L’Oréal decided to overcome this problem by giving Maybelline a complete makeover and turning it into a global mass-market brand while retaining its American image.
The first thing that L’Oréal did was to move Maybelline’s headquarters to New York, a city known for its fast and sophisticated lifestyles. Commenting on this decision, Jones said, “Memphis just did not quite fit the sort of profile for finding some of the key people we needed.” Then L’Oréal aggressively promoted the US origins of Maybelline by attaching the tagline ‘Urban American Chic’ to it. The company also attached ‘New York’ to the brand name in order to associate Maybelline with ‘American street smart.’
In 1997, the company launched Maybelline’s new make-up line called ‘Miami chill’
with bold colors like yellow and green. This gave the brand a new look and targeted it
4 Maybelline was established in 1915 in the US by T L Williams. After beginning with the hugely successful mascara (a cosmetic to darken the eyelashes), Maybelline expanded its product portfolio to include other cosmetics and built up a sizeable brand equity. Till 1967, it was under the control of the Williams family. It was sold to Plough Inc. (later Schering-Plough Corp.) in 1971, to Wasserstein Perella & Co. in 1990, and finally to L’Orèal in 1996.

117
L’ oréal – Building a Global Cosmetic Brand
at spirited and lively teenagers and middle-aged women. It also renamed Maybelline’s
‘Great Finish’ line of nail polish ‘Express Finish,’ because the nail enamel dried
within one minute of application. The company positioned it as a product used by the
‘urban woman on the go.’
This revamp was very successful: Maybelline’s market share in the US increased to
15% in 1997 from just 3% in 1996. In addition, Maybelline’s sales rose steeply from
just over $320 million in 1996 to $ 600 million in 1999. In 1999, buoyed by the
success of Maybelline in the US, L’Oréal acquired the Maybelline brand in Japan
from Kose Corporation, the brand’s Japanese distributor, thus gaining world rights to
Maybelline.
L’Oréal introduced its new line of Maybelline lipsticks and nail polishes in the Japanese market. However, Maybelline’s ‘Moisture Whip’ (a wet look lipstick) did not do well in Japanese markets as it dried quickly after application. L’Oréal gave the lipstick a makeover by adding more moisturizers to it. The new Japanese version of ‘Moisture Whip’ was given a new name ‘Water Shine Diamonds.’ Water Shine Diamonds became a runaway success in Japan. Commenting on the success of the brand, Yoshitsugu Kaketa, L’Oréal’s Consumer-Products General Manager (Japan), said, “It was so successful in Japan that we started to sell Water Shine in Asia and then around the world.”
By the end of 1999, Maybelline was being sold in more than 70 countries around the world. While in 1999 50% of the brand’s total revenues came from outside the US, by 2000 the figure increased to 56%. Maybelline became the leading brand in the medium priced makeup segment in Western Europe with a 20% market share. Commenting on the company’s superior brand management framework, an August 2000 www.industryweek.com article stated, “L’Oréal achieved sales growth of nearly 20% by developing new products, expanding into key international markets, and investing in new facilities, all the while concentrating on increasing the reach of the group’s top 10 brands.”
CASHING IN ON THE MAYBELLINE FORMULA
Maybelline’s success proved Jones’ philosophy of creating successful cosmetic brands by embracing two different yet prominent beauty cultures (French and American). Commenting on this, Guy Peyrelongue, head of Maybelline, Cosmair Inc.,5 US Division, said, “It is a cross-fertilization.” L’Oréal followed this strategy for the other brands it acquired over the years, such as Redken (hair care), Ralph Lauren (fragrances), Caron (skin care and cosmetics), SoftSheen (skin care and cosmetics), Helena Rubenstein (luxury cosmetics) and Kheil (skin care) (Refer Table III).
Table III
Origins of Some L’oréal Brands
ORIGIN BRANDS
EUROPEAN L’Oréal Paris, Garnier, Vichy, La Roche-Posay, Lancome, Giorgio Armani, Cacharel, Biotherm, L’Oréal Professional Paris.
US Kiehl’s, Ralph Lauren, Matrix, Redken, Softsheen-Carson, Maybelline, Helena Rubinstein.
ASIAN Shu Uemura.
Source: www.loreal-finance.com.
5 L’Oréal’s wholly-owned US subsidiary.

118
Marketing Management
L’Oréal acquired the above relatively unknown brands, gave them a facelift, and repackaged and marketed them aggressively. The US-based hair care firms Soft Sheen and Carson were acquired in 1998 and 2000 respectively. Both these brands catered to African-American women. Jones merged these two brands as SoftSheen/Carson and used them as a launch pad to aggressively promote itself outside the US – specifically Africa. As a result, the brand derived over 30% of its $ 200 million revenues in 2002 from outside the US, most of it from South Africa.
L’Oréal firmly believed in the strategy of promoting all its brands in different nations. Even though it had brands originating in different cultures, it sold all its different lines in all countries. However, L’Oréal promoted only one brand aggressively in a country. The brand to be promoted was selected on the basis of the local culture. Thus, for people who preferred ‘American’ products, L’Oréal promoted Maybelline, and for those who preferred ‘French’ products, the L’Oréal brand was promoted. Similarly, the company promoted Asian and Italian brands for customers who preferred them.
Jones also encouraged competition between the different brands of the company. For instance, L’Oréal acquired Redken, a US-based hair care brand in 1998, and introduced it in the French market, where it would have to compete with L’Oréal’s Preference line of hair care products. Analysts were skeptical of this move as they thought introducing new brands in the same category would cannibalize L’Oréal’s own, established brands. However, Jones took a different point of view; he argued that the competition would inspire both the Redken and Preference marketing teams to work harder.
Since self-competition was encouraged at L’Oréal, teams had ample freedom to innovate and develop better products. This kind of competitive spirit from within allowed L’Oréal to beat competition from other players in the market. Commenting on this, Jones said, “The only way to favor creativity in large corporations is to favor multiple brands in different places which compete with each other.”
To encourage competition and nurture creativity, L’Oréal operated two research centers – one in Paris and the other in New York. These centers helped Jones maintain L’Oréal’s image as the ‘scientific’ beauty company. The company spent around 3% of its revenues on research every year, which was more than the industry average of less than 2%. L’Oréal employed 2,700 researchers from all over the world and had 493 patents registered in its name in 2001, the largest ever for any cosmetics company in one year.
L’Oréal made sure that each of its brands had its own image and took care that the image of one product did not overlap with the image of another product. A cosmetics industry analyst, Marlene Eskin, said, “That is a big challenge for this company – to add brands, yet keep the differentiation.”
One of L’Oréal’s most radical experiments was the makeover and re-launch of the Helena Rubinstein skin care and cosmetics brand. Originally positioned in the luxury segment, Helena Rubinstein had the image of a product used by middle aged-women. In 1999, L’Oréal relaunched the brand and targeted it at a much younger and trendier audience than the brand’s typical luxury customers (middle aged-women). Now, the target users were women aged between 20-30 years, living in urban centers like London, Paris, New York and Tokyo. The company also opened a Spa6 in New York to promote the brand (the first instance of a company attempting to run a retail operation as part of a promotional package).
L’Oréal also made use of ‘dramatic’ advertisements to promote the brand. In one of its advertisements, the model sported a green lipstick and white eye-shadow. Many
6 The word spa (originally name of famous mineral springs in Spa, Belgium) refers to any place/resort that has one or more of the following facilities: therapeutic baths, massages, mineral springs, health improvement, beauty treatment, exercise, relaxation and meditation (not an exhaustive list).

119
L’ oréal – Building a Global Cosmetic Brand
analysts even thought that such advertising for a traditional luxury brand was incoherent. However, Jones argued that industry observers who held this opinion had not taken into account how fast the market was changing. He said, “Is it incoherent for younger people to buy luxury cosmetics? Why? Perhaps it was 10 years ago when luxury was equated to the middle-aged customer. But sorry, the biggest luxury consumers in all of Asia, which is one of the strongest luxury markets in the world, are between 20 and 25. This is why the Guccis and Pradas have taken the luxury-goods market by storm.”
Jones also said, “The worldwide luxury consumer no longer equates to a middle-aged lady. She can be. But she can also be young and trendy. So the whole idea that it is incongruous for Helena Rubinstein to be cutting edge in terms of image and makeup is out of date by about 10 years. On the contrary, it is very good, original positioning for Helena Rubinstein to be the coolest of the traditional luxury brands.” Thus, L’Oréal cleverly positioned Helena Rubinstein as a luxury brand for a younger audience without overlapping its image with that of other luxury brands like Biotherm, Lancome and Shu Umeura.
L’Oréal attached a tinge of glamour to its brands to make them more appealing to customers. The company liberally used celebrities from various fields of life, from all parts of the world, for promoting its brands. Some of the well-known personalities featured in L’Oréal’s promotional campaigns included Claudia Schiffer, Gong Li, Kate Moss, Jennifer Aniston, Heather Locklear, Vanessa Williams, Milla Jovovich, Diana Hayden, Dayle Haddon, Andie MacDowell, Laeticia Casta, Virginie Ledoyen, Catherine Deneuve, Noémie Lenoir, Jessica Alba, Beyoncé Knowles and Natalie Imbruglia.
L’Oréal’s brand management strategists believed that good brand management was all about hitting the right audience with the right product. Commenting on the company’s brand portfolio management strategies, Jones said, “It is a very carefully crafted portfolio. Each brand is positioned on a very precise segment, which overlaps as little as possible with the others.”
FUTURE PROSPECTS
L’Oréal’s efforts paid off handsomely. The company posted a profit of € 1464 million for the financial year 2002, as against € 1236 million for the financial year 2001. Its overall sales grew by 10% in 2002, and much of this increase was attributed to impressive growth rates achieved in emerging markets like Asia (of the 21% increase in sales volume, China contributed 61%), Latin America (sales grew by 22% with sales in Brazil increasing to 50%) and Eastern Europe (sales grew by 30% with sales in Russia increasing by 61%).
Industry observers noted that L’Oréal was much ahead of its competitors in terms of profitability and growth rate. L’Oréal’s rival in the luxury segment, Estee Lauder, had reportedly posted a 22% drop in profits in August 2002. The company had also announced a cost-cutting program. Even Revlon, L’Oréal’s competitor in the mass-market segment, had posted nine consecutive quarterly losses since late-2001.
Not all competitors were in such bad shape though; rival companies like Beiersdorf (a Germany-based company that owns the globally popular brand Nivea), Avon and Procter & Gamble had been performing quite well. However, industry analysts agreed that no other cosmetics player matched L’Oréal’s combination of ‘strong brands, global reach, and narrow product focus.’
In March 2003, L’Oréal ventured into new businesses that were closely related to its core activities. One such initiative was Laboratoires Innéov, L’Oréal’s joint venture with Nestlè. Through Inneov, L’Oréal entered the market of cosmetic nutritional supplements. Analysts observed that this would mark the beginning of

120
Marketing Management
‘neutraceutical’7 development. A research analyst at Frost and Sullivan (US-based leading provider of strategic market and technical information), commented, “The Inneov business will draw on both the growing demand for skin products designed to retain youthfulness and the growing market for dietary supplements.”
L’Oréal expected the cosmetics market to grow at 4%-5% per annum in the future. Looking at the future with optimism, Jones said, “No other consumer products group has grown as quickly as we have. The prospects for the next three to four years seem promising to me. L’Oréal has the good fortune of being involved in a business that is a bit less sensitive than others to economic cycles. When the economic climate is bleak, you might put off buying a new car, but you will still buy a tube of lipstick that lets you ‘take a different sort of trip’ for a much smaller price.”
In March 2003, the company entered the prestigious list of the world’s fifty most admired companies compiled by leading business magazine, Fortune, for the first time. This was yet another indicator of the fact that L’Oréal seemed to be going from strength to strength each year. If the strategists at the helm of affairs continued focusing on enhancing stakeholder value year after year, the future would continue to be rosy for the company that sold millions of women the dream of living a ‘beautiful’ life.
Questions for Discussion:
1. Critically comment on L’Oréal’s global brand management strategies. Do you think L’Oréal’s strategies were primarily responsible for its impressive financial performance? What other factors helped the company remain profitable since over two decades?
2. With specific reference to Maybelline, critically comment on Jones’ strategy of acquiring relatively unknown brands of different cultural origins, giving them a makeover and marketing them globally. What are the merits and demerits of acquiring an existing brand vis-à-vis creating a new brand?
3. L’Oréal maintained a large portfolio of brands and was present in all the four segments of the cosmetics market. What positioning strategy did the company follow to ensure that the image of its brands did not overlap? How and why did L’Oréal encourage competition among its brands in a particular segment and at the same time prevent the brands from cannibalizing each other?
© ICFAI Center for Management Research. All rights reserved.
7 The term ‘Neutraceutical’ is derived by combining two words ‘nutritional’ and ‘pharmaceutical’ and refers to foods that act as medicines. Neutraceuticals act as a source of specific food that provides essential nutrients to users.

121
L’ oréal – Building a Global Cosmetic Brand
Exhibit I
L’oréal – Consolidated Financial Statements (1997-2002)
(In € million)
2002 2001 2000 (2) 1999 (1) (2)
1998 (1)
1998 1997
RESULTS OF OPERATIONS
Consolidated sales 14,288 13,740 12,671 10,751 9,588 11,498 10,537
Pre-tax profit of fully consolidatedcompanies
1,698 1,502 1,322 1,125 979 1,339 1,183
As a % of consolidated sales
11.9 10.9 10.4 10.5 10.2 11.6 11.2
Corporate tax 580 536 488 429 375 488 422
Net profit before capital gains and losses and minority interests
1,464 1,236 1,033 833 722 807 722
As a % of consolidated sales
10.2 9 8.2 7.7 7.5 7 6.9
Net profit before capital gains and lossesand after minority interests
1,456 1,229 1,028 827 719 719 641
Total dividend 433 365 297 230 191 191 165
BALANCE SHEETS
Fixed assets 8,130 8,140 7,605 5,198 5,299 5,590 5,346
Current assets 6,843 6,724 6,256 5,139 4,229 4,937 4,512
Cash and short-term investments
2,216 1,954 1,588 1,080 762 903 825
Shareholder’s equity (3)
7,434 7,210 6,179 5,470 5,123 5,428 5,015
Loans and debt 2,646 2,939 3,424 1,914 1,718 1,748 1,767
PER SHARE DATA (Notes 4 to 7)
Net profit before capital gains and lossesand after minority interests per share (8) (9) (10)
2.15 1.82 1.52 1.22 1.06 1.06 0.95
Net dividend per
share (11) (12)
0.64 0.54 0.44 0.34 0.28 0.28 0.24
Tax credit 0.32 0.27 0.22 0.17 0.14 0.14 0.12
Share price as of 31st December (11)
72.55 80.9 91.3 79.65 61.59 61.59 35.9
Weighted average number of shares outstanding
675,990,516 676,062,160 676,062,160 676,062,160 676,062,160 676,062160
676,062,160
Source: www.loreal-finance.com
(1) For purposes of comparability, the figures include:
- in 1998, the pro forma impact of the change in the consolidation method for
Synthélabo, following its merger with Sanofi in May 1999,
- the impact in 1998 and 1999 of the application of CRC Regulation no.99-02 from
1st January 2000 onwards. This involves the inclusion of all deferred tax liabilities,

122
Marketing Management
evaluated using the balance sheet approach and the extended concept, the activation
of financial leasing contracts considered to be material, and the reclassification of
profit sharing under ‘Personal costs’.
(2) The figures for 1999 and 2000 also include the impact on the balance sheet of
adopting the preferential method for the recording of employee retirement
obligation and related benefits from 1st January 2001 onwards. However, the new
method had no material impact on the profit and loss account of the years
concerned.
(3) Plus minority interests.
(4) Including investment certificates issued in 1986 and bonus share issues. Public
Exchange Offers were made for investment certificates and voting right
certificates on the date of the Annual General Meeting on 25th May 1993.
The certificates were reconstituted as shares following the Special General
Meeting on 29th March 1999 and the Extraordinary General Meeting on 1st June
1999.
(5) Restated to reflect the ten-for-one share split decided at the Extraordinary General
Meeting of 14th June 1990.
(6) Figures restated to reflect the one-for-ten bonus share allocation decided by the
Board of Directors as of 23rd May 1996.
(7) Ten-for-one share split (Annual General Meeting of 30th May 2000).
(8) Net earnings per share are based on the weighted average number of shares
outstanding in accordance with the accounting standards.
(9) In order to provide data that are genuinely recurrent, L'Oréal calculates and
publishes net earnings per share based on net profit before capital gains and losses
and after minority interests, before allowing for the provision for depreciation of
treasury shares, capital gains and losses on fixed assets, restructuring costs, and
the amortization of goodwill.
(10) No financial instruments have been issued which could result in the creation of
new L'Oréal shares.
(11) The L'Oréal share has been listed in euros on the Paris Bourse since 4th January
1999, where it was listed in 1963.
The share capital was fixed at € 135,212,432 at the Annual General Meeting of 1st
June 1999: the par value of one share is now € 0.2.
(12) The dividend fixed in euros since the annual General Meeting of 30th May 2000.
Exhibit II
A Brief Note on the Global Cosmetics Industry
The term ‘Cosmetics industry’ usually refers to the ‘cosmetics, toiletry and
perfumery’ industry. Cosmetic products perform six functions: they clean,
perfume, protect, change the appearance, correct body odors and keep the body in
good condition. Cosmetics, toiletries and perfumes have become an important part
of every individual’s daily life and they have come to be regarded as equally
important as health related (pharmaceutical) products. On the basis of product
usage, the cosmetics industry can be divided into four segments: Luxury,
Consumer or Mass-Markets, Professional and Pharmaceuticals. Globally, the
European cosmetics industry has maintained its position as the leader (since the

123
L’ oréal – Building a Global Cosmetic Brand
1980s) in the industry. In 2000, the European cosmetics industry generated almost
€ 50 billion in sales, which was twice the sales volume of the Japanese cosmetics
industry and one-third more than that of the US cosmetics industry. L’Oréal has
remained the global leader in the industry with a 16.8% market share, followed by
Estee Lauder with a 10.9% market share, and Proctor & Gamble with a 9.3%
market share (Refer Table IV for the top ten companies).
Table IV
Top Ten Companies In The Global Cosmetics Industry
Company Market Share
L’Oréal (France) 16.8%
Estee Lauder Companies Inc (US) 10.9%
Proctor & Gamble (US) 9.3%
Revlon Inc (US) 7.1%
Avon Products Inc (US) 4.7%
Shiseido Company Ltd (Japan) 4.2%
Coty Inc (France) 3.3%
Kanebo Ltd (Japan) 2.1%
Kose Company Ltd (Japan) 2.0%
Chapel SA 1.7%
Source: www.web.new.ufl.edu
Established in 1946 in New York, US, Estee Lauder competed with L’Oréal in the luxury segment with brands like Estée Lauder, Aramis, Clinique, Prescriptives, Origins, M·A·C, Bobbi Brown Essentials, Tommy Hilfiger, Jane, Donna Karan, Aveda, La Mer, Stila, and Jo Malone. Proctor and Gamble, the US based FMCG manufacturer, competed with L’Oréal in the mass-market segment with skincare, haircare and bodycare products. Some of P&G’s well-known brands include Biactol, Camay, Cover Girl, Ellen Betrix, Infasil, Max Factor (skincare), Herbal Essences, Loving Care, Natural Instincts, Nice n’ Easy, Pantene Pro-V, Rejoice, Vidal Sassoon, Wash & Go (haircare), Laura Biagiotti, Hugo Boss and Helmut Lang (perfumes). The US-based Revlon Inc also competed with L’Oréal in the mass-market segment with brands like Charlie, Colorsilk, Colorstay, Fire&Ice and Skinlights. Other companies like Avon, Kose, Coty and Shiseido competed globally in the mass-market segment. L’Oréal remained the overall industry leader, as it was the only company that competed in all four segments.
The cosmetics industry has always been characterized by extensive research and innovation by companies to introduce newer and better products. Since the 1990s, the industry has witnessed many changes in terms of the manufacture of cosmetics owing to growing awareness among consumers about the harmful effects that harsh chemicals (generally used in cosmetics) may cause to their body (skin and hair). This was one of the reasons for the manufacture of products with natural or herbal ingredients by companies like L’Oréal and P&G. Due to the increased focus on ‘wellness,’ the industry as a whole is now moving towards ‘cosmecuticals’ and ‘neutraceuticals, that is, products that combine the qualities of nutrients and beauty aids. Industry analysts speculate that the market for these products would rise sharply in the 21st century.
Source: Compiled from various sources.

124
Marketing Management
Additional Readings & References:
1. L'Oréal Reinforces its Presence in Eastern Europe, www.loreal.com, October 13, 1997.
2. L'Oréal Acquires Maybelline in Japan, www.loreal.com, March 30, 1999.
3. L'Oréal’s Owen-Jones: ‘I Strive for Something I Never Totally Achieve’,www.businessweek.com, June 28, 1999.
4. L’Oréal: The Beauty of Global Branding, www.businessweek.com, June 28, 1999.
5. Mudd Tom, Global Movers and Shakers, www.industryweek.com, August 21, 2000.
6. Moskowitz Milton & Levering Robert, 10 Great Companies in Europe: L'Oréal,www.fortune.com, January 22, 2002.
7. The World-Renowned Singer Natalie Imbruglia Joins L'Oréal Paris, www.newswire.com, June 27, 2002.
8. One Brand at a Time: The Secret of L’Oréal’s Global Makeover, www.fortune.com, August 12, 2002.
9. Tomlinson Richard, L’Oréal’s Global Makeover, www.fortune.com, August 15, 2002.
10. Lindsay Owen-Jones Manager of the Year 2002, www.loreal.com, November 20, 2002.
11. Lindsay Owen Jones: ‘2003 off to a Great Start ’, www.loreal.com, February, 28, 2003.
12. Cosmetic Food – The Next Nutraceuticals? www.foodnavigator.com, March 20, 2003.
13. www.scf-online.com
14. www.republic.org
15. www.maybelline.com
16. www.free-cliffnotes.com
17. www.indiainfoline.com

Samsung – The Making of A Global Brand “Now they're in consumers' consideration set. After Sony, they have the potential to be the No. 2 brand globally.”
-Jan Lindermann, Global Director for Brand valuation, Interbrand in 2001.
EMERGING GIANT?
In 1998, South Korea’s leading consumer electronics major, Samsung Electronics
Corporation (Samsung), entered into an agreement with the International Olympic
Association to sponsor the 1998 Seoul Olympics. According to company sources,
Samsung wanted to sponsor Olympics to establish itself as a global brand. Analysts
felt that by associating itself with the Olympics, Samsung would increase its brand
visibility and brand recall among its consumers worldwide. They also pointed out that
to become the next Sony (Refer Exhibit I) of the consumer electronics market,
Samsung would have to invest heavily in marketing.
In the late 1990s, Samsung entered into various marketing alliances with companies
worldwide and sponsored events to enhance its brand awareness. Due to its marketing
efforts, its brand value appreciated by 200% from $3.1 billion in 1999 to $8.3 billion
in 2002. Consequently, in 2002, Samsung emerged as the only non-Japanese brand
from Asia to be listed in the global top 100 brands valued by Interbrand Inc1 (Refer
Table I). The company was ranked 34th in Interbrand’s list of the world’s top 100
brands.
In spite of the worldwide downturn in 2002, Samsung posted a net profit of 1.7 trillion
won2 for the third quarter of 2002-03, which was much higher than its net profit of
425 million won in 2001 for the same period. In 2002-03, Samsung emerged as the
number three player in the global cell phone market after Motorola and Nokia. It also
emerged as the world leader in the $24.9 billion memory chip market.
Table I
Brand Value of Samsung
(in $ billions)
YEAR RANK BRAND VALUE
1999 - 3.1
2000 43 5.2
2001 42 6.4
2002 34 8.3
Source: www.samsung.com
According to industry sources, Samsung’s innovative advertising strategies,
improvements in product design and focus on global markets helped it achieve an
increase in earnings over the years.
1 Interbrand is a leading brand consultant established in 1974. Interbrand lists top 100 brands of the world in association with the BusinessWeek Magazine.
2 As on March 3rd 2003, 1 US$ = 1,188.60 Won. (KRW)

126
Marketing Management
BACKGROUND NOTE
Samsung was established in 1969 as the flagship company of Samsung Corporation
(Refer Exhibit II). It was the third largest player in the Korean electronics market after
Lucky Goldstar (LG) and Daewoo.3 Samsung achieved fast growth through exports,
which constituted around 70% of its total production. Most of the exports were to the
USA on Original Equipment Manufacturer (OEM) basis. It supplied components for
high tech industries in the USA. In the early 1970s, Samsung decided to venture into
the television market, and in 1972 it started production of black & white television
sets for the local market. After its success in the television market, Samsung set up its
home appliances plant in 1973. By 1974 it started manufacturing refrigerators and
washing machines.
By the mid 1970s, Samsung started production of color TVs (CTVs) and energy
efficient high cold refrigerators. By the late 1970s, the company’s exports to the US
markets exceeded US $100 million. During the same period, it established a
marketing subsidiary in the USA. In the 1980s, it started manufacturing microwave
ovens and air conditioners. In 1980, it acquired Korea Telecommunications Corp,
which was renamed Samsung Semiconductor & Telecommunications Co in 1982. In
the same year, Samsung established a sales subsidiary in Germany and its first
overseas plant in Portugal to cater to European markets. In 1986, research labs were
established in Santa Clara (California) and Tokyo to improve the product line. In
1988, the Samsung Semiconductor business was merged with Samsung. By the end of
1989, Samsung was ranked 13th in semiconductor sales worldwide.
Though Samsung was able to establish its brand image in the Korean market, it was
regarded as an OEM in global markets. Since Samsung had a poor brand image in
global markets and its products had a high defect rate, many consumers associated
Samsung’s products with poor quality.
To change this perception of its products, Samsung Corporation initiated a restructuring process across the group in 1994. Samsung Electronics, the flagship company of the group (contributing around 90% of the group’s profits), was the main focus of this restructuring.
In 1994, a business restructuring process – ‘New Management’ - was initiated to transform Samsung into a global brand. This process identified three major focus areas: quality, globalization and multifaceted integration. The company shifted its focus from quantity to quality, and set up manufacturing units across the world to bring down costs, tap global markets efficiently and employ the best talent. The group also implemented various quality initiatives such as Six Sigma and manufacturing initiatives such as assembly manufacturing to enhance output through the optimum utilization of resources.
This change in focus enabled Samsung to become one of the top global brands and also the world leader in around 17 product categories (Refer Exhibit III). Due to the emphasis on continuous innovation, it launched technologically superior products, and by 2001 it posted a net income of $2.2 billion (Refer Exhibit IV). By 2002, Samsung’s product range included digital media network, device solution network, digital appliance network and telecommunication (Refer Table II for the Samsung’s Product Profile). It had manufacturing bases worldwide, a presence in around 47 countries, and approximately 64,000 employees. Samsung also had around 24 production subsidiaries, 35 sales subsidiaries and 20 branch offices worldwide (Refer Table III).
3 LG and Daewoo are the largest Korean conglomerates. General Motors bought a stake in Daewoo, when it was liquidated in 2002 due to financial problems.

127
Samsung – The Making of A Global Brand
Table II
Product Profile of Samsung Electronics
PRODUCT CATEGORY
PRODUCTS
Digital Media Network
TVs, Monitors, Laptops, Mobile Hand PC, DVD Player, Digital Camcorder, Laser Printer, ODD: 32X DVD/ CDRW Combo Drive, HDD.
Digital Solution Network
512 Mb DDR, 32 Mb UtRAM, 1 Gb Nand Flash, Smart Card IC, Compact LCD Driver IC, Embedde ARM, 40" TFT-LCD, 1.8" TFT-LCD.
Digital Appliance Network
Refrigerator, Air Conditioner, Washing Machine, Microwave Oven, Vacuum Cleaner.
Telecommunication Mobile Phone: TFT Color LCD, X –4200, PDA: I –300, CDMA 2000 1x EV-DO, AceMAP Solution Softswitch.
Source: www.samsungelectronics.com
Table III
Global Network of Samsung*
CONTINENT COUNTRY
NORTH AMERICA
Mexico, Brazil, USA
EUROPE England, Spain, Hungary
PRODUCTION SUBSIDIARIES
ASIA China, India, Malaysia, Philippines, Thailand, Vietnam, Indonesia, South Korea
NORTH AMERICA
USA, Canada, Mexico
SOUTHAMERICA
Colombia, Argentina, Republic of Panama
EUROPE England, Germany, France, Italy, Sweden, Portugal, Poland, The Netherlands, Russia
ASIA Ukraine, Japan, China, Singapore, Philippines, UAE, South Korea
AUSTRALIA Australia
SALESSUBSIDIARIES
AFRICA South Africa
SOUTHAMERICA
Brazil, Colombia, Peru
AFRICA Egypt, Morocco, Ivory Coast, Tunisia
ASIA Iran, Saudi Arabia, Jordan, Turkey, China, Malaysia, South Korea, Kazakstan
BRANCH OFFICES
EUROPE Austria, Russia, Latvia
* This list is not exhaustive.
Source: www.samsungelectronics.com

128
Marketing Management
THE MAKING OF A GLOBAL BRAND
In 1993, as a first step in its globalization drive, Samsung acquired a new corporate
identity. It changed its logo and that of the group. In the new logo, the words Samsung
Electronics were written in white color on a blue color background to represent
stability, reliability and warmth. The words Samsung Electronics were written in
English so that they would be easy to read and remember worldwide. The logo was
shaped elliptical representing a moving world – symbolizing advancement and
change. The first and last letters ‘S’ and ‘G,’ broke out of oval shape partially in order
to connect the interior with the exterior. According to company sources, this design
represented the company’s wish to connect itself with the world and serve society as a
whole (Refer Figure I).
Figure I
Source: www.iniche.com
PRODUCT INITIATIVES
Samsung realized that to become a global brand, it had to change the perceptions of consumers who felt that it was an OEM player and associated its products with low technology. Generally, consumers in developed markets (such as the US) opted for Samsung when they could not afford brands such as Sony and Panasonic. To change consumer perceptions, Samsung decided to focus on product design and launch innovative products.
Samsung decided to revamp its image by:
Moving away from cheap imitated products
Offering innovative and technologically advanced products
Initiating marketing activities worldwide to increase the visibility of the Samsung brand.
In 1994, Samsung restructured its design department. It integrated all its design activities under four design groups. These groups formed the ‘Samsung Electronics Design Institute.’ (Earlier, the design department was called the ‘Industrial Design Center’). Samsung established design institutes in Seoul (South Korea), Palo Alto (California, US) and Middlesex (England). The Samsung Electronics Design Institute set about designing new products that would appeal to consumers’ worldwide.
In 1996, Yun Jong Yong (Yun) was appointed as the CEO of Samsung. He brought about major changes across the organization. After holding a brain storming session with senior executives, he decided to base Samsung’s design philosophy on the principle of ‘Balance of Reason and Feeling.’ In other words, Samsung’s designs should balance technological excellence with human adaptability. Yun also declared the year 1996 as the ‘Year of Design Revolution’ and initiated a program for building a complete global design with a budget of $126 million.

129
Samsung – The Making of A Global Brand
Samsung product designs won Industrial Design Excellence Awards (IDEA)4 in 1996. The products that won the awards were the NETboard computer (which targeted US students between 16-25 years); the ‘Weeble’ phone that shook from right to left when the phone rang to get the attention of the consumer, and ‘Junior TV,’ which had a wearable remote.
In the late 1990s, Samsung realized the importance of customization over mass production. It therefore developed innovative products (considered fun and high end products) for the mobile phone sector in accordance with customer preferences in local markets.
Samsung used ‘Lifestyle segmenting’ instead of ‘technological segmentation’ to market its products since consumers generally bought electronic products which reflected their lifestyle instead of those that had specific technological features. Using lifestyle segmentation, the company divided the market and positioned its products. Samsung invested around $3 million in market research to identify the lifestyle and purchase patterns of Generation Y (13-25 years old) and Generation N (Internet-friendly) consumers. The lifestyle-based product designing strategy was successful at Samsung due to effective coordination of the activities of the company’s geographically disposed design teams. Its team of designers in North American, European and Korean markets undertook surveys to understand the lifestyles of consumers. Then workshops were conducted so that all teams could share ideas for product design.
Samsung established a Lifestyle Research Group for studying consumer behavior and
a Materials and Finishes Group for deciding on the materials, colors and product
finishing for all product lines. In addition to the above two groups, it also established
an Advanced Design Group, enabling exploration of new product concepts by
interdisciplinary teams. And in order to encourage innovation, it announced an annual
design competition for its designers.
In 1999, Samsung announced its plan to become one of the top three digital product
suppliers in four markets: personal multimedia, mobile multimedia, home multimedia
and component business. It set a sales target of $58 billion by 2005 for those markets.
Samsung also announced the launch of various digital products in different categories.
To achieve its targets, the company announced R&D investment of around $1.4
billion spread over the next 10 years.
In 1999, Samsung launched products such as the SCH-3500, the world’s first CDMA
PCS portable telephone combining voice activated dialing and Internet access, a
portable digital audio player with MP3 audio compression format (with a removable
SmartMedia card). According to Yun, “our new product portfolio reflects a basic shift
in strategy, demonstrating our deep conviction that digital connectivity is the future of
our industry, especially in terms of personal and mobile multimedia products.”
By the early 21st century, Samsung emerged as one of the biggest brands in the mobile
phones segment. In the cell phone market, it changed its focus from low-end mass
markets to high-end markets. The selling price of Samsung’s mobile phones was
higher than that of Nokia’s products because of the high technology and additional
features that Samsung offered to customers. A typical Samsung mobile phone allowed
consumers to dispatch e-mail, access dictionaries, the Bible, and Buddhist songbooks,
and play electronic games. Samsung also launched a 50-gram phone, which was said
to be world’s lightest phone. It could be worn as a wristwatch and it had facility of
giving voice commands. Analysts felt that though this kind of product did not
generate volumes, it helped Samsung project itself as a high-technology company.
4 IDEA Awards are sponsored by Business Week magazine and awarded by the Industrial Designer Society of America for excellence in product design.

130
Marketing Management
CONSOLIDATING PRESENCE IN DIFFERENT MARKETS
To change its brand image, Samsung decided to associate itself with global sport events. In 1998, when Seoul hosted the Olympics, Samsung became the official sponsor of the wireless technology to the games. This move helped it boost its image worldwide.
In 1999, Erick Kim (Kim), a Korean American working with IBM, took over as the marketing head of Samsung. He focused on capturing the US retail market for consumer electronic goods, such as TVs, washing machines and microwave ovens, through partnerships with US retailing giants.
Samsung entered into a partnership with Best Buy one of the top US retailers. Best Buy executives conducted customer research to analyze consumer-buying behavior.This information was passed on to Samsung’s engineers, who tried to create gadgets that would meet customer expectations. This relationship resulted in the creation of two best selling products – a DVD/VCR player and a cell phone, which could function as a Personal Digital Assistant. In 2001, sales of Samsung products through Best Buy were reported to be around $500 million. For 2002, the company expected sales of $1 billion through Best Buy. Samsung also entered into alliances with US retailers such as CompUSA and Sears, Roebuck & Co to increase its market presence in USA.
In countries like Nigeria, Samsung focused on providing value for money and high technology products. It tried to build its image by providing information about the company through TV and Radio commercials and media events. It also invited Nigerian journalists to Korea to provide them a detailed picture of the company. Samsung also improved its communication with distributors, as they could provide the company customer feedback. It also planned to build close relationships with dealers and distributors to push its products in Nigerian markets (as dealers and distributors play a major role in initial product sales).
Due to its brand building activities across the world, Samsung reported a net profit of 2.95 trillion won in 2001 on total revenues of 32.4 trillion won. In July 2001, Samsung entered into a marketing alliance with AOL Time Warner to work together on AOLTV set-top box5 with the TiVo recording service.6 In return, Samsung products would be promoted in AOL Time Warner’s marketing initiatives. Due to this alliance, Samsung products were promoted in People, Entertainment Weekly and Sports Illustrated of AOL Time Warner’s magazines.
In early 2003, Samsung announced that it would concentrate on US and European markets, where its brand was considered weak in product categories other than mobile phone handsets. Kim Said, “Our brand is weaker in Europe and the U.S., but in cell phones we're pretty strong. In those regions we'll be even more focused. Wireless and digital TV are the two areas we'll focus on in Europe and the U.S.”
Samsung emphasized on brand building when entering new markets. When entering India, one of the world’s largest markets, Samsung realized that its products were unknown in Indian markets. In India, like elsewhere in the world, Japanese goods were considered to be of better quality than Korean goods. To project itself as a high technology company, Samsung undertook a two-month corporate campaign, which highlighted the company’s strengths in semiconductors, colour picture tubes, colour televisions and mobile phone handsets.
In addition to strengthening the Samsung brand in specific markets, the company also launched global advertisement campaigns to enhance its brand image worldwide.
5 A set-top box is a device that enables a television set to become a user interface to the Internet and also enables a television set to receive and decode digital television (DTV) broadcasts.
6 TiVo is an American company offering a branded subscription-based interactive television service that lets viewers program and control which television shows they watch, and when.
131
Samsung – The Making of A Global Brand
ADVERTISING AND PROMOTIONAL STRATEGIES
In 1997, Samsung launched its first corporate advertising campaign – Nobel Prize Series. This ad was aired in nine languages across Europe, the Middle East, South America and CIS countries. The advertisement showed a man (representing a Nobel Prize Laureate) passing from one scene to another. As the man passes through different scenes, Samsung products transform into more advanced models. According to company sources, the idea was to convey the message that Samsung uses Nobel Prize Laureates’ ideas for making its products. Samsung also signed an agreement with the Nobel Prize foundation to sponsor the Nobel Prize Series program, worldwide. The program was developed by the Nobel Foundation, Sweden to spread achievements of the Nobel Prize Laureates.
Initially, Samsung’s advertising activities were decentralized. The company employed various ad agencies to design campaigns for its products. However, in 1999, Kim forfeited Samsung’s agreements with around 55 advertising firms and signed a $400 million contract with a US based ad agency, Foote, Cone & Belding (FCB).7 FCB created global campaigns for the company (featuring models carrying the company’s gadgets), which highlighted the superior technology of Samsung products.
In 1999, Samsung unveiled a new campaign in the US with a new slogan – ‘Samsung DIGITall: Everyone’s invited’ – on the eve of its 30th anniversary. Samsung re-designed its logo to convey its objective: making life filled with convenience, abundance and enjoyment through innovative digital products (Refer Figure II). The new slogan, Samsung DigitAll, expressed the company’s aim of providing digital products ‘For all generations, For all customers and For all products.’
In April 2001, Samsung launched its new brand campaign, which was created by True North Communications’ FCB Worldwide. This campaign was aired in around 30 countries with a budget of $400 million. As part of the brand campaign, the company advertised an 30-second TV spots on various channels such as CNN, VH1, ESPN, TNT and NBC during NBA games. The first advertisement in the series – ‘Anthem’ – was set in U.K. The advertisement showed different Samsung products – flat screen TV monitor, MP3 Player, watch phone being used by people from different ethnic backgrounds. The voice over was: “There is a world where you see, hear and feel things like never before, where design awakens all your senses. This is the world of Samsung and everyone’s invited.” At the end of the commercial the company’s tagline ‘DigitAll, Everyone’s invited’ appeared (Refer Exhibit V)
Figure II
Source: www.hvdm.nl
7 Founded in 1873, US based FCB is one of the world’s top ten ad agencies. It has a presence in around 28 countries. The agency offers integrated services to its clients, with interactive CRM solutions across both online and offline channels.

132
Marketing Management
The ‘DigitAll’ campaign was launched across all countries where the company had a presence and across all product lines. The campaign involved the sponsorship of events at global and regional levels. Reportedly around 30 people from Samsung’s Seoul and North America offices worked with FCB on the campaign.
In 2001, Samsung added the word ‘WOW’ to its marketing campaigns to show the admiration of consumers for its innovative but affordable products. It was reported that Samsung’s 2001 global brand campaign increased consumer awareness about Samsung from 83.7% in 2000 to 91.2% in 2001, and in the US, brand awareness and preference for Samsung increased from 56.4% to 74.1% for the same period.
In April 2002, Samsung adopted Internet marketing to reach high-profile consumers. It concentrated on increasing brand awareness, web traffic, and give product information with every advertisement. It bought ad space on more than 50 websites such as Fortune.com, Forbes.com and BusinessWeek.com. At same time, Samsung continued to advertise in the print and television. Said Peter Weedfald, vice president, marketing communications and new media, “We are integrating all forms of media; it allows us to articulate the demand for our products and manage promotions in real time.” As part of its outdoor advertising initiative, Samsung bought a 65-foot-tall electronic billboard in New York’s Times Square.
In May 2002, Samsung announced its plans to extend its ‘DigitAll’ campaign, by launching new global campaigns with different tag lines – ‘DigitAll Passion,’
‘DigitAll Escape,’ and ‘DigitAll Wow.’ The new ads promoted existing products, like mobile phones, colour LCD mobile phones, entertainment products, and future products like the Internet refrigerator. These advertisements highlighted the flexibility and user-friendly nature of Samsung products. The campaign, for which the company had budgeted around $200 million, was aired on TV spots across US, the Europe, CIS, Southeast Asia, South America, Africa, the Middle East and China. According to Kim, “Many consumers think of digital technology as an elite experience that’s inaccessible to them. Samsung prides itself on developing revolutionary technology that meets everyone’s needs – business or personal.”
BEATING SONY?
In 2001, Samsung declared that it would beat Sony in the consumer electronics market by 2005. Kim said, “We want to beat Sony. Sony has the strongest brand awareness; we want to be stronger than Sony by 2005.” However, analysts felt that it would be difficult for Samsung to beat Sony so soon as Samsung was regarded as an OEM player till the mid-1990s.
In 2002, while Samsung was ranked 34th with a brand value of $8.1 billion, Sony was
ranked 21st with an estimated brand value of $13.90 billion. However, while
Samsung’s rank had moved up from 42 in 2001, Sony’s had slipped down from 20th in
2001. In the third quarter of 2002, Samsung emerged as the world’s number three
player in the mobile market, beating Siemens and Ericsson, with a marketshare of
36.4%. In CDMA technology, it was the world’s number one player (Refer Table IV).
However, analysts felt that though Samsung’s brand building inititatives had
improved its brand value and image in the global market, it was not yet in a position
to overtake Sony. According to analysts, the company needed to concentrate on
manufacturing high technology products. Though Samsung offered televisions, digital
cameras, MP3 players and DVD/VCRs, its product range did not include stereos and
personal computers, which enjoyed high demand in the US, the world’s largest market
for consumer electronics. Moreover, Sony’s Walkman and DVD player were still
considered benchmarks of quality in consumer electronics market.

133
Samsung – The Making of A Global Brand
Table IV Mobile Phone Vendor Market Share For 3Q 2002
(in %)
GSM Handset CDMA Handset
Nokia 44.4 9.4
Motorola 14.1 18.7
Siemens* 11.9 0
Samsung Electronics 9.1 27.3
Sony Ericsson 6.5 2.1
LG Electronics 1.2 19.2
*Siemens does not make CDMA mobile phones.
Source: www.nordicwirelesswatch.com
Though initially Sony downplayed the rivalry, in 2001, it accepted it. Sony Chairman,
Nobuyuki Idei, said, “The product design and the product planning – they’re learning
from us. So Sony is a very good target for them.” Since Sony was Samsung’s largest
customer for chips, analysts felt that Samsung could not risk direct combat with Sony
in international markets. Analysts also pointed out that both Samsung and Sony
needed each other for their survival.
Since digital technology was replacing analog technology, Samsung felt it was in a
position to produce high technology products. With the digitalization of consumer
electronics, Samsung’s expertise in chip making would enable it to offer
technologically advanced products to its consumers.
However, analysts were skeptical about the company’s performance due to the falling
prices of PCs, cell phones and PDAs. They also expressed doubts about the
company’s ability to pump more money into R&D. Since chips generated most of the
company’s profits, falling chip prices would affect its R&D investment.
Questions for Discussion:
1. By 2002, Samsung was rated as one of the top 3 players in the global mobile
handset market. Analysts attributed Samsung’s success to its marketing
initiatives. Discuss the role of marketing in Samsung’s success.
2. Compared to established rivals like Sony, Matsushita and Nokia, Samsung was a
late entrant in the global consumer electronics market. Comment on Samsung’s
brand building initiatives in the global consumer electronics market.
3. Which one of Samsung’s marketing strategies was mainly responsible for its
success as a global brand? In what way did it help Samsung? Discuss.
4. Analysts felt that it would not be easy for Samsung to beat Sony, which was
known for technologically superior products like the Trinitron television,
Playstation and Walkman. Do you think Samsung can beat Sony only through
aggressive marketing, without bringing out any technologically advanced
products?
© ICFAI Center for Management Research. All rights reserved.

134
Marketing Management
Exhibit I Sony Corporation
The history of Sony dates back to 1946 when Masaru Ibuka, Tamon Maeda and Akio Morita formed a company called Tokyo Tsushin Kogyo (Tokyo Telecommunications Engg. Co) with an initial capital of 19,000 yen in the city of Nagoya with just 20 employees to undertake research and manufacture of telecommunications and measuring equipment. The company’s main objective were as follows: to establish an ideal factory, free, dynamic and pleasant where technical personnel of sincere motivation can exercise their technological skills to the highest level.
The first product of the company was an electric rice cooker, which failed to generate sales for the company. Since its first product was a failure, the company entered into the replacement parts business for electric phonographs. In 1950, the company produced Japan’s first tape recorder. The machine was bulky and heavy, however, it performed excellently. But, tape recorder could not find enough market, as it was a totally new concept in Japan and people were not ready to pay a high price for it even if they liked its performance. Soon Morita realized that unique technology and unique products were not enough to keep a business going.
In 1955, the company produced its first transistorized radio and in 1957 it produced a pocket radio. These two products were a huge hit in the market and the company expanded to US markets. In 1958, Tokyo Tsushin Kogyo was renamed Sony, and in 1960 it established its first overseas sales subsidiary, the Sony Corporation of America, with a capital of $500,000. In the following year it expanded its operations to Switzerland through Sony Overseas S.A.
In 1972, Sony became the first Japanese company to set up manufacturing facilities in the US, and in 1973, Sony received an Emmy award for its Trinitron technology. In 1976, Morita took over as CEO from Ibuka, and in 1979, Sony produced an innovative product – Walkman – which achieved a cult following and high sales boosting the company’s profits during the 1980s. In 1981, Sony came up with the 3.5-inch floppy disk.
In 1989, Norio Ohga took over as CEO and Chairman of Sony from Morita. During Ohga’s regime, Sony emphasized process innovations to improve efficiency and control production costs. During Morita’s period, the emphasis was on product development, while in Ohga’s period the emphasis was on process innovation. In the same year, Sony acquired Trans Corn Systems Division and Columbia pictures. In 1994, Sony was restructured to improve the speed and quality of its corporate decisions. It formed eight new internal companies and focused on specific markets. In the same year, Sony established SW Networks (SWN), a full service radio network with more than 600 affiliate stations catering to both domestic and international markets.
In 1995, due to the lack of new products and an unfavorable exchange rate between the dollar and the Yen, Sony ran into problems. In the same year, Noboyudki Idei took over as president from Ohga. Under Idei, Sony strengthened its market position. In the late 1990s, it developed an innovative product – the PlayStation (computer game machines). More than six million PlayStations were sold within 3 years of its introduction. In 1998, Sony restructured its consumer electronics business to make operations more efficient and better adaptable to networks, which were becoming increasingly important.
In 1999, Sony signed a joint venture with Royal Philips Electronics and Sun Microsystems to develop networked entertainment products. In early 1999, Sony again announced that it would restructure its businesses into four autonomous units. In the same year it introduced the world’s most sophisticated robot called AIBO (Japanese word for companion and English abbreviation for Artificial Intelligence Robot). For 2001, Sony reported net income of $134 million. By this time it had a presence in more than 61 countries and offered products and services in the categories of consumer electronics, games, pictures and music.
Source: www.sony.net
135
Samsung – The Making of A Global Brand
Exhibit II
About Samsung Corporation
The history of Samsung’s parent company - Samsung Corporation – dates back to 1938. Initially, the group exported dried fish, vegetables and fruit to China. By 1948 it owned flourmills and confectionery machines. Subsequently, it expanded its businesses and diversified into various fields. In 1951, Samsung Moolsan (Samsung Corporation) was formed, and by 1953, the company ventured into the manufacture of Sugar through the Cheil Sugar Manufacturing Co, which was the only sugar manufacturing company in South Korea at that time.
In the early 1960s, the company diversified into the textile, banking and insurance sectors. In 1965, it entered the print media by acquiring the Saechan Paper Manufacturing. And in 1969, it established the group’s flagship company Samsung Electronics. The 1970s saw the group diversifying into heavy engineering, chemicals and petrochemical industries. Later in the 1980s, the company diversified into high technology area and the aerospace industry. In 1983, Samsung developed its first chip, the 64K Dynamic Random Access Memory (DRAM) chip, through its subsidiary Samsung Semiconductor & Telecommunications, and emerged as Original Equipment Manufacturer (OEM) for companies such as Intel.
In 1985, it set up Samsung Data Systems (renamed as Samsung SDS), which was involved in consulting, business integration and data center services. In 1987, on the death of Lee Byung Chull, Lee Kun Hee (Hee), his son, was appointed chairman of the group. In 1994, the group diversified into the automobile industry. This move has been regarded as one of the biggest mistakes committed by the group. In the same year, due to economic reasons, the New Management Philosophy was introduced. This philosophy laid emphasis on qualitative rather than quantitative growth. In 1995, the Samsung Corporation diversified into the Financial services business through Samsung Finance, which was renamed Samsung Capital. In 1996, Samsung Electronics developed the world’s first giga-bit DRAM, and in the same year, Samsung established its commercial vehicles plant.
In 1997, the company faced a severe cash crunch due to the South Asian crisis. This crisis resulted in a high exchange rate for the South Korean currency (won). In order to generate cash for its investments and decrease debts, Samsung restructured the organization. It initiated cost cutting measures on a large scale; it also hived off non-core businesses such as the Samsung Construction Equipment Business to generate cash. It also hived of its forklift business and sold of real estate and other assets (amounting to $300 million) and decreased its global investments by 30%. It sold 10 of its business units to overseas companies for around $1.5 billion dollars. It also laid off around 50,000 people. In February 1998, Samsung Corp produced its first passenger car. By 1999, Samsung Corp had lowered its high debt-equity ratio from 365% in 1997 to 148%. In 1999, Samsung Corp closed down its passenger and commercial vehicle business and its chairman, Kun-Hee-Lee, covered the group’s debt through personal stock worth 2.8 trillion won.
In 2000, Samsung Corp announced a new management program to stay ahead of the competition in the digital age. According to the new management program, the company aimed at devoting “human resources and technology to create superior products and services, thereby contributing to a better global society.” By 2000, it employed around 174,000 employees all over the world. Its net income in 2000 was $ 7.3 billion on net sales of $119.5 billion.
In 2001, Samsung announced its vision – “continuously striving to conquer new era in digital technology and products.” By 2002, Samsung Corp was involved in heavy engineering, consumer electronics, financial services and chemicals. It had a presence in more than 60 countries.
Source: ICFAI Center for Management Research

136
Marketing Management
Exhibit III
Market Position of Samsung in Various Product Categories Worldwide*
(Figures for 2001)
PRODUCT PRODUCT CATEGORY
MARKETSHARE
MARKETPOSITION
Monitor Digital Media Network 21% First
VCR Digital Media Network 20% First
DVDP Digital Media Network 17% Third
ODD Digital Media Network 13% First
D-RAM Digital Solution Network 29% First
S-RAM Digital Solution Network 26% First
TFT-LCD Digital Solution Network 20% First
Microwave Oven
Digital Appliance Network
25% First
CDMAMobile Phone*
Telecommunications 27.3% First
GSM Mobile Phone*
Telecommunications 9.1% First
* Figures are for 2002
* This list is not exhaustive.
Source: www.samsungelectronics.com
Exhibit IV
Income Statements of Samsung Electronics from 1997-2001
(in thousands US$)
2001 2000 1999 1998 1997
Sales: Domestic 7,926,014 8,222,763 7,029,885 5,380,693 5,663,406
Export 16,493,575 17,632,254 13,714,980 11,259,056 7,386,318
Total Sales 24,419,589 25,855,017 20,744,865 16,639,749 13,049,724
Cost of Sales 18,487,732 16,586,258 14,027,936 11,578,914 8,976,018
Gross Profit 5,931,857 9,268,759 6,716,929 5,060,835 4,073,706
Selling Expenses 4,200,836 3,661,553 3,157,358 2,492,518 2,055,176
Operating Profit 1,731,021 5,607,206 3,559,571 2,568,371 2,018,530
Non operating income
Interest & Dividend 95,365 117,969 180,890 279,383 120,977
Gain on foreign currency transactions
180,429 225,543 212,448 863,231 1,321,352

137
Samsung – The Making of A Global Brand
Source: www.samsungelectronics.com
Exhibit V
Samsung – Digitall Advertisements
Gain on foreign currency translation
35,736 25,733 207,638 - -
Gain on valuation of investments (equity method)
591,848 657,109 236,888 - -
Other 469,551 489,779 470,591 371,563 290,965
1,372,929 1,516,133 1,308,455 1,514,177 1,733,294
Non operating expenses
Interest Expense 154,709 258,949 572,835 924,894 536,428
Amortization of deferred charges
- - - 1,559,267 1,117,517
Loss on foreign currency transactions
183,196 210,444 222,768 857,732 1,478,708
Loss on foreign currency translation
68,999 179,365 84,666 - -
Loss on valuation of inventories
40,821 - - - -
Other 331,484 481,508 576,914 375,354 508,878
779209 1,130,266 1,457,183 3,717,247 3,641,531
Ordinary Profit 2,324,741 5993073 3410823 365247 110293
Extraordinary Income - 115,863 - 235,068 46
Extraordinary Loss - - 211,484 259,920 1,773
Net Income before Taxes 2324741 6108936 3199339 340395 108556
Income Tax Expense 102316 1573091 681148 80895 21283
Net Income 2,222,425 4,535,845 2,518,191 259,500 87,283

138
Marketing Management
Source: www.adage.com.

139
Samsung – The Making of A Global Brand
Additional Readings & References:
1. Nussbaum Bruce, Korea's Samsung: The Hungriest Tiger, BusinessWeek, June 2, 1997.
2. Samsung Celebrates 30 Years and New Products, www.twice.com, September 11, 1999.
3. Brown Heidi, Look Out, Sony, Forbes, April 16, 2001.
4. Samsung: No Longer Unsung, BusinessWeek, August 6, 2001.
5. Holstein. J. William, Samsung’s Golden Touch, Fortune, March 17, 2002.
6. Elkin Toby, Samsung Massively Boosts Online Advertising, www.adage.com, April 29, 2002.
7. Orr Deborah, The Rise of Samsung, Forbes Global, November 11, 2002.
8. Van Marc, Samsung to Sell 43 Mln Handsets in 2002, www.nordiacwirelesswatch.com, November 21, 2002.
9. www.idsa.org
10. www.samsung.com
11. www.samsungelectronics.com
12. www.adage.com
13. www.internetnews.com

Amway’s Indian Network Marketing Experience
“Our biggest challenge is not how to expand the market in India, but how to convince the indifferent Indian consumers about the world-class quality of Amway Products. The quality of the product is Amway’s strength.”
- Sudershan Banerjee, CEO & MD, Amway India in 1999.
A DREAM GONE AWRY
In the late 1990s, the global direct selling giant Amway had to contend with increasing doubts regarding its survival in India. The company that had become synonymous with network marketing or multi-level marketing (MLM)1 the worldover was beset with problems.
Media reports were quick to point out Amway’s failure to sell the basic concept of direct selling to the Indians. Though the company managed to rope in a substantial number of distributors, the attrition rate was at an alarming high of 60-65%. Most of the products that the distributors bought, they consumed themselves. Estimates put the percentage of self-consumption at almost 50-60% of the total volume. (There were rumors that some distributors enrolled just to take advantage of the distributor’s margin of 18-30%). In the initial stages, when trials were the only criterion, this worked well. However, this self-consumption did not translate into repeat purchases.
This was because the percentage of ‘active’ distributors at any given point of time remained at a low level of 35-40%. Many people who joined in the initial frenzy returned the product kits within the first month. Company sources claimed that the returns constituted just 1% of the total strength, but rivals and ex-employees put the figure at over 5%. Of the total distributors, only about 10% showed reasonably high levels of activity.
1 The MLM system utilized a multi-tiered salesforce of independent distributors - none of them employees - to sell products directly to consumers. These distributors earned commissions at two levels - the first, the difference between the distributor’s cost and selling prices, and second, a proportion of the commissions earned by other distributors recruited. MLM thus completely bypassed the retail chain and cut costs of the traditional distribution system. A typical MLM setup began with the recruitment of a group of distributors who paid a registration fee and picked up product kits. Once these goods were sold, the distributors were given the next lot. The more a distributor sold, the higher the commission. Besides selling the goods, the distributors were also expected to hire new distributors for selling the company’s products. The recruiting distributor also got an extra commission based on the sales effected by the distributors hired by him/her. As for the company, the compulsion on the part of the distributors to recruit more and more distributors led to its network penetrating very deep among the consumers. Also, the actual cost of marketing never exceeded 25% of the selling price on an average. As the distributor’s primary commission was a mark-up on the selling price, the only outgo for the MLM team was the commission, which averaged at 9% and at peak levels stood at 21%. These distributo in turn, paid commission to the ‘down-the-line’ distributors out of their own earnings.
Fast moving consumer goods targeted at niche markets such as specialist cosmetics or premium fragrances were typically the most suitable for a MLM setup. Also, if the products were portable and needed to be demonstrated-vacuum cleaners for instance the personal interaction that MLM facilitated, helped a lot. Products, which were neither purchased very often nor very rarely, and were neither too expensive nor too cheap could be marketed well through this system.

141
Amway’s Indian Network Marketing Experience
To top it all, Amway was burdened with an image that had little basis in fact. Its products began to be perceived as being very expensive and meant only for the premium segment. This was identified as the single biggest reason for the high attrition rate. What was overlooked was the fact that almost all Amway products were concentrates. When used in the proper diluted form, the cost per use of each product worked out to be at par with (and in some cases, even lower than) the nearest competitor’s products. For instance, the product named LOC (priced above Rs 320 for a 1-liter pack), when diluted gave around 165 bottles. The cost per usage was thus very low. Either the distributors were themselves not aware of this fact, or they were unable to communicate this to the customers. Since the distributors themselves were unsure about the price-value equation of the products they were selling, they could not effectively convince the consumers either.
Amway also had to contend with customers complaining of poor customer service on the part of the company. Analysts commented that as long as the volume of products that moved through the network was high, network market such as Amway was satisfied. Even though customers complained of the lack of services, the company deemed it more beneficial to go for higher sales force motivation programs rather than undertake customer service initiatives. This was largely due to the fact that the company was almost never involved directly with the end-consumers and the sales volumes were the end of all discussions.
MAKING OF THE DREAM
Privately held by the DeVos and Van Andel families of US, Amway, short for American Way, was set up in 1959. Amway and its publicly traded sister companies supported 53 affiliate operations worldwide. About 70% of Amway’s sales were outside North America. With over 12,000 employees around the world, Amway was renowned for its strong R&D centre in Michigan, which had 24 laboratories. Amway was present in over 80 countries and its manufacturing plants were located in US, Hungary, Korea, China and India. The company had over 3 million distributors across the world. Besides its direct selling portfolio of 450 products, Amway promoted around 3,000 products through catalogue sales2 as well.
Amway had received permission from the Foreign Investment Promotion Board (FIPB) in 1994, to invest $15 million in the Indian operations and to source products from India. The company began with identifying small and medium-scale companies to source its products from. Commercial operations began in May 1998 with a partnership arrangement with Network 21, a company, which acted as a support system and assisted in organizing training, seminars and meetings. Besides its extensive internal research efforts before entering India, Amway also conducted market research through agencies such as Pathfinders and ORG-MARG. Though prior to its entry into India, Amway did recognize the need for a special India-specific pricing strategy and eventually there were just a few marginal cuts in the prices, which were still almost 20% higher than those of the competing FMCG products. The company began with appointing distributors in the country by adopting the ‘NRI sponsored’ by getting NRIs to rope in their friends/relatives in India into Amway distributorship. These distributors were duly provided with starter business kits containing products, training material, and sales literature.
The company’s introductory product range comprised four home care and two personal care products, made available to distributors at the Amway Distribution Centers (ADCs) or through tele-service. A significant portion of Amway’s investment was on transferring state-of-the-art technology and processes to third-party
2 A sales catalog refers to a list of products/services provided by companies. These are sent to selected addresses. The consumers then place the orders based on the information provided in the catalog. The global catalog sales market stood at $ 87 billion in 1998.

142
Marketing Management
manufacturers from the small and medium-scale sectors for the indigenous production of its product range. Amway assisted its three manufacturing partners, the ISO 9001-certified Jejuplast at Pune, Naisa Industries at Daman, and the Hyderabad-based Sarvotham Care, to achieve benchmarking levels of product development, engineering and quality. These facilities were equipped with advanced machinery and world class technologies for production, packaging, and water filtration. Amway scientists and engineers at the India Technical Centre provided assistance in the processes of technology transfer and quality control. The company supported its independent distributors with five full service ADCs at New Delhi, Bangalore, Chennai, Calcutta and Mumbai. ADCs operated as product selection centers for Amway’s entire product range and as training centers for distributors. Amway appointed Sembawang Shriram Integrated Logistics, and Mumbai-based First Flight Couriers as its total logistics partners for home delivery of Amway products across 151 cities in the country.
Amway’s domestic operations fell into five areas - personal care, homecare, nutrition, cosmetics and home tech. The company introduced India-specific products, in pursuance of its go ‘glocal’ philosophy. Also, for the first time in its history, Amway utilized media advertising to promote its products.
In the beginning, Amway had to deal with the negative attitude of many Indians to direct selling. Direct selling was typically seen as unwelcome, an intrusion into one’s privacy. This was true to a certain extent. Sales people often used a ‘hardsell’, the product quality was sometimes poor and most importantly, the salespeople were poorly trained and lacking in motivation. However, Amway changed all this radically and a significant change was brought in the field.
Amway was able to break the time tested and traditional distribution set-up of manufacturer-distributor-retailer-consumer. Within 11 months, Amway became the country’s largest direct selling company and after two years of the commercial launch, Amway’s distributor base crossed the 200,000 mark. Its strengths were clearly manifested in the aggressive product launch plans, its products which claimed to exceed consumer expectations, the ‘money back’ policy, and a distribution network spread across 26 cities servicing more than 306 locations. In 1999, Amway reported a sales figure of Rs 100 crore. Reacting to reports stating this as a ‘below-expectations’ figure, company sources commented that the concept of network marketing had not been a constraint for Amway. The then CEO & MD Bill Pinckney commented, “The direct selling model is not new to India. What’s new is the structure. And while it’s true that consumers do not rush in to buy an Amway product, network marketing works as a low-key approach and evolves over time.”
However, the problems like distributor attrition, a false ‘premium’ image and customer dissatisfaction soon began surfacing. Amway could not sit back and let competitors like Oriflame, Avon and Modicare take advantage of its weaknesses.
PICKING UP THE PIECES
Amway soon woke up to the reality that it had to take steps to put its MLM machinery back to the track. For this, it had to first identify where it had gone wrong. Amway realized that like most direct marketing networks, it had hoped to leverage the global promise of the lucrative business opportunity for its distributors. Though this made sense in the developed consumer markets of the West, in India, distributors also needed to know the value of the products they were selling, this aspect was overlooked by the company.
One of the first ‘corrective’ measures it took was putting stickers on its products,
which clearly indicated the number of usages very clearly. For instance, it introduced
stickers on the packs of its car-wash solution to emphasize the number of washes that
a consumer could get per bottle. The idea was to firmly establish the fact of Amway’s

143
Amway’s Indian Network Marketing Experience
products being highly concentrated and with very low per usage cost. This practice
was later expanded to other products as well.
Amway realized that a complicated market such as India needed a focused approach
for each of the product categories. To strengthen its product focus, Amway set up
strategic business units. Thus, though Amway had centralized marketing of all
products worldwide, its Indian arm appointed category managers for individual
product categories.
Amway also decided to focus on the market in the smaller towns. Quick expansion of the distribution network to smaller towns was identified as a major tool to offset the impact of attrition. The game plan was to reach consumer homes all over directly by making the current distribution system more effective and decentralized. In early 1999, Amway realized that servicing distributors in 160 cities through its 13 locations was curbing growth due to unavailability of critical infrastructure like networked banks, toll-free phones and multi-service courier companies. The cost of making long-distance calls, the courier companies’ refusal to accept cash and the time taken to deliver products were the three major hurdles that Amway faced. The typical direct selling system comprised a central warehouse located close to the manufacturing locations, which sent the products to regional hubs like the metros and then on to the branch offices. As opposed to the traditional FMCG delivery setup, where the distributors or retailers carried inventory, here it was taken care of by the company warehouses and their region-specific distribution centers. Long distance calls and courier companies took care of distribution in cities where the company had no presence. However, with these facilities not being up to the mark, Amway decided that it had to effectively handle these issues and rapidly expand its offices in order to capture the growing direct selling clientele in the country.
The company also decided to give incentives to cost and freight agents (C&FAs) who could deliver parcels in the same city within 48 hours and outside in about 72 hours.
Amway then planned to tap unemployed youth in smaller towns by subsidizing the entry fee for the starters’ sales kit. Amway also offered to finance the sales kits through interest-free loans. It even gave free kits to visually impaired youth in Rajasthan. But media reports were skeptical about Amway’s strategy to use localized strategies for its global products. This ‘gamble’ was Amway’s biggest test case the world over, they remarked.
In a bid to make its products more affordable, Amway introduced value-for-money ‘chhota (small) packs’ in December 1999. The sachets significantly boosted sales. Sachets had two advantages – they helped Amway shake-off the ‘super-premium-products-only’ tag, and with their lower prices invited consumers from lower income levels to try the products. This was expected to lead to brand penetration.
The most significant of Amway’s Indian initiatives were its ‘Indianisation’ efforts.
The company started printing Hindi slogan ‘Hamara apna business’ (our own
business) on its stationery. The company’s first product line, Persona, was created
specially for the Indian consumers. Amway even named its expansion drives as
‘Operation Gaadi’ and ‘Operation Ghar.’ Operation Gaadi was launched in east-Uttar
Pradesh where a store was mounted on a truck and made trips to different regions on
different days. The project was later extended to West Bengal as well. Operation Ghar
was primarily designed to provide better service to the customers as well as to its large
family of distributors. Involving an outlay of Rs 15 crore in its Phase I, Operation
Ghar eventually covered 19 state capitals. Operation Ghar was designed to provide
five Es - ease of ordering, ease of paying, ease of receiving, ease of returning and ease
of information/operations. Amway also utilized the Internet and electronic kiosks to
hook up with its distributors and give them information.

144
Marketing Management
‘NETWORK’ING ITS WAY INTO THE FUTURE
By 2004, Amway planned to become a Rs 1000 crore company with a physical
presence in 198 centers across India. The company also revealed that by 2002, it
would be selling all the 450 Amway products that were available abroad, in India. As
part of its plans to tap unexplored markets, Amway announced an ambitious
expansion of its distribution infrastructure in Andhra Pradesh, which included setting
up a warehouse. Once the marketing business in urban areas was strengthened,
Amway planned to turn its attention to untapped rural areas as well.
Even as Amway was establishing its roots in India, it was already facing troubles abroad. The very concept of network marketing was being threatened by the growing popularity of e-commerce and the Internet. Through the World Wide Web, manufacturers had the opportunity of engaging in one-on-one direct selling in an even simpler way. This posed a major threat to multilevel marketers. However, the real threat seemed to be the merging of telecom networks with the cable television operators. This brought the customer directly in touch with the company through telemarketing tools. This would naturally make the salesperson obsolete. Of course, given the pace of developments on the Indian telecommunications front, network marketers could take it easy for at least some more years.
However, Amway prepared to meet these challenges by taking initiatives to further strengthen its online presence. With Internet usage levels increasing and little spare time for shopping, Amway believed that the Indians would gradually move to online shopping. But it thought the process would take time, as the pleasure of window-shopping and the actual shopping experience could not be replaced very easily. Amway provided graphics and three-dimensional views in the product display sections on its website. The company also planned to have portals in various Indian languages to ensure wide coverage.
THE INDIAN MLM JOURNEY
MLM was the fastest growing sector of the direct selling industry worldwide. In 1988, the total revenue generated by MLM was $ 12 billion, which doubled to $ 24 billion by 1998. The direct-marketing industry in India was about Rs 6 billion in 1999. This was a growth of 62% over the previous year.
In the pre-liberalization era, network marketing in India was usually in the form of various chit fund companies like Sahara India. These had a system of agents, who simultaneously mobilized deposits and appointed sub-agents for further deposit mobilization.
Companies such as Eureka Forbes and Cease-Fire pioneered the direct selling system in the country with a sales force that was trained to make direct house-to-house sales.
Oriflame International was the first international major to begin network marketing operations in India in 1995. This was followed by the entry of Avon India in late 1996. Tupperware, with product portfolio comprising plastic food storage and serving containers, also entered India in 1996. Later, Avon’s decision to opt out of the MLM setup came as a major setback to the industry.3
3 Avon was the world’s largest seller of beauty products operating in 135 countries. The company opted for MLM in India while worldwide it was known for its door-to-door direct selling success. Avon’s decision to adopt MLM was led by the belief that in India, door-to-door salespeople were treated with a strange indifference. However, this led to Avon losing its focus on its stronghold of having a strong end-user focus. Besides, the company could not make the shift in mindset that multi-level selling required, as MLM required a strong distribution push mentality, which was very different from the hard selling to the end users

145
Amway’s Indian Network Marketing Experience
The first homegrown MLM major was Modicare, started by the house of Modis in 1996. Modicare’s network was spread across northern and western India. Commenting on the Indian MLM experience, S.K.Gupta, COO said, “The concept is especially relevant for India because of the highly fragmented retail structure, high brand proliferation which limits shelf-space and massive brand wars both at the trade and advertising level.”
The direct selling industry in India was in its initial stages even in early 2001. Besides Amway, Oriflame Avon and Tupperware, other players included Lotus Learning, LB Publishers and DK Learning, all selling books. All the direct selling companies were members of the Indian Direct Sellers’ Association (IDSA), and were bound by its code of conduct.4
While in international markets, a wide range of products was successfully sold directly to homes, this was not the case in India. In the mature economies, customers were fully aware of the competing products available, whereas in developing economies such as India, awareness levels were comparatively low. Industry observers commented, “The way the market is booming, no direct sale company can meet all its customers only through its own sales force.” However, MLM companies opted for direct selling as against the high visibility retail set up for competitive cosmetics players such as Revlon, aiming to get an image of exclusivity.
There was some resistance to the network-marketing concept in India, as Indians preferred the security of a job. Being a salesperson in an MLM setup did not provide this security. This hampered the company’s ability to attract competent personnel. The problem was aggravated by the fact that companies treated direct selling as ‘just another’ promotional tool, while it was mainly about motivation. One positive aspect of network selling was that it was very convenient for women as the job could be done part-time and at hours of their convenience. Also, the products sold also usually targeted at women, and this made it easier for the Indian women to accept the distributorships.
Most Indian direct selling failures stemmed from the fact that they did not understand the concept thoroughly. Companies who opted for advertising in the media soon found that it had a negative impact. Advertising created a suspicion in the mind of the salesperson that the company was taking direct orders and thus, reducing commissions. In some cases, it also negated the impact of demonstrations. Eureka Forbes handled this carefully, when it advertised not its product, but the salesperson as a friend of the customer. Advertising went hand in hand with retail, as people ought to be told where to go and get the product. In an MLM setup, advertising was not the best way to spend money. Though this did sometimes result in inadequate product exposure, the money which would have been spent on advertising was usually
that Avon was good at. Avon had also significantly lowered its advertising expenditures. Avon’s Managing Director, David F Gosling said, “It was a mistake to adopt multi-level system when we weren’t good at it. We soon realized that we should stick to what we knew best.” He claimed that MLM had simply turned into a recruiting machine and it was difficult to ensure that the distributor down the chain was not thriving on the performance of his recruits without actually performing (selling) himself. Also, Avon held back the much-needed distribution push as the company gradually lost faith in the system. Within two years, Avon switched back to door-to-door selling, putting in place a three-tier network of beauty representatives (BR), beauty advisors (BA) and independent sales managers, which established clearer relationships between the distributor and the company.
4 IDSA primarily focused on promoting consumers’ awareness and interest. Its other main objective was to support and protect the character and status of the direct selling industry, and assist in the maintaining of qualitative standards in direct selling. Legitimate direct selling companies were thus concerned with developing, protecting and maintaining a suitable public image and ensured that their salesforce observed company as well as industry standards of performance and complied with ethical and legal requirements.

146
Marketing Management
diverted into training and motivating the salesperson to contact as many customers as possible. Though Oriflame and Avon did advertise, it was mainly attributed to their being prima-facie into cosmetics and personal care, thereby involving an image factor. Amway, which was into home care products in a big way, had decided not to go in for advertising on a scale as large as adopted by Oriflame and Avon.
Competition was intensifying in the industry in the early 21st century. Amway seemed to be faring better than competitors like Modicare - a fact attributed mainly to its premium brand image. Both Amway and Modicare were not the typical door-to-door selling companies, as they sold only to customers known to their distributors. While Amway targeted only the upper section customers, Modicare targeted the middle and the upper middle class customers. Some of Modicare’s products were priced at one-fourth of the price of Amway’s products. Modicare sources said this was because its products were priced for the Indian market, while Amway’s pricing was more in tune with its global counterpart. Modicare was even willing to reduce its margins in certain cases. Also, Modicare offered 100% refund even when the product had been used, unlike the 75% refund offered by Amway. This could turn out to be a cause for concern for Amway in the long run.
Questions for Discussion:
1. Comment on the concept of network or multilevel marketing. Do you think the model would be successful in India? Also, compare and contrast the MLM model with the traditional distribution system, bringing out the merits and demerits of both.
2. Study the developments that occurred after Amway launched its commercial operations in India. List the reasons, which led to the ‘below-expectations’ performance of the company.
3. Critically examine the corrective measures adopted by Amway to make the MLM model a success. What further measures can the company take in order to tackle the competition from FMCG majors like HLL and P&G?
© ICFAI Center for Management Research. All rights reserved.

147
Amway’s Indian Network Marketing Experience
Exhibit I
Amway Products Available In India (April 2001)
Brand Product Category Bingo Toy
Buff Up 500ml Furniture Cream
Car Wash 500ml Household Care
Chunky the Monkey Toy
Dish Drops 1 Liter, 500 ml Household Care
G&H Body Shampoo Personal Care
G&H Lotion 65 ml Personal Care
Leather & Vinyl Cleaner 500ml Household Care
L.O.C 1 Liter, 500 ml Household Care
Nature Shower CHS 250ml Personal Care
Persona (Pack of 4 Brushes) Tooth Brushes
Pursue 5 ml, 500 ml, 200ml Disinfectant Cleaner
SAB Delicate 500ml Liquid Cleaner
SA8 with Natural Softener 1 Liter, 500ml Liquid Cleaner
Satinique DC Conditioner 250ml Personal Care
Satinique DC Shampoo 250ml Personal Care
Satinique 2-in-1 250ml Personal Care
See Spray 500ml Household Care
Zoom 500ml Household Care
Glucosamine HCl with Boswellia Nutrition Product
Protein Powder 455 gms Nutrition Product
Siberian Ginseng with Gingko Biloba Nutrition Product
Triple Guard Echinacea Nutrition Product
Advanced Daily Eye Cream Personal Care
Alpha Hydroxy Serum Plus Personal Care
Satinique 2-in-1 Sachets (20 nos.) Personal Care
G&H Lotion Sachets (30 nos.) Personal Care
Car Wash Sachets (20 nos.) Household Care
Nutrilite Calendar 2001
Greeting Cards
Sales AidsBody Sponge
Pour and Measure Cap
PC Pump Dispenser
HC Pump Dispenser 500ml
HC Pump Dispenser 1L
Turret Top Cap
Pistol Grip Sprayer
Dispenser Bottle
Source: www.amwayindia.com

148
Marketing Management
Additional Readings or References:
1. Raman A.T., Way to sell, Business India, February 26, 1996
2. Datt Namrata, Opening doors, Business India, March 11, 1996
3. Subramaniam Ganga, A female force, Business India, August 12, 1996
4. Kawatra Pareena, The New Multi-Level Marketing Model, Business Today, September 22, 1996
5. Bansal Shuchi, Amway takes the direct route to India, Business World, December 11, 1996
6. Varghese Nina, Amway to Set Up Shop in India by Sept., Hindu Business Line, March 26, 1997
7. Chakraborty Alokananda, Casting the net, Business India, January 26, 1998
8. The American Way, Hindu Business Line, February 5, 1998
9. Ramachandran Rishikesh, The Success of Amway has a lot to do with entrepreneurialism, Hindu Business Line, February 5, 1998
10. Stanchart Amway Card unveiled, Hindu Business Line, April 8, 1998
11. Amway’s new distribution centre in Chennai, Hindu Business Line, April 16, 1998
12. Amway fancies Indian market, Hindu Business Line, May 5, 1998
13. Amway signs deal to promote UNICEF products, Hindu Business Line, November 4, 1998
14. Datta Namrata, Channel Discovery, Business India, March 8, 1999
15. Amway launches Operation Ghar; states products made locally, Hindu Business Line, April 17, 1999
16. Jain Shweta, Getting More Personal, A&M, April 30, 1999
17. Amway India business to touch Rs 1,000 cr. in 2002, Hindu Business Line, August 9, 1999
18. Thakur Punam, Amway finds its way, Business India, December 13, 1999
19. Amway introduces low-cost sachets, Hindu Business Line, December 17, 1999
20. Amway seeks to step into unexplored markets, Hindu Business Line, March 3, 2000
21. Prasad Shishir, Which Way Amway, Business Standard, June 22, 1999
22. Pande Bhanu, Avon raises its level, Business Standard, September 29, 1999
23. Bright prospects for Amway India after June 2001, The Financial Express, July 31, 2000
24. www.amway.com
25. www.amway-in.com

The Corporate Glass Ceiling
“Those who complain about glass ceilings should keep in mind that glass can be
shattered if one strikes it hard enough and long enough.”
- Russel Madden.1
“The glass ceiling that’s holding women executives back is not just above them, it’s
all around them, in the whole structure of the organization: the beams, the walls, the
very air...most of the barriers that persist today are insidious – a revolution couldn’t
find them to blast them away.”
- Debra Meyerson and Joyce K. Fletcher.2
“People often say there is a glass ceiling. And my reflection on that is, it’s just a thick
layer of men.”
- Laura Liswood, Secretary General of the Council of Woman World Leaders.
THE ‘GLASS CEILING’ BREAKS
In February 1998, Meg Whitman (Meg) became the President and CEO of eBay, the largest online auction company in the world. In July 1999, Carly Fiorina (Carly) was announced the CEO of Hewlett Packard (HP). Carly became the first woman CEO of a Dow 50 company and the only woman CEO of a Fortune 503 company. In January 2002, Patricia F Russo (Pat) was made President and CEO of Lucent Technologies4.
The trend of women achieving top management positions was not only noticed in the developed countries, but also in the developing countries like India. In June 2001, Lalita D Gupte (Lalita) was made the head of ICICI’s global operations. She also ranked 31 in the Fortune’s Power Fifty,5 2001. Other examples included Kalpana Morparia, Senior General Manager (Legal), ICICI and Gayathri Parathasarthy Head, Development Integration Services, a SBU for the IT services division at i-Flex Solutions.
Indian women achieved top management positions in corporates outside India as well. In April 2000, Indra Nooyi (Indra) was promoted as the Chief Financial Officer (CFO) and President of PepsiCo. Indra had the rare distinction of being the highest-ranking Indian woman in the corporate world of America. She was also ranked by Fortune as one of the most powerful women. In August 2002, Naina Lal Kidwai (Naina) became the Vice-Chairman and Managing Director of the Indian investment banking division of HSBC. Naina was also ranked third on Fortune’s list of Asia’s most powerful women, and she was declared the 47th most powerful women in business in the world. Others included Jayashree Vallal, Vice-President at Cisco Systems, and Radha Ramaswami Basu, CEO of Support.com.
1 A fiction and non-fiction writer, Russel Madden has a Master’s degree in Communication Studies and a Bachelor’s degree in Communication Studies and general studies from the University of Iowa. One of his popular books, ‘The Greatest Good’, is based on politics and ethics.
2 Authors of the Harvard Business Review article “A Modest Manifesto for Shattering the Glass Ceiling.”
3 The list of 50 largest companies in the US based on revenues. 4 In Fortune magazine’s annual survey of the Power Fifty, 50 Most Powerful Women in
Business are selected. The magazine tracks the emergence of women who came to power slowly, by staying with a company, steadily built influence, and rose to power through determination and insider knowledge.
5 List of ‘Most Powerful Women in Business’ across the world.

152
Organizational Behavior
With the above developments, some analysts and feminist groups were quick enough to announce that finally, women were breaking the highest of the ‘glass ceilings’ which had become an invisible barrier for many women making efforts to achieve top management positions in leading corporates across the world. Though there was a significant improvement in women’s participation in the corporate world during the last few decades, not many women reached the ‘O-Zone’6 level.
The debate over the glass ceiling’s existence had been continuing for many decades. Women had been raising voices against the ‘glass ceiling’ phenomenon. However, the men in the corporate world denied the very existence of any such phenomenon. Moreover, some women who had reached high positions did not testify the existence of the glass ceiling. They felt that it only took some extra effort, some compromises and support from the family, for women to reach the top.
THE ‘GLASS CEILING’ CONTROVERSY
According to the US Department of Labor, a ‘glass ceiling’ is “an artificial barrier based on attitudinal or organizational bias that prevents qualified women and other minorities7 from advancing upward in their organization into senior management level positions.” The concept of ‘glass ceiling’ surfaced in the US in the late 1970s. A glass ceiling was not a barrier to an individual as such, but a barrier to women and other minorities as a group.
Initially, one of the main reasons cited for the existence of a glass ceiling was that women did not have the required experience and skills to reach the top management. They were restricted to clerical and other support services jobs. The reason seemed to be true, as in the late 1970s and early 1980s, very few women had proper college education and fewer had management degrees. A survey conducted by the Wall Street Journal in 1986 revealed that the highest-ranking women in most industries were in non-operating areas such as personnel, public relations and finance. These functional specializations rarely led to top management positions.
However, in the mid and late 1980s, the trend changed with more women taking up higher education in management and seeking careers in operating areas8 within a company. This was the period when the debate over the existence of ‘glass ceiling’ began. Surveys conducted during the mid-1980s (Refer Table I) revealed the negative organizational bias against women. According to the Harlan and Weiss study9
conducted on male and female executives doing similar kind of jobs, men were allowed to manage more number of people, had more freedom to ‘hire and fire’, and had a direct control over the company’s assets.
According to media reports, the tradition of less women employees representing top management positions continued even during the beginning of the 21st century. In a survey conducted by the US-based Equal Employment Opportunity Commission, 44 million people were employed in the private industry in the US in 2002 out of which 20.72 million (47.1%) were women. However, only 12.5% of all the Fortune 500 companies comprised women corporate officers holding top management positions. Out of the highest-paid executives in Fortune 500 companies, women only 4.1% were women.
6 The ‘O- Zone level’ comprises top management positions including the Chief Executive Officer (CEO), Chief Operating Officer (COO), Chief Financial Officer (CFO), Chief Information Officer (CIO) and Chief Technology Officer (CTO).
7 According to the U.S. government, minorities included American Indians or Alaskan Native, Asian or Pacific Islander, Blacks, and Hispanic individuals.
8 Operating areas include technical and manufacturing jobs. The non-operating areas include personnel, public relations and finance.
9 Harlan and Weiss are US-based researchers working primarily on the inequality of women and other gender discrimination issues affecting career advancement.

153
The Corporate Glass Ceiling
Table I
Major Obstacles to Women’s Career Reported
By Different Surveys in The 1980s
FACTOR
PERCENTAGE OF
WOMEN AGREEING
Wall Street Journal/Gallop Survey
Family responsibilities 3%
Male chauvinism, attitude towards a female boss, slow advancement of women, and being a woman
50%
There are disadvantages of being a woman in the business world 80%
Have been thwarted on their way up the ladder by male attitudes toward women
25%
Paid less than men of equal ability 70%
Korn/Ferry International Survey
Being a woman 40%
Los Angeles Times Survey
Sex discrimination 67%
Signs of racism 60%
Source: Compiled from www.feminist.org
Some feminist groups felt that the major reasons for glass ceiling was job
segregation10, the ‘old-boy’ network11, sex discrimination and the absence of strict
anti-discrimination laws. Sexual harassment12 was seen as another major impediment
in a woman’s career. In the developing countries, the scenario was even worse, with
the percentage of women in corporates being much lower than that in the developed
countries.
The feminist groups felt that the biggest barrier in women’s progress was the male-
dominated management, which made all decisions for the company. They alleged that
while considering candidates for promotions, the all-men executive board seemed to
give preference to men over women. Some women even complained that they were
not invited for certain meetings as they were not considered ‘policymakers.’ Another
reason for the existence of a glass ceiling was thought to be the lack of proper anti-
discrimination laws and government actions. Above all, the real problem seemed to lie
10 The concentration of women and men in different types and levels of activity and employment, with women being confined to a narrower range of occupations (horizontal segregation) than men, and to the lower grades of work (vertical segregation).
11 An informal, exclusive system of mutual assistance and friendship through which men belonging to a particular group, (e.g. alumni of a school), exchange favors and connections, as in politics or business.
12 According to the US Equal Employment Opportunity Commission, sexual harassment was a form of gender discrimination; it included unwelcome sexual advances, requests for sexual favors, and other verbal or physical conduct of a sexual nature, submission to or rejection of which explicitly or implicitly affected an individual’s employment, unreasonably interfered with an individual’s performance or created an intimidating, hostile or offensive work environment.

154
Organizational Behavior
in men’s attitude towards problems faced by women. They did not perceive these
problems as problems at all, which made it difficult for women to solve these.
Instances from some leading multinational companies proved the above to be true. For instance, in 2001, Linda Morgan (Linda), a Black woman, working as a manager at one of Johnson and Johnson’s (J&J) subsidiaries, filed a lawsuit against J&J, which was popular as a equal opportunities employer (Refer Exhibit I). Linda alleged that she was denied promotions, though she had good performance evaluations. She said that she had requested her White superiors for promotions, but was not even called for an interview, though she was highly qualified than the employees who were called for promotion interviews. As per the law suit, J&J also hired people from the minority communities at lower salaries than the White employees with the same or lower qualifications.
In 2001, Karen Bauries King (Karen), one of the women Vice-Presidents of Marriott International (Marriott), filed a law suit against the company. She had joined Marriott as an assistant manager (health plan contracts) and, in ten years, she became the vice-president of its benefit resources division. However, in March 2000, she was asked to leave. Karen alleged that the company discriminated against women, paid them less, did not promote them, and finally, asked them to leave whenever it wished. Karen and her supporters said that, “female employees hit a glass ceiling as they approach the senior vice president level.”
THE DEBATE CONTINUES
Notwithstanding the above arguments by feminist groups, some analysts argued that no glass ceiling existed at all. According to them, women could not reach top management positions only because most of them left their careers mid-way due to personal reasons (like marriage and raising a family). They said, in order to become a CEO, a woman executive would have to sacrifice some aspects of her personal life. The top management posts demanded more commitment and required about 80 hours of work per week. Thus women in such positions would have to forgo their personal lives, which was not possible for most women. Moreover, women themselves left more demanding jobs for more flexible jobs, which allowed them to spend more time with their families, particularly their kids.
Analysts felt that women were paid lower salaries since they left the jobs midway, worked for lesser time and joined low-risk jobs. Though few women reached the top management and were totally committed to their careers, they did not seem to understand how a business worked. It was reported that women who did not realize the importance of office politics, proper channels, and did not have self-confidence and the ability to take quick decisions failed in their jobs.
They further alleged that the invisible ‘glass ceiling’ was used as an excuse by women executives who could not become a part of the top management. Moreover, women themselves seemed to create barriers for themselves – they showed a lack of desire for moving up the ladder. Many women felt contended with their present jobs and did not try for senior positions.
As the debate over the existence of a glass ceiling continued across the globe, some women continued to make their presence felt in the boardrooms and others continued with their efforts to break the glass ceiling. Women not only reached the top management, but also became the CEOs of some of the Fortune 500 companies (Refer Exhibit II and III).
Surprisingly, all these women denied existence of a glass ceiling. For instance, Carly believed that there was no glass ceiling in the US corporations, “I hope that we are at a point that everyone has figured out that there is not a glass ceiling.” Naina shared her experiences: “I did face a few obstacles in my career but most were because I was

155
The Corporate Glass Ceiling
very young, not so much because of gender bias. People with much more experience seemed to be available and that was a problem sometimes, but none due to my being a woman.” Lalita felt that ICICI had been an equal opportunity employer (Refer Exhibit IV). She said, “ICICI has always displayed more of a pro-woman bias than an anti-woman one. I have never encountered the glass ceiling here. I know it exists but I have never faced it.”13 Another individual, Aruna believed in the non-existence of the glass ceiling, “Right through my career, even at the time when I was with TCS, I never found being distinguished because I was a woman. In the tech industry the glass-ceiling does not exist, you see a lot of women tech heads here. If there is a ceiling it is in the mind of the women themselves and not in the industry.”
However, some analysts felt that these were only a few examples of women who could come up to top ranks. Reportedly, many women were struggling to rise through the ranks in different organizations in several industries. Toddi Gutner14 said, “Just because a handful of corporate women have made it to the top doesn’t mean the battle for equal opportunity is over.” Another analyst commented15, “For every Fiorina, who claims the glass ceiling has been shattered, there are hundreds of thousands of working women who know it remains firmly in place.” Analysts felt that women leaders who have achieved top positions should make efforts to eliminate the barriers to the advancement of other women.
THE FUTURE
Though the glass ceiling in the developed countries seemed to have broken only in selected industries like medicine, information technology and financial services (Refer Exhibit V), this development was less visible in the developing countries. Analysts also felt that in the developing countries, especially in the Asian region, it was the ‘culture’ that was primarily responsible for the existence of a strong glass ceiling. The culture did not allow women to work, and they were primarily entrusted with the job of homemaking. Analysts opined that in countries including Korea and India, marriage and male chauvinism had stopped women from building their careers. In addition, the corporate organizations in these countries did not seem to favour women.
To avoid hitting the glass ceiling, some women became entrepreneurs. In the US, the number of companies owned by women had grown by 16% during 1992-97. Similarly, the employment of women in companies owned by women increased by three times their employment in other companies. Even in the Asian countries, women-owned companies were increasing. Some examples were the Addon Company promoted by Choi Young Sun, Sung Joo International by Sung Joo Kim, Pugmarks India by Anuja Gupta and ML Infomap Pvt. Ltd. by Manosi Lahiri.
However, becoming entrepreneurs was not the ultimate solution for the problem of glass ceiling. In India, there seemed to be an unwritten rule of not employing women. Statistics substantiated this view and revealed that only 3% women held senior positions16 in the Indian private sector. In addition, a survey revealed that even women graduates from premier business schools like the IIMs were not very keen to build a career. Pallavi Jha, former chairperson of the Confederation of Indian Industries (Maharashtra Region) said, “A study on women graduates of the Indian Institute of Management, Ahmedabad, showed that more than 70 per cent do not pursue a career.”
Some leading companies in India reportedly said directly that they were traditional in
their ways, and did not hire women as a matter of policy. One example is Videocon
13 www.womenexcel.com 14 In a BusinessWeek article dated August 29, 2002. 15 According to Paula Schuck in her article “Glass ceiling still restricting women,”
www.canoe.ca. 16 As quoted in www.indianest.com and www.corpwatchindia.com

156
Organizational Behavior
International (Videocon), a leading consumer durable manufacturer that did not hire
women in its corporate office, though it had more than 4000 woman workers in its
factories. Commenting on its policy, the chairman of Videocon said, “We are from an
orthodox family and this is the way we work.” The Tata Group also maintained in the
‘no-women rule’ for many decades, which changed during the early 1980s.
Bajaj Auto (Bajaj) was yet another company, which did not hire women for its shop floor as a matter of principle. In 1995, Bajaj changed its policy, but only a few women were hired in the other departments of the company. In 2002, the company had only 6 women managers at various levels. A company official defended it by saying, “We did not recruit women earlier because our factory in Pune was away from the city. We recruit from engineering college campuses and not many women are keen on a manufacturing job like ours.”
On the other hand, some leading organizations in India were employing women in highly responsible positions. Women managers were also being praised by their male counterparts for their soft skills like caring, understanding, good teamwork, good communication skills, patience, perseverance, etc. According to analysts, as women had unique skills and style of management, the organizations should utilize these by assigning them the right responsibilities. Suresh Guptan, Executive in-charge at Tata Services added another point of view saying, “While women still appear to be struggling, middle-level female professionals are being promoted over more deserving men simply because it is politically the correct thing to do.”
Questions for Discussion:
1. Explain the concept of corporate glass ceiling. What do you think are the various factors that prevent women from rising through the ranks in corporates around the world?
2. “For every Fiorina who claims the glass ceiling has been shattered, there are hundreds of thousands of working women who know it remains firmly in place.” Critically analyze the statement and justify your answer.
3. Though the debate on glass ceiling continues, some obstacles did prevent women from reaching top management positions. How do you think these obstacles can be overcome by women, particularly in developing countries like India? Explain.
© ICFAI Center for Management Research. All rights reserved.

157
The Corporate Glass Ceiling
Exhibit I
J&J’s ‘Our Credo’
We believe our first responsibility is to the doctors, nurses and patients, to mothers and fathers and all others who use our products and services. In meeting their needs everything we do must be of high quality. We must constantly strive to reduce our costs in order to maintain reasonable prices. Customers' orders must be serviced promptly and accurately. Our suppliers and distributors must have an opportunity to make a fair profit.
We are responsible to our employees, the men and women who work with us throughout the world. Everyone must be considered as an individual. We must respect their dignity and recognize their merit. They must have a sense of security in their jobs. Compensation must be fair and adequate, and working conditions clean, orderly and safe. We must be mindful of ways to help our employees fulfill their family responsibilities. Employees must feel free to make suggestions and complaints. There must be equal opportunity for employment, development and advancement for those qualified. We must provide competent management, and their actions must be just and ethical.
We are responsible to the communities in which we live and work and to the world community as well. We must be good citizens — support good works and charities and bear our fair share of taxes. We must encourage civic improvements and better health and education. We must maintain in good order the property we are privileged to use, protecting the environment and natural resources.
Our final responsibility is to our stockholders. Business must make a sound profit. We must experiment with new ideas. Research must be carried on, innovative programs developed and mistakes paid for. New equipment must be purchased, new facilities provided and new products launched. Reserves must be created to provide for adverse times. When we operate according to these principles, the stockholders should realize a fair return.
Source: www.jnj.com
Exhibit II
Women CEOS in Global Corporations
Some of the women CEOs in global corporations included Meg, Carly and Pat.
Meg graduated in Economics in 1977 from Princeton and got an MBA from Harvard in 1979. She started her career at Procter and Gamble in the brand management department. She then shifted to Walt Disney Company’s consumer products division, to hold the position of the senior Vice-President (Marketing) and a brand marketing position. Meg also worked as the President of the Stride Rite division, the Executive Vice-President of the Keds division and as Vice-President of Bain & Company. She then became the President and CEO of Florists Transworld Delivery (FTD) and moved on to become the General Manager of the Preschool division of Hasbro Inc., where she was responsible for the global marketing of the ‘Mr. Potato Heads’ brand. In February 1998, Meg became the President and CEO of eBay.
Carly graduated in Medieval History and Philosophy from Stanford University in 1976. She started her career with teaching English in Bologna, Italy, followed by a receptionist’s job in a New York City brokerage company. She got interested in business while working at the brokerage company and during the same time, she did her Master’s in Business Administration from the University of Maryland. In 1980, Carly joined the sales department of AT&T. Through her good sales skills, she moved up the corporate ladder at AT&T and in 1989, she joined its equipment department. In 1992, Carly became the first female officer in the network systems business of AT&T. She started working

158
Organizational Behavior
for Rich McGinn, the CEO of Lucent Technologies (Lucent), a subsidiary of AT&T. In 1996, Rich McGinn made her Lucent’s first woman Executive Vice-President of corporate operations. She handled Lucent’s initial public offering (IPO). She also played a major role in Lucent’s spin-off from AT&T. In July 1999, Carly was chosen as the CEO of HP. She had the distinction of being the first woman CEO of HP. Carly was the highest ranking woman in corporate America. She topped the Fortune list of ‘Most Powerful Women’ for four consecutive years, and was the only woman CEO of a Fortune 50 company.
Pat was a Harvard alumnus, who joined the sales and marketing management team of IBM, where she worked for eight years. In 1981, she shifted to AT&T, where she had took up executive positions in various categories including human resources, marketing, and strategic planning. In 1992, she was made the President of AT&T’s business unit, Global Business Communications Systems. In 1997, she was made the Executive Vice-President of the Corporate Operations division of Lucent Technologies, after the company spun off from AT&T. In 1999, Pat became the Executive VP and CEO of Lucent’s Service Provider Networks Group. In August 2000, Pat quit Lucent to join Eastman Kodak as the COO, and she again joined Lucent as CEO in 2002.
Source: ICMR
Exhibit III Indian Women in Top Management Positions
Even in the developing countries including India, women had reached the helm of organizations.
Indra had the rare distinction of being the highest-ranking Indian woman in the corporate world. She graduated from the Madras Christian College and IIM Calcutta. Her career started at Mettur Beardsell, from where she shifted to Johnson & Johnson. In 1976, she left India and joined Yale University’s Graduate School of Management. After obtaining a degree from the University, she worked for the Boston Consultancy Group, Asea Brown Boveri and Motorola. In 1994, she joined PepsiCo and rose through the ranks to become the CFO in April 2000. In December 2000, she was made the President of the company.
Naina graduated in Economics from the Delhi University and completed her Chartered Accountancy course in 1977. In 1982, she became the first Indian woman to enroll into the MBA course offered by the Harvard Business School. Naina’s professional career started in the mid-1980s at ANZ Grindlays Bank, where she rose through the ranks. She then joined Morgan Stanley India, and became the head of investment banking in JM Morgan Stanley17 in 1994. In August 2002, she left JM Morgan Stanley to head the Indian investment banking division of HSBC as the Vice-Chairman and Managing Director.
Lalita joined ICICI as an officer in 1971, after completing her Masters in Management Studies from Jamnalal Bajaj Institute of Management Studies. She rose through the ranks in ICICI in the next thirty years and played a major role in the growth of ICICI and its transformation into a financial services company.
Aruna was another woman who reached one of the top ranks in corporate India. She started her career in 1984 at Tata Consultancy Services (TCS). In early 1990s, she joined Aptech as the head of its subsidiary, Hexaware India. She then moved to Cap Gemini Ernst & Young (India), the software consultancy arm of Ernst & Young, to head its Advanced Development and Integration department. Over the years, she was promoted as the principal of Cap Gemini Ernst & Young (India).
Source: ICMR
17 Morgan Stanley entered into a joint venture with JM Financials.

159
Th
e C
orp
ora
te G
lass C
eilin
g
Exh
ibit
IV
O
rgan
izat
ion
al S
tru
ctur
e of
IC
ICI
Mr.
K.V
. Kam
ath
M
D &
CE
O
Mrs
. Lal
ita
D. G
up
ta
Join
t M
D &
CE
O
Mr.
S.H
. Bh
oja
ni
Dep
uty
MD
M
r. S
anje
ev K
erke
r SG
M –
Ris
k M
anag
emen
t
Mrs
. Sh
alin
i Sh
ah
GM
–A
cco
un
ts &
T
axat
atio
n
Mr.
A.T
. Kusr
a G
M -
HR
D
Mr.
V. S
rin
ivas
an
G.M
. Sec
reta
rial
Cust
od
ial
Serv
ices
SAP
– C
entr
al O
per
atio
ns
–
Gro
up
- M
IS
Mr.
R.V
enka
tara
ghav
anM
rs. K
alp
ara
Mo
lpar
ia
SGM
- L
egal
Mrs
. Kal
pan
a M
orp
aria
SG
M -
Tre
asury
M
r. S
. Mukh
erji
Maj
or C
lient
G
roup
Mrs
. Shi
kha
Sha
rma
SG
M –
Per
sona
l F
inan
cial
Ser
vice
s
Mr.
M.J
. Sub
bai
ah
SG
M –
Gro
wth
C
lient
Gro
up
Mr.
Arv
ind J
osh
i G
M -
IT
M
r. S
.P. N
agar
Kat
te
GM
– M
&A
Dr.
Nac
hik
et M
or
GM
–T
reas
ury
(I
nve
stm
ents
–
Eco
no
mic
Res
earc
h)
Mr.
S. K
has
no
tis
GM
– W
este
rn R
egio
n
Mrs
. Ram
ani N
irula
G
M –
No
rth
ern
Reg
ion
D
r. S
.C. N
anda
GM
– C
orp
ora
te M
arke
tin
g
Mr.
R. K
ann
an
GM
– O
il &
Gas
M
rs. C
han
da
Ko
chh
ar
GM
- M
CG
M
r. A
. Muke
rji
GM
– I
nfr
astr
uct
ure
Gro
up
, Str
uct
ure
d P
roduct
s, A
dvi
sory
Ser
vice
s
Sou
rce:
ww
w.ic
ici.c
om

160
Organizational Behavior
Exhibit V Representation of Women in Management, 2000
Source: US General Accounting Office report
0
20
40
60
80
100
Comm
un.
Public A
dmin
.
Busines
s
Enterta
inm
ent
Oth
er P
rof.
Educatio
n
Retail
Tra
de
Finan
ce
Hosp
itals
Prof.M
ed.
Percent of all positions filled by womenPercent of management positions filled by women

161
The Corporate Glass Ceiling
Additional Readings & References:
1. Gopalakrishnan Kishori, Women in India: Breaking the Stereotype, www.siliconindia.com, June 29, 2000.
2. Bahl Taru, Running The Show, Her Way!, The Tribune, July 8, 2000.
3. Indian woman third on Fortune list, www.rediff.com, October 5, 2000.
4. Warner Melaine, America's 50 Most Powerful Women, Fortune, October 6, 2000.
5. Alam Srinivas, World at her feet, Business World, October 23, 2000.
6. Lee Karen, Benefits VP charges former employer with gender bias, www.benefitnews.com, April 01, 2001.
7. Patil Vimla, Striving to break through the glass ceiling..., The Tribune, October 14, 2001.
8. Petersen Melody, Two Employees File Bias Suit Against Johnson & Johnson, www.idcg.net, 2001.
9. Dev Sudipta, Women in IT shatter the glass-ceiling myth, Financial Express, February 25, 2002.
10. Srivastava Roli, Women Not Welcome in Corporate India, Times of India, April 18, 2002.
11. A Woman’s Touch, www.womenexcel.com
12. www.fortune.com.

Employee Satisfaction – An Outcome of Motivated Workforce
CASELET 1
Smile Hotels Group is a leading hotel group in India. It has about 40 hotels in various cities across India and 25 in overseas locations. The group emphasizes employee training and development, and customer service. But the CEO of the group, Hari Prasad Thakur (Thakur), observed that the customer growth rate of the group’s hotels had not been quite good for the last three years. He approached a consultancy and asked it to conduct a customer survey to find out their opinion about the hotel’s customer service. The survey revealed customer satisfaction to be average. It was almost equal to the rating given to some of the new hotels in the industry. Thakur was shocked to see the results of the survey and called all the senior managers in the company for a meeting.
Addressing them, he began, “Good morning, Ladies and Gentlemen! As you all know, I had recently hired a consultancy to conduct a customer survey for us. I have the results here with me. It is with great disappointment that I have to inform you all that our group of hotels have rated very low on customer satisfaction. I had never imagined that our customers have such a poor opinion about us. You can see that we are rated at par with some not-so-known hotels.”
On hearing this, most of the managers were shocked. Some of them expressed their disbelief saying, “Oh! We can’t believe this.”
After giving them sufficient time to digest this unpleasant news, Thakur continued, “I had gone in for the survey because customer growth rate has been declining considerably for the last three years. What do you think we can do to satisfy and retain customers?”
The managers suggested various plans to attract and retain customers. The marketing manager of the company, Milind Patil (Patil), said, “It might be a good idea to offer our loyal customers free holiday trips, discounts in holiday packages, discounts in room rent, coupons and lucky draws.”
The associate marketing manager (corporate sector), Hitesh Chaudhary (Chaudhary), added, “We can increase our number of corporate clientele by providing them extra facilities. This, I am sure, will help us attract more executives to stay with us.”
However, Thakur was not convinced. When both, Patil and Chaudhary, were trying to convince Thakur, the HR manager, Soma Roy (Roy), interrupted them saying, “I am sorry to interrupt you but what I wish to point out to you all is that these techniques will work only for a short period of time. If we are looking for a permanent solution, I suggest we should focus on our customer service aspect which is crucial for our business. Our employees are trained to deliver good quality service to our customers. But, I believe that we have to motivate them to serve customers still better. Only by doing this will we be able to improve our customer satisfaction level.”
On hearing this, the operations manager responded, “What else do we have to give to our employees? Our employees already get the best salaries in the industry.”
Roy replied, “Salary alone won’t do. Why can’t we begin an employee recognition program? We will reward employees who offer superior customer service. It would motivate our employees to serve the customers better. Improved service will fetch us more customers.”
Thakur appreciated Roy for his suggestion and said, “That seems to be a good idea. We will implement it. Can you tell us how we should go about it?”

163
Employee Satisfaction – An Outcome of Motivated Workforce
Roy replied, “We will categorize high performers into three categories – good performers, very good performers, and excellent performers. The performance can be measured in terms of integrity, honesty, kindness, respect for customers, environmental awareness, teamwork, coordination, cooperation and trustworthiness.”
Thakur then asked, “What type of rewards would you suggest should be given to each of these categories of high performers?”
Roy replied, “For good performers we may give special two-star badges which they can pin to their coat. For very good performers we can give three-star badges and cash rewards, and excellent performers can be given five-star badges. They can be felicitated in the anniversary celebration function of the group and may be given good ranking that would get them faster promotions.” Suggestions from other managers were also invited and the recognition program was launched.
Questions for Discussion:
1. The salaries of employees of Smile Hotels Group were the best in the industry. Do you think the recognition program was needed to motivate employees? The CEO didn’t accept the suggestions offered by the marketing managers to attract more customers but accepted the suggestion given by the HR manager. Why do you think he liked the HR manager’s suggestion? Substantiate your answer.
2. What more do you suggest can be done by Smile Hotels Group to motivate the employees and improve customer service?
CASELET 2
Situation A
John Morgeld (Morgeld) received an appointment letter from Akay Enterprises (Akay). It was his first job and he would be joining the company as an executive trainee (production). He had got offers from two other companies but he selected Akay because the company promised a cooperative and supportive work environment for newcomers, an informal organizational culture and excellent growth opportunities for employees who stayed with the company.
On the day of joining, he wore an executive dress, tie and shoes and went to the office. The receptionist looked at him and asked him whether he was a marketing executive from any company. When Morgeld answered in the negative and introduced himself as a new employee, the receptionist wished him and began to attend her calls. Morgeld did not know whether he should go inside the office or wait at the reception till he was called in. He chose the second option and waited. He waited for two hours and nothing happened. So, he got up and asked the receptionist what he was supposed to do. The receptionist asked him to go inside.
Morgeld entered into a large hall having several cabins. He did not know, of all the
square cabins, which one he should go to. Randomly, he chose one and introduced
himself to the man sitting in the cabin. The man looked at Morgeld and began to
laugh. After laughing for two minutes, he told Morgeld that all employees come in
casuals to office and Morgeld looked like the CEO of the company in that suit. He
advised Morgeld to come in casuals. But he didn’t seem to know whom Morgeld
should approach and asked him to ask the person in the next cabin. When Morgeld
knocked on the next cabin and introduced himself, the person inside asked him to go
to the big cabin at the far end of the hall where the general manager (GM) of the

164
Organizational Behavior
company sat. Morgeld went to the GM and introduced himself. The GM looked
irritated on being disturbed by Morgeld. When Morgeld stated his reason for being
there, the GM directed Morgeld to approach the production manager, Shashank Ray
(Ray). When Morgeld went to meet Ray whose office was on another floor in the
same building, Ray’s secretary took the appointment letter from him and told him that
Ray was busy in a meeting with some important guest. The secretary asked him to sit
in the reception till he was called. After two hours, Morgeld was called in. Ray saw
Morgeld and he also laughed for a few minutes and told him to come to office dressed
in casuals.
Ray told Morgeld he had another urgent appointment and asked him to meet his
colleague Dheeraj Patel (Patel) who would instruct him regarding the work he would
have to do. Patel’s appraisal was done recently and he was given grade ‘D.’ He was
not given any increment. Patel told all the possible negative points about the
workplace to Morgeld and asked him to leave the place as quickly as possible to have
a better career. Patel also warned him not to be seen interacting with other employees
during office hours as it was an unwritten rule in the organization that no employee
should be caught socializing during office hours. Patel then told Morgeld that he had
some urgent work and left. It was one o’clock and no one seemed to leave for lunch.
Morgeld waited and waited. Then at three o’clock, the office boy came with tea.
When Morgeld asked him where he should go to have his lunch, the office boy told
him that lunch was available in the office canteen between 12 to 2.30 pm and at three
o’clock in the afternoon, he cannot expect to get anything but coffee and tea in the
canteen. On the very first day of his joining the new office, Morgeld returned home
hungry and sad.
Situation B
Morgeld had completed two years of working at Akay. He was always constantly
instructed and closely monitored by his team leader, Sadgun Chari (Chari). Morgeld
was never allowed to take any decision on his own. After two years, for the first time,
he was given a very important task by Chari. Chari told Morgeld that he would not be
able to guide him because he had several other projects on hand. Morgeld felt very
happy. But Chari told him, “If you can do this task, you can be sure of a promotion
this year, but if you can’t, I can’t even assure you of your job.” Hearing this, Morgeld
felt highly pressurized. He was suddenly given a very important task and Chari was
not ready to offer help. He prayed to God and began to work on it. He put his heart
and soul in it. He worked 14 hours a day. Sometimes he spent sleepless nights.
However, he finished the task successfully on time. He went to office and found that
Chari was on leave. He remembered what Chari had said when he had handed him the
project. Chari had cautioned Morgeld that if he couldn’t finish the project by the due
date, it would put their boss, Ray, in a difficult position since he was answerable to the
head office. Therefore, Morgeld went to Ray’s cabin since Chari was on leave. Ray
looked at him with a puzzled look on his face. Morgeld drew his own interpretation of
the expression on Ray’s face and thought inwardly, “I guess he is thinking – Why did
he come directly to my cabin?” Ray asked Morgeld “Where is Chari?” Morgeld
replied, “He is on leave, Sir. Hence I came to submit this file to you. Chari told me
that it is urgent.” Ray looked at the file and told Morgeld, “You keep it with you.
After Chari comes, he will have a look at it and then forward it to me.” Morgeld said,
“But, Sir, it is urgent, I believe.” Ray got irritated and said, “I know that. You take this
file back and start with the next task which is more urgent, OK?” Morgeld came out of
Ray’s cabin in no mood to take up the next task.

165
Employee Satisfaction – An Outcome of Motivated Workforce
Questions for Discussion:
1. “The first impression is the best impression,” What kind of impression did
Morgeld get about his organization? Would this be good for the company?
2. In Situation A and B, Morgeld was demotivated in many ways. Comment on the
urgency of the task given to Morgeld and the way he was treated upon completion
of the task. What was the impact of the work environment on his morale?
CASELET 3
When Manisha Sharma’s (Manisha) uncle, Hariprakash Sharma (Hariprakash), visited her at work in Modern Technologies (Modern), he was pleasantly surprised and amazed to see his niece working leisurely under a tree in the company’s sprawling garden. Later, over a cup of coffee in the company cafeteria, Hariprakash asked Manisha how the company allowed its employees to be away from their desks. “Doesn’t this affect employee productivity?” he asked. Smiling at her uncle’s amazement, Manisha explained, “My company believes in providing its employees with the flexibility of working in an ideal environment rather than imposing restrictions upon them regarding the place of work. The company’s effort towards creating a relaxed work environment has helped it in more than one way. It has resulted in developing a motivated and highly productive workforce. In fact the company is rated among the top three companies in the country for the fifth consecutive year, with regard to work culture and quality of work life.”
Manisha went on to elaborate, “In fact, like Modern, there are many other companies that also believe in providing their employees with an ideal work environment. These efforts are made to help employees cope with the stress associated with working on time-bound projects. Modern aims at creating a stress-free work environment. It does this by providing its employees with natural surroundings in which to work and with facilities such as a hygienically maintained cafeteria, a well-equipped gymnasium, tennis grounds, and a golf course.”
Hariprakash listened to Manisha keenly. As they walked past the golf course, Hariprakash wondered aloud whether such strategies really worked. Manisha clarified his doubt stating that Modern was among the very few companies that had performed well during the last few years despite the economic recession.
The conversation between Manisha and Hariprakash revealed that Modern implemented many such strategies to nurture a motivated workforce.
It offered facilities like telecommuting, flextime, and a holiday on completion of every six-week project schedule. All these were a part of the company’s HR policy. Besides, the company provided excellent growth opportunities for exceptional performers. It had exclusive employee development plans that helped its members progress through the career ladder. In addition to all this, the high salary structure in the organization enhanced employee loyalty and motivated them to attain organizational goals. The enhanced commitment and loyalty towards the organization resulted in bringing down the attrition rate to a considerable extent.
Hariprakash could now comprehend how the company benefited from its various strategies to provide its employees with a congenial work environment. “These efforts of Modern to provide a people-friendly work environment,” agreed Hariprakash, “helped retain the invaluable assets of the company – the people.”
166
Organizational Behavior
Questions for Discussion:
1. “The modern corporate world has redefined the rules of work efficiency and aims at employee wellness, in order to obtain maximum productivity from its employees.” In the context of the present case, discuss the various measures taken by organizations to enhance employee productivity by catering to employee wellness.
2. Organizations have introduced alternative work schedules to help their employees tackle work-related stress, thereby increasing their productivity. Describe the various alternative work schedules that help increase employee productivity.
© ICFAI Center for Management Research. All rights reserved.

Needs Drive Performance
CASELET 1
Milan Khanna (Khanna), HR manager of the GK Group of Industries, found himself
in a pensive mood after studying the annual HR report. The report had serious
implications not only for his job but for the company as well. The annual attrition rate
had grown by 18% during the preceding year, taking the present employee turnover to
a glaring 33%. Most of the talented workforce was leaving the organization for better
offers in the industry. Some of them were leaving even when the new pay was not as
good as that in this company. This was the trend despite the GK Group being
considered one of the best pay-masters in the industry. Moreover, during the previous
financial year, the company had given liberal incentives in the form of bonuses to its
exceptional performers.
The GK Group began as a software firm and later diversified its operations into
biotechnology and bioinformatics. Its employees were highly talented knowledge
workers and were motivated by their jobs and the various opportunities that their job
promised to offer.
However, a review of the exit interviews conducted during the past three years
revealed a striking fact about employee motivation – “Merely increasing the pay and
doling out incentives have only a marginal value as there are many other companies to
match your offer.” The exit interviews also revealed that efficient employees left the
organization seeking greater responsibilities, accountability and empowerment. Lack
of personal and professional growth opportunities in the organization prompted people
to quit and search for greener pastures. The lack of opportunities for learning and
growth in the organization, along with little or no attempts towards employee
empowerment proved to be some of the prime reasons for the high attrition rate at the
GK Group.
In the light of these facts, Khanna came up with a new strategy to contain the rate of
attrition in the company. His strategy was aimed at understanding the complexity of
employee needs and evaluating them. The management charted out a career growth
plan for each of its employees for an average period of three years, with the objective
of developing the overall personality of every organizational member. The plan also
included defining performance benchmarks so as to establish a correlation between
expected and actual employee performance. The employees were to be appraised of
their performance at the end of every six months in relation to these benchmarks so
that they could correct any deviation from the established standards. The strategy
proposed by Khanna aimed at creating a win-win situation for both the individual
members as well as the organization. Therefore, attempts were made to correlate
individual goals and organizational objectives. Recognizing the importance of skill
upgradation and employee empowerment, the management decided to promote
personality development and learning of employees through well established training
facilities. These measures aimed to empower and retain within the organization, the
human capital and talent, which form the most crucial factors in the success of any
knowledge enterprise.
When the GK Group implemented this strategy in the years that followed, it received
wide acceptance and also brought in the desired results of motivating, empowering
and retaining the workforce in the organization.

168
Organizational Behavior
Questions for Discussion:
1. “Merely increasing the pay and doling out incentives have only a marginal value as there are many other companies to match your offer.” Substantiate this statement by describing the various other means of motivating and retaining the workforce in an organization.
2. Discuss the various challenges faced by HR managers in modern organizations and outline the measures they can initiate to cater to the ever-changing needs of employees.
CASELET 2
Neha Kapoor (Kapoor) and Tina Menon (Menon) were excited about their first job offer from a leading multinational company, Meridian Business Solutions (Meridian). Meridian, a UK-based consultancy, offered business development and improvement solutions to organizations in a wide range of industries. Kapoor and Menon had just passed out from a prestigious business school with a masters degree in business administration. Both were bright students and Menon had been a topper all through in college. As students, Kapoor and Menon had always dreamt of working for a multinational company like Meridian. Their dream finally came true when they received a call from Meridian. Having topped the written test and the personal interview, both were offered the position of business development executives in the company. Their job responsibility was to tap potential clients from the corporate world. This seemed to be an ideal break for them as they were keen on getting a job that offered wide exposure to the business environment. The job was a challenging one that provided adequate opportunities for valuable corporate experience. Besides, the compensation offered was also at par with the best in the industry.
The first few months at Meridian were a learning experience for both of them. Kapoor and Menon were extremely enthusiastic about their jobs. The company had given them adequate training and reasonable autonomy to perform their job. They soon began handling clients independently. They were involved in getting new clients and were also responsible for maintaining smooth relationships with them. Both of them reported to the regional sales manager, Nitish Bajaj (Bajaj). Of the two, Bajaj was more impressed with Menon’s performance. Within a couple of months of joining the company, Menon had obtained and closed a deal with a very high profile client. Business with this client was expected to rake in huge profits for the company. In a party organized in the company to celebrate the occasion, Bajaj announced a cash award for Menon in appreciation of her commitment and dedication to the job. This served to reinforce Menon’s motivation and made her strive even harder to better her performance.
After both of them had completed a year of working in the company, the time for their performance review came up. The company had a yearly performance appraisal system which rated employees on the basis of their performance throughout the year. Based on these ratings, the employees were paid hefty performance bonuses that served as effective motivators for its employees. However, the yearly performance appraisal brought with it a rather unpleasant surprise for Menon.
Menon had hoped to receive a handsome bonus as an outcome of her performance review. She was aware that she would be appraised by Bajaj who had expressed appreciation for her good performance and announced a cash award for her within a few months of her joining the company. Meridian, however, did not have a transparent policy regarding appraisals and remuneration paid to employees. So, the

169
Needs Drive Performance
outcome of the appraisal was not immediately known to anyone but the employees themselves. It was only in course of time that details about the rewards could be gathered informally. In Menon’s case too, it took a while for her to know the outcome of her colleague, Kapoor’s appraisal. And what she heard shocked her. Kapoor had been given a bonus much higher than what she had been given. It came as a surprise not only to Menon, but to the rest of the employees as well that Kapoor had been rated higher than Menon, since everyone in the company knew that Menon was better at the job than Kapoor. The performance bonus thus, served as a demotivating factor for Menon as she began to feel that she deserved much more than what she had got and that her performance certainly did not call for receiving a lower bonus than Kapoor.
Menon’s demotivation was evident from her subsequent performance on the job. She stopped working as enthusiastically as she did earlier and was content with doing just the bare minimum required for her job. This change in attitude took place as she obviously felt that there was no point working so hard when she wasn’t being recognized for doing a good job. On comparing the efforts she had put into the job and the reward she had received, with the efforts put in by Kapoor and the reward given to her, Menon began to perceive an inequity in the way employees were rewarded at Meridian. Since she was being paid less than her expectations, she decided to put in less effort so as to bring about a perceived equity of pay between Kapoor and herself.
Consequently, Menon’s productivity level deteriorated and, in turn, it affected the performance and profitability of the organization. Thus, Menon’s negative attitude resulted in negative implications for the organization. Also, this frustration at the job made Menon look around for new jobs.
Questions for Discussion:
1. The annual performance review had a demotivating effect on Tina Menon. Briefly discuss the motivational theory that best describes Menon’s response to the appraisal.
2. Based on the equity theory, explain in what other ways Menon could have reacted to the outcome of the performance appraisal?
© ICFAI Center for Management Research. All rights reserved.

Employee Participation, Organization Structure and Decision Making
CASELET 1
It was the first meeting that was being convened by Raj Malhotra (Malhotra), the new branch manager of the Tirupur branch of KNB Bank, a growing private sector bank. In comparison to other branches, the Tirupur branch had performed badly ever since its inception seven years ago, and Malhotra being young and enthusiastic, was determined to bring about a dramatic improvement in its performance.
The meeting was the first such in the history of the branch as it involved the participation of all the employees of the branch, not just to welcome their new manager, but also to make certain crucial decisions that would result in enhancing the branch’s performance. The assistant manager, Abhiram Krishna (Krishna), had made all the arrangements for the meeting which commenced with Malhotra thanking everyone present for the warm welcome he was given on taking charge. After a brief mention of the various posts and responsibilities he had held till then in his career, Malhotra described the bank’s foray into the insurance sector and pointed out the additional responsibility that every employee of the bank had, to make this diversification a success. Malhotra then emphasized the targets that had to be achieved by the branch for that financial year, both in its regular products as well as in insurance.
With the opening up of the insurance sector in India, a majority of the private sector banks began to show keen interest in entering the sector by forming joint ventures with established insurance companies. KNB Bank too entered into a joint venture with Secure Insurance Services, a UK-based insurance company, to sell life insurance products to Indian customers. All the branch offices of KNB Bank were instructed by the corporate office to promote the sales of insurance products along with the regular bank products such as loans, fixed deposits, safety bonds, credit cards and various types of accounts.
Malhotra invited suggestions from all employees to improve the branch’s performance and achieve the annual target for that year. However, there was very little participation from the employees, despite Malhotra making repeated requests to them to fearlessly voice their opinions. Having received no substantial inputs from his subordinates, Malhotra then presented his plan of action to the employees in a meeting.
Of the various measures put forth by Malhotra to enhance sales, there was enforcement of sales targets even for employees dealing with routine banking operations such as cash transactions, generation of demand drafts, opening of new accounts and handling of customer queries. Although this was unacceptable to the employees, none of them voiced their objection even when Malhotra asked for their opinion. The meeting then concluded after a few more strategies to improve the branch sales were discussed.
The next day, one of the senior employees, Anand Trivedi (Trivedi), approached Krishna, with a document in hand. Krishna, who was busy preparing the monthly reports for the bank, glanced up, and seeing the document in Trivedi’s hand, asked what it was about. Trivedi replied that it was a representation from the employees. Krishna immediately stopped what he was doing and reached for the document. In their representation, the employees requested the management not to impose sales targets on them. They justified their protest by stating that it would be extremely stressful for them to concentrate both on processing routine transactions and on

171
Employee Participation, Organization Structure…
enhancing sales of the bank’s products and services. They claimed that of late, the number of transactions had increased tremendously.
Krishna was visibly irritated after he read the representation and asked Trivedi why the employees had not opposed the decision during the meeting itself. Trivedi replied that while the meeting was in progress, each employee had thought that he would be the only one to oppose it and had hesitated to voice his opposition for fear of antagonizing the management. It was only after the meeting was over and the employees could discuss the matter with each other that they realized that everyone was equally opposed to the decision. Krishna assured Trivedi that although it was not possible for him to promise anything, he would certainly make all efforts possible to make the management reconsider the action plan.
Questions for Discussion:
1. Raj Malhotra encouraged employee participation in the decision-making process of his branch. What is this type of decision-making known as? Also discuss the possible benefits of employee participation in decision-making.
2. During the meeting, all the employees gave their assent to Malhotra’s proposal for a new action plan. However, soon after the meeting, they forwarded a written appeal asking the management to reconsider the action plan. What, in your opinion, made the employees behave in this manner? What is this phenomenon known as? What are the characteristic features of such a phenomenon?
CASELET 2
Ashrita Airlines (Ashrita), a Mumbai-based company, operated flights to all the Asian countries. In all these countries, Ashrita had subsidiaries which offered Airport Terminal Services. The services included traffic control, cargo services, security services and catering (for staff and passengers). The subsidiary in each country was headed by a country manager who enjoyed a great degree of freedom and could take decisions without having to consult the headquarters.
The organization structure at Ashrita was flat in nature. Under the CEO, there were country managers. Under country managers, there were functional managers. All functional executives reported to the respective functional managers. For example, finance executives reported to finance manager and sales executives reported to sales manager.
Ashrita rotated its employees across different jobs to help them acquire cross-functional expertise. But the policy of job rotation did not apply to specialists such as engineers and technicians.
Ashrita’s country manager in India, Ajay Arora (Arora), focused on improving the efficiency of the organization’s terminal services. Arora paid close attention even to minute details of the company’s operations. He ensured that the food served on flight conformed to the customers’ tastes and preferences, and that the passengers’ luggage was transferred from the flight to the luggage room within minutes and they did not have to wait for more than 10 minutes for their luggage. If any customer reported any problem in dealing with any employee at Ashrita, Arora immediately took action in the matter. He called the employee who had interacted with the customer and brought to his notice the customer’s complaint about his service. Arora also pointed out to the employee that if one customer left Ashrita, it meant a loss of business for the company. He emphasized the fact that if Ashrita were to continue to lose business each day due to inappropriate behavior of employees, soon the organization would

172
Organizational Behavior
become bankrupt and would not even be able to pay salaries to its employees. Arora, thereafter, cautioned the erring employee to rectify his behavior to prevent such a situation from recurring. If it came to his notice that there have been more than three occasions in which a customer has complained against an employee, he demoted the employee or fired him.
Arora wanted to further improve the service offered to customers. He hired the services of leading consultancy – Apple Consultants which offered special training programs in customer service to airline employees. The training enabled Ashrita to improve its quality of customer service. In a customer survey conducted a few months after the employees had been trained, most of the customers who traveled by Ashrita Airlines rated the organization’s customer service as excellent.
Ashrita’s terminal services division in India received many awards for its excellent customer service and superior quality services. The subsidiary in India offered engineering services apart from other regular services like cargo, security and catering. Some international airlines used Ashrita’s services and paid for them. This became an additional source of revenue for Ashrita and its profitability increased.
On the founders’ day celebrations of the organization, the CEO of the organization praised and rewarded Arora for his efforts to improve customer service. The other country managers present at the function were impressed and announced their plans to follow in Arora’s footsteps, and make their subsidiaries efficient and profitable in a similar way.
Questions for Discussion:
1. What type of organization structure did Ashrita have? Discuss the advantages and disadvantages of this structure. What are the different methods of departmentation used in organizations?
2. Was the process of decision making centralized or decentralized in Ashrita? How did it benefit the organization? What are the possible negative effects of decentralization?
© ICFAI Center for Management Research. All rights reserved.

Southwest Airlines’ Organizational Culture "Culture is the glue that holds our organization together. It encompasses beliefs, expectations, norms, rituals, communication patterns, symbols, heroes, and reward structures. Culture is not about magic formulas and secret plans; it is a combination of a thousand things."
-Herbert D. Kelleher, Co-Founder and Chairman, Southwest Airlines.
TESTING TIMES
After the September 11, 2001 terrorist attacks, Southwest Airlines (Southwest) and the entire airline industry in the US faced devastating losses. Major airlines rushed to the US Congress for relief in the form of federal assistance. The industry was allocated $15 billion; a part of the relief came as outright grants to cover the losses of operating revenue following the shut down of the industry by federal order, while the rest was in the form of loan guarantees.
However, this assistance was not enough to pull the industry out of its heavy losses. It continued to lose billions of dollars every day because of the slow rate of passenger return. To reduce their losses, the airline industry in the US cut the number of flights by 20% and laid off 16% of their workforces in the weeks following the attacks. However, one airline that responded differently to the crisis was Southwest. The airline had its own unique approach to the crisis. Southwest avoided layoffs altogether and stuck to its mission of caring for its employees. It was felt that avoiding layoffs in the face of a dramatic decline in demand would jeopardize Southwest’s short-term prospects. The company was losing millions of dollars per day in the weeks following the terrorist attacks. However, Southwest was willing to suffer some damage even to its stock prices, to protect the jobs of its people.
Southwest’s no-layoff response to September 11 was a reminder to its employees of the organization’s tradition of caring for its people. When asked to comment on this, an official explained, “It’s part of our culture. We’ve always said we’ll do whatever we can to take care of our people. So that’s what we’ve tried to do.”1
Southwest has been profitable every year for 31 years since it started its operations in 1971. During this period, most airlines have struggled to achieve three or four years of consecutive profitability. In 2002, the total market value of Southwest was $9 billion, larger than that of all the other major airlines in the US put together (Refer Exhibit I). The airline achieved high levels of employee satisfaction and was included in the Fortune magazine’s list of the “100 Best Companies to Work for in America” for three years in a row. Many analysts feel that the remarkable performance of Southwest is because of its ability to build and sustain relationships characterized by shared goals, shared knowledge and mutual respect between employees. All these characteristics were ingrained in the organizational culture of Southwest.
BACKGROUND NOTE
In 1967, Rollin King, a San Antonio entrepreneur who owned a small commuter air service, and his banker, John Parker, initiated the idea of starting an airline company called Air Southwest Co. (later Southwest Airlines Co.) They wanted to provide the best service with the lowest fares for short-haul, frequent-flying and point-to-point
1 Jody Hoffer Gittell, The Southwest Airlines Way, McGraw-Hill, 2003.

174
Organizational Behavior
‘non-interlining’2 travelers. Herbert D. Kelleher, (Kelleher), who was the legal advisor to King’s air service, later joined them to start the airline company. The trio decided to commence operations in the state of Texas, connecting Houston, Dallas and San Antonio (which formed the ‘Golden Triangle’ of Texas). These cities were growing rapidly and were also too far apart for travelers to commute conveniently by rail or road. With other carriers pricing their tickets unaffordably high for most Texans, Southwest sensed an attractive business opportunity.
Having decided on the cities to operate in, Kelleher applied for the incorporation of the company in March 1967. On February 20, 1968, Southwest received permission from the Texas Aeronautics Commission (TAC) to operate across the three cities. Immediately thereafter, the Trial court restrained the TAC’s permission in response to a petition moved by the other intrastate airline operators (Braniff, Trans Texas and Continental). After an unsuccessful appeal to the State Court, Southwest obtained its certificate for operation after clearance from the Texas Supreme Court.
In January 1971, the Southwest management appointed Lamar Muse as the airline’s first CEO.3 Muse had earlier worked for Trans Texas, Southern, Central and Universal Airlines. Southwest again faced hurdles in the form of complaints filed by Braniff and Texas International with the Civil Aeronautics Board (CAB) to protest against Southwest’s start-up. Braniff also put pressure on some of the Southwest’s underwriters to withdraw from the airline’s initial public offering (IPO). The airline, however, overcame these obstacles and started operations on June 18, 1971 (Refer Table I for Southwest’s expansion).
Table I
History of Southwest’s Expansion
YEAR OF ENTRY
CITIES OR AIRPORTS SERVICED
1971 Dallas, Houston, San Antonio
1975 Rio Grande Valley
1976 Austin, Corpus Christi, El Paso, Lubbock, Midland/Odessa
1978 St. Louis, Kansa City, Detroit
1979 New Orleans
1982 San Francisco, Los Angeles, San Diego, Las Vegas, Phoenix
1994 Seattle, Spokane, Portland, Boise
1995 Omaha
1996 Tampa Bay, Ft. Lauderdale, Orlando, Providence (Rhode Island)
1997 Jacksonville (Florida), Jackson (Mississippi)
1998 Manchester (New Hampshire)
1999 Islip (New York)
2 Southwest did not arrange connections with other airlines; passengers transported their own luggage to recheck themselves onto connecting airlines.
3 Howard Putnum was the CEO of Southwest from 1987 to 1981. In early 1982, Herbert Kelleher took over as the CEO.

175
Southwest Airlines’ Organizational Culture
2000 Albany International Airport and Buffalo-Niagara International Airport.
2001 West Palm Beach, Florida and Norfolk, Virginia
Source: www.southwest.com
In 2001, Kelleher stepped down as the CEO and President of Southwest. He was succeeded by Jim Parker and Colleen Barrett. Jim Parker was chosen the vice chairman of the Board and CEO while Colleen Barrett was made the president, chief operating officer, and corporate secretary. Kelleher was now the chairman of the board and chairman of the executive committee of Southwest.
SHAPING SOUTHWEST’S ORGANIZATIONAL CULTURE
Operational Philosophy
Southwest’s objective was to provide safe, reliable and short duration air service at the lowest possible fare. With an average aircraft trip of roughly 400 miles, or a little over an hour in duration, the company had benchmarked its costs against ground transportation. Southwest focused on short-haul flying, which was expensive because planes spent more time on the ground relative to the time spent in the air, thus reducing aircraft productivity. Thus it was necessary for Southwest to have quick turnarounds4 of aircraft to minimize the time its aircraft spend on the ground. Southwest limited the turn time for each plane to ten minutes or less. It has managed to limit airplanes’ turn time to about 20-25 minutes over the years (Refer Table II.)
Table II
Aircraft Turnaround At Southwest
7:55 Ground crew chat around gate position
8:03:30 Ground crew alerted, move to their vehicles
8:04 Plane begins to pull into gate; crew moves towards gate
8:04:30 Plane stops; Jetway5 telescopes out; baggage door opens
8:06:30 Baggage unloaded; refueling and other servicing underway
8:07 Passengers off plane
8:08 Boarding call; baggage loading, refueling complete
8:10 Boarding complete; most of ground crew leaves
8:15 Jetway retracts
8:15:30 Pushback from gate
8:18 Pushback tractor disengages; plane leaves for runway.
Source: An industry approach to cases in strategic management, Pearce and Robinson
A quick turnaround strategy was more relevant to Southwest than to its competitors as it had a point-to-point flight between cities rather than a hub-and-spoke network6. A
4 Turning aircraft around as fast as possible to the gate to minimize the time that aircraft spend on the ground as ground time is non-revenue producing time for an airline.
5 A registered trademark for a certain kind of aircraft loading bridge, which allowed passengers direct access to an aircraft from the terminal.
176
Organizational Behavior
hub-and-spoke system was characterized by longer wait time for both passengers and airplanes, more planes, extra computer systems, extra salaries to ground staff and additional commissions to travel agents. In addition, the airlines had to pay rent for the gates, as the planes were kept idle at airports waiting for the connecting flights. Recognizing these disadvantages, Southwest persisted with its point-to-point flights between cities. However, according to industry sources, a hub generates up to 20% more revenue per plane than a comparable point-to-point flight. Airlines with point-to-point flights had to be extremely cost-effective. There are many ways of being cost-effective such as cheap labor and cheap equipment. But Southwest chose quicker turnaround of its aircrafts.
Southwest discovered different ways to speed the turnaround of its aircraft. It used only one type of aircraft - the Boeing 737. This ensured interchangeability of crews, furnishings and spare parts, and maintenance was more uniform. It also used less congested airports to avoid disrupting flight operations and to maximize aircraft time in the air. It also offered limited services: no in-flight meals - only beverages and snacks. This reduced cost and turnaround time.
LEADERSHIP
Southwest’s organizational culture was shaped by Kelleher’s leadership. Kelleher’s personality had a strong influence on the culture of Southwest, which epitomized his spontaneity, energy and competitiveness. Southwest’s culture had three themes: love, fun and efficiency. Kelleher treated all the employees as a “lovely and loving family”. Kelleher knew the names of most employees and insisted that they referred to him as Herb or Herbie. Kelleher’s personality charmed workers and they reciprocated with loyalty and dedication. Friendliness and familiarity also characterized the company’s relationships with its customers.
Southwest encouraged its workers to have fun while working. Flight attendants were allowed to wear baggy shorts and wild-print shirts. The philosophy behind this focus on fun was that if people were allowed to have good time, they would want to stay - whether they were employees or customers. Said Kelleher, “A lot of people think you’re not really serious about your business unless you act serious. At Southwest, we understand that it’s not necessary to be uptight in order to do something well. We call it ‘professionalism worn lightly’. Fun is a stimulant to people. They enjoy their work more and work productively.”
Southwest ran company contests simply for the fun of it and prizes included cash or travel passes. The contests typically included a Halloween costume contest, a Thanksgiving poem contest, or a design contest for the newsletter cover. According to company sources, all these created an unusual, enjoyable, yet highly productive, culture at Southwest.
Kelleher adopted the principle of “Management by fooling around” for Southwest. This included doing a rap video to promote the airline, and working hands-on with mechanics, baggage handlers and ticket agents. It also included his wearing jungle-print pajamas on business flights.
Every month Kelleher handed out “Winning Spirit” awards to employees selected by fellow employees for exemplary performance. Once an employee was awarded two free airline tickets for returning to a customer a lost purse which contained $800 and several credit cards. Such practices reaffirmed the values that Southwest placed on individuality among its workers at all levels of management.
6 A system for deploying aircraft that enables a carrier to increase service options at all airports covered by the system. It uses a strategically located airport (the hub) as a passenger exchange point for flights to and from outlying towns and cities (the spokes).

177
Southwest Airlines’ Organizational Culture
Kelleher had realized the importance of building confidence in his employees so as to
get things done faster. In his own words, “One of the ways you build confidence is
you give them room to take risks and the room to fail; and you do not condemn when
they do fail. You just say, that’s an educational experience, and we are going on from
here. And we have just spent a good bit on your education -- we hope to see you apply
it in the future.” Company sources stressed that Kelleher had never tried to single out
an employee for a mistake that had been inadvertently made. Kelleher also strove hard
to make Southwest’s employees understand the importance of ‘quickness’, a term he
preferred to ‘speed’. He explained that though quickness brought discomfort, “there
can be security in discomfort.”
Kelleher focused on employees when taking business decisions. He demonstrated his affection for his employees when he remarked: “I have said on at least a hundred occasions that I would rather be with the people of Southwest Airlines, no matter what the occasion, no matter when it is, than make a trip to Paris or do anything else in the world people think is of an exalted nature.”
Boeing’s former president and CEO, Phil Condit, described Kelleher’s role in perpetuating the Southwest culture, “If you go back to tribal behavior… one of the most critical people in any tribe was the shaman, the fundamental story teller. Keep in mind, their job was not one of historical accuracy. Instead their job was to tell stories that influenced and guided behavior. … I have watched Herb tell all the stories: … You see, stories are powerful because we remember them. I think Herb is Southwest’s shaman; he is the storyteller, and these stories get repeated and retold and they form the fabric of the Southwest culture.”
BUILDING RELATIONSHIPS
Since its inception, Southwest attempted to promote a close-knit, supportive and enduring family-like culture The company initiated various measures to foster intimacy and informality among employees. Southwest encouraged its people to conduct business in a loving manner. Employees were expected to care about people and act in ways that affirmed their dignity and worth. Instead of decorating the wall of its headquarters with paintings, the company hung photographs of its employees taking part at company events, news clippings, letters, articles and advertisements. Colleen Barrett sent cards to all employees on their birthdays.
Southwest chose to grow very conservatively, expanding only into one or two cities each year, so that it could devote the necessary time and attention to spread its unique culture in each new city. Southwest used in-house newsletters, videos, annual reports and cultural exchange meetings to diffuse its culture as the company grew big. Southwest instituted a mechanism called the Culture Committee in 1990 for the sole purpose of reinforcing the spirit of Southwest. This committee consisted of committed team leaders dedicated to communicating the airline’s mission, vision, values, norms and philosophies (Refer Exhibit II, III & IV.) It included members from each of the functions, including pilots, flight attendants, gate and ticketing agents and mechanics. etc. Members met at quarterly intervals at the headquarters with Colleen Barrett to brainstorm ideas for maintaining and strengthening Southwest’s culture. In addition to the Culture Committee at system-wide level, each station had its own Culture Committee and met every month to plan social and charitable events. Explained an operations agent, “Each station has its own Culture Committee. The station manager puts out a letter asking who wants to be on it. They organize fund-raisers and parties. We usually have a spring party, a summer party, a fall party, and a Christmas party. We raise money doing other things, so the parties are free, or may be $10 to get in.”
Southwest attempted in several ways to create a small company atmosphere. Meetings were typically action-oriented. Southwest communicated the importance of

178
Organizational Behavior
every single customer by educating employees about how many customers the company actually needed to make a profit. Southwest did not document plans in a long-winded manner. When Southwest submitted documentation less than an inch thick to the US Justice Department regarding the Morris Air7 acquisition, investigators were initially suspicious about the adequacy of the documentation. However, later on, they found everything in order. Southwest nurtured and supported its employees’ families and invited them to become a part of Southwest. Employees were encouraged to bring their children to work periodically and spouses were invited to attend significant company events.
Southwest attempted to empower its employees to work on new ideas. When Southwest employees came up with the idea of ticketless travel, they did not make a formal presentation to senior executives. They just went ahead with the implementation.
Southwest also laid great emphasis on integrity. Integrity at Southwest meant sticking to promises and actions. Southwest pilots entered into a 10-year long wage contract with the company because they probably believed in the integrity of persons on the other side of the negotiating table.
The Southwest management attempted to motivate employees by showing them how their individual contributions were linked to the major goals of the organization. They acknowledged people’s contributions during company celebrations, by publishing heroic feats in Luv Lines8 and by a simple ‘thank you’ that said, “What you did made a difference”. This appeared to help the company in improving its overall performance.
Behind the success of Southwest even at difficult times, has been the relationship of shared goals, shared knowledge and mutual respect among Southwest employees. The relationships were much stronger than those observed in other airlines in the US. In American Airlines, employees seemed to care for one thing and that was to avoid blame for failing to accomplish their tasks. This fear generated a sense of competing goals and not shared goals. At Southwest goals were shared between employees. Managers, supervisors and frontline employees in each functional area felt that their primary goals were safety, on-time performance and satisfying the customer. These goals were shared and employees from each functional area referred to the same goals and explained why they were important. Commented a Southwest customer service supervisor, “The main thing is that everybody cares. We work in so many different areas but it doesn’t matter. It’s true from the top to the last one hired …. Sometimes my friends ask me, why do you like to work at Southwest? I feel like a dork, but it’s because everybody cares.”
There were also differences in the degree of shared knowledge between Southwest employees and employees of other airlines. Interviews conducted with the frontline employees of American Airlines revealed that they had little awareness of the overall work process and had a tendency to understand their own piece of the process rather than the whole process. On the contrary, Southwest employees revealed that they understood the overall work process and the links between their own jobs and the jobs performed by their counterparts in other functions. Commented one pilot, “Everyone knows exactly what to do. Each part has a great relationship with the rest….There are no great secrets….Each part is just as important as the rest….Everyone knows what everyone else is doing.”
7 Southwest acquired Salt Lake City based Morris Air Corporation on December 31, 1993. After this acquisition, Southwest expanded its operation to Seattle, Portland, Spokane and Boise, cities in the northeast.
8 Newsletter of Southwest

179
Southwest Airlines’ Organizational Culture
At Southwest, employees treated each other with a great deal of respect unlike in other
airlines where status boundaries posed an obstacle to coordination. At American
Airlines, the relationships between the pilots and other functions were particularly
problematic. Commented a station manager of American airlines, “Ramp workers
have a tremendous inferiority complex. They think everyone is looking down on
them. The pilots don’t respect them.” At Southwest, employees spoke respectfully of
their colleagues in other functions and interacted comfortably with them, irrespective
of whether the person’s job was to clean toilets or fly the plane.
Contrary to popular belief, Southwest was the most highly unionized airline in the US
airline industry (Refer Exhibit V.) In spite of being highly unionized, Southwest
experienced little labor conflict when compared to its competitors (Refer Exhibit VI.)
This was because Southwest emphasized the importance of labor-management
partnerships. The respect shown by Southwest managers for employees and their
elected representatives reinforced the trust of frontline employees for the company
and their identification with the company’s goals. In its thirty-one year history,
Southwest has had only one strike. Analysts felt that respectful relationships between
management and frontline employee unions have helped in realizing respectful
relationships throughout Southwest.
THRIVING UNDER PRESSURE
Post-September 11, 2001, when most airlines in the US went in for massive layoffs,
Southwest avoided laying off any employee (Refer Exhibit VII.) Even before the
September 11 crisis hit, Kelleher had explained his philosophy regarding layoffs in an
interview to Fortune magazine. He said, “Nothing kills your company’s culture like
layoffs. Nobody has ever been furloughed [at Southwest], and that is unprecedented in
the airline industry. It’s been a huge strength of ours. It’s certainly helped us negotiate
our union contracts. One of the union leaders….came in to negotiate one time, and he
said, “We know we don’t need to talk with you about job security.” We could have
furloughed at various times and been more profitable, but I always thought that was
shortsighted. You want to show your people that you value them and you’re not going
to hurt them just to get a little more money in the short term. Not furloughing people
breeds loyalty. It breeds a sense of security. It breeds a sense of trust. So in bad times
you take care of them, and in good times they’re thinking, perhaps, “We’ve never lost
our jobs. That’s a pretty good reason to stick around.”
Analysts felt Southwest’s philosophy regarding layoffs is not a popular one in the US
business environment. Commented Business Week, “Such words would likely make
famous job-slashers like Jack Welch cringe. But Southwest is a member of a tiny
fraternity of contrarian companies that refuse, at least for now, to lay off….In the
aftermath of a national tragedy that economists say makes a recession and thousands
of additional job cuts inevitable, their stance seems almost noble -- an old-fashioned
antidote to the ‘make-the-numbers-or-else’ ethos pervading Corporate America.”
Business Week also pointed out the benefits of a no-layoff approach such as fierce
loyalty, higher productivity and the innovation needed to enable them to snap back
once the economy recovered.
Southwest’s decision to avoid layoffs was made possible because of its ability to
sustain short-term losses. The company had a long-standing policy of maintaining low
debt levels and relatively high levels of cash-on-hand. According to company
officials, the company managed in good times as though they were in bad times -- one
of Southwest’s corporate philosophies (Refer Exhibit IV.)

180
Organizational Behavior
REPLICATING THE SOUTHWEST MODEL
Southwest was the only airline to remain profitable in every quarter since the
September 11 attack. (Refer Exhibit VIII for financial position of Southwest.)
Although its stock price dropped 25% since September 11, it was still worth more
than all the other big airlines combined. Its balance sheet looked strong with a 43%
debt-to-equity ratio and it had a cash of $1.8 billion with an additional $575 million in
untapped credit lines. The company left no stone unturned to boost employee loyalty
and morale. When the federal government offered cash grants to boost the industry
after the September 11 attacks, the management included this money in the company’s
profit-sharing formula for employees. At a time when other airlines were talking of
sacrifice, Southwest was offering raises and stock options to its employees.
Analysts feel that replicating the Southwest model would be difficult as the Southwest
model involved more than a particular product market strategy. For Southwest, taking
care of business literally meant taking care of relationships and it formed the bedrock
of its competitive advantage. The quality of relationships was not just a success factor
but the most essential success factor. Southwest believed that to develop the company,
it had to constantly invest in relationships. What remains to be seen is whether the
quality of relationships is enough to carry Southwest through the challenges that lie
ahead as analysts feel that “at some point, Southwest is going to be faced with much
more aggressive and more cost-competitive rivals.”
Questions for Discussion:
1. What is the basic mission and philosophy at Southwest? How far have they influenced the culture at Southwest? What are the major components of Southwest’s culture and their implications for the organization?
2. Leadership has an influence in shaping the culture of an organization. Explain the role played by Kelleher’s leadership in shaping the culture at Southwest. Do you think the change in leadership will affect the company’s culture?
3. Organizational culture has a profound influence on the survival and success of an organization. Do you think that the organizational culture at Southwest airlines influenced its unique success in a volatile industry with many cases of corporate failures?
4. Southwest struck to a policy of no-layoff at a time when the rest of the US airlines industry saw it as a necessary evil to respond to the crisis after the September 11 terrorist attack. Why did Southwest avoid laying off employees when the rest of the industry was doing so? Do you think Southwest has benefited from such a policy?
© ICFAI Center for Management Research. All rights reserved.

181
Southwest Airlines’ Organizational Culture
Exhibit I Market Capitalization of Southwest
Relative to Airline Industry*
*Market capitalization (value of a total outstanding stock) as closing on Sept.23, 2002.
Source: Jody Hoffer Gittell, The Southwest Airlines Way, McGraw-Hill, 2003
Exhibit II
Mission Statement
Source: www.southwest.com
Exhibit III
Principle Values
Source: Nuts! Southwest Airlines’ Crazy Recipe for Business and Personal Success, Brad Press Inc.1996.
“Southwest Airlines is dedicated to the highest quality of Customer Service delivered with a sense of warmth, friendliness, individual pride and company spirit”.
“We are committed to provide our employees a stable work environment with equal opportunity for learning and personal growth. Creativity and innovation are encouraged for improving the effectiveness of Southwest Airlines. Above all, employees will be provided the same concern, respect, and caring attitude within the organization that they are expected to share externally with every Southwest customer.”
Unlike many companies, Southwest had not formally documented its principal values. The authors of the book “Nuts! Southwest Airlines’ Crazy Recipe for Business and Personal Success,” however, had identified certain principles, which Southwest consistently tried to instill in the employees. These principles included:
Profitability Ownership Low cost Legendary service Family Egalitarianism Fun Common Sense/Good Judgment Love Simplicity Hard-work Altruism Individuality

182
Organizational Behavior
Exhibit IV
Corporate Philosophy
Source: Nuts! Southwest Airlines’ Crazy Recipe for Business and Personal Success, Brad Press Inc.1996
Exhibit V
Percentage of Employees Represented by Unions in U.S. Major.Airlines
Source: Jody Hoffer Gittell, The Southwest Airlines Way, McGraw-Hill, 2003
Southwest’s corporate philosophy tried to promote a positive attitude among employees. Some of the values, which the management tried to encourage, included:
Employees are #1. The way you treat your employees is the way they will treat your customers.
Think small to grow big.
Manage in the good times for the bad times.
Irreverence is okay.
It’s okay to be yourself.
Have fun at work.
Take the competition seriously, but not yourself.
It's difficult to change someone's attitude, so hire for attitude and train for skill.
Think of the company as a service organization that happens to be in the airline business
Do whatever it takes.
Always practice the Golden Rule (serve others rather than being served), internally and externally.

183
Southwest Airlines’ Organizational Culture
Exhibit VI
Labor Conflict Index*
*Number of strikes, arbitrations, mediations, and releases since 1985
Source: Jody Hoffer Gittell, The Southwest Airlines Way, McGraw-Hill, 2003
Exhibit VII
Employee Layoffs after September 11, 2001*
*Data obtained from layoffs reported in press after September 11, divided by year-end employment for 2000 as reported by Bureau of Transportation Statistics)
Source: Jody Hoffer Gittell, The Southwest Airlines Way, McGraw-Hill, 2003

184
Organizational Behavior
Exhibit VIII
Southwest Airlines
Financials
INCOME STATEMENT Dec-02 Dec-01 Dec-00 Dec-99
Net Sales 5,521.77 5,586.17 5,649.46 4,735.59
Cost of Goods Sold 3,684.81 3,667.23 1,683.69 2,884.47
Operating Inc 417.34 594.22 1,021.15 781.48
Pretax Income 392.68 827.66 1,017.36 773.61
Net Income 240.97 511.15 625.22 474.38
BALANCE SHEET Dec-02 Dec-01 Dec-00 Dec-99
Assets
Total Current Assets 2,231.96 2,520.22 831.54 631.01
Net PP&E 6,645.46 6,445.49 5,819.73 5,008.17
Total Assets 8,953.75 8,997.14 6,669.57 5,652.11
Liabilities and Shareholder’s Equity
Short-Term Debt 130.45 514.57 108.75 7.87
Total Current Liabilities 1,433.83 2,239.19 1,298.40 960.47
Long-Term Debt 1,552.78 1,327.16 760.99 871.72
Total Liabilities 4,532.13 4,983.09 3,218.25 2,816.33
Total Common Equity 4,421.62 4,014.05 3,451.32 2,835.79
CASH FLOW STATEMENT Dec-02 Dec-01 Dec-00 Dec-99
Net Cash Flow from Operations 520.01 1,484.61 1,298.29 1,001.71
Net Cash Flows from Investing 603.06 997.84 1,134.64 1,167.83
Net Cash Flows from Financing -381.66 1,270.10 -59.47 206.43
Key Ratios
P/E 40.23
Earnings Per Share (EPS) 0.30
Dividends Per Share (DPS) 0.02
Dividend Yield 0.15
Quick Ratio 1.39
Current Ratio 1.56
Return on Equity (ROE) Per Share 5.73
Return on Assets (ROA) 3.33
Return on Invested Capital (ROIC) 5.12
In millions of USD
Source:www.southwest.com
185
Southwest Airlines’ Organizational Culture
Additional Readings & References:
1. Southwest Airlines: Flying high with ‘Uncle Herb’, Business Week, July 3, 1989.
2. Where services flies right, Fortune, August 24, 1992
3. Southwest’s love fest at Love Field, Business Week, April 28,1997
4. No Love lost at love field, Business Week, December 1, 1997.
5. Southwest’s new direction, Business Week, February 22,1999.
6. Airlines may be flying in the face of reality, Business Week, February 22, 1999.
7. An unlikely battle brews for Southwest, American, Chicago Tribune, February 25, 1999.
8. From Texas, with love and peanuts, New York Times, March 14, 1999.
9. Continental, TWA top airline survey, Associated Press, May 11, 1999.
10. Southwest Airlines’ route to success, Financial Times, May 13, 1999.
11. The Chairman of the Board Looks Back, Fortune, May 28, 2001.
12. Where Layoffs Are a Last Resort, Business Week, October 8, 2001.
13. Holding Steady, Business Week, February 3, 2003.
14. www.southwest.com`

Leadership - The Right Approach
CASELET 1
Rahul Mehra (Mehra) was annoyed that the week had begun badly. It was Monday morning and it was time for him to provide his manager, Ashish Gupta (Gupta), with a detailed report on achievement of his weekly targets. Unfortunately, the preceding week too, had been a dull one with not even fifty percent of the targets being met.
Mehra worked as a sales representative for the personal loans division of a leading private bank. He had to meet weekly targets to become eligible for the special sales incentives, the only lucrative monetary benefit offered by the company. The bank set the targets for each sales representative in terms of the number of new customers and the total value of sales to be achieved.
Gupta was a manager who liked to be in total control of any situation. His micromanaging tendency made him exercise total control over his subordinates in all organizational aspects. (A micromanager is one who does not trust his subordinates and who closely monitors them on the job.) He thought of himself as being very knowledgeable and did not feel he had to seek suggestions from his team members. He believed in issuing instructions to his subordinates and expected them to follow the instructions without questioning. He kept an eye on the performance of his 12-member team of sales representatives throughout the twelve-odd hours they spent in office. He expected his team members to keep him informed about their progress on any target on an hourly basis even when they were on the field. The team was responsible for obtaining leads (prospective customers) and eventually converting them into customers. The targets, in terms of the volumes and value of loans, were so high that achieving them seemed a difficult task.
Mehra went into Gupta’s room only to be given a strong warning that if the achievement of targets for the week ahead was also below expectations, it would cost him his job. Most of Mehra’s colleagues too had a similar experience to narrate after they had submitted their weekly report. To make matters worse, Gupta called for an emergency meeting of sales representatives, and announced that all teams must follow a systematic procedure to gather data, make cold calls to potential customers from the leads obtained and then close the deal. No one was permitted to deviate from this style of working. The team was thus forced to follow a traditional way of marketing, which included calling up prospective customers and following up until the deal was finalized. They were not allowed to try out new and innovative ways of marketing their services. The team members were expected to report to Gupta about their performance on a daily basis, unlike the weekly reporting that was followed previously.
The week that followed, was one in which team members struggled under tremendous pressure. Ultimately, they were unable to meet even the weekly targets. This made Gupta even more frustrated and he again called for a meeting. But what took place at the meeting left him in a state of shock, helplessness and despair. Mehra, along with three others, among the best performers in the organization, quit the organization.
Questions for Discussion:
1. Describe the leadership style that was followed by Ashish Gupta. Also discuss the
effects of such leadership on an organization.
2. Outline the concept of micromanagement and bring out its impact on employee behavior in the context of the case.

187
Leadership – The Right Approach
CASELET 2
Indigo Software (Indigo), set up in Hyderabad in the early 1970s, with an initial strength of 150, grew to become the country’s leading software development firm in the year 2000, with around 18,000 employees on its rolls. The company’s success can be attributed to the values upheld by its founders. Indigo’s founders believed that to retain its place in the dynamic business environment, the company had to develop leaders of high quality who kept the global perspective in mind while working in the organization. With this as its aim, the company established the Leadership Learning Institute (LLI) to nurture leadership qualities among its employees across the globe.
The vision of Indigo’s founders was to make it big in the global business arena and to transform the company from being just a software developing firm to one providing consultancy services to organizations to help them meet their strategic goals. Indigo used its leadership center to direct itself in a planned and controlled manner to achieve this objective. The center was used as an avenue to spread knowledge and corporate values throughout the company.
During its initial years, the organization was small enough to make it possible for its founder, Janardhan Rao, to personally interact with his employees. This allowed the employees to observe and emulate the leadership qualities of their employer. However, with an increase in the number of employees, it became difficult for the chief to address his workforce personally. Therefore, the company set up a leadership development center with the aim of developing leadership qualities among the organizational members.
At the center, employees from various operational centers of the company spread across the globe and of different nationalities were imparted training in leadership qualities. They were divided into groups of 400, each group being periodically sent to workshops, where leadership training was imparted to them over four weeks. The workshops revolved around the objective of developing timeless leadership principles that would help the company withstand the tough competition outside and other contingencies. Members of the workshop were also trained in effective decision making. Once they successfully completed their training, these employees were given opportunities to hone their leadership skills in the organization and transfer their knowledge to other organizational members.
With the establishment of the LLI, Indigo attempted to develop leadership from within and address business risks through succession planning, keeping a holistic outlook in mind.
Questions for Discussion:
1. “Modern organizations are developing robust leadership development systems to identify leaders within the organization and hone their skills to be more effective in such roles.” Describe the various skills that are necessary to be an effective leader.
2. Indigo’s founders believed that if the company had to survive in the dynamic business environment, it would have to develop leaders of high quality from within the organization, who had a global perspective. Can leadership be taught in leadership development centers or is it an in-born trait in individuals?
© ICFAI Center for Management Research. All rights reserved.

The Right Way to be an Effective Leader
CASELET 1
Mumbai-based Arkay Supplies Ltd. (Arkay) manufactured office equipment. The CEO of the company, Robert Franco (Franco), believed in employee empowerment and participation. He entrusted his immediate managers with a lot of responsibility. The head of procurement division, Rajiv Gulati (Gulati), enjoyed full autonomy. Gulati could finalize purchase deals amounting to Rs 90 crore without consulting Franco. The marketing manager, N. Shivamani, could design and launch an expensive promotional campaign and then make it known to Franco. Franco did not reprimand the manager if the campaign failed to generate the desired response from customers. But he would not tolerate it if the manager repeated the same mistake again. He wanted his managers to analyze the reasons for failure and take steps not to repeat them in future. He expected his managers also to empower their subordinates, allow them to take risks and develop their leadership skills.
Ravi Raj (Raj) was a procurement manager in the division headed by Gulati. Raj reported to Gulati. Under Raj, there were three subordinates designated as purchase executives who assisted him in his work. When the vendors submitted their tenders, the purchase executives scrutinized the proposals, selected the top 10 proposals and forwarded them to Raj. Raj studied the proposals, selected the best of them and then sent his purchase executives to the vendor’s site to examine the quality of the raw material. The executives personally examined the quality of the raw material, and brought some samples back to their firm for examination. The quality control department at Arkay tested the samples and determined the quality of raw material supplied by the vendors. On the basis of the reports from the quality control department, Raj selected the best vendor(s) and explained to Gulati why he chose those vendors. If Gulati was not satisfied with the explanation, he obtained proposals from other vendors and examined them as well. But if he was satisfied with Raj’s explanation, he called the vendors concerned and negotiated on price, the date of delivery, amount and quality of material to be supplied, with them. Gulati ensured that everyone in his department completed their work and did it perfectly before they left for the day unless there was a valid reason for the employee to leave the work pending. If Raj or his subordinates did not understand what they were expected to do, Gulati explained it to them patiently. They could walk in any time and get their doubts cleared if they had any.
Gulati never allowed Raj to negotiate with vendors to finalize the price. If, for some reason, Gulati was not free on the given date, he asked the vendors to postpone the date for negotiation. Otherwise he asked Raj to consult him throughout the negotiation and not to finalize the agreement until he came and read all the clauses. Gulati never asked Raj to participate in the negotiations he held with the vendors. Raj also did not insist on participating because the negotiations lasted till late in the night and Raj was glad that boss did not ask him to stay during the negotiations, so that he was free to leave for home. The final documents of the contract were typed by a clerk the next day and formally signed by Gulati and the vendors. Franco praised Gulati for striking the best deals.
However, in the marketing division, it was a different story altogether. The marketing manager, Shivamani, set sales targets for the marketing executives. Most of the executives complained that the targets he set were very high and difficult to achieve. But Shivamani never agreed to lower the targets once they were established. Many executives complained that Shivamani expected high level of performance from them but never offered them the support required. If Shivamani observed that any executive did not achieve at least 80% of the sales target by the date he gave them, he punished

189
The Right Way to be an Effective Leader
the marketing executive by denying him leave, preventing him from claiming reimbursement for expenses incurred by refusing to sign his form, and so on. Many executives who could not stand Shivamani’s highhanded behavior left the organization.
Questions for Discussion:
1. Do you think Gulati should assign greater responsibility to Raj or allow Raj to continue to work to the extent he does at present?
2. Compare and contrast the leadership styles of Gulati and Shivamani using a leadership grid.
CASELET 2
Zet Manufacturers (Zet) manufactured iron and steel rods used for construction. The general manager, K. Giridhar Prasad (Prasad), was unhappy with his management team. The managers were not able to fulfill the responsibilities given to them properly. Prasad hired a renowned HR consultant in the city, Sudheer Sharma (Sharma) to counsel and conduct development programs for the managers.
Sharma visited the firm and held one-to-one meetings with the managers. These meetings revealed something interesting – the actual reason for the poor performance of the managers was Prasad himself. The managers did not like Prasad’s style of management. Prasad was always keen on self-promotion in his meetings with superiors and subordinates. He lacked respect for other people. He would point out even a small mistake committed by a manager and criticize him a lot in the presence of other managers. He imposed a high degree of control over his managers. He always pressurized managers to do whatever task he gave them, on priority. Moreover, he changed priorities frequently. Sometimes, Prasad assigned the same task to different managers. Managers believed that this was because Prasad did not have faith in their abilities.
However, they respected Prasad for his intellectual capabilities. Prasad was a very good speaker and articulated things in a way that quickly convinced listeners. He was a visionary and encouraged change. He welcomed new ideas and thoughts. He could analyze large volumes of data in a short period of time and took decisions quickly. As a result, he wound up meetings so quickly that managers could not contribute much. If he decided to implement a new process or system in the organization, he worked hard till he achieved it by solving all the problems that came in the way of its implementation.
Prasad always boasted of his own achievements and those of his management team. He sent wrong reports to the head office stating that many projects were completed before they were actually completed. The head office, therefore, assigned more work to Prasad’s office, overburdening the managers. The managers were frustrated and wanted to complain about Prasad’s behavior to the Vice President of the company. Some managers tried to cope with the problem by keeping aside the tasks assigned by Prasad intermittently, unless they were really urgent. Each manager had 30-50 tasks pending with him. Last minute rush and errors were therefore common in the organization.
When Sharma spoke to the managers and observed the work practices in the firm, he found that the organization lacked proper planning, and the management focused on solving problems, rather than preventing problems. Also, there was lack of coordination among the various organizational processes. When Sharma presented the

190
Organizational Behavior
results of his findings to Prasad, Prasad was surprised to know that he was responsible for the demotivation of his managers. Prasad wondered how was it that the managers had such a huge number of pending projects. He went to one of the managers and examined the pending list. After seeing the projects on the list, he told Sharma that some of them were just ideas which had come to his mind, which he had conveyed to his managers. He did not want the managers to take them up as projects. However, Prasad told Sharma that he wanted to change his behavior and improve his leadership style so that the problems would not recur in the future.
Questions for Discussion:
1. If you were the HR consultant Sharma, what suggestions would you make to Prasad to improve his leadership style?
2. Last-minute rush and errors were common in Zet. Who was responsible for the problems – the managers, Prasad or the system?
© ICFAI Center for Management Research. All rights reserved.

GE and Jack Welch
”If leadership is an art, then surely Welch has proved himself a master painter.”
- Business Week, May 28, 1998
“The two greatest corporate leaders of this century are Alfred Sloan of General
Motors and jack Welch of GE. And Welch would be the greater of the two because he set a new, contemporary paradigm for the corporation that is the model of the 21st
Century.”
- Noel Tichy, Professor of Management, University of Michigan, and a longtime GE observer.
INTRODUCTION
On September 6, 2001, John Francis Welch Jr. (Jack Welch), Chairman and Chief Executive Officer of General Electric Co. (GE)1, retired after spending 41 years with GE. During the period, he made GE the most valuable company in the world. Analysts felt that, with his innovative, breakthrough leadership style as CEO, Jack Welch transformed GE into a highly productive and efficient company.
During Jack Welch’s two decades as CEO, GE had grown from a US$13 billion manufacturer of light bulbs and appliances in 1981, into a US$480 billion industrial conglomerate by 2000. Analysts felt that Jack Welch had become a ‘deal-making’ machine, supervising 993 acquisitions worth US$13 billion and selling 408 businesses for a total of about US$10.6 billion.
Jack Welch was infact described as ‘the most important and influential business leaders of the 20th Century’ by some Wall Street analysts and academics alike. Management experts felt that Jack Welch’s reputation as a leader could be attributed to four key qualities: he was an intuitive strategist; he was willing to change the rules if necessary; he was highly competitive; and he was a great communicator.
THE MAKING OF A CEO
Jack Welch graduated in chemistry from the University of Massachusetts and in 1959 got a Ph.D in chemical engineering from the University of Illinois. In 1960, he started his career at GE as a Junior Engineer. However, in 1961, Jack Welch decided to quit the US$10,500 job as he was unhappy with the company’s bureaucracy. He was offended that he was given a raise of only US$1000, the same amount given to all his colleagues. He had even accepted a job offer from International Minerals and Chemicals in Skokie, Ill.
However, Reuben Gutoff, an executive at GE convinced Jack Welch to stay back. Reuben Gutoff promised that he would prevent him from getting entangled in GE red tape and would create a small-company environment with big-company resources for him. This theme of ‘small-company environment’ with ‘big-company resources’ came to dominate Jack Welch’s own thinking as the leader of GE.
1 Thomas A Edison established Edison Electric Light Company in 1878. General Electric was created in 1892, after the merger of Edison General Electric Company and Thomson-Houston Electric Company. By 2000, GE became a diversified technology and manufacturing company with about 313,000 employees, with revenues of US$129.9 bn. Some of the business divisions of the company include Aircraft Engines, Appliances, Aviation Services, Commercial Equipment Financing, Commercial Finance, Employers Reinsurance Corporation, GE Equity, GE Financial Assurance, GE Consumer Finance, Industrial Systems, Lighting, Medical Systems, Mortgage Insurance Corp., Plastics, Power Systems, Real Estate etc.

192
Organizational Behavior
Jack Welch quickly rose to become the head of the plastics division in 1968. He became a group executive for the US$1.5 billion components and materials group in 1973. This included plastics and GE Medical Systems.
In 1981, Jack Welch became GE’s youngest CEO ever (Refer Exhibits I & II). His
predecessor, Reg Jones said, “We need entrepreneurs who are willing to take well-
considered business risks – and at the same time know how to work in harmony with a
larger business entity…The intellectual requirements are light-years beyond the
requirements of less complex organizations.”
THE WELCH ERA AT GE: 1981-2001
During the first five years as CEO, Jack Welch emphasized that GE should be No.1 or
No.2 in all businesses or get out of them. He disposed off the businesses with low-
growth prospects, like TVs and toaster ovens. He expanded the financial-service
provider GE Capital into a powerhouse. He also entered the broadcasting industry
with the acquisition of RCA Corp., the owner of NBC TV network.
At the same time, he shed more than 100,000 jobs – a fourth of GE’s work force –
through mass layoffs. Tens of thousands of other high paying manufacturing jobs
were moved to cheaper, union-free locations overseas. Following this, Jack Welch
was nick named ‘Neutron Jack’ after the nuclear weapon that killed people but left
buildings largely intact. The number of employees at GE dropped from 402,000 at the
end of 1980 to as low as 220,000 in mid-1990s. Jack Welch felt that making GE a
leaner company was necessary to ensure healthy profits in the wake of high inflation
and stiff Japanese competition. By 2000, the number of employees went up to
314,000, mostly as a result of acquisitions.
Analysts felt that GE under Jack Welch had performed very well (Refer Exhibits III
and IV). The company’s 2000 earnings of US$12.7 billion were 8 times more than the
profit it reported in 1980 (US$1.5 billion). By 2000, its shares had risen about 5,096%
(inclusive of dividends) or about 21.3% p.a. from the day Jack Welch took over.
Analysts felt that where most top executives lost their effectiveness in 10 years or less,
Jack Welch was an exception, staying on the job and driving GE to elevated levels of
accomplishment for 20 years. Like the seasons in the year, there were rhythms and
rituals to how Jack Welch managed GE. Besides his monthly teaching sessions at the
Crotonville2 academy, Jack Welch clearly laid out his monthly programs (Refer
Exhibit V).
However, analysts felt that the Welch Era was not without flaws. GE had suffered
major setbacks, in the form of criminal indictments relating to military contracts and
battles with environmental groups. GE was blamed for the Poly-Chlorinated
Biphenyls (PCB)3 contamination in the Hudson River. In early 2001, the U.S.
Environmental Protection Agency endorsed a $460 million dredging plan to clean the
river.
Analysts also observed that Jack Welch relied too much on GE Capital, the financial
services division for GE’s growth. However, by 2000, the division had accounted for
half of the company’s profits. Others pointed out that GE did not encourage women
and minorities to take up top managerial positions. According to a few, Jack Welch’s
2 GE’s Management Development Centre. 3 In mid-1970s, GE contaminated the Hudson river by dumping PCBs and other pollutants.
PCBs and the pollutants caused Cancer. In 1977, PCBs were banned worldwide.

193
GE and Jack Welch
biggest shortcoming was his handling of growing political and social pressures, as
evidenced by the European Union’s veto of the proposed GE-Honeywell4 merger and
the Bush Administration’s order GE to clean up the Hudson River at a cost of US$460
million.
JACK WELCH’S LEADERSHIP STYLE
Analysts felt that Jack Welch’s profound grasp on GE stemmed from knowing the company and those who worked for it. More than half of his time was devoted to “people issues”. Most importantly, he had created something unique at a big company – Informality. The hierarchy that Jack Welch inherited with 29 layers of management was completely changed during his tenure. Everyone, from secretaries, to chauffeurs to factory workers, called him ‘Jack’. Everyone could expect – at one time or another – to see him. Analysts felt that Jack Welch gave employees a sense that he knew them. Commenting on the informality at GE, Jack Welch said, “The story about GE that hasn’t been told is the value of an informal place. I think it’s a big thought. I don’t think people have ever figured out that being informal is a big deal.”
Making the company “informal” meant violating the chain of command, and communicating across layers. Analysts felt that it had to do with Jack Welch’s charisma and the way he used company’s meetings and review sessions to great advantage. When he became the CEO, Jack Welch inherited a series of obligatory corporate events, which he had transformed into meaningful levels of leadership. There were meetings in early January with GE’s top 500 executives in Boca Ration, Fla., and monthly teaching sessions at Crotonville. These meetings allowed Jack Welch to set and change the corporation’s agenda, to challenge and test strategies and people. They also helped him to make his presence and opinion known to all.
Analysts felt that Jack Welch knew the value of surprise. Every week, he made unexpected visits to plants and offices. There were luncheons with managers several layers below him, and many handwritten notes. Said a marketing manager of industrial products, “We’re pebbles in an ocean, but he knows about us.”
In April every year, Jack Welch undertook an annual review of personnel of the executive level and above, called the Session C meetings. The meetings ran for 20 days. This process started every February when every employee filled a self-assessment review, which was later discussed with the review manager. The manager sent the assessment up the management chain. Jack Welch with his vice chairpersons and senior human resources personnel, met with the business leaders at their respective headquarters. Salaries were not discussed at these meetings. Only questions like – who is retiring? Who do you want to promote? Who should attend executive classes at Crotonville? – were discussed. At these meetings that Jack Welch and his senior colleagues devoted full attention to the human resources side of the business (Refer Box for purpose of Session C Meetings).
4 The proposed US$45 billion acquisition of Honeywell, Inc. announced in October 2000, fell through in July 2001 because of resistance from the European Commission. Honeywell, Inc. is mainly into the manufacture of aircraft engines. Other businesses of Honeywell include Electronic Control, Home & Building Control, Industrial Control, Performance Polymers and Chemicals, and Transportation and Power Systems.
Objectives of Session C Meetings
To review the effectiveness of the organization and any plans to change
To review and provide feedback on the performance, promotability, and developmental needs of the top management
To review plans and suggestions for backup planning for key management jobs
Early identification of high-potential talent to ensure appropriate development
To focus special attention on key corporate or business messages

194
Organizational Behavior
Analysts felt that one of the best ingredients of GE’s people issues was the reward system. Jack Welch made sure that the best business leaders were rewarded properly. To identify the best, Jack Welch relied on the Vitality chart (Refer Figure I). Using the chart, the employees were sorted as As, Bs, and Cs. The chart was used by senior GE executives during Session C process to make sure that GE’ s best performing employees were being rewarded and recognized. In some cases, the reward was a stock option. In his early days as the CEO, GE had granted stock options to only 200 employees. Eventually Jack Welch made a point of spreading those options throughout large segments of the company – including thousands of employees. By March 1999, the figure rose to 27,000.
Jack Welch had actually become a ‘teacher’ within GE. At Crotonville, Jack Welch led more than 250 class sessions and trained more than 15,000 GE managers and executives. He went to the academy every two weeks, for 17 years to interact with new employees, middle managers, and senior managers. Each session at the academy lasted for about four hours. Jack Welch asked questions and then challenged the employees to answer.
However, Jack Welch realized that his message was not getting across to the entire company and he was not as convincing as he hoped to be. He said, “I was intellectualizing the issues with a couple of hundred people at the top of the company, but clearly I wasn’t reaching hundreds of thousands of people.”5 To reach those people, Jack Welch initiated a powerful-in-house communication system. After Jack Welch gave a leadership speech at GE’s January management meeting, the next day, 750 video copies of the speech were dispatched to GE locations around the world. The tapes were prepared in eight different languages.
5 ‘Welch, An American Icon’ by Janet Lowe.
RoleModels
StrongPerformers
HighlyValued
Border Line
Least Effective
GE Performance Ranking
100% 100% 50-60% None NoneStockOptions
Figure I The Vitality Chart
Source: ‘The GE WayFieldbook’ by Robert Slater

195
GE and Jack Welch
Jack Welch identified four qualities of leadership, all starting with letter E, and named it E4. (Refer Box) He connected the four E’s with one P – Passion. According to him, it was the passion that separated the A’s from B’s. The B’s were very important to the company and were encouraged to search every day for what they were missing to become A’s.
Key GE Leadership Ingredients
‘E4’
Energy Enormous Personal Energy – Strong Bias for Action
Energizer Ability to Motivate and Energize Others…
Infectious Enthusiasm to Maximize Organization Potential
Edge Competitive Spirit…Instinctive Drive for
Speed/Impact…Strong
Convictions and Courageous Advocacy
Execution Deliver Results
Source: “The GE Way Fieldbook”, by Robert Slater
JACK WELCH – THE STRATEGIST
Analysts felt that Jack Welch was focused and analytical. He restructured GE’s portfolio from 350 businesses during 1980s down to two-dozen core activities by late 1990s. During his initial years as CEO, he either expanded internally or made acquisitions to position all GE’s businesses as either number one or number two in their fields. The planned acquisition of Honeywell, Inc., which didn’t materialize, was expected to redefine GE for the years to come.
GE under Jack Welch transformed Six Sigma6, which was originally intended to serve as a quality control for manufacturing, to focus on virtually all service-related transactions. GE learned and developed the complex Six Sigma program through internal and external benchmarking research. Jack Welch said, “The methodologies of Six Sigma were learned from other companies, but the cultural obsessiveness and all-encompassing passion for it is pure GE.” The Six Sigma program increased the company’s operating profit margins from 13.6% in 1995 to 16.7 % in the third quarter of 1999.
Jack Welch attributed three factors to the success of Six Sigma at GE: aligning employee benefits and promotions with Six Sigma programs; demanding high degree of senior management support to define objectives and facilitate implementation; and working to demonstrate the impact of Six Sigma initiatives to customers. The employees engaged in the Six Sigma discipline were categorized as Green Belts and Black Belt champions. No employee was considered for a management position unless they had some Green Belt training and completed at least one Six Sigma program. GE took a top-down approach to ensure that the best employees became Black Belts. Jack Welch personally supervised the progress that business units made in their Six Sigma programs. Furthermore, Black Belts and Master Black Belts had a high degree of visibility to the company’s senior management team and were responsible for mentoring and coaching Green Belts. GE reinforced the importance of the Six Sigma program by linking it with managerial compensation. About 40 percent of each GE executive’s bonus was linked to Six Sigma implementation, which applied to the top 7,000 executives.
6 The ‘Six Sigma’ was a sophisticated quality program created by Motorola in the 1980s and was adopted by GE in 1997. By 2001, the process was perfected by GE. Six Sigma was a highly involved measurement device of production defects per one million operations.

196
Organizational Behavior
Source: www.ge.com, Annual Report 1994
Analysts felt that Jack Welch was the primary driver of the Six Sigma program at GE. He constantly defined and adjusted the specific objectives for the program. He spoke frequently to the organization regarding the program’s development and continually emphasized its value during conferences, meetings and through publications such as annual reports. Almost every GE division leader combined the Six Sigma methodology with company culture and goals. Each division implemented Six Sigma with project teams overseen by senior management. Analysts felt that the high level of senior management support was one of the vital factors in GE’s Six Sigma success.
Jack Welch was determined to turn the Six Sigma company vision “outside in” to make “the customer’s profitability the number one priority in any process improvement.” In 1998, GE Capital generated over US$300,000 million as net income from Six Sigma quality improvements. This division emphasized that customers needed to experience the productivity improvements the company had enjoyed. It was essential to understand the customer’s particular quality demands in order to determine what should be categorized as a ‘defect.’ Customer satisfaction and loyalty were vital elements of the Six Sigma program at GE at all levels. Technical support was also an important aspect of Six Sigma implementation. Customers had immediate access to GE’s vast resources and technical expertise at all times.
Jack Welch’s vision of ‘the boundaryless corporation’ was to make GE into a company without bureaucracy, where people were curious, open, cooperative and always breaking down barriers. Jack Welch said, “It's how open you are about information, how open you are to ideas from other companies…You'll see charts in GE on the 'Wal-Mart Method' or the 'Lopez Three-Step' process (from former General Motors purchasing chief J. Ignacio Lopez de Arriortua). You are not a hero at GE for being a Lone Ranger with only your own ideas.” GE adopted many ideas and techniques from other companies. (Refer Box).
Ideas and Techniques Adopted by GE from Other Companies
1. American Standard, a customer of GE’s Motors and Industrial Systems business, had been using a technique called "Demand Flow Technology" to double and triple inventory turnover rates and move toward a goal of zero working capital. GE teams successfully adopted it and obtained dramatic results in the Power Systems, Plastics and Medical Systems divisions.
2. Yokogawa, GE’s partner in the Medical Systems business, had been using "Bullet Train Thinking" to take 30-50% out of product costs over a two-year period. This technique, which employed "out-of-the-box" thinking and cross-functional teams to remove obstacles to cost reduction, was fully operational in GE’s Aircraft Engines business.
3. Quick Market Intelligence - the weekly direct customer feedback technique, was originally learned from Wal-Mart and implemented with great success in GE’s Appliances business to improve asset turnover. “QMI” was adopted by GE Capital's Retailer Financial Services to drive the quality of customer service in its credit card operations.
4. Caterpillar reduced its service cost structure and new product introduction time through part standardization disciplines. The implementation of these disciplines was the key to the rapid new product introduction successes in GE’s Appliances and Power Systems businesses, where product introduction cycle times were cut by more than half.
5. From Toshiba GE learned “Half Movement” – half the parts, half the weight, in half the time -- and it was expected to become a key element of engineering design philosophy at each of GE’s businesses.

197
GE and Jack Welch
Jack Welch and other senior executives popularized the line “Best Practices has legitimized plagiarism,” at GE, where the study of other high-performing organizations was institutionalized. At GE, employees were encouraged to borrow and implant excellent ideas that were not trademarked, patented or proprietary.
Analysts felt that by 1995, boundaryless behavior, an awkward phrase in the past, was increasingly becoming a way of life at GE. Jack Welch said, “It has led to an obsession for finding a better way -- a better idea -- be its source a colleague, another GE business, or another company across the street or on the other side of the globe that will share its ideas and practices with us.”
Jack Welch felt that boundaryless behavior became the ‘right’ behavior at GE. He said, “…and aligned with this behavior is a rewards system that recognizes the adapter or implementer of an idea as much as its originator. Creating this open, sharing climate magnifies the enormous and unique advantage of a multi-business GE, as our wide diversity of service and industrial businesses exchange an endless stream of new ideas and best practices.”
To promote strategic thinking and planning at GE, Jack Welch required operations executives to prepare a few simple slides describing the essence of their business situations. Benchmarking helped them address questions about competitive dynamics:
What does your global competitive environment look like?
In the last three years, what have your competitors done?
In the same period, what have you done to them?
How might they attack you in the future?
What are your plans to leapfrog them?
When Jack Welch returned from a visit to Wal-Mart after studying the practices of the world's largest retailer, he communicated his experiences in his annual letter to shareholders in GE’s annual report: “In 1991, we shared best practices with a number of great companies. We learned something everywhere, but nowhere did we learn as much as at Wal-Mart. Sam Walton and his strong team are something very special. Many of our management teams spent time there observing the speed, the bias for action, the utter customer fixation that drives Wal-Mart; and despite our progress, we came back feeling a bit plodding and ponderous, a little envious, but, ultimately, fiercely determined that we're going to do whatever it takes to get that fast.”
Jack Welch felt that one of his important jobs was to transfer best practices across all the businesses, with lightning speed and with the help of business leaders. To achieve this, every Corporate Executive Council (CEC) meeting dealt in part with a generic business issue – a new pay plan, a drug-testing program, and stock options. Every business was free to propose its own plan or program and present it at the CEC. However, the details of the plan were not approved immediately. Jack Welch wanted to know what the details were so that he could see which programs were working and immediately alert the other businesses to the successful ones.
GE had always been a global company. In mid 1960s, Reuben Gutoff and Jack Welch formed two joint ventures in plastics – one with Mitsui Petrochemical of Japan and the other with AKU of Holland, a chemical and fiber company. Under Jack Welch, GE further expanded into Europe with the purchase of a majority stake in Tungsram, Hungary’s largest and oldest lighting business. GE became the No.1 light bulb maker in the world following the acquisition of Thorn Lighting in the UK. In September 1989, Jack Welch visited India, and formed a 50-50 medical venture with Wipro7.
7 Wipro Technologies, based in Bangalore, India, is the global technology services division of Wipro Limited. (NYSE:WIT) established about two decades back. The company offers services for business transformation and product realization and also solutions for the service provider market.

198
Organizational Behavior
The early 1990s saw GE push its globalization efforts through acquisitions and
alliances and by moving its best people onto global assignments. Analysts felt that GE
focused its attention on countries that were either in transition or out of favor. For
instance, during mid-1990s, when European economy was sluggish, GE saw many
opportunities, particularly for financial services. Around the same time, when Mexico
devalued the peso and its economy was in turmoil, GE made over 20 acquisitions and
joint ventures. This significantly increased GE’s production base.
JACK WELCH – THE LEADERSHIP GURU
After stepping down as the CEO, Jack Welch became an advisor to William Harrison,
CEO, JP Morgan Chase. He also entered into an agreement to become a leadership
guru to several other clients. He was also named the special partner at New York
investment firm, Clayton, Dubilier & Rice. Jack Welch also authored his
autobiography, ‘Jack: Straight from the Gut’, which was at the top of the best-sellers
list in 2001.
Analysts felt that Jack Welch’s influence did not end at GE. Many executives who had
worked under Jack Welch went on to head more than a dozen U.S. companies.
Hundreds more held senior corporate posts across the globe. Workers and employees
who had never been near GE were also familiar with Jack Welch’s management style
including his employee ranking systems. It remained to be seen how well Jeffrey
Immelt, the new CEO,8 who was groomed by Jack Welch, could carry the legacy of
Jack Welch at GE.
Questions for Discussion:
1. Some Wall Street analysts and academics described Jack Welch as ‘the most
important and influential business leaders of the 20th Century.’ Analyze the
various aspects of Jack Welch’s leadership style.
2. Analysts felt that where most top executives lost their effectiveness in ten years
or less, Jack Welch was an exception, staying on the job and driving GE to
elevated levels of accomplishment for 20 years. Analyze the strategies used by
Jack Welch, which made GE the most valuable company in the world.
© ICFAI Center for Management Research. All rights reserved.
8 From September 6, 2001.

199
GE and Jack Welch
Exhibit I
Reg Jones Introducing Jack Welch at The CEO in 1981
Source: ‘Jack: Straight from the Gut’, by Jack Welch with John A Bryne
Exhibit II
Jack Welch at His first Board Meeting as Chairman
Source: ‘Jack: Straight from the Gut’, by Jack Welch with John A Bryne

200
Organizational Behavior
Exhibit III
The Welch Era at GE
Source: www.ge.com
Exhibit IV
GE Under Jack Welch
Source: Business Week, May 28, 1998

201
GE and Jack Welch
Exhibit V
Jack Welch’s Monthly Program
Early January
Sets agenda for the year with top 500 executives at a session in Boca Raton, Fla.
March
Tracks progress and swaps ideas with top 30 executives at quarterly Corporate Executive Council in Crotonville
April/May
Goes into the field to each of GE’s 12 businesses for full-day Session C meetings to personally review performance and developmental plans for GE’s top 3000 managers. Also sends out a survey to thousands of employees to find out what they’re thinking.
June
Quarterly CEC meeting at Crotonville
June/July
Spends full day with the leaders of each of GE’s businesses to review their three-year strategic plans at headquarters in Fairfield.
September
Quarterly CEC meeting at Crotonville
October
Convenes top 140 executives in Crotonville at corporate officers’ meeting to set the stage for the upcoming Boca meeting.
October/November
Invests full day with the leaders of each of GE’s businesses to review budgets.
December
Quarterly CEC meeting at Crotonville.
Source: Business Week, May 1998.
202
Organizational Behavior
Additional Readings & References:
1. GE Annual Reports 1994, 1995, 1996.
2. How Jack Welch manages GE, Business Week, May 1998.
3. Carol Hymowitz and Matt Murray, How GE's Chief Rates and Spurs His Employees, The Wall Street Journal, June 21, 1999.
4. Robert Slater, The GE Way Fieldbook, McGraw Hill, 1999.
5. Douglas Harbrecht, Jack Welch Finds a Reason to Stick Around, Business Week,
October 23, 2000.
6. Jack: The Welch Era at General Electric, Business Week, December 2000.
7. Diane Brady, Jeff Immelt: His own man, Business Week, September 5, 2001.
8. Matt Murray, Why Jack Welch’s leadership matters to businesses world-wide: Welch remolded GE in his own aggressive image, The Wall Street Journal, September 5, 2001.
9. Jack Welch: A Role Model for Today’s CEO?, Business Week, September 10, 2001.
10. Jack Welch: The Lion Roars, Business Week, September 14, 2001.
11. Jack Welch: A CEO who can’t be cloned, Business Week, September 17, 2001.
12. Diane Brady, Hit it the road Jack, Business Week, October 25, 2001.
13. Jack Welch, John A Bryne, Jack: Straight from the gut, Warner Books, 2001.
14. Janet Lowe, Welch: An American Icon.
15. www.ge.com.

203
SRC Holdings – The ‘Open Book Management’ Culture
“We are building a company in which everyone tells the truth every day — not because everyone is honest, but because everyone has access to the same information: operating metrics, financial data, valuation estimates. The more people understand what is really going on in their company, the more eager they are to help solve its problems.”
- Jack Stack, President and CEO, SRC Holdings Corp., in January 2000.1
THE POWER OF EMPLOYEE INVOLVEMENT
There were over 73,000 players operating in the $53 billion remanufacturing2 industry
of the US by the turn of the 20th century. An extensive range of remanufactured
products and related services were available in different industry sectors, such as
automobiles, electrical apparatus, machinery, compressors, valves, tires, office
furniture, and toner cartridges.
The engine and spare parts remanufacturing segment was one of the major segments
driving the growth of the automobile remanufacturing industry in the US. In the early
2000s, the demand for remanufactured engines was steadily increasing due to a large
number of vehicles in the used car segment and the increasing prices of new vehicles.
Surprisingly, the number of players in this segment had gone down considerably since
the 1990s. Few small companies could sustain themselves in the engine/parts
remanufacturing market. While many of them were acquired by the bigger ones in a
spree of consolidation (mergers, acquisitions, and reorganizations), many others
disappeared without a trace.
This consolidation resulted in the emergence of a few, but powerful players such as
Caterpillar Engine Systems (Caterpillar Inc.), Cummins Engine Co. Inc. and Navistar
International Transportation Corp. As the competition intensified, the players were
forced to invest more in research and development (R&D), to strengthen their sales
and distribution networks, and to constantly improve their product service and
remanufacturing capabilities. As a result of the above, all the companies took a severe
beating in their profit margins.
The Springfield (Missouri, US) based SRC Holdings (SRC), was one of the very few
smaller players that continued to prosper in such a highly competitive market,
dominated by the bigger players. Reportedly, it was the only company in the industry
that had continuously registered profits since its inception in 1983. SRC aimed at
generating a 15% growth in revenues and earnings during both good and bad times.
The company registered annual revenue of over $160 million in the year 2001. Since
1983, SRC Holdings had been ahead of its competitors on all productivity metrics
1 “Keep Employees in the Dark, and They’ll Go Where It’s Light,” www.businessweek.com, January 14, 2000.
2 Remanufacturing refers to the process of disassembling used items and utilizing the components to manufacture new products. In remanufacturing, the parts are cleaned, repaired, or replaced and finally reassembled to working condition. Remanufacturing deals with building only parts of a vehicle; when the entire vehicle is made, the process is referred to as rebuilding.

204
Organizational Behavior
such as operating income per employee, revenue per employee, and return on invested
capital.
Analysts attributed the strong performance of SRC Holdings to its organization
culture, which was based on the ‘Great Game of Business’ (GGOB) system founded
by its President and CEO, John P. Stack (Stack). SRC was regarded as one of the
pioneers of the ‘Open Book Management’ (OBM) philosophy, which was formulated
in the mid-1980s. Both GGOB and OBM are based on the principles of throwing the
financial books open to employees, treating them as business partners and thus
making them accountable for the company’s performance (Refer Exhibit I for a brief
note on OBM).
BACKGROUND NOTE
SRC Holdings, originally called Springfield Remanufacturing Corporation, was
formed in 1974, when Internation Harvester (Harvester3), established it as a diesel
engines and engine components remanufacturing unit for its trucks, agricultural and
construction equipment dealers. SRC was a problem child for Harvester from its very
inception and by the late 1970s, the division was saddled with a $2 million loss and a
host of employee-related problems. At this point, Stack, a Superintendent at one of
Harvester’s machining division plants, was made SRC’s plant manager and was given
six months to determine whether the division should be saved or scrapped.
Stack observed that the division was facing a severe dearth of tools, as a result of
which, production was hampered. He realized that the employee unrest was also
because of the same problem – though they wanted to work, they could not do so
because the tools were not available. Stack convinced Harvester to supply the required
tools as early as possible and thus managed to get the production line on track. To
motivate the employees and to improve their productivity, Stack decided to apply the
same technique he had used at the machining division in his earlier posting. This
technique involved stimulating the competitive nature among employees by making
their jobs seem like a game and encouraging them to win the game.
Commenting on this, Stack said, “I had no master plan. My feelings were more basic.
I just felt that, if you were going to spend a majority of your time doing a job, why
couldn’t you have fun at it? For me, fun was action, excitement, a good game. If there
is one thing common to everybody, it is that we love to play a good game.”4 Stack’s
system was based on the simple premise that ‘everyone loves being a winner.’ The
system with goals, scorekeeping, and rewards, was designed to show employees what
it takes to win.
For this purpose, Stack set three modest goals – product quality, safety, and
housekeeping, which he collectively called ‘accountabilities.’ More over, the
employees were also set some production goals. According to Stack, the rationale for
these goals was to make the employees focus on common objectives. The goals were
realistic and achievable in the near future. Commenting on the need for such goals,
Stack said, “Things were in such disarray. You had to start with something. We
needed something to celebrate.”5
3 A major US-based manufacturer of medium and heavy-duty trucks and farm and construction equipment.
4 “The Turnaround,” www.inc.com, August 01, 1986. 5 “The Turnaround,” www.inc.com, August 01, 1986.

205
SRC Holdings – The ‘Open Book Management’ Culture
The company got an opportunity to celebrate very soon when it achieved its goal of
100,000 hours of production without any accidents. As part of the celebrations, the
plant was closed down for a party, and the members of the safety department marched
around with fire extinguishers. Such celebrations soon became common at the
company as other departments began exceeding their targets. To further motivate the
employees to win, Stack instituted an award called, the ‘Travelling Trophy,’ for the
department which exceeded the goals by the highest percentage.
Quality control was taken up with great fervor in the company, as the employees
began to understand its importance. On one occasion when a client complained of a
transmission breakdown, Stack sent a reassembler to fix the problem. The reassembler
had to spend the whole weekend repairing the transmission machine in Kentucky,
before the client was satisfied with its performance and could allow the reassembler to
go. Stack believed that such incidents made employees quality conscious. They were
sure to work carefully in future to ensure that their products were defect free. He said,
“I can tell you, when the guy gets back here, the word gets around so fast that you do
not ever want to expereince that kind of pressure.”6
These changes at Springfield Remanufacturing Corporation, made it a profitable
division within four months. By the end of 1970, it reported a profit of $250,000.
Stack now felt the need for an effective system to measure and monitor costs.
Accordingly, he set up a new cost department in February, 1980. This department
aimed at converting the division’s costing system from actual costs to standard costs
to enable it to accurately measure progress in using resources more efficiently.7
Reportedly, the standard cost system also contributed to the increase in SRC’s profits
in 1980. For the fiscal year 1980, the company’s profits increased to $1.1 million.
Returns on sales increased from 0.9% in 1970 to 8.0% by 1981, while the productivity
increased by 53% for the same period.
The company was once again in trouble, when the US economy underwent a recession
in the early 1980s. Due to the recession, the income from farms declined and the
farmers were not very keen on investing in farm equipment, substantially. Since
Harvester relied on the farm sector to a great extent to sell its agricultural equipment,
its business too suffered. Worried at the prospect of Harvester deciding to close down
or sell SRC, Stack and a team of managers decided to buy the division themselves.
They submitted a proposal to Harvester to buy the division for $9 million. Harvester
did not take any immediate decision regarding this proposal. Meanwhile, Stack began
appoaching various venture capital firms to source loans for the buy-out he was
planning.
By 1982, business conditions across the US deteriorated further and Harvester found
itself neck-deep in debt of around $4 billion and struggling hard to wardoff
bankruptcy. It laid off 76 employees and invited bids from buyers for its major
business divisions including Springfield Remanufacturing Corporation. Dresser
Industries Inc., nearly purchased the business in late 1982, but for some reason, the
6 “The Turnaround,” www.inc.com, August 01, 1986. 7 Actual costs are real costs incurred on overheads and purchase of materials/labor. In an actual
cost system, the real cost of every purchase, material issue, labor, and overheads incurred, is assigned to jobs and products. Standard costs are normal/specified costs that are used as benchmarks for comparing with the actual costs to find variations. A standard costing system helps in estimating the overall cost of production, tracking actual costs, and helps in measuring variances, thus enabling efficient management of resources.

206
Organizational Behavior
deal failed at the last moment. Eventually, Harvester accepted the proposal of Stack
and his team of 12 company managers.
Stack experienced many setbacks in arranging the funds. Over 50 financial firms
turned down his proposal since his buy-out plan did not make sound business sense to
them. This incident laid the foundation for Stack’s firm belief in acquainting himself
with financial ratios and other aspects that were integral and essential for running a
company. Commenting on this, he said, “Here I was, learning for the first time how a
business was truly evaluated. All those years I was managing the wrong stuff. I should
have been managing ratios and managing in terms of the balance sheet. If my old
company had managed that way, it would still be here. So I decided that if I ever got
this factory, I was going to teach people the ratios that we have got to beat.”8
Stack finally succeeded in obtaining a loan of $8.9 million from an investment bank.
In January 1983, Stack and his team bought Springfield Remanufacturing Corporation
for $9 million (Stack contributed $20,000 and the remaining $80,000 came from the
12 member management team).
THE GREAT GAME OF BUSINESS
In February 1983, SRC’s debt equity ratio stood at 89:1 and the company was
required to pay a monthly interest of $90,000 on the $8.9 million loan. Stack felt that
there was only one way to deal with this constraining financial obligation – to seek the
help of employees, open the company’s books to them, educate them on all facets of
running a business, and make them partners in the business. Stack told his employees,
“We need to generate enough cash and profits to stay afloat. I do not know how to do
it. Here are the financial statements. This is how we keep track of what is going on. I
need your help.”9
This laid the foundation for the practice of OBM at SRC and led to the
institutionalization of GGOB, which was built on SRC’s earlier system of treating the
job as a game. The three main GGOB components were: know and teach the rules;
follow the action and keep score; and provide a stake in the outcome (to the winners).
SRC began identifying the problems/weaknesses in different areas of the company
and made sure that overcoming them became the primary goal of every employee.
Employees were required to work in teams and a significant part of their
compensation package was tied up with winning the game.
SRC initiated a comprehensive training program to ensure that all the employees
understood and participated in the GGOB system. All the employees were trained
using a series of courses covering various facets of business such as purchasing,
scheduling, production, financial and cost accounts, plant audit, industrial
engineering, inspection, and warehousing. The employees were also given coaching in
various aspects of running a business which included preparing financial statements,
forecasting financial results, identifying critical drivers of financial results, and
employing effective communication channels and techniques.
Stack believed that employees learnt more about their jobs informally from people
they worked with, rather than through formal training. However, he agreed that formal
training was important to ensure that the employees developed certain basic skills
such as ability to read, and the ability to do arithmatic. He also believed that
8 “Measuring Business Performance,” www.beysterinstitute.org, June 1999. 9 “Want To Play The Game?” www.pmmag.com, June 01, 2000.

207
SRC Holdings – The ‘Open Book Management’ Culture
employees could learn better and faster when the teaching was integrated into their
normal, day-to-day business functions. Thus, in addition to the formal training
programs, the company also focused on providing the employees with informal
training.
As a part of this informal training, an employee activity committee, consisting of
executives from different departments was set up. These executives were given $5000
each and were free to choose how they spent the money for the improvement of the
company. While planning how to use this money, the executives got to learn a lot
about the various aspects of business such as difficulties in management, importance
of communication, and healthy relations within their department and with other
departments.
Commenting on how the employees were taught the rules of the business, Stack said,
“We would never cut anyone’s budget – too many budget projections are made in
business on the assumption that the board is going to cut them by 10%. But we do
bring the marketplace to the people, showing them the rules of the game. We show
them, for example, what wages the company’s competitors’ are paying so that they
understand that if they want to pay themselves more they have to make savings in
other areas.”10
SRC gave all its employees, free access to the company’s monthly financial reports
and the daily progress reports of every division. Supervisors/division heads held small
group sessions and encouraged employees to ask questions or raise doubts related to
these financial statements. By understanding the financial statements, employees
could identify the ‘numbers’ that indicated the company’s financial and operational
efficiency. Apart from these numbers (referred to as the critical numbers), various
financial and non-financial indicators that drove the critical number were also
identified.
The next step in the GGOB system was the creation of the ‘Huddle’ and ‘Scoreboard’
systems. As part of this, SRC encouraged its employees to hold group meetings
regularly to review their progress towards the achievement of their goals (targets set
for the critical numbers). The company also held a ‘Great Huddle’ every week, where
all the employees gathered to report their numbers, which were posted on a
consolidated scoreboard. Explaining the proceedings of such meeting, Stack said,
“The sessions are about the important numbers. You take your stories, convert them
into a number, walk to the front of the room and write it down for everyone in the
plant to see.”11
Income statements were extensively used to identify the weak areas of the company.
Unlike most organizations where income statements are prepared annually/half-
yearly/quarterly, SRC made them on a weekly basis. The top executives of every
division prepared a detailed, projected income statement of their division every week.
This income statement contained the income and expense figures of the previous
month in the first column, projections for the current month as appearing in the annual
budget for that year in the second column and the next three columns were left blank.
At the weekly meetings, adjusted projections based on the reports submitted by
different divisions were factored into one of these blank columns of the statement.
Thereafter, the operating income figure was calcualted, indicating where the company
10 “Learning The Rules of The Business Game: Employee Motivation,” Financial Times, January 12, 2001.
11 “Less is More: How Great Companies Use Productivity as a Competitive Tool in Business,”
by Jason Jennings.
208
Organizational Behavior
stood with respect to its plans. After the meeting, the managers and the supervisors
presented a brief review of the income statement to employees in their respective
divisions and discussed their future course of action to meet their set goals.
The winners of the game were given incentives in the form of bonus plans. At SRC,
the bonus programs were tied up with the achievement of specific goals. For example,
in 1985, the bonus program was tied to the achievement of two goals: reducing
overhead charge-out rate12 from $39 to $32 per hour, and increasing operating income
from 6% to 15% of sales. Though the employees succeeded in bringing down the
charge-out rate to $23 per hour, they could not meet the operating income target. As a
result, they received only 7.8 of their gross salary as bonus as against the 10% they
would have got had they met the other goal as well.
Stack said that the bonus programs helped overcome the company’s weaknesses, “I
sleep much better knowing that everyone is worrying about our company’s
vulnerabilities, not just me. Yes, we have had to work at our bonus program, but it has
been worth everything we have put into it. It has become, quite simply, one of the
most powerful tools we have for keeping our jobs secure and our company strong.”13
On account of the implementation of the GGOB system, SRC grew at a rate of 40%
between 1983 and 1986 and its debt equity ratio reduced from 89:1 to 5.1:1 during
this period. The company’s share price also increased from 10¢ in 1983 to $8.54 in
1986. According to analysts, GGOB not only helped the company to turnaround and
grow, but also resulted in the formation of a unique organizational culture, which
made SRC one of the best examples of successful OBM and employee ownership.
THE UNIQUE ORGANIZATIONAL CULTURE
SRC employees were taught to think and act like the owners of the company. They
were given the freedom to be innovative about their job, department, and company.
Stack did not believe in the policy of forcing employees to mechanically perform their
job. He gave his employees the complete responsibility of their jobs. According to
Stack, this helped employees realize the need to make every effort possible to
overcome their weaknesses and eventually led them to be innovative (in overcoming
weaknesses). Stack referred to this practice as giving ‘psychic ownership’ to
employees.
SRC’s culture was woven around providing opportunities for employees.
Commenting on this, Stack said, “We realized that we had a lot of people in their 30s,
and we had to figure out how to provide opportunities for them to advance. They
became good businesspeople; we needed a place to put them. So we created new
businesses by helping people inside the organization who came to us with ideas. The
businesses we created were designed to solve a weakness in the company or capitalize
upon an opportunity. We invest the start-up cash, take a percentage of the deal, and
give the management team and the employees the rest.”14 Thus, SRC encouraged its
employees to come up with ideas for new product lines or businesses.
The remuneration system at SRC was also based on the company’s philosophy of
equal treatment to the employees at all levels. Reportedly, employees at SRC were
12 Calculated by dividing the amount of total overheads by total chargeable hours.13 “The Problem with Profit Sharing,” www.inc.com, November 01, 1996. 14 “Why They Threw the Books Open at Springfield Remanufacturing Corp.”
www.cgey.nl.com.

209
SRC Holdings – The ‘Open Book Management’ Culture
paid in four ways – salary; stock programs (where each employee earned stock based
on the company’s performance); individual bonus programs (based on employee
performance); and their share in the earnings of the company. Employee stock
valuation was done using a formula that was known and understood by employees at
all levels. SRC gave stock options as bonuses to employees and allowed them to trade,
buy and sell those stock options within the organization. When employees decided to
leave or had to retire from SRC, the company bought back their stock options at an
annually fixed rate.15
Apart from this, employees at SRC also received additional rewards, if their ideas
contributed to improve the company’s operations. Reportedly, this practice made
many employees come up with innovative ideas, which proved to be beneficial. For
example, Freeman Tracy, an engine disassembler, came up with around 50 ideas,
which saved $2 million in production costs for the company and earned him over
$7,500.
SRC believed in promoting employees from within the organization. Hence, it filled
the managerial positions in its new business ventures with its own employees rather
than hiring new employees from outside the company. The company followed this
practice because it felt that executives from outside might not fit into the carefully
nourished culture at SRC. Apart from this, promoting from within also acted as a
motivating factor for the employees, as they saw a wide opportunity for growth at the
company.
Employee job-satisfaction surveys were conducted half-yearly at SRC, wherein
employees were asked to agree or disagree with various statements such as, ‘Those of
you who want to be a leader in this company have the opportunity to become one;’ ‘In
the past six months someone has talked to you about your personal development;’ and
‘At work, your opinions count.’ When the scores were low in a particular area, a
committee was appointed to investigate the reasons and come up with solutions.
SRC also placed a high emphasis on succession planning. Managers and senior
executives were required to give the names of employees lower in the line, who could
take over their positions. Reportedly, every manager and executive at SRC was
responsible for having three people trained and prepared to take over his job. This
information provided the company with a list of potential replacements and helped it
design appropriate training programs for employees.
SRC provided its employees a fair chance for advancement in the company by way of
its annual personal development interviews. As part of these interviews, the
employees were asked to write down the next job they would like to have (the
employees were provided with the list of all the jobs in the company right from the
receptionist to the President). Then the employees were told what they should do to
qualify for their chosen jobs and their progress was tracked accordingly.
Reportedly, SRC was also committed to avoiding lay-offs at the company.
Commenting on this, Stack said, “We have a tremendous passion for keeping and
maintaining jobs. And so we have put our money where our mouth is.”16 According to
Stack, the company had built a four-layer process to avoid lay-offs. He said, “What
we have built is a four-layer process to protect everyone here during tough economic
times. The stock program would be affected first before we would ever cut a job. Next
15 Around 40% of SRC’s shares were held by its workforce, while Stack (19%) and the 12 managers who took part in the buyout owned the remaining shares.
16 “Less is More: How Great Companies Use Productivity as a Competitive Tool in Business,” by Jason Jennings.
210
Organizational Behavior
the bonus program would be hit and then a depletion of corporate earnings. These are
the things we would do before ever considering laying someone off.”17
Commenting on the company’s commitment against layoffs, Stack said, “There have
been times when the market has collapsed and we have been devastated and we did
not lay anyone off. Sometimes it takes a long time to recover from those hits but you
will not recover from them and move forward without your most important asset –
good people.”18 According to Stack, SRC, which aimed at a 15% increase in its
revenues and earnings, always planned for contingencies and trapdoors as part of its
annual growth plans so that it did not have to resort to layoffs.
SRC’s commitment against laying off people is evident from the following incident:
in December 1996, the automobile major General Motors cancelled an order of 5,000
engines. SRC’s calculations indicated that it would be at a financial risk (due to
decrease in revenues with cancellation of the order) if it did not layoff 100 employees.
The only other option to avoid the losses was to start 100 new product lines and get
them running in three months. Some senior SRC executives did not agree to the
second option and were all set to go ahead with the layoffs.
However, the same set of senior executives devised a way out of the situation by
producing replacement engines for the aftermarket19. This meant developing 100
engine models for the 100 different car models in the market during that period.
Though the task was extremely difficult, SRC felt it was worth giving it a try before
laying anyone off. Subsequently, SRC undertook this task, faced numerous problems,
but in the end, survived the crisis without laying off a single employee.
Every employee who came to work at SRC was explained certain ground rules he/she
was expected to follow. The new employees were told clearly that 30% of every
employee’s job at SRC consisted of learning how to make money and profits. In fact,
they were asked to join the company only when they believed that they could comply
with the company’s culture and rules.
BENEFITS OF GGOB
By implementing GGOB, SRC became a company of entrepreneurs where employees
considered themselves as profit makers and cash-flow generators. One of the popular
stories Stack often recounted (to explain what difference GGOB made at SRC) was of
the ‘Nozzlettes.’ In the mid-1980s, when Stack was holding a weekly meeting and the
managers were giving their income statements about an engine that had 750 parts, a
lady from the corner of the room called out, “I do not give a damn about the engine. I
want to know about the injector nozzles.”
This lady was the head of the injector nozzle20 department and wanted complete
information on the nozzle (including what it cost the competition to manufacture it,
17 “Less is More: How Great Companies Use Productivity as a Competitive Tool in Business,” by Jason Jennings.
18 “Less is More: How Great Companies Use Productivity as a Competitive Tool in Business,” by Jason Jennings.
19 Aftermarket equipment (in automobile industry) can be defined as any part which is sold and installed in or on a motor vehicle after such vehicle has left the vehicle manufacturer’s production line.
20 Injector nozzle is an integral part of diesel fuel systems. The function of injector nozzle is to spray the fuel in atomized form into the combustion chamber of each cylinder in the engine.

211
SRC Holdings – The ‘Open Book Management’ Culture
and the amount of profits they made). After the information was provided to her, there
were substantial improvements in that department in terms of housekeeping, quality
and employee morale. The door above the lady’s department carried a sign that said,
‘We are the highest-grossed-margin product in the factory.’
Stack realized that she was the only employee in the factory who tracked gross
margins. He expressed his appreciation of her efforts. Commenting on her reaction to
this, Stack said, “I could see the pride, the feeling of self-esteem. I saw what happens
when you give people the tools of information so that they can be a part of the
business. This lady was throwing away nozzle tips and buying new ones for 12 bucks.
She figured out a way to salvage them at a cost of only 2 bucks. This put $2 directly
into her bonus program and saved $8 on the bottom line, which increased the price of
the company shares she owns.”21
Reportedly, opening up books and imparting business knowledge to employees had
also led to some of the greatest breakthrough decisions at SRC. In the mid-1980s,
when Stack was conducting a weekly meeting at the company, one of the workers
raised his hand and asked, “Jack (Stack), our stock is doing really well and some
people are cashing out. I do not want to just be a connecting rod for them. Where’s the
money going to come from when I want to cash out?” This question led to a virtual
transformation of the company. It forced Stack to think of making SRC ‘bulletproof,’
by building many little companies dealing with different businesses instead of one big
company, and to continually evaluate these companies from the perspective of a
potential buyer. This decision to diversify into other businesses was also based on the
realization that by focusing on the truck engine business, which accounted for more
than 76% of the company’s receivables in the mid-1980s, the company was at a risk
as the truck industry had a history of going into recession every six years.
As a result, the company diversified into other businesses. In the early 21st century,
SRC had 22 companies under its fold, most of which were engaged in
remanufacturing automotives/heavy-duty engines/engine parts or offering product
support systems to original equipment manufacturers in related businesses.
Reportedly, most of the 22 businesses were spawned from the company’s weaknesses
or opportunities identified by its employees. Some of the major companies included
SRC Heavy Duty, SRC Automotive, Newstream Enterprises, SRC Megavolt, ReGen
Technologies LLC, Avatar Components Corp. and Encore Inc.
SRC also made a business of its GGOB system by establishing the Great Game of
Business Inc., an education and consulting firm that spread the OBM philosophy and
provided management training to other companies in playing GGOB.22 The company
had taught more than 3,000 companies how to play GGOB and how to incorporate
OBM in their organizations (Refer Exhibit II for the steps in implementing GGOB in
companies). ‘The Great Game of Business,’ a book written by Stack (with Bo
21 “Why They Threw the Books Open at Springfield Remanufacturing Corp.” www.cgey.nl.com.
22 SRC had begun offering training to other companies in playing GGOB since 1984. However, as the number of companies approaching SRC increased manifold by the late-1980s, it decided to institutionalize GGOB and established the Great Game of Business Inc. in 1988. The company offered GGOB literature, seminars, work-shops, and training programs. GGOB training was offered in three six-week modules, which were broken down into components such as, learning the rules, making change using ‘scorecards’ and creating a culture in where everyone is committed to the company’s financial success.

212
Organizational Behavior
Burlingham, editor of Inc. magazine) on the implementation and success of GGOB at
SRC (published in 1992), sold over 200,000 copies across the world.23
While SRC would definitely be ranked very low on the list of top global corporations, the fact remains that its turnaround would always be referred to as one of the most successful business turnaround stories in the history of US. Two-thirds of SRC’s original three-hundred member workforce (from 1983), is still working with the company – a success which analysts attribute to SRC’s culture. According to analysts, the company’s highly knowledgeable and motivated employee base would continue to be a major competitive advantage in the years to come.
Questions for Discussion:
1. Discuss the initial problems faced by SRC that led to its buyout by the employees. What were the circumstances that prompted the new management to adopt the OBM philosophy?
2. Explain the concept of GGOB and describe why SRC employees were prepared to play it over the years. Elaborate on the basic beliefs and value systems underlying the decision to implementation of OBM and GGOB at SRC.
3. Critically comment on the role played by innovation, encouragement, and job protection in creating the unique culture at SRC. How far do you think OBM and GGOB contributed to this culture? Justify your answer.
4. Examine the benefits, apart from the cultural benefits, that the company was able to reap as a result of implementing GGOB and OBM. Do you think companies, irrespective of the industry and geographical area they operate in, would benefit from the implementation of OBM and GGOB? Why/Why not?
© ICFAI Center for Management Research. All rights reserved.
23 Stack’s second book, “A Stake in the Outcome: Building a Culture of Ownership for the
Long-Term Success of Your Business” was published in March 2002.
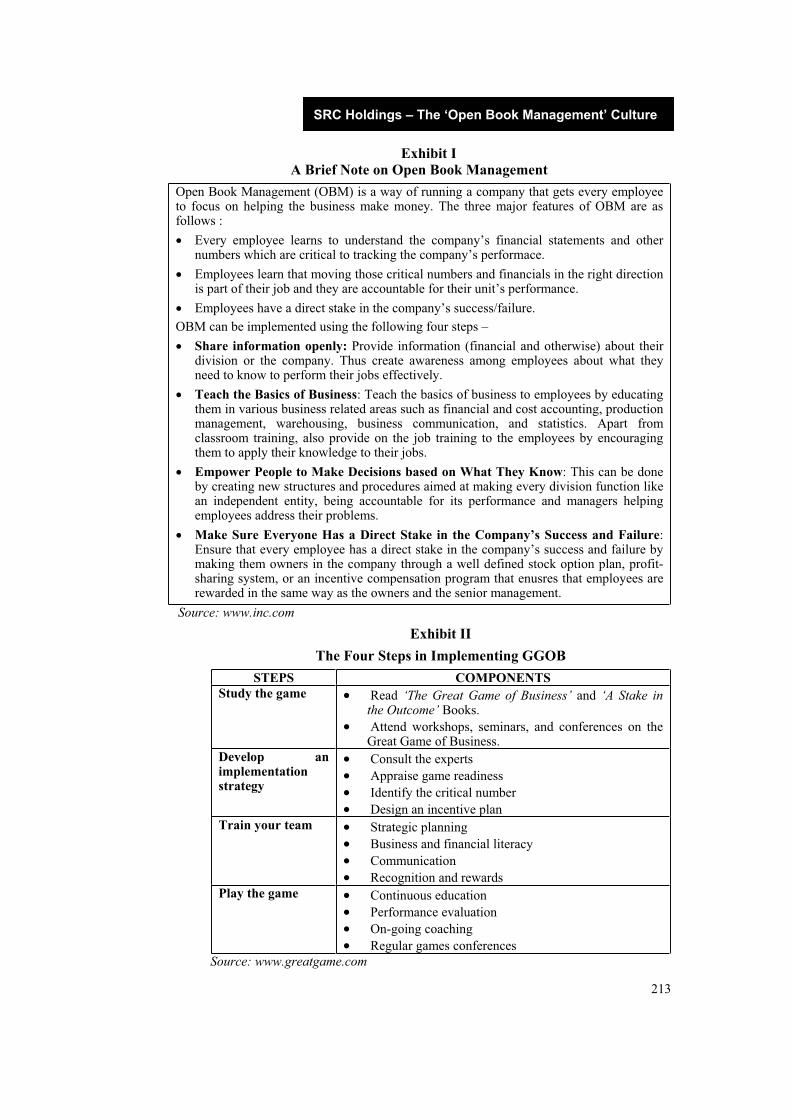
213
SRC Holdings – The ‘Open Book Management’ Culture
Exhibit I A Brief Note on Open Book Management
Open Book Management (OBM) is a way of running a company that gets every employee to focus on helping the business make money. The three major features of OBM are as follows :
Every employee learns to understand the company’s financial statements and other numbers which are critical to tracking the company’s performace.
Employees learn that moving those critical numbers and financials in the right direction is part of their job and they are accountable for their unit’s performance.
Employees have a direct stake in the company’s success/failure.
OBM can be implemented using the following four steps –
Share information openly: Provide information (financial and otherwise) about their division or the company. Thus create awareness among employees about what they need to know to perform their jobs effectively.
Teach the Basics of Business: Teach the basics of business to employees by educating them in various business related areas such as financial and cost accounting, production management, warehousing, business communication, and statistics. Apart from classroom training, also provide on the job training to the employees by encouraging them to apply their knowledge to their jobs.
Empower People to Make Decisions based on What They Know: This can be done by creating new structures and procedures aimed at making every division function like an independent entity, being accountable for its performance and managers helping employees address their problems.
Make Sure Everyone Has a Direct Stake in the Company’s Success and Failure:Ensure that every employee has a direct stake in the company’s success and failure by making them owners in the company through a well defined stock option plan, profit-sharing system, or an incentive compensation program that enusres that employees are rewarded in the same way as the owners and the senior management.
Source: www.inc.com
Exhibit II
The Four Steps in Implementing GGOB
STEPS COMPONENTS Study the game Read ‘The Great Game of Business’ and ‘A Stake in
the Outcome’ Books.
Attend workshops, seminars, and conferences on the Great Game of Business.
Develop an implementation strategy
Consult the experts
Appraise game readiness
Identify the critical number
Design an incentive plan
Train your team Strategic planning
Business and financial literacy
Communication
Recognition and rewards
Play the game Continuous education
Performance evaluation
On-going coaching
Regular games conferences
Source: www.greatgame.com

214
Organizational Behavior
Additional Readings & References: Amend Patricia, The Turnaround, Inc. Magazine, August 1986.
Burlingham Bo, Being the Boss, Inc. Magazine, October 1989.
Case John, The Open-Book Revolution, Inc. Magazine, July 1995.
Morris Davis, Making Workers Owners, www.ilsr.org, August 01, 1995.
Stack Jack, The Problem with Profit Sharing, Inc. Magazine, November 1996.
Stack Jack, Measuring Morale, Inc. Magazine, January 1997.
Stack Jack, The Curse of the Annual Performance Review, Inc. Magazine, March 1997.
Kleiner Art, Remanufacturing Business, www.wired.com, May 1997.
Howarth Roger, Employee Empowerment, www.bizjournals.com, March 23, 1998.
Stack Jack, The Next in Line, Inc. Magazine, April 1998.
Case John, HR Learns How to Open the Books, www.shrm.org, May 1998.
Stack Jack, The Training Myth, Inc. Magazine, August 1998.
Sullivan & Frost, Engine Complexity Causing Shift from Rebuilding to Remanufacturing in Truck Engine Aftermarket, PS Newswire, November 16, 1998.
Eriksen Greg, Measuring Business Performance: Why They Threw the Books Open at Springfield Remanufacturing Corp, www.beysterinstitute.org, June 1999.
Rohr Ellen, Want to Play the Game? www.pmmag.com, June 01, 2000.
C.McCune Jenny, How Open-Book Management Can Help Your Small Business,www.bankrate.com, September 15, 2000.
Nelson Bob, Open Book Policy, http://cmi.meetingsnet.com, October 01, 2000.
Baker David, Learning the Rules of the Business Game: Employee Motivation, Financial Times, January 12, 2001.
Turner Freda, 'Open-Book' Management Style Solicits Ideas from Employees,www.bizjournals.com, January 29, 2001.
Jack Stack, www.fortune.com, December 03, 2001.
Case John, No More 'Etch A Sketch' Planning, Inc. Magazine, December 2001.
Drickhamer David, Executive Word -- Open Books to Elevate Performance,www.industryweek.com, January 11, 2002.
Autoparts Report, January 29, 2002
Jack Stack, www.beysterinstitute.org, March 2002.
Experience the Dramatic Results of Open Book Management, www.cfoplus.net, March-April 2002.
Burlingham Bo, The Innovator’s Rule Book, Inc. Magazine, April 2002.
After Enron: The Ideal Corporation, www.businessweek.com, August 26, 2002.
Turner Freda, Organizations and Successful Change Initiatives, www.webpronews.com, August 02, 2003.
TDF Speaker Spotlight, www.trainingdirectorsforum.com, June 2003.
Butler Betsy, Companies Open Up Their Books to Give Employees a Greater Sense of Ownership, www.bizjournals.com, July 28, 2003.
Springfield Remanufacturing Corporation, www.successprofiles.com.
www.srcreman.com
www.greatgame.com
www.inc.com
www.shrm.org
www.manufacturingmarketresearch.com
www.remancentral.com
www.menke.com
http://deming.eng.clemson.edu
www.cfoplus.net
www.umass.edu
www.cesj.org
www.bridgefieldgroup.com

British Airways: Leadership and Change It has been incredible. I recall the dark days of the oil hike and of the Gulf war, but what we are experiencing just now, and I'm afraid what is likely to continue for some
time ahead, dwarfs anything I have ever experienced. 1
There are clearly tough times ahead and experience has shown us that conserving
cash is critical at these times.2
Rod Eddington, Chief Executive Officer, British Airways
INTRODUCTION
On February 11, 2003 Rod Eddington, the Chief Executive of British Airways (BA)
woke up in his hotel room in New York. Switching on the news channel, he was
delighted to see that the channel was covering the airline's recent quarterly results,
announced the previous day in London. It was then that he saw the tanks at the
Heathrow airport. On his return to London, Eddington saw first hand the troops and
police roadblocks put in place at dawn by the government, worried that terrorists
might try to shoot down an aircraft. The same day Eddington received a note from his
management group predicting a gloomy picture of zero revenue growth for the
following 12 months, as the prospect of a war in the Gulf and weak economic
conditions would deter international travelers. Eddington wondered when the good
times would return again for the airline industry, which had been going through a
crisis since September 11, 2001. He also wondered how to boost the low staff morale,
and rejuvenate the culture that BA had built painstakingly over the years.
BACKGROUND NOTE
BA was one of the leading airways in the world. In 2002, BA recorded revenues of
£8,340 million and a loss of £110 million and carried 40 million passengers. 3
BA operated a fleet of 360 aircraft to nearly 270 destinations in some 97 countries. It owned minority stakes in Australia’s Qantas and Spain's Iberia. BA was part of the Oneworld global marketing alliance, which also included American Airlines, Cathay Pacific Airways, Finnair, Qantas, and Iberia.
BA had been formed in 1974, as a result of the merger of the state run British Overseas Airways Corporation (BOAC), which handled long haul international routes, and British European Airways (BEA) that mainly covered destinations in continental Europe. Right from its inception, BA was a loss making company, slow and lethargic in its operations and insensitive to customer needs. BOAC and BEA staff could not agree on administrative and operational matters and service deteriorated rapidly. BA’s poor service became highly publicized when the Beatles detailed a horrific BOAC flight to Miami Beach in their famous song “Back in the USSR.”
After the merger, the expected integration of the two organizations did not materialize on account of cultural factors. The people at BOAC believed they belonged to a gentleman’s airline and equated BEA with a trade man’s airline. BEA people on the other hand considered themselves true competitors and their colleagues at BOAC to
1 The Guardian Unlimited, 22nd September 2001. 2 www.britishairways.com, British Airways Press release, ‘Response to Iraq conflict’, 26th
March 2003. 3 British Airways Annual Report 2001/2002.

216
Organizational Behavior
be snobs. Each group served different categories of passengers with different requirements. The only common feature seemed to be inefficiency. Both groups blamed each other and passed the buck. Service grew worse as there was little or no accountability. People regularly joked that the “BA” sign stood not for British Airways but for “Bloody Awful”. The situation became so bad that in 1980, BA was voted as the airline to be avoided at all costs4.
In 1981, Lord King was appointed the Chairman of BA. King’s mandate was to restructure BA, make it profitable, and prepare it for privatization. King was quick to realize that internal politics was seriously undermining the organizational efficiency. He immediately reduced the staff strength from 58,000 to 38,000 and replaced existing directors by professionals with rich experience in various industries. One of the most important decisions King took was the appointment of Colin Marshall, as the CEO in 1982.
King and Marshall quickly attempted to resolve the differences between the BOAC and BEA staff. Together they turned around BA by emphasizing both customer service and employee welfare through a number of initiatives. They encouraged employees to look beyond their narrow functional and cultural boundaries. They devised a number of unique and innovative measures to promote cross-functional coordination and better utilization of assets. Various employee development programs were launched to boost employee morale. A strong management team was put in place, in preparation for the privatization of the airline in 1987. BA also took various measures to improve its image prior to privatization. The airline used aggressive advertising to promote its brand name and corporate image worldwide. BA also invested in modernizing the fleet, ground facilities and IT upgradation.
By 1986, BA had been transformed from a loss-making airline with a reputation for poor customer service into the industry’s benchmark for innovation, service and profitability. The airline restructured itself completely including its fleet, pricing schedules and advertising. In 1986, BA developed a new corporate mission statement to guide its activities.
Exhibit I
MissionTo be the undisputed leader in world travel.
Values
Safe and secure
Honest and Responsible
Innovative and team spirited.
Global and caring.
A good neighbor.
Goals
Customer’s choice - Airline of first choice in key markets.
Strong profitability-Meeting investor’s expectations and securing the future.
Truly global-Global network, global outlook, recognized everywhere for superior value in world travel.
Inspired people Building on success and delighting customers.
Source: www.britishairways.com
4 Barsoux J.F, J. L Manzoni, ‘Becoming the World’s Favorite Airline: British Airways 1980-93’,INSEAD- CEDEP, France, 1997.

217
British Airways: Leadership and Change
When BA was privatized in 1987, 95% of BA staff received shares. In both 1988 and
89, BA won the world’s best airline award for two years consecutively. 5
In February 1993, Lord King stepped down as Chairman. Following his retirement,
Sir Collin Marshall took full executive management responsibility.
In January 1996, BA appointed Bob Ayling as the new CEO. Ayling, who joined the
airline in 1985 from the Department of Trade, had looked after the legal matters
relating to BA’s privatization in 1987 and its acquisition of the British Caledonian in
1988. Ayling carried forward the reforms initiated by his predecessors and
significantly improved the efficiency of operations. But his aggressive style of
management and efforts to cut costs and jobs backfired. He was forced to resign in
March 2000.
In May 2000, Ayling was succeeded by Rod Eddington, an Australian who had earlier
been running Cathay Pacific and Ansset. Eddington seemed to win the confidence of
his staff quickly. He continued to shrink capacity created two years earlier and
concentrated on premium customers by flying ‘point to point’ rather than filling
Jumbo jets with low fare transfer passengers. Unlike his predecessor, he took care not
to dismiss budget travelers out of hand.
During 2000-2001, the aviation industry continued to be under pressure due to global
recession culminating in the September 11 terrorist attack. As many airlines filed for
bankruptcy, BA downsized substantially during 2002. Between August 2001 and
March 2004, BA had plans to cut the workforce by 23 per cent or 13,000 jobs. 6
In 2003, the outlook for BA remained bleak due to the imminent war between USA
and Iraq. The Middle East sector formed one of the most profitable, full capacity
routes for BA. The airline’s passenger traffic fell by 5.6% in February 2003, but its
premium traffic plunged by 14.3% year-on-year - in part because of the growing
threat of war and terrorism.
However, Eddington believed BA could weather the storm. He told the Financial
Times7:
"We will need to respond [to the war in Iraq], but we are well prepared financially and operationally."
BA had liquid reserves of £2.2 billion of which £1.8 billion was in cash. Though it had a net debt of £5.2 billion, there was no big repayment due in the near future.
CHANGE MANAGEMENT AT BA
King and Marshall
Before the arrival of Colin Marshall, BA had been inward focused, operations oriented, with little emphasis laid on customer service. This attitude had obviously led to several customer related problems. There was a total absence of a market orientation and little focus on profitability.
5 Barsoux J.F, J. L Manzoni, ‘Becoming the World’s Favorite Airline: British Airways 1980-93’,INSEAD- CEDEP, France, 1997.
6 “British Airways to cut 5800 more jobs”, Air Transport World, Cleveland, March 2002. 7 FT.com, “Eddington lays out his survival strategy”, By Kevin Done, Aerospace
Correspondent, 14th March 2003.

218
Organizational Behavior
In King’s words8:
“ BA was an organization that did not really understand the word profit, that was very fearful of moving into the private sector. It was also obvious to me that the organization was extremely introverted, had really no grasp of what the market place wanted, what the customer wanted…We couldn’t get away from the fact that we were running an operation. The operation was everything, the customers were just an unfortunate add on. ”
BA had a highly hierarchical bureaucratic structure. Managers were respected for their position and status within the organization. Their behavior was often inflexible and the level of initiative required by managers was very low. They were expected to behave with a minimum of freedom as the rules of the game were well written in manuals.
Serious communication gaps existed across the organization. BA employees had few opportunities to express their own views regarding working practices or any other issues. The management style was authoritarian. Decisions were made in isolation, without involving other areas affected by the issue to be decided. People were selected or promoted primarily on political considerations. Appraisal and reward systems were unrelated to performance. Clear goals were often not set. The reward system was linked to the length of service. A cross-functional perspective was really missing.
After becoming chairman in Feb 1981, Lord King announced9:
“My endeavors will be concentrated on doing all I can to see that BA has all the resources it requires to maintain and to improve its standing as one of the greatest carriers in the world. ”
In September 1981, King launched the Survival Plan with ‘tough, unpalatable and immediate measures’ to stem the spiraling losses and save the airline from bankruptcy. The radical steps included reducing staff strength from 52,000 to 43,000, in just nine months, freezing pay increases for a year, and closing 16 routes, eight online stations, and two engineering bases. It also involved halting cargo-only services and selling the fleet, and inflicting massive cuts upon offices, administrative services and staff clubs. The Survival Plan eventually brought the total employee strength down to nearly 35,000 through voluntary measures offering generous severance, which totaled up to some £150 million.
Sir Colin Marshall who joined as CEO in February 1983 made customer service a personal crusade from the day he entered BA. He set up a core marketing team of four
young internally promoted managers. Marshall announced10
:
“From the customer’s perspective, the quality and value of the product are determined to a great extent by the people delivering the service. We therefore have to “design” our people and their service attitude, just as we design our seat, an in-flight entertainment program or an airport lounge to meet the needs and preferences of our customers. ”
In July 1983, Marshall launched a sweeping reorganization, splitting the operations
into eleven profit centers. The new structure aimed at reducing layers of management,
allowing more efficient communication across functions and ensuring coherence
8 Salama A, ‘The Culture change process: British Airways case study’, Cranfield school of management, 1994.
9 Salama A, ‘The Culture change process : British Airways case study’, Cranfield school of management, 1994.
10 Prokesch S. E, ‘Competing on Customer Service: An Interview with British Airways’ Sir Colin Marshall’, Harvard Business Review, 1995.

219
British Airways: Leadership and Change
between operations, short-term budgeting and long term strategic management. These
profit centers were entrusted to young managers who were promoted three to four
levels overnight. Simultaneously, Marshall removed many executives deemed
unlikely to adapt to the new customer focus in the company. In November 1993,
Marshall introduced a profit sharing program for employees, a practice rarely seen in
the UK.
Training became an integral part of BA’s efforts to build a new corporate culture.
Every employee underwent intensive management training programs like Putting
People First (1983-86) and Managing People First (1985-88). Marshall explained11
:
“The title is significant. It deliberately refers to putting people first. We
want to remind our staff that their colleagues are people, and the way
employees treat each other is just as important as their treatment of
customers.”
Putting People First (PPF)
PPF conducted by the Danish firm Time Manager International lasted two days and
included 150 participants and consisted of presentations, exercises and group
discussions.
The key message12
was
“If you feel OK about yourself you are more likely to feel OK about
dealing with others.”
PPF was so warmly received that non-frontline employees also wanted to be included.
A one day “PPF II” program facilitated the participation of all BA employees through
June 1985.
Approximately 40,000 BA employees went through the PPF program. The program
urged the participants to reflect on their interactions with other people, including
family, friends and, by association, customers. The program made a tremendous
impact, due to the honesty of its message, excellence of its delivery, and the strong top
management support. PPF emphasized positive relations with people in general.
Implied in the positive relationship message was an emphasis on customer service.
But the program was careful to put the employees as individuals first.
Staff going through PPF reviewed their personal experience of dealing with people at
home, and at the work place. They were introduced to the concepts of goal setting and
of taking responsibility for getting what they wanted out of life. Simple techniques
were explained to help employees deal with stressful and unpleasant situations and to
develop a more positive attitude.
Employees were sent personal invitations, thousands were flown in from around the
world, and a strong effort was made to treat everyone with respect. Grade differences
became irrelevant during PPF. Managers and staff members interacted freely. A senior
director came at the end of every single PPF session and took part in a question and
answer session. Marshall himself frequently attended the closing sessions and
attempted to address employee concerns in a transparent manner. The overall staff
response seemed to be very positive.
11 Barsoux J.F, J. L Manzoni, ‘Becoming the World’s Favorite Airline: British Airways 1980-93’,INSEAD-CEDEP, France, 1997. 12 Salama, A, ‘The Culture change process: British Airways case study’, Cranfield school of management, 1994.

220
Organizational Behavior
Managing People First (MPF) Program
Despite all these efforts, BA continued to suffer from turf wars especially at the
middle management level. Besides, some managers felt they were not cared for. So
they found it difficult to care for others. BA made a number of efforts to change the
mindset of senior managers.
Among the significant efforts to build a new breed of leadership was the executive
training process, Managing People First (MPF), a five-day residential program
(launched in 1985) developed specifically for the 1400 BA managers under the human
resource director, Nick Georgegettes. MPF stressed the importance of trust,
leadership, vision and feedback. It also sought to operationalise the process of change
within BA. MPF was an intensive, twelve-hour-a-day learning process, that
represented a departure from past practices. It attempted to implement the philosophy
of “emotional labor” by changing the historical impersonal culture into a culture,
which reinforced “the business of caring and trust”.
MPF provided participants with plenty of individual feedback about their managerial
behaviour. They were obliged to communicate better with their peers and
subordinates. MPF impressed upon the participants the need to motivate the staff, and
to avoid “emotional burnout”. The program was intended to prepare people for
change. The program generated responses like, “ It was almost as if we were touched
on the head… We don’t think we even considered culture before MPF”. It initiated
regular meetings with staff every two weeks, in contrast to before the program when
he met with staff members only as problems arose.”
In late April 1986, a group of New York based managers, who attended MPF,
submitted a proposal to recover lost traffic due to terrorist threats. They received head
office approval for their $ 7 million public relations, advertising and sales promotion
campaign. By September, traffic was back to normal levels.
But some senior line managers did not actively involve themselves in the
implementation of MPF. There were also rumours that the board of directors did not
support the initiative. Some employees perceived it as an HR initiative to change the
management style of BA. Some managers felt MPF was far removed from the
changes occurring in other areas of the organization. The emphasis on “trust” sounded
hypocritical at a time when job security had reduced considerably.
There were comments like13
:
“People can now lose jobs if something goes wrong…. We don’t have
security anymore. Perhaps we are here only for today. Trust is based on
security.”
While these programs enjoyed some success, not many employees felt “ Touched on
the Head “ by programs following PPF and MPF.
An external research report identified some of the key obstacles that remained on the
way to organizational changes. (Exhibit: II).
13 Salama, A, ‘The Culture change process: British Airways case study’, Cranfield school of management, 1994.

221
British Airways: Leadership and Change
Exhibit II
Obstacles to Change As Perceived By BA Managers
Mentions Rank
Coping with competing value systems
BEA versus BOAC, cost Versus Service, Operations versus Marketing
17% 1
Managing Across Hierarchical Lines
compartmentalization makes interdepartmental cooperation difficult
12% 2
Continual cost containment / Downsizing –
no chance to regroup
12% 2
Inadequate Staff-
people in wrong jobs, not customer-oriented.
10% 4
Source: Forum Corporation Research Report, 1986.
Simultaneously BA introduced a new evaluation program based on both result oriented measurement (60%) and other a measurement of how people were going about their jobs (40%), particularly the extent of their commitment to the fundamental corporate values as judged by the boss and peers. Each year, the performance of managers was evaluated by their bosses according to a list of 60 ‘statements of behaviour’ taught during MPF, identified as key behaviour characteristics necessary in a customer service business. These changes were then reflected in the compensation system. Accordingly people were judged more on a qualitative basis covering both what the manager achieved and the manner in which it was achieved.
Other Programs
Following PPF and MPF, BA introduced a fairly successful company wide program in 1985 called “A day in the life” and less significant programs in 1987 called “To Be The Best”, “Leading in the service business”, an “Awards for Excellence” program to recognize outstanding contributions and a “Brainwaves” program to encourage suggestions from employees.
As Marshall once observed14
:
“I am a great believer that when you embark on these type of programs you are stuck with it for evermore, because if you let it stop for a period of time, you will see a very marked decline in the staff attitudes to the delivery of service. You’ve got to keep them ‘hyped’ to some extent on an ongoing basis.”
Marshall also regularly communicated to the staff through video.
BA also offered a company specific MBA program in conjunction with Lancaster University in 1988. It devised the “seeds” program to identify and develop potential change agents and created its ‘Top Flight Academics’ to help promising managers at every level make the transition to the next level.
14 Barsoux J.F, J. L Manzoni, ‘Becoming the World’s Favourite Airline: British Airways 1980-93’,INSEAD- CEDEP, France, 1997.

222
Organizational Behavior
BA used team building workshops and management development programs as a
follow up to other major initiatives. Efforts were made to create a greater sense of
participation among employees, by incorporating learning processes in the normal
daily routine. The airline also evolved systems to make better use of internal skills and
resources. BA distributed lapel buttons that said, “I Fly The World’s Favorite Airline”
to motivate its employees.
In April 1992, BA embarked on a major corporate service development initiative,
called “Winning for Customers.” Its main platform was a training event, “Winners”. It
ran each weekday for nearly two years until every employee had an opportunity to
take part. The main theme was the vital role that individual employees played in
retaining customers. Later 7,500 managers, supervisors, captains and cabin service
directors also attended a two-day “Managing Winners” program. (See Exhibit: III for
the responses of BA staff to culture change.)
BA installed a 360 – degree feedback program to replace the old top down system.
Employees welcomed this approach and felt that team involvement in decision
making would grow further. Customer feedback formed a major component of the
new system. BA expected senior managers to attend the customer listening forums
regularly to listen in on calls that came into customer relations department’s ‘Care
Line’ and discuss the causes and solutions to service issues.
As Marshall put it15
,
“It was decided not to develop a system that rewarded people only for
results, but combine results-oriented measurement with measurement of
how people were going about their jobs and, particularly, the extent of
commitment to the fundamental corporate values.”
Bob Ayling
While taking over as CEO in 1996, Ayling felt that the airline’s main problem was
complacency.
Ayling told the board16
,
“ People have got to be open with each other, they’ve got to be
challenging and professional, they’ve got to do what they say.”
In March 1996, BA became the first company in the world to make daily TV
broadcasts to its staff to communicate company news to employees directly and thus
kill the rumor mill that existed.
In September 1996, Ayling announced at a meeting of top 300 managers, his plans to
ask 5000 volunteers to quit the company over the next 18 months. In their place he
proposed a similar number of new recruits with greater flexibility and more
appropriate skills. This evoked angry reactions from the employees. Relations
between the management and the union also deteriorated.
Ayling was also determined to clean up BA‘s tarnished reputation and to give it a
fresher, more cosmopolitan image – that of a 21st century airline.
15 Barsoux J.F and J.L Manzoni, ‘Becoming the World’s Favorite Airline: British Airways 1993-97’, 398-080-1 INSEAD-CEDEP, France, 1997. 16 Barsoux J.F and J.L Manzoni, ‘Becoming the World’s Favorite Airline: British Airways 1993-97’, 398-080-1 INSEAD-CEDEP, France, 1997.

223
British Airways: Leadership and Change
His vision was17
“ We remain proudly British, but perhaps we need to lose some of our old fashioned Britishness. We are no longer a civil service department dabbling in air transport, but a global company whose headquarters happen to be in Britain. I know many of our overseas staff do not feel intense loyalty to any sense of British nationhood, and we need to move away from those ideas. Abroad, people see this country as friendly, diverse and open to all cultures. We must better reflect that ”.
Ayling worked on the creation of a new identity for BA, which it unveiled in June 1997, to 300 assembled guests at Heathrow airport. In 63 countries, hundreds of invited guests and 140,000 of BA’s employees viewed the announcement by satellite broadcast. An impressive array of special events around the world accompanied the launch. No expense was spared in announcing the decision to transform the “World’s Favorite Airline” into a global company by replacing the company’s traditional designs with ethnic designs.
The airline indicated that the new identity program was part of a broader corporate and cultural change. The plans extended to upgrading the First, Club World and Club Europe class travel cabins and covered new products and services for leisure and business travelers. He kept £10 billion to be invested over the next three years on projects such as improving the BA terminal at JFK airport in New York, providing better in-flight entertainment, adding new routes, offering on line reservations, and expanding relationships with airline partners like American Airlines.
The new identity also attempted to project British Airways as an airline of the world, born and based in Britain with employees passionately committed to serving the communities of the world. It aimed at reflecting the best of established British values, blended with the nation's more modern attributes - its friendly, youthful, diverse and cosmopolitan outlook, and openness to many cultures. 50 ethnic designs commissioned from artists across the world adorned the tail fins of BA’s entire fleet, ticket jackets, scarves of cabin crew as well as business cards. The move followed a market survey which recommended that the airline must move away from the ‘British’ image to that of ‘a citizen of the world’ recognising the fact that 60% of the BA’s passengers were non British. However, this identity change that cost BA £60 million generated more controversy than anticipated. Many saw the revamp as extravagant and confusing.
Some employees felt that the airline should attend to its industrial relations rather than its image. Initial reactions from the British press were also not favourable. Almost immediately the new corporate identity drew derision and criticism in newspaper articles. Corporate image specialists were quoted as saying that the “designs looked like a wallpaper catalogue” and lacked a clear focus. The new image also provoked an angry reaction from shareholders at the BA Annual General Meeting, including complaints that the change was unpatriotic and a waste of money.
The launch of BA’s new corporate identity coincided with the start of two trade union ballots on possible strike action. Employees were upset with two key decisions Ayling took at that time. One was the sale of BA’s catering division. This was resolved when the management agreed to extend benefits to employees transferred out of the division. Ayling pointed out that there would be no job losses within catering. Generous terms were offered. Employees would be transferred to a new owner on the same pay, with pensions to match those offered at British Airways. A loyalty bonus was also offered and staff travel entitlements were preserved for a period of time. The
17 BBC Online Archives-“BA takes ethnic route in £ 60 m bid to stay in front around the globe.”

224
Organizational Behavior
other decision involved consolidation of overtime and allowances into basic pay. This was part of a new initiative to cut costs.
In June 1997, BA’s announcement to save £42 million in personnel costs through more outsourcing known as the “Business Efficiency Program (BEP)” resulted in a major clash with trade unions. While this pushed up the pension income of most people, some crew stood to lose monetarily. Also, the staff were required to work on more flights. The management agreed to make up for this shortfall, but new recruits stood to lose about 20% of the income.
While one union accepted the terms of the management, the other, British Airlines’ Stewards and Stewardesses Association (BASSA) went on a 72 hour strike. The management’s hard – line approach and declaration of the strike as illegal evoked widespread condemnation from the public. The board felt compelled to issue a statement of confidence in Ayling.
The BA management exerted pressure on striking employees with threats of dismissal and loss of pay. The airline also proposed to take legal action against BASSA and the International Transport Workers Federation (ITF), which also joined issue with the management. The strike began to evoke the sympathies of crew belonging to other airlines. Soon the BA management found itself being dragged into a bitter battle, which threatened to sully its image. The strike cost BA £125 million and reduced the company’s market capitalization by £300 million. Employee morale also plunged as a result of the strike. Although the strike lasted only three days, the disruption went on for weeks and passengers deserted to fly with rivals like VAA and United Airlines, many never to return.
By April 1998, BA had endured 10 months of sustained condemnation of the new corporate image. Ayling himself was attacked for all these happenings. The Economist said that it was his belligerent management style and his failure to attend to detail, that was driving away BA’s business class traffic.
To make matters worse, Kevin Murray, the company’s communications director resigned in the wake of public criticisms. He was charged with selling the ethnic tailfins to the public. Ayling knew that his resignation would attract still more unpleasant media attention.
Many crewmembers also told Bob Ayling how unsatisfied they were with the company’s management style. Ayling believed that radical changes were bound to upset people, but said that he hoped to go ahead with his program as quickly as possible, before seeking to rebuild relations. But to restore employee morale, Ayling pledged that he would be more ‘caring’ and would take into account people’s concerns. An internal task force called ‘The Way Forward’ was constituted to generate ideas on how to improve communication between management and staff and to improve operational performance.
BA launched a new program called ‘Leadership 2000’ with the objective of improving its managers’ skills and making them responsible for customer satisfaction. The program introduced various initiatives to encourage better decision making and greater accountability, rewards based on result and a less hierarchical structure.
BA launched a series of initiatives to simplify the performance management system. This was based on interviews with 100 employees about what good managers actually did. More observable behavioral criteria were introduced. It was decided to conduct two proper performance reviews per year and at least one career development discussion. Another initiative called ‘In Touch’, made it compulsory for employees not in direct contact with customers to spend one day a year on the front-line. A confidential help-line was also created to offer practical advice and counseling to employees.

225
British Airways: Leadership and Change
Towards the end of 1998, Ayling announced BA’s first ever third quarter loss, which was a major blow for an airline which made profit even during the 1991 gulf war, when the entire industry was down. It looked unlikely that the employees would receive their annual bonus.
In 1999, BA revived the “Putting People First” program renaming it “Putting People First Again”. All the 64,000 employees were put through the “Putting People First Again” initiative in order to improve service standards. The Financial Times commented that it was ‘an implicit acceptance that people have not always come first in recent years’.
BA’s Business Efficiency Program, continued to deliver strong results in 1999. This improvement was achieved despite greater capital investments and spending in preparation for the Year 2000 problem. Labor relations and punctuality improved significantly in 1999.
In June 1999, in contrast to the fanfare two years earlier, BA declared that half of its 340 strong fleet would have their tailfins repainted with an image based on the Union Jack, which was already in use on British Airways’ flagship aircraft, the Concorde. This decision effectively ended the company’s controversial ‘world Images’ aircraft livery policy. Ayling admitted that the company had to accept the “reality” of BA as a British based global airline, and the decision was recognition of the airline’s need to attract more business class passengers and improve staff morale.
A widespread feeling persisted that Ayling had failed to take his staff with him, despite the charm, intelligence and persuasiveness he displayed in private. The Economist reported that morale had slumped, customers had become fed up with grumpy staff and business suffered. The climate of suspicion Ayling had helped to create made it all the more difficult to implement many of the changes he wanted to. Some analysts felt that he had over managed a good airline. In March 2000, the board had run out of patience and asked Ayling to resign.
The day after Ayling’s resignation, the Financial Times reported18
:
“ In his four years as BA chief executive, Mr. Ayling had earned the dislike of many of his staff, provoked a strike by BA’s cabin crew and caused a national furore by replacing the Union flag on BA’s tail fins with ethnic art from around the world.”
Rod Eddington
Rod Eddington, who took over as BA’s CEO in May 2000 faced the challenge of boosting the morale of 65,000 employees while continuing to cut costs by downsizing.
In an interview with the Economist, Eddington remarked19
:
“…It is my job to empower the organization to be able to do that (ability to deliver the right products and services). People are the lifeblood of any airline and it is the people of British Airways, both as individuals and as a team, who will deliver its future success. I look forward to meeting as many as possible over the coming weeks and months and listening to what they have to tell me about how we can further improve our products and service. I also look forward to meeting our customers. ”
High hopes were pinned on Eddington, the 50 year old former chief of Australian airline Ansett. As successor to Bob Ayling, he took over just as BA prepared to report its first loss since privatization.
18 Financial Times, 11th March 2000. 19 The Economist, “Hemmed in at home”, 4th July 2001.

226
Organizational Behavior
Soon after Eddington took charge, a series of crises followed. BA grounded Concordes in August 2000, for several months after the crash of an Air France Concorde outside Paris, which killed 113 people. The service was restored only in 2001.
In March 2001, the outbreak of the Foot and Mouth disease in the UK had a serious impact on BA’s traffic. The worst day in the airline industry’s history was September 11, when terrorists attacked the WTO building in New York. The airline industry across the world was badly affected. Security and insurance costs increased as a consequence of the terrorist attacks.
BA was forced to lay off 5200 employees on top of 1800 job cuts made earlier in 2001. As part of his efforts to further contain the losses Eddington decided to eliminate Christmas bonus for 36.000 employees thereby saving £37 million.
In February 2002, BA announced further job cuts of 5800, involving £200 million in severance wages, but leading to annual savings of £650 million. Eddington also decided to further restructure routes and withdraw from many uneconomical routes.
In September 2002, BA emerged as the most successful airline at the prestigious 2002 Business Traveler Awards, winning a total of seven categories. BA also regained top spot in the Best Business Class category. BA also bagged five further awards for Best Cabin Crew, Best Short haul Flights, Best First Class, Best Frequent Flyer Programme and Most Innovative Airline.
Rod Eddington said20
:
"In a tough year for the industry, it’s particularly heartening for us that our staff have been able to continue to deliver excellent service which has been recognized in this way. Winning seven awards means a great deal to us, particularly as they have been voted for by frequent travelers. I’m particularly proud to have won Best Business Class which is recognition for our revolutionary Club World flat bed which has set the standard for the industry and been a huge success with our customers.”
FUTURE OUTLOOK
In early 2003, BA realized that its future depended on the ability to perform better than other players in an increasingly competitive market. The management believed that BA would be one of the most threatened airlines in the event of an Iraq war for two reasons. One, London continued to be a terrorist target. Two, the outbreak of war would produce the sharpest fall in passengers on the long-haul routes (Premium traffic fell by 7.6% in January 2003), particularly across the Atlantic, on which BA made almost all of its profits in normal times. BA also generated 6% of its revenues in the long-haul Middle East flights with full capacity most of the time.
The cost of a war was expected to be heavy for BA. Eddington was aware that during the 1991 gulf war, traffic had plunged by 40%, though it recovered fast when the war ended.
BA also faced the prospect of having to make heavily increased contributions to its pension funds. Looking at the projected economic scenario for the immediate future, Eddington realized that global turbulence would continue to haunt BA for some more time. He wondered as to what he should do to keep the morale and commitment of his people high and regain BA’s past glory.
© ICFAI Knowledge Center. All rights reserved.
20 Source: Asiatraveltips.com

227
British Airways: Leadership and Change
Exhibit III
BA: Responses to the Culture Change
The new culture in BA brought about a transformation in its core mission, to become more customer focused.
“ Flying the aeroplane is now a part of the getting the business to work, not the thing that everybody needs to have experience in or be a professional in. Customers are everything now and the operation is subsidiary to the customers. There is a great emphasis on the primary purpose of the business: getting people to travel and to be pleased with their experience and to come back several times.”
Although not unanimously, by 1990 staff and management at BA felt that culture at the airline had changed for the better since the 1970’s. There was near complete agreement on the positive feelings generated by the success. the general atmosphere of the company is a much more positive one. There is an attitude of “ we can change things, we are better than our competitors…”
Although different managers described the new culture in different ways, they all agreed that the historical values had been gradually and slowly changing. Both the managers who had worked for BA for 20 years and the newcomers shared this view.
“ Customer surveys are more respected”
As a consequence of this new mission the customer Service department was created. Emphasis was placed on marketing activities and the quality of passenger handling was then highly valued compared with before.
As reported by some of the senior managers
“ I’m not certain if there’s a relationship which is that a good culture leads to a successful company, but there is certainly the converse of that, that a successful company leads to a better culture. We are a more successful company now, and as a result of that it’s easier to have a positive culture.”
“ I think the core difference is that when I joined this was a transport business, and I now work for a service industry. “
“ In the late 1970’s it was very controlled, a lot of rules and regulations. It stifled initiative: We have become very free and got more access to our boss.”
“ In terms of both its superficial identity, its self confidence and also the basic service and product, there’s an enormous difference to 10 or 11 years ago. Its management is perceived as more professional and its business is perceived to be more competent and effective. “
“ The company is no doubt changing for the better. I see the organization as having type A (business man) and type B (non business man) people. Type a is increasing in number, but on a very slow basis. Type B are passengers or workers, never managers, they are not thinking about business at all, they are thinking about their own area but not the business as a whole.”
Source: Salama, .A, ‘The Culture change process: British Airways case study’, Cranfield school of management, 1994.

228
Organizational Behavior
Bibliography
1. Kotler, John P, “Changing the culture at British Airways,” Harvard Business School, 1993.
2. Salama, Dr.Alzira, “The Culture change process: British Airways case study,” Cranfield school of management, 1994.
3. Lanning, D.B, “British Airways PLC,” Richard Ivey School of Business, 1994.
4. Earl, W, and Klein, Norman, “British Airways: Using the Information Systems to Better Serve the Customers,” Harvard Business School, 1994.
5. Prokesch , Steven E, “Competing on Customer Service: An Interview with British Airways,” Sir Colin Marshall’, Harvard Business Review, 1995.
6. Jean-Francois and Barsoux, Jean-Louis, “Becoming the World’s Favorite Airline: British Airways 1980-93,” INSEAD-CEDEP, France, 1997.
7. Jean-Francois and Barsoux, Jean-Louis, “Remaining the World’s Favorite Airline: British Airways 1993-97,” INSEAD-CEDEP, France, 1997.
8. Quelch, John A, “British Airways,” Harvard Business School, 1997.
9. Dana, Leo Paul, “British Airways Plc,” Nanyang Technological University, Singapore, 1998.
10. “British Airways takes a Flier,” Fortune, 27th September1999.
11. “Marshall’s Plan,” The Economist, 18th March 2000.
12. “Hemmed in at home,” The Economist, 4th July 2001.
13. “BA,” Marketing; London, 1st August 2002.
14. “BA Downsizes, promises No Layoffs,” Aviation Week and Space Technology, New York, 10th September 2001.
15. Guyon, Janet, “Europe’s dark Skies,” Fortune, 15th October 2001.
16. “To Conserve cash in the airline crisis, British Airlines will eliminate the Christmas bonus for 36,000 employees,” Aviation Week and Space Technology, New York, 15th October 2001.
17. “Ready for Take off,” The Economist, 10th November 2001.
18. Mann, Paul, “Fortunes Plummet at British Airways,” Aviation Week and Space Technology, New York, 12th November 2001.
19. “The unpalatable Truth,” The Economist, 24th November 2001.
20. Grugulis, I and Wilkinson A, “British Airways: Culture and Structure,” Research Series Paper 2001, Loughborough University, 2001.
21. “AA=No-No,” The Economist, 2nd February 2002.
22. Brady, Rose, “Global Wrap up,” Business Week, 25th February 2002.
23. Brady, Rose, “British Airways Retrenches,” Business Week, 25th February 2002.
24. “BA to cut 5800 more jobs,” Air Transport World, Cleveland, March 2002.
25. “BA Opts for PR to Retain full-service ‘premium ‘image,” Marketing, London, 23rd
May2002.
26. “Bad air day,” The Economist, 25th May 2002.
27. Barrie, Douglas, “British Airways Loss Less than Expected,” Aviation Week and Space Technology, New York, 27th May 2002.
28. Hannon, David, ‘British Airways Flies towards $996 million savings goal’, Purchasing; Boston, 15th August 2002.
229
British Airways: Leadership and Change
29. Finn, Widget, “Air of Uncertainty,” Director; London, August 2002.
30. Palthe, Jennifer, “Organizational Culture and Change at British Airways,” HatworthCollege of Business, 2002
31. Jean-Francois and Barsoux, Jean-Louis, “Flying into a Storm: British Airways 1996-2000,” INSEAD-CEDEP, France, 2002.
32. Schubert, Stephan, “Value Creation in a Turbulent Industry: the case of British Airways and the European Low-Cost Carriers,” Audentia Nantes School of Management, 2002.
33. British Airways Annual Report and Accounts, 2001 / 2002
34. “Travel Brief – British Airways: Carrier Swings to a Net Profit But Warns of Flat Revenues,” Wall Street Journal; New York, 11th February 2003.
35. Clark, Andrew, “BA sees zero growth Ahead,” The Guardian; Manchester (UK), 11th
February 2003.
36. “Preparing for War”, The Economist, 13th February 2003.
37. FT.com, “Eddington lays out his survival strategy”, By Kevin Done, Aerospace Correspondent, 14th March 2003.
38. “BA goes for Job cuts as Airlines Sector Tackles Record Slowdown,” Financial Express,27th March 2003.
WEBSITES
1. www.britishairways.com
2. www.hoovers.com
3. www.wally.rit.edu
4. www.hoovers.com
5. www.ft.com
6. www.forbes.com
7. www.asiatraveltips.com

Fall of Arthur Andersen
“They [Andersen] can never clear their name. In the court of public opinion, they
have been tried, convicted and hanged. After WorldCom, there was just nothing you
could say.”
- Lynn Turner, Former Chief Accountant, Securities and Exchange Commission (US), in June 2002.
GRACE TO DISGRACE
In March 2002, Andersen (previously Arthur Andersen), one of the world’s leading audit firms, was indicted by the US Department of Justice (DOJ) on charges of obstructing the course of justice in the Enron (one of Andersen’s clients) case. DOJ claimed that Andersen shredded many Enron-related documents, while Enron was being probed by the Securities and Exchange Commission (SEC)1. Enron, which had filed for bankruptcy in December 2001, was being investigated for illegal accounting practices.
DOJ had begun a criminal investigation into Andersen in January 2002 in connection with the Enron case. All along, the media and Andersen employees had expected the firm to reach out of court settlement with DOJ. However, such a settlement did not materialize. DOJ’s investigation revealed that Andersen had deliberately destroyed crucial documents relating to Enron during October-November 2001. This revelation and the fact that the firm had been embroiled in many controversies during the late 1990s destroyed all chances of an out of court settlement and led to the indictment.
Through the late-1990s, Andersen’s name had figured prominently in various instances of business fraud by its clients, namely, Sunbeam, Waste Management Inc., Quest Communication, Global Crossing, and Baptist Foundation of Arizona.2 The firm faced civil charges for its supposed misrepresentation of accounts in most of these cases. The audit partners, who were involved in the audit of these companies were indicted and penalized by the SEC. In many of these cases, Andersen had settled investor claims, without acknowledging any fraud on its part (Refer Exhibit I for the settlements).
Following the indictment by the DOJ, many of Andersen’s clients as well as employees left; the remaining employees took to the streets, protesting the DOJ’s decision. They said that punishing the whole firm and its thousands of employees for the wrongdoings of a handful of corrupt partners was not justified. As negative publicity for Andersen mounted, it seemed certain that the firm would never be able to do business the way it had for over eight decades. Industry observers remarked that it was indeed painful watching the accounting firm that had set the standard for honest and law-abiding accounting in the US fall from grace.
1 SEC is the primary regulatory body of the US securities market. It works in close association with many other institutions such as the Congress; federal agencies and departments; state securities regulators; self-regulatory organizations such as stock exchanges; and other private regulatory bodies. The primary mission of the SEC is to protect and maintain the integrity of the securities market and to ensure that public companies disclose comprehensive financial and other information to the public.
2 Even in the 1980s, Andersen had been criticized for its failure to locate fraudulent practices at De Lorean, a leading car manufacturer in the US. In 1985, the firm also got involved in a dispute with the US government over this issue, following which the government barred it from auditing government firms for 15 years. However, in 1997, a special committee assessed the De Lorean case again and lifted the ban.

231
The Fall of Arthur Andersen
BACKGROUND NOTE
In 1913, Arthur Andersen (Arthur) and Clarence Delaney founded Andersen in Chicago. The firm was initially named Andersen, Delaney & Co., and was engaged in offering accounting services to companies. Andersen was essentially a partnership firm, with all the chief auditors having a share in the firm. The firm changed its name to Arthur Andersen (Andersen) in 1918.
Arthur gave a lot of importance to ethical values and insisted on honest accounting and the elimination of conflicts of interest in auditing the firms. During the late 1920s, because of the depression in the US economy, many investors lost faith in companies. Reportedly, Andersen, under the leadership and guidance of Arthur, was instrumental in restoring the faith of US investors in companies based on its integrity and high professional values.
Arthur also focused on creating a firm with its own set of business standards. His emphasis on ‘Arthur Andersen specific’ business standards evolved into the concept of ‘One Firm’ over the years. This concept ensured that all Arthur Andersen clients across the world received the same quality of work, the same kind of approach to work, and the same caliber people trained in the same way. Such consistency in offering services and quality was achieved by imparting rigorous training to all new recruits. The training sought to help new recruits imbibe the Arthur Andersen culture, popularly known as the ‘Andersen Way.’
After Arthur’s death in 1947, Leonard Spacek (Spacek), a partner in the firm, became the CEO. Spacek too decided to take the firm forward on the basis of the values that Arthur believed in. By the early 1950s, the culture of ethics and honesty was so deeply ingrained in the firm that the firm was elected to the Accounting Hall of Fame of Ohio State University in 1953.
In the early 1950s, realizing the potential of technology, especially computer technology, Andersen began investing in the same. By the mid-1950s, Andersen was offering consultation and installation services through its new Administrative Services Division. During the same period, the firm also went in for overseas expansion. The firm’s credibility continued to grow, and by the late 1950s, it seemed to have become a matter of ‘honor’ for every accountant in the US to join Arthur Andersen. This was primarily because more than a job, Arthur Andersen offered its employees ‘a way of life.’ The media often referred to it as an extraordinary organization, a great American Brand.
Andersen’s consulting activities soon expanded from technology to other areas of management. During the early 1960s, the consulting group was renamed ‘Management Information Consulting Division’ (MICD) to reflect the wider scope of its activities. During the late 1960s, the demand for computers increased drastically, thus increasing the demand for the services of the consulting group.
In 1977, Andersen decided to create a new structure to integrate its various international offices. It established Arthur Andersen Worldwide, under Arthur Andersen & Co. Societe Cooperation, a Swiss umbrella organization. Meanwhile, the consulting group of Andersen was generating huge profits, and the consulting group partners were unhappy with their position in the firm, which was dominated by the audit partners. Reportedly, despite the fact that the consulting partners were earning higher revenues than the audit partners, they were still looked down as number two in the firm and were required to report to audit partners. This led to serious differences between the audit and consulting groups.
In 1987, the consulting group changed its name from MICD to Andersen Consulting. Two years later, the audit group agreed to spin-off the consulting group as an independent division. However, this agreement included a clause, which stated that the group, which earned more, would have to contribute upto 15% of its earnings to

232
Organizational Behavior
the other group. At the time of the agreement the revenues of the consulting group accounted for over 40% of the firm’s total revenues ($2.8 billion).
In early 1990, seeing the potential of consulting services, the audit group entered the consulting business, by launching the Technology Consulting Group. To avoid clashes between the two groups, the audit group formally agreed to confine itself to clients with revenues below $175 million, for technology consulting services. In 1994, Andersen Consulting’s revenues equaled the total Andersen revenues for the first time (50% of total revenues), and continued to grow. Following this, the consulting partners began to see their auditing partners as a strain on their profits as they had to contribute 15% of their revenues to the audit group.
By the mid-1990s, the audit group’s consulting division was posting high margins. Inspired by this and seeing more potential in the market, the audit group began offering other business consulting services and changed the name of its consulting group to Business Consulting Group. This move increased the tension between the two groups. Finally, Andersen Consulting filed for arbitration, as required by the partnership deed, to separate from Andersen Worldwide.
As per the arbitration ruling delivered in August 2000, Andersen Consulting was made independent of Andersen Worldwide and was required to pay $1 billion to Andersen Worldwide as compensation for its freedom. Andersen Consulting was also required to remove ‘Andersen’ from its name, following which it was renamed ‘Accenture.’
The decade of the 1990s saw vast changes in the business world. During this period, the US economy grew at a rapid pace and companies competed fiercely for market share. The concept of paternalism was on the decline and lay-offs became common, with companies cutting costs and increasing productivity to improve profitability. Companies in the US made huge profits and there was an astronomical rise in the remunerations of key executives, who were instrumental in drastically increasing the profitability of their companies.
By the mid-1990s, the partner base of Andersen totaled 1,835 and the ratio of partners
to staff was large. This resulted in low income per partner, and pressure on the
partners to increase revenues and profits. Reportedly, the pressure on the audit group
was severe given the increasing competition. The fact that the Andersen Consulting
partners looked down on the audit partners because they (consulting partners)
generated higher revenues, added to this pressure. Reportedly at that period, the audit
partners could not afford to reject their clients even though the clients were involved
in numerous illegal activities.
By the end of the 20th century, Andersen had more than 100 member firms across 83
countries and a vast employee base of 77,000. The various services offered by
Andersen at that time included Assurance and Business Advisory Services, Global
Corporate Finance and Tax services and, Business Consulting and Business Advisory
services (See Exhibit II). In March 2001, the firm changed its name to Andersen from
Arthur Andersen as required by the court after the separation of the consulting group
from the firm.
Under Berardino’s leadership, in early 2001, Arthur Andersen began taking on ‘new
economy’ clients, who took high risks to earn higher returns by making massive
acquisitions within short periods. This move was in line with the ‘Emerging 10’
strategy announced back in 1999, which aimed at taking fast-growing entrepreneurial
companies as clients. The firm’s decision to focus on clients such as Enron, Global
Crossings and Worldcom was a part of the above strategic plan. In 2001, as
Andersen’s revenues touched new heights ($9.3 billion), perhaps not many would
have foreseen the catastrophe that was about to strike the firm.

233
The Fall of Arthur Andersen
THE FALL – WAS ANDERSEN GUILTY?
In October 2001, Enron, a leading energy trading company in the US and one of the biggest clients of Andersen, announced its third-quarter results for 2001. The third-quarter results included a loss of $638 million, a $35 million write-down due to losses on its partnerships, and a decrease in shareholder’s equity by $1.2 billion. This announcement led to a sharp decline in the stock price of Enron (40%). Following this, suspecting Enron of financial misappropriations, the SEC launched an investigation into Enron’s financial dealings in late October.
The investigation revealed serious accounting misappropriations by Enron between 1996 and 2001. In November 2001, Enron restated its financial statements for the years, 1997 to 2000 and for the first two quarters of 2001, and reported a loss of $586 million for that period. According to reports, Enron had huge accumulated debts on account of its dubious financial dealings with its partners and had even traded its shareholders’ equity. Following this, many shareholders filed suits against Enron, charging it with fraud and misappropriation of shareholder equity and claimed compensation. This crisis led to a steep decline in the stock price of Enron during the period. In December 2001, Enron filed for bankruptcy. The collapse of Enron was the biggest corporate failure in the US so far (Refer Exhibit III for a note on the Enron debacle).
Andersen, which had been, both, the external and the internal auditor of Enron during the period Enron manipulated its financials,3 was severely criticized for its failure to spot the irregularities. In December 2001, in a statement given to the US Congress, Andersen executives involved in the Enron audit blamed Enron for withholding crucial financial data. They claimed to have warned Enron executives of ‘possible illegal acts’ when they came to know that the company had withheld crucial financial information. Berardino said that Enron’s failed business model, not Andersen’s accounting practices, was responsible for its downfall.
The DOJ’s criminal investigation into Andersen, begun in January 2002, was aimed at accumulating proof against Enron, and at finding out the extent of Andersen’s involvement in the irregularities. When it was discovered that Andersen had shredded many Enron-related documents, even the firm’s staunch supporters were taken aback. According to an article, “The shredder at the Andersen office at the Enron building was used virtually constantly and, to handle the overload, dozens of large trunks filled with Enron documents were sent to Andersen’s main Houston office to be shredded. A systematic effort was also undertaken and carried out to purge the computer hard-drives and email system of Enron related files. In London, a coordinated effort by Andersen partners and others, similar to the initiative undertaken in Houston, was put into place to destroy Enron-related documents within days of notice of the SEC inquiry.”4
The investigation also revealed that Nancy Temple (Temple), an in-house attorney at Andersen, sent a series of e-mails to partners at the Houston office, involved in Enron auditing, in October 2001, reminding them to comply with the firm’s document destruction and retention policy. The policy reportedly required all Andersen offices to destroy unnecessary information on their clients and retain only the most necessary information on them, on completion of a client’s job. The aim of this policy was to prevent data overload at Andersen.
Accepting the charge that Enron related documents had been destroyed, Andersen held David Duncan (Duncan), the chief auditor for Enron, responsible for shredding the documents. Though Duncan claimed that he was merely complying with the
3 Arthur Andersen had been the external auditor of Enron since the 1980s. It had taken up the internal audit responsibilities of the company in the mid-1990s.
4 www.accountancyage.com, April 5, 2002.

234
Organizational Behavior
document retention policy of Andersen, he was fired in January 2002. Commenting on this Berardino said, “What was done was not in keeping with the values and heritage of this firm. It was wrong. There’s no other word for it. But 85,000 people did not work on the Enron engagement; 85,000 people did not destroy documents. And 85,000 people did not encourage anyone to destroy those documents. We are going to hold people accountable. And we will make it clear that this behavior will not be tolerated.”5
Public outrage at Andersen’s actions intensified as details of its role in the bankruptcy became known. Media reports criticized the firm for not fulfilling its duties as an auditor. According to an article, “Andersen did not fulfill its professional responsibilities in connection with its audits of Enron’s financial statements, or its obligations to bring to the attention of Enron’s Board concerns about Enron’s internal controls over the related-party transactions.”6 Meanwhile, not only did Enron sever its ties with Andersen, many Enron investors too filed suits against the firm, claiming compensation.
In an attempt to restore its reputation, in February 2002, Andersen hired Paul Volcker (Volcker), a former Federal Reserve Board chairman, to lead an independent group to put in place reform measures and make fundamental changes to the firm’s existing business model. However, in early March, it was reported that Volcker was finding it difficult to persuade the partners to agree to his plans. According to Barbara Toffler (Toffler) in ‘Final Accounting’, “The Volcker plan could have been great. Andersen could have been ‘scared straight.’ But they did not want to change how they did business.”
The repercussions of the above soon led to the exodus of clients, especially in the US, from Andersen to other firms in early 2002. Andersen lost 690 clients (public limited companies) between January 2002 and March 2002, against its public limited company client base of 2,311 in December 2001. Some of the major public limited clients that left Andersen included United Airlines, Aquila Inc., Costco Cos., Merck & Co. and UnitedHealth Group. Many clients from the private sector, such as Delta, Merck and Freddie Mac, also left the firm. The firm also saw many of its partners leaving to join rival firms. Following this, Berardino resigned, taking the responsibility for the crisis at the firm.
Considering the firm’s dubious activities and the fact it was not ready to acknowledge its guilt, DOJ indicted Andersen in March 2002. As these events unfolded, Andersen was reportedly trying to merge its operations with other audit and consulting firms such as KPMG, Deloitte and Ernst & Young in different parts of the world. Andersen also began laying-off employees in huge numbers across the world. Its US employee base came down from 27,000 to a little over 10,000.
THE FALL – NAILING ANDERSEN
In April 2002, Duncan pleaded guilty to the charge of obstruction of justice (by shredding documents) and agreed to cooperate with the DOJ and testify against Andersen. Duncan testified that though at first the Andersen audit team had known about certain accounting errors at Enron, it did not force Enron to reflect it in its financial statements. This was because the team found that amount to be negligible compared to the company’s vast revenues and shareholders’ equity. However, in mid-2001, the team changed its mind and forced Enron to write-down $1.2 billion in shareholders’ equity and asked it to attribute the write-down to an accounting error. Commenting on this, analysts felt that Duncan had been willing to play the same game
5 www.guardian.co.uk, January 29, 2002. 6 Final Accounting, Barbara Ley Toffler, with Jennifer Reingold.

235
The Fall of Arthur Andersen
his colleagues played at Waste Management and at other companies, ‘Let it go and hope it fixes itself later.’7
Duncan also testified that the e-mail from Temple influenced his team to shred Enron-related documents and e-mails. In that e-mail, Temple asked Duncan to change an earlier internal memo written in mid-October, regarding advice given to Enron about its third-quarter earnings for 2001. In the earlier memo, Duncan had stated Andersen’s objections to the way Enron was preparing its financial report for the third quarter of 2001. Reportedly, Duncan had advised Enron not to use the term ‘non-recurring’ for $1 billion charges against income it was about to announce in third quarter since it could violate Generally Accepted Accounting Principles (GAAP).
According to prosecutors, Temple was aware of the accounting misappropriations and the fact that it could attract SEC’s attention. Her e-mail mentioned the need to protect Andersen from potential section 10A issues, which required auditors to report the improper actions of their clients. Temple indirectly asked Duncan to alter the internal memo to protect the firm from litigation as she suspected an SEC investigation into Enron. Commenting on the influence of Temple’s e-mail on him and his team, Duncan said, “Obviously, the thought of litigation, whether that be of SEC or some other kind, was on our minds.”
The trial began in early June 2002. The prosecutors were required to prove that Andersen deliberately destroyed Enron related documents and e-mails with the intent of obstructing the course of justice. During the course of the trial, prosecutors focused on Duncan’s orders to shred documents and Temple’s e-mails to various Andersen offices reminding them of the document destruction and retention policy and e-mails suggesting a possible official enquiry into Enron documents.
Finally in mid-June 2002, the jury announced its verdict: it held Andersen guilty for obstruction of justice. The DOJ’s judgment was due in October 2002. The SEC revoked Andersen’s license to audit public limited companies and ordered the firm to pay a fine of $1,000 for obstructing state investigation (this was the highest fine a state board could charge).
The jury’s verdict was based less on document shredding and more on Temple’s e-mail to Duncan on October 16, 2001. Reportedly in that e-mail Temple also pressed Duncan to remove her name from the final memo because, in her words, “It increases the chances that I might be a witness, which I prefer to avoid.”8 Commenting on this, jurors said that Temple’s suggestion to change the memo, demand the removal of her name, and mention SEC issues convinced them that the firm was guilty. Commenting on this a member of the jury said, “It’s against law to alter that document with the intent to impair the fact-finding ability of an official proceeding.”9
Following the verdict, Andersen announced that it would stop auditing corporate clients by August 2002. Then the company received another blow: the SEC announced accounting irregularities at another company in June 2002. The company, WorldCom, was one of the leading telecom companies in the US and one of Andersen’s most valuable clients.
In late June 2002, the company admitted that it had resorted to fraudulent accounting practices for five quarters (four quarters of 2001 and the first quarter of 2002).10
WorldCom filed for bankruptcy in July 2002, becoming the largest ever company to do so. By late 2002, the misrepresentation in its financial statements was estimated to be well over $9 billion. Though Andersen was already headed for closure, the
7 Final Accounting, Barbara Ley Toffler, with Jennifer Reingold. 8 Houston Chronicle, June 19, 2002. 9 Final Accounting, Barbara Ley Toffler, with Jennifer Reingold. 10 In 2001, WorldCom fraudulently reported $ 2.393 billion in income before taxes instead of its
actual loss of $ 662 million. According to SEC, in the first quarter of 2002 also, WorldCom incorrectly reported income before taxes of $ 240 million, instead of a loss of $ 578 million.

236
Organizational Behavior
WorldCom debacle came as a severe blow. Now it could not easily dismiss the Enron episode as just an aberration. Nevertheless, Andersen again tried to deny any role in the crisis and claimed that it was not aware of the accounting discrepancies.
The firm accused WorldCom’s Chief Financial Officer, Scott Sullivan (Sullivan), for
withholding crucial information about accounting practices at WorldCom. However,
this time there were no takers for this argument. Analysts remarked that the
manipulation of WorldCom’s accounts should have been evident to Andersen’s
auditors as the concept involved in the manipulation was so fundamental. Roman
Weil, Professor, University of Chicago Graduate School of Business, said, “It is basic
accounting stuff. An auditor who looked into this would say it is wrong. Andersen
said it was not consulted. Who knows?”11
The Enron and WorldCom debacles raised many questions in corporate and media
circles about the role of auditors. Accounting improprieties, involving one of the most
prestigious audit firms, seemed to have undermined the confidence of investors and
raised doubts about the reliability of the financial statements made by companies. The
Enron and WorldCom cases sparked off debates about the responsibilities of auditors.
THE DEBATE ON THE ROLE OF AUDITORS
During the 1990s, audit firms tended to become business consulting firms which also did auditing. This shift in focus from auditing to consulting had a negative impact on the business of audit firms because their consulting services created certain problems. As most of the audit firms were partnership firms, they lacked the leadership necessary for coping with rapid growth.
The partnership model did not suit the expanding consulting business model. It resulted in a lack of proper span of control as all partners had equal control over the firm. This in return resulted in lack of effective communication channels that led to huge gaps in communication between the partners working on various projects. In the absence of a clearly defined span of control, partners worked independently and sometimes gave in to their personal weaknesses. Analysts felt that this was one of the reasons for the deterioration of values at audit firms and one of the major reasons for Andersen’s unethical actions.
Analysts felt that performing various roles for their clients (as consultants, for instance) made auditor-client relationships very strong. As a result, auditors neglected their responsibilities towards investors and failed to inform them of the company’s true financial position. By offering risk management and litigation support services along with audit services to its clients, Andersen landed itself in this very problem. Moreover, since Andersen offered both, audit and consulting services (especially financial consulting services), a conflict of interests became unavoidable.
Industry observers felt that by offering internal as well as external audit services to the same client, audit firms like Andersen started a rather unhealthy trend. This led to many problems such as mistakes unnoticed by one audit going unnoticed in the next audit as well; thus defeating the purpose of having two audits. Also, analysts felt that this practice gave auditors the opportunity to manipulate the accounts in accordance with their clients’ wishes. The high remunerations offered by the companies to auditors also affected their loyalties: the companies’ interests mattered more to them than the investors’ interests. Reportedly, Andersen received $52 million in 2001 ($25 million as audit fee and the remaining as consulting fee) from Enron; very high according to industry standards.
11 www.chron.com, June 27, 2002.

237
The Fall of Arthur Andersen
Another unhealthy practice that had entered in the auditing business was the unethical
selling of consulting services to clients. At Andersen, audit partners were expected to
extend the scope of their work at the client company and ‘induce’ a need for their
consulting services. Andersen too emphasized on selling consulting services to clients
and rewarded auditors who brought in more clients and revenues irrespective of their
auditing skills. According to Barbara Ley Toffler (Toffler), a former partner at
Andersen, partners were expected ‘to create needs [for consulting services] that do not
exist in the client company, then provide the services to meet those needs, turn
partners into salespeople instead of careful analysts, and pray to the God of
revenue.’12
The practice of auditors retiring and moving on to the boards of companies had also
become a cause for concern. According to analysts, many audit firms had their former
audit partners on the boards of their client companies. As a result, auditors, on account
of their relationship with their former partners, did not strictly adhere to audit rules
when any misappropriation was located. Reportedly, more than half of Waste
Management’s top management consisted of former Andersen partners. This
unhealthy relationship between the auditors and their client contributed to Waste
Management’s eventual bankruptcy and indictment for fraudulent financial practices.
Analysts expressed distress and alarm over the changed attitude of auditing firms,
where revenues mattered more than ethics and integrity. During the 1990s, auditors
seemed to be ignoring their responsibilities towards investors and instead helping
clients attain their selfish aims and helping themselves to huge payments. However,
greed (client’s as well as auditor’s) was not the only factor underlying the
degeneration of values at audit firms.
The accounting methods being used by the audit firms for many decades had become
obsolete. As a result, they did not suit the business and economic structures of modern
organizations. According to Barry Melancon, a member of the American Institute of
Certified Public Accountants (AICPA),13 “We need to move accounting from an
industrial age model to an information age model.”14 Analysts remarked that it was
highly impossible for a company or an investor to get a true picture of a company’s
financial condition, using traditional accounting techniques.
The role of auditors has always been an uncomfortable one: they have to judge the
financial integrity of clients who are paying them. In the 1990s, as companies in the
US came under pressure to show high profits and an increase in stock prices, many
companies began to manipulate their accounts. Some auditor firms co-operated with
these companies and in exchange received high remunerations. The fear of losing their
clients to such audit firms and the greed for money forced other audit firms also to
play along.
12 Final Accounting, Barbara Ley Toffler, with Jennifer Reingold. 13 AICPA is the national professional organization for certified public accountants (CPAs) in
the US. Its mission is to provide its members with the resources, information and leadership to help them offer valuable audit services of the highest order, benefiting both the investing public and their clients. AICPA’s functions include serving as a national representative of CPAs before the government and other regulatory boards, offering certification and licenses to qualified CPAs, setting professional standards and monitoring the performance of CPAs to ensure they meet the professional standards and values.
14 www.marcusletter.com, mid 2002.

238
Organizational Behavior
THE AFTERMATH
In August 2002, Andersen Worldwide, the parent company of the US-based
Andersen, agreed to pay claims worth $60 million to Enron shareholders and creditors
(against claims of over $25 billion). Andersen Worldwide also stated that it was not
responsible for the deeds of Andersen (US), as Andersen (US) operated as an
independent division.
In October 2002, Andersen received the DOJ verdict: the firm was given the
maximum court sentence (in such cases) of five years probation on its US operations
and a $500,000 fine for altering evidence of its Enron work. Commenting on the
verdict, Rusty Hardin, Andersen’s lawyer, said that Andersen would appeal the ruling
as it had not committed any crime.
The verdict seemed to be a formality since the firm had already become inoperative in
the US and had merged its worldwide operations with other firms. By the end of
August 2002, all Andersen offices in the US were closed, its assets sold off, and
employees laid off. Once regarded as the most trustworthy audit firm in the US,
Andersen was forced by circumstances to wipe out the very traces of its very
existence. Commenting on this, Robert Mintz, a New Jersey-based attorney, said,
“This is a case where the execution was carried out well in advance of the sentencing,
so there’s not much left for the sentencing judge to do.”15
Commenting on the pitiful end of Andersen and the corporate scams across the US in which auditors were involved, analysts urged audit firms to revise their standards and code of ethics. In mid-2002, leading firms PricewaterhouseCoopers, Ernst & Young and Deloitte & Touche announced that they would no longer provide internal audit services to their external audit clients. This move was seen as an attempt to restore the integrity of the accounting profession.
Robert Herdman, Chief Accountant, SEC, admitted that intricate accounting norms in the US were also in part responsible for the Andersen debacle. Analysts felt that these norms needed to be altered to suit contemporary business models and that various complexities and loopholes needed to be removed to prevent companies or auditors from taking advantage of them. The SEC and AICPA had already taken some initiatives (during mid 2002) to exercise more control over corporate accounting practices (Refer Exhibit IV for details). Analysts also felt that government and audit authorities needed to reform audit practices in the country and exercise strict control over auditors (Refer Exhibit V for guidelines to improve audit practices).
To curtail the growing number of corporate frauds, the US government passed ‘The Sarbanes-Oxley Act of 2002.’ The Act, which represented some of the most substantial changes in the history of federal securities laws, imposed strict rules on publicly traded companies. The objective of the Act was to prevent fraud in the management and accounting of a public company (Refer Exhibit VI for details of the Sarbanes-Oxley Act 2002). Industry experts hoped that such reforms would restore the trust of the investors in audit firms and companies – and that perhaps these reforms would be one of the positive outcomes of the Andersen saga.
Questions for Discussion:
1. Briefly comment on the evolution of Arthur Andersen into a trusted and respected accounting firm. Critically examine the reasons that led to a change in the firm’s professional values during the 1990s.
15 www.chron.com, October 16, 2002.

239
The Fall of Arthur Andersen
2. Comment on the role of Andersen in the fall of Enron. How did the Enron debacle affect Andersen? Whom do you hold responsible for the fall of Andersen? Justify your stand.
3. Critically comment on the dubious practices of audit firms during the 1990s and early 2000s. Whom do you hold responsible for the deteriorating value system of audit firms during the 1990s? Justify your answer.
4. Critically examine the initiatives taken by the government and other regulatory bodies to improve audit practices in the US. Do you think these initiatives would restore the trust of investors in audit firms? Suggest some ways in which audit firms could restore their reputation.
© ICFAI Center for Management Research. All rights reserved.

240
Organizational Behavior
Exhibit I
Settlement of Claims by Arthur Andersen
Sunbeam Inc., a leading appliance maker and an Andersen audit client, was sued for accounting fraud during the late 1990s. Reportedly, one third of Sunbeam’s profits in 1997 were the result of accounting fraud. The company filed for bankruptcy in 2001. Andersen paid $110 million in early 2001 to settle (without admitting legal responsibility) a class action suit by shareholders of Sunbeam, involving ‘misstated’ corporate financial statements in the 1990s.
Waste Management Inc., a garbage management firm, which had been one of the hottest stocks of the 1970s and 1980s, was sued for accounting fraud during the late 1990s. Andersen had been its auditor for more than 25 years. Reportedly, Waste Management was involved in an accounting fraud of over $1.4 billion during the mid-1990s. Andersen paid $7 million in June 2001 to settle allegations arising from an audit of Waste Management.
Andersen paid $90 million to investors and $2.5 million to the state of Connecticut to settle allegations that the firm knowingly approved inaccurate forecasts by Colonial Realty, involved in real estate ventures in Hartford. At the same time, state officials said Andersen auditors took cash, trips and other gifts from Colonial executives. Investors lost more than $300 million.
Andersen paid the state of Ohio $5.5 million to cover taxpayers’ losses on insured deposits at the failed Home State Savings Bank to settle allegations that it was negligent in reviewing the bank’s books.
Andersen agreed to at least $24 million in settlements over allegations that it misrepresented the financial health of Arizona-based American Continental Corp. and its subsidiaries, which included Charles Keating’s failed Lincoln Savings & Loan.
Source: www.nupge.ca
Exhibit II
Consulting Services of Arthur Andersen
Consulting services offered by the Business Consulting Group ranged from strategy, reorganization and finance solutions to the design and implementation of IT systems.
Strategy and Organization Solutions: Developing and implementing organizational strategies including mechanisms for controlling; delivery of strategic goals such as balanced scorecard; and analyzing and implementing organizational structures, for instance, strategy implementation, restructuring or post-merger integration.
Finance Solutions: Solutions for optimizing the management of the financial resources of a company. Implementing activity based costing and budgeting solutions as well as optimizing the processes and organization of the finance function itself.
Customer and Channel Solutions: Solutions related to the evaluation, design and implementation of processes and technologies for the customer management activities of a company, such as customer and channel strategies, contact centers and customer relationship management.
Oracle Enterprise Applications: Solutions related to information technology strategies and the selection and implementation of enterprise resource planning (ERP) systems. Installation of Oracle Applications.
Technology Integration Services: Solutions focused on Business Intelligence (including MIS, EIS and data warehousing), IT Strategy and Applications Architecture (including software selection processes, project and program management, Quality Assurance and Risk Management), WWW solutions and Content Management, Enterprise Application Integration and Software Engineering.
Source: www.andersenbc.com

241
The Fall of Arthur Andersen
Exhibit III The Enron Debacle
Enron was formed in July 1985 as a result of the merger of US-based Houston Natural Gas and InterNorth, a natural gas company. It was formed with the objective of becoming a premium natural gas pipeline company in the US. In the late-1980s, the company began trading natural gas commodities and expanded its operations to Europe. By 1989, Enron had become the largest natural gas provider in the US and the UK. In the 1990s, Enron expanded its operations across the world with the objective of being the leading energy company in the world.
During the mid-1990s and late-1990s, Enron invested heavily in diversifying into different business areas such as plastics, broadband telecommunications, fertilizers, coal, water, metal and paper. As a result, by 2000, Enron emerged as one of the leading energy, commodity and services companies in the world and reported $101 billion in revenues for the year 2000. During the same year, Enron was ranked 18th in the Fortune 500 list of companies. However, many discrepancies were detected in Enron’s financial statements during mid-2001, which forced the company to file for bankruptcy in December 2001.
According to analysts, many factors contributed to Enron’s downfall. Enron’s rapid diversification into a number of different business areas during the late 1990s put a strain on its finances. In its haste to diversify, the company reportedly made some bad investments, which failed to generate the expected returns and became financial burdens. As Enron had overpaid for some of its overseas investments, it had to cope with huge losses, when these investments failed.
To show a healthy financial picture to investors, Enron decided not to reveal the losses in its financial statements. To conceal these losses, the company entered into numerous offshore partnerships, which bought such troubled investments/companies from Enron by raising money from third parties. This practice helped the company eliminate the losses from its books and instead show profits. But in order to raise the necessary debt (by the partnerships) Enron was forced to provide guarantee to the third party creditors. Such guarantees resulted in a strain on the company’s financials.
Reportedly, Andy Fastow (Fastow), CFO of Enron had been the general manager for two such partnerships, LJM Cayman LP (LJM) and LJM2 Co-Investment LP (LJM2), which were set up to buy Enron’s assets and hedge investments. Fastow was paid an additional $30 million annually for managing LJM and LJM2. Reportedly, between 1997 and 2000, LJM and LJM2 were involved in dubious dealings worth billions with Enron, in which Enron also invested various company assets and company stock. Between June 1999 and September 2001, Enron and Enron-related entities entered into 24 business relationships with LJM1 or LJM2.
The SEC’s investigation revealed that some of Enron’s Special Purpose Entities (SPEs) and partnerships (such as Chevco, LJM1 and LJM2) which should be consolidated into the company’s financials (based on percentage of Enron’s investment in those concerns) were not included in Enron’s financial statements, which led to misrepresentation of Enron’s accounts through 1997-2001, stating profits instead of losses.
Source: Compiled from various sources.
Exhibit IV Sec and AICPA Initiatives
Some of the major initiatives taken by SEC and AICPA are given below.
SEC would be creating new organizations outside the structure of the AICPA to oversee auditors of publicly held companies. A disciplinary board would be created to accelerate the investigation of alleged audit failures and provide more transparency in auditing. The current program of firm-on-firm triennial peer reviews for auditors of publicly traded companies would be replaced by an annual quality monitoring process for the largest firms. A new organization would be created to carry this monitoring. This new body would be given the authority to monitor compliance with SEC audit standards and to refer instances of noncompliance to the disciplinary board. Both new entities would operate outside the profession’s existing self-regulatory structure.
In response to these proposals by the Chairman of the SEC, the members of the Public Oversight Board (POB) announced that it would terminate its existence before March 31, 2002. Until then,

242
Organizational Behavior
the POB acted as a monitoring and controlling board for the peer review, quality control inquiry and the standard setting efforts of the Auditing Standards Board.
AICPA announced that it would allow regulatory bodies and companies to place limits on providing certain non-audit services to public company audit clients.
The AICPA and the 1,200 firms that are members of the AICPA’s SEC Practice Section, put in place improved audit standards for detecting fraud, as well as new measures for deterring fraud such as expanded internal control procedures for management, boards, and audit committees.
AICPA also announced that it would support more extensive changes in its self-regulatory structure.
The AICPA stated that a number of additional reforms needed to be enacted to deter accounting abuses and avoid an Enron-type disaster in the future. These include providing a new and improved financial reporting model suitable for companies of the Information Age for which earning assets are not accurately valued by traditional measures.
Source: www.aicpa.org
Exhibit V General Guidelines to Improve Audit Practices
(As Per A January 28, 2002 Business Week Article) Bar Consulting To Audit Clients: To ensure that there is no conflict of interest between the consulting and audit services.
Mandate Rotation of Auditors: To prevent the development of a close relationship between companies and auditors, which could hinder auditors from making unbiased judgements.
Impose More Forensic Auditing i.e. Auditing in-depth: To ensure that auditors do not miss any underlying problems with a company’s accounts, which might be missed in the usual course of audit.
Prevent Auditors from Joining Companies’ Boards: To ensure that a conflict of interest does not arise between an auditor’s responsibilities and his relationship with his former colleagues. This is also to ensure that auditors remain faithful to their profession and do not get tempted to become as wealthy as their audit clients.
Reform Internal Audit Committees: To ensure that internal audit committees in the companies are given better control and independence to monitor the companies’ accounting practices.
Source: www.businessweek.com
Exhibit VI Brief Summary of Sarbanes-Oxley Act 2000
The Sarbanes-Oxley Act 2002 is enforced with the objective of reducing the occurrence of corporate frauds, which increased considerably during the late 1990s and early 2000 and shattered the lives of millions of investors. The Act aims at preventing management and accounting frauds and improving financial reporting and disclosure by companies by (among other things):
Increasing criminal penalties for corporate wrongdoing;
Increasing disclosure requirements for periodic reports filed pursuant to the SEC, particularly with respect to off-balance sheet liabilities and pro forma financial statements;
Increasing the authority and responsibilities of audit committees and introducing new independent standards for audit committee members;
Creating a new Public Company Accounting Oversight Board;
Creating professional responsibility standards for attorneys;
Accelerating the disclosure of insider trading activities;
The Act also contains provisions for protection against retaliation by public companies, managers or other agents against employees who make public the violation of laws relating to securities or other misdeeds of companies. Any retaliation against such ‘whistle blowers’ might even attract a fine and criminal penalty of upto ten years in prison under the Act.
Source: www.bipc.com

243
The Fall of Arthur Andersen
Additional Readings & References:
1. The Enron Debacle, www.businessweek.com, November 12, 2001.
2. Arthur Andersen's Sorry Record of Big-Time Auditing, www.nupge.ca, January 20, 2002.
3. Andersen Blame Game Heats Up, www.money.cnn.com, January 21, 2002.
4. Accounting in Crisis, www.businessweek.com, January 28, 2002.
5. Tran Mark, Arthur Andersen Appeals for Sympathy, www.guardian.co.uk, January 29, 2002.
6. Miller Alex, Zea Adriana, Andersen and Deloitte in Acquisition Talks,www.accountancyage.com, March 11, 2002.
7. Miller Alex, Andersen Loses Hong Kong and China to PwC,www.accountancyage.com, March 21, 2002.
8. E&Y Takes Andersen in Russia, www.accountancyage.com, March 21, 2002.
9. Wild Damian, Andersen CEO Resigns, www.accountancyage.com, March 27, 2002.
10. Highlights of the Andersen Indictment, www.accountancyage.com, April 5, 2002.
11. Professional Lessons from Andersen’s Fall, www.expressitpeople.com, April 8, 2002.
12. Out of Control at Andersen, www.businessweek.com, April 8, 2002.
13. Arthur Andersen Cuts 7,000 Jobs, www.newsmax.com, April 9, 2002.
14. Miller Alex, Court Shown Revealing Andersen E-mail, www.accountancyage.com, May 22, 2002.
15. Arnold James, Tough Times for the ‘Androids,’ www. news.bbc.co.uk, June 15, 2002.
16. Andersen's Fall from Grace, www. news.bbc.co.uk, June 17, 2002.
17. Flood Mary, Decision by Jurors Hinged on Memo, www.chron.com, June 19, 2002.
18. Fowler Tom, Andersen Guilty, www.chron.com, June 19, 2002.
19. Carpenter Dave, Andersen's WorldCom Story Similar to Enron Excuse, www.chron.com, June 27, 2002.
20. The Andersen Files, www.news.bbc.co.uk, July 22, 2002.
21. Arthur Andersen Loses its Texas Accounting License, www.chron.com, August 16, 2002.
22. Fowler Tom, Andersen Worldwide to settle for $60 Million, www.chron.com, August 27, 2002.
23. Andersen's Last Auditing Hours, www.news.bbc.co.uk, August 30, 2002.
24. A Final Accounting, Chicago Tribune, September 1, 2002.
25. Akar Katie, May Bonnie, Price Kim Wrunk Jay, An Ethical Analysis of Corporate Conduct at Arthur Andersen LLP, www.moceyunas.com, September 28, 2002.
26. Flood Mary, Fowler Tom, Arthur Andersen Gets the Maximum Sentence,www.chron.com, October 16, 2002.
27. The Andersen Verdict and the Rush to Judgment, www.marcusletter.com.
28. Norris Floyd, Audit Industry Faces Tough Road to Reform, www.chron.com.
29. www.andersenbc.com
30. www.thelenreid.com
31. www.bipc.com

Reorganizing ABB – From Matrix to Customer-Centric Organization Structure
(A)“This is an organization that fosters sharing and collaboration between its operations in different parts of the world and links closely with clients, suppliers and the countries where it is present. Its combination of multi-domestic local presence and coordination by means of a global matrix organization is a unique response to the ‘think global, act local’ imperative.”1
Kevin Barham and Claudia Heimer on ABB2.
INTRODUCTION
For the financial year 2001, Zurich, Switzerland-based Asea Brown Boveri Limited (ABB), one of the world’s leading multinational companies, reported it’s first-ever loss of $691 million in its 14-year post-merger record. For the financial year 2002, ABB reported a bigger loss of $787 million representing a 14% increase in losses compared to 2001 (Refer Exhibit I). Moreover, there was also a fall in revenue by 23 % compared to 2001. For the nine month period ended September 2002, ABB reported a pre-tax profit margin of just 2.5%, which was significantly lower than that of its European competitors – France-based Schneider3 (8%), and the UK-based Invensys4 (10%).
Analysts felt that poor strategic decisions taken by the top management of ABB and
HR-related problems arising due to frequent changes in the organization structure
were some of the reasons for the poor financial performance of ABB. They also felt
that the frequent changes in the leadership of ABB during the late 1990s and early
2000s made matters worse for the company.
From 1988 to 2002, ABB had four CEOs – Percy Barnevik (1988-96), Goran Lindahl
(1997-2001), Jorgen Centermann (2001-02) and the current CEO Jurgen Dormann
since September 2002. During this period, the organization structure of ABB was
changed three times5. The matrix structure of Percy Barnevik (Barnevik) was
restructured by Goran Lindahl (Lindahl). Jorgen Centerman (Centerman) changed
ABB’s organization structure once again, replacing it with his own customer-centric
model, while Jurgen Dormann (Dormann) intended to consolidate ABB’s core
businesses, undertaking yet another revision in the organization structure of ABB.
1 As quoted in the book, “ABB – The Dancing Giant: Creating the Globally Connected Corporation,” written by Kevin Barham and Claudia Heimer.
2 ABB is a global electrical engineering group having business interests in electrical power technologies, automation technologies, and oil, gas and petrochemicals business.
3 Schneider is one of the world’s leading manufacturers of equipments for electrical distribution, industrial control and automation. It has operations spread across 130 countries.
4 Headquartered at UK, Invensys is a global electronics and engineering company. The company has four divisions -- Production Management, Energy Management, Development (Rail Systems, Wind Power, and Power Components), and Industrial Components and Systems.
5 A detailed description of the organizational restructuring undertaken by Lindahl, Centerman and Dormann, and their implications for ABB, is covered in the ICMR case study, “Reorganizing ABB – From Matrix to Customer Centric Organization Structure (B).”

245
Reorganizing ABB – From Matrix to Customer-Centric O i ti St t (A)
THE MATRIX STRUCTURE
ABB was formed on January 5, 1988, as a result of the merger between Sweden-based
engineering group, Asea AB, and Switzerland-based Brown Boveri Limited. Both the
companies had a history of around 100 years and were major competitors in the
electrical equipment market in Europe. Barnevik took over as the CEO of ABB,
headquartered at Zurich (Switzerland).
Given the massive size of ABB’s operations, the challenge for Barnevik was to create
a structural framework into which its worldwide activities could be integrated.
Barnevik intended ABB to be “global and local, big and small, radically decentralized
but with central control.”6 In an attempt to achieve this objective, he created a matrix
structure.
THE TOP MANAGEMENT LEVEL
The matrix structure consisted of four management levels, with clearly defined
responsibilities at each level (Refer Exhibit II). The first or top level of the matrix
structure consisted of the Group Executive Management (Refer Exhibit III), whose
members included the President & CEO – Barnevik, Deputy CEO and eleven ABB
Executive Vice Presidents (EVPs). The primary task of the Group Executive
Management (GEM) was to devise global strategies and periodically review the
performance of ABB’s eight business segments spread over 28 business regions. The
members belonged to different nationalities and met once every three weeks to discuss
business developments.
A few members of the GEM were assisted by the corporate staff in certain specified
fields, which included audit, corporate control, corporate development, corporate
finance, information, insurance and risk management, investor relations, legal affairs,
management resources, marketing, public finance, purchasing and export control, real
estate, corporate research, taxes and customs and technology. The allotment of
corporate staff to the EVP’S was based upon the requirements of the business segment
headed by them. For example, Lars Thunell, who headed the financial services
business segment, was assisted by corporate staff in the fields of corporate finance,
insurance and risk management, investor relations, and project finance.
ABB’s operations were divided into eight business segments (Refer Table I). The
eight business segments were further divided into fifty business areas. Each business
area focused on a specialized activity pertaining to the business segment to which it
belonged. For example, the power transmission business segment comprised the
business areas such as switchgear, power transformers, distribution transformers and
electrical metering. The business areas were headed by business area managers.
In 1988, ABB’s operations were spread across 140 countries, broadly categorized into
five geographical groups – Western Europe – European Community, Western Europe
– European Free Trade Area, North America, Asia & Australia, and Others. These
five geographical groups were further divided into 28 business regions (Refer Exhibit
III).
6 As quoted in the book, “Managing across borders,” by Christopher A. Barlett and Sumantra Ghoshal, page no. 260.

246
Organizational Behavior
Table I
ABB’s Business Segments (1988)
BUSINESS SEGMENT
ACTIVITIES UNDERTAKEN
Power Plants Manufacturing and supplying equipments such as boilers, light water reactors, etc. for power generation
Power Transmission Manufacturing and supplying equipments such as switchgear, transformers, etc. for high voltage transmission of electricity
Power Distribution Manufacturing and supplying equipments for distribution of electricity
Industry Manufacturing and supplying equipment such as electrical drives, rolling mills, etc. required in automation and industrial processes
Transportation Manufacturing high-speed trains, locomotives, and urban transportation systems such as freight wagons and freight handling systems
Financial Services Financing, leasing, treasury operations, insurance, trading and portfolio management for companies within the ABB group as well as for third parties
Environmental Control
Manufacturing environmental control systems
Other Activities
Instrumentation, motors, robotics, telecommunication, superchargers, communication and information systems, integrated circuits, district heating services, power lines, general contracting and a few other activities in Germany and Sweden
Source: ABB Annual Report, 1988.
THE MIDDLE MANAGEMENT LEVEL
The second or middle management level of the matrix structure consisted of business area managers and country managers. The business area managers reported to the Executive Vice President of the concerned business segment. They were responsible for managing the worldwide operations of the business area allotted to them (Refer Table II).
Table II
Responsibilities of Business Area Managers
To formulate the global strategy for the allotted business area.
To ensure that the required quality and cost standards are maintained in ABB’s operating companies under their purview.
To allot the export markets to front line-operating companies under their business area and provide them with logistics-related support.
To facilitate transfer of unique technical know how within the operating companies by creating common forums.
To focus on Research and Development, so that critical technical improvements and new innovations could be developed to enhance the market leadership position of ABB.
Adapted from “The logic of global business: An interview with ABB’s Percy Barnevik,” by W. Taylor, Harvard Business Review, March/April1991.

247
Reorganizing ABB – From Matrix to Customer-Centric O i ti St t (A)
The country managers headed the national holding companies of ABB. ABB had
national holding companies (NHCs) in each of the countries in which it had
operations. The country manager was responsible for managing the operations of
ABB’s national holding companies in a country. For example, all business operations
of ABB in Germany were managed by the country manager of ABB Germany. The
primary responsibility of the country managers was to implement ABB’s global
strategy by taking local conditions into consideration. They were also responsible for
formulating and implementing HR policies within the country. They interacted with
trade unions, customers and others and sorted out local issues. The country managers
also reported directly to the members of GEM.
THE LOWER MANAGEMENT LEVEL
The third or lower management level of the matrix structure consisted of the heads of
the front line operating companies (FLOCs) of ABB. ABB’s business operations were
carried out by a federation of 1300 FLOCs. The FLOCs were duly incorporated in the
countries concerned under the overall umbrella of the national holding companies.
These companies were segregated according to business areas in the different
countries. For example, in the power plants business segment, one of the business
areas was hydro power plants. The hydro power plants business was carried out by
FLOCs in several countries. All the FLOCs in all the countries engaged in the hydro
power plants business taken together gave the total number of FLOCs engaged in this
business area. Similarly, taking all the fifty business areas and the countries in which
they operated gave the total figure for the 1300 FLOCs.
The FLOCs were accorded the status of distinct legal entities. They even generated
their own financial statements, and sourced their own debt requirements. The
involvement of the top management in the local country operations was minimal. The
management of ABB decided that the companies could retain 30% of their earnings.
On an average, each company had 200 employees and generated revenues worth $85
million. On the one hand, the heads of the operating companies reported to the
concerned business area managers, while on the other, they reported to the country
managers where the company was located. Explaining the significance of operating
companies in ABB’s matrix structure, Barnevik said, “We are fervent believers in
decentralization. When we structure local operations, we always push to create
separate legal entities. Separate companies allow you to create real balance sheets
with real responsibility for cash flow and dividends. With real balance sheets,
managers inherit results from year to year through changes in equity. Separate
companies also create more effective tools to recruit and motivate managers. People
can aspire to meaningful career ladders in companies small enough to understand and
be committed to.”7
THE PROFIT CENTER LEVEL
The profit centers’ managers formed the fourth or lowest layer of ABB’s matrix
structure. The operations of the 1300 FLOCs were split into 3500 profit centers. The
profit centers were specialized areas within the FLOCs, set up to achieve the task
allotted to them. On an average, each profit center consisted of 50 people. The profit
centers also generated their own profit and loss statements, and they were made
7 As quoted in the article, “The logic of global business: An interview with ABB’s Percy Barnevik,” by W. Taylor, Harvard Business Review, March/April1991.

248
Organizational Behavior
accountable for their financial and operating performance, which was periodically
reviewed and evaluated by the lower, middle and the top management levels. The
profit centers represented the closest link to ABB’s customers. The profit center
managers were selected on the basis of their familiarity with local market conditions.
Commenting on the significance of profit centers in the organization, Barnevik said,
“Our strategy of delegating responsibility to many small profit centers is a winning
one. It puts our people close to customers and lets them see how their decisions and
attention to customer needs contribute to ABB's growth. This, in turn, frees up rich
human resources of initiative and energy. We want to achieve management by
motivation and goals, instead of by instruction and directives.... Adopt the right
priorities: Customer first, ABB Group second, own profit center third.”8
THE RATIONALE
The matrix structure was devised by Barnevik so as to develop global strategies for
ABB by taking into account the local conditions in the countries in which the
company had its operations. The reasoning behind creating a decentralized structure
was to drive ABB closer to its customers and expedite the decision-making process.
The dual reporting system ensured that both geographical interests as well as product-
specific interests were taken care of. Further, it also ensured that there was proper
information flow within the organization. Regional managers as well as business area
managers could track the operations of individual companies.
In implementing the matrix structure, the challenge for ABB was to integrate the
work cultures of two massive organizations – Asea and Brown Boveri. The company
had to induce a change in the attitude of employees who were used to a bureaucratic
culture. To induce this change, the ABB management devised a two-pronged strategy
– it emphasized the exercise of control, while at the same time, adopting a humane
approach towards employees’ needs. In an attempt to exercise control by making
employees accountable, the company devised a unique system, called ABACUS
(Asea Brown Boveri Accounting and Communication System). The system provided
ABB’s managers with reports, which updated them about the happenings within the
organization such as the performance of different business segments/companies,
comparative performance statements of different segments/units, and so on. This also
enabled the members of the GEM to evaluate the performance of ABB at the various
levels of hierarchy from the business segment level to that of the profit center, and
accordingly, to devise strategies for the company. Using this system, the operating
companies could benchmark their performance against their peers within ABB. In
order to bind the employees belonging to diverse cultures within the organization, a
policy ‘bible’, containing the company’s mission, vision (Refer Exhibit IV), values
and purpose, was framed and its contents were communicated across the entire
organization. Barnevik toured extensively around the world and explained the policy
bible to the company’s employees.
Analysts felt that the main advantage for ABB in creating a decentralized structure,
was to involve the employees at different levels in the decision making process. At
ABB, forums were created where the heads of all national companies were invited to
form a part of the related business area boards. This gave them an opportunity to be
involved in decisions regarding the worldwide strategy for their business and other
operations. Further, functional councils were created where the managers, who
specialized in functions such as marketing, finance, production, etc., met to discuss
8 As quoted in ABB’s annual report, 1994, www.abb.com

249
Reorganizing ABB – From Matrix to Customer-Centric O i ti St t (A)
the prevalent best business practices in their respective fields and, accordingly, frame
policies for them. Initiatives such as these enhanced their commitment towards the
organization, apart from enabling them to gain wider exposure in their fields.
The merger, followed by the organizational restructuring exercise, as well as a few
acquisitions during the initial years, led to improved financial performance of ABB.
When ABB was formed in 1988, its operations were primarily concentrated in
Western Europe. However, after ABB’s acquisitions, the company expanded its
operations into other regions including Eastern Europe, North America and Asia.
Reaping the synergies of merger, ABB reduced its workforce by 35,000 between 1990
and 1992.
In 1992, ABB underwent a minor restructuring in which the environmental control
business segment was dissolved, and its business areas were split among the
remaining seven business segments. Towards the end of 1992, ABB had seven
business segments, divided into 65 business areas and 5000 profit centers.
By late 1994, the matrix structure was further simplified as the number of segments
was reduced from seven to five. In order to focus more on region-specific issues and
to consolidate its position in these regions, ABB’s worldwide operations were divided
into three broad regions – Europe (comprising 26 countries), the Americas
(comprising 8 countries) and Asia Pacific comprising 19 countries). Each of the three
broad regions was headed by an Executive Vice President (Refer Exhibit V). In mid-
1995, ABB spun off its transportation business by entering into a joint venture with
Daimler Chrysler AG9. The newly formed company was named Adtrendz. As a result
of these changes, by 1996, ABB’s matrix structure was left with four business
segments focusing on three broad regions.
THE IMPLICATIONS
By creating a matrix organizational structure and establishing global and regional
management, ABB reaped many benefits. The operations of frontline operating
companies were integrated with ABB’s worldwide operations through the matrix. As
a result, these companies got an international identity, and their exports increased. The
companies got access to the worldwide distribution network of ABB, through the
matrix structure. For example, ABB Stromberg (Stromberg before restructuring), a
Finland-based company, which manufactured electric drives, transformers, circuit
breakers, generators, transformers, etc. was not financially performing well, despite its
wide range of products, as all its products were not of international quality standards.
However, the company possessed unique technical expertise in manufacturing one
product – electric drives. Post-restructuring, the company became one of the ABB’s
top performing companies, having become internationally reputed for its electric
drives, while it continued to produce and export other products as well. Within the
first three years, its worldwide exports rose by over 50% while its exports to Germany
and France increased by ten times within four years.
ABB was also able to reap the advantages of economies of large-scale operations in
the international markets. For example, the sales personnel of ABB India could sell
products of ABB China, if they felt that the products of ABB China were of good
quality and suited the needs and preferences of Indian consumers. The decentralized
9 Headquartered at Germany, it engages in the development, manufacture, distribution and sale of a wide range of automotive and transportation products, primarily passenger cars and commercial vehicles. The company also provides a variety of services relating to the automotive value-added chain.

250
Organizational Behavior
matrix structure also enabled ABB to respond quickly to changes in market
conditions. For example, in 1994, the government of Norway called for bids to build
an airport in Oslo. The country manager of ABB Norway quickly spotted the
opportunity and appointed an airport project leader, who in turn convinced the
management of ABB’s 20 businesses in Norway to co-operate with him in fulfilling
the project. This enabled ABB to bag 70 airport contracts worth an estimated $300
million.
ABB reaped significant financial benefits after the restructuring exercise by Barnevik.
During 1988 to 1996, its revenues almost doubled, from $18 billion to $34 billion.
Further, the company’s focus on regional operations enabled it to reap rich dividends.
For instance, between 1988 and 1994, ABB’s orders from Eastern Europe rose by
nearly 7 times, from $225 million to $1.65 billion.
However, ABB faced lot of difficulties because of the restructuring. One such
problem occurred in 1988, when the headquarters of ABB were shifted from Sweden
to Zurich. The company had to encounter huge resistance from the local employee
unions, governments and press. The unions complained, “Decisions will be made in
Zurich, we have no influence in Zurich, there is no codetermination in Switzerland.”10
The issue was sorted out after intense negotiations with the concerned unions.
Moreover, the management of ABB had to face severe resistance, especially from the
unions, when job cuts were made.
Analysts felt that the matrix structure resulted in conflicting interests within the ABB
group. For example, while the business area manager devised strategies for his
business based on conditions across the world, the regional manager had to devise
strategies based on the conditions within his region. The operating companies were
sandwiched between the conflicting interests of the country managers and business
area managers. They also felt that the matrix structure made it extremely difficult for
managers at the top to monitor the activities due to the large number of
regions/companies that had to be supervised or handled by them.
Questions for Discussion:
1. The matrix organization structure of ABB consisted of four management levels, with clearly defined responsibilities at each level. Explain in detail about each of these management levels and elaborate on the roles and responsibilities of the management at each level.
2. When ABB was formed in 1988, the challenge that Barnevik faced was to create an organization structure that integrated two large companies – Asea and Brown Boveri successfully. Critically examine the need for developing the matrix structure. Explain how it allowed decentralization of powers at the local management level while ensuring control by the headquarters.
3. “ABB’s combination of multi-domestic local presence and coordination by means of a global matrix organization is a unique response to the ‘think global, act local’ imperative.” What benefits did ABB reap by establishing a multi-domestic local presence? Critically comment on the disadvantages of the matrix structure.
© ICFAI Center for Management Research. All rights reserved.
10 As quoted in the article, “The logic of global business: An interview with ABB’s Percy Barnevik,” by W. Taylor, Harvard Business Review, March/April1991.

251
Reorganizing ABB – From Matrix to Customer-Centric O i ti St t (A)
Exhibit I
Financial Performance of ABB
YEAR REVENUE ($ million)
NETINCOME ($ million)
1988 17,832 386
1989 20,260 589
1990 26,337 590
1991 28,443 609
1992 29,109 505
1993 27,521 68
1994 28,758 760
1995 32,751 1315
1996 33,767 1233
1997 31,265 572
1998 23,723 1305
1999 24,681 1614
2000 22,967 1443
2001 23,726 -691
2002 18,295 -787
Source: ABB Annual Reports, 1988-2002.
Source: ICMR
Executive Vice President
(Power Plants)
Group Executive Management (Top
ManagementLevel)
FLOCs Heads (Lower
ManagementLevel)
Business Area Managers (Ex. Hydro Power Plants)
Business Area Managers/Country
Managers (Middle Management)
Country Managers (Ex. ABB Norway)
Germany)
Company Heads (FLOCs)
Profit Center Managers
(Profit Center Level)
Exhibit II
ABB’s Matrix Structure (1988)

252
Organizational Behavior
Exhibit III
ABB’s Group Organization
(As on March 1, 1989)
NAME BUSINESS SEGMENT
BUSINESS AREAS BUSINESS REGIONS
CORPORATE STAFF
Percy Barnevik
President & CEO
Environmental Control
Indoor climate, gadelius, service, components, cooling.
Thomas Gasser
Deputy CEO
Audit, Corporatecontrol and development, Legal affairs, Management resources, Taxes and customs
Erwin Bielinski
Executive Vice President
Power Plants Gas turbine power plants, utility steam power plants, industrial steam power plants, pressurized fluidized bed combustion, nuclear power plants, power plant control.
Sune Carlsson
Executive Vice President
PowerDistribution
Various Activities (instrumenta-tion, motors, robotics)
Low voltage apparatus, low voltage systems, installation, medium voltage equipment, distribution plants,
All power distribution business areas in Germany and Switzerland
France, Ireland, Norway, UK
Arne Bennborn
Executive Vice President
West and South Africa,Southeast Asia,NortheastAsia, Japan, Australasia, Africa and the Arabian Peninsula, Latin America
Eberhard von Koerber
Various Activities
Superchargers, Other Activities in Germany
Federal Republic of
Information, Marketing

253
Reorganizing ABB – From Matrix to Customer-Centric O i ti St t (A)
Executive Vice President
Germany, Austria, Benelux, EasternEurope,Greece
Goran Lindahl
Executive Vice President
PowerTransmission
High voltage switchgear, power systems, network control, power transformers, distribution transformers, relays, cables and capacitors, mica camp, elektrokoppar, All Power Transmission business areas in Germany Sweden and Switzerland
Bertold Romacker
Executive Vice President
Various Activities
Communication and Information Systems, Integrated Circuits, Telecommunication
Corporate Research and Technology
Beert-OlafSvanholm
Executive Vice President
Transportation
Various Activities
District heating services, other activities in Sweden
Denmark, Finland, Portugal, Spain,Sweden
N.A
Werner Thommen
Executive Vice President
Special Projects N.A N.A
Lars Thunell
Executive Vice President
Financial Services
Treasury center, leasing and financing, trading.
Canada, US Corporate finance, insurance and riskmanagement, investor relations, project finance, purchasing and export control, real estate.
LeonardoVannotti
Industry
Various
Metallurgy, process automation, drives, marine, oil and gas
Italy N.A

254
Organizational Behavior
Executive Vice President
Activities (Power Lines and General Contracting)
Source: Adapted from ABB Annual Report, 1988.
Exhibit IV
ABB’s Vision and Mission
ABB creates value:
By making our customers more competitive in a networked world
We strive to help our customers gain competitive advantage from technology advances and developments in their markets. We do this by creating comprehensive Industrial IT offerings that combine world-class products and services with superior domain know-how and collaborative commerce.
By offering our employees opportunities to learn, grow and share in the value created by their efforts
We reward creativity, flexibility and results-oriented actions that help make our customers successful. Through adoption of common business processes, we release energies and creativity to focus on serving our customers.
By achieving returns that meet or exceed the expectations of our shareholders
We generate the growth that creates investor confidence by managing for value. The power of being close to the market and understanding how we can create more value for our customers will generate the financial strength needed in fast changing capital markets.
By living our commitment to sustainabilityWe strive for a balance in the economic, environmental and social impact of our business and we actively contribute to economic progress, environmental stewardship and sustainable development in the communities and countries in which we operate.
Source: www.abb.com
Exhibit V
ABB Group Organization (1994)
Executive Committee
Member
Armin Meyer Goran Lindahl
Sune Carisson Kaare Vagner Percy Barnevik
BusinessSegments
PowerGeneration
PowerTransmission
&Distribution
Industrial and Building Systems
Transportation Financial Services
BusinessArea
Gas Turbine andCombined Cycle Plants Utility Steam Power Plants PowerGeneration Industry
Hydro Power PlantsFossil
Cables Distribution TransformersHigh-Voltage Switchgear Medium-Voltage Equipment
Network Control and
Automation and Drives Oil, Gas and Petrochemical General Contracting Flexible Automation Instrumentation Motors Electrical and Mechanical
Locomotives TrainsMultiple Units and Metros Light Rail VehiclesFixed Railway Installations Transportation Customer Support
Signaling
Treasury Centers Leasing & Financing Insurance Stock-brokerage &Investment Management Project &

255
Reorganizing ABB – From Matrix to Customer-Centric O i ti St t (A)
Combustion Systems and ServicesNuclear Power Plants Power Plant Control ResourceRecovery Air Pollution Control Power Plant Production EnergyVentures
Protection Power Lines PowerSystems PowerTransformersMiddle East and North Africa
Installations Low-voltage Systems Low-voltage Apparatus Installation Material Air Handling Equipment Refrigeration Service
Building ServiceSuperchargers
Various Activities: DistrictHeating
Trade Finance
SeniorCorporate Officers
Arne Bennborn Large Composite Plants
Thomas Gasser Coordination of Corporate Staffs and specialcorporateprojects
Goran Lundberg
SpecialProjects and strategies,PowerGeneration
Craig Tedmon Group ResearchandDevelopment
BusinessSegment Manager
Jan Roxendal Financial Services
Exhibit V
Abb Group Organization (1994) (Continued)
Executive Committee Member
Eberhard Von Koerber
Robert Donovan Alexis Fries
Business Region Europe The Americas Asia Pacific
Country Austria
Belgium
Czech Republic
Denmark
Finland
France
Germany
Greece
Argentina
Brazil
Canada
Mexico
USA
Venezuela
Other Central and South American
Australia
China
Hong Kong
Indonesia
Japan
Korea
Malaysia
New Zealand

256
Organizational Behavior
Hungary
Ireland
Italy
Netherlands
Norway
Poland
Portugal
Romania
Russia
Spain
Sweden
Switzerland
Turkey
United Kingdom
Other European Countries and CIS
South Africa and Sub-Sahara Africa
Countries Phillippines
Singapore
Taiwan
Thailand
Vietnam
Other Asia Pacific Countries
South Asia
India
Other South Asia Countries
Source: ABB Annual Report 1994.

257
Reorganizing ABB – From Matrix to Customer-Centric O i ti St t (A)
Additional Readings and References:
1. Rapoport, C, Moran, K, A tough Swede invades the U.S,. Fortune, June 29, 1992.
2. Bartlett, Christopher A, Ghoshal, Sumantra, Beyond the M-Form, Toward a Management Theory of the firm, Strategic Management Journal, Winter 1993.
3. Handy, Charles, Balancing corporate power: A new federalist paper, McKinsey Quarterly, 1993 Issue.
4. De Vries, Manfred F.R. Ke, Making a giant dance,. Across the Board, October 94.
5. Bartlett, Christopher A, Ghoshal, Sumantra, Changing the Role of Top Management: Beyond Strategy to Purpose, Harvard Business Review, November/December 1994.
6. The ABB of management, Economist, January 6, 1996.
7. Quelch, John A, Bloom, Helen, The return of the country manager, McKinsey Quarterly, 1996 Issue.
8. Evett, Bill, Ten years on and still smiling, International Power Generation, April 1998.
9. Prahalad, C.K, Lieberthal, Kenneth, The End of Corporate Imperialism, HarvardBusiness Review, July/August 1998.
10. Re-re-restructuring!, www.domain-b.com, September 15, 1998
11. ABB still growing, International Power Generation, September 1998.
12. Profits up, management out at ABB, European Power News, September 1998
13. ABB Realigns Business Segments to Tap Market Trends, Names New Executives to Group Executive Committee, www.abb.com, December 8, 1998
14. Bartlett, Christopher A, Ghoshal, Sumantra, Managing Across Borders, HarvardBusiness School Press, 1998
15. McClenahen, John S, CEO of the Year, Industry Week, November 15, 1999
16. Morais, Richard C, ABB reenergized, Forbes, August 23, 1999.
17. Tsun-yan Hsieh; Lavoie, Johanne; Samek, Robert A. P, Are you taking your expatriate talent seriously?, McKinsey Quarterly, 1999 Issue.
18. Tsun-yan Hsieh; Lavoie, Johanne, Samek, Robert A. P, Think global, hire local.,McKinsey Quarterly, 1999 Issue.
19. A Great Leap, Preferably Forward, Economist, January 20, 2001.
20. ABB: Huge Tremors at a Swiss Giant, BusinessWeek, February 14, 2002.
21. Scandal and poor performance have forced ABB to open up, Economist, March 2, 2002.
22. The new drive, Business India, March 05, 2001.
23. Setting A New Course, Industry Week, March 19, 2001.
24. Tomlinson, Richard, Dethroning Percy Barnevik, Fortune, March 21, 2002.
25. Neither Lender Nor Borrower Be, Economist, March 30, 2002
26. Europe's second biggest engineering group is dangerously close to collapse, Economist, November 26, 2002
27. Tomlinson, Richard; Mission impossible?, Fortune (Asia), November 18, 2002.
28. Luckey, Janes, The mighty fall, International Power Generation, November/December 2002.
29. Ganesan, Senthil, ABB: Truly Global, Global CEO, www.icfaipress.org, January 2003.
30. Reed, Stabley, Arndt, Michael, Work Your Magic, Herr Dormann, BusinessWeek, February 10, 2003.
31. Tully, Kathryn, Finding ways out of the mire, Euromoney, February 2003.
32. Sisodiya, Singh, Amit, ABB: The Giant Stumbles, The Analyst, www.icfaipress.org, February 2003.
33. ABB Annual reports 1988, 1992, 1994, 1998, 1999, 2000, 2001, 2002, www.abb.com

Reorganizing ABB – From Matrix to Customer-Centric Organization Structure
(B)“This is an aggressive move aimed at greater speed and efficiency by further focusing and flattening the organization. This step is possible now thanks to our strong, decentralized presence in all local and global markets around the world." 1
Goran Lindahl, former President and CEO, ABB, commenting on his new structure in 1998.
“We are responding to a silent revolution in the market that is completely changing the business landscape. Faced with increasing complexity and speed – much of it driven by the Internet – our customers want clarity and simplicity. Our new structure will make us easier to do business with and fully reflects our new vision of creating value and fuelling growth by helping our customers become more competitive.”2
Jorgen Centerman, former CEO, ABB Group, 2001.
“The new structure will allow us to serve our customers better, enhance the external focus and more closely integrate our senior managers in local markets into our global management teams.”3
Jurgen Dormann, CEO, ABB Group, 2002.
THE NEED TO RESTRUCTURE
The matrix organizational structure implemented by ABB served as a model for
organizations with operations all over the world, to understand how to strike a balance
between centralization and decentralization of authority between the center and local
management.
However, notwithstanding its definite advantages, the matrix structure4 led to a few
problems for ABB. Conflict of interests between the business area management and
the regional management often resulted in delayed decision making, especially at the
level of the Frontline Operating Companies. This in turn affected ABB’s ability to
respond quickly to the rapidly changing business environment. Under these
circumstances, analysts felt that there was a need to make ABB’s organization
structure more flexible and expedite the decision making process. Further, ABB’s
existing business segments needed to be realigned in such a manner that would enable
them to serve the customers better.
On January 1, 1997, Goran Lindahl (Lindahl) succeeded Barnevik as the CEO of
ABB. Barnevik was appointed Executive Chairman of the group. In 1997, ABB had
four business segments – Power Generation, Power Transmission and Distribution,
1 As quoted in the press release, “ABB Realigns Business Segments to Tap Market Trends; Names New Executives to Group Executive Committee” in the website, www.abb.com, dated August 12, 1998.
2 As quoted in the press release, “Early response to new market demands, aimed at fuelling growth” posted on www.abb.com, dated January 12, 2001.
3 As quoted in the press release, “ABB acts to lower cost base after week Q3” posted on www.abb.com, dated October 24, 2002.
4 A detailed description of ABB’s matrix structure and its implications is covered in the ICMR case study, “Reorganizing ABB – From Matrix to Customer-Centric Organization Structure (A).”
259
Reorganizing ABB – From Matrix to Customer-Centric…
Industrial & Building Systems and Financial Services, which were further categorized
into 36 business areas. At that time, ABB had 1000 operating companies spread across
100 countries under three broad geographical regions – Asia, America and Europe.
In the year 1997, ABB’s financial performance deteriorated significantly. ABB’s 1997 net profits dropped to US $572 million from US $1233 posted in 1996 (Refer Exhibit I). The company’s businesses started showing signs of stagnation. Further, ABB’s operations in Asia were severely affected by the Southeast Asian economic crisis. Analysts felt that Lindahl had to take some significant measures to revive ABB, quickly.
Lindahl responded by initiating a damage control exercise. In 1998, 12 factories in the
US and European regions were closed down, resulting in the reduction of ABB’s
workforce by 12,600 employees. He identified certain business areas that had the
potential to emerge as major profit contributors for ABB. These areas included
industrial control systems, deep-water oil and gas exploration, intelligent electrical
systems, and services. In 1998, Lindahl decided to restructure ABB so as to enable it
to focus its resources on the potentially lucrative business areas.
LINDAHL’S REORGANIZATION
Lindahl split the Power Transmission & Distribution segment into a Power
Transmission segment and a Power Distribution segment, and the Industrial and
Building materials segment into three new segments – the Automation segment, the
Oil, Gas and Petrochemicals segment, and the Products & Contracting segment.
However, the Power Generation and the Financial Services segment remained
unchanged. Lindahl restructured ABB so that the company could become more
focused and competitive in each field, and hence, become more responsive to new
business opportunities. As per the modifications made in the structure, the Group
Executive Committee now consisted of the President and CEO, the Executive Vice
Presidents of the seven new global business segments and the Chief Financial Officer
(Refer Exhibit II).
In his efforts to simplify the decision-making process, Lindahl eliminated a layer of
regional management, which was present in the matrix structure. The regional offices
for Europe (Brussels), the Americas (Miami) and Asia (Hong Kong) were closed
down.
The reason for this move was explained by Lindahl, who said, “In most countries
where we have customers we [now] have local expertise, we have local brainpower
that can look after the added value. So we don’t need to have an extra management
layer. Wherever you find a cost element that is not necessary to the business, [you
must] take it out.”5 The dual reporting system of the matrix structure was also
removed. Under the new system, the local country heads of the businesses reported
directly to the Business Area managers who were based in the Zurich headquarters.
Commenting on the restructuring, Lindahl said, “This should be seen as a leapfrog
move in response to market trends, to make sure we can serve our customers better
and build more value for our stakeholders.”6
5 As quoted in the article, “CEO of the Year” in Industry Week, November 15, 1999. 6 As quoted in the press release, “ABB Realigns Business Segments to Tap Market Trends;
Names New Executives to Group Executive Committee” posted on www.abb.com, dated August 12, 1998.

260
Organizational Behavior
Under the new framework, the managers of FLOCs reported directly to the business
area managers. As a result, the role of the country manager was made redundant.
Summing up the benefits of ABB’s new organization structure, Lindahl said, “The
knowledge focus and our moves to ensure more market transparency underpinned the
realignment of ABB’s group segment structure. That move sharpens our business
focus by better matching the segments to their markets and underscores ABB’s
commitment to respond faster to the needs of customers, employees and other
stakeholders.”7 However, ABB incurred an estimated $866 million in Lindahl’s
restructuring initiative. The restructuring also resulted in nearly 10,000 job cuts in a
single year.
Lindahl supplemented his restructuring exercise with a series of initiatives, which
included acquisitions, joint ventures and divestitures. In 1998, ABB acquired the
Italian automation systems firm, Elsag Bailey Process Automation NV8, for $2.1
billion. As a result, ABB became the world’s largest manufacturer of robotics and
automated control systems with revenues amounting to $8.5 billion. The acquisition
boosted the prospects of the Automations segment. In 1999, ABB entered into a 50-50
joint venture with the French Power company, Alstom SA, resulting in the formation
of the world’s largest power generation company, ABB Alstom Power NV. ABB had
invested an estimated $8 billion in the new company.
Lindahl also sold ABB’s equity share in the joint venture with Daimler Chrysler AG9,
for an estimated $472 million, marking the end of the company’s transportation
business. In 2000, ABB also sold its equity stake in the power generation joint venture
to Alstom. According to analysts, Lindahl made this move in order to diversify from
high capital intensive, low profit margin businesses, to technology-intensive, high
profit-margin businesses such as B2B e-commerce, building technologies10 and
financial services.
The restructuring and cost cutting initiatives including closing of factories and job
cuts, by Lindahl, resulted in improved financial performance for ABB in 1999. For the
financial year ending 1999, the revenues of ABB increased to $24.68 billion, an
increase of 4% over 1998, while net income rose to $1.61 billion, an increase of 24%
over 1998. However, the financial performance of ABB deteriorated significantly in
2000. For the financial year ending 2000, the company reported revenues of $22.96
billion while net profit fell by 10.5% to $1.44 billion. The poor financial performance
of ABB led to Lindahl’s stepping down as ABB’s CEO in December 2000.
CUSTOMER-CENTRIC ORGANIZATION
On January 1, 2001, Jorgen Centerman became the CEO of ABB. Centerman was
driven by a modern outlook, which revolved around serving the customers better by
7 As quoted in ABB’s 1998 annual report. 8 Headquartered in the Netherlands, Elsag Bailey Process Automation NV is a leading provider
of automation systems, process instrumentation, analytical measurement products and professional services. The company’s technologies are sold worldwide for automation of various processes in electric power, chemical, pharmaceutical, oil and gas, paper, metals, mining, food and beverage and other industries.
9 Headquartered at Germany, it is engaged in the development, manufacture, distribution and sale of a wide range of automotive and transportation products, primarily passenger cars and commercial vehicles. The company also provides a variety of services relating to the automotive value-added chain.
10 It comprised of technologies involved in air handling systems, building energy management services, communication network design and support.

261
Reorganizing ABB – From Matrix to Customer-Centric…
using IT. He conducted an analysis of ABB’s customers, which revealed that the top
200 of them accounted for 30 percent of the company’s revenues in 2000. Of this, 180
clients purchased their requirements from one ABB unit. The top 200 clients spent 8%
of their total product expenditure on ABB’s products. Based on the results of his
analysis, Centerman soon announced major changes in Lindahl’s group organization
structure. In his new customer-centric organization structure, the entire ABB group
was re-aligned around customer groups. Through this structure, he aimed to increase
the top 200 customers’ spend on ABB’s products from 8% to 12%. Centerman
expected that the increased expenditure on the top customers would yield an
additional $4 billion to ABB’s revenues.
As per the new structure, the existing business segments of ABB were replaced by
four end-user divisions, two channel partner divisions and a financial services division
(Refer Exhibit III). The end-user divisions included Utilities, Manufacturing &
Consumer Industries, Process Industries and Oil and Gas & Petrochemicals divisions.
The end-user divisions directly provided customers with ABB’s products and services.
The two channel partner divisions included Power Technology Products and
Automation Technology Products. These divisions served directly external channel
partners like wholesalers, retailers, system integrators and original equipment
manufacturers. The role of the financial services segment was to offer financial
support to the various projects within the group as well as to wholesalers, retailers and
end-customers.
To succeed in his restructuring drive, Centerman had to ensure that ABB would be
more accessible to its customers. Further, the various processes like manufacturing
and distribution within the ABB group, needed to be linked using IT infrastructure. In
order to achieve these dual objectives, two new divisions were created – the corporate
process division and the corporate transformation division, each being headed by an
executive committee member. The role of the corporate process division was to
implement the best available business processes and management practices in ABB’s
operations all over the world, and pass on the benefits obtained to the customers.
Centerman justified this move, saying, “Common business and management processes
are essential in a truly customer-driven enterprise. This will, over time, provide a
single interface between us and the customer, and free up our people to focus on
creating greater value for our customers. This is what our customers request today --
to capitalize on technology advances and rapidly changing markets in order to be
more competitive. This, in turn, will fuel growth for ABB. At the same time, it creates
value for our shareholders and for the communities and countries where we
operate.”11 The corporate transformation division was created to ensure the speedy
implementation of the restructuring process.
Centerman also increased the number of members of the executive committee from 7
to 11. The committee now included all the heads of the nine new business segments
(Refer Exhibit IV) as well as Centerman himself and Renato Fassbind, the CFO of
ABB. In accordance with the newly framed structure, changes were also made in the
overall management. Commenting on the changes made in the management structure,
Centerman said, “We are fully organizing our company around customers and
channels to market, building our whole organization from the customers’ perspective
11 As quoted in the press release, “Early response to new market demands, aimed at fuelling growth” posted on the website, www.abb.com, dated January 12, 2001.

262
Organizational Behavior
and working our way in. From the salesperson to the CEO, every unit at every level
will be structured along customer lines.”12
In order to support Centerman’s restructuring initiatives, ABB acquired a 53% stake
in the US-based software company, Skyva International. Skyva produced software,
which enabled it to integrate the important business processes of ABB’s suppliers,
manufacturers and customers. The launch of the website, www.abb.com, helped ABB
to expedite order processing time for customers, reducing it from 3 hours to 10
minutes. Centerman also made changes in the customer service system to help
customers who needed information regarding different product and service offerings
of ABB. Previously, customers who had multiple product enquiries had to interact
with the sales personnel belonging to the respective product divisions within ABB.
Under the new system, the customers could interact with only one ABB employee for
all their information needs, thereby saving valuable time. Centerman also started a
new company, New Ventures Ltd., to scan the business environment and spot
potentially lucrative business opportunities for ABB so that it could capitalize on them
as quickly as possible.
The restructuring process was supposed to be completed by mid-2001. However, in
fact, implementation began only in July 2001. It took six months for the restructuring
to be completed. In January 2002, the corporate transformation division was
integrated into the corporate process division, indicating the completion of its task.
Centerman said, “The customer-centric organization has been put in place in all
markets. Now it is time to drive through implementation and operational
efficiencies”13. In April 2002, the process industries division and manufacturing and
consumer industries division were merged into one division – the industries division.
A significant element of ABB’s new customer-centric organization was the creation of
key account managers in order to cater exclusively to the needs of ABB’s top
customers. By September 30, 2001, ABB had 168 key account customers. In an
attempt to serve the customers better, ABB supplemented the sale of its products with
industrial IT solutions.
The implementation of the customer-centric organization yielded positive results for
ABB. By the end of financial year 2001, the amount of business from the company’s
top 200 customers increased substantially. By September 30, 2001, orders from
ABB’s top 100 customers had increased by 4%. The ABB utilities division received
an order worth $36 million from Statoil, a Norwegian oil company, for the
maintenance and modification of a gas treatment plant in Norway and platforms in the
North Sea.
However, though the business from the top consumers improved, the overall financial
condition of ABB deteriorated in 2001 with the company reporting its first post-
merger net loss of $691 million14. ABB also reported high debts of $4.1 billion in
2001; they increased further to $5.2 billion by mid 2002. The poor financial state of
12 As quoted in the ABB Group Annual Report, 2000.13 As quoted in the press release, “ABB combines Group Transformation and Group Processes
divisions and appoints Eric Drewery as Division Head” posted on the website, www.abb.com, dated January 29, 2002.
14 A major portion of the losses ($470 million) was due to asbestos claims that came with ABB’s acquisition of Combustion Engineering (CE). In November 1989, ABB acquired the US-based power generation firm, CE for $1.6 billion. The fact that the firm had used asbestos in its operations until the late 1970s was not taken into consideration. As a result, ABB had to bear the burden of settling claims relating to the asbestos purchases. During the period 1990 to 2001, ABB had to pay $861 million towards asbestos-related settlements.

263
Reorganizing ABB – From Matrix to Customer-Centric…
ABB coupled with the costs of frequent restructuring forced the company to undertake
a major reduction in its workforce. ABB announced a reduction of 12,000 jobs for the
financial year 2002-03, in order to reduce wage costs by $500 million.
Centermann also sold 68% of ABB’s share in its structured finance business, a part of
the financial services business segment, to GE Commercial Finance for $2.3 billion on
September 4, 2002. He also sold the meters division for $244 million in September
2002. However, he stopped his restructuring efforts abruptly in September 2002, when
he resigned as CEO, following differences with the group’s chairman Jurgen
Dormann.
RESTRUCTURING BY DORMANN
Jurgen Dormann became the CEO of ABB in September 2002. He felt that the
restructuring exercise initiated by his predecessor was not yielding the desired results.
In order to further simplify ABB’s organization structure, he created two new
divisions – the Power Technologies Division by merging the Utilities division with
the Power Technology Products division; and the Automation Technologies Division
by merging the Industries division with the Automation Technologies Products
division. The Oil, Gas and Petrochemicals division remained untouched, as Dormann
intended to sell it. Dormann’s strategy was to reinstate ABB’s focus on its core
business areas and divest the rest. He also dissolved the Corporate Process division.
Having announced these decisions on October 24, 2002, Dormann said, “Our
organizational measures will allow us to build on our leadership positions in power
and automation technologies, and secure competitive cost and profitability levels even
in a weak market.”15
The new structure represented a logical alignment of ABB’s businesses. The newly
formed Power Technologies Division served customers of the Utilities segment. It
comprised an estimated 43,000 employees and was expected to generate $8.5 billion
in annual revenues for ABB. Similarly, the Automation Technologies division served
customers of the Industries Division. The 63,000-employee strong division was
expected to generate $9.25 billion revenues for ABB. Analysts felt that Dormann
wanted to avoid duplication of efforts, resulting from creating separate divisions to
serve customers, which Centermann had undertaken. Further, the simplified structure
facilitated closer supervision of the company’s operations, as Dormann had to focus
on fewer divisions. The new restructuring exercise was also expected to cut costs to
the tune of $500 million for ABB. Commenting on Dormann’s restructuring initiative,
John D. Wilson, ABB group vice president and head of the company’s global Life
Sciences and Consumer businesses, said, “The recent changes in ABB will make us a
more streamlined and responsive company as a whole. We are able to react quickly to
customer needs and changing market conditions.”16
THE IMPLICATIONS
According to the analysts, the changes in the organizational structure of ABB, made
by Lindahl, Centerman and Dormann resulted in the centralization of authority in the
hands of global managers based in ABB’s headquarters. As a consequence, the
15 As quoted in the press release, “ABB acts to lower cost base after weak Q3,” posted on www.abb.com, dated October 24, 2002.
16 As quoted in the article, “Suppliers revamp offerings to meet industry needs” by Kathie Canning, posted on www.chemicalprocessing.com, dated December 12, 2002.

264
Organizational Behavior
strategy of “think globally, act locally,” for which ABB was renowned, suffered a
setback.
Analysts felt that under Lindahl, ABB had benefited by creating three new business
segments. The positive financial results were reflected in the financial year 1998, the
first year of implementing the new structure. In 1998, the power generation segment
received massive orders for its power plants. The company’s power transmission
division received major orders from Latin America (it responded quickly to
privatization and deregulation drives in countries such as Argentina and Brazil),
Middle East and Africa, which, to some extent, helped the company to contain the
effects of the Southeast Asian economic crisis.
However, Lindahl was severely criticized for his decision to divest the power
generation business, one of ABB’s key businesses. Moreover, Lindahl’s modifications
in the organization’s structure (apart from his thrust on making ABB a knowledge-
oriented company through the use of IT) complicated the company’s operations
further. As a consequence, there was a large amount of duplication of efforts within
the ABB group. For instance, by the end of 2001, there were 576 Enterprise Resource
Planning (ERP) software installed in different divisions of ABB. In another example,
in one of the company’s global subsidiaries with small operations, there were 60
different payroll systems, whereas, another of its subsidiaries with large operations
had 38 different payroll systems, while the actual requirement was just a few.
Analysts also felt that the employees were made the scapegoats in all the restructuring
initiatives carried out by the CEOs. The restructuring undertaken by Lindahl coupled
with his strategy of relocating resources from Europe to Asia, resulted in massive job
cuts in Europe. During 1997 to 1999, 40,000 jobs were cut in Europe while 45,000
new jobs were created in Asia.
Commenting on the problem that existed in the previous organization structures, Eric
Drewery, an ABB executive, who was the country manager in Britain from 1988 to
2000, said, “Many of our worldwide customers were only trading with one or two
business areas, even though we had 26 global businesses. They didn’t know of the
existence of the rest of our product portfolio.”17
Centerman’s restructuring of ABB into a customer-centric organization, coupled with
his focus on offering industrial IT solutions to its customers, yielded positive results
for ABB. This was reflected in the increase of orders received by the newly-created
business segments. In May 2001, ABB’s process industries division signed a ten-year
agreement with one of its major customers, Dow Chemical, to provide process and
safety control solutions. The division also signed a $15 million contract with Visy
Industries -- one of the largest industrial IT software contracts in the pulp and paper
industry. In October 2001, ABB’s utilities division received a major order worth $360
million from the State Power Corporation of China to build a high voltage direct
current transmission system linking hydro power plants in two regions in the People’s
Republic of China.
Commenting on the benefits of the customer-focused approach, Dinesh Palival, EVP
of ABB’s process industries division said, “Despite tumultuous markets, the high
number of orders we won in all industries and parts of the world in the past year
demonstrates our customers’ confidence in us, and the many long-term agreements we
signed with major customers reflect our deep knowledge of their businesses and the
17 As quoted in the article, “Dethroning Percy Barnevik,” by Richard Tomlinson and Paola Hjelt, Fortune (Asia), April 01, 2002.

265
Reorganizing ABB – From Matrix to Customer-Centric…
strength of industrial IT.”18 ABB’s manufacturing and consumer industries division
received major orders in the US, Slovakia and Germany and China. ABB’s oil, gas
and petrochemicals divisions received orders from countries such as Brazil, Nigeria,
Australia, Angola and Russia.
However, Centerman’s restructuring also led to HR problems. The closure of a few
factories in Europe led to heavy protests by the employees. The number of profit
centers was also reduced to 400 by 2001, which led to a loss of 7,000 jobs during
1997 - 2001.
Questions for Discussion:
1. Lindahl created a new structure to give ABB more flexibility in reacting to changing market conditions. Explain the key features of the group structure. Compare and contrast the group structure with the matrix structure.
2. Centerman created a customer-centric structure in order to ensure that ABB focused more on its major customers. Explain in detail the customer-centric structure and how it achieved its objective of focusing on top customers.
3. From 1998 to 2002, ABB underwent three major changes in its organizational structure. Critically analyze the HR and business implications (positive as well as negative) for ABB in the light of frequent organizational restructuring.
© ICFAI Center for Management Research. All rights reserved.
18 As quoted in ABB annual report 2001.

266
Organizational Behavior
Exhibit I
Financial Performance of ABB
YEAR REVENUE
($ million)
NETINCOME ($ million)
1988 17,832 386
1989 20,260 589
1990 26,337 590
1991 28,443 609
1992 29,109 505
1993 27,521 68
1994 28,758 760
1995 32,751 1315
1996 33,767 1233
1997 31,265 572
1998 23,733 1305
1999 24,681 1614
2000 22,967 1443
2001 23,726 -691
2002 18,295 -787
Source: ABB Annual Reports, 1988-2002
Exhibit II
ABB’s Organization Structure under Lindahl (1998)
Executive committee Business Segment Business Areas/Functions
Goran Lindahl
President & CEO
• Audit
• Corporate Communications
• Environmental Affairs
• Global processing
• International consulting
• Investor relations
• Legal affairs
• Management resources
Renato Fassbind
Chief Financial Officer
• Accounting
• Controlling
• Consolidation
• Insurance
• Mergers & Acquisitions
• Risk Management

267
Reorganizing ABB – From Matrix to Customer-Centric…
• Real Estate
• Reporting
• Taxes & Finance
Alexis Fries Power Generation
• Gas & Combi-Cycles
• Steam Power plants
• Power Plant Systems
• Nuclear Systems
• Environmental Systems
• Power Plant Service
Sune Karlsson Power Transmission
• Cables
• High-Voltage products & substations
• Power Lines
• Power Systems
• Power Transformers
• T&D Service and Support
Sune Karlsson Power Distribution
• Distribution Systems
• Distribution Transformers
• Medium-voltage equipment
Jorgen Centerman Automation
• Automation power products
• Instrumentation & control products
• Flexible Automation
• Marine & Turbochargers
• Metals & minerals
• Petroleum, chemical &consumer industries
• Pulp & paper
• Utilities
Gorm Gundersen Oil, Gas & Petrochemicals
• Oil, Gas & Petrochemical
Armin Meyer Products and Contracting
• Contracting
• Low-voltage products and systems
• Air Handling-equipment
• Service
Jan Roxendal Financial Services
• Treasury Centers
• Leasing & Finance
• Insurance
• Structured Finance
• Energy Ventures

268
Organizational Behavior
Exhibit IV
Jorgen Centerman’s Customer-Centric Organization (2001-02)
Description Name (* indicates new member)
Process Industries: serving customers in industries such as pulp and paper, printing, mining and metals, cement, chemicals, petrochemicals, pharmaceuticals, and marine
Dinesh Paliwal,* 43, Indian, presently head of ABB’s Pulp, Paper, Mining and Minerals business
Manufacturing and Consumer Industries:serving the full range of product manufacturers, as well as infrastructure customers in the telecommunications, airports, postal and distribution, and building sectors
Jan Secher,* 43, Swedish, presently head of ABB’s Flexible Automation business
Utilities: serving electric, gas and water utilities
Richard Siudek,* 54, American/British, presently head of ABB’s Power Transmission and Distribution businesses in the U.S.
Oil, Gas and Petrochemicals: serving the hydrocarbon industries, from resource recovery to processing
Gorm Gundersen, 56, Norwegian, presently head of the Oil, Gas and Petrochemicals segment
Automation Technology Products: a complete range of hardware and software products for automation and control, robotics,
Jouko Karvinen, 43, Finnish, presently head of ABB’s Automation Segment
Exhibit III ABB’s Customer-Centric Organization (2001-02)
External ChannelPartners
System integrat-ors,OEM’s
etc.
Utilities Process Industries
Manufacturing &
Consumer Industries
Oil, Gas, & Petro-
ChemicalsExternal Channel Partners
FinancialServices
Group Processes
Power Technology Products
All transformers, medium-and high-voltage switch-gear, capacitors, etc.
Automation Technology Products
Hardware, software for automation/control, robotics, sensors, meters, drives, motors, switches, low-voltage products, etc…
Source: Adapted from “Real-time enterprise solutions with industrial IT,” by Brad A. Hoffman, in
ABB Review, March 2001 issue, www.abb.com

269
Reorganizing ABB – From Matrix to Customer-Centric…
sensoring, metering, drives, motors, switches and accessories, and other low-voltage products and technologies
Power Technology Products: a complete range of transformers, switchgears, apparatus, cables, as well as other products and technologies for high- and medium-voltage applications
Peter Smits, * 49, German, presently head of ABB’s Distribution Transformer business
Financial Services: Insurance, structured finance, development and ownership of private infrastructure projects, and treasury services to ABB companies
Jan Roxendal, 47, Swedish, presently head of the Financial Services segment
Corporate Processes: Implementation of common processes and groupwide infrastructure in areas such as quality control, supply chain management, eBusiness development, and information systems
Andrew Eriksson,* 54, Swiss/South African, presently head of ABB’s Medium-Voltage Equipment business
Corporate Transformation: Support senior management to implement the new customer-based organization worldwide
Eric Drewery, * 61,British, presently head of ABB in the U.K.
Source: Press release, “ABB realigns organization around customers,” posted on www.abb.com dated January 12, 2001.

270
Organizational Behavior
Additional Readings and References:
1. The ABB of management, Economist, January 6, 1996.
2. Evett, Bill, Ten years on and still smiling, International Power Generation, April 1998.
3. Prahalad, C.K, Lieberthal, Kenneth, The End Of Corporate Imperialism, Harvard
Business Review, July -August 1998.
4. Re-re-restructuring!, www.domain-b.com, September 15, 1998.
5. ABB still growing,, International Power Generation, September 1998.
6. Profits up, management out at ABB, European Power News, September 1998.
7. ABB Realigns Business Segments to Tap Market Trends, Names New Executives to Group Executive Committee, www.abb.com, December 8, 1998.
8. Bartlett, Christopher A, Ghoshal, Sumantra, Managing Across Borders, Harvard
Business School Press, 1998.
9. Morais, Richard C, ABB reenergized, Forbes, August 23, 1999.
10. McClenahen, John S, CEO of the Year, Industry Week, November 15, 1999.
11. Tsun-yan Hsieh; Lavoie, Johanne, Samek, Robert A. P, Are you taking your expatriate talent seriously?, McKinsey Quarterly, 1999 Issue.
12. Tsun-yan Hsieh; Lavoie, Johanne; Samek, Robert A. P, Think global, hire local.,McKinsey Quarterly, 1999 Issue.
13. McClenahen, John S; ABB To Get An It Ceo, November 20, 2000.
14. ABB realigns organization around customers, www.abb.com, January 11, 2001.
15. A Great Leap, Preferably Forward, The Economist, January 20, 2001.
16. ABB: Huge Tremors At A Swiss Giant, Business Week Online, February 14, 2002.
17. Scandal and poor performance have forced ABB to open up, Economist, March 2,
2002.
18. The new drive, Business India, March 05, 2001.
19. Setting A New Course, Industry Week, March 19, 2001.
20. Hoffman, Brad A, “Real-time enterprise solutions with industrial it”, ABB Review,
www.abb.com, March 2001.
21. Tomlinson, Richard; Dethroning Percy Barnevik, www.fortune.com, March 21, 2002.
22. Neither Lender nor Borrower Be, Economist, March 30, 2002.
23. ABB sells Structured Finance business to GE Commercial Finance for US$ 2.3 billion, www.abb.com, September 4, 2002
24. New leadership at ABB, www.abb.com, September 5, 2002
25. Taylor, W, ABB Gets New CEO Amid Money Woes, ENR: Engineering News-Record,
September 16, 2002
26. ABB acts to lower cost base after weak Q3, www.abb.com, October 23, 2002.
27. Troubled ABB Plans Changes, ENR: Engineering News-Record, November 4, 2002.
28. Tomlinson, Richard, Mission impossible?, Fortune (Asia), November 18, 2002.
29. Europe's second biggest engineering group is dangerously close to collapse, Economist, November 26, 2002.
30. ABB Axes 10,000 Jobs, International Power Generation, November –December 2002.
31. Luckey Janes, The mighty fall, International Power Generation, November- December
2002.
32. ABB melds four divisions into two, Control Engineering, November 2002.
33. Ganesan, Senthil, ABB: Truly Global, Global CEO, www.icfaipress.org, January 2003.
34. Reed, Stabley; Arndt, Michael, Work Your Magic, Herr Dormann, Business Week,
February 10, 2003.
35. Tully, Kathryn, Finding ways out of the mire,. Euromoney, February 2003.
36. Sisodiya, Singh, Amit, ABB: The giant stumbles, The Analyst, www.icfaipress.org,
February 2003.

Reorganizing HP “If there are people who thought it would be over and done within 12 months, I would have said to them that they do not have an appreciation for what it takes to change a very large, very complex, very successful company -- because this company has been successful for decades.”
- HP CEO, Carly Fiorina, commenting on the restructuring, in February 2001.
“She’s playing CEO, visionary, and COO, and that’s too hard to do.”
- BusinessWeek, February 29, 2001.
THE PROBLEMS
In the mid 1990s, global computer major HP1 was facing major challenges in an
increasingly competitive market. In 1998, while HP’s revenues grew by just 3%,
competitor Dell’s rose by 38%. In the same year, HP’s share price remained more or
less stagnant, while competitor IBM’s increased by 65%. Analysts said HP’s culture,
which emphasized teamwork and respect for co-workers, had over the years translated
into a consensus-style culture that was proving to be a sharp disadvantage in the fast-
growing Internet business era. Analysts felt that instead of Lewis Platt, HP needed a
new leader to cope with the rapidly changing industry trends.
Responding to these concerns, the HP Board appointed Carleton S. Fiorina (Fiorina)2
in July 1999 as the CEO of the company. Revenues grew by 15% for the financial
year ended October 2000 (Refer Exhibit I), prompting industry watchers to say that
Fiorina seemed all set to put HP’s troubles behind for good. However, for the quarter
ended January 31, 2001, the net profits were well below the stock market
expectations. Soon there was more bad news from the company. In late January 2001,
after forcing a five-day vacation on the employees and putting off wage hikes for
three months in December 2000, HP laid off 1,700 marketing employees. By early
February 2001, HP’s share price fell by 18.9%, from $45 in July 1999 to $36.
In April 2001, citing a slowdown in consumer spending, Fiorina announced that HP’s
revenues would decrease by 2% to 4% for the quarter ending April 30, 2001. She also
said that HP would in all likelihood show no growth for the next two quarters. Many
analysts and competitors were surprised at this announcement. According to some
analysts, the major reason for the shortfall in revenue was Fiorina’s aggressive
management reorganization. They said that with the global slowdown in the
technology sector, it was the wrong time to reorganize.
Things worsened when HP laid off 6,000 more workers in July 2001. The lay-offs
came less than a month after 80,000 employees had willingly taken pay-cuts. The
management also sent memos saying that layoffs would continue and just
volunteering for pay-cuts would not guarantee continued employment. According to
company insiders, though these changes were necessary, they had affected employee
morale. Many employees had lost faith in Fiorina’s ability to execute her
reorganization plans.
1 With net revenues of $48.78 billion, HP ranked 19th in the global Fortune 500 list in 2001. The company was the second largest computer manufacturer in the world, and was the market leader in desktop computers, servers, peripherals and services such as systems integration.
2 The first CEO from outside HP, Fiorina had 20 years of experience at AT&T and Lucent.

272
Organizational Behavior
BACKGROUND NOTE
Stanford engineers Bill Hewlett and David Packard founded HP in California in 1938 as an electronic instruments company. Its first product was a resistance-capacity audio oscillator, an electronic instrument used to test sound equipment. During the 1940s, HP’s products rapidly gained acceptance among engineers and scientists. HP’s growth was aided by heavy purchases made by the US government during the Second World War.
Till the 1950s, HP had a well-defined line of related products, designed and manufactured at one location and sold through an established network of sales representative firms. The company had a highly centralized organizational structure with vice-presidents for marketing, manufacturing, R&D and finance. HP had 90 engineers in product development. To have a clear demarcation of goals and responsibilities, and to promote individual responsibility and achievement, HP began to organize these engineers into smaller, more efficient groups by forming four product development groups. Each group concentrated on a family of related products and had a senior executive reporting to the vice-president of R&D. The product-development staff functions were so restructured as to allow a design engineer to concentrate only on the division’s products and to work closely with the field salespeople.
As HP grew larger, it moved towards a divisional structure. By the 1960s, HP had many operating divisions, each an integrated, self-contained organization responsible for developing, manufacturing and marketing its own products. This structure, it was thought, would give each division considerable autonomy and create an environment that would encourage individual motivation, initiative, and creativity in working towards common goals and objectives. In the words of Packard, “We wanted to avoid bureaucracy and to be sure that problem-solving decisions be made as close as possible to the level where the problem occurred. We also wanted each division to retain and nurture the kind of intimacy, the caring for people, and the ease of communication that were characteristic of the company when it was smaller.”
In the 1960s, HP made organizational changes for the sales representative firms. These firms represented and sold the products of other non-competing electronics manufacturers along with those of HP. This arrangement was creating problems3 in the 1960s due to HP’s rapid growth. To get around these difficulties, HP set up its own sales organization, taking care not to break ties with the existing representatives who were encouraged to join the sales divisions of the company.
In 1968, HP adopted a group structure in response to the increasing number of operating divisions and product lines. Divisions with related product lines and markets were combined into a group headed by a group manager. Each group was made responsible for the coordination of divisional activities and the overall operations and financial performance of its members. The new structure had two objectives – to enable compatible units to work together more effectively on a day-to-day basis and to decentralize some top management functions so that the new groups would be responsible for some of the planning activities and other functions previously assigned to corporate vice-presidents.
The group structure improved HP’s field marketing activities by enabling sales engineers to understand and sell the entire line of HP products. Under this structure, the sales engineer became the representative of a specific group, selling and supporting only that group’s products. Packard said, “As the company moved to a group structure, I stressed to our people that this change did not represent any
3 HP’s growing product portfolio demanded more attention by the sales firms.
273
Reorganizing – HP
deviation from our traditional philosophy of management. From the beginning we had a strong belief that groups of people should be given full responsibility for specific areas of activity with wide latitude to develop their own plans and make their own decisions. Our new organization did not alter this basic concept, but strengthened it.”
By the early 1970s, HP had grown from a highly centralized, rather narrowly focused company into one with many widely dispersed divisions and activities. HP began to use a concept called ‘local decentralization,’ wherein a division was given the full responsibility for a product line (when it had grown large enough) at a separate, but close, location.
HP’s organizational charts provided only general guidelines. As one divisional
manager said, “In no way do charts dictate the channels of communication used by HP
people. We want our people to communicate with one another in a simple and direct
way, guided by common sense rather than by lines and boxes on a chart. To get the
job done, an individual is expected to seek information from the most likely source.
HP systems increasingly include products from different groups and divisions. Even
though an organization is highly decentralized, its people should be regularly
reminded that cooperation between individuals and coordinated efforts among
operating units are essential for growth and success. Although we minimize corporate
direction at HP, we consider ourselves one single company, with the flexibility of a
small company and the strengths of a large one – the ability to draw on corporate
resources and services, shared standards, values and culture, common goals and
objectives, and a single world-wide identity.”
Notwithstanding the efforts made by the top management to generate synergies across
divisions, the decentralized structure that HP had, till the 1980s, created major
problems for the company. HP began to be perceived by users as three or four
companies, with little coordination between them. When users of HP 3000 computers
went to buy HP printers, they found that the software loaded on their computers
(which were made by another HP division) wouldn’t allow them to use it for graphics.
In the 1990s, HP found that its elaborate network of committees was slowing down its
ability to take quick decisions, especially those pertaining to new product
development. To address this problem, the then CEO John Young, dismantled the
committee network, and as a part of reorganization, also cut a layer of management
from the hierarchy. He further decentralized decision-making and divided the
computer business into two primary groups. One group was made responsible for PCs,
printers and other products sold though dealers and the other for workstations and
minicomputers sold to large customers. To enable the company to respond faster to
market needs, each group was given its own sales and marketing team. These changes
enabled HP to gain market share in workstations and minicomputers, and till the mid
1990s, HP performed well. The company’s huge success in printers and PCs had
increased revenues from $13.2 billion in 1990 to $38.42 billion in 1996, with profits
increasing at a fast pace.
However, with the growth in size of operations, came problems as well. With 83
different product divisions, the bureaucracy had increased significantly. For instance,
when Best Buy, a retailing company wanted to buy some computer products, 50 HP
employees came forward to sell their units’ products. A former executive at HP said,
“I left HP because I did not want to spend 80% of my time managing internal
bureaucracy anymore.” He revealed that he once had to get an operational change
cleared by 37 different internal committees.

274
Organizational Behavior
There were reports that the bureaucracy was hindering innovation as well4. Managers
were often reluctant to invest in new ideas for fear of missing their quarterly goals –
HP had not had a mega-breakthrough product since the inkjet printer was introduced
in 1984. Despite the lack of new products, Platt did nothing to motivate the product
development teams. Instead, he focused on promoting diversity in the workplace and
on ensuring a more humane balance of work and personal life for HP employees.
Analysts felt that while these efforts were praiseworthy, they did little to help the
company face the tough business environment in which it was operating.
Meanwhile, HP spun off its test-and-measurement unit (See Exhibit II) and divided its
huge portfolio of products into four divisions – Home PCs, Handhelds, and Laptops;
Scanners, Laser Printers, and Printer Paper; Consulting, Security Software, and Unix
Servers; and Ink Cartridges, Digital Cameras, and Home Printers. The head of each of
these divisions was given the same powers as that of a CEO. However, the company’s
stagnant revenues and the declining profit growth rate in 1998 compounded its
problems. It was at this stage that Fiorina took over the company’s reins.
THE FIORINA REORGANIZATION
Fiorina immediately introduced several changes, in an attempt to set things right at
HP. She began by demanding regular updates on key units. She also injected the
much-needed discipline into HP’s computer sales force, which had reportedly
developed a habit of lowering sales targets at the end of each quarter. Sales
compensation was tied to performance and the bonus period was changed from once a
year to every six months.
HP Labs, the company’s R&D center had only been making incremental
improvements to existing products. This was because engineers’ bonuses were linked
to the number, rather than the impact of their inventions. To boost innovation and new
product development, Fiorina increased focussed on ‘breakthrough’ projects. She
started an incentive program that paid researchers for each patent filing.
Fiorina developed a multiyear plan to transform HP from a ‘strictly hardware
company’ to a Web services powerhouse (See Exhibit III). To achieve this plan,
Fiorina dismantled the decentralized organization structure. In early 2000, HP had 83
independent product divisions, each focused on a product such as scanners or security
software. The company had 83 product chiefs having their own R&D budgets, sales
staff, and profit-and-loss responsibility. In a bid to make HP an effective selling
organization, Fiorina reorganized these units into six centralized divisions (See
Exhibit IV). Three of these were product development groups – printers, computers,
and tech services & consulting (the ‘back-end’ units) and the other three were sales
and marketing groups – for consumers, corporate markets, and consulting services
(the ‘front-end’ units).
The back-end units developed and built computers, and handed over the products to
the front-end groups that sold these products to consumers as well as corporations.
Fiorina expected the new structure to strengthen collaboration, between sales &
marketing executives and product development engineers thus helping to solve the
customer problems faster. Industry experts said that this was the first time a company
4 In 1993, a researcher showed Platt a prototype Web browser – two years before Netscape Communications became the first Internet Company to release its Navigator browser. Platt reportedly told to show the same to the company’s computer division. Eventually, it was not accepted.

275
Reorganizing – HP
with thousands of product lines and scores of businesses had attempted a front-back
approach, a strategy that required laser focus and superb coordination.
The new arrangement solved a number of long-standing HP problems, making the company far easier to do business with. Rather than too many salespeople from various divisions, now customers dealt with one person. It helped HP’s product designers focus on what they did best and gave the front-end marketers authority to make the deals that were most profitable for the company. For instance, now they could sell a server at a lower margin to customers who opted for long-term consulting services. The new R&D strategy resulted in the doubling of patent filings from HP in 2001 to 3000, putting the company among the top three patent filers in the world.
However, the reorganization soon ran into problems. In the past, HP’s product chiefs had run their own operations from designing of the product to providing sales and support. In the new set-up, they had a very limited role. Though they were still responsible for keeping HP competitive, achieving cost goals, and getting products to market on time, they had to pass on those products to the front-end organizations responsible for marketing and selling them. With no authority to set sales forecasts, back-end managers were unable to allocate the R&D funds accordingly. At the same time, front-end sales representatives had trouble meeting their forecast if their back-end colleagues came up with the wrong products.
With HP’s 88,000 employees adjusting to the biggest reorganization in the company’s history, expenses had risen out of control. According to one HP manager, “It was frantic. The financial folks were running all around looking for more dollars.” Freed from the decades-old lines of command, employees began spending heavily, with dinner and postage expenses running far over the normal amount. Such lavish spending was rare under the old structure where product chiefs kept a tight control on their expenditures.
Analysts also claimed that in the new structure, the back-end product designers would not be able to stay close enough to the customers to deliver products as per their requirements. Neither would the executives responsible for selling thousands of HP products be able to give sufficient attention to each of the products. Moreover, while productivity-linked commissions to the sales force were intended to boost revenues and profitability, they only helped in raising sales for low-margin products that did little for corporate profits.
The new structure did not clearly assign responsibility for profits and losses. With responsibility for growth and profits shared between front-and back-end managers, there was less financial control and more disorder. With employees in 120 countries, redrawing the lines of communication and getting personnel from different divisions to work together was proving very troublesome. According to one HP manager, “The people who deal with Fiorina directly feel very empowered, but everyone else is running around saying, ‘What do we do now?’”
HP’s customers were not happy either. The front-back reorganization had created confusion internally, and many customers said they had noticed little improvement. According to one computer reseller who had struggled for two months to get HP to work out a customized configuration for one of its new servers, “It’s beyond my ability to communicate our frustration. It’s painful to watch them mess up million-dollar deals.”
HP IN TROUBLE
Apart from these structural problems, Fiorina’s tenure reportedly did little to improve
HP’s business performance. The market share gains made in Fiorina’s first year as
CEO had begun to recede in late 2000. While HP continued to dominate the inkjet and

276
Organizational Behavior
laser printer business with a 41% market share, its PC share had fallen from 7.8% to
6.9% for the 12 months ended January 31, 2001.
Sales of HP’s Windows servers had dropped from 10.6% to 8.2% in the same period.
HP did not perform well in the software, storage and consulting businesses where it
had only a single-digit market share. However, HP’s share of the high-end Unix server
business had increased to 28% in the quarter ended January 31, 2001, (up from 23.3%
the year before).
According to analysts, Fiorina had tried an approach that had never been attempted
before at a company of HP’s size and complexity. She was accused of being over-
ambitious in trying to tackle all of HP’s problems together at the same time. They said
that putting in place such sweeping changes was tough anywhere – more so in the case
of the tradition-bound HP, already suffering from the slowdown in the technology
sector.
Questions for Discussion:
1. HP had consistently transformed itself to meet the needs of the changing business
environment over the years. Analyze the company’s reorganization efforts in the
pre-Fiorina era and comment on their efficacy.
2. Examine the restructuring plan put in place by Fiorina and critically comment on its advantages and disadvantages in light of the company’s performance after the plan’s implementation.
© ICFAI Center for Management Research. All rights reserved.
.

277
Reorganizing – HP
Exhibit I
HP’s Consolidated Condensed Statements of Operations
(In $ million, except per share data)
Year ended October 31, 2001 2000 1999 1998
Net Revenue 45,226 48,870 42,370 39,419
Costs and expenses:
Costs of products sold and services 33,474 35,046 34,135 27,790
Research and Development 2,670 2,634 2,440 2,380
Selling, general and administrative 7,259 7,063 6,522 5,850
Restructuring Charges 384 102 -- --
Total costs and expenses 43,787 44,845 38,682 36,020
Earnings from operations 1,439 4,025 3,688 3,399
Interest income and other, net 171 356 708 530
Litigation Settlement 400 -- -- --
Losses (gains) on divestitures 53 244
Interest expense -- -- 202 235
Earning from continuing operations before taxes
702 4,625 4,194 3,694
Provision for taxes 78 1,064 1,090 1,016
Net earnings from continuing operations 621 3,561 3,104 2,678
Net earnings from discontinued operations -- 136 387 267
Net earnings 624 3,697 3,491 2,945
Net earnings per share:
Basic 0.32 1.87 1.73 1.42
Diluted 0.21 1.80 1.67 1.39
Source: HP Annual Report 2000

278
Organizational Behavior
CHAIRMAN, PRESIDENT AND CHIEF EXECUTIVE OFFICER
LEWIS PLATT
FINANCE AND
ADMIN. BOB
WAYMAN
MEASUREMENT HED BAMHOLT
INKJET PRODUCTS
ANTONIO PEREZ
LASERJET SOLUTIONS CAROLYN TICHNOR
PERSONAL SYSTEMS
DIANA LITMOR
ENTERPRISE COMPUTING SOLUTIONS
ANN LIVERMORE
GEN.ERAL COUNSEL,
CORPORATE AFFAIRS
COMPONENTS INKJET
TECHNOLOGY PERSONAL LASER JETS
INFORM -ATION
STORAGE ENTERPRISE
SYS.TEM & SOFTWARE
ENTERPRISE MARKETING
HP LABS
INTERNAL AUDIT
MEDICAL HOMESOLUTIONS
COMMERCIAL LASERJETS
BUSINESS PC ORGANIZAT.
BUSINESS CRITICAL
COMPUTING
FINANCING & COMPLE
-MENTS
CUSTOMER ADVOCACY
ENTERPRISE STORAGE
CUSTOMER SERVICE & SUPPORT
GM.EXECUTIVE COMMITTEE
INTERNET BUSINESS
OPENVIEW SOFTWARE
COMMUN -ICATION INDUSTRY
SYSTEMS AND
TECHNO -LOGY
ENTERPRISE ACCOUNTS
SERVICE & SUP..SALES
SERVICES
SUPPORT
FIELD SUPPORT
GEOGRAPHIC OPERATIONS
CONTROLLER
CORPORATE DEVELOP.
INFORMAT. SYSTEMS
TREASURY
HUMANRESOURCES
TAX, LICENSING
AND CUSTOMS
REAL ESTATE BENEFIT FUND
INVESTMENT
Y2K PROGRAM
CHEMICAL ANALYSIS
HP PRODUCT PROCESSES
TEST AND MEASURE
-MENT
AUTOMATED TEST
COMMS. TEST SOLUTIONS
OFFICE SOLUTIONS
CPG OPERATIONS
CONSUMER SALES AND
MARKETING
ELECTRONIC INSTRUM
-ENTS
MICROWAVE& COMMS.
SALES AND MARKETING
HARD COPY SOL. &
SERVICES
APPLIANCE &
SCANNERS
COMMERCIAL CHANNELS
HOMEPRODUCTS
WORK -STATION SYSTEMS
COMMERCIAL CHANNELS
Exhibit II HP – Corporate Organization (1995)
Source: www.hp.com

279
Reorganizing – HP
Exhibit III
Fiorina’s three Phase Restructuring Plan
PHASE I, 1999: PREPARE THE GROUND
SPREAD THE GOSPEL: Held ‘Coffee with Carly’' sessions in 20 countries to
boost morale. Convinced top lieutenants that HP needs to match the growth of
rivals.
ONE IMAGE: Merged HP’s fragmented ad effort under one all-encompassing
‘Invent’ campaign.
SPARK INNOVATION: Reoriented HP’s R&D lab away from incremental
product improvements and toward big-bang projects such as nanotechnology for
making superpowerful chips.
PHASE II, 2000: IMPROVE GROWTH AND PROFITS IN CORE BUSINESSES
CONSOLIDATE: Reorganized HP’s 83 product divisions into four units: two
product development units that worked with two sales and marketing groups – one
aimed at consumers, the other at corporations.
SET STRATEGY: Created a nine-member Strategy Council to allocate resources
to the best opportunities rather than leaving strategy to product chieftains.
WHACK COSTS: Lowered expenses by $1 billion by revamping internal
processes to tap the power of the Web.
PHASE III, 2001 AND BEYOND: BUILD NEW MARKETS
TRIGGER NEW PRODUCT CATEGORIES: Established cross-company
initiatives to develop altogether new Net-related businesses.
WOO CUSTOMERS: Offered soup-to-nuts solutions for customers by creating
teams from across HP that sold to major accounts.
GOOD CORPORATE CITIZEN: Used HP’s resources to create subsidized or
low-cost computer centers and services to make the Net available to everyone.
Source: BusinessWeek, February 19, 2001.
CONSULTING, SECURITY
SOFTWARE UNIX
INK GARTRIDES, DIGITAL GAMERAS,
HOME PRINTERS
CONSULTING, SECURITY
SOFTWARE, UNIX SERVERS
SCANNERS, LASER PRINTERS, PRINTER
PAPER
EXECUTIVE COUNCIL
CEO
THE OLD HP Each product unit was responsible for its own profit/loss
Exhibit IV
HP – Corporate Organization (Old)

280
Organizational Behavior
Source: Business Week, February 19, 2001.
HP – Corporate Organization (New)
The New HP
The Strategy Council Nine Fast rising managers who advise the executive council on allocating money and people to growth initiatives
Carly Fiorina Authority Recommendations Ideas & Innovations Products & Information
Executive Council Eight top lieutenants including heads of the four front and back-end groups.
FRONT END
CORPORATE SALES
$34 billion in annual revenues Job: Meet near-term financial targets by selling technology solutions to corporate clients. Keep back-end units abreast of what’s hot.
PRINTERS43% of annual production Job: Build new printing and imaging products to ensure HP’s long term growth. Track trends with help from
front-end units.
BACK END
FRONT END
CONSUMER SALES
$15 billion in annual revenues Job: Sell consumer gear with focus on meeting current-year earnings and revenue goals. Let back end know of must-have products and features.
COMPUTERS 57% of annual production Job: Focus on future success by making computers that companies and consumers want, with
sales input from front end.
BACK END
CROSS-COMPANY INITIATIVES
Personnel from the front and back-end groups collaborate on projects aimed at sniffing out new markets that will
create growth.
DIGITAL IMAGING
Make photos, drawings and videos as easy to create, store and
send as e-mail.
WIRELESSSERVICES
Develop wireless technologies that will fuel sales of HP-made devices ranging from handhelds to
servers.
COMMERCIAL PRINTING
Divert printing jobs from offset presses to net-linked HP
printers.

281
Reorganizing – HP
Additional Readings & References: 1. Burrows Peter, HP’s Carly Fiorina: The Boss, BusinessWeek, August 02, 1999.
2. Burrows Peter, Making a New HP Way, BusinessWeek, August 02, 1999.
3. Burrows Peter, Can Fiorina Reboot HP? BusinessWeek, November 27, 2000.
4. Burrows Peter, The Radical, BusinessWeek, February 29, 2001.
5. Burrows Peter, Carly to HP: Snap to it, BusinessWeek, February 29, 2001.
6. Zellen Barry, Reinventing the Heart of HP, www.interex.org
7. www.hp.com
8. HP Annual Report 2000

Change Management@ICICI “What role am I supposed to play in this ever-changing entity? Has anyone worked out the basis on which roles are being allocated today?”
- A middle level ICICI manager, in 1998.
“We do put people under stress by raising the bar constantly. That is the only way to ensure that performers lead the change process.”
- K. V. Kamath, MD & CEO, ICICI, in 1998.
THE CHANGE LEADER
In May 1996, K.V. Kamath (Kamath) replaced Narayan Vaghul (Vaghul), CEO of
India’s leading financial services company Industrial Credit and Investment
Corporation of India (ICICI). Immediately after taking charge, Kamath introduced
massive changes in the organizational structure and the emphasis of the organization
changed - from a development bank1 mode to that of a market-driven financial
conglomerate.
Kamath’s moves were prompted by his decision to create new divisions to tap new
markets and to introduce flexibility in the organization to increase its ability to
respond to market changes. Necessitated because of the organization’s new-found aim
of becoming a financial powerhouse, the large-scale changes caused enormous tension
within the organization. The systems within the company soon were in a state of
stress. Employees were finding the changes unacceptable as learning new skills and
adapting to the process orientation was proving difficult.
The changes also brought in a lot of confusion among the employees, with media
reports frequently carrying quotes from disgruntled ICICI employees. According to
analysts, a large section of employees began feeling alienated. The discontentment
among employees further increased, when Kamath formed specialist groups within
ICICI like the ‘structured projects’ and ‘infrastructure’ group.
Doubts were soon raised regarding whether Kamath had gone ‘too fast too soon,’ and
more importantly, whether he would be able to steer the employees and the
organization through the changes he had initiated.
BACKGROUND NOTE
ICICI was established by the Government of India in 1955 as a public limited
company to promote industrial development in India. The major institutional
shareholders were the Unit Trust of India (UTI), the Life Insurance Corporation of
India (LIC) and the General Insurance Corporation of India (GIC) and its subsidiaries.
The equity of the corporation was supplemented by borrowings from the Government
of India, the World Bank, the Development Loan Fund (now merged with the Agency
for International Development), Kreditanstalt fur Wiederaufbau (an agency of the
Government of Germany), the UK government and the Industrial Development Bank
of India (IDBI).
1 Developmental Financial Institutions were set up with principal objective of providing term finance for fixed asset formation in Industry.

283
Change Management @ ICICI
The basic objectives of the ICICI were to
assist in creation, expansion and modernization of enterprises
encourage and promote the participation of private capital, both internal and external
take up the ownership of industrial investment; and
expand the investment markets.
Since the mid 1980s, ICICI diversified rapidly into areas like merchant banking and
retailing. In 1987, ICICI co-promoted India’s first credit rating agency, Credit Rating
and Information Services of India Limited (CRISIL), to rate debt obligations of Indian
companies. In 1988, ICICI promoted India’s first venture capital company –
Technology Development and Information Company of India Limited (TDICI) – to
provide venture capital for indigenous technology-oriented ventures.
In the 1990s, ICICI diversified into different forms of asset financing such as leasing,
asset credit and deferred credit, as well as financing for non-project activities. In 1991,
ICICI and the Unit Trust of India set up India’s first screen-based securities market,
the over-the-counter Exchange of India (OCTEI). In 1992 ICICI tied up with J P
Morgan of the US to form an investment banking company, ICICI Securities Limited.
In line with its vision of becoming a universal bank, ICICI restructured its business
based on the recommendations of consultants McKinsey & Co in 1998. In the late
1990s, ICICI concentrated on building up its retail business through acquisitions and
mergers. It took over ITC Classic, Anagram Finance and merged the Shipping Credit
Investment Corporation of India (SCICI) with itself. ICICI also entered the insurance
business with Prudential plc of UK.
ICICI was reported to be one of the few Indian companies known for its quick
responsiveness to the changing circumstances. While its development bank
counterpart IDBI was reportedly not doing very well in late 2001, ICICI had major
plans of expanding on the anvil. This was expected to bring with it further challenges
as well as potential change management issues. However, the organization did not
seem to much perturbed by this, considering that it had successfully managed to
handle the employee unrest following Kamath’s appointment.
CHANGE CHALLENGES – PART I
ICICI was a part of the club of developmental finance institutions (DFIs – ICICI,
IDBI and IFCI) who were the sole providers of long-term funds to the Indian industry.
If the requirement was large, all three pooled in the money. However, the deregulation
beginning in the early 1990s, allowed Indian corporates’ to raise long-term funds
abroad, putting an end to the DFI monopoly. The government also stopped giving
DFIs subsidized funds. Eventually in 1997, the practice of consortium lending by
DFIs was phased out.
It was amidst this newfound independent status that Kamath, who had been away
from ICICI for eight years working abroad2, returned to the helm. At this point of
time, ICICI had limited expertise, with its key activity being the disbursement of
eight-year loans to big clients like Reliance Industries and Telco through its nine zonal
2 Though Kamath had started his career with ICICI, he had left the bank to join Asian Development Bank (ADB) in Manila in 1988.

284
Organizational Behavior
offices. In effect, the company had one basic product, and a customer orientation,
which was largely regional in nature.
Kamath, having seen the changes occurring in the financial sector abroad, wanted
ICICI to become a one-stop shop for financial services. He realized that in the
deregulated environment ICICI was neither a low-cost player nor was it a
differentiator in terms of customer service. The Indian commercial banks’ cost of
funds was much lower, and the foreign banks were much more savvy when it came to
understanding customer needs and developing solutions. Kamath identified the main
problem as the company’s ignorance regarding the nuances of lending practices in
newly opened sectors like infrastructure.
The change program was initiated within the organization, the first move being the
creation of the ‘infrastructure group (IIG),’ ‘oil & gas group (O&G),’ ‘planning and
treasury department (PTD)’ and the ‘structured products group (SPG)’, as the lending
practices were quite different for all of these. Kamath picked up people from various
departments, who he was told were good, for these groups.
The approach towards creating these new skill sets, however, led to one unintended
consequence. As these new groups took on the key tasks, a majority of the work,
along with a lot of good talent, shifted to the corporate center. While the zonal offices
continued to do the same work - disbursing loans to corporates in the same region -
their importance within the organization seemed to have diminished. An ex-employee
remarked, “The way to get noticed inside ICICI after 1996 has been to attach yourself
to people who were heading these (IIG, PTD, SPG, O&G) departments. These groups
were seen as the thrust areas and if you worked in the zones it was difficult to be
noticed.”
Refuting this, Kamath remarked, “This may be said by people who did not make it.
And there will always be such people.” Some of the people who did not fit in this set-
up were quick to leave the organization. However, this was just the beginning of
change-resistance at ICICI.
Another change management problem surfaced as a result of ICICI’s decision to focus
its operations much more sharply around its customers. In the system prevailing, if a
client had three different requirements from ICICI,3 he had to approach the relevant
departments separately. The process was time consuming, and there was a danger that
the client would take a portion of that business elsewhere. To tackle this problem,
ICICI set up three new departments: major client group (MCG), growth client group
(GCG) and personal finance group. Now, the customer talked only to his
representative in MCG or GCG. And these representatives in turn found out which
ICICI department could do the job.
Though the customers seemed to be happy about this new arrangement, people within
the organization found it unacceptable. In the major client group, a staff of about 30-
40 people handled the needs of the top 100 customers of ICICI. On the other hand,
about 60 people manned the growth client group, which looked after the needs of mid-
size companies. Obviously, the bigger clients required more diverse kinds of services.
So working in MCG offered better exposure and bigger orders. The net effect was that
the MCG executive ended up doing more business than the GCG executive. A middle-
level manager at ICICI commented, “The bosses may call it handling growth clients
3 For instance, an eight-year loan, merger and acquisition advice and working capital requirements.
285
Change Management @ ICICI
but the GCG manager is actually chasing non-performing assets (NPA)4 and Board of
Industrial and Financial Restructuring (BIFR)5 cases.”
Kamath was quick to deny this allegation as well, “Just because somebody is within
the MCG does not guarantee him success. And these assignments are not permanent.
Today’s MCG man could easily by tomorrow’s GCG person and vice-versa.”
Complaints against these changes put in continued and ICICI was blamed for not
putting in adequate systems in place to develop the right people. The manner, which
ICICI recognized an individual’s efforts - the feedback process - was also questioned.
A manager remarked, “Last year the bonuses varied from Rs 30,000 to Rs 250,000
depending on the performance. In many cases the appraisal scores were same but the
bonus amount was not. And we were not told why.”
With Kamath’s stated objective to make ICICI provide almost every financial service,
separating the customer service people from the product development groups was
another problem area. In the current scheme of things, an MCG or GCG person acted
as a clients’ representative inside ICICI. The MCG or GCG person understood the
client’s need and got the relevant internal skill department to develop a solution.
Unlike foreign banks, there were no demarcations between these internal skill groups
and client service person. (Demarcation helped in preventing an internal skills person
from cannibalizing business being developed by the client service group.) With no
such systems in place at ICICI, this distorted the compensation packages between the
competing divisions.
While Kamath’s comments in the media seemed to dismiss many of the employee
complaints, ICICI was in fact, putting in place a host of measures to check this unrest.
One of the first initiatives was regarding imparting new skills to existing employees.
Training programmes and seminars were conducted for around 257 officers by
external agencies, covering different areas. In addition, in-house training programmes
were conducted in Pune and Mumbai. During 1995-96, around 35 officers were
nominated for overseas training programmes organized by universities in the US and
Europe. ICICI also introduced a two-year Graduates’ Management Training
Programme (GMTP) for officers in the Junior Management grades.
Along with the training to the employees, management also took steps to set right the
reward system. To avoid the negative impact of profit center approach, wherein
pressure to show profits might affect standards of integrity within an organization,
management ensured that rewards were related to group performance and not
individual performances. To reward individual star performers, the method of
selecting a star performer was made transparent. This made it clear, that there would
be closer relationship between performance and reward.
However, it was reported that pressure on accountability triggered off some levels of
anxiety within ICICI which resulted in a lot of stress in human relationships.
Dismissing reports of upsetting people, Kamath said, ‘much of the restructuring plan
has come from the bottom.’
4 Non performing Assets (NPAs) are loans on which interest payments have been due for more than one quarter (3 months) and in the case of monthly installments have been due for more than 3 installments.
5 The Board for Industrial and Financial Reconstruction (BIFR) is responsible for the revival of companies declared sick. A company is declared sick if it has incurred losses continuously for 3 years and its networth turns negative.

286
Organizational Behavior
ICICI also reviewed the compensation structure in place. Two types of remuneration
were considered – a contract basis which would attract risk-takers and a tenure-based
compensation which would be appealing to employees who wanted security. Kamath
accepted that ICICI had been a bit slow on completing the employee feedback
process. Soon, a 360-degree appraisal system was put in place, whereby an individual
was assessed by his peers, seniors and subordinates. As a result of the above
measures, the employee unrest gradually gave way to a much more relaxed
atmosphere within the company.
By 2000, ICICI had emerged as the second largest financial institution in India with assets worth Rs 582 billion. The company had eight subsidiaries providing various financial services and was present in almost all the areas of financial services: medium and long term lending, investment and commercial banking, venture capital financing, consultancy and advisory services, debenture trusteeship and custodial services.
CHANGE CHALLENGES – PART II
ICICI had to face change resistance once again in December 2000, when ICICI Bank
was merged with Bank of Madura (BoM)6. Though ICICI Bank was nearly three
times the size of BoM, its staff strength was only 1,400 as against BoM’s 2,500. Half
of BoM’s personnel were clerks and around 350 were subordinate staff.
There were large differences in profiles, grades, designations and salaries of personnel
in the two entities. It was also reported that there was uneasiness among the staff of
BoM as they felt that ICICI would push up the productivity per employee, to match
the levels of ICICI7. BoM employees feared that their positions would come in for a
closer scrutiny. They were not sure whether the rural branches would continue or not
as ICICI’s business was largely urban-oriented.
The apprehensions of the BoM employees seemed to be justified as the working
culture at ICICI and BoM were quite different and the emphasis of the respective
management was also different. While BoM management concentrated on the overall
profitability of the Bank, ICICI management turned all its departments into individual
profit centers and bonus for employees was given on the performance of individual
profit center rather than profits of whole organization.
ICICI not only put in place a host of measures to technologically upgrade the BoM
branches to ICICI’s standards, but also paid special attention to facilitate a smooth
cultural integration. The company appointed consultants Hewitt Associates8 to help in
working out a uniform compensation and work culture and to take care of any change
management problems. ICICI conducted an employee behavioral pattern study to
assess the various fears and apprehensions that employees typically went through
during a merger. (Refer Table I).
6 Bank of Madura was established in 1943 at Madurai, Tamil Nadu. By 2000, it was number one bank in Tamil Nadu and it had 278 branches all over India.
7 In 1999-2000 business per employee at ICICI averaged Rs. 59.5 million to BoM’s Rs 22 million and profit per employee was Rs 0.78 million to BoM’s Rs 0.17 million.
8 Hewitt Associates is a global management consulting and outsourcing firm specializing in human resource solutions.
287
Change Management @ ICICI
Table I
‘Post-Merger’ Employee Behavioral Pattern
PERIOD EMPLOYEE BEHAVIOR
Day 1 Denial, fear, no improvement
After a month Sadness, slight improvement
After a Year Acceptance, significant improvement
After 2 Years Relief, liking, enjoyment, business development activities
Source: www.sibm.edu
Based on the above findings, ICICI established systems to take care of the employee resistance with action rather than words. The ‘fear of the unknown’ was tackled with adept communication and the ‘fear of inability to function’ was addressed by adequate training. The company also formulated a ‘HR blue print’ to ensure smooth integration of the human resources. (Refer Table II).
Table II
Managing HR during the ICICI-Bom Merger
THE HR BLUEPRINT AREAS OF HR INTEGRATION
FOCUSSED ON
A data base of the entire HR structure
Road map of career
Determining the blue print of HR moves
Communication of milestones
IT Integration – People Integration –Business Integration.
Employee communication
Cultural integration
Organization structuring
Recruitment & Compensation
Performance management
Training
Employee relations
Source:www.sibm.edu
To ensure employee participation and to decrease the resistance to the change,
management established clear communication channels throughout to avoid any kind
of wrong messages being sent across. Training programmes were conducted which
emphasized on knowledge, skill, attitude and technology to upgrade skills of the
employees. Management also worked on contingency plans and initiated direct
dialogue with the employee unions of the BoM to maintain good employee relations.
By June 2001, the process of integration between ICICI and BoM was started. ICICI
transferred around 450 BoM employees to ICICI Bank, while 300 ICICI employees
were shifted to BoM branches. Promotion schemes for BoM employees were initiated
and around 800 BoM officers were found to be eligible for the promotions. By the end
of the year, ICICI seemed to have successfully handled the HR aspects of the BoM
merger. According to a news report9, “The win-win situation created by….HR
initiatives have resulted in high level of morale among all sections of the employees
from the erstwhile BoM.”
9‘Bank of Madura & ICICI Bank merger proceeds smoothly,’ www.rediff.com, September 27, 2001.
288
Organizational Behavior
Even as the changes following the ICICI-BoM merger were stabilizing, ICICI
announced its merger with ICICI Bank in October 2001. The merger, to be effective
from March 2002, was expected to unleash yet another series of changes at the
organization. With Kamath still heading ICICI, analysts were hopeful that the bank
would come out successfully in the task of integrating the operations of both the
entities this time as well.
Questions for Discussion:
1. ‘The changed focus of ICICI to become a one-stop shop for financial services necessitated the changes in the organization culture and goals.’ Analyze the changes implemented by Kamath in mid-1990s and comment briefly on the necessity and efficacy of these changes.
2. Compare and contrast the change management process at ICICI initiated after Kamath became the CEO with the one following the ICICI-BoM merger. Also explain the rationale behind the employee resistance in both the cases.
© ICFAI Center for Management Research. All rights reserved.

289
Ch
an
ge M
an
ag
em
en
t @
IC
ICI
Exh
ibit
I
Org
aniz
atio
nal
Str
uct
ure
of
ICIC
I (2
001)
Mr.
K.V
. K
amat
h
MD
& C
EO
Mrs
. L
alit
a D
. G
upta
Jo
int
MD
& C
EO
M
r. S
.H.
Bhoja
ni
De p
uty
MD
M
r. S
anje
ev K
erk
er
SG
M –
Ris
k M
anag
emen
t
Mrs
. S
hal
ini
Shah
G
M –
Acc
ou
nts
&
Tax
atat
ion
Mr.
A.T
. K
usr
a
GM
- H
RD
Mr.
V. S
rin
ivas
an
G.M
. S
ecre
tari
al C
ust
odia
l S
ervic
esS
AP
– C
entr
al O
per
atio
ns
–
Gro
up
- M
IS
Mr.
R
.Ven
kat
arag
hav
a
n
Mrs
. K
alpar
a M
olp
aria
S
GM
- L
egal
Mrs
. K
alp
ana
Mo
rpar
ia
SG
M -
Tre
asury
M
r. S
. M
ukher
ji
Maj
or
Cli
ent
Gro
up
Mrs
. S
hik
ha
Sh
arm
a S
GM
– P
erso
nal
F
inan
cial
Ser
vic
es
Mr.
M.J
. S
ubbai
ah
SG
M –
Gro
wth
Cli
ent
Gro
up
Mr.
Arv
ind
Jo
shi
GM
- I
T
Mr.
S.P
. N
agar
Kat
te
GM
– M
&A
Dr.
Nac
hik
et M
or
GM
–T
reas
ury
(I
nv
estm
ents
–
Eco
no
mic
Res
earc
h)
Mr.
S. K
has
noti
s
GM
– W
este
rn R
egio
n
Mrs
. R
aman
i N
irula
GM
– N
ort
her
n R
egio
n
Dr.
S.C
. N
and
a G
M –
Cor p
ora
te M
arket
ing
Mr.
R. K
annan
GM
– O
il &
Gas
M
rs.
Ch
anda
Koch
har
GM
- M
CG
Mr.
A.
Mu
ker
ji
GM
– I
nfr
astr
uct
ure
Gro
up,
Str
uct
ure
d P
roduct
s, A
dv
isory
Ser
vic
es
Sourc
e: w
ww
.ici
ci.c
om

290
Organizational Behavior
Exhibit II Employee Strength over the Years
YEAR NUMBER OF EMPLOYEES
1993 1117
1994 1237
1995 1237
1996 1239
2001 8275
Source: ICICI Annual reports
Exhibit III
ICICI Profitabilty over the Years
(in Rs billion)
YEAR PAT
1994-95 3.10
1995-96 3.90
1996-97 4.36
1997-98 7.52
1998-99 10.86
1999-00 10.01
2000-01 12.06
Source: ICICI Annual Reports

291
Change Management @ ICICI
Additional Readings & References:
1. Hema B., Rebuilding ICICI, Business India, May 20, 1996.
2. Sriram N., Reinventing ICICI, Business World, May 29, 1996.
3. Shedding Fat, Business Standard, September 1, 1998.
4. George Cherian, ICICI Revamps Set-Up, The Economic Times, March 21, 1999.
5. Smith Alexander George, ICICI Bank begins integration of BoM, www.rediff.com, June 13, 2001.
6. Jayakar Roshni & Arora Sunit, ICICI: The Melting Pot, www.bestemployers.com.
7. www.icici.com.
8. www.indiainfoline.com.

Microsoft's People Problems "I hire smart people that are pretty high bandwidth, and I challenge them to think. I ask them to be pretty committed and to work pretty hard."
-Bill Gates, Founder of Microsoft1
“The real problem for Microsoft is going to be to learn to use the carrot when the stick has been the dominant tool.”
-Jim Seymour, president, Seymour Group,
an information-strategies consulting firm2
In early 1999, the top management of Microsoft Corp. undertook a comprehensive,
system-wide restructuring of the company. The reorganization was initiated by the
then CEO and chairman Bill Gates and the company president Steve Ballmer. The
primary objective of the reorganization was to shift the focus of the company from
being product-oriented to being customer-oriented. Gates and Ballmer called this
initiative V-2 (short for Vision 2) and said that the new structure was part of the
“reinvention” of Microsoft.
The company was reorganized into different core divisions on the basis of the target
customer groups served, namely information technology managers, knowledge
workers, software developers and consumers. Some observers suggested that this
initiative was undertaken because of the anti-trust proceedings initiated against
Microsoft the previous year. The company feared the court would rule that Microsoft
be split into two companies - one for Windows and the other for applications software,
and wanted to be ahead of the ruling.
However, some observers felt there was a deeper motive. They believed the
restructuring was undertaken to counter the frustration felt with the growing
bureaucracy in the company by many of Microsoft's employees. By creating a new
structure, Gates and Ballmer sought to reinvigorate the company by giving its
employees greater responsibility in their jobs. In the original structure, all decisions
had to be approved by Gates and Ballmer. The new structure sought to give the upper
management a freer hand in running their divisions. They hoped this would give
higher level managers a more challenging and personally rewarding work
environment.
Microsoft, one of the biggest and, arguably, the most powerful company in the
software industry, experienced a unique problem in the late 1990s. A large number of
its top executives left the company to retire or set up their own businesses. Most of
these employees had been with the company for between five and ten years and had
played an important role during its phase of growth. As the company grew in size and
power, it became more bureaucratic and lost some the elements of the work culture
that had so endeared it to employees when it was growing. This change in culture,
coupled with the internet boom of that period, prompted the employees to leave the
company and set out on their own. The restructuring initiative also was meant to
overcome some of the disadvantages of size and create a new work culture at
Microsoft.
1 Kathy Rebello, Evan.I. Scwartz, “Microsoft; Bill Gates's Baby Is on Top of the World. Can It Stay There?”, Business Week, February 24, 1992.
2 Jim Seymour, “Microsoft’s Agenda in the Time of Cholera”, www.thestreet.com.

293
Microsoft’s People Problems
BACKGROUND NOTE
Microsoft was founded in April 1975 as a partnership concern by William. H. Gates (Gates) and Paul Allen (Allen). It was incorporated in July 1981. Gates and Allen were school-mates who were first introduced to computers in their prep school in Seattle, Washington. At that time, computers were still new, and were heavy and cumbersome to use. The school did not have its own systems but entered into agreements with private corporations to allow the students to work on their computers for given periods of time.
Gates, Allen and a few other friends quickly took to the new technology and spent most of their time learning more about computing. They soon learnt to hack systems and began tampering with valuable files until the company involved found out and banned them from using the systems. However, later, the company realized its vulnerability, and hired them to study the systems and spot weaknesses in them to prevent hacking by others.
However, this company went out of business, and Gates and his friends (who were still in school then) looked for other places to hone their computing skills. In 1969, Gates, Allen and two other friends formed a group called the Lakeside Programmers Group. Information Sciences Inc., a local company, hired them to develop a payroll system. During this stint, the group made a mark and soon other organizations hired it on contract to fix the weaknesses in their systems. Gates and his friends gained valuable programming experience through these jobs.
In 1973, Gates enrolled for a law course at Harvard University. However, he spent most of his time in the university computer center. All this time, he was in touch with his old group, especially Allen. Allen moved to Boston to be closer to Gates. Gates and Allen often talked about having their own business some day. A year later, Allen saw a picture of the first microcomputer3 on the cover of a magazine and showed it to Gates. They realized that the home personal computer (PC) market was going to grow rapidly and software would be needed to run the systems. They contacted Micro Instrumentation and Telemetry Systems (MITS), a manufacturer of PCs, and offered to develop a programming language to run a PC called Altair, manufactured by the company. The programming language was an improved version of BASIC. 4 They allowed MITS to distribute the language, but retained the ownership rights to sell it without restrictions. In 1975, Gates dropped out of Harvard and set up Microsoft with Allen.
By 1977, BASIC was the standard programming language used on most computers. In 1977, Microsoft introduced the FORTRAN 5 and COBOL 6 languages for PCs. By the end of 1977, Microsoft emerged as the market leader in microcomputer languages, with sales exceeding $1,000,000. In 1978, Intel launched a new 16-bit7
microprocessor which offered better performance and memory than the earlier 8-bit microprocessors. The new chip was called Intel 8086. Microsoft developed a new version of BASIC compatible with the new chip. In that year, sales of BASIC crossed one million units.
3A microcomputer, also known as a personal computer, is a computer designed for individual users. It was built on a smaller scale than mainframes, which were usually manufactured for organizational use.
4 Beginners All-purpose Symbolic Instruction Code, one of the first programming languages for computers.
5 FORTRAN stands for Formula Translator. It is a high-level computer programming language suitable for mathematical and scientific computations.
6 Common Business Oriented Language. A programming language used in business data processing.
7 A bit is a compression of two words – binary digit. It is an electronic signal written in 0s and 1s and is the basic unit of information for computers.

294
Organizational Behavior
The increasing popularity of microcomputers attracted IBM 8 to this segment. IBM had earlier focused on manufacturing mainframes,9 but it soon realized the potential of the microcomputer market. The company decided to select outside vendors to supply hardware and software to avoid delays in its launch of microcomputers. For the software, it selected Microsoft. When IBM wanted to select an operating system10 for its computers, it conducted surveys of the various vendors. The most popular operating system at that time was CP/M, developed by a company called Digital Research. However, Digital Research's lukewarm response to IBM's offer prompted IBM to tie up with Microsoft to develop the new operating system.
Microsoft bought an operating system called Q-DOS from a Seattle-based programmer for $50,000 and renamed it MS-DOS (Microsoft Disk Operating System). By 1981, 35 of the 100 employees of Microsoft were working on the IBM project. IBM accepted MS-DOS and made it the official operating system of the IBM PC. As other PC makers wanted to make their PCs compatible with IBM, MS-DOS soon became the accepted standard for PCs. Within a year of the launch of the IBM machine, MS-DOS was used in the computers manufactured by several companies including Zenith, Hitachi, Compusystems, Panasonic and NEC. Microsoft retained the licensing rights of MS-DOS
MS-DOS served as an interface that could work on applications and languages, irrespective of hardware. This made it compatible with the products of a number of different manufacturers, increasing its market. Encouraged by the success of MS-DOS, Microsoft started developing applications software.11 In 1982, work began on developing a spreadsheet12 called Multiplan, that would work on all the operating systems in the market at that time (CP/M, Apple DOS, Unix and MS-DOS). However, Lotus launched its 1-2-3 spreadsheet in November 1982. 1-2-3 was more advanced than Multiplan. Multiplan's capabilities were limited due to the 64K memory limit required by IBM, whereas, 1-2-3 targeted the more advanced 256K machines. 1-2-3 became the market leader in spreadsheets and despite several attempts, Microsoft was unable to overtake it in the US.
Between 1980 and 1983, the number of PC users increased from 300,000 to 2.9 million. The number of PC manufacturers also increased. About 99 per cent of the PC makers used MS-DOS in their computers. In 1983, Microsoft also introduced a word processing system called Word 1.0.By the end of 1983, 500,000 copies of MS DOS had been sold. The same year Allen fell ill with Hodgkin's disease (a lymphatic cancer) and left Microsoft. In 1984, Microsoft introduced Multiplan, BASIC and Word 1.0 for Apple’s Macintosh computer. 13 It also upgraded MS-DOS for IBM. In 1985, it introduced Windows 1.03, and the Excel spreadsheet for Macintosh.
In 1986, Microsoft went public. The IPO brought in $61 million and Gates became a millionaire. In 1987, the company introduced the second generation of operating systems and called it OS/2 (it was later called Windows). It also bought Forethought, a software company which had developed PowerPoint, an application used for making presentations. In 1988, it introduced an OS/2 LAN (local area network) manager for networked PCs and in 1989, it introduced the SQL Server14 and Macintosh Excel
8 International Business Machines Corporation (IBM) is one of the biggest manufactures of computers in the world.
9 Mainframe is an industry term for a large computer manufactured for large scale computing. It is traditionally associated with centralized computing and usually other computers are connected to it to share its resources.
10 Software that controlled a computer's basic functions. 11 Computer programs that are used by an organization to meet its business needs, such as
accounting, word processing, presentations, etc. 12 A spreadsheet is an application which allows the processing of numbers and financial data. 13 The Macintosh was a 32-bit single user system. It popularized graphical user interface. 14 Database management system designed for client/server computing.
295
Microsoft’s People Problems
2.2.15. In 1989, Microsoft acquired Bauer, a company which specialized in printer driver software. In 1991, MS DOS 5.0 was introduced. This new version of DOS used the greater system memory to allow multiple programs to run simultaneously and provided limited task switching capabilities. By 1992, Microsoft's share of the global desktop PC market was 44 per cent.
In 1993, Microsoft introduced Windows NT which included NT Workstation (a fully-integrated, multitasking 32-bit PC operating system), NT Server (a powerful operating system for both server applications, file and print sharing), and Office 4.2 (an integrated application suite containing Word 6.0, Excel 5.0 and PowerPoint 4.0). Windows NT was highly successful, selling at a rate of more than one million copies a month. Between 1993 and 1995, Microsoft accounted for more than 80 percent of new operating systems sales for desktop PCs. In 1994, Windows and MS-DOS together generated sales of about $1 billion. The same year Windows NT and Office 4.0 won PC Magazine's annual awards for technical excellence in the systems software and applications categories.
In 1995, when Microsoft announced that it would acquire Intuit, a company which specialized in personal finance applications software, the US Department of Justice filed a suit to stop the acquisition. By the end of 1995, MS-DOS had become the most widely used operating system in the world, with 140 million out of the installed 170 million PCs worldwide using it. Sales of Windows and Office also continued to grow. Microsoft expanded its operations through acquisitions and between 1995 and 1998, it acquired or invested in 37 companies. In the late 1990s, the company started focusing on the internet which it had neglected till then. It acquired Hotmail, an internet e-mail startup, founded by Jack Smith and Sabeer Bhatia, and other companies which enhanced its internet capacity.
THE ANTITRUST CONTROVERSY
In 1998, Microsoft became embroiled in antitrust proceedings initiated by the US government. The charges against Microsoft were that the company tried to use its vast asset base and huge cash pile to gain an unfair advantage over its competitors. The government accused Microsoft of bundling Internet Explorer with Windows 95 to force customers to purchase both products, and modifying Sun Microsystems' Java language to make it Windows-compatible. In December 1999, after a series of preliminary hearings and interviews, the Department of Justice (DoJ) and 19 states formally filed papers arguing that Microsoft had violated antitrust laws. (Refer Exhibit I for an overview of the antitrust rules in the US).
In early 2000, Bill Gates stepped down as the chief executive of the company and Steve Ballmer, who was then head of sales, took over. Later that year, the district court ruled that Microsoft be spilt into two – one division to provide operating systems and the other for application packages. The split was recommended as a way of rectifying the competitive situation in the software industry, and to curb Microsoft's “unlawful” behavior. Microsoft appealed this ruling at the federal appeals court. The appeals court ruled that Microsoft need not be split, but found merit in some of the findings of the district court indicating that the company had violated antitrust regulations.
In 2001, Microsoft and the DoJ arrived at a settlement which set new rules for Microsoft. Microsoft agreed to make portions of its Windows software code available to its competitors to allow them to ensure that their products were compatible with the operating system. It also agreed to allow computer manufacturers to choose which of the Microsoft products they would like to load on to their systems without bundling.
15 Spreadsheet program that allows full linking and embedding of objects.

296
Organizational Behavior
Some of the states agreed to this settlement, but nine other states decided to go ahead with the suit. Microsoft offered to pay all the costs of litigation to the states which cooperated with it, in order to encourage the other states to join the settlement, but to no avail.
In December 2001, the company entered the bidding for AT&T Broadband (an
internet provider) in direct competition with AOL Time Warner. In the same month,
Comcast, a major cable operator (in which Microsoft was a major investor) and
AT&T announced the merger of their cable operations. In 2002, AOL Time Warner
and Sun Microsystems separately filed antitrust suits against Microsoft. AOL Time
Warner asserted that one of its subsidiaries, Netscape which marketed a browser
called Navigator, had been harmed by Microsoft's anticompetitive actions, namely
bundling its competing Internet Explorer with Windows to discourage manufacturers
from choosing Navigator. Sun Microsystems asserted that Microsoft illegally choked
off the distribution of Sun's Java programming language, with which programmers
could write applications that could be run on different operating systems without
alteration.
Microsoft agreed to comply with the settlement it had entered into with the DoJ, but in
early 2003, two states were still pursuing the case. In May 2003, Microsoft agreed to
pay $750 million to AOL Time Warner to drop the antitrust suit. The two companies
also agreed to collaborate on technology to help the sales of movies and music on the
internet.
By early 2003, Microsoft had operations in 70 countries across the world and
employed over 50,000 people. In the quarter ending March 2003, the company made
over $ 2 billion in profits from revenues of $ 7.8 billion (Refer Exhibit-II for financial
statement).
INCREASING ATTRITION
Till the 1990s, Microsoft had one of the lowest voluntary attrition rates in the highly
volatile software industry. The attrition rate at Microsoft was about seven percent,
which was approximately half the average rate in the industry.
From the mid 1980s, after its phenomenal IPO, to the late 1990s, Microsoft was the
favorite destination of job seekers in the US as well as the rest of the world. Microsoft
grew at a dizzy pace and quickly became one of the most powerful companies in the
world. Although Microsoft had a policy of paying salaries which were about 65
percent of the industry average, the generous stock options the company gave its
employees, more than made up for this. More often than not, the stock options made
the employees millionaires in a few years.
Apart from the options, Microsoft was one of the most successful companies in the
world. It had the reputation for making a success of most of its ventures. During the
period of the late 1980s and the early 1990s, the company was still developing most of
its major products and competing with other software giants. There was a culture of
competitiveness and success.
By the late 1990s, Microsoft had grown to be the benchmark for all software startups.
Microsoft was a 'super power' in the field of software and had successfully dealt with
most its major competitors. However, one major glitch was that Microsoft was a late
starter in internet applications. The top management of Microsoft failed to see the
potential of the Internet, and overlooked it until they were overtaken by competitors,
notably Netscape. It then went on an all-out spree to develop Internet Explorer, which
it bundled along with Windows to overcome competition from Netscape Navigator.

297
Microsoft’s People Problems
The late 1990s also brought up a new problem for the company. For the first time
since it was established, Microsoft began to experience the problem of employees
leaving the firm. A key employee who left Microsoft in this period was Brad
Silverman, one of the main developers of Windows 95 and Internet Explorer. Chief
technology officer, Nathan Myrhvold, internet developer, Ben Slivka and the founder
of the web TV division, Steve Perlman, were other employees in key positions who
left Microsoft. Analysts suggested the following reasons of the increase in attrition
rates:
NO CHALLENGES
Microsoft had always been characterized by a culture that was extremely competitive.
Employees jokingly called it the 'we'd better get going' culture. When the company
introduced new products to rave reviews and rocketing sales, the people responsible
for the products did not meet to celebrate. Instead, they did a post-mortem of what
could have been done better. The company had always been competitor-centric, and
Gates often sent out memos to employees about the competitive threats ahead. These
were popularly referred to as 'call-to-arms' memos. The enemy was always clearly
defined and all the employees knew what was expected of them. They called the fight
against the enemy 'jihad'.16 It was the single most motivating factor for employees.
They knew they were trying to better the enemy and they gave the company their best.
They enjoyed the thrill of competition and eventual success.
As Microsoft grew, it started eliminating competition. In fact, eliminating competition became one of the major objectives of the company. The company routinely bought-out or 'killed' competition to further its own interests. (This gave rise to the antitrust case against it.) As the competition reduced, there was no longer any threat and employees no longer had to be constantly on their toes. Consequently, a very important motivator was eliminated. Most of the people who left, mentioned this as the most important reason for their leaving. There was no longer any challenge in working for Microsoft. The company did not have the atmosphere it had when it started. It had grown too big and too powerful.
The growth of the company also killed its employees’ ability to take the initiative. In the early years, when a small group of people was working on a certain project, there was an incredible amount of work to do and anyone could grab responsibility. This gave employees a feeling of empowerment and involvement with the company. But as the company grew, the number of people working on projects increased and individual responsibilities became more clearly defined. Tasks became more complex and streamlining was necessary. Role clarity was emphasized. People were given a narrow area of responsibility and were expected to accomplish what was assigned to them. In this setup, seeking additional responsibility became unacceptable and was more likely to result in a reprimand than a reward. Consequently, people felt alienated from their work and were no longer deeply involved in the organization. This led to problems of low employee morale.
When Microsoft was growing, there was a culture of risk-taking and a grand vision pervaded the organization. Many people who worked at Microsoft in the early days recalled nostalgically the fun they had working in a company which emphasized innovation and initiative. Sam Jadallah, who left after 12 years at Microsoft, and who, at 31, had been the company’s youngest vice-president, said, “The culture of risk taking was disappearing rapidly. And the amount of fun I was having was
16 The word jihad means striving. The western press often used the word to imply 'holy war' or war for a noble cause.

298
Organizational Behavior
shrinking”.17 Unable to adjust to the new way of doing things, many of the “older” employees preferred to leave.
DISADVANTAGES OF SIZE
Another important reason for leaving was the feeling that the company had become too big. Its large size made Microsoft lose some of the elements of work culture that had made it the favorite destination of job seekers in the late 1980s.
People who left believed that size hurt Microsoft in many ways. As the company grew, the bureaucracy increased and internal politics started playing an important part in regular proceedings. It no longer had the flexibility of a startup and it was becoming very difficult to push decisions through the system. There were five layers of management, which impeded quick decision-making. This left a number of executives frustrated. “It just got so frustrating. You want to do innovative work, but you have to spend half your time defending your turf,” said Eric Engstrom, who left after eight years at Microsoft to start an internet based company.18
All new ideas had to be developed into detailed business plans and sold to different groups of decision makers. This often delayed the process and resulted in loss of the opportunity altogether. Delayed decision making was compounded by the fact that Ballmer and Gates insisted that all decisions be routed through them. Excessive centralization made other managers feel undermined. “Senior executives didn't feel like they were in control of their own destiny,” said Chris Williams, vice-president of human resources at Microsoft.19 New ideas were also not encouraged unless they had the potential to generate billions of dollars in revenue. Concepts of smaller potential were often struck down as of no value. “At Microsoft, an idea has to be able to generate revenues like ten to the sixth power (a million) for it to be interesting” said Usama Fayyad, who left Microsoft's research lab to set up his own data mining business.20
Internal politics also killed a few projects, creating despondency. Eric Engstrom had
created a powerful browser which could better the Netscape browser. However, at the
time he was about to testify in the antitrust case. He also had some differences with
the Windows team. Organizational politics put an end to his innovation.
ELEMENTS OF CULTURE
At Microsoft, employees were asked to justify everything they did. No one was spared
from criticism and people were severely reprimanded when they left loopholes in their
projects. Senior managers had regular meetings with the demanding Bill Gates. So
dreaded were the meetings with Gates that employees were known to have mock
sessions with their colleagues to prepare themselves for the actual one.
Ramesh Parmeshwaran left Microsoft after seven years to start a company called
Askme.com, an internet advice portal. He said that Microsoft lacked the "human
element". People were expected to sacrifice their personal lives for the company. They
were forced to stay late and criticized if they left early too often. He wanted his own
company to be a "kinder, gentler Microsoft."
Microsoft was often criticized for its inability or unwillingness to innovate. Instead it
would look for startup companies with innovative products and try to acquire them.
17 Joseph Nocera, “I Remember Microsoft”, Fortune, July 10, 2000. 18 Joseph Nocera, “I Remember Microsoft”, Fortune, July 10, 2000. 19 Michael Moeller, “Remaking Microsoft”, Business Week, May 17, 1999. 20 Joseph Nocera “I Remember Microsoft”, Fortune, July 10, 2000.

299
Microsoft’s People Problems
Windows copied Apple's Macintosh's graphical use interface. DOS itself was
purchased very cheaply from a Seattle-based company. Neither was Internet Explorer
developed by Microsoft. When Microsoft realized the potential of the internet, and
Netscape entered the market with a very powerful and popular tool for browsing the
internet, Microsoft responded by buying out a company called SpyGlass, which had
developed a web browser based on the same code that Netscape used. This technology
was used as a base for developing Internet Explorer, which it bundled with Windows
and sold to PC makers.
Excel, the spreadsheet application, was a revved-up version of the company's earlier
product Multiplan, which had been developed on the lines of VisiCalc, a popular
spreadsheet of that time. Powerpoint, the very popular presentations application was
also acquired when Microsoft bought Forethought, the original developer of the
application. Critics said the company had always been a technology follower and did
not make any special effort to innovate. Therefore, innovative ideas were not
encouraged. Microsoft focussed more on simply acquiring innovations from smaller
companies rather than on developing them in-house. This also discouraged employees
with innovative ideas, who often left to set up their own companies.
George Snelling who, with his ex-Microsoft colleagues Mark Igra and Matthew Bellew, set up Westside.com (an internet portal which provides software and servers to create interactive websites), said that the same concept could have been developed for Microsoft, but there would have been a series of meetings to convince Gates and Ballmer about how the new project would mesh with Microsoft's strategic vision. "With our own company we can move much faster," he said.21 The founders of Westside.com said they left Microsoft to create their own company because they wanted to recreate the “excitement, freedom and innovation of the early Microsoft culture.”22
Another important reason for people leaving was the generous stock options of the company. The stocks often made people so rich that they could retire on their earnings and pursue their non-business interests. This happened with a number of middle and top managers at Microsoft. The internet revolution of the 1990s and the resultant boom in dotcoms also prompted a number of dynamic Microsoft employees to leave their jobs and set up their own companies. Everybody wanted to be where the action was. People felt Microsoft was a stumbling giant when compared to the agile dotcoms. They could no longer stay with Microsoft and let opportunities go by. Microsoft had not begun to focus on the internet till quite late, and some people felt this was a mistake.
The issue was not just how many people were leaving, but rather ‘who was leaving'. Most of the key people who helped create Microsoft left the company. “Microsoft has become autocratic, and as a result has lost some of the best thinkers” said Enderle.23
Analysts felt that a company like Microsoft could not afford to lose motivational leaders, as the loss created a feeling of insecurity and unrest among the followers.
Microsoft had recruited people for their aggressiveness and ability to spot technological trends. “We like people who have got an enthusiasm for the product, technology, who really believe that it can do amazing things. We're very big on hiring smart people,” Bill Gates often said.24 This principle boomeranged as those same aggressive people were unable to sit back and see the internet revolution pass them by. They were also no longer satisfied by the level of challenge offered by the company and craved to do more.
21 Joseph Nocera “I Remember Microsoft”, Fortune, July 10, 2000. 22 Joseph Nocera “I Remember Microsoft”, Fortune, July 10, 2000 23 Sally Whittle, “Where is Microsoft Going Tomorrow?”, www.vnunet.com. 24 “The Microsoft Edge”, Pocket Books, New York.

300
Organizational Behavior
RECRUITING DIFFICULTIES
Microsoft experienced trouble in recruiting people as well. A number of graduates were choosing smaller companies with smaller packages over Microsoft during campus placements, mainly for the challenges they offered.
Patrick Nichols got job offers from Microsoft and Trilogy Software Inc. (a maker of e-commerce programs) after he graduated from Cornell University. In spite of efforts by Microsoft recruiters, he chose Trilogy because Microsoft could not match Trilogy's fun-loving culture.
Graduates from premium business schools were also moving towards setting up their own companies (usually internet companies), rather than working at large corporations like Microsoft. James Chen, a graduate of the Massachusetts Institute of Technology, who interned at Microsoft during his summer vacation, and had a standing offer to work there after his graduation, chose to pass over Microsoft in favor of CampusCraze.com, a web company he launched to provide a community for students. “Now there are a lot more options,” said Chen.25
This became a major problem for Microsoft, as it had not only to fill the gaps in the middle and top management who left in pursuit of better opportunities, but also bring in new talent to develop a range of ‘next generation’ products that were so important to the company’s continued success. Many top graduates, however, wanted greater challenge and flexibility. They wanted to work in an atmosphere of risk-taking and competition. While Microsoft had been a risk-taking, competitive firm in the early days as some ex-employees affirmed, analysts felt that its size had made the company lose its sense of purpose.
ISSUES OF DISCRIMINATION
The company faced another major problem with regard to its temporary employees. Microsoft often employed temporary workers, sourced from employment agencies, to meet the need for workers at short notice. At any point of time, temporary workers constituted approximately one-third of the total workforce of the company. Temporary workers were employed as customer service representatives, software testers or even programmers.
These temporary workers, were on the payroll of the employment agency through which their job was routed and not on Microsoft’s payroll. Hence, they were not treated on par with the regular employees. They were also not eligible for any of the benefits the regular employees had, like sick leave, paid vacation or holidays, not to speak of stock options. They were not encouraged to take any initiative in their work and were considered inferior by the permanent staff. This was in spite of some of them being employed by the company for long periods of time, sometimes stretching to years. Marcus Courtney, himself a ‘temp’ for a period of two years, organized a union of temporary workers. They demanded that the temps be treated on par with regular employees, as they had worked for the company for long periods of time and therefore merited equal recognition. They also filed a suit claiming all the benefits they had not enjoyed as temporary workers during the period of their service.
In December 2000, Microsoft settled the lawsuit by paying $97 million to over 8,000 workers who claimed that they should have received various benefits during their period as temps at Microsoft. The company later instituted policies providing for the compulsory lay-off of temporary workers for a minimum of 100 days after a year of work, so that a clear distinction could be made between a temporary and a permanent employee. Many considered this move insensitive and unethical.
25 Michael Moeller, “Outta Here at Microsoft”, Business Week, November 29, 1999.

301
Microsoft’s People Problems
Around this time, there was also a charge of racial discrimination against the company. Three African-American employees filed suits that they were discriminated against on racial grounds at Microsoft. One of the cases filed by Monique Donaldson, who was a technical writer and program manager, claimed that she and some other African Americans were denied promotions and stock options on the basis of “subjective and discriminatory evaluations" by white supervisors.
CHECKING THE EXODUS
On realizing the magnitude of the attrition problem, the top management at Microsoft began taking steps to curb the departure of important people. Gates himself was closely associated with identifying the key people the company did not want to lose, and trying to retain them by making their jobs more exciting. There was the instance of a physicist at Microsoft, who was also an amateur sculptor. He wanted to leave his job to get into sculpting on a full-time basis. When his boss had a discussion with him, he revealed that he lacked creative satisfaction his job. His boss decided to change his job to include functions like prototyping new user scenarios and experimenting with design. Satisfied with the new role which gave him scope for creativity, the employee agreed to stay on. There were a number of other instances where the company made concerted efforts to retain star talent.
Salaries and other forms of compensation were also upgraded. After Steve Ballmer
became the president of Microsoft in 1998, one of the first things he did was to stop
Microsoft's two-decade old practice of paying considerably lower salaries than its
rivals. He raised salaries by an average of 15 percent. Some talented employees got
raises of up to 40 percent in their pay. The company also started giving pay scales
differentiated on the basis of the cost of living in different regions, to bring about
geographic equity. This was also a departure from the old policy, where salaries were
paid on the basis of the cost of living at Microsoft's headquarters in Redmond,
Washington.
Ballmer held a series of meetings with key people in the organization to understand the problems of a perceived lack of career opportunities and inter-departmental coordination. He realized that there was too much bureaucracy and red tape in the company, which thwarted communication and innovation. So, he reorganized the company into seven customer-focused divisions, as against the existing technology-based divisions (Refer Exhibit III). This move helped revive the entrepreneurial flair in the employees of the company and gave some managers more autonomy. “It feels like having my own small company without the hassles of ordering staples and looking after finances,”26 said Bruce Burns, director of the business services group.
Efforts were made to reach out to employees on a one-to-one basis to keep them more motivated and involved. The human resources department also began paying more attention to retaining employees, rather than simply recruiting good ones. Representatives of the HR department undertook a fact-finding tour to a number of successful companies like General Electric, News Corp., etc. to study their practices. On-campus 'recruiting' also took on a new meaning, with HR personnel trying to make the company’s jobs more appealing to people who were already on Microsoft's campus, or, in other words, making efforts to retain the people who were already working with Microsoft. Ballmer said, “I don't want to see them go. They're friends. They are a family.”27 But he also added that sometimes it is better for some people to leave -better for the people concerned and good for the company as well.
26 Sally Whittle, “Where is Microsoft going tomorrow?”, www.vnunet.com. 27 Rebecca Buckman, “Ballmer remains Bullish on Future of MS Despite Anti-trust Suit”,
www.expressindia.com

302
Organizational Behavior
Questions for Discussion:
1. Most of the people who left Microsoft believed that the size and success of the company had harmed its work culture. Describe the changes that occurred in the company's culture over the years, and the impact of these changes on the employees and the organization.
2. Microsoft began to have difficulty in recruiting people. Why? Also comment on the issue of temporary workers and the allegation of racial discrimination.
3. The top management of Microsoft undertook to reinvent the company to correct some of its problems. Describe the changes that came about as a result of this effort. Do you think that changing the structure of the company could have a positive impact on its work culture? In your opinion, will the new structure of Microsoft help resolve the problems faced by the company?
© ICFAI Center for Management Research. All rights reserved.

303
Microsoft’s People Problems
Exhibit I
Antitrust Laws in the US
Some of the important Acts and Sections relating to antitrust cases are as follows.
Sherman Act
Enacted in 1890, it is the original antitrust statute. Sections of primary interest
are sections 1 and 2.
Section 1 makes it a felony28 to engage in any contract, combination or
conspiracy in restraint of trade or commerce.
Section 2 makes it a felony to monopolize or attempt to monopolize any part of
trade or commerce among the several states of foreign nations.
Clayton Act
This Act was passed in 1914. It expanded the anti-trust powers of the government. It
had two sections of primary interest.
Section 13 makes price discrimination illegal. Price discrimination is defined as
the act of charging different prices to different buyers of the same product.
Section 14 prohibits "tying contracts", in which sale or its price or discount is
conditioned upon the purchaser not using or dealing in the goods of the
competitor of the seller.
Tunney Act.
This is formally known as the Antitrust Procedures and Penalties Act. It was
enacted in 1974.
Section 16 of the Act requires that "before entering any consent judgment
proposed by the United States, the court shall determine that the entry of such
judgment is in the public interest". This means that the court shall not grant any
decrees to companies that go against public interest.
The primary complaint was that Microsoft imposed a per processor fee on the
computer manufacturers, requiring them to pay a royalty to Microsoft for every piece
they sold, regardless of whether it had a Microsoft operating system or not. This way,
even if the manufacturers used another operating system, they would have to pay
Microsoft a royalty. This made them choose Microsoft operating systems over
others.
It was also alleged that Microsoft entered into long term contracts with
manufacturers, which included minimum purchase agreements and transfer of unused
balances to future contracts. This effectively ensured that manufacturers continued to
use Microsoft products.
Adapted from www-cs-students.stanford.edu
28 Felony is a crime carrying a penalty of more than a year in prison. (www.Usdoj.gov )

304
Organizational Behavior
Exhibit II
Financials
Quarterly Financials
Income StatementAll amounts in millions of US Dollars except per share amounts.
Quarter Ending
March 2003
Quarter Ending
December 2002
Quarter Ending
Sept 2002
Quarter Ending
June 2002
Revenue 7,835.0 8,541.0 7,746.0 7,253.0
Cost of Goods Sold 840 1,739.0 902.0 1,009.0
Gross Profit 6,995.0 6,802.0 6,844.0 6,244.0
Gross Profit Margin 89.3% 79.6% 88.4% 86.1%
SG&A Expense 2,905.0 3,248.0 2,497.0 3,011.0
Depreciation & Amortization 375.0 295.0 297.0 359.0
Operating Income 3,715.0 3,259.0 4,050.0 2,874.0
Operating Margin 47.4% 38.2% 52.3% 39.6%
Total Net Income 2,794.0 2,552.0 2,726.0 1,525.0
Net Profit Margin 35.7% 29.9% 35.2% 21.0%
Diluted EPS ($) 0.26 0.24 0.25 0.14
Source: www.hoovers.com
Annual Financials
Income StatementAll amounts in millions of US Dollars except per share amounts.
June 2002 June 2001 June 2000
Revenue 28,365.0 25,296.0 22,956.0
Cost of Goods Sold 4,107.0 1,919.0 2,254.0
Gross Profit 24,258.0 23,377.0 20702
Gross Profit Margin 85.5% 92.4% 90.2%
SG&A Expense 11,264.0 10,121.0 8,925.0
Depreciation & Amortization 1,084.0 1,536.0 748.0
Operating Income 11,910.0 11,720.0 11,029.0
Operating Margin 42.0% 46.3% 48.0%
Total Net Income 7,829.0 7,346.0 9,421.0
Net Profit Margin 27.6% 29.0% 41.0%
Diluted EPS ($) 0.71 0.66 0.85
Source: www.hoovers.com

305
Microsoft’s People Problems
Exhibit III
Organizational Structure at Microsoft after Restructuring
Microsoft's structure was organized around the following groups.
Personal Services Group
The Personal Services Group (PSG), focused on trying to make it easier for customers and businesses to connect online and to deliver software as a service. PSG encompassed Microsoft's Personal NET division, the Services Platform division, the Mobility group, the MSN Internet Access and Consumer Devices group, and the User Interface Platform division.
MSN and Personal Services Business Group
This group ran network programming, business development, and worldwide sales and marketing for MSN and Microsoft's other service efforts like MSN e-shop, MSN Carpoint, MSN HomeAdvisor, MSNBC Venture, Slate and MSNTV.
Platforms Group
The Platforms group was concerned with the development of Windows. It worked on making storage, communication, notification, sharing photos and listening to music a natural extension of the Windows experience. The group includes .NET Enterprise server group, Developer Tools division, and the Windows Digital Media division.
Productivity and Business Services Group
This group deals with business process applications and services. It worked towards evolving a service-based product that built on the functionality and capabilities of Microsoft Office. The group contained the Emerging Technologies Group, the Business Tools Division and the Business Applications Division.
Worldwide Sales, Marketing and Services
The sales and marketing group worked on integrating the activities of Microsoft's sales and service divisions and partners with the needs of the various Microsoft customer groups around the world. This group included the Microsoft Product Support Services, Network Solutions group, the Enterprise Partner group, the Central Marketing Organization and all of Microsoft's business sales regions around the world.
Microsoft Research
The research group was involved in developing innovative solutions to the computer science problems of the day. The primary activities involved developing software for the next generation of hardware, improving the software design process and investigating the mathematical underpinnings of computer science.
Operations Group
This group was responsible for managing business operations and overall business planning. This included the corporate functions of finance, administration, human resources, and information technology.
Adapted from www.ascet.com.

306
Organizational Behavior
Additional Readings & References:
1. Judy Bick, "The Microsoft Edge", Pocket Books, New York, 1999.
2. Kirk Cheyfitz, "Thinking Inside the Box", Free Press, New York, 2003.
3. Arnold Bernstein, "Programmers of the World Unite", Business Week, December 12, 1998.
4. Michael Moeller, "Remaking Microsoft", Business Week, May 17, 1999.
5. John Cook, "Baby Bills off to the Internet Gold Rush", Seattle Post- Intelligencer, July 20, 1999.
6. Arnold Bernstein, "Temp Wars: Why Microsoft May Cry Uncle", Business Week,November 15, 1999.
7. Michael Moeller, "Outta Here at Microsoft", Business Week, November 29, 1999.
8. James Fallows, "Inside the Leviathan", The Atlantic Monthly, February 2000.
9. Joseph Nocera, "I Remember Microsoft", Fortune, July 10, 2000.
10. "The Bugs in the Microsoft Culture. Is Redmond a great place to work for temps and minorities?", Fortune, February 7, 2001.
11. Christine Y Chen.., "Chasing the Net Gen", Fortune, February 9, 2001.
12. Jay Greene, " Rick Belluzo: Microsoft's Odd Man Out", Business Week, April 4, 2002.
13. Jason Pontin, "Microsoft wins War of Attrition", Red Herring, November 1, 2002.
14. "Microsoft's Culture Under Siege", www.zednet.co.uk, March 22, 1999.
15. Paul Festa, "Another Microsoft exec leaving", news.com.com, June 8, 1999.
16. Davis Jim, "Microsoft boosts salaries to keep talent in hot job market",news.com.com, March 6, 2000.
17. Jim Seymour, "Microsoft's Agenda in the Time of Cholera", www.thestreet.com, June 7, 2000.
18. Matt Rossof, "Microsoft Addresses Morale, Turnover",www.directionsonmicrosoft.com, January 15, 2001.
19. John Caroll, "Top Ten Reasons why Microsoft is a Good Citizen", www.zdnet.com, July 25, 2002.
20. David Winer, "What is Leadership", davenet.userland.com
21. www.hoovers.com., www.ketupa.net
22. www-cs-students.stanford.edu
23. www.technews.com., www.ascet.com., www.exn.ca
24. allsands.com
25. www.nevada.edu
26. www.vnunet.com
27. www.microsoft.com

Derivatives Trading In India “The introduction of derivatives trading will separate leveraged positions from the spot markets and make it easier for exchanges to implement rolling settlement. This should reduce volatility in the existing markets, and make risk containment and regulation easier by making markets safer.”1
- Ashish Kumar Chauhan, Vice-President, National Stock Exchange (NSE).
“It had to start at one point of time or the other. Just like a plant needs soil, water and minerals to nurture well, for derivatives you need a healthy cash market in place.”2
- Alok Churiwala, Member of Bombay Stock Exchange (BSE).
INTRODUCTION
On June 9, 2000, the Bombay Stock Exchange (BSE) introduced India’s first derivative instrument – the BSE-30(Sensex) index futures. It was introduced with three month trading cycle – the near month (one), the next month (two) and the far month (three). The National Stock Exchange (NSE) followed a few days later, by launching the S&P CNX Nifty3 index futures on June 12, 2000.
The plan to introduce derivatives in India was initially mooted by the National Stock Exchange (NSE) in 1995. The main purpose of this plan was to encourage greater participation of foreign institutional investors (FIIs) in the Indian stock exchanges. Their involvement had been very low due to the absence of derivatives for hedging risk. However, there was no consensus of opinion on the issue among industry analysts and the media. The pros and cons of introducing derivatives trading were debated intensely. The lack of transparency and inadequate infrastructure of the Indian stock markets were cited as reasons to avoid derivatives trading. Derivatives were also considered risky for retail investors because of their poor knowledge about their operation. In spite of the opposition, the path for derivatives trading was cleared with the introduction of Securities Laws (Amendment) Bill in Parliament in 1998.
The introduction of derivatives was delayed for some more time as the infrastructure for it had to be set up. Derivatives trading required a computer-based trading system, a depository4 and a clearing house5 facility. In addition, problems such as low market capitalization of the Indian stock markets, the small number of institutional players and the absence of a regulatory framework caused further delays. Derivatives trading eventually started in June 2000.
The introduction of derivatives was well received by stock market players. Trading in derivatives gained substantial popularity, and soon the turnover of the NSE and BSE derivatives markets exceeded the turnover of the NSE and BSE cash markets. For instance, in the month of January 2004, the value of the NSE and BSE derivatives
1 Nina Mehta, “Derivatives En Route to India,” Derivatives Strategy, May 1999. 2 Prashant Mahesh, “India’s Millennium Move,” www.financialexpress.com, January 25, 2000. 3 S&P CNX Nifty is a diversified 50 stock index of NSE. The 50 stocks that are included
account for 23 sectors of the economy and are the most liquid stocks on NSE. The name S&P CNX reflects the identity of both the promoters i.e. NSE and Crisil & their consulting partner Standard & Poor (S&P).
4 A depository is an organization which holds securities like shares, debentures, bonds, government securities etc., of investors in electronic form. It also provides services related to the transaction of securities.
5 A clearing house facilitates the clearing and settlement operations of the funds and securities of the trades done on stock exchanges.

310
Financial Management
markets was Rs.3278.5 billion (bn) whereas the value of the NSE and BSE cash markets was only Rs.1998.89 bn. (Refer Exhibit I and II).
In spite of these encouraging developments, industry analysts felt that the derivatives
market had not yet realized its full potential. Analysts pointed out that the equity
derivative markets on the BSE and NSE had been limited to only four products –
index futures, index options and individual stock futures and options which were
limited to certain select stocks.
BACKGROUND NOTE
The initial steps to launch derivatives were taken in 1995 with the introduction of the Securities Laws (Amendment) Ordinance, 1995 that withdrew the prohibition on trading in options on securities in the Indian stock market. In November 1996, a 24-member committee was set up by the Securities Exchange Board of India (SEBI)6
under the chairmanship of LC Gupta to develop an appropriate regulatory framework for derivatives trading. The committee recommended that the regulatory framework applicable to the trading of securities would also govern the trading of derivatives.
Following the committee’s recommendations, the Securities Contract Regulation Act (SCRA) was amended in 1999 to include derivatives within the scope of securities, and a regulatory framework for administering derivatives trading was laid out. The act granted legality to exchange-traded derivatives, but not OTC (over the counter) derivatives. It allowed derivatives trading either on a separate and independent derivatives exchange or on a separate segment of an existing stock exchange. The derivatives exchange had to function as a self-regulatory organization (SRO) and SEBI acted as its regulator. The responsibility of clearing and settlement of all trades on the exchange was given to the clearing house which was to be governed independently.
Derivatives were introduced in a phased manner. Initially, trading was restricted to index futures contracts based on the S&P CNX Nifty Index and BSE-30 (Sensex) Index. Later, trading was extended to index options (based on the same indices) in June 2001, and options on individual securities in July 2001. SEBI also permitted the launch of futures contracts on individual stocks in November 2001.
Even after trading in derivatives was formally launched, their introduction was vehemently opposed by a section of brokers, media and industry analysts. There was a series of arguments and counter arguments leading to a heated debate between those who favored them and those who were against introduction of derivatives.
THE DEBATE AND THE RESULT
Those who opposed the introduction of derivatives argued that these instruments would significantly increase speculation in the market. They said that derivatives could be used for speculation by investors by taking large price positions in the stock market while committing only a small amount of capital as margin. For instance, instead of an investor buying stocks worth Rs.1 million (mn), he could buy futures contracts on Rs.1 mn of stocks by investing a few thousand rupees as margin. Thus, trading in derivatives encouraged investors to speculate - taking on more risk while putting forward less investment. They were quick to point out some of the disasters of the past that had occurred due to the mismanagement of trading in derivatives (Refer Exhibit III).
6 SEBI is the apex regulatory body for the securities markets in India. The basic objective of SEBI is to protect the interest of small investors and to promote the development of, and to regulate the securities market.

311
Derivatives Trading In India
Analysts also said that the introduction of derivatives required a well functioning and mature spot market, that was absent in India. Another danger they felt was the lack of transparency and counterparty risk7 since most derivative instruments were traded over the counter (OTC) in the markets in a completely unregulated fashion (Refer Exhibit IV).
Derivatives could also be used as a tax evasion tool by restructuring the cash flows in such a way that income from derivatives was under-reported. Another disadvantage was that FIIs could take large positions in the derivatives market by paying small amounts of margins and might thereby attempt to take control of the equity markets and decide its future movements. Derivatives were considered similar to betting and gambling. Hence, permitting trading in these kinds of instruments was considered unacceptable. Analysts also raised serious doubts about the Indian capital market’s capability to provide enough liquidity for derivatives trading; the failure of which could lead to a serious liquidity crisis.
Moreover, analysts also felt that a substantial effort would be required to create awareness and educate people about derivatives before they could be introduced. The investors were not mature enough for these instruments and fears were expressed that they may speculate in derivatives and incur huge losses due to their inadequate knowledge about derivatives.
Those who were in favor of introducing derivatives said that these instruments had been introduced and well-accepted in all major foreign markets for a long time and opposition to them was more based on emotions rather than any real logic. They argued that the depth of the financial markets would improve with the introduction of risk-management tools like derivatives. The introduction of derivatives was expected to bring in greater participation from risk-averse investors resulting in increased volume of trades and liquidity in the markets. Using derivatives, institutional investors would be able hedge their risks effectively against unfavorable market movements.
There was also strong empirical evidence that in those countries where derivatives had been introduced, there had been significant gains in both trading volumes and in market capitalization. Derivative instruments made spot price discovery more reliable using models like the normal backwardation hypothesis8. Analysts pointed out that these instruments caused any arbitrage opportunities to disappear and led to better price discovery. Derivatives provided an excellent mechanism for portfolio managers to manage portfolio risks and for treasury managers to manage interest rate risks.
With the introduction of derivative instruments like currency and interest rate swaps, analysts felt that Indian corporates would be able to raise finance from global markets at better terms. They would also be able to take advantage of low interest rates prevailing in global markets. Moreover, it had become increasingly necessary to introduce derivatives since their absence might encourage foreign exchanges to construct and trade in derivative instruments based on Indian securities.
The introduction of derivatives would also help in drawing greater levels of FII investment into the country. The risks that foreign institutions faced while operating in the Indian markets were currency and market risk. The currency risk could be hedged through the dollar rupee futures while the market risk could be hedged through stock index futures.
After much heated debate, derivatives trading was finally introduced. By early 2004, a number of derivative instruments were in vogue on Indian bourses (Refer Exhibit V). Since August 2002, trading volumes in derivatives had increased significantly. In
7 The risk to each party of a contract that the counterparty will not live up to its contractual obligations. In the case of financial contracts it is also known as default risk.
8 Futures prices generally represent the cost of carry over the current spot price. Hence, according to Normal Backwardation Hypothesis, it is possible to discover the spot price if we deduct the cost of carry from the futures price.
312
Financial Management
January 2004, the value of NSE and BSE derivatives market was Rs.3,278.5 bn. In terms of the number of contracts in single stock derivatives, India had emerged as the largest market globally.
A FEW ISSUES REMAIN
By January 2004, more than three and a half years of derivatives trading had been completed. However, according to several analysts and media reports, SEBI, NSE and BSE had still to resolve many issues so that the derivatives market could realize its full potential. For instance, the issue of imposing taxes on income arising from derivatives trading still remained to be sorted out.
The Income Tax Act of India did not have any specific provision regarding taxability of derivatives income. The tax authorities were still undecided on the issue, and in the absence of any provision, derivatives transactions were held on par with transactions of a speculative nature (in particular, the index futures/options which were essentially cash settled, were treated this way). Therefore, the loss, if any, arising from derivatives transactions, was treated as a speculative loss and was eligible to be set off only against speculative income up to a maximum period of eight years. Analysts argued that derivatives instruments were essentially used by investors to hedge risks, and they should not be considered as speculative transactions. They should therefore, be taxed as short-term capital gains/losses on securities. Analysts also opined that the reason why institutional investors were shying from the derivatives market was the lack of clarity on tax and accounting treatment of derivatives.
Another problem faced in the derivatives market especially by retail investors was the minimum contract size, which was fixed at Rs. 0.2 mn. The idea behind this decision was to curb too much speculation from small investors who had little knowledge about derivatives. However, analysts felt that the minimum contract value of Rs. 0.2 mn was too high and acted as a deterrent for retail investors who were otherwise willing to transact in the derivatives market
Analysts felt that there is a need to educate retail investors and brokers about derivatives rather than setting trading limits for them. Derivatives were a bit complex and required more than a basic knowledge about the stock market to be traded successfully. There were a lot of myths and misconceptions about derivatives trading in the minds of retail investors, which needed to be cleared.
In a report, the Bank for International Settlements said that OTC derivatives markets worldwide had witnessed a significant growth in the number of outstanding contracts over the past few years, with the outstanding position on global OTC markets expected to be to the tune of $127.56 trillion in 2002 (Refer Exhibit VI). Analysts felt that concrete steps were required to evaluate all possible alternatives to the issue of legality of OTC derivatives.
Though the regulatory framework for administering the derivatives market in India (Refer Exhibit VII) conformed to international norms, some more steps were required to strengthen the financial infrastructure. There was a need for bankruptcy and insolvency laws to explain clearly the rights of securities holders on winding up or on insolvency of intermediaries. In order to bring in transparency and create stability in the financial markets, public disclosure of trading and derivatives activities of the banks and security firms were required to be made mandatory.
Allowing cross-margining9 between spot and derivatives market was an issue which had to be addressed. Cross-margining resulted in a far more efficient use of a member’s capital for trading in related products and in more than one market. A
9 Cross-margining takes into account a member/client’s combined position across products/market segments. This implies that a member’s margin with an exchange for one market could be used against the margin requirements of another market.

313
Derivatives Trading In India
clearing corporation could easily compute and levy a single net margin amount based upon offsetting positions in different products/markets/exchanges.
Other issues that analysts felt had to be addressed for further development of derivatives market were related to the settlement procedures and transparency of derivative transactions. All the derivative transactions were cash settled. This was appropriate in the case of index derivatives but in the case of single stock derivatives, analysts felt that the regulatory authorities could consider physical settlement. In the past, derivatives trading had led to financial disasters the world over. It was estimated that the cumulative losses over a period of eight years (1987 to 1995) in derivatives trading globally amounted to $16.7 bn. To prevent such disasters in India, analysts commented that the margin requirements needed to be stringently enforced and a proper process of surveillance had to be established.
With the number of NSE branches across India increasing, analysts were concerned about the role of the BSE and the problem that derivative markets might be monopolized by NSE. Though there had been growth in derivatives trading volumes, it had been limited to NSE. In fact, NSE comprised 98.84% of the derivatives market. On the other hand, BSE had been experiencing low volumes to the extent that it was forced to consider closing its derivative segment. BSE blamed SEBI for low volumes on its bourses, as it was not allowed to expand its operations beyond Mumbai. More than 60% of volumes in NSE came from cities other than Mumbai.
THE NEW INITIATIVES
As of early 2004, derivatives trading in India had been restricted to a limited range of products including index futures, index options and individual stock futures and options limited to certain select stocks. Analysts felt that index futures/options could be extended to other popular indices such as the CNX Nifty Junior10. Similarly, stock futures/options could be extended to all active securities.
Efforts were also on to encourage participation from domestic institutional investors. SEBI had authorized mutual funds to trade in derivatives, subject to appropriate disclosures. A broader product rollout for institutional investors was also on the cards. Steps were taken to strengthen the financial infrastructure. These included developing adequate trading mechanisms and systems, and establishing proper clearing and settlement procedures. Regulations hampering the growth of derivative markets were being reviewed. The taxation aspect of the income from derivatives trading was also being looked into. NSE and BSE conducted training programs for investors to create awareness and educate them about derivatives trading.
In January 2004, the Insurance Regulatory and Development Authority (IRDA) allowed insurance companies to deal in financial derivatives and participate in the Collateralized Borrowing and Lending Obligation (CBLO)11 of the Clearing Corporation12. In an amendment to the IRDA Investment Regulations 2000, the insurance regulatory body allowed all life and general insurance companies to deal in financial derivatives to the extent permitted according to the guidelines issued by it.
10 CNX Nifty Junior is the second most important index on the NSE after S&P CNX Nifty. CNX Nifty Junior consists of 50 most liquid stocks other than those included in the S&P CNX Nifty.
11 CBLO is a money market instrument developed by the Clearing Corporation of India. CBLO is an obligation by the borrower to return the money borrowed at a specified future date; an authority to the lender to receive the money lent at a specified future date, with an option/privilege to transfer the authority to another person for value received; an underlying charge on securities held in custody (with CCIL) for the amount borrowed/lent.
12 Incorporated on April 30, 2001, Clearing Corporation of India is India’s first clearing house for government securities, forex and other related market segments.
314
Financial Management
In January 2004, the Reserve Bank of India (RBI) allowed FIIs to fully hedge their equity exposure. FIIs were allowed to trade in the derivatives market subject to the condition that their overall open position did not exceed 100 per cent of the market value of their total investments. Managed future funds were permitted to take a position in the derivatives market without having any exposure in the cash market. Moreover, FIIs intending to invest funds in the cash market were also permitted to take a long position in the futures market. Registered FIIs were allowed to participate in both index-based and stock specific derivative contracts provided their positions were within the laid down limits13.
In February 2004, RBI prepared a report on derivatives trading with the objective of harmonizing the regulatory aspects for over-the-counter and exchange-traded products. To encourage trading in interest rate derivatives, the central bank was in the process of laying out certain parameters which would allow banks with strong risk management systems to trade and act as ‘market makers’14 for interest rate derivatives.
However, a section of analysts felt that merely allowing institutional investors would not be enough to make the derivatives market more vibrant. There were still lots of issues that needed to be resolved. Moreover, though mutual funds had been allowed to trade in the derivatives market, SEBI (MF) Regulations restricted the use of equity derivatives only to ‘hedging and portfolio re-balancing.’ It did not permit mutual funds to use equity derivatives for arbitrage strategies, portfolio optimization and return enhancement strategies.
Questions for Discussion:
1. In June 2000, derivatives trading were finally flagged off in India. Briefly discuss the events that led to the introduction of derivatives trading in Indian stock markets.
2. Industry analysts were divided in their opinion over introducing derivatives trading in India. Critically comment on the views expressed for and against the introduction of derivatives. Do you think derivatives should have been introduced? Take a stand and justify it.
3. Though trading in derivatives has been introduced in India, analysts feel that there is still a long way to go before we realize their full potential. What issues need to be addressed to accelerate the growth of derivatives market? Do you think the recent measures taken by SEBI, RBI and the stock exchanges are adequate? What other measures can be taken?
© ICFAI Center for Management Research. All rights reserved.
13 A FII had a position limit restricted to 15% of the open interest in all derivative contracts on a particular underlying index or Rs.1 bn whichever was higher, per exchange in the case of index related derivative instruments. Similarly, the position limit was restricted in derivative contracts on a particular underlying stock to 7.5% of the open interest of all derivative contracts on a particular underlying stock or Rs. 0.5 bn, whichever was higher, at a particular exchange.
14 Market maker can be a brokerage or a bank that maintains a firm bid and ask price on a given security by willing to buy or sell at publicly quoted prices.

315
Derivatives Trading In India
Exhibit I
NSE Derivatives Segment Turnover
(Rs. in bn)
MonthFutures on S&P CNX Nifty Index
Futures on Individual Securities
Options on S&P
CNX Nifty Index
Options on
Individual Securities
Interest Rate
Futures Total
Aug 02 29.78 178.81 5.18 55.62 0 269.38
Sep 02 28.36 175.01 5.83 62.21 0 271.40
Oct 02 31.45 212.13 7.27 83.57 0 334.41
Nov02 35.00 254.63 8.46 100.29 0 398.37
Dec 02 59.58 355.32 10.87 130.43 0 556.20
Jan 03 55.57 382.99 9.40 143.53 0 591.49
Feb 03 50.40 324.45 9.46 109.64 0 493.95
Mar 03 66.24 297.70 18.56 110.82 0 493.32
Apr 03 69.94 297.50 17.07 115.69 0 500.20
May 03 62.83 327.52 16.17 127.72 0 534.24
Jun 03 93.48 465.05 19.42 150.42 1.82 730.17
Jul 03 147.43 705.15 32.03 213.70 0.19 1098.50
Aug 03 249.89 912.88 38.38 202.47 .01 403.63
Sep 03 458.61 1138.74 50.13 204.04 0 1851.52
Oct 03 564.35 1463.77 45.74 229.78 0 2303.64
Nov 03 494.86 1224.63 38.48 163.74 0 1921.71
Dec 03 653.78 1509.33 54.55 171.41 0 2389.07
Jan 04 998.78 1957.88 69.13 214.84 0 3240.63
Source: www.nseindia.com
Exhibit II Nse Cash & Derivatives Segment Turnover
(Rs. in bn)
Month Cash Segment Turnover
% age of Total
Turnover
Derivatives Segment Turnover
% age of Total Turnover
Total Turnover
Aug 02 461.13 63.12 269.38 36.88 730.51
Sep 02 464.99 63.14 271.40 36.86 736.39
Oct 02 519.02 60.82 334.41 39.18 853.43
Nov 02 513.52 56.31 398.37 43.69 911.89
Dec 02 619.73 52.70 556.20 47.30 1175.93
Jan 03 647.62 52.26 591.49 47.74 1239.11

316
Financial Management
Feb 03 482.89 49.43 493.95 50.57 976.84
Mar 03 431.60 46.66 493.32 53.34 924.92
Apr 03 489.71 49.47 500.20 50.53 989.91
May 03 546.90 50.59 534.24 49.41 1081.14
Jun 03 615.86 45.75 730.17 54.25 1346.03
Jul 03 788.78 41.79 1098.50 58.21 1887.28
Aug 03 853.47 37.81 1403.63 62.19 2257.10
Sep 03 1033.45 35.82 1851.52 64.18 2884.97
Oct 03 1155.95 33.41 2303.64 66.59 3459.59
Nov 03 928.86 32.59 1921.71 67.41 2850.57
Dec 03 1103.73 31.60 2389.07 68.40 3492.80
Jan 04 1342.69 29.30 3240.63 70.70 4583.32
Source: www.nseindia.com
Exhibit III
Corporate Disasters Due to Mismanagement of Derivatives
Barings Bank
In 1995, financial markets the world over were shocked when the 233-year-old Barings Investment Bank was left with a loss of $1.3 bn by Nicholas William Leeson (Nick Leeson), a trader in futures for Barings Bank. It all started when Leeson was sent to Singapore in 1992. Though he had permission for intra-day trading activities, he exceeded his authority by taking huge overnight positions. Barings took a self-destructive step when it allowed Leeson to act both as front-office trader and back-office settlements manager. Leeson used this to his full advantage and opened an account ‘88888’ which he used to hide losses that he was making on derivative trading activities. Thereafter, he scaled up his trading activities in futures and options, and by December 1994 had accumulated losses of $208 mn on that account. All through this, he always represented to the top management that he had been making profits in trading activities. This was concealed by not divulging the details of account ‘88888’ to Barings in London, giving false reports, misrepresenting the profitability of trading activities and a number of false trading transactions and accounting entries. Leeson expected Tokyo’s Nikkei stock index to rise substantially at the beginning of 1995 and took huge positions, which he lost heavily on when the index did not rise. He bought 20000 futures contract over a period of three months in a futile attempt to move the market. According to Asia Week report around 75% of the total loss which Baring suffered resulted from these trades.
Compiled from ‘Billion Dollar Man,’ www.asiaweek.com and ‘Bank of England’ report on www.numa.com
Sumitomo Corporation In 1996, Sumitomo Corp. of Japan suffered a loss of $1.8 bn due to the derivative trading activities of its employee Yasuo Hamanaka, in the copper market. Unlike Leeson, Hamanaka was properly supervised and was believed to have pursued a well-thought-out corporate strategy of ‘cornering’ the world copper market. Sumitomo took advantage of fundamental economic principles of demand and supply, but instead of buying/selling in the real market, it chose to act through the derivatives market. Copper is subject to wide fluctuations between supply and demand, and being a commodity the production and consumption is not simultaneous, so it can be stored. Sumitomo tried to create an artificial shortage of copper to send prices soaring by taking huge positions in the copper market.

317
Derivatives Trading In India
The fundamental method of operation is as follows. First, you buy a commodity
irrespective of whether you actually physically own the commodity or buy up
‘futures’, in huge quantities that represent the total demand. Then deliberately keep
some - not all – of what you have bought from the market, to sell later. What you
have now done, if you have pulled it off, is created an artificial shortage that sends
prices soaring, allowing you to make big profits on the stuff you do sell. You may be
obliged to take some loss on the supplies you have withheld from the market, selling
them later at lower prices, but if you do it right, this loss will be far smaller than your
gain from higher current prices. This is exactly what Sumitomo did and amazingly
was able to pull it off, yielding huge profits for a number of years. But what led to
Sumitomo’s fall was Hamanaka’s unwillingness to sell some of the copper at a loss.
He tried to repeat his initial success by driving prices ever higher. Since a market
corner is necessarily a sometime thing, his unwillingness to let go, led to disaster.
Source: ‘How Copper came a Cropper’ on www.ex.ac.uk/~Rdavies/arian/scandals/
Exhibit IV
Features of OTC Markets
Compiled from Financial Derivatives Market and its Development in India on www.iimcal.ac.in
Exhibit V
Financial Derivatives Instruments in NSE
Products Index Futures Index Options Futures on Individual Securities
Options on Individual Securities
Underlying
Instrument
S & P CNX
Nifty
S & P CNX Nifty 41 Securities
stipulated by
SEBI
41 Securities
stipulated by SEBI
Type European American
Trading Cycle Maximum of 3
month trading
cycle. At any
time there will
be three
contracts:
Same as Index
futures
Same as Index
futures
Same as Index
futures
Over-the-counter contracts are mainly between the buyer and the seller with no obligation on the part of the exchange itself.
These (OTC) markets are not regulated and are also not subject to collateral or margin requirements.
In these markets very little information is available to the public regarding pricing and other trading information.
Since these markets are unregulated it involves counterparty risk.
There are no formal rules for risk and burden sharing.
In OTC markets derivative product can be customized to suit any risk/reward profile.

318
Financial Management
near month
the next month
the far month
Expiry Day Last Thursday of
the expiry month
Same as index
futures
Same as index
futures
Same as index
futures
Contract Size Permitted lot
size is 200 and
multiples thereof
Permitted lot size is
200 and in its
multiples
As stipulated by
NSE (not less
than Rs 0.2 mn)
As stipulated by
NSE (not less than
Rs 0.2 mn)
Price steps Re. 0.05 Re. 0.05
Base Price –
First day of
trading
Previous day’s
closing Nifty
Value
Value of the options
contract arrived
based on Black-
Scholes model
Previous day
closing value of
underlying
security
Theoretical value
of the options
contract arrived at
based on Black-
Scholes model
Base Price
(Subsequent)
Daily settlement
Price
Daily close price Daily settlement
price
Same as Index
options
Price Bands Operating ranges
are kept at 10 %
Operating ranges
are kept at 99% of
base price
Operating ranges
are kept at 20%
Operating ranges
are kept at 99% of
the base price
Quantity
Freeze
20000 units or
greater
20000 units or
greater
Lower of 1% of
market-wide
position limit
stipulated for
open positions
or Rs. 50 mn
Same as Individual
futures
Source: www.nseindia.com and www.iimcal.ac.in
Exhibit VI Indian Regulatory Framework
The regulatory framework in India is based on the recommendations made by the two Committees (LC Gupta and JR Verma) set up by SEBI for the smooth introduction of derivatives trading in India. The regulations are mostly in line with the International Organization of Securities Commissions (IOSCO) report on the International Regulation of Derivatives markets, Products and Financial Intermediaries made public in December 1996. The lawmakers have also tried to do justice with investors by addressing the common issues like investors’ protection, financial stability and market efficiency.
The Indian regulatory framework awards official recognition and legal acceptance to exchange traded derivatives, though the question of over the counter (OTC) markets still remains to be addressed. The products are standardized (Standard contract) which have been designed to address the functional priorities of risk shifting and price discovery. The regulator has also developed an in built system to prohibit market manipulation by providing for direct surveillance, price bands and positions limits.
To promote financial integrity and stability it has been provided that the authorization of derivative brokers/dealers will be based on capital adequacy and net worth. Also provisions have been made for adequate clearing and payment facilities, margin requirements, use of credit with some restrictions, segregation of customer fund from those of the firm for the purpose of customer protection, creation and maintenance of records on transactions including executed confirmations.
Adapted from Legal Aspects of Derivatives Trading in India on www.igidr.ac.in

319
Derivatives Trading In India
Exhibit VII
Global Derivatives Industry(Outstanding Contracts in $ Bn)
1995 1996 1997 1998 1999 2000 2001 June 02 Exchange traded derivatives
9283 10018 12403 13932 13522 14302 23798 -
Currencyfutures and options
154 171 161 81 59 96 93 -
Interest rate futures and options
8618 9257 11221 12643 11669 12626 21758 -
Stock Index futures and options
511 591 1021 1208 1793 1580 1947 -
OTCInstruments
17713 25453 29035 80317 88201 95199 111115
127564
Currencyswaps and options
1197 1560 1824 5948 4751 5532 6412 7647
Interest rate swaps and options
16515 23894 27211 44259 53316 58244 69776 80849
Other Instruments
- - - 30110 30134 31423 34927 39068
Total 26996 35471 41438 94249 101723 109501 134913
Source: Bank for International Settlements

320
Financial Management
Additional Readings & References: 1. Billion Dollar Man, Asiaweek.com, December 12, 1995
2. Shah, Ajay, Derivatives in Emerging Markets, Economic Times, July 1, 1997
3. Mehta, Nina, Derivatives En Route to India, Derivatives Strategy, May 1999.
4. Mahesh, Prashant, India’s Millennium Move, Financial Express, January 25, 2000.
5. Vora, Bhavesh, Taxation of Derivatives Transactions – Case Studies, I.T. Review, May 2002.
6. Ramachandran, G, Three Years of Derivatives: NSE Walks Away with the Market,Business Line, June 8, 2003.
7. Shah, Devang, Size Does Matter, for Derivatives Contract Size, www.valuenotes.com, June 17, 2003.
8. Shanbhag, A.N, Taxing the Future, Business Standard, August 16, 2003.
9. Jain, Nitin, Growth of Derivatives Market in India, www.valuenotes.com, September 15, 2003.
10. F&O Turnover Crosses 20K-cr Mark on NSE, Economic Times, January 29, 2004.
11. Mittal, Rajneesh, Why Derivatives?, www.karvy.com
12. Kuriakose, Deepak V, Demystifying Derivatives, www.karvy.com
13. www.nseindia.com
14. www.bseindia.com
15. www.sebi.gov.in
16. www.derivativesindia.com
17. www.numa.com
18. www.ex.ac.uk/

Reliance Petroleum’s
Triple Option Convertible Debentures (A)
“Till the advent of a big-ticket mop-up of investor funds by Reliance, the stock market
was confined to brokers, a few high net worth individuals, the UTI and a small set of
investors who profited from investing in MNCs when the companies were forced to
dilute their stakes in the mid-70s by the Government. Dhirubhai Ambani made
investing in the equity markets an acceptable practice in what was essentially a
market with a narrow investor base in the 70s and part of the 80s.”
- Business Line, July 2002.
AN INNOVATIVE FINANCIAL INSTRUMENT
In September 1993, Reliance Petroleum Ltd. (RPL), a part of the Reliance Group
made an initial public offering (IPO) to partly finance its Rs 51.42 billion refinery
project. RPL planned to establish a 9-million-tonne refinery at Jamnagar, Gujarat.
This was the first private sector refinery to be set up in India, pursuant to the oil sector
reforms1. The total public issue was of Rs. 21.72 billion while the net offer to the
Indian public amounted to Rs 8.62 billion. This was the largest IPO in India at that
time and was made through an innovative financial instrument in the form of Triple
Option Convertible Debentures (TOCDs).
The TOCDs were rated BBB+ (‘triple B plus’)2 by Crisil and Fitch3. Capital market analysts appreciated RPL’s move to issue TOCDs to raise capital from the public since they felt that these financial instruments would benefit the company as well as the investors. The TOCDs were not structured as a conventional debt since they did not have to bear the burden of interest costs for the company. Moreover, they also provided with an option to investors to opt for equity shares at the time of TOCD conversion in September 1997 in case the listed price of RPL stocks was higher. Analysts believed that the TOCDs would also ensure that RPL maintained its debt-equity ratio at 1:1. However, some market observers expressed doubts whether this mega issue would be fully subscribed given the depressed stock market conditions during that time. Despite these fears, the TOCD issue was successful.
The issue created an investor base exceeding two million, the second largest in the
Indian corporate sector next only to Reliance Industries Limited (RIL). Market
analysts attributed this success to the investor friendly image of the RIL Group. The
use of convertible securities that reduced the investors’ risk and provided them with
the option of converting debentures into tradable securities also contributed to its
success. They also said that the Reliance Group was among the few Indian business
houses, which recognized the importance of public investors, discovered the vast
1 The oil sector reforms involved deregulation of the marketing of controlled products namely LPG, gasoline, kerosene and diesel.
2 The rating indicated sufficient safety with regard to timely payment of interest and principal. However, adverse circumstances were more likely to lead to a weakened capacity to repay interest and principal than for debentures in higher rated categories.
3 US based Fitch is a leading global credit rating agency originally known as Duff and Phelps. It rates financial instruments on the basis of their repayment ability. BBB+ indicates investment

322
Financial Management
untapped potential of capital markets and channelized it for the growth and
development of the industry. Commenting on the success of the TOCD issue,
Business Standard stated, “Reliance’s uninterrupted dividends and increasing market
value were sure signs for the success of the TOCD issue.”4
THE RELIANCE PETROLEUM STORY
Reliance Group was among the largest business houses in India with interests in several businesses including textiles, petrochemicals, petroleum products, oil & gas, power, telecom, synthetic fibers, fibre intermediates, financial services, refining & marketing and insurance.
The significant success, which the RIL Group had witnessed over the years, could be mainly attributed to the founder and former chairman of Reliance Group, Dhirubhai H. Ambani. In 1950, at the age of 17 he went to Aden (now part of Yemen) and worked for A Besse & Company Ltd., a distributor for Shell products. In 1958, he returned to Mumbai and started his first company, the Reliance Commercial Corporation (RCC), a commodity trading enterprise and an export house. In 1966, as a first step towards its highly successful strategy of backward integration, he set up a textile mill called Reliance Industries Limited (RIL) in Naroda, Ahmedabad. In 1975, a technical team from the World Bank certified that the Reliance textile plant was “excellent according to developed country standards.” In 1977, RIL went public. For much of the 1980s, Reliance Group’s fund-raising was centred on its flagship company RIL, which came out with the public issue of equities as well as convertible debentures. The use of convertible financial instruments to raise finances from public was actively practiced by Reliance to ensure that its debt equity ratio did not exceed 1:1.
Since the first public issue, the RIL Group had made efforts to build an investor friendly image. RIL had a history of paying uninterrupted dividends with the dividend growing from 15 per cent in 1976-77 to 55 percent in 1994-95. Moreover, the dividends paid had been on a much higher equity capital which rose to Rs 3.19 billion in 1993-94 from Rs 59.5 million in 1976-77 due to the bonus and rights issues made during the period. The kind of returns RIL’s stock offered over the years seemed to have built shareholders’ confidence in the group. The group had been credited with a number of financial innovations in the Indian capital market and emerged as one of the largest family of shareholders in the world with investments of over Rs.360 billion.
In September 1991, RPL was incorporated under the name Reliance Refineries Private Limited in Mumbai. On March 06, 1993, the name of the company was changed to Reliance Refineries Limited. Subsequently, at the extraordinary general meeting of the company held on March 26, 1993, it was renamed Reliance Petroleum Ltd. The company came out with its first public issue in September 1993.
SOURCES OF FINANCE
An organization can raise money through public investors by issuing various financial instruments. These can be in the form of equity shares, preference shares, debentures and bonds and can be classified into two broad categories of equity and debt.
EQUITY
Equity refers to the raising of funds from the public by issuing shares from the equity share capital of the company at face value or at a premium. Companies that have a
grade rating with a low probability of default. However, this rating was later withdrawn in 2001.
4 Business Standard Research Bureau, August 2002.

323
Reliance Petroleum’s Triple Option Convertible Debentures (A)
proven track record or new companies promoted by well-known existing companies can issue shares at a premium. The price of the share issued in IPO is determined in consultation with the lead manager5 for that issue. However, the price has to be justified as per the Malegam Committee recommendations6. Though equity is the most common source of raising funds, it involves larger issue expenses including underwriting7 costs, registration costs, listing fees, lead manager expenses etc. Moreover, equity for an unproven venture may not be considered attractive by investors resulting in lower than expected realizations from the issue.
Organizations can also raise equity capital through a rights issue. A rights issue allows
a company to give its current shareholders the opportunity, ahead of the general
public, to buy new shares in proportion to the number of shares they already own.
These additional shares are usually offered below the prevailing market price and
have to be exercised within a relatively short specified period. This method of raising
finance is similar to private placement8, with the existing shareholders acting as
counter parties in the exchange. This method may reduce the cost of financing
substantially. The issue of rights shares in India is governed by Section 81 of the
Companies Act of 1956.
Preference shares are another form of shares that fall between pure equity and debt.
They do not carry any voting rights and can be issued only after the issue of equity
shares. The amount of dividend for these shares is fixed and paid in the event of a
profit ahead of equity shares. These shares can be subscribed either through a public
issue or can be allotted through a private placement. The claims of preference
shareholders are given higher priority than those of equity shareholders but lower than
those of debtholders.
A warrant is a certificate that gives its holder the right to purchase equity shares at a
specified price. A warrant is usually offered along with a bond. The warrant provides
its holder with a right and not an obligation to purchase equity shares.
DEBT
Debt instruments can be broadly classified into debentures and bonds. Debentures are
fixed interest debt instruments with varying periods of maturity. They can be listed on
the stock exchanges provided they have been rated by a credit rating agency.
Debentures can be classified as fully convertible, partially convertible and non
convertible. These together are classified as convertible securities or convertibles.
They are instruments with embedded options and give the holder a right to convert a
given security into a specified number of equity shares under stated conditions.
A bonds is a certificate of intention to pay the holder a specified sum, within a
specified date. The fundamental difference between debentures and bonds is that
debentures are normally secured against tangible assets of the company whereas
5 The Investment bank which is primary responsible for organizing a given issue. This bank finds lending organizations and underwriters to create the syndicate, negotiate terms with the issuer, and assess market conditions. It is also referred as the syndicate manager, managing underwriter, lead underwriter.
6 The committee recommends price justification on the basis of i)Earnings Per Share (EPS) for the last three years. ii) A comparison of pre-issue price to earnings (P/E) ratio and the P/E ratio of the industry. iii) The minimum return on increased networth to maintain pre-issue EPS.
7 Underwriting is a process, whereby, the Lead Manager or Underwriter ensures that the issue will be subscribed fully. In case the issue is not fully subscribed, the underwriter is forced to purchase the unsubscribed portion of the issue.
8 Issuing shares to a select group at a specified price.

324
Financial Management
bonds are not. Bonds can be of various types including income, infrastructure, and tax
savings or deep discount bonds. They can be fixed interest rate, floating rate or deep
discount bonds. Fixed rate bonds provide a fixed interest rate to investors which is
specified during the time of issue. In case of floating rate bonds, the interest is usually
linked to some benchmark index such as the bank rate. The interest is usually quoted
as a mark up of the bank rate and varies as that rate increases or decreases. Both these
bonds provide a regular income with the interest being paid at fixed intervals or a
cumulative income in which the interest is paid on redemption. However, deep
discount bonds are issued at a discount to the face value and an investor is paid the
face value on redemption.
TOCDS – A CLOSER LOOK
The TOCDs issued by RPL were an innovative variant to the Reliance Group’s general policy of raising capital through the issue of convertible securities. Each TOCD was issued for a face value of Rs 60. The TOCDs were made more attractive by allowing the payment to be made in installments of the sum of Rs 60 (Refer Table I) spread over a period of three years. The instrument included two equity shares allotted to the investors at the face value of Rs 10 each. These two equity shares were allotted as soon as the first installment of Rs. 20 was paid. The remaining amount of Rs 40 comprised a non-convertible portion accompanied by two detachable warrants9,each of which could be converted into an equity share by paying Rs. 20 per share i.e. at a premium of Rs. 10. The rights against the warrants could be exercised between the forty seventh and forty ninth months after the opening date of the issue i.e. September 23, 1993.
Table I
RPL’s TOCD Issue Payment Schedule
Payment Schedule Amount Zero Date – (taken as issue opening date) Rs. 20
After 18 Months * Rs. 10
After 30 Months * Rs. 15
After 36 Months * Rs. 15
Source: Capital Market, September 26, 1993.
* To be reckoned from zero date
The holders of the TOCD would not be paid any interest for the first five years of the issue but were provided with three options (Refer Table II). The investors were required to exercise their option in September 1997 (between the 47th and 49th month from the date of the issue) when the RPL share was trading at around Rs. 22. They were also required to make a choice between converting the non convertible portion and the detachable warrants into equity shares or redeeming the instrument.
Table II
RPL’s TOCD Options
Option 1 Option 2 Option 3 Retain the non-convertible portion of Rs. 40 per debenture and get
Surrender the non-convertible portion of Rs. 40 per debenture
Exercise the warrants between the 47th and 49th month from the zero date by making a
9 A warrant entitles the holder to buy a given number of shares at a stipulated price. A detachable warrant is one that can be sold separately from the original instrument it was issued with.
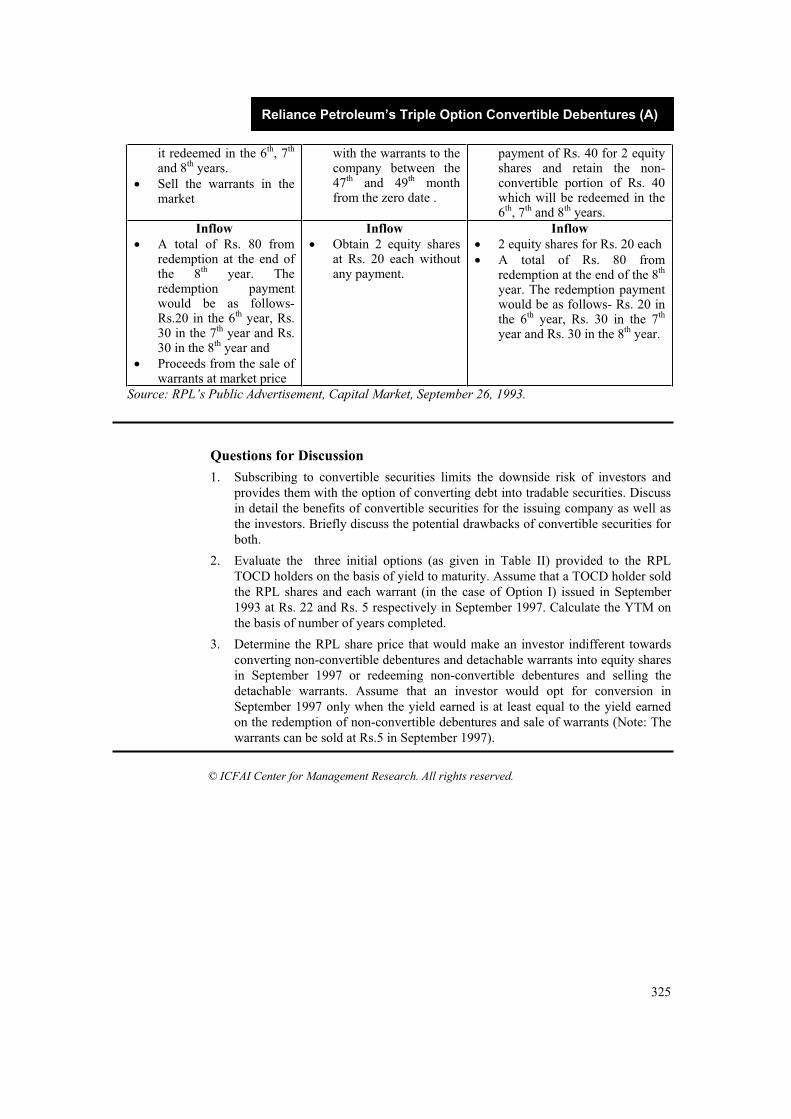
325
Reliance Petroleum’s Triple Option Convertible Debentures (A)
it redeemed in the 6th, 7th
and 8th years.
Sell the warrants in the market
with the warrants to the company between the 47th and 49th month from the zero date .
payment of Rs. 40 for 2 equity shares and retain the non-convertible portion of Rs. 40 which will be redeemed in the 6th, 7th and 8th years.
InflowA total of Rs. 80 from redemption at the end of the 8th year. The redemption payment would be as follows- Rs.20 in the 6th year, Rs. 30 in the 7th year and Rs. 30 in the 8th year and
Proceeds from the sale of warrants at market price
InflowObtain 2 equity shares at Rs. 20 each without any payment.
Inflow2 equity shares for Rs. 20 each
A total of Rs. 80 from redemption at the end of the 8th
year. The redemption payment would be as follows- Rs. 20 in the 6th year, Rs. 30 in the 7th
year and Rs. 30 in the 8th year.
Source: RPL’s Public Advertisement, Capital Market, September 26, 1993.
Questions for Discussion
1. Subscribing to convertible securities limits the downside risk of investors and
provides them with the option of converting debt into tradable securities. Discuss
in detail the benefits of convertible securities for the issuing company as well as
the investors. Briefly discuss the potential drawbacks of convertible securities for
both.
2. Evaluate the three initial options (as given in Table II) provided to the RPL
TOCD holders on the basis of yield to maturity. Assume that a TOCD holder sold
the RPL shares and each warrant (in the case of Option I) issued in September
1993 at Rs. 22 and Rs. 5 respectively in September 1997. Calculate the YTM on
the basis of number of years completed.
3. Determine the RPL share price that would make an investor indifferent towards
converting non-convertible debentures and detachable warrants into equity shares
in September 1997 or redeeming non-convertible debentures and selling the
detachable warrants. Assume that an investor would opt for conversion in
September 1997 only when the yield earned is at least equal to the yield earned
on the redemption of non-convertible debentures and sale of warrants (Note: The
warrants can be sold at Rs.5 in September 1997).
© ICFAI Center for Management Research. All rights reserved.

326
Financial Management
Exhibit I
Risk Factors of RPL Public Issue
The profit projections of the company were based on the Administered
pricing mechanism of the Government of India. Any adverse changes would
have an effect on the profitability of the company.
The supply of crude oil was canalized through the Indian Oil Corporation by
the Government of India. Any interruption in the supply of crude oil would
have an adverse impact on the working of the company. However, the Indian
Petroleum Industry had not experienced any interruption in the supply of
crude oil even during the Gulf War.
The estimates and prices on which capital costs had been made could vary on
account of adverse developments during the period of implementation, which
could lead to cost and time overruns. According to company sources
adequate precautions had been made to minimize the impact of such
developments
The company would also raise Rs. 6 billion through suppliers credit and
foreign currency loans. Exchange rate fluctuations and interest rate variations
would affect project costs.
The company had entered into a Memorandum of Understanding (MOU)
with UOP Americana for supplying the needed technology but an agreement
had still to be signed. (as on September 1993).
The estimates for the costs were made on the basis of data available with
Engineers India Limited (EIL), who were consultants for other refineries,
with suitable adjustments for capacities and costs. This was done, as detailed
engineering particulars for the project were not available.
Source: RPL’s Public Advertisement, Capital Market, September 26, 1993.
Exhibit II
Lead Managers to RPL Issue
Industrial Development Bank of India
ICICI Securities and Finance Company Limited
The Industrial Finance Corporation of India Limited
SBI Capital Markets Limited
J. M. Financial & Investment Consultancy Services Limited
Enam Financial Consultants Private Limited
Source: RPL’s Public Advertisement, Capital Market, September 26, 1993.

327
Reliance Petroleum’s Triple Option Convertible Debentures (A)
Additional Readings and References: 1. “Reliance Petroleum - Innovative delicacy,” Capital Market , September 26 1993
2. “Reliance Petroleum warrant Price Shoots Up,” Financial Express, October 20, 1997.
3. “Reliance Petro Board to Take Up Debenture Conversion Option,” Financial Express,March 13, 1998.
4. Readers Response, “Reading Reliance,” Economic Times, May 11, 1998.
5. Research Report, myiris.com, May 2001.
6. Vaidya Nathan S, “Messiah of Investing Masses,” Business Line, July 8, 2002.
7. Dr. Ritchie John C Jr. (Ph.D.), “Convertible Securities,” Temple University.
8. www.ril.com
9. www.indiainfoline.com
10. www.myiris.com
11. www.relpetro.com

Reliance Petroleum’s
Triple Option Convertible Debentures (B) “Finance will never be a constraint in executing projects because Indian investors will provide me with the necessary resources.”
- Dhirubhai Ambani, Former Chairman, RIL Group.
RELIANCE PETROLEUM LIMITED TOCD ISSUE
Reliance Petroleum Limited (RPL), a part of the Reliance Group1 came up with an initial public offering (IPO) in September 1993 to partly finance its Rs 51.42 billion refinery project. The total public issue was of Rs. 21.72 billion while the net offer to the Indian public was Rs. 8.62 billion. The issue was the largest during that time in India and was made available to the public through an innovative financial instrument in the form of Triple Option Convertible Debentures (TOCDs).
The TOCD was not structured as a conventional debt instrument. Each TOCD was issued for a face value of Rs. 60. This included two equity shares allotted to the investors at a face value for Rs 10 each. The remaining Rs 40 comprised of a non-convertible accompanied by two detachable warrants2. The TOCD holders could exercise the option to convert their instrument into equity shares in September 1997 that is, between the 47th and 49th months from the date on which the TOCD was issued (Refer Exhibit I for complete details of the TOCD issue).
Some market observers expressed doubts as to whether this mega public issue would be fully subscribed to given the depressed condition of the stock market at that time. Belying these fears, RPL’s issue of TOCD was successful. However, despite the success in obtaining the required finances, the RPL project could not be commenced as scheduled3. The delay was caused mainly due to the scaling up of the proposed refining capacity from the initial nine million to 18 million tons and eventually to 27 million tons per annum.
With this increase in capacity, RPL became the world’s largest grassroot refinery and seventh largest operating refinery in the world. The project commenced with the acquisition of land in December 1994. The construction commenced only in the year 1996, with the leveling of land and laying of equipment foundations. The increase in the plant’s refining capacity from 9 million tons to 18 million tons was officially announced in April 1998, followed by a further increase in capacity in December 1998 to 27 million tons. The project was eventually commissioned in the financial year 1999-2000. It started commercial production in April 2000. RPL completed its first full year of commercial operations in March 2001, during which it emerged as the largest private sector company in terms of revenues, with sales worth more than Rs 300 billion. The plant utilized 100% of its capacity during the initial years and was expected to increase it to 115%.
1 The Reliance Group is among India’s largest business houses, involved with interests in several businesses including textiles, petrochemicals, petroleum products, oil & gas, power, telecom, synthetic fibers, fibre intermediates, financial services, refining & marketing and insurance.
2 A warrant entitles the holder to buy a given number of shares at a stipulated price. A detachable warrant is one that can be sold separately from the original instrument it was issued with.
3 The project was to commence its operations during the financial year 1996-97.

329
Reliance Petroleum’s Triple Option Convertible Debentures (B)
By 2002, RPL had emerged as one of the most modern refineries in the world, using
the latest technology, and had the ability to use almost any kind of crude oil. The
refinery had the capacity to process 80,000 tons of crude oil per day and its capital
cost per ton was about 40% lower than existing refineries in India. This translated into
substantial cost competitiveness. Some of the products like naphtha reformate and
propylene produced by RPL were captively consumed by Reliance Industries Limited4
ensuring sufficient off take and substantial savings in handling and storage costs.
Captive consumption by group companies accounted for approximately 25%-30% of
RPL’s production. The main products of the company were liquid petroleum gas
(LPG), motor spirit/gasoline (MS), naphtha, high-speed diesel (HSD), superior
kerosene oil (SKO) & aviation turbine fuel (ATF), fuel oil (FO), coke and sulphur.
THE NEED FOR AN ALTERNATIVE
The holders of the RPL’s TOCD issued in 1993 were not allowed to exercise the option of converting TOCD in September 1997, as was promised in the IPO document. This was postponed till May 1998 in order to provide the investors with a new conversion option. Analysts commented that the need to come up with the new option was prompted by the fact that the non- convertible debenture was trading at around Rs. 48 (Refer Table I) and the two warrants could be sold for Rs 5 each in the market between September 1997 and April 1998, as against shares worth Rs 40 that would be received if the same were to be surrendered. Moreover, RPL’s stock price was Rs. 22 (Refer Table II).
Table I
RPL’s Debenture Prices (Average Price)
Date Debenture Prices Face Value (Rs.40)
April 1998 Rs.48
September 1998 Rs.55
February 2000 Rs.48
Source: myiris.com
Table II
RPL’s Share Prices (Average Price)
Date Share Prices September 1997 Rs 22
March 1998 Rs 25
April 1998 Rs 22.50
May 1998 Rs 22
September 1998 Rs 21
March 1999 Rs 20
November 1999 Rs 50
February 2000 Rs 70
March 2000 Rs 60
November 2000 Rs 50
4 Reliance Industries Limited (RIL) is the flagship company of the Reliance group involved in several businesses like petrochemicals, polyester, textiles etc.

330
Financial Management
March 2001 Rs 53
November 2001 Rs 30
March 2002 Rs 25
September 2002 Rs 23
Source: myiris.com
This meant that the market value of the shares held by an investor opting for conversion in accordance with the initial offer (Refer Exhibit I) in September 1997 was Rs. 44 which was much lower than the combined market value of the non-convertible debenture and the detachable warrants. This meant that investors would not have opted to surrender the TOCDs.
THE NEW OPTION
On April 15, 1998, RPL convened an extraordinary general meeting (EGM) to seek shareholders’ approval to hike its authorized share capital from Rs 50 billion to Rs 70 billion. The purpose was to enable investors to use the new conversion option,5 which involved phased allotment of three equity shares with a face value of Rs 10 each, in lieu of Rs 40 paid-up non-convertible debentures along with the detachable warrants. As per the option, the first equity share at par would be allotted in November 1999 (the 6th year), followed by two equity shares at a premium of Rs 5 each in November 2000 (the 7th year) and November 2001 (the 8th year). The period from May 1998 to June 1998 was the period during which the conversion offer would operate.
In case the TOCD holders did not want to opt for the new option, they could get the non-convertible portion of the TOCD redeemed in three installments. The first installment of Rs 20 per TOCD was to be paid in November 1999 (6th year). The second installment of Rs 30 per TOCD, was payable in November 2000 (7th year) and the final installment of Rs 30 (8th year) per TOCD was payable in November 2001.
However, the new option provided by RPL had its fair share of criticism. A certain set
of warrant holders felt that the conversion price of Rs 13.33 for a TOCD was too high
for them, since they bought the warrant for Rs 5 in April 1998, and could convert
them into shares only at Rs. 20.
The move, apart from giving an option to about 2.4 million TOCD holders to opt for
equity in the company, was also aimed at shoring up the balance sheet of the company
by reducing the debt-to-equity ratio. If all the TOCD holders decided to surrender
their debentures in return for three equity shares, it would lead to lowering of the debt-
to-equity ratio to 0.45:1 from the current 0.80:1. According to sources, this would
strengthen the capital base of the company and enable it to participate in the attractive
opportunities coming up in the oil sector, pursuant to reforms and deregulation of the
refining, marketing and distribution, and energy sectors.
However, in February 2000, RPL exercised its call provision and redeemed the non-
convertible portion of its outstanding TOCDs, which aggregated to Rs 9.6 billion at
Rs 50.50, a 5% premium compared to the prevalent market price of Rs 48. This
redemption parity were provided to over 0.9 million TOCD holders, almost two years
in advance. According to RPL sources, the redemption of outstanding TOCDs would
improve RPL’s debt-equity ratio to around 0.9:1, and would contribute to substantial
reduction in the company’s overall interest costs.
5 The TOCDs, when converted into equity shares, would ultimately result in an increase in the issued and subscribed equity share capital of the company by an amount not exceeding Rs 13.75 billion.

331
Reliance Petroleum’s Triple Option Convertible Debentures (B)
RPL – INVESTOR RETURNS?
The Reliance Group had always prided itself in creating value for its investors. This was visible through the RPL share prices from the very first year when it began operating. The share price witnessed a sharp rise from around Rs.22 at the beginning of the financial year 1999 to about Rs.60 by the end of it. RPL’s financial performance over the next two financial years had been impressive with a net profit worth Rs 14.64 billion in 2000-2001 and Rs 16.74 billion in 2001-2002 on revenues amounting to Rs 309.63 billion and Rs.331.17 billion respectively. However, during September 2002, the share price of RPL stood at around Rs.23. The earnings per share (EPS) of the RPL stock remained at three, but there had been a sharp decline in its P/E6 multiple from 18 in 2001 to only 8 in 2002. There was a delay in dismantling the administrative pricing mechanism, which was expected to benefit RPL profits7
significantly. In such a scenario, investors, who had converted their TOCDs into equity shares rather than redeeming them, wondered whether they had made the right decision.
Questions for Discussion:
1. What were the reasons behind RPL offering a new conversion option to its TOCD investors? Evaluate the new option keeping the exercise date for the option as May 1998 (treated as completed year 5).
The choices available under the new option are:
Surrender the non-convertible portion of Rs.40 per debenture along with the warrants to the company for three equity shares allotted in a phased manner. Assume that the shares are sold as soon as they are received.
Retain the non-convertible portion of Rs.40 per debenture and get it redeemed in the 6th, 7th and 8th years, and sell the warrants and the two equity shares issued in September 1993 in the market, in May 1998.
Redeeming the debentures in February 2000 (considered as 6.5 years) as per the call option of the company.
2. Compare the yield earned by an investor who exercised the option of converting the non-convertible debenture plus detachable warrants into three equity shares and sold the equity shares in September 2002 with:
An investor who did not avail the conversion option and redeemed the non convertible debenture, sold the warrants in the market and sold the two equity shares allotted in September 1993 in May 1998 (treated as completed year 5).
An investor who converted the non-convertible debenture and the detachable warrants into shares and sold the shares as soon as they were allotted, that is, in November 1999 (the 6th Year), November 2000 (the 7th Year) and November 2001 (the 8th Year) including the two equity shares allotted in September 1993 and sold in May 1998.
3. In May 1998, an investor purchases the non-convertible portion of the TOCD at Rs. 48 along with the two detachable warrants at Rs 5 each. Calculate the yield earned by the investor if he exercises the option for conversion of the non-convertible portion and the detachable warrants into three equity shares, and sells the shares as and when they are allotted.
© ICFAI Center for Management Research. All rights reserved.
6 It refers to the ratio between market price of a stock and the earnings per share. 7 After the dismantling of the administered pricing mechanism the public sector refineries,
would not be entitled to a guaranteed return and would have to compete on an equal footing with the private refineries. Since RPL is the lowest cost refinery in India it can price its products competitively thus giving significant advantage to the company over its competitors in terms of increased revenues.

332
Financial Management
Exhibit I
Details of the RPL TOCD Issue Made In September 1993
The TOCD issue was made attractive to investors by spreading the payment of the sum of Rs.60 for the issue over a period of three years.
RPL’S TOCD Issue Payment Schedule
Payment Schedule Amount
Zero Date (taken as issue opening date)
Rs. 20
After 18 Months * Rs. 10
After 30 Months * Rs. 15
After 36 Months * Rs. 15
Source: Capital Market, September 26th, 1993.
* To be reckoned from zero date
The holders of the TOCD would not be paid any interest for the first five years of the issue, but were provided with three options.
RPL’S TOCD Options
Option 1 Option 2 Option 3
Retain the non-convertible portion of Rs.40 per debenture and get it redeemed in the 6th,7th and 8th years.
Sell the warrants in the market.
Surrender the non-convertible portion of Rs.40 per debenture with the warrants to the company between the 47th and 49th
month from the zero date.
Exercise the warrants between the 47th and 49th month from the zero date by making a payment of Rs.40 for 2 equity shares and retain the non-convertible portion of Rs.40 which will be redeemed in the 6th, 7th and 8th years.
Inflow
A total of Rs. 80 from redemption at the end of the 8th
year. The redemption payment would be as follows – Rs 20 in the 6th year, Rs 30 in the 7th year and Rs 30 in the 8th year and
Proceeds from the sale of warrants at market price.
Inflow
Obtain 2 equity shares at Rs.20 each without any payment.
Inflow
2 equity shares for Rs.20 each
A total of Rs.80 from redemption at the end of the 8th year. The redemption payment would be as follows- Rs.20 in the 6th year, Rs.30 in the 7th year and Rs. 30 in the 8th year.
Source: RPLs Public Advertisement, Capital Market, September 26, 1993.

333
Reliance Petroleum’s Triple Option Convertible Debentures (B)
Additional Readings and References: 1. “Reliance Petroleum - Innovative delicacy,” Capital Market, September 26, 1993.
2. “Reliance Petroleum warrant Price Shoots Up,” Financial Express, October 20, 1997.
3. “Reliance Petro Board to Take Up Debenture Conversion Option,” Financial Express,March 13, 1998.
4. Readers Response, “Reading Reliance,” Economic Times, May 11, 1998.
5. RPL Research Report , myiris.com , May 2001.
6. Vaidya Nathan S, “Messiah of Investing Masses,” Business Line, July 8, 2002.
7. Dr. Ritchie John C Jr. , “Convertible Securities,” Temple University.
8. www.ril.com
9. www.indiainfoline.com
10. www.myiris.com
11. www.relpetro.com

MRPL and RPL – Analyzing Risk and Returns
“Four Indian oil companies feature among the top ten oil companies in Asia. Reliance Petroleum’s market capitalization of Rs 288.24 billion is the highest among Asian refining companies.”
- Goldman Sachs Database on Asian Refineries in 2000.
INTRODUCTION
Mangalore Refinery and Petrochemicals Limited (MRPL) and Reliance Petroleum
Limited (RPL) were the first two refineries established by the private sector in India.
In March 1992, MRPL brought out a public issue of shares, and in September 1993,
RPL did the same. Both these refineries were established at a time when the
administered pricing mechanism (APM)1 was in force. APM involved full government
control over the oil and natural gas sector, where only four major government owned
oil companies (IOC, HPCL, BPCL and IBP) had the right to directly market
petroleum products (Refer Exhibit I).
The government refineries were not able to meet the increasing demand for petroleum
products. Hence, opening up of the oil and natural gas sector to private companies and
dismantling APM were considered as methods for reducing the demand-supply gap of
petroleum products.
When the Government of India (GOI) approved private sector participation in the oil
refining and petroleum industry, a new investment opportunity was made available to
Indian investors. Those who invested in MRPL and RPL were optimistic about the
returns on shares of both these companies since reputed leading business houses such
as the Aditya Birla Group (ABG)2 and the Reliance Group3 promoted these refinery
projects. Due to the dearth of oil company stocks promoted by the private sector, the
shares of both these companies were lapped up by public investors and financial
institutions. Both the public issues were heavily oversubscribed.
However, few investment analysts expressed their reservations about investing in
stand-alone refineries like MRPL and RPL since they felt that the financial
performance of companies in the refining industry was completely dependant on the
crude oil prices.
1 The government-controlled APM for petroleum products is based on the retention price concept, under which oil marketing companies are compensated for operating costs and assured a return of 12% after tax on net worth. This concept ensures a fixed level of profitability for oil marketing companies, subject to their achieving specified capacity utilization. APM ensures that products such as kerosene (used by the economically weaker sections of the population), and diesel (used by public transport and agricultural sector) are protected from the volatility in international oil prices.
2 The Aditya Birla Group is one of India’s largest business houses. The group includes companies such as Grasim, Hindalco, India Rayon and Indo Gulf.
3 The Reliance Group is among the largest business houses in India, with interests in several businesses including textiles, petrochemicals, petroleum products, oil & gas, power, telecom, synthetic fibers, fibre intermediates, financial services, refining & marketing and insurance.

335
MRPL and RPL – Analyzing Risk and Returns
BACKGROUND NOTE
MRPL
MRPL was the first grassroot refinery set up by the private sector in India. The company, which was incorporated in March 1988, had received government approval in April 1991 for setting up a refinery in Mangalore in the state of Karnataka. MRPL was set up as a joint venture between Hindustan Petroleum Corporation Limited4
(HPCL) and Indian Rayon and Industries Limited (IRIL), a part of the ABG group. HPCL and IRIL each held a 37.8% equity stake in the joint venture while the rest was offered to the public.
The MRPL project was planned to be set up in 1992 with a refining capacity of three million (mn) metric tonnes per annum (MMTPA) at an estimated cost of Rs.11.62 billion (bn). The project was partly financed through a public issue of 16% secured redeemable partly convertible debentures (PCDs) of Rs.135 amounting to Rs.5.82 bn and 17.5% secured redeemable non-convertible debentures of Rs.200 (with detachable equity warrants) amounting to Rs.5.60 bn. The remaining Rs 0.2 billion was financed through foreign currency loans.
The project ran into cost escalations and the plant was finally commissioned in March 1996 at a revised cost of Rs. 25.93 bn. In September 1999, MRPL increased the refining capacity of the plant to nine MMTPA. The capacity expansion involved an additional cost of Rs. 37 bn. To ensure the continuous supply of crude for the refinery, MRPL entered into contracts with domestic as well as international crude oil producers. Initially, the sole rights for marketing MRPL’s products were with HPCL, but in 2001, MRPL started direct marketing of its products by exporting fuel oil, aviation turbine fuel, motor spirit and Naphtha.
RPL
RPL was the second grassroot refinery set up by the private sector in India after MRPL. RPL’s plant was set up at Jamnagar in the state of Gujarat. It was promoted by the Reliance Group and was completely privately owned. It was incorporated as Reliance Refineries Private Limited in September 1991. The company was given its current name of Reliance Petroleum Limited (RPL) at an extraordinary general meeting (EGM) held in March 1993.
RPL was planned to be set up with an initial refining capacity of nine MMTPA at an estimated cost of Rs. 51.42 bn in 1993. The project was partly financed by an initial public offering (IPO) of triple option convertible debentures (TOCDs) in September 1993 (Refer Exhibit II). The public issue of RPL amounted to Rs. 21.72 bn, the largest issue in terms of amount raised during that time in India. The net offer to the Indian public was Rs. 8.62 bn.
The project commenced with the acquisition of land, which was completed in December 1994. Construction commenced in 1996, with the leveling of land and the laying of equipment foundations. The Reliance Group expected the plant to be fully commissioned in 1996, but this was delayed due to an increase in the capacity of the refinery. In April 1998, the Group announced that capacity would be increased to 18 MMTPA; and in December 1998, it announced a further increase in refining capacity to 27 MMTPA. The project was eventually commissioned in the financial year 1999-2000.
The main products manufactured by the refinery were liquid petroleum gas (LPG), motor spirit/gasoline (MS), Naphtha, high-speed diesel (HSD), superior kerosene oil (SKO), aviation turbine fuel (ATF), fuel oil (FO), coke and Sulphur. A large
4 HPCL is one of the largest oil refining and marketing company in the public sector in India with revenues of more than Rs. 400 billion in the financial year 2001-2002.

336
Financial Management
proportion of these products were assured of captive consumption by Reliance Industries Limited (RIL), and other constituents of the Reliance group.
FINANCIAL PERFORMANCE
MRPL
MRPL completed its first full year of operations in the financial year 1996-1997. The
refinery operated at a capacity utilization of 93.5% during this period. The company
earned a net profit of Rs. 905 mn in the very first year of its operations. However,
during the financial years 1999-2000, 2000-2001 and 2001-2002, MRPL suffered
significant losses (Refer Table I for the financial results of MRPL). The company’s
debt to networth ratio rose from 5.61 in the financial year 1999-00 to 7.88 in 2000-01,
to as high as 16.13 in 2001-02.
Table I
MRPL’s Income Statement and Balance Sheet
(Rs. in mn)
Particulars April 1999 – March 2000 April 2000 –
March 2001
April 2001 –
March 2002
Net Sales 30212.04 28891.50 53714.40
Other Income 701.37 524.20 439.90
Total Income 30913.41 29415.70 54154.30
Expenditure5 (30112.79) (27917.50) (51587.00)
Interest (2369.59) (2378.30) (6722.90)
Depreciation (1427.63) (1728.60) (3633.50)
Tax (0.24) (0.30) 2864.30
Total Expenditure (33910.25) (32024.70) (61943.40)
Profit After Tax (2996.84) (2609.00)6 (4924.80)
Equity 7921.00 7921.00 7921.00
Reserves 1714.50 (1506.96) (4489.56)
Debt 54082.97 50516.52 55356.94
Source: www.bseindia.com
MRPL also witnessed an increase in the expenditure on raw materials mainly due to
the increase in crude oil prices. This increase in cost resulted in a reduction in the
company’s margins. According to analysts, the dismantling of administered pricing
mechanism was also expected to affect MRPL adversely, since its average cost of
production was higher than that of other refineries.
Despite efforts made by MRPL to restructure its debt, the company continued to incur
losses. For the financial year 2001-02, the company reported a loss of Rs. 3.01 bn for
the first quarter (ended June 30, 2002) on revenues of Rs. 11 bn.
5 Expenditure includes cost of raw material, staff costs and other miscellaneous expenditures. 6 In 2000-01 an extraordinary item worth Rs. 758.5 mn was added to the revenues. This caused
a decrease in the loss to Rs. 1850.5 mn.

337
MRPL and RPL – Analyzing Risk and Returns
RPL
RPL completed its first full year of commercial operations in the financial year 2000-
2001 with a capacity utilization of 100%. It became the largest private sector company
in the country in terms of sales during the financial year 2000-01 (Refer Table II for
financial results of RPL). With a net profit of Rs. 14.64 bn in 2000-01, and a ROE of
over 25%, RPL was amongst the most profitable petroleum refineries in India (Refer
Exhibit III). Moreover, the operating profit margins of RPL for 2000-01 and 2001-02
were higher than those of public sector refineries.
Table II
RPL’s Income Statement and Balance Sheet
(Rs. in mn)
Particulars April 2001 – March 2002 April 2000 – March 2001 Net Sales 331170.00 309630.00
Other Income 3550.00 2200.00
Total Income 334720.00 311830.00
Expenditure7 (299430.00) (279090.00)
Interest (9550.00) (10320.00)
Depreciation (8020.00) (6610.00)
Tax (980.00) (1170.00)
Total Expenditure (317980.00) (297190.30)
Profit after Tax 16740.00 14640.00
Equity 52020.00 47488.10
Reserves - 34974.20
Debt - 74921.30
Source: www.bseindia.com
The RPL refinery was set up at a 30% lower cost per ton of refining capacity than
other refineries in Asia. The lower cost of production enabled RPL to gain
competitive advantage over its rivals. RPL was able to earn huge profits in the very
first year because it had a low cost of production as well as a low debt to net worth
ratio, which was 0.9:1 as on March 2001, thus reducing the overall interest burden on
the company. RPL had a low interest burden (in comparison to other similar projects)
primarily due to its policy of issuing convertible securities. These securities were
hybrid debt instruments offered at a low interest rate that provided the investor the
option of converting them into equity shares after a specified period of time.
THE STOCK MARKET PERSPECTIVE
According to stock market analysts, the share price of a company usually provided a
true reflection of the company’s present and expected financial performance. The
stock price usually reflected various risks associated with the company, which could
be broadly categorized as systematic and unsystematic risks (Refer Exhibit IV).
An analysis of the stock price performance of MRPL and RPL would help investors analyze the quantum of returns offered to them and identify the extent of risks associated with these companies over a specified period of time. The quarterly share prices of MRPL and RPL between 1996 and 2002 are provided in Table III to help measure the risks and returns of these two companies.
7 Expenditure includes cost of raw material, staff costs and other miscellaneous expenditures.

338
Financial Management
Table III
Quarterly Closing Prices (04/30/1996 to 09/30/2002)
Date BSE-308 RPL MRPL
04/30/96 3376.64 14.75 32.50
06/28/96 3731.96 12.90 28.25
09/30/96 3519.42 10.25 19.35
12/24/96 2883.88 10.40 20.60
03/31/97 3360.89 12.70 17.65
06/30/97 4256.09 17.40 18.10
09/30/97 3902.03 19.00 21.60
12/31/97 3658.98 23.55 19.85
03/31/98 3892.75 20.50 19.25
06/30/98 3250.69 20.00 16.15
09/30/98 2812.49 17.60 13.90
12/31/98 3055.41 18.80 12.90
03/31/99 3739.96 18.70 10.30
06/30/99 4140.73 27.05 19.00
09/30/99 4764.92 46.90 21.00
12/30/99 5005.82 65.70 16.70
03/31/00 5001.28 60.04 12.35
06/30/00 4748.77 53.95 9.90
09/29/00 4090.38 56.75 8.80
12/29/00 3972.12 56.60 8.80
03/30/01 3604.39 48.55 7.70
06/29/01 3456.78 47.00 6.85
09/28/01 2811.66 29.75 6.30
12/31/01 3263.33 29.30 6.80
03/28/02 3469.35 25.85 6.80
06/28/02 3244.70 24.05 10.00
09/30/02 2930.51 23.10 7.65
Source: www.bseindia.com
THE FUTURE PROSPECTS
In August 2002, the ABG group announced that it would exit MRPL by selling its
entire stake to the Oil and Natural Gas Corporation (ONGC) at a price of Rs. 2 per
share. According to Kumara Mangalam Birla, the chairman of the ABG group, one of
8 BSE 30 is the Bombay Stock Exchange Index consisting of 30 prominent stocks representing various sectors.

339
MRPL and RPL – Analyzing Risk and Returns
the main reasons for exiting the joint venture was the poor financial performance of
MRPL.
According to analysts, purchasing an equity stake in MRPL would be a forward
integration move for ONGC, which had been in the business of oil exploration and
production. They also felt that by investing in the lucrative oil refining and marketing
sector, ONGC would diversify risks in the oil exploration sector. Moreover, by
investing Rs. 6 bn as equity as part of the financial restructuring of MRPL, ONGC
reduced its tax liability.
In early 2002, RPL announced plans to merge with Reliance group’s flagship
company Reliance Industries Limited (RIL). In April 2002, both RPL and RIL
shareholders approved the merger. The RPL-RIL merger was announced at a swap
ratio of 1: 11, i.e., an RPL shareholder would receive one share of RIL for every
eleven shares of RPL. After the merger, the joint entity (RIL) was ranked 425th in
Fortune’s Global 500 list of the world’s largest corporations. According to analysts,
the dismantling of the administered pricing mechanism as well as the freedom to
market petroleum products (which was earlier restricted to state run oil companies)
would provide the merged company to further increase its profits. The new regulation
also allowed private petroleum companies to sell highly profitable transport fluids,
such as petrol and diesel, directly to consumers. Analysts felt that due to RIL’s low
cost of production and plans to market petroleum products, the company had a bright
future ahead.
Questions for Discussion:
1. Compare the MRPL and RPL refinery projects. What, according to you, are the reasons for the differing financial performance of both these refineries? Using the information given in Exhibit III draw a comparison between these two refineries and their public sector counterparts.
2. Explain the term Beta ( ) of a stock. Calculate the historical ( ) of both MRPL
and RPL for the period 1996-2002. Use the value of ( ) calculated above to determine the required rate of return on each of the stocks for a period of one year if the risk premium9 is 11.17% and the risk free rate is 7.5%. How confident can an investor be of this return? (Note: Use the CAPM equation to calculate the required returns).
3. Calculate the average return and risk on shares of RPL and MRPL during the period 1996-2002. Divide the total risk on each of the stocks between systematic and unsystematic components. Calculate each of the components as a percentage of the total risk.
4. Calculate the risk as well as the expected return for a portfolio created by investing in RPL and MRPL in the following proportions:
% Investment in RPL % Investment in MRPL 100 0
90 10
80 20
70 30
60 40
9 The risk premium refers to the excess return earned by the market portfolio over the risk free return.

340
Financial Management
50 50
40 60
30 70
20 80
10 90
0 100
Plot the frontier joining all possible portfolio combinations using the weights specified above. Identify the minimum variance portfolio. Explain why the expected risk of the portfolio is not a weighted average of the individual risk (standard deviations) of each of the stocks. (Note: The individual risk for each stock is equal to the standard deviation, and the returns are equal to the expected returns calculated in Question 1. The correlation between the stocks can be determined by calculating the historical correlation between the returns on each of the shares).
© ICFAI Center for Management Research. All rights reserved.

341
MRPL and RPL – Analyzing Risk and Returns
Exhibit I
Refineries in India
Name of the Company Location of the Refinery
Capacity (MMTPA)
Guwahati 1.00
Barauni 4.20
Koyali 12.50
Haldia 3.75
Mathura 7.50
Digboi 0.07
Indian Oil Corporation Ltd. (IOC)
Panipat 6.00
Mumbai 5.50 Hindustan Petroleum Corporation Ltd. (HPCL) Visakhapatnam 4.50
Bharat Petroleum Corporation Ltd. (BPCL) Mumbai 6.90
Madras Refineries Ltd. (MRL) Chennai 6.50
Cochin Refineries Ltd. (CRL) Cochin 7.50
Bongaigaon Refinery and Petrochemicals Ltd. (BRPL)
Bongaigaon 2.35
Crude Distillation Unit of MRL Narimanam 0.50
Numaligarh Refineries Ltd. (NRL) Numaligarh 3.00
Mangalore Refinery and Petrochemicals Ltd. (MRPL)
Mangalore 9.69
Reliance Petroleum Ltd. (RPL) Jamnagar 27.00
Total 108.46
Source: www.petrochemnext.com
Exhibit II
Details of The RPL TOCD Issue (September 1993)
The TOCD issue was made attractive to investors by spreading the payment of the sum of Rs.60 for the issue over a period of three years.
RPL’s TOCD Issue Payment Schedule
Payment Schedule Amount
Zero Date (taken as issue opening date) Rs. 20
After 18 Months * Rs. 10
After 30 Months * Rs. 15
After 36 Months * Rs. 15
Source: Capital Market, September 26th, 1993.
* To be reckoned from zero date
The holders of the TOCD would not be paid any interest for the first five years of the issue, but were provided with three options.

342
Financial Management
RPL’S TOCD Options
Option 1 Option 2 Option 3
Retain the non-convertible portion of Rs.40 per debenture and get it redeemed in the 6th, 7th and 8th years.
Sell the warrants in the market.
Surrender the non-convertible portion of Rs.40 per debenture with the warrants to the company between the 47th and 49th
month from the zero date.
Exercise the warrants between the 47th and 49th
month from the zero date by making a payment of Rs.40 for 2 equity shares and retain the non-convertible portion of Rs.40 which will be redeemed in the 6th, 7th
and 8th years.
InflowA total of Rs. 80 from redemption at the end of the 8th year. The redemption payment would be as follows – Rs 20 in the 6th
year, Rs 30 in the 7th year and Rs 30 in the 8th year and
Proceeds from the sale of warrants at market price.
InflowObtain 2 equity shares at Rs.20 each without any payment.
Inflow2 equity shares for Rs.20 each
A total of Rs.80 from redemption at the end of the 8th year. The redemption payment would be as follows- Rs.20 in the 6th
year, Rs.30 in the 7th year and Rs. 30 in the 8th year.
Source: RPL’s Public Advertisement, Capital Market, September 26, 1993.
Exhibit III
Performance of Players in the Petroleum Sector in India
The annual demand for petroleum products in India was expected to reach 145 mn tonnes by the end of the financial year 2006-2007. To meet the increased demand for petroleum products it required investments exceeding $50 bn during the period 2003 to 2010 in the field of exploration, drilling and refining activities. The financial performance of the major refineries in India could be assessed through key indicators such as their operating income, revenues, operating margins, earning per share (EPS), price earning ratio (P/E) of stocks and cash flow per share (CF/S).
Financial Performance: FY 2001-2002
(in Rs. mn)
Parameter HPCL BPCL RPL MRPL CPCL
Revenues 404861.46 377352.38 331170 53714.40 60608.88
Operating Income 405642.14 378826.20 334720 54154.30 60674.29
Operating Profit 18503.59 20827.16 35290 2923.68 2696.38
PAT 7879.75 8498.30 16740 (4924.79) 637.12
Operating Margin (%) 4.56 5.51 10.65 5.44 4.44
Net Profit Margin (%) 1.94 2.24 5.00 (9.09) 1.05
EPS 23.22 28.33 - (6.20) 4.23
P/E 12.51 11.61 - Negative 7.68
CF/S 42.73 47.66 - (4.84) 11.27

343
MRPL and RPL – Analyzing Risk and Returns
Financial Performance: FY 2000-2001 (in Rs. mn)
Parameter HPCL BPCL RPL MRPL CPCL Revenues 432023.86 425900.49 309630 28891.50 69710.60
Operating Income 434539.88 428227.82 311830 29415.70 69778.93
Operating Profit 19267.60 19398.84 32740 1418.71 3418.40
PAT 10880.08 8326.63 14640 (1850.54) 1224.31
Operating Margin (%) 4.43 4.55 10.57 4.91 4.89
Net Profit Margin (%) 2.50 1.94 4.69 (6.40) 1.75
EPS 32.06 27.76 3.08 (2.33) 8.21
P/E 5.01 7.39 15.76 Negative 3.65
CF/S 44.8 49.28 4.47 (0.15) 15.29
Financial Performance: FY 1999-2000 (in Rs. mn)
Parameter HPCL BPCL MRPL CPCL Revenues 303084.82 314768.74 30212.04 53872.73
Operating Income 303546.74 315915.48 30913.41 53959.50
Operating Profit 16498.17 17362.19 1078.54 3301.99
PAT 10574.11 7016.31 (2996.84) 1426.29
Operating Margin (%) 5.44 5.51 3.57 6.11
Net Profit Margin (%) 3.48 2.22 (9.69) 2.65
EPS 31.16 46.78 (3.77) 9.69
P/E 4.23 2.81 Negative 3.61
CF/S 44.80 87.88 (1.94) 15.20
Source: www.bseindia.com
Exhibit IV Calculating the Systematic Risk (Beta) of a Security
RISK
The risk of a security refers to the extent of uncertainty in getting returns from that security. Risk can be classified as firm specific or unsystematic risk and systematic or market risk. Unsystematic risk refers to the extent of variability in returns of a security on account of firm specific factors. The two principal sources of unsystematic risk are business risk and financial risk. Business risk refers to changes in the operational environment of the firm, whereas financial risk is usually associated with the debt-equity ratio or the capital structure of the firm. This type of risk is specific only to a particular security and can be minimized by investing in a large portfolio of securities.
Systematic risk is also known as non-diversifiable risk. There are three categories of systematic risk: market risk, interest rate risk, and purchasing power risk. Market risk refers to the variability of returns due to fluctuations in the securities market. Interest rate risk refers to the variability in a security’s return resulting from changes in the level of interest rates. Other factors remaining the same, security prices move inversely to interest rates. For example, if the Reserve Bank of India were to increase the bank rate,10 funds would become more expensive, leading to a fall in stock prices. Purchasing power risk, also referred to as inflation risk, involves an increase in the price of goods and services, which may cause inflation. Rising prices would reduce the purchasing power of an investor, thereby having an adverse affect on stock prices.
10 The rate at which RBI lend funds to national banks.

344
Financial Management
The modern portfolio theory defines the systematic risk of a security as its vulnerability to market conditions. The vulnerability can be measured by the sensitivity of the return of a security vis-a-vis the returns of a market index (for
example BSE 30 index). This is denoted by the Greek letter beta ( ). Hence, the beta
( ) of the stock measures the sensitivity of returns of a security to market returns. For
example, if the beta ( ) of a stock is equal to 1, it implies that when market returns (i.e., returns from the BSE index) increase/decrease by 10%, the security returns also increase or decrease by the same percentage during that period. The higher the risk of
a security, the greater the value of ( ).
Estimating Beta ( )The beta of a stock refers to the dependence of one variable (security returns) on another (market returns). This dependence can be estimated statistically through a simple linear regression. A simple linear regression takes the form of an equation of a straight line.
Y = a + bX +c........
Where,
Y (the dependent variable) refers to the security’s returns
X (the independent variable) refers to the market returns and
B (co-efficient of X) refers to Beta ( )
Accordingly, can be estimated from the following regression specification
ri = + rm + e..........
Where
ri is the dependent variable which refers to the security returns
rm is the independent variable which refers to the market returns and
e is the error term
Steps in carrying out a regression to determine Beta ( )1. Collect the market index prices, i.e., closing market index prices for a period of 5
years or longer. The periodicity (p) of the index prices can be daily, monthly or weekly. Collect the security prices for the same period on a daily, weekly or monthly basis. (Note: The periodicity i.e. daily, weekly or monthly should be the same for the security prices as well as the market prices).
2. Calculate the periodic return for the above sets of data.
3. The market return refers to the x-axis or independent variable and the security returns refer to the y-axis or dependent variable.
4. Run a regression on the above data to obtain the following output.
Constant
Standard Error of the y estimate
R squared
Number of observations
Degrees of freedom
X – Co-efficient – ( )
Standard error of co-efficient 5. The beta of a security can also be calculated by determining the covariance
between the security returns and the market returns
= Covariance(ri, rm)/ 2m
Where:
ri = Returns on the security
rm = Returns on the market index 2m = Variance in market returns

345
MRPL and RPL – Analyzing Risk and Returns
Additional Readings and References:
1. Nair Suma, Profit Spills, indiainfoline.com, August 4, 2000.
2. Reliance Petroleum: Challenging the Limits, Indiabulls Research, March 22, 2001.
3. Srinivasan Raghuvir, RPL-RIL Merger: Excellent Synergies and Smart Timing,Business Line Internet Edition, March 2, 2002.
4. Inamdar Parul, Deliverance of the First Private Sector Fortune Global 500 Indian Company – RIL, indiainfoline.com, March 4, 2002.
5. ENS Economic Bureau, Reliance Ind. – RPL Mega Merger Cleared The Indian Express, March 4, 2002.
6. Harolikar Amar A, Salafis Refai, The RPL-RIL Merger: the Millennium Merger,indeconomist.com, March 15, 2002.
7. Panchal Salil, What is APM dismantling all about? rediff.com, April 6, 2002.
8. Srinivasan Raghuvir, What MRPL Means to ONGC, Business Line August 4, 2002.
9. HPCL Plans to Retain Stake in Pie, Business Standard, August 30, 2002.
10. UTI Petrofund, moneycontrol.com, September 25, 2002.
11. Refineries in India, Petrochemnext.com
12. Security Analysis and Portfolio Management, Fisher and Jordan.
13. www.myiris.com
14. www.bseindia.com
15. www.ril.com
16. www.mrpl.co.in
17. www.moneycontrol.com
18. www.domain-b.com

Valuing Sify’s Acquisition of India World“This is the first time an Indian company has paid for a strategic value of this size to demonstrate leadership. People will realize this is necessary eventually.”
- Rajeev Memani, partner at Ernst & Young.
“Valuing these high-growth, high-loss firms has been a challenge, to say the least; some practitioners have even described it as a hopeless one.”
- Mckinsey and Company1.
A LANDMARK ACQUISITION
Established in December 1998 in Secunderabad (Andhra Pradesh, India), Satyam
Infoway Limited (Sify) was one of the first private Internet service providers2 (ISP) in
India. On November 29, 1999, the company announced that it would acquire the
entire equity stake of IndiaWorld Communications Private Limited at a huge amount
of Rs. 4.99 billion. This was one of the first and the largest dotcom acquisition3 in
terms of deal amount in India.
The unique feature of the acquisition was an all cash deal4, which had to be executed
in two phases. In the first phase, Sify had to acquire a 24.5% stake (49000 shares) in
IndiaWorld for Rs 1.22 billion during the time of announcement of the deal in
November 1999. The second phase of the deal gave Sify an option of purchasing the
remaining 75.5% stake (151000 shares) at Rs. 3.25 billion in cash before September
30, 2000. Sify had to also pay a non-refundable deposit of Rs 513 million, which
would be forfeited, in case Sify does not exercise the option.
The deal surprised stock market analysts and merger and acquisition gurus both in
India and abroad. According to an employee at Rediff.com5, “People didn’t believe
that the value of the deal could be Rs 4.99 billion. Some of us felt it was a wire
agency mistake.” Financial analysts too were taken aback. The question on
everybody’s mind – Whether Sify took a right decision to invest Rs. 4.99 billion in
IndiaWorld which had reported a paltry net profit of Rs. 2.7 million on revenues of
Rs. 13 million in the financial year 1998-1999. How had Sify arrived at that Rs. 4.99
billion figure while valuing the acquisition deal? What were the strategic and financial
benefits to Sify from this acquisition? Does it really make sense for Sify to invest Rs.
4.99 billion for IndiaWorld’s 0.2 million shares which effectively worked out to
paying of a whooping amount of Rs. 24,950 for each share of IndiaWorld with a face
value of Rs. 10?
1 Comment in Frontline magazine, June 23, 2000, on valuation of dotcoms. 2 A company whose network is linked to the Internet through a dedicated communication line.
It offers other companies with dedicated communication lines to the Internet. It also allows individual users to dial up and access the Internet through its computers for a specific fee.
3 After the Sify-IndiaWorld deal, BFL Software Limited (BFL) acquired Mphasis Corporation (Mphasis) of the US in an all-stock deal worth Rs. 8.76 billion in February 2000.
4 The deal was structured by DSP Merrill Lynch who were the advisors for IndiaWorld during the sale of the portal.
5 Rediff was established in 1996 by Ajit Balakrishnan as a portal focusing on resident and non-resident Indians. It was listed on NASDAQ in June 2000. Rediff also offers a version of its site Rediff US targeting Indians living in the US.

347
Valuing Sify’s Acquisition of India World
Some analysts voiced their concerns about the deal being grossly overvalued. Expressing his concerns, Manish Gunwani, a financial analyst at SSKI6 said, “There aren’t too many popular Indian portals and IndiaWorld had a high profile. Even then, the valuation seems very stretched. It’s based on what may happen, not on current realities.” Analysts also drew comparisons with the leading software company Infosys whose Rs. 10 paid up shares quoted at Rs. 9, 250 on November 30, 1999.
Amidst all these concerns, Sify’s CEO and managing director R Ramaraj (Ramaraj) was confident about the deal. He said, “The acquisition would be a good strategic fit to Satyam Info way’s portal business adding a large overseas Indian audience to the large India based audience that www.satyamonline.com currently enjoys. The combined portal network is expected to be a mega portal for India interest audience in India and elsewhere.”
VALUING DOTCOMS
The objective of valuing any company is to determine a fair price, which an investor should pay to buy an equity stake in the company. The traditional methods for valuing firms were developed keeping in mind the companies in the brick and mortar sector. These companies had tangible physical assets as well as clearly defined sources of revenues. The traditional methods for valuing firms included the Discounted Cash Flow Method (DCF), the Economic Value Added (EVA) method, the pure play or comparable company approach and the multiplier method (Refer Exhibit I).
Most of the traditional models for valuing a brick and mortar firm were based on publicly available financial figures. The valuation of traditional firms based on published information gave traditional valuation models greater validity. These models utilized both the current as well as historical earnings to determine the future earnings of the firm. These earnings were projected over a specified period of time and were discounted back at a specific discount rate to arrive at the value of the company.
The use of traditional models to value dotcoms had several anomalies. The traditional
models valued the companies based on their tangible physical assets such as
buildings, machinery etc. This represented the investment made in the firm. The return
on the investment and the rate of reinvestment were required to determine the future
growth rate of the firm. However, for a dotcom company, tangible assets were only a
few web servers, some equipment and office space, which was not a substantial
investment. Moreover, there was a lack of sufficient historical data to make a
projection of future cash flows. In the absence of historical information, the drastic
growth in earnings predicted for dotcom companies could not be validated.
In the absence of historical data, the dotcom could have been valued by using the
comparable company or pure play model which involved comparison with another
firm engaged in a similar business with approximately the same size. However, to
value dotcoms it was difficult to find such strictly comparable firm with all the
required information necessary for valuation.
Another problem faced for valuing dotcom companies was that they did not have
well-defined profitable revenue models. Most of the dotcom companies including the
large ones such as Yahoo!, Amazon etc. had not recorded positive earnings in 1999.
The negative earnings did not allow valuers to measure the expected growth rate,
which further complicated the valuation of dotcoms. The above anomalies led to the
need for a different model, which could fairly value the profit potential of dotcoms.
6 SS Kantilal Ishwarlal (SSKI) Securities Private Limited is a registered stockbroker in the Mumbai and National Stock Exchange.
348
Financial Management
Some analysts felt that dotcom valuation must be based on the Internet metrics and their conversion into potential revenues. Though for dotcoms the initial cash burn rate7 was higher they were also expected to generate profits at a much higher growth rate compared to traditional firms. Some of them felt that the most important asset for any dotcom company was its customer base. Hence, the valuation should be based on the company’s ability to increase its customer base and ensure that it generated sustained revenues. Other key factors that influenced the valuation of dotcoms were Internet traffic, market size, features of the website, competition, replicability etc. A modified valuation model was required which should would the above parameters to value dotcoms (Refer Exhibit VII).
SIFY’S ACQUISITION OF INDIAWORLD
The first phase of IndiaWorld’s acquisition was financed by Sify through the funds raised from its initial public offering (IPO) of American Depository Shares (ADS)8 on NASDAQ9 which raised $75 million in October 1999. Sify completed the second phase of the acquisition of IndiaWorld on June 30, 2000, by modifying the option agreement entered in November 1999. The revised agreement changed the acquisition from an all cash transaction to a cash plus stock deal. Sify settled the final payment of Rs. 3.25 billion by making a payment of Rs. 2.15 billion in cash and issuing 2,68,500 fresh equity shares of Sify worth Rs. 1.10 billion. Hence, in the deal each equity share of Sify was valued at Rs. 4097. The equity shares issued under the deal were neither listed in India nor could be converted into ADSs according to the law during that time.
The restructuring of the deal was done with the mutual consent of both Sify and IndiaWorld. The deal was accounted for as a two-step acquisition under the purchase method of accounting. Rajesh Jain (Rajesh), managing director of IndiaWorld said, “The acceptance of shares in Sify instead of cash for part of the deal reflected the confidence in and commitment for Sify’s business and future.” In November 1999, Rajesh also became a member of Sify’s advisory board, which was responsible for deciding Sify’s future course of business.
IndiaWorld was established by Rajesh and had been in operation since 1994. Mumbai based IndiaWorld was engaged in the business of providing web-based solutions and India-based content to overseas Indian audience. The company operated popular portals such as samachar.com, khel.com, dhan.com, bawarchi.com, khoj.com etc. These portals recorded a total of 13 million page views during October 1999 (Refer Exhibit II). IndiaWorld was the only dotcom in India that had been earning profits consistently for three years prior to the acquisition. Though the profit was meager but very few companies had profitable operations in the global dotcom industry during that time.
Sify planned to integrate various IndiaWorld websites into its own portal www.satyamonline.com. In 1999, Sify was one the largest ISPs with a subscriber base in excess of 100,000 in over 30 cities. Sify also had popular websites walletwatch.com, carnaticmusic.com, carstreet.com etc. (Refer Exhibit III) which focused on providing content and e-commerce solutions to resident Indians.
7 The rate at which a company uses up its cash funds for financing its operations before generating positive cash flows is called the cash burn rate.
8 American Depository Shares refers to the shares of a non-US based company issued in the US and traded on the US stock exchange. On January 5, 2000, the holders of Sify’s ADSs were allotted an extra three ADS. Each ADS represents one-fourth share. i.e. one Sify equity share is equal to four ADSs.
9 National Association of Security Dealers Automated Quotation was established in 1971 and was the world’s first electronic stock market. It is a computerized system that provides price quotations and allows the trading of several stocks both listed as well as over the counter. It has traditionally listed and traded several hi tech stocks.

349
Valuing Sify’s Acquisition of India World
IndiaWorld with its large overseas audience provided Satyam an ideal opportunity to extend its services to the NRI segment. The merger also provided Sify with additional 13 million page views per month of IndiaWorld in addition to its own 13 million page views.
This acquisition was one of the largest in the global Internet industry during that time. Though the huge amount paid by Sify to acquire IndiaWorld had left valuation experts guessing, Sify was confident about the benefits. Ramaraj said that though Sify could have invested the funds raised through the ADS issue to set up its own website but it would have taken a far longer time for these newly established websites to record the page views that IndiaWorld attracted. Moreover, the websites of IndiaWorld had greater brand equity and already enjoyed a high level of popularity among overseas Indians. He felt that the acquisition was also in line with Sify’s overall objective of providing total Internet solutions to customers.
THE VALUATION DEBATE
Though the analysts and valuation experts were convinced about the benefits to Sify from IndiaWorld’s acquisition they were divided on the valuation of the deal. Some of the experts felt that the value of a company varied depending on the buyer. For example, a strategic buyer10 could be willing to pay a higher price for a company compared to a financial buyer11.
Analysts argued that the acquisition of IndiaWorld by Sify was made with a strategic objective. They said that IndiaWorld would be a perfect complement to Sify’s website. The deal would allow Sify to exploit cross-selling opportunities within its own portal and ISP service and ready access to the existing customer base and content of IndiaWorld’s portal. Moreover, IndiaWorld was the second largest portal in India in 1999 and enjoyed good brand equity. They felt that Sify was following a similar strategy used by America Online (AOL) in the US. AOL had consistently acquired leading content and service providers to retain its customers.
However, traditional stock analysts felt that the valuation of IndiaWorld was purely based on Internet metrics such as page views, eyeballs or hits that IndiaWorld might attract and not on the potential earnings that the company might generate. They felt that this was a speculative approach that did not reflect the true fundamentals of the company. Rashesh Shah an investment banker with Edelweiss Capital12 felt that most of the Indian dotcom ventures were in the early life cycle stage of attracting greater page views and hits to their site and sustained revenues and profitability would take a much longer time.
In addition to the criticisms against the valuation, financial analysts also felt that Sify’s decision to pay a substantial amount of the deal in cash to fund the acquisition was not the right decision. The cash could have been utilized for other important projects of Sify. They felt that Sify must have opted for an all-stock transaction to fund the acquisition.
In spite of the apprehensions about the acquisition, the stock market welcomed Sify’s move. The ADSs listed on NASDAQ rose by $32 to $140 on the day when the announcement was made. This increased Sify’s market capitalization on NASDAQ by $680 million to $2.9 billion.
10 A strategic buyer refers to an acquirer who buys a company to complement its strategic objectives.
11 A financial buyer refers to a venture capitalist who generally invests in a dotcom venture at its early stage and is willing to pay a lower price because of the greater risk involved.
12 Edelweiss Capital Limited was established in 1996. The company offers investment banking services and venture capital syndication and co-ordination for small start-ups.

350
Financial Management
Though initially the stock markets had greeted the acquisition well, the performance of both Sify and IndiaWorld over the past two financial years after the acquisition was not impressive. The earnings for both companies were negative despite the growth in page views (Refer Exhibit IV and V for Financial Results).
Questions for Discussion:
1. The acquisition of IndiaWorld by Sify provides financial analysts an ideal opportunity to understand the objective and mechanism behind valuating dotcoms. What is the primary objective of valuing a company? What are the problems involved in valuing companies in the Internet industry using traditional models of valuation.
2. IndiaWorld was acquired for Rs 4.99 billion by Sify in November 1999. Using page views multiplier model to value dotcoms calculate the fair market value of IndiaWorld in October 1999. Determine the Price/Revenue multiple in terms of page views for Rediff.com as in October 1999. The market value of Sify on NASDAQ in October 1999 can be used as a proxy for the market capitalization of Rediff.com. The page views of Rediff.com for the second quarter of 1999-2000 was 70 million and the portal advertising revenues for the quarter was $0.28 million.
3. Study the performance of Sify and IndiaWorld over the last two financial years. Discuss whether the price paid for the acquisition was justified by comparing the perceived synergies to the actual performance of Sify and IndiaWorld. What are the future prospects of Sify after the acquisition of IndiaWorld?
4. There are several valuation methods developed with varying degrees of applicability and suitability. Which is the most suitable and appropriate method of valuation for dotcom companies like IndiaWorld? Justify your stand.
© ICFAI Center for Management Research. All rights reserved.

351
Valuing Sify’s Acquisition of India World
Exhibit I Traditional Models for Valuing Companies
Discounted Cash Flow Approach The DCF approach popularized by McKinsey is based on the fundamental principle that the value of a company at any point is the present value of the future cash flows that a company can generate.
Value = CF1/(1+r)+ CF2/(1+r)2…..
Where CF represents the free cash flows computed for the future based on the historical data as well as assumptions made about the future performance. The free cash flow is arrived at after deducting the investment that is required to generate the needed cash flows. The free cash flow is discounted using a discount rate, which is usually the weighted average cost of capital of the company (WACC).
Cost Method
This is considered as an unscientific method of valuing companies. The method does not value companies on the growth options available but values the companies on the basis of existing assets. There are variants to this method of valuing companies.
1. Book Value Method – The value of the company according to this method is the accounting value of the company. The company is valued as the sum of its book assets and the equity is equal to the net worth of the company.
2. Net Assets Value Method – This method values companies as the market value of all the assets including intangibles if they were to be liquidated.
The drawback of these methods are that they assume that the companies to be valued are not going concerns and are going to be liquidated.
Multiplier Method The multiplier approach is not as complete as the DCF methodology but is very popular on account of its simplicity. This method uses an accounting indicator such as sales, earnings, book value etc and compares it with the market value. E.g.- Price/Earning ratio. This multiple is used to determine the future value of the company once the earnings are determined. The simplicity of this method is due to the fact that the valuer does not have to determine cash flows at every stage.
Pure Play or Comparable Company MethodThis method is used to value private unlisted companies. A public company which is similar to the private company in terms of size and operations is valued using the other traditional methods of valuation. This value is then used as a proxy to determine the value of the private company by making some adjustments. The difficulty with this method does not lie in finding a company engaged in a similar business but finding one that is of approximately the same size. In such a situation, a performance measure such as sales, earnings, cash flows etc of the public company could be used as a multiple. This multiple is then applied to the same performance measure of the private company to value it.
Economic Value Added (EVA) The EVA method combines the DCF approach with the returns earned by the organization i.e. the net operating profit after tax to determine the value added by the investment made. EVA in simple terms measures the excess returns generated by the company over and above the cost of capital. This is multiplied with the capital invested to determine the economic profit that the company has earned. The value of the company is the sum of the capital invested and the present value of the economic profits earned. The present value of the economic profits is determined by discounting the EVA projected for a specified period at the cost of capital.
EVA = Operating Invested Capital (Return on invested capital – Weighted Average Cost of Capital)
Source: ICMR

352
Financial Management
Exhibit II
Indiaworld’s Websites
Samachar.com: Samachar.com is a comprehensive news website providing
information on the happenings within India to an overseas Indian audience. The
feature of the website is that it provides access to the headlines from various
newspapers at one location. This saves time for individual browsers as they don’t
need to access individual websites such as economictimes.com, timesofindia.com
etc. The website is designed to allow easy access to different sections and saves the
browser from loading different pages. The website also provides links to several
other Indian websites such as magazines, government sites, entertainment sites etc.
The advertisements on the site also provide useful information such as sites through
which money can be sent to India, phone card sites etc that are of great help for
overseas Indians.
Khoj.com: Khoj.com is an effective India based search engine. It provides visitors
with the option of searching for information in other group websites such as
Samachar, Khel, Bawarchi etc. The site also provides links to various popular
websites that provide information ranging from general affairs, business, sports,
travel etc about India. The website also provides users the option of adding their
personal URL to a particular category. It is described as “The Great Indian Search
Engine” by Satyam Infoway.
Khel.com: Khel.com is a popular Indian sports site. It provides the latest news on
different sports not only featuring India but also from other parts of the world. It
features a number of articles on a variety of sports and presents interviews with
different sports personalities. The site also provides visitors with the opportunity of
opening e-mail accounts and carrying on online chats. The site also hosts a live
scoreboard that provides continuous updated scores during a cricket match. The
website also allows users to shop for books and other sporting goods. This is
generally considered as a comprehensive website for Indian sports enthusiasts.
Bawarchi.com: The website as the name suggests is an online cookbook for Indian
food catering to an overseas audience. The site provides a collection of recipes that
are arranged both alphabetically as well as category wise. There are columns that
cater to food from different regions. The website also has a section that handles
queries from visitors on health and nutrition. The site also focuses on providing
special recipes for different festivals. The site also has a section where recipes are
provided by various producers of milk products and cooking oil companies. The site
also has an interesting glossary that provides a list of English and Indian food terms
to remove any confusion that visitors might have regarding different culinary terms.
Itihaas.com: This is a website providing information on Indian history. The site has
articles and features on different stages of Indian history. The site is divided into
four sections that cover different periods in Indian history. The first section begins
with the Harappan civilization and ends at around 1000 A.D. The second section
covers Medieval India. The third section covers Modern India from 1757 A.D. to the
independence of the country in 1947. The final section provides information on the
post independence era. The site cannot be considered as a comprehensive website on
Indian history but provides some amount of useful information quickly for
interested Internet browsers.
Source: Adapted from BestIndianSites.com

353
Valuing Sify’s Acquisition of India World
Exhibit III
Sify’s Websites
Walletwatch.com: Walletwatch.com is a finance website that provides users with
the facility of online portfolio management. It allows users to manage their different
portfolios by providing them with updated stock prices and the percentage gains or
losses. Similar to other financial websites it also provides charts that allow investors
to track various stock prices inter-day, monthly, annually etc. The website is
designed in such a manner that it is divided into different sections such as equity,
fixed income, forex, mutual funds, bullion and insurance that allow the users to
make more focused searches.
Carnaticmusic.com: This is a website that caters to a niche segment of music
lovers. It provides comprehensive information on carnatic music to Indian carnatic
music lovers in different parts of the world. The website also allows visitors to
interact with each other as well as various famous musicians. It provides visitors with
an online audio and concert gallery that allows them to review various recordings.
The site attracts both the serious carnatic music enthusiast as well as those with a
passing interest in music.
Carstreet.com: The website provides visitors with information on the different cars
that are driven within India. The site is well designed with section covering New
Cars, Used Cars, Maintenance, Car Finance etc. The website also allows visitors to
post complaints and write their own columns. In addition to the above features the
site also has a photo gallery and provides news from the world of motor sport to the
Formula 1 and Rally enthusiasts.
Source: Adapted from BestIndianSites.com
Exhibit IV
Indiaworld’s Financial Statements
Profit and Loss Account (in Rs. million)
Particulars 1999-2000 2000-2001 2001-2002
Income
Service Income 32.86 60.07 48.27
Other Income 1.61 1.24 4.76
Total Income 34.47 61.31 53.04
Expenditure
Cost of Service 10.18 21.66 15.39
Operating and General Expenses 15.81 18.33 35.14
Finance Charges 0.30 0.37 -
Marketing and Promotion Expenses - 19.28 -
Employee Remuneration Benefits 2.55 3.71 2.28
Depreciation 0.97 1.13 0.69
Total Expenditure 29.81 64.48 53.50
Profit/Loss before Tax 4.66 (3.17) (0.46)
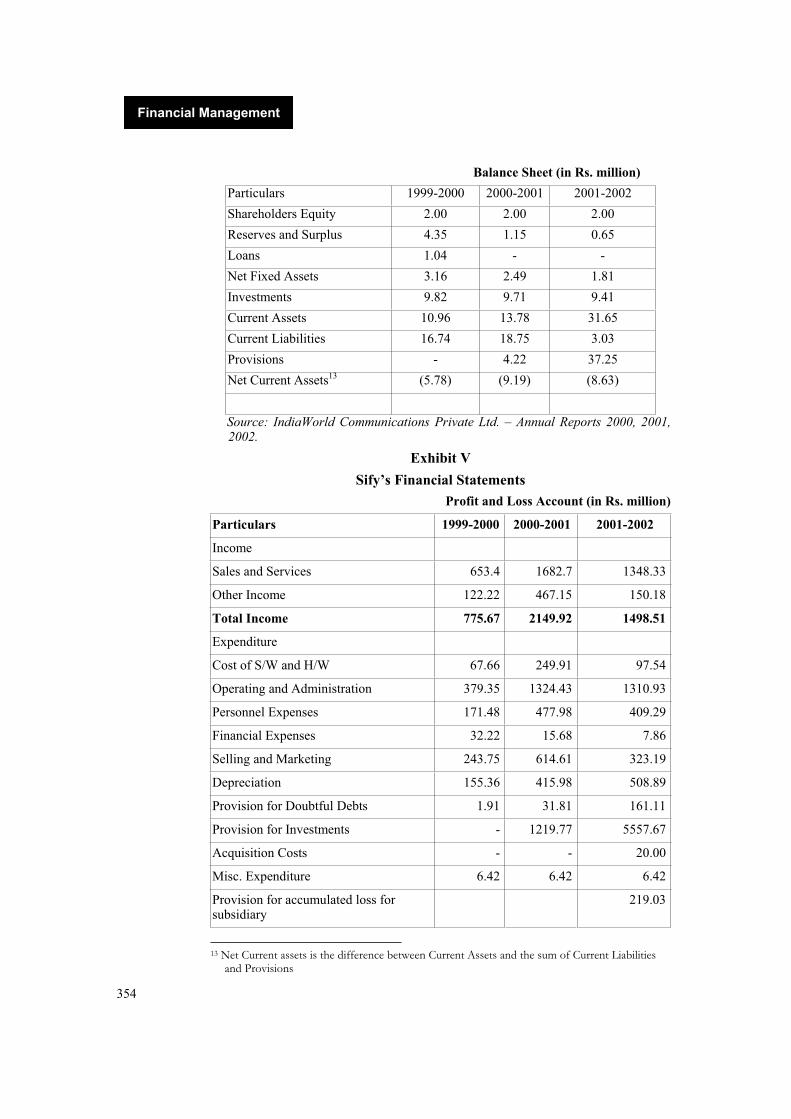
354
Financial Management
Balance Sheet (in Rs. million)
Particulars 1999-2000 2000-2001 2001-2002
Shareholders Equity 2.00 2.00 2.00
Reserves and Surplus 4.35 1.15 0.65
Loans 1.04 - -
Net Fixed Assets 3.16 2.49 1.81
Investments 9.82 9.71 9.41
Current Assets 10.96 13.78 31.65
Current Liabilities 16.74 18.75 3.03
Provisions - 4.22 37.25
Net Current Assets13 (5.78) (9.19) (8.63)
Source: IndiaWorld Communications Private Ltd. – Annual Reports 2000, 2001, 2002.
Exhibit V
Sify’s Financial Statements
Profit and Loss Account (in Rs. million)
Particulars 1999-2000 2000-2001 2001-2002
Income
Sales and Services 653.4 1682.7 1348.33
Other Income 122.22 467.15 150.18
Total Income 775.67 2149.92 1498.51
Expenditure
Cost of S/W and H/W 67.66 249.91 97.54
Operating and Administration 379.35 1324.43 1310.93
Personnel Expenses 171.48 477.98 409.29
Financial Expenses 32.22 15.68 7.86
Selling and Marketing 243.75 614.61 323.19
Depreciation 155.36 415.98 508.89
Provision for Doubtful Debts 1.91 31.81 161.11
Provision for Investments - 1219.77 5557.67
Acquisition Costs - - 20.00
Misc. Expenditure 6.42 6.42 6.42
Provision for accumulated loss for subsidiary
219.03
13 Net Current assets is the difference between Current Assets and the sum of Current Liabilities and Provisions

355
Valuing Sify’s Acquisition of India World
Total Expenditure 1058.15 4356.59 8621.93
Profit/Loss before Tax (282.48) (2206.70) (7123.42)
Balance Sheet (in Rs. million)
Particulars 1999-2000 2000-2001 2001-2002
Shareholders Equity 222.49 231.83 232.02
Reserves and Surplus 10380.03 13480.90 13490.95
Loans 214.59 12.83 5.90
Net Fixed Assets 804.46 1920.18 1620.57
Investments 1228.61 6276.63 857.51
Current Assets 8577.96 3706.76 1950.23
Current Liabilities 469.04 891.23 624.75
Net Current Assets 8107.96 2815.53 1325.48
Source: Sify Annual Reports, 2000, 2001 and 2002.
Exhibit VI
Sify Ads Price 2000-2002 (Quarterly Closing Prices)
Date Price (in $’s) Revenues in $mn Revenue/share Price/Revenue 03/2000 210.52 1.9 0.083 2536.38
06/2000 89.00 2.9 0.12 741.66
09/2000 54.24 4.2 0.18 301.33
12/2000 14.52 6.4 0.27 53.77
03/2001 12.12 7.2 0.31 39.09
06/2001 13.52 9.4 0.40 33.80
09/2001 4.2 10.1 0.43 9.76
12/2001 6.08 11.9 0.51 11.92
03/2002 25.16 9.6 0.41 61.36
06/2002 8.32 8.5 0.36 23.11
09/2002 4.28
Source: moneycentral.msn.com
Note: 4 ADSs are equal to one share. The number of shares issued was around 23 million. The price refers to the price of each share or 4 ADSs
Exhibit VII Valuation Models for Dotcoms
Several models were suggested to value dotcoms. Some of the models include:
VALUATION USING PAGE VIEWS AS A MULTIPLIER Since dotcoms were knowledge based companies with limited sales, negative earnings and no free cash flows, analysts had to resort to multiples such as price per click, price per subscriber, price per page views etc. to value a dotcom firm. The price per page view represents one of the multiples used initially to arrive at a relevant price multiple that could be used to value a dotcom. The price per page view could be compared with the P/E ratio used in the valuation of traditional old economy companies. The parameters needed to measure the price per page view of a dotcom were:

356
Financial Management
Market Capitalization/Value – A base market capitalization was needed to determine the price per page view. The base market value could be the market capitalization of the firm on the stock market. In case the firm was not listed, the market capitalization of a similar firm in the industry could be used to represent the market value.
Page Views – The number of times a page was accessed during a particular period.
Revenues Earned – The revenues for a dotcom would come from advertising, subscription fees, merchandising etc.
The price per page view was determined using the following steps:
Step 1 – Determine the market capitalization of the firm.
Step 2 – Determine the average daily page views for the particular dotcom.
Step 3 – Divide the market value of the equity with the average daily page views to arrive at the market value per daily page views.
Step 4 – Identify the total revenues earned for the year.
Step 5 – Divide the total revenues generated by the number of page views during the year to obtain the revenue per page view.
Step 6 – The price/revenues multiple in terms of page views can be obtained by dividing the market value per daily page view determined in Step 3 with the revenue per page view in Step 5.
This multiple could serve as a benchmark for future valuations. This method was considered viable since it did not take into consideration financial parameters such as cash flows or net earnings that were very low or negative for most dotcom firms.
Source: Harmons Internet Valuation Models
VALUATION BASED ON QUANTIFYING QUALITATIVE FACTORS
According to Gordon V Smith an expert on the valuation of intangibles like brands, patents and trademarks, there are three basic factors that must be considered for valuing a dotcom.
The management that is responsible for the functioning of the company.
The segment in which the dotcom operates. A dotcom that operates in a niche segment would be more likely to make money in the long run.
The manner in which a company invests the funds at its disposal. The most important assets for a dotcom are its customers and the investments must look towards building a larger customer base. An increase in the number of customers increases the revenues earned by a firm which in turn results in higher valuations. There have been firms that have made large investments in building their brand but have not been able to increase the number of customers.
The most difficult part of this method involved quantifying the qualitative aspects specified by Gordon V Smith. However, Anderson Consulting utilized a ‘Customer Index’ measure which was initially developed for the financial sector to determine the true economic value of customers by tracking revenues and costs on a per customer basis. This would help in determining the effect of future investments on the cost and revenues earned per customer. This measure would be appropriate for dotcoms such as Amazon.com whose key driver has always been the number of customers it attracts.
The decline of technology stocks and the dotcom companies during the financial year of 2000 brought to fore the exorbitant values attached to these companies.

357
Valuing Sify’s Acquisition of India World
These valuations were based on non-financial parameters such as page views, clicks, potential customers’ etc. Hence, modified versions of the traditional models were evolved to value Internet companies. These models were based on earnings growth and cash flow generating ability and had strong theoretical foundations.
MODIFIED DCF MODEL – MCKINSEY AND COMPANY
Mckinsey suggested a modified version of the discounted cash flow approach to value
a dotcom company. It was based on three subtle changes made to the traditional
model. The model was a scenario-based model with a probability attached to each
scenario. According to Mckinsey, the valuation of the company began by determining
the state of the industry and the company in the future when it had achieved a
sustainable and moderate growth rate instead of beginning by determining its current
level of performance. The valuer could then work backwards and extrapolate this
information to estimate the current performance. However, according to Mckinsey it
would take almost ten years for an Internet company to achieve a state of stable and
sustained growth. The difficulty in valuing high growth companies such as those in
the Internet industry was the uncertainty associated with them. The use of a
probability based scenario provided a method of valuing the company by taking into
consideration this uncertainty. Thus, the future financials of a company were predicted
for a range of scenarios that made the valuation more valid, than a valuation based on
a single forecast used for companies belonging to the old economy. The most difficult
aspect of valuation lay in linking the future scenarios to current performance. This had
to be based on strong fundamental analysis of both the firm as well as the industry.
The analysis helped in identifying key value drivers of a firm which were utilized to
determine the earnings that a firm might generate.
Source: Valuing dotcoms after a fall, McKinsey Quarterly, Q2 2001.

358
Financial Management
DAMODARAN'S MODELProf. Aswath Damodaran developed a model for the valuation of companies on the Internet based on the cash flows a firm generates. He used the example of Amazon.com to illustrate the model. The model splits the valuation period into two stages of growth , an initial period of high growth followed by a period of stable growth. According to this model, the firm grows at a higher rate during the first period and tapers off to reach a stable growth rate at the end of the first phase. The parameters required to value a company based on the model were:
The growth rate in the revenues
The length of the high growth period.
The capital requirements, depreciation and working capital needs during the high growth period.
The expected growth rate during the stable period.
The cost of capital of the firm, to discount the cash flows.
The steps involved in the valuation of the company were as follows:
The revenue growth for the firm was determined on the basis of the growth rate in revenues over previous financial year i.e. the growth rate over the previous 12 months provides a better reflection of the growth expected than revenue growth in periods prior to that, or industry growth rate. This growth rate was applied to the revenues earned over the previous 12 months to arrive at future revenues. Since revenues could never be negative, the problem of negative earnings affecting the valuation of dotcoms did not arise.
An operating margin was determined based on the current income statement of the firm as well as the performance of other firms in the industry. The operating margin was used to arrive at the earnings before interest and tax (EBIT).
The free cash flow was then estimated for the year by subtracting the net capital expenditure and net change in working capital from the net profit (EBIT(1-T)) and adding any non-cash expenditure back.
In case of a dotcom company where the earnings were negative, the reinvestment rate could be determined on the basis of current capital expenditure and changes in working capital or on the basis of the capital turnover ratio relating it to the changes in revenue of the firm.
Since a dotcom did not possess sufficient historical data to estimate Beta needed to calculate the discount rate, the Beta of comparable firms was used as a proxy.
The value of the company was obtained by discounting the free cash flows obtained in Step 3 with the discount rate obtained in Step 5.

359
Valuing Sify’s Acquisition of India World
Additional Readings and References:
1. Charles Assisi, Satyam picks up 24.5% stake in IndiaWorld for $28 million.
2. ENS Economic Bureau, Satyam to Acquire IndiaWorld for Rs. 499 crores, Indian Express November 29th 1999.
3. Sify takes IndiaWorld with revised settlement, Business Line July 4th 2000.
4. Charles Assisi and Madhu Suthanan, A matter of perspective, Financial Express, January 8th 2000.
5. Mukul Pandya, Portal Wars, LittleIndia.com October 16th 2002.
6. Brian Carvalho, the Big Deals, Businessworldindia.com 28th February 2000.
7. Maura Ginty, Satyam to buy IndiaWorld, internetnews.com November 29th 1999.
8. Shishir Prasad and M.Anand, Satyam’s prize bid, businessworldindia.com December 13th
1999
9. Atul Priyadarshi , Solving the tech riddle, Analyst July 2000
10. N Janardhan Rao, Virtual Adventures, Analyst March 2000.
11. Tracy Mayor, Value made visible, ciol.com May 1st 2000.
12. George Mathew and Dave Chatterjee, Satyam Deal - Investors skeptical about high acquisition cost, indianexpress.com, December 1st 1999.
13. Mohit Gupta, the Rs. 500 cr dotcom, iinvestor.com December 29th 1999.
14. Vidya Viswanathan, the Black Art of Dot.Com Valuation, Businessworld December 27th
1999.
15. www.vcline.com
16. www.Sifycorp.com
17. www.moneycentral.msn.com
18. www.nasdaq.com
© ICFAI Center for Management Research. All rights reserved.

Tata Tea’s Leveraged Buyout of Tetley “We were very clear that the burden on Tata tea should be such that the company would be able to absorb it. And it would not materially affect Tata Tea’s bottomline”
-N.A. Soonavala, Vice-Chairman, Tata Tea.
“It was important to make the right decision on the comprehensiveness of the transaction. The model has been driven by existing and future earnings potential of the Tetley group and the resultant post-acquisition cash flows to immediately justify the business and financial model”
-Rana Kapoor, MD, Rabo India Finance Ltd., Commenting on the deal.
INTRODUCTION
In the summer of 2000, the Indian corporate fraternity was witness to a pathbreaking achievement, never heard of or seen before in the history of corporate India. In a landmark deal, heralding a new chapter in Indian corporate history, Tata Tea acquired the UK heavyweight brand Tetley1 for £ 271 million.
This deal which was the largest cross-border acquisition by any Indian company, marked the culmination of Tata Tea’s strategy of aggressive growth and worldwide expansion. The acquisition of Tetley pitchforked Tata Tea into a position where it could rub shoulders with global behemoths like Unilever and Lawrie.
The acquisition of Tetley made Tata Tea the second biggest tea company in the world, the largest being Unilever, owner of Brooke Bond and Lipton. Moreover, the acquisition also enabled Tata Tea to metamorphose from a plantation company to an international consumer products company. Ratan Tata, Chairman, Tata group said, “It is a great signal for global industry by Indian Industry. It is a momentous occasion as an Indian company has been able to acquire a brand and an overseas company.”
Apart from the size of the deal, what made it particularly special was the fact that it was the first ever leveraged buyout (LBO)2 by an Indian company. This method of financing had never before been successfully attempted by any Indian company. Tetley’s price tag of £271 mn (US $450 mn) was more than four times the net worth of Tata Tea. The financing mechanism of the LBO made this unusual transaction possible. This mechanism allowed the acquirer (Tata Tea) to minimize its cash outlay in making the purchase.
THE TALE OF TATA TEA
Tata Tea was incorporated in 1962 as Tata Finlay Limited, and commenced business in 1963. The company, in collaboration with Tata Finlay & Company, Glasgow, UK, initially set up an instant tea factory at Munnar (Kerala) and a blending/packaging unit in Bangalore. Over the years, the company expanded its operations and also acquired tea plantations. In 1976, the company acquired Sterling Tea companies from James Finlay & Company for Rs 115 mn, using Rs 19.8 mn of equity and Rs. 95.2 mn of unsecured loans at 5% per annum interest. In 1982, Tata Industries Limited bought out
1 Tetley was the second largest brand of packaged tea in the global market, behind Unilever’s Brooke Bond and Lipton brands.
2 The Lectic Law library’s lexicon defines a leverage buyout as “a mechanism under which a company is acquired by a person or entity using the value of the company’s assets to finance its acquisition. This allows (for) the acquirer to minimize its outlay of cash in making a purchase.”

361
Tata Tea’s Leveraged Buyout of Tetley
the entire stake of James Finlay & Company in the joint venture, Tata Finlay Ltd. In 1983, the company was renamed Tata Tea Limited.
In the mid 1980s, to offset the erratic fluctuations in commodity prices, Tata Tea
entered the branded tea market. In May 1984, the company revolutionized the value-
added tea market in India by launching Kanan Devan tea3 in polypacks. In 1984, the
company set up a research and development center at Munnar, Kerala. In 1986, it
launched Tata Tea Dust in Maharashtra. In 1988, the Tata Tea Leaf was launched in
Madhya Pradesh.
In 1989, Tata Tea bought a 52% stake in Karnataka-based Consolidated Coffee
Limited-the largest coffee plantation in Asia, in order to expand its coffee business. In
1991, Tata Tea formed a joint venture with Tetley International, UK, to market its
branded tea abroad.
In 1992, Tata Tea acquired a 9.5% stake in Asian Coffee- the Hyderabad based 100%
export oriented unit known for its instant coffee through an open offer. This offer was
the first of its kind in Indian corporate history. Later, in 1994, Tata Tea increased its
stake in Asian Coffee to 64.5% through another open offer. This helped it consolidate
its position in the coffee industry.
In 1995, Tata Tea initiated a massive physical upgradation program at a cost of Rs 1.6
bn. The upgradation program, spread over four years, was meant to improve its
production facilities. In the same year, the company, along with a Sri Lankan partner,
bid successfully for a group of 20 tea estates in the famous Watawala plantations in
Sri Lanka.
In 1996, Tata Tea felt the need to develop into a truly national brand. It identified an
opportunity to enter the leaf tea segment in the South. Between 1996 and 1998, the
company launched Tata Tea Premium in Karnataka, Andhra Pradesh, Kerala and Goa.
In December 1999, Kanan Devan was relaunched in Kerala in an entirely new pack,
along with a fresh advertisement campaign. The company also planned to relaunch
Kanan Devan in other markets. The new pack, with the revamped Tata logo,
incorporated modern graphics while retaining the core properties associated with the
brand. The back panels on the pack were also made more interesting and informative.
To meet the demands of the American market, Tata Tea Inc. – a wholly owned
subsidiary of Tata Tea Limited – was set up in Florida to package and market instant
tea in the US. The tea was produced in Tata Tea’s factory in Munnar and then
processed in Florida. The company also launched Snapple, a ready-to-drink iced tea,
in the US. In 2000, it was one of the largest selling ready-to-drink teas in the US.
In order to tap the Japanese tea and coffee market, Tata Tea entered into a joint
venture with Hitachi of Japan – Tata Hitachi Sales Limited. In the mid 1990s, Tata
Tea formed a joint venture with Nippon Yusen Kaisha (NYK), one of the largest
shipping companies in the world. This joint venture, Tata NYK, aimed at playing a
major role in transport operations and management of seaports, inland container
3 Brand of Tata Tea that was very popular especially in South Indian markets. The Kanan Devan variety went back over a century and was derived from the tea growing in the Kanan Devan Hills (Tata Tea had tea estates on these hills) located in the eastern part of central Kerala and adjoining parts of Tamil Nadu. The Kanan Devan name was used for decades for selling bulk teas originating from these hills, and this led to a loose tea franchise in southern India, particularly Kerala. With the growth in the branded tea segment, Tata Tea leveraged on the name Kanan Devan to convert this loose tea franchise into a brand so as to move up the value chain.

362
Financial Management
depots, and container freight stations.(Prior to this joint venture, Tata Tea had been
serving as an agent for NYK).
DE-MYSTIFYING LBO
The Tata-Tetley deal was rather unusual, in that it had no precedence in India. Traditionally, the Indian market had preferred cash deals, be it the Rs.10.08 bn takeover of Indal by Hindalco or the Rs. 4.99 bn acquisition of Indiaworld by Satyam. What set the Tata -Tetley deal apart was the LBO mechanism which financed the acquisition.(See box item for a detailed explanation of an LBOs).
The LBO seemed to have inherent advantages over cash transactions. In an LBO, the acquiring company could float a Special Purpose vehicle (SPV)4 which was a 100% subsidiary of the acquirer, with a minimum equity capital. The SPV leveraged this equity to gear up significantly higher debt to buyout the target company. This debt was paid off by the SPV through the target company’s own cash flows.
The target company’s assets were pledged with the lending institution and once the debt was redeemed, the acquiring company had the option to merge with the SPV. Thus, the liability of the acquiring company was limited to its equity holding in the SPV. In an LBO, the takeover was financed by the target company’s future internal
4 An SPV is a company floated for the purpose of acquisition in an LBO. The company is created with an equity base and this equity is leveraged along with the assets of the acquired company to fund the acquisition.
LBO is defined as the “acquisition of a company, financed by the borrowing of all the stocks or assets of a public limited company by a small group of investors. This buying may be sponsored by buyout specialists or investment bankers that arrange such deals and usually includes representation by incumbent management.”
Typically, the buying group forms a shell corporation to act as a legal entity making the acquisition. In the stock purchase format, the target shareholders simply sell their stock and all interest in the Target Corporation to the buying group and then the two firms may be merged. In the asset-purchase format, the Target Corporation sells its assets to the buying group. The original shareholders own the target organization, now merely a pool of cash, to make investments with no tangible assets; the target corporation issues a liquidating dividend to its shareholders or becomes an investment company, using the pool of cash to make investments, whose proceeds are distributed to the shareholders. Sometimes the management is the prime moving force in this process; then it is called management buyout (MBO).
In an LBO, debt financing typically represents 50% of the purchase price. The debt is secured by the assets of the acquired firm and is usually amortized over a period of less than ten years. As funds are generated by operations or from sale of assets of the acquired firm, the debt to be paid off is to be scheduled. The sale of assets occurs when the investor group is motivated to take control in part because of what it considers unwise or ill-judged acquisitions by the firm in the past.
There may also be limited equity participation on the part of outside investors such as pension funds and insurance companies, often with the proviso that the equity interest will be repurchased after a pre-determined period to provide a specific yield. Following completion of the buyout, the acquired company is usually run as a privately-held corporation rather than a public corporation, at least for a period of time, after which resale of the firm at a profit is anticipated.

363
Tata Tea’s Leveraged Buyout of Tetley
accruals. This reduced the burden on the acquiring company’s balance sheet and made the entire takeover a low risk affair.
Tata Tea’s reserves at the time of the LBO were just around Rs 4 bn, precluding the
possibility of making such a gigantic acquisition on its own. Neither could it afford
the debt burden associated with large borrowings. So, it opted for a leveraged buyout.
`The deal was so structured that although Tata Tea retained full control over the
venture, the debt portion of the deal did not affect its balance sheet. The liability of
acquisition was limited to Tata Tea’s equity contribution to the SPV. Also, the lenders
had no recourse to Tata Tea in India. The deal did not dilute Tata Tea’s earnings
substantially. One expert5 described it as “a classic leveraged buyout of cross-border
finance, without recourse to Tata Tea, secured solely upon Tetley’s assets and cash
flow”. Interestingly, in the case of Tata Tea, the deal helped satisfy it, two major
requirements of financing, minimum exposure for Tata Tea but at the same time
retaining 100% ownership of the company, a seemingly win-win deal indeed.
STRUCTURE OF THE DEAL
The purchase of Tetley was funded by a combination of equity, subscribed by Tata
Tea, junior loan stock subscribed by institutional investors (including the vendor
institutions Mezzanine Finance, arranged by Intermediate Capital Group Plc.) and
senior debt facilities arranged and underwritten by Rabobank International.
Tata Tea created a Special Purpose Vehicle (SPV)-christened Tata Tea (Great Britain)
to acquire all the properties of Tetley. The SPV was capitalized at £70 mn, of which
£60 mn was contributed by Tata Tea (£ 45mn were raised by GDR6 issue and the
remaining amount came from Tata Tea’s reserves). The US subsidiary of the
company, Tata Tea Inc. contributed the balance £10 mn. The SPV leveraged the £70
mn equity 3.36 times to raise a debt of £235 mn, to finance the deal (Refer Figure I).
The entire debt amount of £235 mn comprised 4 tranches (A, B, C and D) whose tenor
varied from 7 years to 9.5 years, with a coupon rate of around 11% which was 424
basis points above LIBOR7. Of this, the Netherlands based Rabobank had provided
£215 mn, while venture capital funds, Mezzanine and Shroders contributed £10 mn
each.
While A, B, and C were senior term loans, tranche D was a revolving loan that took
the form of recurring advances and letters of credit. Of the four tranches A and B were
meant for funding the acquisition, while C and D were meant for capital expenditure
and working capital requirements respectively.
The debt was raised against Tetley’s brands and physical assets. The valuation of the
deal was done on the basis of future cash flows that the brand was expected to
generate along with the synergies arising out of the acquisition.
Though the actual cost of the Tetley takeover was £271 mn, Tata Tea spent another £9 mn on legal, banking and advisory services and a further £25 mn for Tetley’s working capital requirements and additional funding plans, thereby swelling the total
5 Rana Kapoor, MD, Rabo India Finance Ltd. 6 Tata Tea raised 45 mn pounds from 7.6 million GDR’s issued at $9.87 each, in March 2000. 7 LIBOR is an abbreviation for "London Interbank Offered Rate," and is the interest rate offered
by a specific group of London banks for U.S. dollar deposits of a stated maturity. LIBOR is the base interest rate paid on deposits between banks in the Eurodollar market (A Eurodollar is a dollar deposited in a bank in a country where the currency is not the dollar). It exists for various currencies and for different maturities.

364
Financial Management
acquisition cost to £305 mn. Since the entire securitization was based on Tetley’s operations, Tata Tea’s exposure was limited to the equity component of only £70 mn. Thus effectively, for just £70 mn equity exposure, Tata Tea acquired a £271 mn company.
A WISE DECISION?
Some analysts felt that Tata Tea’s decision to acquire Tetley through an LBO was not
all that beneficial for shareholders. They pointed out that though there would be an
immediate dilution of equity (after the GDR issue), Tata Tea would not earn revenues
on account of this investment in the near future (as an immediate merger is not
planned). This would lead to a dilution in earnings and also a reduction in the return
on equity. The shareholders would thus have to bear the burden of the investment
without any immediate benefits in terms of enhanced revenues and profits. From the
lenders’ point of view too, there seemed to be some drawbacks. Because of the large
amount of debt relative to the equity in the new corporation, the bonds were typically
rated below the investment grade.
LBO as a concept did not seem to have found wide acceptance in the Indian financial
system. Given the high rates of interest in the country, such debt did not seem to be
forthcoming, especially since banks and financial institutions seemed interested in
deploying their funds in high-return investments rather than in LBO. Also, a deal of
this sort required the acquiring company’s SPV to be leveraged to a far higher extent
than the generally acceptable level of 1:1 to 1:2 debt-equity ratio which Indian banks
TATA
TEA INC.
TATA
TEA
100%Subsidiary
PRUDENTIALMEZZANINE
CAPITAL
SCHRODERS
£10
million
£15million TATA TEA
(GB)
£10million
£ 10
million
£30million
INTERMEDIATE
CAPITAL GROUP
RABOBANK£185 million
Equity:
£70 million
Debt:
£235 million
£25million £ 271 million
TETLEY
ACQUISITION
LEGAL SERVICES &
BANK CHARGES
£9 million
TETLEY’S WORKING CAPITAL
REQUIREMENT
GDR issue £45 million
Figure I Structure of Tata Tea’s LBO Deal
Source: Business World, 10 April, 2000.

365
Tata Tea’s Leveraged Buyout of Tetley
and financial institutions were comfortable with. However, inspite of all the odds,
Tata Tea’s acquisition of Tetley seemed to have set a new benchmark in cross-border
acquisitions by Indian corporates. It seemed to have generated considerable interest
and appreciation of the concept as a viable alternative in Indian corporate circles. It
remained to be seen how many would follow this new path, entering into nuptials of
the leveraged kind.
Questions for Discussion:
1. An “LBO has inherent advantages over cash transactions.” Do you agree with the statement? Justify your answer.
2. Do you think LBO was the appropriate financing mechanism for Tata Tea’s acquisition of Tetley? Give reasons for your answer.
3. Explain how the Tata-Tetley LBO deal was executed.
4. “The Indian financial system does not provide an environment in which LBOs can flourish.” Comment on this statement.
© ICFAI Center for Management Research. All rights reserved.

366
Financial Management
Additional Readings & References: 1. Dutta Sudipt, The Queen’s cuppa, Business India, November 8–21, 1993.
2. Shenoy Meera, A good brew, Business India, October 10–23, 1994.
3. Karmali Nazneen and Bose Madhumita, What is brewing, Business India, January 2 - 15, 1995.
4. A cup of woes, Business India, February 26 – March 10, 1996, pp.105.
5. Prabhakar Mohana, A brewing battle, Business India, June 17–30, 1996.
6. Mazumdar Rakhi, Will Tetley add flavour to Tata Tea’s cuppa?, Business Today, February 22, 2000.
7. Joseph Lancelot, A mating of means, Business India, March 6–19, 2000.
8. De Arijit, Tata’s brew has a tetley blend, Business Today, April 7–21, 2000.
9. Rajeev Dubey, Funding Tetley’s buyout, Business World, April 10 2000.
10. Bose Madhumita, Netting bidders, Business India, April 17–30, 2000.
11. Bamzai Sandeep, Bigger sipper, Business India, June 26 – July 09, 2000.
12. Bose Madhumati, Troubled times, Business India, July 10 – 23, 2000.
13. Sisodiya Amit Singh, Not Everyone’s Cup of Tea, Chartered Financial Analyst, June 2000.
14. Bhattacharjee Dwijottam, Brewing up global success, URL of Tata
15. Balakrishnan Paran, Heady Blend, India Today, March 13, 2000.
16. Mathew James, Tata tea ready with novel funding plan, Business Standard, February, 21, 2000
17. Fred J. Weston, Kwang S. Chung, Susan E. Houg, Mergers, Restructuring & Corporate control, Prentice Hall, 1996.

Essar Steel – Defaulting on Debt Repayment “The fault did not lie in the instruments itself but in the financial planning that went behind it. It may be relevant to quote the safety motto of the National Rifle Association – ‘Guns do not kill people. People kill people.”
- A December 2002 article on www.indiainfoline.com, commenting on the Essar FRN default issue
THE DEFAULT
In July 1999, Essar Steel (Essar), the leading Indian sponge iron manufacturer and the flagship company of the well-known business house, the Essar Group was facing a severe financial crisis. Essar earned the dubious distinction of becoming the first Indian company to default in honoring its international debt repayment obligations. The company failed to repay its Floating Rate Notes (FRNs) worth $250 million issued to foreign investors. These had matured on 20th July, 1999. Analysts claimed that this development could seriously hamper the credibility of Indian companies and Indian paper in the international debt markets.
Expressing its inability to make arrangements for repayment, Essar announced that it would come up with a concrete solution by the end of October 1999. The company sent notices to its FRN-holders assuring them that within 90 days (starting from the date of default), it would announce its plans of rollover payment or refinancing through external sources. The notice required FRN-holders to choose between the two options (rollover or refinance). Essar sources said that the future course depended on the response of the FRN-holders.
According to financial institutions1 (FIs), if the FRN-holders sought immediate payment, the issue could even go to international courts, and the company would have to face demands for liquidation of its assets towards repayment of the amount. FI sources felt that refinancing would be difficult as the default had cast doubts on Essar’s credibility as a borrower. Moreover, they expressed fears that this default could become a major crisis, if other creditors of the company sought to recall their loans.
The default did not come as a surprise for company observers and many of them had predicted this eventuality much earlier. They considered the poor asset liability management practices followed at Essar responsible for all these problems.
BACKGROUND NOTE
Essar’s parent organization, the Essar Group was engaged in various businesses including power, telecom, shipping, oil and iron and steel. Essar was the second largest private sector steel manufacturer in India (TISCO is the largest). The history of the Essar Group dates back to 1956, when its founder, Nand Kishore Ruia (NKR) began undertaking independent contract works (mostly in the construction and shipping businesses) under the name of Essar Construction and Carriers Ltd. In 1969, after NKR’s demise, his brothers Shashi Ruia and Ravi Ruia took over the business responsibilities. During the 1970s and 1980s, the company diversified its operations by entering into the power, steel and oil businesses. Over the years, the Essar group
1 Primarily, development finance institutions such as IDBI and the erstwhile ICICI that play the role of owners/lenders in many Indian companies.

368
Financial Management
continued to grow in related fields i.e. offshore construction, pipeline laying, contract drilling and marine transport.
The liberalization of the Indian economy in the early-1990s opened up many opportunities for the Essar group. The Ruias tried to diversify further and emerged as a conglomerate of companies (Refer Table I).
Table I
Major Essar Group Companies
COMPANY DETAILS EssarShipping
Started operations in 1969; operated a fleet of over 50 vessels and is the second largest company in the industry. The company had three divisions: bulk carriers, tanker and offshore supply vessels
Essar Power Primarily set up to meet the requirements of Essar’s steel plants. The size of the power plant was extended to supply power to the Gujarat grid (60% of the power was supplied to the Gujarat government)
Essar Oil Set up in 1989 to provide exploration, production and related services in oil and gas sector. One of the leading private players in the oil industry
EssarTelecom
Entered the cellular telephone market in mid 1990s by acquiring Sterling Cellular (Delhi). One of the leading cellular service providers in India during the early 21st century
Essar Steel Flagship company of Essar Group. It was the largest sponge iron producer in the country in early 21st century
Source: ICMR
ESSAR STEEL
Essar was incorporated in 1976 as Essar Steel Ltd. According to analysts, the Ruia family played a significant role in the development of the industry. Essar was the first private sector company, which was permitted by the government to set up a 2-million tonne steel plant. During that period (1989), the group found out that it was difficult to acquire long-term funds for financing capital-intensive projects such as steel in India. Moreover, foreign investors were also not permitted to extend funds for more than five years. Due to this, Essar had to borrow funds from Indian FIs, for the construction of the Hazira (Gujarat) hot rolled coil (HRC) plant (with a repayment period of seven years).
The plant was to be commissioned in October 1992. However, in October 1992, the company announced that it had changed the scope of the project. As a result, the cost of the project increased from initial Rs 13.94 billion to Rs 33.5 billion. The company then planned to commission the plant in June 1994. However, the project was further delayed, which resulted in cost overruns of 33%, taking the cost to Rs 44 billion. As the need for funds was not fulfilled by the domestic loans, the company decided to raise funds from other countries by issuing FRNs.
Prior to the liberalization of the Indian economy in 1991, the state determined the interest rates and a fixed interest rate prevailed throughout the country. However, after liberalization, the markets experienced considerable changes and the interest rates were revised at regular intervals. Instruments such as FRNs now emerged as attractive financing options for many companies2 (Refer Exhibit I for a note on FRNs).
2 Besides Essar, companies such as The Power Finance Corporation, Sterlite, Indian Railway Finance Corporation, Arvind Mills, Spic Electric Power Corporation and SPIC also issued FRNs.
369
Essar Steel – Defaulting on Debt Repayment
In July 1994, Essar issued FRNs for US $200 million with a maturity period of five years (the five-year maturity period was fixed as per the guidelines of the Ministry of Finance). The actual rate of interest through the years ranged between 7.63% and 8.53%, based on the volatility in the LIBOR3 rate.
The FRN issue was floated at 2.65 basis points above the LIBOR rate and was listed
on the Luxembourg exchange. Soon after in September 1994, Essar came out with
another FRN issue worth US $ 50 million, on the same terms as the previous FRN
issue. Essar opted for FRNs as a mode of financing since they were available at lower
interest rates as compared to bank rates. The company announced that the HRC plant
would begin commercial production by April 1996. As the lead-time for completing
the project was four years, Essar thought it would have sufficient time and that it
would be able to repay its domestic and international debts comfortably.
The HRC plant began commercial production in July 1997. As this plant bought 70%
of its output from the Hot Briquetted Iron (HBI) plant (Hazira), Essar had a significant
cost advantage over its competitors. Essar also set up a 3.3 mtpa iron ore pelletisation
plant in Vizag (Andhra Pradesh) with an investment of Rs 3.5 billion to meet the
requirements of its sponge iron plant and HBI plant, which reduced its operational
costs to the tune of Rs 30 million per year. The use of superior technology and the
high degree of automation adopted, enabled Essar to reduce its manpower
requirements. According to Neddows and Co. (Canada), one of the renowned steel
consultants in the world, “Essar compares favorably with other international steel
producers in terms of equipment conditions, management, operational efficiency and
operating costs.” However, analysts felt that Essar failed to leverage the labor and
operational cost advantage it had on account of its high input costs (interest,
depreciation and other fixed costs).
During the late 1990s, on account of global downturn in the steel industry and a host
of other internal problems Essar’s financial position weakened considerably.
Unfortunately, this was also the time for repayment of FRNs.
DETAILING THE PROBLEMS
By the late-1990s, the profits of the entire Essar group had started declining. Analysts
attributed this to the various unrelated diversification moves undertaken by the group
during the early and mid 1990s. In 1998, the group incurred a loss of Rs 4.13 billion
(it had earned a profit of Rs 1 billion in 1997). Some of the major reasons for this
were: ineffective project planning, delay in the completion of projects, dumping4,
wrong choice of financial instruments, and reduced returns on investments. Moreover,
many of these diversification moves failed to deliver the desired results and the
group’s image took a beating.
The simultaneous launch of various projects during the mid-1990s pushed the group
towards a liquidity crunch. As a result of these diversification efforts, Essar Steel got
entangled in a complex mesh of cross holdings in other Essar companies, which
3 London Inter-Bank Offered Rate (LIBOR) is a European market rate used by a consortium of 24 British banks in negotiating loan agreements. It is the average of the interest rates paid on the deposits of US dollars in the London banks. In simple words, it is the arithmetic mean of the interest rate quoted by the specified banks (called reference banks) for that particular period or on that date.
4 Dumping refers to the selling of a product in a destination market at a price that is less than what the product is sold for in the country of its origin. Usually, cheap, inferior goods are dumped in a foreign market either to reduce unwanted stock or to damage the foreign competitor’s market.

370
Financial Management
created serious problems. Essar held 42% share in Essar Power, 10% in Essar
Commvision, 0.78% in Essar Oil and 9% in Essar Power. The poor performance of
the other companies reflected in Essar’s financials as well (Refer Exhibits II and III
for financial information about the company).
The company faced several other problems. According to analysts, the problems at
Essar started with a three-year delay in the functioning of the Hazira plant. The plant,
which was scheduled to begin production in 1994, began production only in July 1997
and incurred huge cost overruns. In addition to this, commissioning of the Vizag plant
was also delayed by 18 months due to the lack of funds. This also increased costs by
Rs 2 billion.
Some analysts blamed Essar’s aggressive export drive for worsening the situation further. A major part of Essar’s exports (45%) were directed to South-East Asia, which was facing an economic slump in the mid-1990s, due to the Asian currency crisis.5 As a result, exports suffered. Moreover, the Commonwealth of Independent States (CIS)6 started dumping their surplus low-grade HRC products in India. As the anti-dumping laws in India were not stringent during that period, steel companies such as SAIL and Essar took a severe beating.
Essar’s high production costs also affected the company badly. According to industry observers, the company’s input costs were very high. The manufacturing cost of steel at Essar amounted to an estimated $ 432 per tonne during that period. Though Essar’s actual cost of production was only $ 260 per tonne, the final cost of manufacture increased to $ 432 per tonne on addition of input costs such as interest, depreciation and other fixed costs. This was much higher than that of its foreign contemporaries like US Steel ($ 313 per tonne) and Nippon Steel ($ 300 per tonne). It was higher than the selling price of steel in Asia. This forced Essar to sell steel below the manufacturing cost during the late 1990s resulting in huge losses.
Analysts also held Essar’s management responsible for the mismanagement of funds raised from various sources. According to them, Essar met the regulatory requirements of promoter funding in various Essar group companies, during their diversification drive in the 1990s, by diverting the funds allotted for various projects into those group companies. To cover the diversion of funds, the company kept revising the scope of its projects periodically (like expanding the capacity of the project). This led to delays and huge cost overruns in the projects, especially the HRC project. According to a report, the company diverted an estimated Rs 2.45 billion in
5 The South-east Asian financial crisis started in early July 1997, when international currency speculators as well as many Thai nationals started selling Thailand’s currency, the Baht to buy US dollars, causing a flight of capital out of the country. As a result, capital became scarce and interest rates on borrowed money rose sharply, leading to the Baht losing about 20% of its value. As a result, The Thailand stock and real estate markets collapsed, pushing the country into its worst recession - production decreased, unemployment rose sharply and businesses failed and went bankrupt. The crisis spread quickly to other countries in the Southeast Asian regions like Malaysia, Indonesia and South Korea, significantly damaging the region’s economic health.
6 CIS agreement was signed by a group of sovereign states (former soviet republics) in December 1991, to cooperate in various fields of external and internal policies of the countries. The countries included the Azerbaijan Republic, the Republic of Belarus, the Republic of Armenia, the Republic of Kazakhstan, the Republic of Moldova, the Kyrgyz Republic, the Russian Federation, the Republic of Uzbekistan, the Republic of Tajikistan and Ukraine. In 1993, Georgia joined the list of CIS countries.
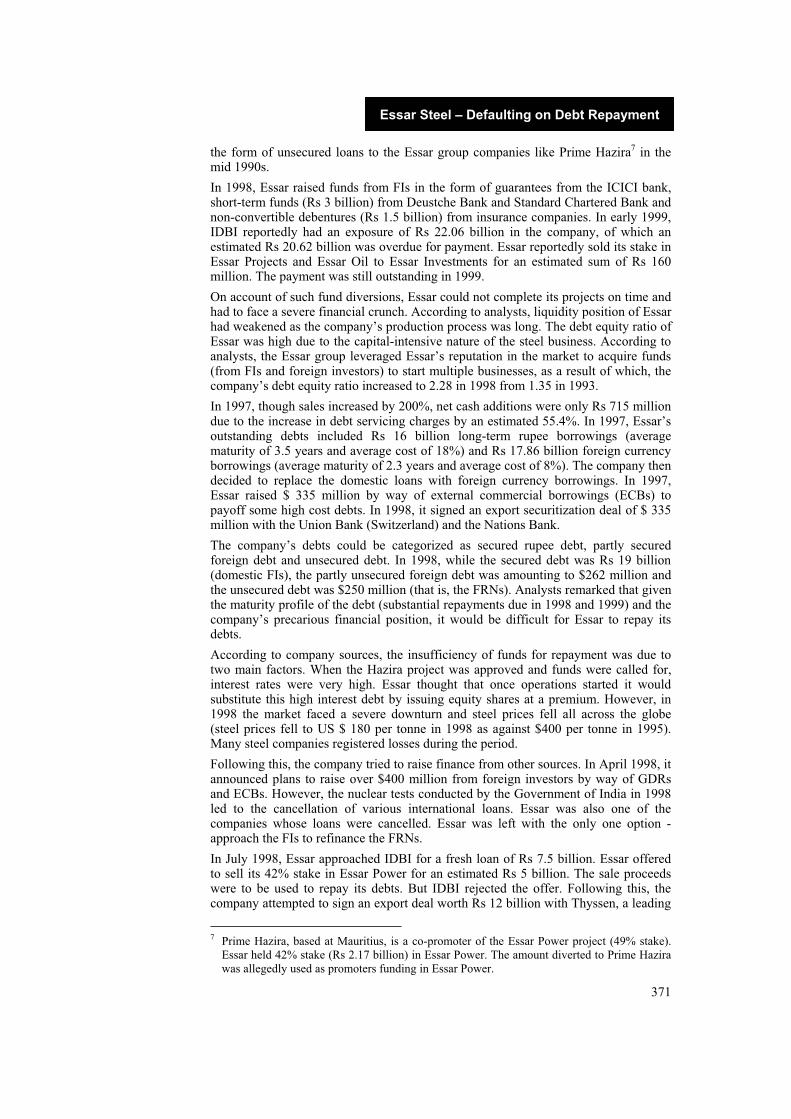
371
Essar Steel – Defaulting on Debt Repayment
the form of unsecured loans to the Essar group companies like Prime Hazira7 in the mid 1990s.
In 1998, Essar raised funds from FIs in the form of guarantees from the ICICI bank, short-term funds (Rs 3 billion) from Deustche Bank and Standard Chartered Bank and non-convertible debentures (Rs 1.5 billion) from insurance companies. In early 1999, IDBI reportedly had an exposure of Rs 22.06 billion in the company, of which an estimated Rs 20.62 billion was overdue for payment. Essar reportedly sold its stake in Essar Projects and Essar Oil to Essar Investments for an estimated sum of Rs 160 million. The payment was still outstanding in 1999.
On account of such fund diversions, Essar could not complete its projects on time and had to face a severe financial crunch. According to analysts, liquidity position of Essar had weakened as the company’s production process was long. The debt equity ratio of Essar was high due to the capital-intensive nature of the steel business. According to analysts, the Essar group leveraged Essar’s reputation in the market to acquire funds (from FIs and foreign investors) to start multiple businesses, as a result of which, the company’s debt equity ratio increased to 2.28 in 1998 from 1.35 in 1993.
In 1997, though sales increased by 200%, net cash additions were only Rs 715 million due to the increase in debt servicing charges by an estimated 55.4%. In 1997, Essar’s outstanding debts included Rs 16 billion long-term rupee borrowings (average maturity of 3.5 years and average cost of 18%) and Rs 17.86 billion foreign currency borrowings (average maturity of 2.3 years and average cost of 8%). The company then decided to replace the domestic loans with foreign currency borrowings. In 1997, Essar raised $ 335 million by way of external commercial borrowings (ECBs) to payoff some high cost debts. In 1998, it signed an export securitization deal of $ 335 million with the Union Bank (Switzerland) and the Nations Bank.
The company’s debts could be categorized as secured rupee debt, partly secured foreign debt and unsecured debt. In 1998, while the secured debt was Rs 19 billion (domestic FIs), the partly unsecured foreign debt was amounting to $262 million and the unsecured debt was $250 million (that is, the FRNs). Analysts remarked that given the maturity profile of the debt (substantial repayments due in 1998 and 1999) and the company’s precarious financial position, it would be difficult for Essar to repay its debts.
According to company sources, the insufficiency of funds for repayment was due to two main factors. When the Hazira project was approved and funds were called for, interest rates were very high. Essar thought that once operations started it would substitute this high interest debt by issuing equity shares at a premium. However, in 1998 the market faced a severe downturn and steel prices fell all across the globe (steel prices fell to US $ 180 per tonne in 1998 as against $400 per tonne in 1995). Many steel companies registered losses during the period.
Following this, the company tried to raise finance from other sources. In April 1998, it announced plans to raise over $400 million from foreign investors by way of GDRs and ECBs. However, the nuclear tests conducted by the Government of India in 1998 led to the cancellation of various international loans. Essar was also one of the companies whose loans were cancelled. Essar was left with the only one option - approach the FIs to refinance the FRNs.
In July 1998, Essar approached IDBI for a fresh loan of Rs 7.5 billion. Essar offered to sell its 42% stake in Essar Power for an estimated Rs 5 billion. The sale proceeds were to be used to repay its debts. But IDBI rejected the offer. Following this, the company attempted to sign an export deal worth Rs 12 billion with Thyssen, a leading
7 Prime Hazira, based at Mauritius, is a co-promoter of the Essar Power project (49% stake). Essar held 42% stake (Rs 2.17 billion) in Essar Power. The amount diverted to Prime Hazira was allegedly used as promoters funding in Essar Power.

372
Financial Management
steel trading firm in Germany. However, the deal required to be guaranteed by some bank or FI. But Essar failed to obtain the guarantee as the FIs and the banks refused to give guarantee.
However, towards the end of 1998, Essar’s hopes were rekindled. In November 1998, the government finally acceded to the demands of the steel companies and imposed anti-dumping tariffs on HRC from CIS countries. The government also requested the FIs to bail out Essar by funding it. Though other steel companies accused the government of being partial to Essar, analysts felt that the government was acting in the interest of corporate India, as the default in FRN payments by Essar might send wrong signals to foreign investors intending to invest in Indian companies. They said that it was a desperate effort by the Indian government to save the country’s image in the international market. According to them, the Government feared that if the FRN default occurred, it could adversely affect the market for Indian paper in the global arena. Though the FIs agreed to bail out Essar they laid down tough conditions to do so, one of them being the requirement that the company bring back the diverted funds (by the group) amounting to over Rs 2.16 billion.
Essar failed to fulfill these conditions. Company sources claimed that the stand taken by the FIs was not justified. They said that if the FIs decided to finance the FRN issue, their total exposure in Essar would be Rs 31 billion (the existing total FI exposure in Essar was Rs 20 billion against the total project cost of Rs 69 billion). This was below the debt-to-equity ratio allowable for large capital-intensive projects. According to the norms, FIs should have an asset cover8 of 1.4, even after refinancing. Hence the company sources said that even after refinancing the FRNs, the exposure of FIs would remain lower than the exposure levels approved for steel projects such as Ispat Steel (Rs 52 billion) and Jindal Vijaynagar (Rs 32 billion).
Meanwhile, Essar began to securitize its future receivables through the sale of steel. But the FIs asked the company to give a performance guarantee. The company tried to obtain the same from the banks controlled by the State Bank of India (SBI), but failed. In June 1999, Essar signed a $170 million MoU with Marathon Power, a US based company to sell off the Hazira Power Plant. The MoU also included a Power Purchase Agreement, under which Essar would receive power at a specified rate for twenty years.
As the above developments unfolded, rumors of Essar’s impending repayment default began spreading and the FRN began to be quoted at a discounted price (just over $ 70 for a face value of $ 100). The FIs now advised Essar to seek a rollover of the FRNs by notifying the FRN-holders. The notification was to be made by June 29, 1999. However, the company failed to notify the FRN-holders by the due date and was thus, left with only two options: either to redeem the FRNs on the due date or default in the repayment.
Essar went back to the FIs and asked for help in honoring the FRN repayments on the due date, citing that the company’s prospects would improve due to the MoU signed with Marathon Power. The FIs carefully studied the terms and conditions of the MoU signed between Essar and Marathon Power. They expressed doubts about Essar’s capability to get ready cash (as per the MoU) to honor its FRN issue on its due date. An FI source said, “Who will bear the loss if the MoU gets into problems?”
However, the FIs agreed to refinance Essar, provided certain conditions were fulfilled. These included the sale of the Hazira Power plant and the sale of Essar Oil and Mineral subsidiaries. However, the sale of these companies was delayed, following
8 Asset coverage is the extent to which a company’s net assets cover its debt obligations. A company’s ability to cover its debt obligations is tested by the asset coverage ratio. Asset coverage ratio is the ratio of liquidation value of all assets minus intangible assets and current liabilities (after deduction of short term debt obligations) to the total debt outstanding.

373
Essar Steel – Defaulting on Debt Repayment
which the FIs asked Essar to set up an escrow account9 for over Rs 10 billion that included the sale proceeds of the power plant.
However, as the company failed to set up an escrow account, in early-July, 1999, the FIs refused to bail it out. Stating their reasons for doing so, a source from IDBI (which led the FIs) said that bailing out companies ‘was not a part of its business’ and as it already had a high exposure in the steel industry, it would not be a good idea to support Essar. The management at IDBI felt that supporting Essar could downgrade the bank’s image. The bank would have to face the risk of having higher non performing assets and this would lead to a fall in its share prices.
Left with no other choice, Essar had to notify its FRN-holders that it would not be
able to redeem its bonds. However, the company promised that it would pay the last
interest due on the FRNs. Essar made it clear that it was working on a comprehensive
plan which would be announced within 90 days of the redemption date. In late July
1999, Essar announced that it was working on a financial plan with the help of the
Bank of America. As a part of its debt reduction plans, the company divested its
pelletisation division and its 650 MW Hazira power plant and announced plans to
raise an additional equity of Rs 3.3 billion through a 1:1 rights issue.
In October 1999, Essar proposed three options to its FRN-holders: to extend the maturity of the loan by 12 years (making the FRN-holders as secured creditors), to extend the maturity of the loan by 5 years (FRN holders would remain as unsecured creditors) or to redeem the FRNs (at a future date that was yet to be fixed).
In response to this package, around 65% of the FRN-holders opted for cash payment at 39% discount to the face value. The due date for this payment was set for January 31, 2000. If payments were not made on the due date, the FRN-holders could approach the courts for liquidation of the company. The remaining 35% of the FRN-holders, which mainly constituted Indian banks (including the Bank of Baroda, SBI, UCO Bank and the Bank of India, holding FRNs worth $ 40 million), agreed for a rollover, provided that the notes were backed by some security and the interest rate of the notes was increased by at least 2%.
Following this, Essar approached IDBI yet again asking for $ 104 million to make cash payments to the FRN-holders. But IDBI refused once again. This was a major blow to Essar as the due date (January 31, 2000) was approaching. Meanwhile, the international financial community reacted positively to the stand taken by the FIs and appreciated their refusal to bail out Essar.
Essar however began to fear the consequences of not meeting January 31 deadline. As a result, the company began another round of persuasions; this time the FRN-holders were asked to agree for another extension and were promised another interest payment (for the extended period), in addition to the principal and interest outstanding. Industry observers commented that Essar was following a pattern of rescheduling the FRN payments again and again, and that given the circumstances, there seemed to be no way out for the company.
END OF PROBLEMS?
In late-1999, the global steel industry began recovering and prices reached a high of $450 per tonne by 2000. In the light of this development, analysts were quick to comment that Essar’s cash flows would improve and it would be able to pay back its debts in due course. This view was also strengthened by the massive restructuring
9 An escrow account is a trust account established for the purpose of holding funds on behalf of principal or some other person until the consummation or termination of a transaction.
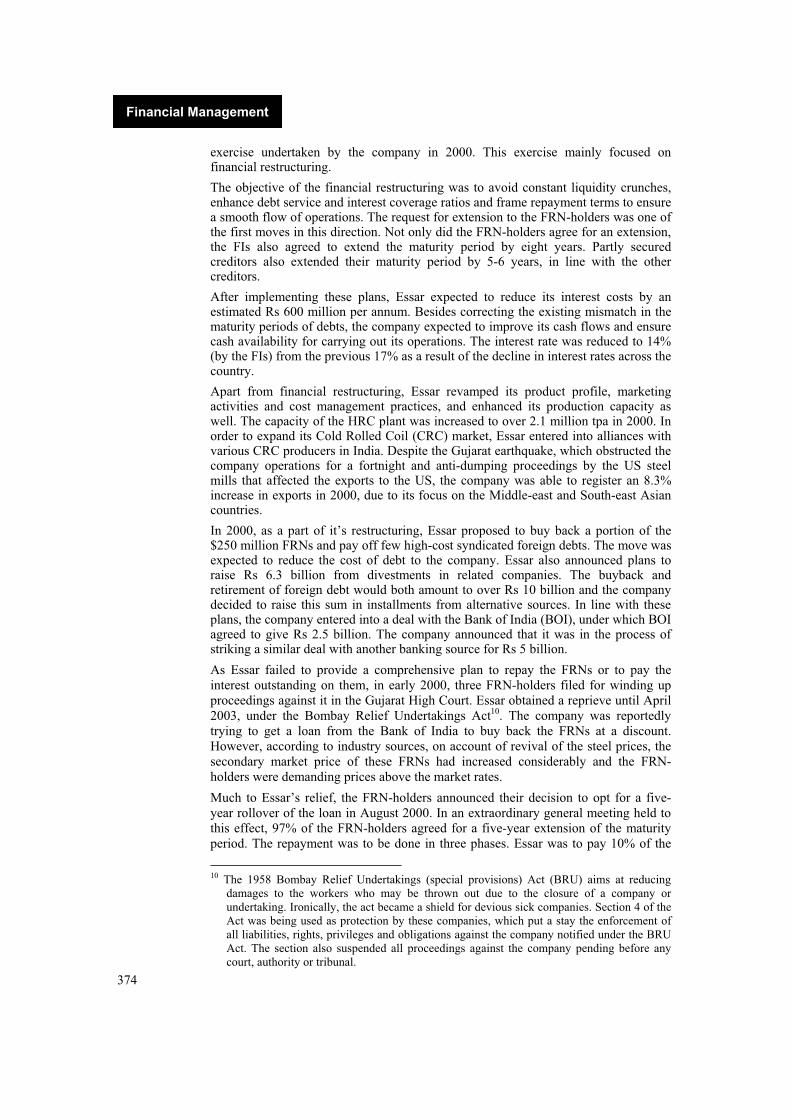
374
Financial Management
exercise undertaken by the company in 2000. This exercise mainly focused on financial restructuring.
The objective of the financial restructuring was to avoid constant liquidity crunches, enhance debt service and interest coverage ratios and frame repayment terms to ensure a smooth flow of operations. The request for extension to the FRN-holders was one of the first moves in this direction. Not only did the FRN-holders agree for an extension, the FIs also agreed to extend the maturity period by eight years. Partly secured creditors also extended their maturity period by 5-6 years, in line with the other creditors.
After implementing these plans, Essar expected to reduce its interest costs by an estimated Rs 600 million per annum. Besides correcting the existing mismatch in the maturity periods of debts, the company expected to improve its cash flows and ensure cash availability for carrying out its operations. The interest rate was reduced to 14% (by the FIs) from the previous 17% as a result of the decline in interest rates across the country.
Apart from financial restructuring, Essar revamped its product profile, marketing activities and cost management practices, and enhanced its production capacity as well. The capacity of the HRC plant was increased to over 2.1 million tpa in 2000. In order to expand its Cold Rolled Coil (CRC) market, Essar entered into alliances with various CRC producers in India. Despite the Gujarat earthquake, which obstructed the company operations for a fortnight and anti-dumping proceedings by the US steel mills that affected the exports to the US, the company was able to register an 8.3% increase in exports in 2000, due to its focus on the Middle-east and South-east Asian countries.
In 2000, as a part of it’s restructuring, Essar proposed to buy back a portion of the $250 million FRNs and pay off few high-cost syndicated foreign debts. The move was expected to reduce the cost of debt to the company. Essar also announced plans to raise Rs 6.3 billion from divestments in related companies. The buyback and retirement of foreign debt would both amount to over Rs 10 billion and the company decided to raise this sum in installments from alternative sources. In line with these plans, the company entered into a deal with the Bank of India (BOI), under which BOI agreed to give Rs 2.5 billion. The company announced that it was in the process of striking a similar deal with another banking source for Rs 5 billion.
As Essar failed to provide a comprehensive plan to repay the FRNs or to pay the interest outstanding on them, in early 2000, three FRN-holders filed for winding up proceedings against it in the Gujarat High Court. Essar obtained a reprieve until April 2003, under the Bombay Relief Undertakings Act10. The company was reportedly trying to get a loan from the Bank of India to buy back the FRNs at a discount. However, according to industry sources, on account of revival of the steel prices, the secondary market price of these FRNs had increased considerably and the FRN-holders were demanding prices above the market rates.
Much to Essar’s relief, the FRN-holders announced their decision to opt for a five-year rollover of the loan in August 2000. In an extraordinary general meeting held to this effect, 97% of the FRN-holders agreed for a five-year extension of the maturity period. The repayment was to be done in three phases. Essar was to pay 10% of the
10 The 1958 Bombay Relief Undertakings (special provisions) Act (BRU) aims at reducing damages to the workers who may be thrown out due to the closure of a company or undertaking. Ironically, the act became a shield for devious sick companies. Section 4 of the Act was being used as protection by these companies, which put a stay the enforcement of all liabilities, rights, privileges and obligations against the company notified under the BRU Act. The section also suspended all proceedings against the company pending before any court, authority or tribunal.

375
Essar Steel – Defaulting on Debt Repayment
FRNs falling due in the third year, 10% in the fourth year and the remaining 80% at the end of the fifth year. Just as the controversy seemed to have settled down, Essar defaulted yet again in late 2002 and failed to make repayments that were due to the FRN-holders (those who had not agreed to its rollover plans). Following this, two FRN-holders filed a petition for winding up the company in the Ahmedabad High Court.
In January 2003, Essar came up with a new proposal to pay off the FRN-holders. As per this proposal, Essar gave two options to its FRN-holders; one, redemption of the FRNs at a deep discount of about 75-80% (with Rs 5 billion new loan from Indian banks), and two, repayment over a period of 14 to 15 years. The proposal was due for finalization by the corporate debt restructuring committee (CDR), which constituted FIs and banks in February 2003. However, given Essar’s poor track record in FRN issue, there were few buyers for these new options.
According to industry sources, the company was aware of the fact that the repayment
of the FRNs would not be possible, given its low profitability. IDBI (which carried
out project appraisal for Essar) had made it clear to the company that it might not be
able to repay the FRNs and had suggested that arrangements be made for refinancing
the FRNs. (IDBI’s advice was based on the fact that it was a general practice in the
steel industry to have a repayment period of 12-15 years for debt raised for large
capital intensive projects such as steel).
Whether Essar was guilty of taking its investors and lenders for a ride or not is quite
debatable. However, the fact remains that the ‘Essar FRN debacle’ highlighted the
importance of proper ‘fund raising’ planning for a company’s future financial
performance. It also shows how fund raising through medium-term tenure instruments
could be disastrous when the funds are required for the long-term. The fact that such
defaults though avoidable, were not uncommon, and many South East Asian
companies had defaulted in their loan payments to international investors due to
economic slumps in their countries during the mid and late 1990s, would perhaps be
of little significance to those who had ‘locked’ their funds in Essar. Whether the FRN-
holders would ever get back their money or not was a question not many at Essar
seemed to be comfortable answering for the time being.
Questions for Discussion:
1. Why did Essar decide in favor of utilizing FRNs as a debt instrument? What benefits do FRNs offer to companies, in comparison to the other popular debt instruments? What are the benefits for the investors?
2. Analyze and explain the reasons behind Essar defaulting on the FRN repayment. Critically comment on the role of the FIs in the issue. Could Essar avoid the problem by better planning/management? If so, how?
3. Describe the restructuring initiatives undertaken by Essar to improve its financial position and comment whether it would be able to meet the new repayment schedules for the FRNs or not. What other options could the company explore to come out of its financial problems?
© ICFAI Center for Management Research. All rights reserved.

376
Financial Management
Exhibit I
About Floating Rate Notes (FRNS)
The total value of the global bond market is estimated to be over 50% larger than that of the total equity markets. A majority of bond issues are denominated in US dollars, followed by the Japanese Yen and Deutsch Mark. The various types of bond market instruments include straight fixed rate debt, equity-related bonds (convertibles, bonds and equity warrants), zero coupon11 bonds, composite currency bonds, dual-currency bonds and FRNs (Refer Table I for characteristics of bond market instruments).
Table I
Characterstics of Bond Market Instruments
Instrument Frequency of Payment Coupon Size
Payoff At Maturity
Straight Fixed Rate Annual Fixed Currency of issue
Floating Rate Note 3/6 months Variable Currency of issue
Convertible Bond Annual Fixed Currency of issue or Conversion to equity shares
Zero Coupon Bonds None Zero Currency of issue
Dual Currency Bonds Annual Fixed Dual currency
Composite Currency Bond
Annual Fixed Composite currency of Issue
Source: www2.bus.okstate.edu
An FRN is defined as a medium to long-term bearer note, which can be liberally traded. Interest on FRNs is paid periodically. However, the interest rate moves in tandem with the level of floating indices (standard interest rate/ reference index, which constantly reflects the actual market liquidity) such as LIBOR in London, MIBOR in Mumbai (India) and SIBOR in Singapore.
In general, FRN holders receive interest income equal to the total of the standard rate and a certain spread. Minimum interest rates are stipulated to ensure minimum returns to the investors. Normally, these FRNs are listed on the stock exchange, which provides the note holders with a liquidity option. Another benefit to the note holders is that, the prices of FRNs (quoted in the secondary market) remain more stable compared to fixed rate securities as the interest rates are periodically adjusted in tandem with the reference index.
The evolution of FRNs was a result of the problems faced by financial market players
trying to find new ways of eliminating the uncertainty associated with interest rates. In
a market where interest-risk fluctuations and capital market volatility are common, the
risk associated with loans taken by a corporate also increases considerably.
Moreover, lenders are not interested in lending money at fixed interest rates on a long-
term basis. Even those who do lend on fixed rates for long-term charge very high
rates. In markets like these, FRNs came to the rescue of both the borrowers as well as
the lenders. The instrument essentially acts as a guarantee of a rate of return linked to
LIBOR or some other reference rate while giving FRN-holders the flexibility of
11 A coupon is defined as the interest rate on a fixed income security (determined on issuance) and expressed as a percentage of the face value.

377
Essar Steel – Defaulting on Debt Repayment
making use of the secondary market liquidity (Refer Table II for an illustration of
calculating the coupon payment for FRNs).
FIs, like commercial banks often resort to FRNs as a source of long-term funding, due to the instrument’s long-term maturity period and floating rate nature. Since commercial banks practicing syndication lending reset the interest rates periodically, FRNs were an attractive option. This was because the coupon rates were adjusted automatically in tandem with the reference index. Apart from these, FRNs offer equal benefits for both investors and lenders as they assure high yields compared to many short-term notes and also offer a liquidity option. The fact that the yields are constantly updated often acts as an additional benefit. There are five key variables of interest in a basic FRN (Refer Table III).
Table II
Coupon Payment for Frns
Consider a five-year FRN of $1000. The coupon payment can be calculated as follows:
Assuming that the coupons are referenced to a six-month LIBOR paying coupon interest half-yearly, the LIBOR being 5.4% and the default risk premium being 1.5% the next coupon payment would be –
0.5* (0.054 + 0.015) * 1000 = $ 34.5
In case, the six month LIBOR on the next reset date is set at 6.4%, the next coupon payment would be –
0.5 * (0.064 + 0.015) * 1000 = $ 39.5
Adapted from www.indiainfoline.com, Financial Management, December 20, 2002.
Table III
Key Variables of Interest in an FRN
VARIABLE DETAILS
Reference Index The calculation of each successive new coupon is based on this index. Major reference indices included London Inter-Bank Offer Rate (LIBOR), US 90-day Treasury Bill rates, Prime rates, Commercial paper rates, (Mumbai Inter-Bank Offer Rate) (MIBOR) and Bank rate.
Quoted Margin to Reference Rate
A set margin or spread (to the specified reference index) for the payment of a new coupon by the FRN issuer. The quoted margin is also known as default risk premium. It is the compensation for the credit risk of the FRN holder.
Reset Frequency The market standard for the FRN is that the coupon payment frequency and coupon-reset frequency are similar. The frequency might differ in some cases where the coupon reset frequency might be faster than the coupon payment frequency. For example, the coupon reset rate might have been bimonthly, while the coupon interest might be set for half-yearly payment.
Observation Date The rules for setting the dates upon which the value of the reference index would be observed for determining the next coupon rate differ from time to time. The rule for specifying the observation date generally includes a specific time and specific place also. For instance, the observation date for 6-month LIBOR could be specified as the average offered rate for 6-month Eurodollar deposits at few specific reference banks in London at 12 noon.
Maturity Date A predetermined maturity date at which the principal of the FRN issue was required to be repaid, with the last coupon payment.
Adapted from www.indiainfoline.com, Financial Management, December 20, 2002.

378
Financial Management
Based on the changing investor preferences and borrower funding specifications, FRNs evolved into different types (Refer Table IV).
Table IV
Types of FRNS
Mis-match FRNs (Rolling Rate FRNs)
The note issued under this caption pays interest semi-annually though the actual rate is fixed monthly. This enables investors to benefit from the difference in interest amount arising due to the change in interest rates for different maturities.
Mini-Max FRNs (Collared FRNs)
FRNs include minimum and maximum coupons. The investors benefit in terms of high spread (on LIBOR) and agree to a minimum and maximum coupon rate on their notes, the differential between the two being very small.
Capped FRNs FRNs that are issued also include an interest rate cap, which provides a ceiling above which the borrower is not required to service the notes, even if LIBOR goes above that level. As a quid pro quo, investors have margins higher than normally applicable.
VRN-Structured FRNs
Long date paper, mostly perpetual, with variable interest spreads, with margins over LIBOR going up for the longer maturity periods.
Perpetual FRNs These FRNs are not redeemable and are hence known as perpetual floaters or undated issues. As the FRN does not have a mandatory repayment date, it might be counted as a form of capital, until the borrowers call for repayment (when the coupons start giving unattractive returns).
Deleveraged FRNs
The term ‘deleveraging’ implies that the coupon index is based on a fraction of LIBOR or Prime. With this, the investor is able to receive an upfront floating rate coupon, which is higher than attainable with prime FRN or plain LIBOR.
Inverse FRNS (IFRNs)
It is inversely proportional to the basic FRN. An IFRN’s coupon increases while the floating index decreases and vice-versa. This allows investors to benefit in case of falling interest rates.
Source: Adapted from www.indiainfoline.com, Financial Management, December 20, 2002.
Companies used FRNs as they enabled them do get debt funds with long-term maturity without needing to pay a high rate of interest throughout the period of the loan. On the investors side too, FRNs met the needs of those investors who wanted to liquidate their investment before the maturity of the issue.
Exhibit II
Essar – Profit And Loss Account (1998-2001)
(in Rs million)
Period ended 03/98 03/99 03/00 03/01
Gross Sales 24,967.30 22,603.10 24,218.40 25,188.30
Excise Duty (2,897.70) (2,657.40) (2,276.20) (2,338.30)
Net sales 22,069.60 19,945.70 21,942.20 22,850.00
Other income 1,557.20 1,029.20 483.10 462.20
Total income 23,626.80 20,974.90 22,425.30 23,312.20
Raw materials 4,707.30 5,498.60 5,184.50 6,959.90
Stock adjustment (Inc)/Dec (717.60) (1,555.80) 1,551.70 (542.00)
Cost of material 3,989.70 3,942.80 6,736.20 6,417.90
Employee cost 369.50 490.80 513.60 488.00
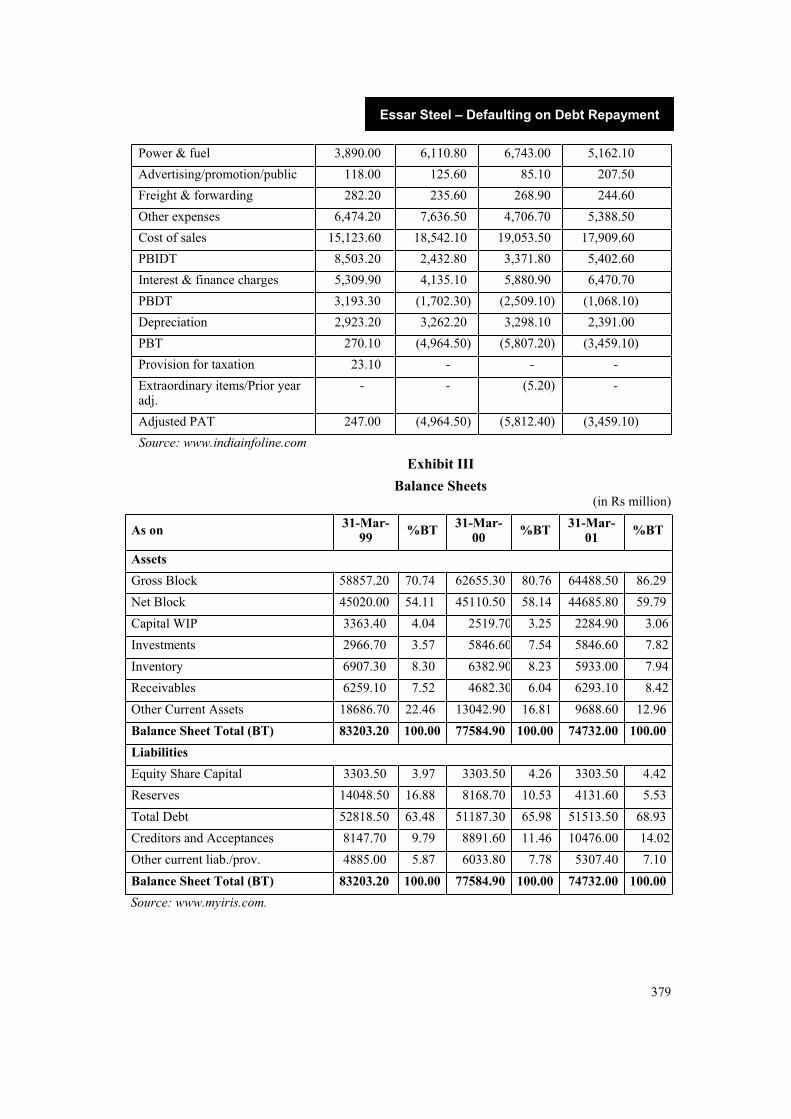
379
Essar Steel – Defaulting on Debt Repayment
Power & fuel 3,890.00 6,110.80 6,743.00 5,162.10
Advertising/promotion/public 118.00 125.60 85.10 207.50
Freight & forwarding 282.20 235.60 268.90 244.60
Other expenses 6,474.20 7,636.50 4,706.70 5,388.50
Cost of sales 15,123.60 18,542.10 19,053.50 17,909.60
PBIDT 8,503.20 2,432.80 3,371.80 5,402.60
Interest & finance charges 5,309.90 4,135.10 5,880.90 6,470.70
PBDT 3,193.30 (1,702.30) (2,509.10) (1,068.10)
Depreciation 2,923.20 3,262.20 3,298.10 2,391.00
PBT 270.10 (4,964.50) (5,807.20) (3,459.10)
Provision for taxation 23.10 - - -
Extraordinary items/Prior year adj.
- - (5.20) -
Adjusted PAT 247.00 (4,964.50) (5,812.40) (3,459.10)
Source: www.indiainfoline.com
Exhibit III
Balance Sheets (in Rs million)
As on 31-Mar-99
%BT 31-Mar-00
%BT 31-Mar-01
%BT
Assets
Gross Block 58857.20 70.74 62655.30 80.76 64488.50 86.29
Net Block 45020.00 54.11 45110.50 58.14 44685.80 59.79
Capital WIP 3363.40 4.04 2519.70 3.25 2284.90 3.06
Investments 2966.70 3.57 5846.60 7.54 5846.60 7.82
Inventory 6907.30 8.30 6382.90 8.23 5933.00 7.94
Receivables 6259.10 7.52 4682.30 6.04 6293.10 8.42
Other Current Assets 18686.70 22.46 13042.90 16.81 9688.60 12.96
Balance Sheet Total (BT) 83203.20 100.00 77584.90 100.00 74732.00 100.00
Liabilities
Equity Share Capital 3303.50 3.97 3303.50 4.26 3303.50 4.42
Reserves 14048.50 16.88 8168.70 10.53 4131.60 5.53
Total Debt 52818.50 63.48 51187.30 65.98 51513.50 68.93
Creditors and Acceptances 8147.70 9.79 8891.60 11.46 10476.00 14.02
Other current liab./prov. 4885.00 5.87 6033.80 7.78 5307.40 7.10
Balance Sheet Total (BT) 83203.20 100.00 77584.90 100.00 74732.00 100.00
Source: www.myiris.com.

380
Financial Management
Additional Readings and References: 1. Bhandari Bhupesh, The Ruias are on the Rack, Business World, March 22, 1999.
2. Dalal Sucheta, Essar Wants Bailout, But What About Those Funds?www.indianexpress.com, March 23, 1999.
3. FIs to look into Essar-Marathon MoU, www.expressindia.com, June 27, 1999.
4. Swain Sitanshu, FIs ask Essar to Set Up Rs 1,000-cr Escrow to Bail out FRN, Financial Express, June 27, 1999.
5. Essar FRN Issue - Nefarious Bailout, Says Amar Singh; Nefarious Moves, Says Ruia, www.indianexpress.com, July 2, 1999.
6. Essar: Wanted, www.equitymaster.com, July 20, 1999.
7. As FIs Refuse Bailout, Essar Steel Defaults on FRN Redemption, www.rediff.com, July 20, 1999.
8. Saxena Manish, FRN Debacle – Essar Group Failed to Pick Funding Options Right,Financial Express, July 26, 1999.
9. Essar Steel Proposal to Lenders, www.essar.com, October 4, 1999.
10. Essar Looks to Resolve FRN Debacle, www.equitymaster.com, October 5, 1999.
11. Essar FRNs to be Redeemed at 39% Discount, www.equitymaster.com, November 13, 1999.
12. Essar Steel and FRN Holders Solve Dispute, Financial Express, November 14, 1999.
13. Essar Default – Burden Set to Fall on IDBI, Indian Express, January 31, 2000.
14. IDBI Refuses to Bail Out Essar Steel, Indian Express, February 1, 2000.
15. Lobo Linus, Essar Steel -- Restructuring a Turnaround to Cut Burden of Interest,www.expressindia.com, July 3, 2000.
16. Mathew Vinod, Relief Undertaking Tag for Essar Steel, Business Line, April 13, 2002.
17. Dalal Sucheta, Arm-twisting v/s Privatization, http://iecolumnists.expressindia.com, July 28, 2002.
18. The Essar Steel Debacle, www.indiainfoline.com, December 20, 2002.
19. Floating Rate Notes (FRNs), www.indiainfoline.com, December 20, 2002.
20. Essar Plans to Pay Off Rs 2,199 Crore Foreign Debt with Fresh Loans, Financial Express, January 20, 1003.
21. www.essar.com
22. www.indiainfoline.com
23. www.naviamarkets.com
24. www.myiris.com
25. www.blonnet.com
26. www.nordea.lt
27. www2.bus.okstate.edu
28. www.cob.vt.edu

Gujarat Ambuja: Understanding Financial Statements
In 2004, Gujarat Ambuja Cement Ltd (GACL), which had grown tenfold during the late 1990s, was the third largest producer of cement in India, next only to Associated Cement Companies (ACC) & Birla Cements. In 2003, GACL had a capacity of 12.5 mn tonnes and generated revenue in excess of 2,500 crores. The company had posted a net profit of Rs 221.73 crore for the year ended June 30, 2003. GACL was the lowest cost producer in the Indian cement industry.
GACL’s quest for cost leadership had been driven by various productivity improvement and cost cutting measures. The company had won awards for management excellence, quality, and environment management. Ever since its inception, the company had believed in doing things in innovative and unconventional ways.
GACL’s modern plants, large kilns, high degree of automation, low manpower costs, low power tariff and low fuel costs had helped it to become the cost leader in the industry. GACL had cut energy costs by reducing the usage of coal through use of substitutes like crushed sugarcane. GACL operated most of its plants at above 100% capacity utilisation. The company had pioneered the use of ship transportation to cut freight costs and also established the necessary infrastructure like ports, freight and handling terminals. Low-cost funds had helped GACL to cut the cost of capital. The company's engineers had picked up best practices during visits to overseas plants in countries like Japan and Australia. GACL had also reduced pollution levels at its cement production plants and complied with the Swiss standards of 100 milligrams per cubic nanometer.
BACKGROUND NOTE
GACL was established as Ambuja Cements Private Ltd. (ACPL) in 1981 by Narotam Satyanarayan Sekhsaria (Sekhsaria), a businessman from the state of Gujarat in western India. Originally a cotton trader, Sekhsaria liked the cement business because of its stable demand, lack of substitutes and limited competition. With the support of Gujarat Industrial Investment Corporation (GIIC), Sekhsaria and his two partners, Suresh Neotia and Vinod Neotia, set up APCL. Suresh Neotia was appointed Chairman while Sekhsaria took charge as the Managing Director. In 1983, the company floated a public issue and its name was changed to GACL. The same year, production started at a 0.7 million tons per annum (mtpa) plant, named Ambuja Cements, in Ambuja Nagar, Gujarat. GIIC sold its stake in GACL in two tranches to Sekhsaria in 1987 and 1990.
In 1993, GACL commissioned its second cement plant at Ambuja Nagar (capacity 1 mtpa), named Gujambuja Cements. Attracted by buoyant cement demand in the northern regions, GACL set up a 1.5 mtpa plant at Suli in Himachal Pradesh (HP), in 1995. In the same year, GACL floated a wholly owned subsidiary in Mauritius - Cement Ambuja International Ltd. (CAIL). In 1996, GACL floated another subsidiary, Ceylon Ambuja Cements (Private) Ltd., through which it acquired a small company, Midigama Cement, in Sri Lanka.
In 1996, GACL set up its third plant at Ambuja Nagar, named Guj Line - II (capacity 1 mtpa). GACL also established grinding and packing units at Ropar (Punjab) and Panvel (Maharashtra). In 1997, GACL acquired Modi Cements' sick 1.4 mtpa plant at Raipur (Madhya Pradesh) for Rs 1.66 billion. This plant was renamed Ambuja Cement Eastern Ltd. After the acquisition, GACL revamped its processes to bring them on par with the standards of its other plants. In 1998, GACL acquired the

382
Financial Management
Nadikudi (about 100 kms from Guntur) and Proddatur (near Cuddaph) limestone mines in Andhra Pradesh to strengthen its presence in southern India.
In December 1999, GACL paid Rs 3.5 billion to acquire a 51% stake in Delhi based DLF Cement. DLF Cement had started its operations in 1997 in Rajasthan with a plant capacity of 1.4 mtpa. After this acquisition, GACL became the fourth largest cement manufacturer in India after ACC, L&T and Grasim.
In the same month, GACL also acquired a 7.2% stake in ACC for Rs 4.55 billion. With 14 manufacturing units in India, ACC had a total capacity of over 11 mtpa. It was one of the largest integrated cement manufacturers in the world. In December 2001, GACL began trial production at a new 2 mtpa plant in Chandrapur, Maharashtra, taking its total capacity to 12.5 mtpa. In FY 2003, the company recorded a sales figure of Rs 2173 crores and a PAT of Rs 293 crores.
FINANCIAL STATEMENT ANALYSIS
In line with the company's vision to become the leader in the Indian cement industry, GACL had been pursuing strategic alliances, capacity expansion, new plants, and aggressive takeovers. In this context, it was important for GACL to manage its finances effectively.
Balaji Sehwag, a fresh MBA, had joined the Corporate Finance Division of GACL. He reported to the head of the division directly. Balaji’s boss had asked him to make a detailed presentation on GACL’s financials. The balance sheet and profit & loss statement of GACL were given to Balaji (See Exhibit I&II).
© ICFAI Knowledge Center. All rights reserved.

383
Gujarat Ambuja: Understanding Financial Statements
Exhibit I
GACL –Profit and Loss Statement (30th June 2003)
Rs. in Crores
2002-2003 Rs. in Crores
2001-2002 Rs. in Crores
INCOME
Sales/ Operating Income
Sales 2,025.10 - 1,582.63
Adjustments relating to previous years 0.2 - 0.38
2,025.30 1,538.01
290.58 198.84
1,734.72 1,384.17
Other Income 36.24 21.56
Variation in Stocks 4.39 -12.79
1,775.35 1,392.94
EXPENDITURE
Manufacturing Expenses 807.15 - 602.98
Administrative & Selling Expenses 455.42 - 324.16
Interest and Finance Charges 87.94 - 96.64
Depreciation and Amortization 171.64 - 137.82
1,522.15 1,161.60
Profit before Tax 253.2 231.34
Provision for Current Tax 19.75 16.5
Provision for Deferred Tax 11.72 28.32
31.47 44.82
Profit after Tax 221.73 186.52
Balance as per last account 76.01 75.69
Adjustment in respect of Prior years
Depreciation and Amortization (net) 0.3 -0.38
Income Tax - -7.25
Wealth Tax 0.06 0.04
0.36 -7.59
Transferred from Debenture Redemption Reserve (On Redemption of debentures)
18.75 62.5
Transferred from Investment Allowance (Utilised) Reserve Account
15.5
Transferred to Debenture Redemption Reserve
18.75 108
Transferred to General Reserve 100 40
Interim Divedend on Equity Shares 46.58 - 62.07

384
Financial Management
Corporate Dividend Tax on above 5.97
52.55 62.07
Proposed Final Dividend on Equity Shares
62.13 31.04
Corporate Dividend Tax on above 7.96 -
70.09 31.04
Balance carried to Balance Sheet 90.96 76.01
*Subject to Deduction of Tax
Earnings Per Share (Refer Note 6)
Basic 14.31 11.54
Diluted 12.82 10.32
Source: CMIE
Exhibit II
GACL – Balance Sheet (30th June 2003)
Rs. in Crores
As at 30.06.2003 Rs. in Crores
As at 30.06.2002 Rs. in Crores
SOURCES OF FUNDS
Shareholder's Funds
Share Capital 155.3 - 155.17
Share Application Money 0.01 - 0.06
Employee Stock Option outstanding
0.08 - 0.1
Reserves & Surplus 1,461.25 - 1,449.32
1,616.64 1,604.65
Amount received against issue of warrants
- 18
Deferred Tax Liability (Refer Note 7(b))
305.3 222.76
Loan Funds
Secured Loans 845 1,191.16
Unsecured Loans
99,300 (-) 1% FCCB of US$ 1,000 each
461.37 - 461.37
Others 444.91 - 130.63
906.28 592
1,751.28 1,783.16
Total 3,673.22 3,628.57

385
Gujarat Ambuja: Understanding Financial Statements
APPLICATIONS OF FUNDS
Fixed Assets
Gross Block 2,957.73 - 2,855.43
Less: Depreciation 1,012.04 - 847.81
Net Block 1,945.89 - 2.007.62
Capital Work in Progress 52.69 - 32.55
1,998.58 - 2,040.17
Advances against Capital Expenditure
13.37 - 12.09
2,011.95 2,052.26
Investments 1,101.71 1,132.05
Current Assets, Loan and Advances
Inventories 224.31 - 208.37
Sundry Debtors 45.94 - 39.02
Cash and Bank balances 30.88 - 50.73
Other Current Assets 0.86 - 23.69
Loans and Advances 518.93 - 340.69
520.92 662.5
Less Current Liabilities and Provisions
Liabilities 191.59 - 188.21
Provisions 74.31 - 34.3
265.9 - 222.51
Net Current Assets 555.02 439.99
Miscellaneous Expenditure (to the extent nor written off or adjusted)
4.54 4.27
Total 3,673.22 3,628.57
Source: CMIE

Understanding Cost of Capital Ramesh and Suresh, two first year MBA students of a leading B School in the country were meeting in the hostel mess at dinner time. From their looks, it was clear that the long day of classes had sapped their energy. Since, they were in different sections, they had different teachers for some subjects. After picking up the trays from the counter, they walked back to a corner table and sat down to exchange notes on how the day had gone.
Ramesh: How was the day?
Suresh: It was ok in the morning. OB, Business History and all that qualitative stuff. But we had a double lecture in financial management in the afternoon. That was mind-boggling stuff. I couldn’t make out much of what Prof. Kamath was saying.
Ramesh: Tell me more about it.
Suresh: He was teaching us cost of capital. The first part was okay. He told us the cost of capital is the weighted average cost of debt and equity. I got a bit confused about the weights to be used. But I think I am going to be ok once I go through PC (Financial Management by Prasanna Chandra, a leading text book in the country, used at most B Schools).
Ramesh: So where did you really find it tough going?
Suresh: Well. Kamath started with the cost of debt. That turned out to be simple stuff. If it is a traditional loan, it is nothing but interest rate, adjusted for the tax shield. On other hand, if it is a bond, it is the yield the investors get by applying the principle of time value for the different cash flows like interest payment and principal repayment.
Ramesh: So the problem was with the cost of equity? Let me confess. We had Prof. Ramachandran teaching us the same topic last week. I was not wholly convinced but I didn’t want to let it be known to others that I did not understand. After all, I scored an A in the mid semester examinations.
Suresh: Look, in case of debt the outflow for the borrower is the inflow for the investor. But in case of equity, things are different. If I buy a share at Rs 50 and sell it at Rs 60 at the end of the year, I get a return of 20%. According to Kamath, that should be the cost of equity. He says that the cost of equity is nothing but the rate of return the equity investors expect. My point is the company was not involved in either of the transactions, i.e., buying the share or selling the share. So, how can the rate of return generated by the investor be cost to the company?
Ramesh: What you are saying makes sense. Carry on.
Suresh: A cost cannot exist in the vacuum. Another point, which beats me, is many companies these days, are reporting the cost of capital figures in their balance sheets (See Exhibits). I am not at all convinced about the way they calculate it. In any case they do not show their detailed calculation.
Ramesh : Let us do one thing. We are reaching a blind wall. Let us go to Prof. Malhotra. He is supposed to be a ‘cat’. Maybe, he will have the answer.
MARICO INDUSTRIES LIMITED
Marico was the market leader in the hair oil segment, with its Parachute and Hair & Care brands. It was also one of the leading players in the branded edible oil segment with strong brands like Saffola and Sweekar. Besides hair and edible oil, the company had a presence in niche segments like Instant Starch (Revive), Anti lice shampoo (Mediker) and food products like jams and sauces (Sil). Marico also had a fee based marketing arrangement with Procter & Gamble (P&G) for marketing a few P&G

387
Understanding Cost of Capital
brands through its own network. Parachute, Saffola and Sweekar were the key earnings drivers, contributing to almost 80% of Marico’s turnover.
Exhibit I
Marico - Selected Financials (Amount in Rs. Million)
Year ended March 31st 99-00 00-01 01-02 02-03
a Average Capital Employed 1,345 1,602 1,916 2,093
b Average Debt / Total Capital (%) 2.1 2.2 2.3 3.9
c Cost of Equity (%) 13.2 13.1 15.0 13.0
d Cost of Debt (Post Tax) (%) 7.1 6.5 - 1.0
e Weighted Average Cost of Capital (%) 13.1 13.0 14.7 12.5
f Profit After Tax (excl. extraordinary Items)
375 458 530 562
g Add: Interest Post Tax 34 27 42 12
h Net Operating Profit After Tax 409 485 572 574
i Less: Cost of Capital 176 207 281 261
j Economic Value Added 233 278 291 313
k % to Capital Employed 17.3 17.3 15.2 14.9
Source: Annual Report
Exhibit II Marico Selected Financials
The highlights pertain to the financial performance of marico Consolidated
Year ended March 31st 1994 1995 1996 1997 1998 1999 2000 2001 2002 2003
Sales & Services 2,364 2,833 3,486 4,097 4,900 5,512 6,497 6,707 6,957 7,755
Profit before Interest & Tax (PBIT)
20 252 364 353 424 477 458 537 619 651
Operating Profit before Tax
149 191 268 277 365 440 426 501 578 640
Extraordinary / Exceptional items
- - 29 14 - - (18) - - -
Profit before Tax (PBT) 149 191 297 291 365 440 408 501 578 640
Profit after Tax (PAT) 64 118 212 215 300 375 357 458 501 562
Cash Profits (PAT * Depreciation)
81 150 238 246 340 427 435 546 703 783
Economic Value Added (Refer Management Discussion)
48 90 125 87 188 230 233 278 291 313
Net Fixed Assets 167 270 404 453 605 694 953 1,274 1,413 1,027
Investments 7 22 23 8 - - - - - 139
Net Current Assets 159 230 634 524 463 540 502 475 669 934

388
Financial Management
MiscellaneousExpenditure
- - - - - - - - - 4
Total Capital Employed 333 522 1,061 985 1,068 1,235 1,455 1,749 2,082 2,104
Equity Share Capital 45 45 145 145 145 145 145 145 145 290
Preference Share Capital - - - - - - - - - 290
Reserves 140 252 515 653 834 1,065 1,277 1,568 1,827 1,350
Net Worth 185 297 660 798 979 1,210 1,422 1,713 1,972 1,930
Borrowed Funds 148 225 401 187 89 25 33 36 50 114
Deferred Tax Liability - - - - - - - - 60 61
Total Funds Employed 333 522 1,061 985 1,068 1,235 1,455 1,749 2,082 2,104
Profit before Tax to Turnover (%)
6.3 6.7 8.5 7.1 7.4 8.0 6.3 7.5 8.3 8.3
Profit after Tax to Turnover (%)
2.7 4.2 5.2 4.9 6.1 6.8 5.5 6.8 7.2 7.3
Return on Net Worth (%)
(PAT / Average Net Worth)
41.0 49.0 44.3 29.5 33.8 34.3 27.1 29.2 27.2 28.8
Return on Capital Employed (%)
(PBIT* / Average Total Capital Employed)
70.4 58.9 46.0 34.5 41.3 41.5 32.7 33.5 32.3 31.1
Net Cash Flow from Operations per share (Rs.) (Refer Cash Flow Statement) ##
- 17 1.8 19.7 28.7 15.4 30.6 37.7 45.1 22.3
Earning per Share (EPS) (RS.)
(PAT / No. of Equity Shares) ##
14.1 26.3 12.6 13.9 20.7 25.9 24.6 31.6 34.5 19.0
Economic Value Added per share (Rs,)
(Refer Management Discussion) # #
10.7 20.0 8.6 6.0 13.0 15.8 16.1 19.2 20.1 10.8
Dividend per share (Rs.) ##
1.2 1.5 2.5 5.0 7.5 9.0 9.0 10.0 14.0 4.8
Debt / Equity 0.80 0.76 0.61 0.23 0.09 0.02 0.02 0.02 0.03 0.06
Book Value per share (Rs.)
(Net Worth / No. of Equity Shares) ##
41.1 66.0 45.5 55.0 67.5 83.4 98.1 118.1 136.0 66.5
Sales to Average Capital Employed @
7.1 5.4 3.3 4.2 4.6 4.8 4.8 4.2 3.6 3.7
Sales to Average Net Working Capital #
15.6 14.6 8.1 7.1 9.9 11.0 12.5 13.8 12.2 9.7
* PBIT includes extraordinary items
@ Average Capital Employed = (Opening Capital Employed + Closing Capital Employed)/2

389
Understanding Cost of Capital
# Average Net Working Capital = (Opening Net Current Assets + Closing Net Current Assets)/2
# # Per share information for 2002-03 is calculated on enhanced equity share capital of Rs. 290 million (29 million shares)
Source: Annual Report
DR. REDDY’S LABORATORIES (DRL)
DRL had transformed itself from process engineering and research driven pharmaceutical company in the past five years. The company achieved several landmarks in 2001 with its ADR issue, launch of generic fluoxetine in the US and license of an anti diabetic molecule to Novartis. DRL had formulated new chemical entities (NCE) with two licensed to Novo Nordisk and one to Novartis. After the merger with sister company Cheminor Drugs, DRL had gained entry into the lucrative US generics market. The company created headlines in August 2001 when it was the first company to launch a generic version of Fluoxetine 40 mg dosage form and an enjoyed six-month exclusivity period to market the same. In international markets the focus was on CIS countries, Brazil, China, Middle East, South Africa, South East Asia.
DRL had consolidated its position in domestic formulations market through aggressive product launches as well as acquisitions. The takeover of American Remedies in 2000 had strengthened its brand portfolio.
DRL calculated its cost of equity by using the following formula:
Return on risk-free investment + expected risk premium on equity investment adjusted for the beta variant for Dr. Reddy’s in India.
10-year G-Sec yield taken as the risk-free rate of investment (6.09%).
Beta value of 0.65 used for calculation of cost of equity.
Taxes on EBIT calculated at the Effective Tax Rate (excluding deferred taxes).
Exhibit I
Dr. Reddy’s - Selected Financials
Source: Annual Report
Exhibit II
Dr. Reddy’s P&L (in Rs. Millions)
For the year ended March
31, 2003
For the year ended March
31, 2002
Increase/Decrease)
%Income Sales 15,983 15,578 3%
Income from services - 79 (100%)
Rs. Mn.
2003 2002 2001 Shareholders’ Funds 18832 15457 5241 Debt – LT 41 47 1003 Total Capital Employed (a) 18873 15504 6244 Earnings before Interest & Tax EBIT 3944 5095 1460 Tax on EBIT* 398 423 411 NOPAT (a) 3546 4672 1049 Weighted Average Cost of Capital 11.9% 12.7% 14.6% Capital charges (b) 2238 1973 910 Economic Value Added (a-b) 1307 2699 140

390
Financial Management
License fees - 344 (100%)
Other income 667 515 30% 16,650 16,516
Expenditure Material costs 4,778 4,290 11%
Conversion charges 119 62 92% Excise duty 847 790 7%
Personnel costs 1,211 1,006 20%
Operating expenses 3,351 2,926 15% Research and development expenses
1,338 980 37%
Amortisation of long term deposits
23 23 0%
Deferred Revenue Expenditure written-off
- 931 (100%)
Provision for decline in the value of long term investments and investments written off
51 217 (76%)
Finance charges 34 109 (69%) Depreciation 586 474 24%
12,338 11,808 Profit before tax 4,312 4,708 (8%)
Income tax
- Current tax 402 395 2% - Deferred tax expense/(benefit)
(11) (284) (96%)
Profit after taxation 3,921 4,597 (15%)
Source: Annual Report
ORCHID CHEMICALS & PHARMACEUTICALS
Orchid Chemicals & Pharmaceuticals Ltd., a leading pharmaceutical company headquartered in Chennai, India was involved in the manufacturing and export of cephalosporin and non-cephalosporin bulk actives, formulations and nutraceuticals. Its activities included contract manufacturing, manufacturing, regulatory affairs & legal Services, research & development.
The cost of capital calculations for Orchid is given below.
Exhibit I
Orchid – Selected Financials
Rs lakhs
S. No. Particulars 2002-03
1.Step 1: Calculation of Cost of Funds Deployed Average Debt 62029
2. Average Shareholders’ Networth# 42658
3. Total Funds Deployed 104687
4. Cost of Debt (Post Tax) % 8.63%
5. Cost of Equity - % 11.82%
6. Weighted Average Cost of Funding 9.93%
7. Cost of Funds Deployed 10397
Step 2: Calculation of Net Operating Profit after Taxes (NOPAT)
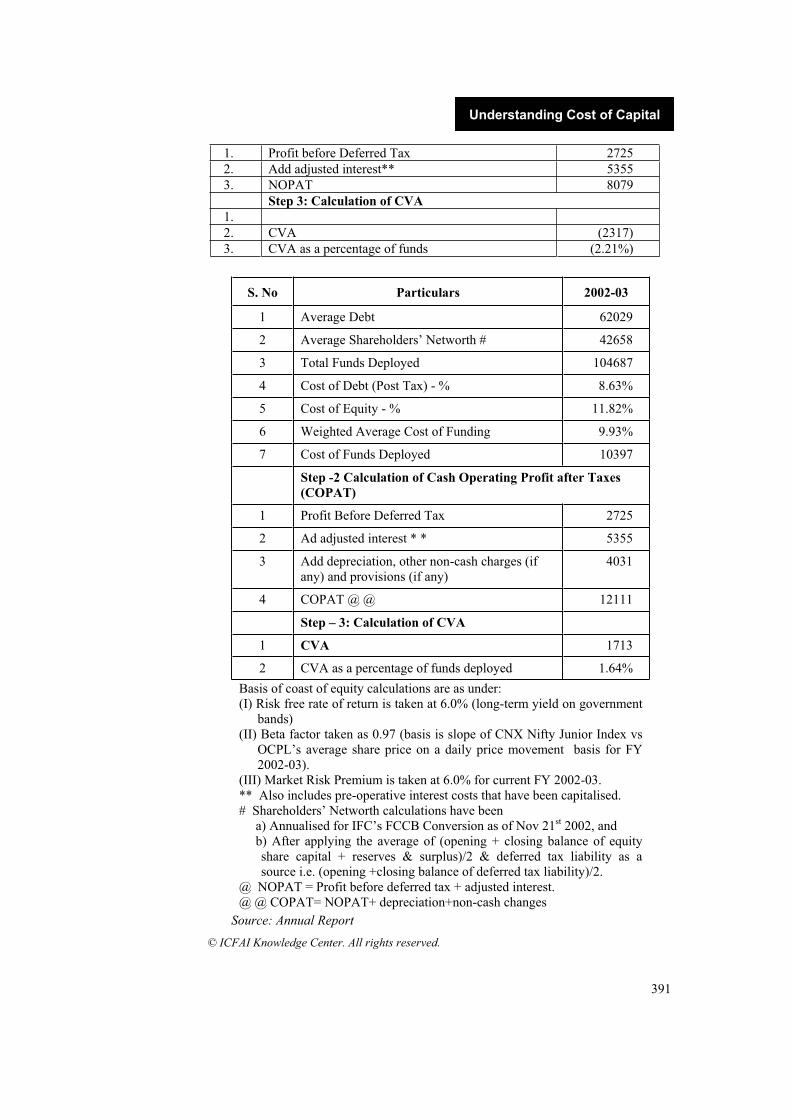
391
Understanding Cost of Capital
1. Profit before Deferred Tax 2725
2. Add adjusted interest** 5355
3. NOPAT 8079
Step 3: Calculation of CVA1.
2. CVA (2317)
3. CVA as a percentage of funds (2.21%)
S. No Particulars 2002-03
1 Average Debt 62029
2 Average Shareholders’ Networth # 42658
3 Total Funds Deployed 104687
4 Cost of Debt (Post Tax) - % 8.63%
5 Cost of Equity - % 11.82%
6 Weighted Average Cost of Funding 9.93%
7 Cost of Funds Deployed 10397
Step -2 Calculation of Cash Operating Profit after Taxes (COPAT)
1 Profit Before Deferred Tax 2725
2 Ad adjusted interest * * 5355
3 Add depreciation, other non-cash charges (if any) and provisions (if any)
4031
4 COPAT @ @ 12111
Step – 3: Calculation of CVA
1 CVA 1713
2 CVA as a percentage of funds deployed 1.64%
Basis of coast of equity calculations are as under: (I) Risk free rate of return is taken at 6.0% (long-term yield on government
bands) (II) Beta factor taken as 0.97 (basis is slope of CNX Nifty Junior Index vs
OCPL’s average share price on a daily price movement basis for FY 2002-03).
(III) Market Risk Premium is taken at 6.0% for current FY 2002-03. ** Also includes pre-operative interest costs that have been capitalised. # Shareholders’ Networth calculations have been a) Annualised for IFC’s FCCB Conversion as of Nov 21st 2002, and b) After applying the average of (opening + closing balance of equity
share capital + reserves & surplus)/2 & deferred tax liability as a source i.e. (opening +closing balance of deferred tax liability)/2.
@ NOPAT = Profit before deferred tax + adjusted interest. @ @ COPAT= NOPAT+ depreciation+non-cash changes
Source: Annual Report
© ICFAI Knowledge Center. All rights reserved.
The Coimbatore Bypass Road Project
INTRODUCTION
The Coimbatore Bypass was the first road project to be implemented in South India on BOT1 (build, operate and transfer) basis. The project was a pioneering initiative, which incorporated private sector participation and levy of toll on users to ensure sustainability in the long run. The road ran between Neelambur on the Salem side of NH-47 Tamilnadu and in Kerala2, Madukkarai on the Palghat side.
The project involved construction of a 28-km long two-lane bypass road, the 32.2m new Athupalam bridge across the river Noyal, the railway overbridge at Chettipalayam Tamilnadu and the maintenance of the old bridge at Athupalam, all in the state of Tamilnadu. Larsen & Toubro (L&T)3 was authorized to collect and retain the fee from users of the new and old Athupalam bridges. The bypass was expected to ease the traffic congestion in Coimbatore city, Tamilnadu and the Salem-Cochin national highway running between Tamilnadu and Kerala. The shippers, mostly export oriented units relying on the Cochin port for shipments, were other major beneficiaries as transportation time could be saved using the new road.
Construction was started in January 1998 and completed in 22 months4 time. The Athupalam bridge was opened for traffic in December 1998 and the bypass became operative from January19, 2000. The project cost was about Rs.1.04 bn. The project concession period was for 12 years, and was expected to set a precedent for assessment of traffic risk patterns in the country for toll-based roads. However, the project ran into problems when users refused to pay the toll for the old Athupalam bridge. They argued that the old bridge was already in existence. As for the bypass and the new Athupalam bridge, they felt that the toll rates were on the higher side. They also complained that L&T had not taken them into confidence before coming out with the toll rates.
FINANCING OF THE PROJECT
In the 1970s, the Tamilnadu government planned the Coimbatore bypass road to ease
the traffic congestion in Coimbatore and the NH-47 between Salem and Cochin.
However, due to paucity of funds, the project had to be dropped.
In 1995, the Government of India (GoI) liberalized its policies and opened up the road
sector for private investments. In September 1995, the GoI through its Ministry of
Surface Transport (MoST)5 invited tenders from the private sector to finance and
1 In a typical BOT model, the government entity enters into an agreement with a private sector company to finance, design and build a facility at its own cost. The private company is then given a concession, usually for a fixed period to operate that facility and obtain revenues from its operation before transferring the facility back to the government at the end of the concession period. This enables the project company to receive sufficient revenues to service its debts during this period. In the BOT model, title to the assets of the concession (mainly land) remains with the public authority.
2 Tamilnadu and Kerala are states of the Indian Union. 3 Larsen & Toubro is an engineering and construction conglomerate with additional interests in
IT, cement and electrical businesses. 4 The project was contracted to be completed within 29 months. However, L&T hurried to
complete the construction ahead of schedule, so that it would be able to collect the toll faster. 5 MoST decides the policies regarding the transportation sector, while National Highways
Authority of India (NHAI) implements these policies.

393
The Coimbatore Bypass Road Project
implement the construction, operation and maintenance of the Coimbatore bypass
road project on BOT (build, operate and transfer) scheme. As the project was not
viable on its own, the GoI after studying the various options, widened the scope by
including the construction of an additional two-lane bridge on river Noyal on the NH-
47.
A concession agreement for the integrated project of bypass and a bridge at Athupalam on NH-47 was signed on October 3, 1997 between the MoST, the government of Tamilnadu and L&T. L&T set up a special purpose vehicle (SPV) - L&T Transportation Infrastructure Ltd. (LTTIL), to implement the project. L&T held 100% equity in LTTIL. LTTIL implemented the project on BOT basis, with the revenue accruing directly to it.
The project was constructed by L&T-ECC (Engineering Construction Corporation) group, the largest construction organization in India. L&T-Ramboll Consulting Engineers, a joint venture between L&T and Ramboll of Denmark, was employed for quality control supervision and review of the critical pavement design.
The project was financed by share capital of Rs 416 mn and term loan of Rs 620 mn, with a debt-equity ratio of 1.5:1. As per the agreement with the Tamilnadu government, L&T had to hold a minimum equity of 26% at the end of 30 years6.
The debt financing was done by State Bank of India (SBI), L&T Finance, Housing and Urban Development Corporation (HUDCO), Housing Development Finance Corporation (HDFC), and Industrial Development Bank of India (IDBI). IDBI had sanctioned Rs.300 mn for the project in the form of infrastructure bonds. The loan was given in two tranches of Rs.150 mn each at 15% interest each. Principal repayment was to begin from the eighth year onwards.
SBI loaned Rs.300 mn to the project. Infrastructure Development Finance Corporation (IDFC) had structured a “liquidity support” arrangement to help SBI in emergency situation. This support enabled SBI to approach IDFC for refinancing in case it failed to raise the money from other sources. For IDFC, liquidity support was different from the take-out financing7 since it was lending on condition that the bank was unable to raise the money. Moreover, IDFC would not take the project risk even if it lends to the bank. IDFC would only be carrying the bank risk as it had given the money to the bank and not the SPV.
REVENUE GENERATION
L&T pointed out that the project helped vehicles save fuel and vehicle operating costs due to reduction of distance by 2.5 km and free flow traffic, besides time. Other
6 In the concession agreement signed between MoST and L&T, the government allowed the project promoters to bring down the equity to as low as 26% during the operational phase. However, the financial institutions insisted that the equity dilution below 51% would be permitted only after full repayment of debt dues.
7 A take-out financing agreement involves three parties – in this case, IDFC, SBI (or a participating bank), and the project company. The debt funds were provided by SBI for five years at the end of which SBI had the option to either continue or call back the principal. IDFC at that point would take-out SBI for the principal amount of the loan. The project companies therefore were able to avail themselves of longer tenure funds of over 10 years. Banks could assume full credit risk, partial credit risk or no credit risk in the initial period, with the variable being the interest premium. In this structure, both the bank and the IDFC would be able to participate in the credit risk for principal and interest respectively. This structure could enhance the flow of investments from commercial banks to the infrastructure projects. The other projects to be financed through takeout financing were Bharati Telenet, and Narmada Bridge in Gujarat.

394
Financial Management
benefits to the bypass users included less pollution, pleasant drive, good wayside amenities and lastly, safety.
L&T gave special emphasis to safety aspect of the road. Crash barriers were provided on the high embankment of the road, along with thermo plastic road markings. Traffic signals were erected at the junctions of Neelambur (Tamilnadu), Madukkarai (Kerala), Trichy Road (Tamilnadu), and Pollachi Road (Kerala). Speed breakers were erected at suitable locations on the major district roads crossing the bypass to regulate the speed of vehicles. Retro reflective signboards were also provided to illuminate junctions for better visibility at nights. L&T also set up trauma care with ambulance facility at the bypass.
Table I
Toll Charges for Using the Coimbatore Bypass Road
Type of Vehicle Toll Charged (Rs.)
Car, jeep & van 19
Light Commercial Vehicles 28
Heavy commercial vehicles 56
Multi-axle vehicles 84
Source: ICMR
The Indian Railways asked L&T to build a rail overbridge instead of a crossing for the bypass8. However, L&T successfully argued that it was not part of the original project. In order to recover the additional costs, an alternative funding method had to be selected to keep the fixed costs to be recovered from the project at low. Hence, with the consent of the state government, L&T decided to toll the old Athupalam Bridge, which did not come within the route of the bypass (Refer Table II).
Table II
Toll Charges for Using the Old Athupalam Bridge
Type of Vehicle Toll Charged (Rs.)
Car, jeep & van 5
Light Commercial Vehicles 15
Heavy commercial vehicles 15
Multi-axle vehicles 23
Source: ICMR
L&T also intended to provide necessary amenities for travelers such as petrol pumps, parking facilities, service stations, restaurants, drinking water facility, public telephone booths etc. The development of the real estate was to be taken up soon. Toll plazas of international standards were another attraction.
CHALLENGES
L&T faced problems with the tolling of the old Athupalam bridge, which did not
come within the route of the bypass. This bridge was an already existing facility being
used by the incoming traffic from Kerala to Tamilnadu. Transport operators had
initially refused to pay the tolls. The bulk users of the bridge including the state
transport corporations of Tamilnadu and Kerala had refused to pay the tolls.

395
The Coimbatore Bypass Road Project
The Tamilnadu state government too backtracked and sought concessional tariff for
state transport buses on the plea that the transport department was in the red. The
Tamilnadu government was willing to pay only Rs.50 per bus for making more than
three trips a day instead of the originally planned Rs.15 per bus per trip. L&T agreed
to the subsidized toll rate on the condition that the state government compensated the
revenue losses sustained by the company9.
The Coimbatore District Bus Owners Association (CDBOA) and the Lorry Owners Association refused to pay even the subsidized tariff. The CDBOA had even taken the issue to Madras10 High Court against the tariff but the Court directed the private operators to pay the toll charges. However, they refused to comply with the court’s orders.
Since December 1998, L&T was unable to collect the tolls from road users and this resulted in a loss of Rs.74.1 mn as of June 2000. This included Rs.11.4 mn due from the Tamilnadu government towards reimbursement of losses incurred out of the subsidized toll payment for the state transport buses.
N R Naramsimhan, GM (developmental projects)- L&T felt that unless the state government gave L&T powers to deal strictly with the non-payers, it would be impossible to recover the investment. He felt L&T might even request the state government to take over the project. L&T contemplated on invoking the force majeure clause11 and pulling out of the project. L&T was also under tremendous pressure from the financial institutions, which had lent money, to create additional securities. MoST had asked the state government to take a quick decision as a delay would have an adverse impact on other BOT projects in the state.
Questions for Discussion:
1. Discuss the implications of the state government’s poor support to the project, on the future investment in the concerned state? Give reasons.
2. What is the role of innovative financial instruments like takeout financing in the infrastructure sector?
© ICFAI Center for Management Research. All rights reserved.
8 As a policy decision, Indian Railways had upgraded the construction of railway crossings to rail overbridge.
9 About 230 buses made a minimum of 2,180 trips a day. L&T claimed that it would sustain a loss of Rs.20,000 per day on government vehicles alone.
10 Madras (renamed Chennai) is the capital of Tamil Nadu. 11 Force majeure is an event or accident beyond any person's control. It includes natural
disasters (or acts of God), mass acts of human agency, such as war and civil strife.

396
Financial Management
Additional Readings and References: 1. L&T arm to tap market sans corporate, Business Standard, December 15, 1997.
2. L&T inks two concessional deals for bridge projects, Business Standard, May 19, 1998.
3. SBI, IDFC in pact for infrastructure financing, The Hindu, September 16, 1998.
4. Raman T M A, L&T looking for partner to divest equity in Coimbatore bypass, October 22, 1998.
5. Rs.15 crore for Coimbatore road project disbursed, Business Standard, January 11, 1999.
6. Srikanth Sridevi, Coimbatore bypass users refuse to pay toll, Business Standard, March 2, 1999.
7. Shivkumar C, The Coimbatore bypass, Business Standard, September 13, 1999.
8. Raman T M A and Venkataraman Kavitha, L&T may pull out of Coimbatore bypass project, Financial Express, October 20, 1999.
9. Venkataraman Kavitha, L&T seeks power to regulate Athupalam bridge users, Financial Express, July 24, 2000.

Biotechnology in Cuba After the Cuban revolution in 1959, Cuba chose science and technology to foster economic development. In line with Fidel Castro’s vision to provide free health care to his people apart from developing an intellectual capital that could be finally converted into future tangible monetary benefits through trade and aid, Cuba pursued biotechnology to etch out a path for itself towards scientific excellence. Though haunted by the U.S.’s trade embargo, Cuba was committed to usher in an economic resurrection.
Cuba, the biggest island in the Caribbean, had been the economic colony of U.S.A. before it achieved its independence through the Cuban Revolution in 1959. Led by its leader, Fidel Castro (Castro), Cuba defended itself against the U.S. in 1961 in the historic Bay-of-Pigs invasion. In lines with Castro’s vision of a free Cuba with a strong scientific foundation, since early 1960s, Cuba had been fostering science and technology for its economic growth. Cuba chose Biotechnology to meet domestic health needs apart from developing an intellectual capital which could be finally converted into tangible monetary benefits through trade and aid. With the establishment of the ‘Centre for Genetic Engineering and Biotechnology’ (CIGB) in 1986, Cuba etched out a path for itself towards scientific excellence. Though haunted by the U.S.’s trade embargo, Cuba was committed to usher in an economic resurrection.
EMERGENCE OF BIOTECHNOLOGY IN CUBA
Even before the Cuban revolution, there had been a few renowned biomedical researchers in Cuba like Tomas Romay, Carlos J. Finlay, Felipe Poey and Pedro Kouri, but they lacked government sponsorship that impeded major scientific developments in Cuba. In 1959, Cuba had a per capita of $ 91.25.1 Besides, 36%2 of the population suffered from intestinal parasites and 14%3 had tuberculosis. Cuba also had a high illiteracy rate of 43%4. Castro pledged that every citizen of Cuba would have access to free health care and enshrined it under the Article 49 of the new Cuban constitution.5 He said, “Cuba’s future must, by necessity, be a future of scientist.”6 In 1961, the then existing ‘Cuban Academy of Sciences’ (founded in 1861) was reorganized and 13 institutes were established under the Cuban Ministry of Health. Within a few years, the ‘Cuban Institute for Research on Sugarcane Derivatives’ (ICIDCA), the ‘National Centre for Scientific Research’ (CNIC) and the ‘National Centre for Scientific Research’ (CENIC) were established. CENIC’s objective was to train scientists and groom them for research institutes, which were on the anvil.
In 1964, the U.S. imposed an embargo against Cuba that included food and medicine. The embargo threatened Cuba’s health care system. Cuba had to take the help of the erstwhile Soviet Union for pharmaceuticals and medical equipments. A major impetus was given to biotechnology as it was found to have great potential in improving public health through the development of new vaccines and improving crop and animal production. Further, it was opined that export of the biotechnology products to other countries would help in substantial foreign exchange earnings for Cuba.
1 Rayne, Trevor, “History of Cuban Revolution”, www.rcgfrfi.easynet.co.uk 2 ibid3 ibid4 ibid5Bourne, Peter, G., “ASKING THE RIGHT QUESTIONS: LESSONS FROM THE CUBAN
HEALTHCARE SYSTEM”, www.ukhen.org 6Fuente, Jose de la., “Wine into Vinegar – The fall of Cuba’s biotechnology”,
www.futurodecuba.org

400
Managerial Economics
In 1981, Cuba witnessed a serious epidemic of dengue fever. During the crisis, the meeting of the directors of all the research centres recalled Prof. Randolph Lee Clark’s (US Cancer specialist from the Anderson Hospital, Houston, Texas) suggestion about the use of ‘interferon’ (a protein produced naturally by the cells of our body that increases the resistance of surrounding cells against viral attacks) in combating viral infections. Subsequently, the success of ‘interferon’ in the treatment of dengue fever gave further impetus to research in Molecular Biology and Genetic Engineering in Cuba and gave rise to the ‘CIGB’ [Exhibit 1] in 1986 at a cost of $ 150 million7 .
THE SOVIET (DIS) CONNECTION
In 1961, after the historic Bay-of-Pigs invasion (when the U.S. imperialism was humiliated by the Cuban counterattack led by Fidel Castro, sabotaging the U.S. planned invasion of Cuba), the Cuban government geared up to increase the income levels and employment of the masses (by employing all agricultural workers on the state farms and co-operatives and converting small farmers into landowners), introduced land reforms and provided free access to education and health care to the entire population. The government also increased its control over the economy by nationalising private companies. This restructuring also involved nationalisation of $1billion8 worth U.S. - owned property in Cuba. This infuriated the U.S. government, which retaliated by imposing trade embargo against Cuba, leaving the country seeking for new markets for it’s sugar. In 1964, the erstwhile USSR lent a helping hand by signing a contract through which USSR bought sugar from Cuba at almost 5 times9
the market rate and gave oil in exchange to Cuba. Sugar was then the main export
7Cereijo, Manuel, “SUMMARY OF CUBA’s BIOTECHNOLOGY CAPACITY”,www.amigospais-guaracabuya.org
8“CSM: Biotech & Cuba”, www.nerage.org, April 21st 2003 (Yee, Chen May, “Cutting-edge biotech in old-world Cuba”, The Christian Science Monitor)9Warwick, Hugh, “Cuba’s Organic Revolution”, The Ecologist, Vol. 29, No.8, December 1999, (www.twnside.org.sg)
Exhibit 1
The Centre for Genetic Engineering and Biotechnology (CIGB)
The CIGB was the core of a network of institutions involved in biotechnology research and development. The other institutes under CIGB were:
The Centre for Molecular Immunology (CIM) – built at a cost of $ 10 million in 1994, focused on cancer and production of pharmaceuticals.
The National Biopreparations Centre – built at a cost of $ 15 million in 1992, focused on the production of Hepatitis B vaccines.
The Finlay Institute – named after the Cuban discoverer who discovered that mosquito was the carrier of the yellow fever virus. This institute focused on the production of meningococcal type B vaccine used for meningitis. It was built at a cost of $ 10 million.
The National Centre for the Production of Laboratory animals – focused on producing a variety of animals from mice to monkeys to be supplied to the various research centres.
Source: Prof. Ramkissoon, Harold, “SCIENCE & TECHNOLOGY IN CUBA”, www.cariscience.org and Cereijo, Manuel, “SUMMARY OF CUBA’s BIOTECHNOLOGY CAPACITY”, www.amigospais-guaracabuya.org

401
Biotechnology in Cuba
product of Cuba and for 30 long years (1959 – 1989), 85%10 of Cuba’s sugar trade was only with the USSR.
In 1972, Cuba became a member of the ‘East European Council for Mutual Economic Assistance’ (Camecon). This integration of the Cuban economy with the Camecon’s five-year production allocation plans led to a changeover to a centrally planned economy in Cuba.
In 1989, the Soviet Union’s disintegration led to the collapse of the Cuban economy. Between 1989 and 1993, Cuba’s GDP fell by 35%.11 Oil imports from Russia fell from thirteen million tons in 1989 to less than seven million tons in 1993.12 The Cuban economic downslide was further worsened by the U.S. embargo.
Instead of succumbing to the crisis, Cuba pulled up its sleeves to restructure its economy. Cuba chose Biotechnology, tourism and sugar as the major sectors for priority investments. Through biotechnology, Cuba decided to produce substitutes for food and agricultural imports, create new export products like biomedicines and support the National Food Programme (NFP)[Exhibit 2]. In the health sector, Cuba exported biomedical products like the meningitis B vaccine and exported it under the brand name VAMENGOCBC13 mainly to Latin American and Caribbean countries in the late 1980s. This vaccine, being administered in Cuba since 1986, led to 97%14
10 ibid11 Gordon, Joy, “Cuba’s Entrepreneurial Socialism”, www.theatlantic.com, January 1997 12 ibid13Elderhorst, Miriam, “Will Cuba’s Biotechnology Capacity Survive the Socioeconomic
Crisis?”, www.biotech-monitor.nl, September 20th 1994 14 ibid
Exhibit 2
Biotechnology and the National Food Programme (early 1990s)
• The enhancement of food production and the nutritional value of food – Cuba faced the dilemma of enhancing food production without reducing the level of sugar production, which was still the main source of foreign currency. Therefore, research was carried out to increase agricultural yields per year, production per yield and resistance of sugar cane and food crops to environmental stress (drought and salt). As a result, new varieties of sugar cane, bananas, potatoes, tomatoes, cassava and soya beans were developed through somaclonal1 variation. Besides, mass micropropogation of disease free plant material of bananas, sugar cane (total production of 6 million plantlets in 1990), pineapple, potato and tobacco was also undertaken. Further, genetic engineering was used for the enhancement of production of sugar cane, rice, tomatoes, fruits and potatoes.
The industrial production of Single Cell Proteins (SCP) from molasses, a sugar cane by-product was also carried out. The SCP’s utility as a human feed (which till then was used as animal feed) was found to enhance the nutritional value of the diet and to possibly substitute the import of soya beans and fishmeal.
• The production of biological fertilizers, herbicides, and pesticides – To substitute imported chemicals, an integrated programme on biological pest control was launched. By the end of 1991, about 56% of the cultivated area was protected by indigenously produced biopesticides. In addition, one tone of ‘micorrhiza’, a biological fertilizer was produced in 1991.
Source: Elderhorst, Miriam, “Will Cuba’s Biotechnology Capacity Survive the
Socioeconomic Crisis?”, www.biotech-monitor.nl, September 20th 1994

402
Managerial Economics
immunization of the Cuban children and adults who were vaccinated. The VAMENGOCBC, apart from being registered in Brazil, Uruguay, Bolivia, Paraguay and Nicaragua, soon entered the Asiatic, European and African markets. In 1989, Brazil signed an export contract with Cuba for eight million doses of the vaccine worth $ 80 million.15
Early 1990s
With the collapse of the USSR, Cuba’s public health financing was drastically reduced from $250 million16 a year in late 1980s to $65 million17 in the early 1990s. The U.S. embargo further worsened the situation and restricted Cuba from purchasing medicines from the U.S. Cuba implemented a programme for import substitution and domestic production of drugs encompassing 42218 pharmaceutical products with an investment of $75 million.19
In 1991, ‘Heber Biotec S.A.’ was established to market around 16020 products of
CIGB. Some of these products (available in over 5021 countries worldwide) included
- hepatitis B vaccine, human alpha interferon, certain enzymes, diagnostic kits
including one for HIV and a cattle tick vaccine (by 1998, Heber Biotec S.A. achieved
a sales figure of $290 million22 a year). Cuba invested $ 1 billion23 in the early 1990s
to establish a centralised version of the Silicon Valley24, the ‘Western Havana
Scientific Pole’.25
In 1992, the U.S. government further strangled the Cuban economy through its ‘U.S.
Cuban Democracy Act’26 . This act extended the embargo to encompass all exports to
Cuba that could aid development of biotechnology. Under such circumstances, the
Cuban government decided that tourism and not biotechnology was the way to rapidly
acquire foreign exchange. This diminished the commitment towards biotechnology,
thus widening the gap between Cuba and other industrialised nations. Further, in an
attempt to curb the potential exodus of researchers, Cuban government stopped them
from attending scientific meetings and joint projects – which were once the success
factors of Cuban biotechnological development. Biotechnology by then had become
less attractive with the students no longer willing to work in the biomedical centres.
The mid and late 1990s
The crisis situation in Cuba in the early 1990s revealed the deficiencies of a centrally planned economy - the investments made in a particular sector were at the expense of
15 ibid16Aitsiselmi, Amina, “DESPITE U.S. EMBARGO, CUBAN BIOTECH BOOMS”,
http://gndp.cigb.edu.cu, NACLA Report on the Americas, Mar/Apr2002, Vol. 35 Issue 517 ibid18 ibid19 ibid20 Prof. Ramkissoon, Harold, “SCIENCE & TECHNOLOGY IN CUBA TODAY”,
www.cariscience.org 21 ibid22 Fineman, Mark, “Little-known biotech industry vital to Cuba’s economic future”,
www.fiu.edu, August 14th 1998 23 “CSM: Biotech & Cuba”, www.nerage.org, April 21st 2003 (Yee, Chen May, “Cutting-edge
biotech in old-world Cuba”, The Christian Science Monitor)24 A region in California south of San Francisco that is noted for its concentration of high-
technology industries 25 The most important region of Cuban biotechnology that comprises of 52 scientific institutions
where nearly 4,000 scientists and engineers simultaneously work on more than 100 ongoing research projects.
26 Elderhorst, Miriam, “Will Cuba’s Biotechnology Capacity Survive the Socioeconomic Crisis?”, www.biotech-monitor.nl, September 20th 1994

403
Biotechnology in Cuba
the other sectors. As the investment in biotechnology dropped, the biotechnology centres had to make their own investments. This reduced amenities at the work place due to shortage of funds leading to reduced motivation levels among the employees. Moreover, bureaucracy at the administrative level leading to inflexibility was impeding activities like up-scaling of production and commercialisation of biotechnology products.
However, in the mid 1990s, due to foreign currency crunch, as Cuba was forced to reduce its imports, it renewed its focus on the use of biotechnology in agriculture and health. Meanwhile, the Cuban government, realising the shortcomings of a centrally planned economy, had introduced elements of ‘mixed economy’ like the replacement of state-run farms by co-operatives managed by workers, legalising foreign investments, Cuban corporations and joint ventures.
In 1996, the U.S. government under president Bill Clinton, passed the ‘Helms-Burton bill’, which permitted lawsuits that could be filed in the U.S. against foreign companies that made use of any property of the American corporates in Cuba that had been confiscated by the Cuban government following the Cuban revolution. Further, the bill denied the U.S. entry visas to executives of foreign companies doing business in Cuba. Cuba was unperturbed by these legislations and there were also no cases of companies pulling out of Cuba. GDP of Cuba for the first half of 1996, on the contrary, grew by 9.6%.27
By mid 1990s, CIGB came to be known as one of the few research and production facilities that used recombinant DNA (Deoxyribo Nucleic Acid) methods in the production of vaccines. Breakthroughs in biotechnology were achieved through production of recombinant vaccine for hepatitis B, recombinant streptokinase (anti-coagulant for breaking up blood clots in heart attack victims) and erg3mab (an anti-cancer drug that revolutionised cancer treatment). Cuba also produced the world’s first recombinant meningitis B vaccine28 apart from developing the easy use kit for the detection of HIV-AIDS and hepatitis. These breakthroughs attracted sufficient attention worldwide in late 1990s, leading to the signing of licensing agreements by Smith-Kline Beecham PLC for vaccine against meningitis B and Canada’s York Medical for marketing Cuban biotechnology products in the West. In 2000, the World Health Organisation approved Cuba’s hepatitis B vaccine for the use in the United Nations vaccination campaign.
By the turn of the 21st century, Cuba was spending almost 1.15%29 of its GNP (Gross National Product) on scientific research and development, and started producing vaccine for Haemophilus influenzae type B (Hib) bacteria that caused meningitis, pneumonia and, otitis (inflammation or infection of the ear) in children. Branded as Quimi-Hib30, the vaccine was expected to help Cuba save $ 2-3 million31 per year on its National Vaccine Programme. Cuba by 2003 was earning $100 million32 a year from its total pharmaceutical and biotechnology exports. In late 2003, CIGB announced its landmark discovery on the life cycle of hepatitis C virus, which gave better understanding of the host-virus interaction at the cellular level. Cuba also looked forward to corporate partnership for product development based on this discovery to speedup the project.
27 Gordon, Joy, “Cuba’s Entrepreneurial Socialism”, www.theatlantic.com, January 1997 28 Wheeler, Tim, “Cuba takes lead in genetic engineering, biotechnology”, www.hartford-
hwp.com, December 14th 1996 29 Fidler, Richard, “Development within Underdevelopment?”, http://archives.econ.utah.edu,
May 16th 2002 30 Riera, Lilliam, “Production underway on Cuban vaccine against meningitis, pneumonia and
otitis”, www.granma.cu, November 26th 2003 31 ibid32 “CSM: Biotech & Cuba”, www.nerage.org, April 21st 2003 (Yee, Chen May, “Cutting-edge
biotech in old-world Cuba”, The Christian Science Monitor)

404
Managerial Economics
A CHALLENGING INITIATIVE
Cuba’s road to its success in biotechnology had been quiet demanding. A more than
four decades long U.S. imposed embargo, amended at various points of time only to
make it stricter had crippled the Cuban economy. The estimated cost of the economic
blockade in 1998 was $ 800 million33 and the total cost of the blockade along with the
economic damage caused till 2003 (from 1960) was $ 181 billion.34 Moreover the
market for biomedical products was controlled by the transnational companies
belonging to the developed countries. These companies had the experience,
economies of scale, worldwide marketing, and distribution, which Cuba lacked.
Moreover the Cuban biotechnology was believed to be thriving on the development of
knock-off versions of already patented drugs.35
Cuba asserted in the ‘Biotechnology Havana’ 200336 (a conference held every year by
CIGB) that the country enforced international protocols like the World Trade
Organisation’s Trade-related Aspects of Intellectual Property Rights agreements. By
2003, CIGB held more than 3037 patents in various research areas like new vaccines
and adjuvant (a substance that is used in a vaccine to improve the immune response so
that less vaccine is needed to produce a non-specific stimulator of the immune
response), therapeutic recombinant (a combination) proteins and peptides, molecular
vaccines, therapeutic monoclonal antibody38 and diagnostic systems.
Cuba’s advanced biological and chemical research activities came under keen
observation of the international community especially after the September 11 terrorist
attacks on the U.S. in 2001. The U.S. State Department undersecretary for arms
control, John Bolton, alleged, “Cuba has at least a limited offensive biological warfare
research and development.”39 Cuba vehemently denied the charges calling it a
‘sinister’40 political move.
In spite of all the external adverse conditions that restricted the purchase of
technology and the marketing of their products, Cubans had been proud of their
achievements in the field of science and technology.41 Tracey Eaton said, “It was
Cuba’s $ 1 billion gamble – to train an army of scientists, develop a sprawling biotech
industry and tackle every affliction from cancer to AIDS. Since the 1990, Cuban
scientists have developed dozens of new treatments and drugs, including the world’s
only vaccine against meningitis B.”42 As observed by Richard Fidler, Cuba achieved
“development within underdevelopment”43 by creating a biotechnological
infrastructure that apart from catering to the country’s domestic requirements also
made it big in the international market [Annexure 1].
© IBS Case Development Center. All rights reserved.
33 Spencer, Neville, “Introduction: Cuba as alternative”, www.dsp.org.au, 2003 34 ibid35 “Truly revolutionary”, The Economist, November 27th 2003, Page: 64 36 “Truly revolutionary”, The Economist, November 27th 2003, Page: 64 37 “CIGB – HEBER PROFILE 2003”, http://gndp.cigb.edu.cu 38 An antibody that recognizes only one type of antigen (foreign particle). 39 Padgett, Tim, and Mascarenas, Dolly, “Inside Cuban ‘Bioterrorism”, www.time.com, May
14th 2002 40 ibid41Prof. Ramkissoon, Harold, “SCIENCE & TECHNOLOGY IN CUBA TODAY”,
www.cariscience.org 42 Eaton, Tracey, “Cuba wins big payoff on biotech bet”, www.miami.com, November 21st
200343 Fidler, Richard, “Development within Underdevelopment”, http:// archives.econ.utah.edu,
May 16th 2002

405
Biotechnology in Cuba
Annexure 1 Leading products of CIGB, Cuba
Drug Brand Name
Hepatitis B Vaccine
Recombinant alpha 2b Interferon
Recombinant Streptokinase
Interferon gamma
Epidermal Growth Factor
Recombinant GSCF
Vaccine for the control of cattle tick
HEBERVIOCAC-HB®
HEBERON ALPHA R®
HEBERKINASE®
HEBERON GAMMA®
HEBERMIN®
Hebervital
GAVAC®
Compiled by: IBS-CDC

Microsoft’s Entry into Antivirus Industry In September 2003, Microsoft entered the antivirus industry by acquiring anti-virus solution provider GeCAD. This move by Microsoft left many analysts speculating about the future of antivirus (AV) industry, given that, throughout its history Microsoft had dominated every software market it entered.
This case discusses about the events, which prompted Microsoft to enter into the AV market and also likely impact of its entry on the AV industry. This case also discusses how Microsoft 's entry into antivirus market was perceived as a threat to LINUX.
“All the major anti-virus players that get majority of their revenues from selling desktops and enterprise anti-virus solutions will be directly competing with Microsoft. This will force anti-virus vendors to diversify or die”1 - Ray Lewis, general manager at digital security company ‘Aladdin Knowledge System’
INTRODUCTION
Microsoft’s products worldwide had been a prime target to a series of computer
viruses2 and worms3 [Annexure 1], since mid 1990s. The security flaws [Annexure 2]
in Microsoft’s products provided an opportunity to hackers4 to access and tamper
vital information stored in the computers. On July 9, 2001, a computer worm known
as ‘Code Red’ affected 250,000 computers5 worldwide in just nine hours of its
release. Code Red exploited the security vulnerability in Microsoft’s ‘web server
software6’ to spread across the world and caused disruption of e-commerce and
personal operations like e-mail. By 2003, it was widely believed that Microsoft’s
products, which enjoyed a monopoly in desktop operating systems7 (97.46% of world
market)8, web browsers9 (95%) and office productivity software10 (90%) were the
favorite targets for virus writers. As a decisive step towards protecting its virus-
battered reputation, Microsoft, in September 2003, acquired antivirus (AV)
technology from a little-known Romanian firm ‘GeCAD Software’. Reacting to
Microsoft’s move, the global AV industry raised concerns saying that through out its
history Microsoft was infamous for its bundling tactics (combining new products with
its windows operating system) to thwart competitors. AV industry feared that
Microsoft might use the same tactic to monopolize the AV market there by rendering
other AV products obsolete.
1 Leyden John, “On MS, AV and Addictive Updates”, www.theregister.co.uk, June 13, 2003 2 It is a small piece of software that resides in a real program. Each time the program runs, the
virus runs, too, thereby affecting other programs. 3 It is a piece of code that uses networks and security holes to replicate itself! 4 A programmer who uses his skills to break illegally into other computers is called a hacker. 5 http://www.uksecurityonline.com/threat/worms.php 6 A server process running at a web site, which sends out web pages in response to HTTP,
requests from remote browsers. 7 Operating System is the software that manages the computer memory, disc storage and
processor. It also manages the computer display, printers and other devices. 8 “Microsoft’s Internet Explorer global market share is 95% according to OneStat.com”,
www.Onestat.com, December 16, 2002 9 A software application that allows to browse the Internet. E.g. Internet Explorer! 10 Software such as word, excel, PowerPoint are included in Office Productivity Software!

407
Microsoft’s Entry into Antivirus Industry
MICROSOFT’S SECURITY INITIATIVES
“In the past, we’ve made our software and services more compelling for users by
adding new features and functionality and by making our platform richly extensible.
We’ve done a terrific job at that, but all those great features won’t matter unless
customers trust our software. So now, when we face a choice between adding features
and resolving security issues, we need to choose security. Our products should
emphasize security right out of the box”11, said Bill Gates (Gates), Chairman of
Microsoft. On January 15, 2002, Gates launched a “Trustworthy Computing” (TC)
campaign as a part of improving product security. As a part of this campaign, more
than 8,500 Microsoft programmers conducted a thorough security check on its new
product ‘Windows Server 2003’. Microsoft ended up spending $200 million12 on
beefing up security for ‘Windows Server 2003’ alone. In March 2002, the company
set up ‘Security Business Unit’. This unit was responsible for training developers to
write secure codes and to create and enforce security goals for Windows products. In
June 2002, Microsoft launched another campaign called ‘Palladium’ to create a
“trusted” computing system. This system required a security chip inside every PC
(which operated on Windows) to protect sensitive information and to stop the spread
of viruses. In 2002, Microsoft stopped development for two and half months to train
more than 9,000 of its developers to write more secure codes.
Microsoft issued security patches13, as an attempt to fix major security flaws that were identified in their products. It urged customers to update their systems by downloading the patches. It was believed that Microsoft’s strategy of patching Windows holes as they emerged, did not work. On January 25th 2003, a computer worm known as ‘SQL Slammer’ infected more than 90% of computers using ‘SQL Server’ in US, within 10 minutes of its release14. Six months prior to the ‘Slammer’ attack, Microsoft detected the flaw in SQL Server 2000 software that was exploited by ‘Slammer’ and issued a patch and also urged customers to download the patch in order to fix the flaw. In spite of that, ‘Slammer’ worm exploited the flaw and spread by infecting copies of SQL Server on computers that were accessible via the Internet. As a result of the ‘Slammer’ worm, in May 2003, Microsoft joined with AV vendors Network Associates Inc. and Trend Micro Inc. to form the ‘Virus Information Alliance’ (VIA) to provide information to users about virus threats to Microsoft products and services. VIA members regularly exchanged technical information on newly discovered viruses.
In spite of the security measures taken up by Microsoft, on August 11, 2003, a
computer worm known as ‘Blaster’ exploited a loophole in Microsoft’s Windows
Server 2003 (launched in April 2003) and spread through the Internet affecting
423,000 computers worldwide15. Blaster worm carried a hidden message for Gates:
“Billy gates why do you make this possible? Stop making money and fix your
software!”16. It was believed that ‘Blaster’ put more pressure on Microsoft to sharpen
focus on security. On September 3, 2003, Microsoft stated that it was acquiring AV
technology from ‘GeCAD’ as a part of its ‘TC’ campaign. Microsoft entered into the
11 Lemos Robert and Kane Margaret, “Gates: Security is top priority”, News.com.com, January 17, 2002
12 “Epidemic”, www.businessweek.com, September 8, 2003 13 Security patches are solution to the flaws that were detected in Microsoft’s products. 14 Broersma Matthew, “Slammer—the first ‘Warhol’ worm?” news.com.com, February 3, 2003 15 Acohido Byron, “Microsoft thwarts Blaster worm attack”, www.USATODAY.com, August
15, 2003 16 “Global virus attack crashes computers”, www.chalomumbai.com, August 13, 2003

408
Managerial Economics
$2.217 billion AV industry with this acquisition. GeCAD manufactured RAV
AntiVirus software, which was used for desktops, mail servers18 and file servers19.
Microsoft planned to develop its own AV product on the lines of the technology used
in RAV, but could not decide, whether it would bundle the AV technology in its
Windows operating system or not. Microsoft stated that its AV software would not be
for free rather it would be a subscription-based service. It was widely believed that
GeCADs acquisition by Microsoft not only signalled its desire to enter into the
security market but also a threat to big players in the AV market.
THREAT TO COMPETITORS
According to technology researcher, International Data Corp. (IDC), the worldwide
antivirus software market in 2002 was $2.2 billion20. IDC expected sales to rise to
$4.4 billion by 2007. In September 2003, when Microsoft entered the AV market,
Symantec, Network Associates International (NAI), Trend Micro, Computer
Associates International and Sophos were the five biggest AV manufacturers in the
world. Symantec (manufacturer of ‘Norton’ AV) was the leader with 37% market
share.
Microsoft’s entry into the AV industry elicited mixed reactions from its competitors.
While some companies felt that using AV technology alone was not sufficient for
Virus protection, others opined that additional security software such as intrusion
detection (ID)21, firewall22 and security management applications were also important,
where Microsoft lacked competency. Some rivals of Microsoft also stated that
Microsoft’s bundling of firewall with its ‘Windows XP’ version didn’t prevent
consumers from opting for AV products from other companies and there was no
reason to be apprehensive about Microsoft’s entry into the AV market. And also
Microsoft wasn’t new to the AV market. In 1994, it bundled AV software, known as
MSAV (Microsoft Antivirus), made by Central Point Software in its MS-DOS23 and
Windows 3.1 operating system. According to Graham Cluely (Cluely), a senior
technology consultant with AV firm Sophos, MSAV was a disastrous flop and
couldn’t detect viruses24. According to Cluely, “To do anti-virus is quite a different
discipline to producing other software. Developers can spend time developing dancing
paper clips but to combat viruses you have to be nimble and focused and the big
challenge for Microsoft will be whether they can respond quickly enough.”25 It was
widely believed that in case Microsoft did not bundle its AV software with its
operating system, it would just be another AV manufacturer without posing any threat
to the established players.
17 “Microsoft: A killer App That Could Kill the Competition” www.businessweek.com, September 29, 2003
18 A computer used to store and/or forward electronic mail. 19 A digital computer that provides workstations on a network with controlled access to shared
resources.20 “Which Antivirus Stock Is Safer?” www.businessweek.com, September 16, 2003 21 An ID system gathers and analyzes information from various areas within a computer or a
network to identify possible security breaches, which include both intrusions (attacks from outside the organization) and misuse (attacks from within the organization).
22 A firewall protects a computer network from unauthorized access. Firewalls may be hardware devices, software programs, or a combination of the two.
23 Microsoft Disk Operating System 24 Salkever Alex, “Microsoft, your PC’s Security Guard?” www.businessweek.com, August 14,
200325 “Microsoft to fight virus writers head on”, www.bbc.com, June 11, 2003

409
Microsoft’s Entry into Antivirus Industry
In spite of all these optimisms, many AV manufacturers were also worried about
Microsoft’s bundling tactics [Exhibit 1]. NAI warned its shareholders that Microsoft’s
entry into the AV industry could render their products obsolete. Symantec also warned
its investors that Microsoft’s including its AV product in its operating system might
decrease or delay the demand for certain of their products, including those currently
under development.26 After the acquisition, Microsoft announced that it would not
discourage customers from using AV software’s from other manufacturers. However,
share prices of some AV companies took a beating. Shares of Symantec rose only by
1.2%, Network Associates shares tumbled by 15.6%, WatchGuard Technologies27
shares dropped by 12%, and NetScreen Technologies was down by 3.1%28.
Microsoft’s acquisition of GeCAD not only posed a threat to AV industry but also ‘Linux’, which was a major competitor of Microsoft in the computer server market. According to IDC, Linux server market grew 35% compared to 10% of Microsoft, in 200329. GeCAD’s ‘RAV’ was platform independent i.e. it was used for computers running on both Windows and Linux operating system. GeCAD’s ‘RAV’ antivirus for Mail Servers supported a number of e-mail server products of Linux including the Sendmail, Qmail and Postfix. Andreas Marx, an antivirus software expert at the University of Magdeburg, Germany, who made a thorough examination of GeCAD’s antivirus software for Linux, concluded, “GeCAD is really the best antivirus solution for Linux. I don’t know why Microsoft bought a Linux company. GeCAD’s windows
26 “MS to Offer Antivirus Software”, www.wired.com, June 10, 2003 27 WatchGuard technology is a computer security provider. 28 Abramson Ronna, “Blaster Bounce Unravels in Microsoft’s Shadow”, www.thestreet.com,
August 19, 2003 29Newman Amy, “IDC Server Tracker Finds Server Market Still Slinking Along”,
www.serverwatch.com, June 2, 2003
Exhibit 1
Microsoft’s Anti-Competitive Tactics and the U.S. Anti-Trust Laws
In 1996, Microsoft bundled its Internet Explorer (IE) with Windows 95 version operating system to edge out the market leader ‘Netscape Navigator’ (Netscape) by monopolizing the global browser market. Netscape controlled 85%1 of the global browser market compared to only 4% of (IE). Microsoft distributed its bundled operating system to more than 2000 ISPs (Internet Service Provider) in the U.S like America Online (AOL), CompuServe and AT&T. By the end of 1997, Netscape’s share had fallen to 50%1. In 2002, IE’s market share was 95% compared to 3% of that of Netscape.
In 2001, Microsoft coupled ‘Windows Media Player 8.0’ (WMP) with its ‘Windows XP’ operating system to stifle ‘Real Networks’1 competition in the ‘Media Player’ market. As Microsoft bundled more applications into Windows, its competitors were forced to file antitrust cases against it. “Microsoft would simply prefer that there [were] no antitrust laws at all, [and] remarkably they have acted as if there [were] no such laws,”1 said Mike Pettit, President of Procomp.1 On April 3, 2000, U.S. District Judge Thomas Penfield Jackson ruled that Microsoft used its monopoly in personal computer operating systems to thwart competitors. Jackson in his 50-page judgment wrote, “Microsoft maintained its monopoly power by anticompetitive means and attempted to monopolize the Web browser market. Microsoft unlawfully bundled its Web browser to its operating system” which violated the Sherman Act.”1 [Annexure 3]
Compiled by ICFAI Business School Case Development Center

410
Managerial Economics
business is really small compared to their Linux business”30. As a part of the deal with GeCAD, Microsoft planned to stop the distribution of the RAV antivirus products after the acquisition. Analysts questioned Microsoft’s intentions of acquiring the AV technology, which provided leading virus-scanning tools for e-mail servers on Linux platforms.
Microsoft’s entry into the AV market was also seen as a move to target the security software products as a new growth opportunity. According to John Pescatore31, global information-technology security market for hardware, software and services was worth $17 billion in 200332. “Microsoft is likely to build out from the consumer and desktop end of the market. Content filtering, personals firewalls and privacy tools are like to follow soon, followed by Digital Rights Management products. Web services security will provide a second front by which Microsoft will expand into the security market, building on its .NET foundations.”33 said, Graham Titterington, an analyst at ‘Ovum’, the largest advisor on telecom, software and IT services in Europe.
Rob Rosenberger, chief editor of Vmyths.com, a premier website on information about viruses and antivirus industry, opined that Microsoft’s entry into the AV market would compel AV manufacturers to produce better products. He said, “Antivirus technology has stagnated for years under the cartel’s reign. Microsoft’s entry into ‘their’ turf could force them to market much better technology, strictly as a competitive move,”34. It was also believed that Microsoft acquiring little known ‘GeCAD’ rather than A-list AV vendors such as, Symantec or McAfee, wouldn’t rock the AV industry. And also if Microsoft had to compete with the rivals, it would have to change Windows in such a way as to render rival AV products useless.
Whatever might be the reasons, AV industry knew that Microsoft in the past had dominated whichever product category it had entered. Referring to the anticipated
30Evers Joris and Roberts Paul, “Microsoft to Kill popular Linux Antivirus product”, www.computerworld.com, June 12, 2003
31 John Pescatore is the research director at tech consultancy ‘Gartner’ 32 Salkever Alex, “Microsoft, Your PC’s Security Guard?” www.businessweek.com, August 14,
200333 Leyden John, “Microsoft enters AV market”, www.theregister.co.uk, June 11, 2003 34 Leyden John, “On MS, AV and Addictive Updates”, www.theregister.co.uk, June 13, 2003
Annexure 1
Notable Viruses Affecting Microsoft Products
Concept Virus: In 1996, a computer virus known as ‘Concept’ infected computers that were using Microsoft (MS) Word. It was the first ‘macro’ (A symbol, name, or key that represents a list of commands, actions, or keystrokes) virus to be discovered. Since MS word contained many macros, the virus was able to spread through the word documents.
Melissa Virus: On March 26, 1999, a macro virus known as ‘Melissa’ infected computers that used MS Outlook. It propagated in the form of an e-mail message containing an infected word document as an attachment. When the attachment was clicked, programs were created which replicated the e-mail, extracted the first fifty email addresses from the victims Microsoft Outlook address book and infected those systems where the mails were opened.
Nimda worm: In Sept. 2001 a computer virus known as “Nimda” affected more than 130,000 web server and PCs in US. This worm exploited the vulnerability in the Windows Internet connection security under Internet Explorer 5.0. It affected systems using Microsoft IIS (Internet
Information Server) running on Windows NT and Windows 2000 servers.
Compiled by ICFAI Business School Case Development Center

411
Microsoft’s Entry into Antivirus Industry
impact of Microsoft’s entry into the global AV arena, Gregory Stenstrom, CEO of Stenstrom Scientific, a security solution provider based in New Jersey, pointed out - “If I were them, I’d get into another business. You get a company like Microsoft in antivirus and it’ll put Trend Micro’s and Symantec’s lights out.”35
© IBS Case Development Center. All rights reserved.
35 Marcia Savage, “Microsoft’s Antivirus Move Rattles Security Industry”, www.internetweek.com, June 12, 2003
Annexure 2
Notable Security Loopholes in Microsoft’s Products
Microsoft FrontPage: In September 2002, Microsoft discovered a flaw in its Microsoft FrontPage1
Server Extensions, which allowed attackers to cause a Denial of Service (DoS)1 attack or crash the system. This bug affected Web sites that were created with FrontPage 1.1, FrontPage 97, FrontPage 98, FrontPage 2000 and FrontPage 2002.
Windows XP Operating System: In October 2001, California-based eEye Digital Security discovered a security flaw in the Windows XP Operating System. This flaw allowed hackers to take full control on any Windows XP computer on the Internet. The flaw was discovered in a feature called Universal Plug and Play1.
Windows 2000: In March 2003, Chris Paget of Next Generation Security Software Ltd, reported a security flaw in Windows 2000 which allowed hackers to control the Windows 2000 server. The flaw involved a potential buffer overrun in Windows Media Services that could cause a Windows 2000 server to fail and execute the hacker’s code.
Microsoft Passport Authentication System: In November 2001, Marc Slemko (Slemko), a Seattle based software programmer, discovered a security flaw in the Wallet -the Passport service that kept track of financial data used by e-commerce sites. Slemko demonstrated that, by sending a Hotmail user a specially crafted e-mail, he could get complete access to the reader’s financial data contained in Passport’s Wallet service stored on Microsoft’s servers.
Microsoft Internet Security and Acceleration Server 2000 (ISA Server): A scripting vulnerability in the ISA Server allowed attackers to execute code of their choice in order to access cookies and data belonging to the users using ISA server. ISA Server contained a number of HTML-based error pages that allow the server to respond to a client requesting a Web resource with a customized error.
Windows Media Services: A flaw due to the memory problem known as “Buffer Overflow”1
detected in the Windows Media Services for Windows 2000 Server, allowed attackers to release a malicious program onto the server running the software. Microsoft stated that this flaw affected Windows 2000 Server, Datacenter Server and Advanced Server.
Windows Media Player (WMP) 9: An ActiveX (ActiveX control provides a user interface that allows the user to take such actions as pausing or rewinding the media1) vulnerability was detected in the WMP 9, which allowed attackers to play or modify media files on the victims system without his knowledge.
Compiled by ICFAI Business School Case Development Center

412
Managerial Economics
Annexure 3 Sections 1 and 2 of Sherman’s Antitrust Laws
1 Sherman Act, 15 U.S.C. § 1 Trusts, etc., in restraint of trade illegal; penaltyEvery contract, combination in the form of trust or otherwise, or conspiracy, in restraint of trade or commerce among the several States, or with foreign nations, is declared to be illegal. Every person who shall make any contract or engage in any combination or conspiracy hereby declared to be illegal shall be deemed guilty of a felony, and, on conviction thereof, shall be punished by fine not exceeding $10,000,000 if a corporation, or, if any other person, $350,000, or by imprisonment not exceeding three years, or by both said punishments, in the discretion of the court.
2 Sherman Act, 15 U.S.C. § 2
Monopolizing trade a felony; penaltyEvery person who shall monopolize, or attempt to monopolize, or combine or conspire with any other person or persons, to monopolize any part of the trade or commerce among the several States, or with foreign nations, shall be deemed guilty of a felony, and, on conviction thereof, shall be punished by fine not exceeding $10,000,000 if a corporation, or, if any other person, $350,000, or by imprisonment not exceeding three years, or by both said punishments, in the discretion of the court.
Source: http://usgovinfo.about.com/library/weekly/blsherman.htm

Caribbean Sugar: Implications of European Connection
The history of sugar in the Caribbean can be traced back to the 17th century when the Dutch introduced sugarcane in these islands in the 1640s. Since then, the sugar industry had been the backbone of the Caribbean economies. In 1965, the Caribbean region, with its ten sugar exporting countries, had a peak annual sugar production of 1.4 million tons. However, in just thirty years, by 1995, the Caribbean sugar production had dropped to 0.8 million tons per annum and the region was left with only six sugar exporting countries.
The case discusses how excessive economic protectionism by the European nations led to inefficiencies in the Caribbean sugar industry and finally crippled the industry in the wake of globalization that did away with the protectionist policies.
The Caribbean region with ten sugar exporting countries, was among the top 10 exporters in the world till the mid 1960s and had peak annual sugar production of about 1.4 million tons in 19651. Thirty years later, in 1995, the region’s production had dropped to 0.8 million tons. By 2002, unmanageable costs and massive losses in the sugar industry, year after year, had left the Caribbean with only six sugar-exporting countries - Jamaica, Belize, Trinidad and Tobago, Barbados, Guyana and St.Kitts.
“Sugar is as important to the Caribbean economies as rice to Vietnam or oil to Saudi Arabia”2. For centuries, the sugar sector in form of foreign exchange earnings had been the backbone of the Caribbean countries [Annexure 1]. But by 2002, the Caribbean sugar exports had dropped to $261 million3 from $338 million4 in 1998-99, a natural outcome of the crisis being faced by the Caribbean sugar industry.
By 2002, Cuba (known as the “Sugar Bowl of the World”), due to financial crunch following the stoppage of aids from the erstwhile Soviet Union, had to shut down 70 of its 156 sugar mills5. Jamaican sugar production dropped to a 50-year low to 152,165 tons6 in 2002 –2003 as a result of the closure of most of its sugar factories following severe financial crunch. Trinidad’s state owned sugar company, Caroni, laid off all its employees7 in 2003 after witnessing years of perennial losses. The Caribbean sugar industry, whose roots can be traced back to the European colonization of the Caribbean islands (early 17th century to mid 20th century), had been confronted with formidable challenges.
THE COLONIAL PAST
The history of sugar in the Caribbean can be dated back to the 17th century. The Dutch, who already had colonies in the Caribbean, introduced sugar to these colonies
1 Thomas, Dr Clive,“How sweet it is: Sugar in the new trade order”, www.landofsixpeople.com May 12, 2002 (Stabroek News)
2Wilkenson, Bert, “Caribbean to fight Australia, Brazil Challenges to Sugar”, www.epawatch.nets, October 21, 2002
3 “Caribbean Sugar”, www.jusbiz.org, September 4, 2002 4Ahmed, Dr Belal, “The Impact of Globalization on the Caribbean Sugar and Banana
industries”,www.scsonline.freeserve.co.uk 5 Frank, Mark, “ Cuba says sugar crop smallest since 1930s”, www.gadcuba.org, ( Reuters July
7, 2003) 6 “Jamacian sugar production hits 50-year low”, www.cnn.com, (Reuters, August 9, 2003) 7 “The Caribbean sugar industry Sweet and Sour”, The Economist, August 30, 2003

414
Managerial Economics
in the 1640s8. Prior to this, the European colonies were predominantly involved in cotton and tobacco cultivation. The French, English and the Dutch, who depended on tobacco, eventually faced crisis, as they could not compete, either in quantity or quality, with the tobacco produced in the mid-Atlantic colonies9. So they switched to sugar as the tropical climate in the Caribbean favored sugar cultivation. This phase of economic growth in the Caribbean from the mid 17th century onwards was described as the ‘sugar revolutions’10. The huge demand for labor, for cultivation purposes, gave rise to the transatlantic slave trade11, particularly that of the Africans.
Apart from the climate, the abundant fertile land and the availability of forests that
provided fuel to the sugar factories, greatly enhanced sugar production in the region.
For example, production in Barbados increased from 7,000 tons in 1655 to 12,000
tons12 in 1700. Guadeloupe increased its sugar exports from 2,000 tons in 1674 to
10,000 tons13 by the early 18th century. As demand for sugar increased in Europe,
Europeans made sugarcane the major cash crop in the Caribbean Islands. By the early
20th century, sugar cultivation had become one of the most important economic
activities in the islands.
The Dutch, French and the English rulers supported the Caribbean sugar traders with
trade monopolies14 to withstand competition from Brazil15. This protectionism
continued even after independence from their colonial masters. [ Annexure 2].
POST INDEPENDENCE ERA (MID 20TH CENTURY ONWARDS)
After the Caribbean islands became independent, the European Community continued
to buy sugar from them at a preferential price16 with the help of some special
agreements [Annexure 3]. The two major agreements, namely, the ‘ACP-EU Sugar
Protocol’17 and the ‘Special Preferential Sugar’ (SPS) [Exhibit-1], signed during
the1970s and 80s, started accounting for 85% of the total sugar exports18 of the ACP
states. These agreements enabled the Caribbean countries to sell their sugar at a price
higher than that of the world market. Some Caribbean countries like Barbados,
Jamaica, Guyana and the Dominican Republic exported major part of their sugar to
Europe as per the agreements and then imported sugar for domestic consumption at
world market price.
8 “Caribbean islands”, www.memory.loc.gov 9 New York, New Jersey and Pennsylvania, which were under Dutch rule before the British
conquered them in 1664 10 A series of interrelated changes that altered the entire agriculture, demography, society, and
culture of the Caribbean, thereby transforming the political and economic importance of the region.
11 Galloway, J.H., “II.F.2.- Sugar”, www.meehawl.com 12 www.bell.lib.umn.edu/products/sugar.html 13 www.bell.lib.umn.edu/products/sugar.html 14 www.bell.lib.umn.edu/products/sugar.html 15 Sugar production had started in Brazil much earlier than in the Caribbean. Brazil continued
being the largest producer and exporter of sugar even after sugar production started in Caribbean Islands.
16 Galloway, J.H.,“II.F.2. - Sugar”, www.meehawl.com 17 An agreement for sugar trade between African, Caribbean and Pacific (ACP) countries and
the European Union ( EU) 18 Thomas, Dr Clive, “How sweet it is: Sugar in the new trade order”,
www.landofsixpeople.com May 12, 2002 (Stabroek News)

415
Caribbean Sugar: Implications of European Connection
Exhibit 1
ACP- EU Sugar Protocol
The Sugar Protocol, signed in 1975, was an indefinite period agreement between the Governments of European Union and the ACP Signatory States. The three main aspects of agreement were- agreed quantities, guaranteed prices and indefinite duration of the agreement.
Through this protocol, the European Union (EU) member states were to import agreed quantities of sugar every year from the ACP signatory states.
Contd…
Contd…
The guaranteed prices were negotiated annually between the EU and ACP signatory states. The prices received by the ACP states in form of the ‘Guaranteed Price’ was equal to what the European sugar producers used to receive19. As the European sugar producers received higher prices for their sugar than the world market price due to subsidies from their respective governments, the ACP states also received higher prices for their exports. For example, in 2002, the EU paid 21 cents per pound of cane sugar as compared to 6 cents20 of the world market.
The protocol was for an indefinite period. Economic or other difficulties in the European Union could not lead to any modifications in the indefinite nature of the protocol. The protocol provided protection to the Caribbean sugar industry from international competition.
Special Preference Sugar (SPS)
In 1986, when Portugal and Spain joined EU, the ACP states formulated a request to import sugar from them, to meet the raw sugar (Sugar which has not undergone the refinement process) deficit of the Portuguese refineries. In 1992, the European Economic Commission (EEC) came up with a proposal for the regulation on supplies to the Portuguese sugar refineries, which came to be known as the ‘non-paper’. The ‘non-paper’ introduced the idea of ‘Hierarchy of preference’ for purchasing raw sugar for EU’s refineries. According to this, the first preference was to be given to the domestic suppliers, next to the ACP states which were in the ACP-EU sugar protocol, followed by the third country suppliers like Cuba and Brazil and finally additional quantities, if required, again from the ACP states. The ‘non-paper’ also proposed that no third country supplier would receive any preferential price in case they supplied raw sugar to meet the deficits of the Portuguese sugar refineries. The proposals of the ‘non-paper’ were enacted as a new EU Legislation for purchasing raw sugar in 1995 and the raw sugar supplied under this agreement came to be known as SPS. This legislation formed the basis for EU to negotiate the minimum price with the ACP states for importing SPS. Like the Sugar Protocol, SPS was also between governments of the EU and the ACP states. The difference was that, unlike the ACP-EU sugar protocol, the SPS agreement was for a fixed six-year term.
Although the Caribbean countries exported 430,000 tons21 of sugar to Europe in 2002, they faced threats on certain fronts. The ‘Everything But Arms’ (EBA)22 initiative by many European nations coupled with Australia, Brazil and Thailand challenging the sugar protocol and the SPS, the Caribbean sugar industry anticipated it’s share in the European sugar markets to be under major threat.
19 “ACP sugar trade”,www.acpsugar.org/protocols 20 “WORLD TRADE NEWS”,www.wto.org, October 16, 2002 21 “WORLD TRADE NEWS”, www.wto.org, October 16, 2002 22 EBA provided 48 poorest countries with unrestricted access to the EU markets and the EU
would buy any product from these countries, except arms.

416
Managerial Economics
CRISIS IN THE CARIBBEAN SUGAR INDUSTRY
High cost of production that resulted in higher sugar prices vis-à-vis lower world
market price was an important factor for the crisis in the Caribbean sugar industry. For
three successive years (1995-1998), the average cost of sugar production in different
Caribbean countries varied widely. The average cost was 45 US cents per pound of
sugar in Trinidad and Tobago, 22 in Guyana, 39 in St.Kitts, 16 in Belize, 33 in
Jamaica and 35 in Barbados. In 1999-2000, the Caribbean sugar producers earned 22
cents per pound of sugar exported to EU against a weighted average cost of
production of 31 cents per pound. Except Belize (cost of sugar production per pound
being 16 cents), which made profits and Guyana (cost of sugar production per pound
being 22 cents), operating at break-even price, most of the Caribbean sugar producers
incurred losses.
Besides the high cost of sugar production, the Caribbean economies reeled in unique problems. In Trinidad and Tobago, falling yield per hectare, seasonal labor shortages, factory equipment problems and numerous cane fires hampered the production. Reduction in sugar quotas by the major importers like U.S.A and the EU was another problem. EU’s quota of sugar from Trinidad and Tobago reduced from 69,000 tons to 47,300 tons23 in 1985. By 1987, ISA (United States International Sugar Agreement) dropped its quota of imports from Trinidad and Tobago to just 6,504 tons24 (60% reduction from 1984). After facing such formidable circumstances for nearly two decades, ‘Caroni’, which controlled 90% of the sugar industry in Trinidad and Tobago, closed down in 2003. [Exhibit-2].
Exhibit 2
Government of Trinidad and Tobago purchased 51% share of ‘Caroni Sugar Company’ (Caroni) in 1971, from U.K based Tate and Lyle for $10 million25.Caroni was established by the British and had been a part of the economic prosperity of Trinidad and Tobago for over a hundred years. Caroni controlled over 90% of sugar industry in Trinidad and Tobago. Caroni’s productivity per worker was abysmally low. While competitors in Australia were able to cultivate 40 acres per worker and Haiti cultivated 80 acres per worker, Caroni cultivated only 5 acres per worker26. The cost of production at Caroni was naturally high given the other overhead expenses. The company’s cost of production was between TT$3,00027 to 5,000 a ton against a preferential selling price of TT$3,40028 in the European markets. The company went into perennial losses. In spite of the Trinidad and Tobago Government investing over $1 billion29 in writing off loans and debts in three decades since 1971,the company still faced sever financial crisis and the losses were mounting to unmanageable levels, the Government eventually closed Caroni in 2003.
Jamaica had been one of the highest producers of sugar in the Caribbean. In 1965, sugar production touched a record 512,000 tons30 with 12 sugar factories. But within
23 “Agriculture”, www.countrystudies.us/caribbean-islands 24 “Agriculture”, www.countrystudies.us/caribbean-islands 25 Kangal, Stephan, “Caroni is More Than Sugar”, www.trinidadandtobagonews.com, May 17,
200226 George, Alleyne, “Caroni and Globalisation”, www.trinidadandtobagonews.com, February
26, 2003 27 “TT$”, means Trinidad and Tobago Dollar 28 Shah, Raffique, “Anatomy of Crisis In The Sugar Industry” , www.trinicenter .com, February
16 2002 29 “Trinidad and Tobago shuts sugar firm”, www.bbc.co.uk, August 1, 2003 30 “Jamaican sugar production hits 50th-year low”, Reuters, September 8, 2003

417
Caribbean Sugar: Implications of European Connection
three decades, only two factories31 operated profitably. The rest suffered losses. For example, the ‘Hampden Sugar Factory’ (Hampden), had accumulated a loss of $458 million32 in the period 1997-2002. To revive the sick sugar industry33, the Jamaican Government wrote off debts of the sugarcane farmers to the tune of $540 million34 in 2002 and also offered $150 million for sugarcane re-plantation. Still, by the early 21st
century, four of the twelve factories had to be closed down. The latest closure was in November 2002 when the government of Jamaica announced the closure of Hampden. The Agriculture Minister of Jamaica, while announcing the closure, said, that Hampden required an investment of $400 million to just bring the machinery to working condition.
The Cuban sugar industry had half a million workers and another 1.5 million35 were indirectly dependent on it. It was one of the largest employers in the country. This vital industry of Cuba had been in doldrums since the collapse of the Soviet Union as the economic support to Havana from Moscow decreased36. In 1989-1990, Cuban sugar production touched its peak with 8.1 million tons37 and then declined rapidly due to the loss of the Soviet subsidies and markets. In the year 2001-2002, the Cuban sugar industry produced 3.6 million tons of sugar (which was the lowest since 1933) of which 2.9 million tons38 was exported. The fall in sugar exports together with the international low prices for sugar led to the closure of 70 of 156 sugar mills39 in Cuba. Cane cutting machines were sidelined due to lack of spare parts and lubricants. Workers were left without work. Sugar production further deteriorated in 2002-2003, with production between 2.2 million and 2.3 million tons.
In Guyana, although the sugar production in 2002 touched as high as 330,000 tons40,the future of the industry was uncertain. Guyana exported on an average 80% of its sugar41 to the European Union (EU) under the ACP-EU Sugar Protocol and the SPS. As these agreements were challenged by other sugar producing countries like Thailand, Australia and Brazil, Guyana’s sugar industry faced a tough challenge. On the occasion of consultations of European Community with Brazil and Australia, Guyana’s Foreign Trade Minister, Clamet Rohee, in a statement at WTO, urged, “In your deliberations and discussions, I ask you not to forget this dimension of the debate, not to forget that what is at stake is nothing short of economic collapse, loss of a nation’s lifeblood”.42
Apart from all these institutional problems, globalization and the WTO regulations were also on offer to these ailing Caribbean economies.
31 “Jamaican sugar production hits 50th-year low”, Reuters, September 8, 2003 32 Cummings, Mark, “300 to lose jobs at Hamped”, www.jamaicaobserver.com, July 22, 2003 33 “Government seeks $6-b loan for sugar industry”, May 28, 2003 34 Cummings, Mark, “300 to lose jobs at Hamped”, www.jamaicaobserver.com, July 22, 2003 35 Oramans, Joaquin, “ALTERNATIVES IN THE SUGAR INDUSTRY”, www.cubaminrex.cu 36 “Cuba- Sugar chief sacked”, www.bbc.co.uk, October 25, 2003 37 Frank, Mark, “Cuban sugar industry revamping starts poorly”, www.forbes.com, (Reuters
August 7, 2003) 38 Frank, Mark, “ Cuba says sugar crop smallest since 1930s”, www.gacuba.org, (Reuters July
7, 2003) 39 Frank, Mark, “ Cuba says sugar crop smallest since 1930s”, www.gacuba.org, (Reuters July
7, 2003) 40 “Guyana’s sugar industry has managed its economic constraints well-T&T Labour
Consultant”, www.sdnp.org.gy, August 27 , 2003 41 “Sugar Agreements”, www.guysuco.com 42 “Guyana faces economic ruin if EU sugar regime challenge succeeds- Rohee tells WTO
meeting in Geneva”, www.landofsixpeoples.com, (Stabroke News November 30, 2002)

418
Managerial Economics
THE IMPACT OF GLOBALIZATION
The 1990s witnessed some decisive changes in the global economy. The Uruguay round of talks under the ‘General Agreement on Tariffs and Trade’ (GATT) resulted in the formation of the ‘World Trade Organization’ (WTO). WTO spawned a global agricultural trade. Due to globalization of agriculture, there was a shift in agricultural production to those regions of the world, which were more competitive due to lesser-input costs. This posed tough challenges to the developing economies based on agriculture, including the Caribbean nations.
The limited size of the Caribbean countries denied them the economies of scale43 in sugar cane production. The unregulated foreign exchange markets of the Caribbean countries resulted in an increase in the prices of imported agricultural inputs like fertilizers, pesticides and irrigation equipments44 in turn increasing the cost of sugar production. The Caribbean governments provided subsidies to their farmers to overcome the high production costs but the WTO Regulations pushed the Caribbean farmers into danger by their proposal of reduction or elimination of subsidies. The high cost of sugar production, which the Caribbean countries could not bring down, made them vulnerable to the global competition. Besides this, the WTO regulations also opposed the special agreements through which the Caribbean countries enjoyed certain privileges from their EU partners.
David Jessop, Director of the Caribbean Council, observed, “Movement towards
reform of European agricultural policy carries with it an essential message for the
Caribbean. That is, time is running out for any Caribbean agricultural industry that
does not face up to the inevitability that preferential arrangements with Europe that
directly or indirectly support high prices are coming to an end and the region must
develop rapidly, plans to restructure its agricultural sector”.45
CARIBBEAN SUGAR INDUSTRY: THE OUTLOOK
In the face of disappearing economic boundaries due to globalization, Caribbean
countries had been trying different options to save their dwindling economies. After
intense market research, the ‘Guyana Sugar Corporation’ (GYSUCO), developed a
new variety of sugar called ‘Demerara Gold’, a superior quality sugar with golden
crystals. This new product to be traded internationally provided a ray of hope for the
Guyana sugar industry.
Cuba shifted its focus from sugar to tourism as the major growth area of the economy.
In 1990 more than 90% of the foreign exchange earnings46 of Cuba was from sugar
exports to Soviet Union, whereas in 2001, the major earnings came from tourism, $2
billion as compared to $ 441 million47 from sugar. A country known to be ‘the sugar
bowl of the world’ was inching away from sugar.
Jamaica appointed a ‘Parliamentary Joint Select Committee’ to recommend possible
ways to save its sugar industry. The Committee recommended an analysis of the
43 Ahmed, Dr Belal, “The Impact of Globalization on the Caribbean Sugar and Banana Industries”, www.scsonline.freeserve.co.uk
44 Ahmed, Dr Belal, “The Impact of Globalization on the Caribbean Sugar and Banana Industries”, www.scsonline.freeserve.co.uk
45 Jessop, David, “Preferential trade agreement with Europe coming to an end”, www.jamaicaobserver.com, June 29, 2003
46 Frank, Mark, “ Cuba economy flat as tourism booms and sugar crashes”, www.hawvanajournal.com
47 Tayler, Letta, “Cuban Sugar Shift Not So Sweet” , www.hermanos.org, September 30, 2002

419
Caribbean Sugar: Implications of European Connection
financial viabilities of independent farmers and the estates producing sugar. The
Committee also recommended urgent rehabilitation of the ‘Sugar Company of
Jamaica’ (SCJ) by restructuring the price support being given to the farmers, who
were its suppliers and the incorporation of these farmers and SCJ’s workers as equity
partners.
As Dr. Belal Ahmed, an Agronomist and a prominent researcher in Caribbean region
had aptly summed up the Caribbean sugar industry scenario, “Globalization has
demonstrated clearly that the Caribbean Sugar and Banana industries need to be more
competitive. This can be achieved to some degree only through raising efficiency and
productivity. For sugar cane this would involve identifying and establishing higher
yields with high cane: sugar varieties; more mechanization of operations; and overall
improved operations in the factory”48
© IBS Case Development Center. All rights reserved.
Annexure 1
Source: www.1uptravel.com/worldmaps/caribbean-island1.html
48 Ahmed, Dr Belal, “The Impact of Globalization on the Caribbean Sugar and Banana Industries”, www.scsonline.freeserve.co.uk

420
Managerial Economics
Annexure 2
Caribbean countries Past Colonial masters
Anguilla English
Antigua & Barbuda Spanish
British Virgin Islands English
The Bahamas English
Barbados English
Cayman Islands English
Cuba Spanish
Dominica English
Dominican Republic Spanish
Grenada English
Guadeloupe France
Guyana English
Haiti France
Jamaica Martinique English
Montserrat English
Netherlands Antilles Dutch
Puerto Rico Spanish
St Kitts & Nevis English
St Lucia English
St Martin France
St Vincent and the Grenadines English
Trinidad & Tobago English
Turks & Caicos Islands English
The Virgin Islands US
Source: www.bathnes.gov.uk
Annexure 3Commonwealth Sugar Agreement (CSA)
In 1919 a new regime of preferential tariff treatment was extended to sugar in the British Empire and the preference was fixed at 65.58 pounds per ton between 1925 and 1928. In 1928 duties were altered by the British Government to protect the British refineries against the import of refined sugar. In turn the British refiners agreed to buy Commonwealth sugar49 instead of foreign sugar50 and the benefit of the preferential tariff accrued to the commonwealth producer.
During and after the World War II, the British government used to buy the entire exportable surplus from the sugar industries of the Commonwealth countries. In 1948, discussions began for long-term agreements between United Kingdom and the Commonwealth countries. The British government wished to obtain assured supplies
49 Sugar produced in the countries that were under British rule. 50 Sugar produced in the countries that were not under British rule.

421
Caribbean Sugar: Implications of European Connection
of sugar for balance of payment reasons and to lift the rationing on sugar. Governments of the Commonwealth nations wanted to expand their sugar industries. As a result Commonwealth Sugar Agreement (CSA) was signed in 1951. Under CSA irreducible import quotas were established for Britain and a uniform commonwealth price for sugar came into being. In 1968 the concept of ‘indefinite duration’ was introduced in the CSA.
European Economic Community (EEC)
Six countries founded the EEC in 1952: Belgium, France, Germany, Italy, Luxembourg and the Netherlands. The EEC sugar markets were organized differently in each founding member state till a common organization for sugar was established in 1968.
Yaounde and Lome Conventions
In 1958, the EEC decided to grant financial aid to the countries and regions under their jurisdictions. The end of 1950s saw the development of mutual cooperation between African, Caribbean and Pacific countries, most of whom, in the early 1960s gained independence from their colonial masters and entered into association with EEC. This led to the signing of Yaounde convention between the Associated African and Malagasy States (AAMS) and the EEC. This convention was a major landmark initiating a five-yearly trade and aid agreements negotiated between EEC and the African countries, which were later on joined by the Caribbean and the Pacific countries.
In 1973 United Kingdom, Ireland and Denmark joined the EEC. Many other Commonwealth countries establishing links with the EEC followed this.
United Kingdom, which joined the EEC in 1974, had previously tabled a proposal that specific provisions should be made to allow it to import guaranteed quantities of sugar, at negotiated prices under CSA. On 1st February 1975 an agreement was made between the EEC and the ACP states on the new convention of Association (the Lome Convection). On 28th of February 1975, The ACP-EU Sugar Protocol, which had been negotiated separately, came into effect stalling the implementation of the Lome Convention. The ACP-EU Sugar Protocol incorporated the essential Guarantees of duration, remunerative prices and the export quotas, to the ACP countries, which the developing nations of the commonwealth had been struggling to retain for many years.
Source: “A Brief History of ACP Sugar from 1919 to 1974”, www.sugartraders.co.uk

Anglogold’s Growth Strategies ‘Anglogold Limited’ (Anglogold), with its headquarters in Johannesburg, South Africa, was formed in 1998 through the consolidation of the African gold mines of ‘Anglo American Plc’. In 2000, Anglogold forayed into marketing of its gold products like jewellery, by starting its online portal, ‘GoldAvenue’. Throughout its short history, Anglogold’s rapid growth has been characterised by mergers and acquisitions. With its announcement to merge with the Ghana-based ‘Ashanti Goldfields Company Ltd’ in 2003, Anglogold is poised to become number one in the global gold mining industry.
“We have taken incremental steps up the value chain. We need a gold
Microsoft…we need a presence near $10 billion to command fund managers’
interest.”
– Bobby Godsell, CEO, AngloGold Ltd.
Ever since its inception, AngloGold had been pursuing a growth strategy based
on mergers and acquisitions [Annexure 1]. Not content being just in the activity
of gold mining, AngloGold moved up the value chain to market gold products
(jewellery), to extract the maximum out of its gold. Although it failed to acquire
Australia’s Normandy, AngloGold still was committed to its strategy of
consolidation in the gold mining industry. In mid-2003, AngloGold announced its
merger with the ‘Ashanti Goldfields company ltd.’ of Ghana that was subjected to
the approval from the parliament of Ghana. This merger, when approved by the
parliament of Ghana, was expected to be one of the greatest achievements of
AngloGold, catapulting it to the number one position in the global gold industry.
ANGLOGOLD – A BRIEF HISTORY
In 1917, Sir Ernest Oppenheimer1 (Sir Ernest) established the ‘Anglo American Corporation’ (Anglo American) in South Africa to exploit the gold mining potential of East Rand in South Africa. It was started with an authorised capital of £1million,2 raised from the UK and the U.S. – hence the company name. With significant gold mining developments in the 1920s, Anglo American became the largest single shareholder in De Beers3 in 1926. Sir Ernest became the chairman of De Beers in 1929. In the 1930s, the company played a vital role in the establishment of industrial operations like ‘AECI’ (African Explosives and Chemical Industries), and ‘Boart Longyear Company’, a mining technology and drilling equipment company.
During the 1940s and 1950s, Anglo American developed the ‘Free State goldfields’ and the ‘Vaal Reefs mine’ in South Africa. The success of these mines put the company at the forefront of the gold mining industry. In 1957, the company gained the confidence to develop the ‘Western Deep Levels’4 in South Africa.
In 1961, for the first time Anglo American made its first major investment outside South Africa by acquiring stakes in the ‘Hudson Bay Mining and Smelting Company’ in Canada. In the mid-1960s, Anglo American made forays into steel,
1 German-born industrialist, financier, and one of the most successful leaders in the mining industry in South Africa and Rhodesia.
2 “Anglo American – A Brief History”, www.angloamerican.co.uk 3 World’s largest diamond miner and marketer with its headquarters at Kimberley, South
Africa.4 A gold-platinum minein the Witwatersrand Reef.
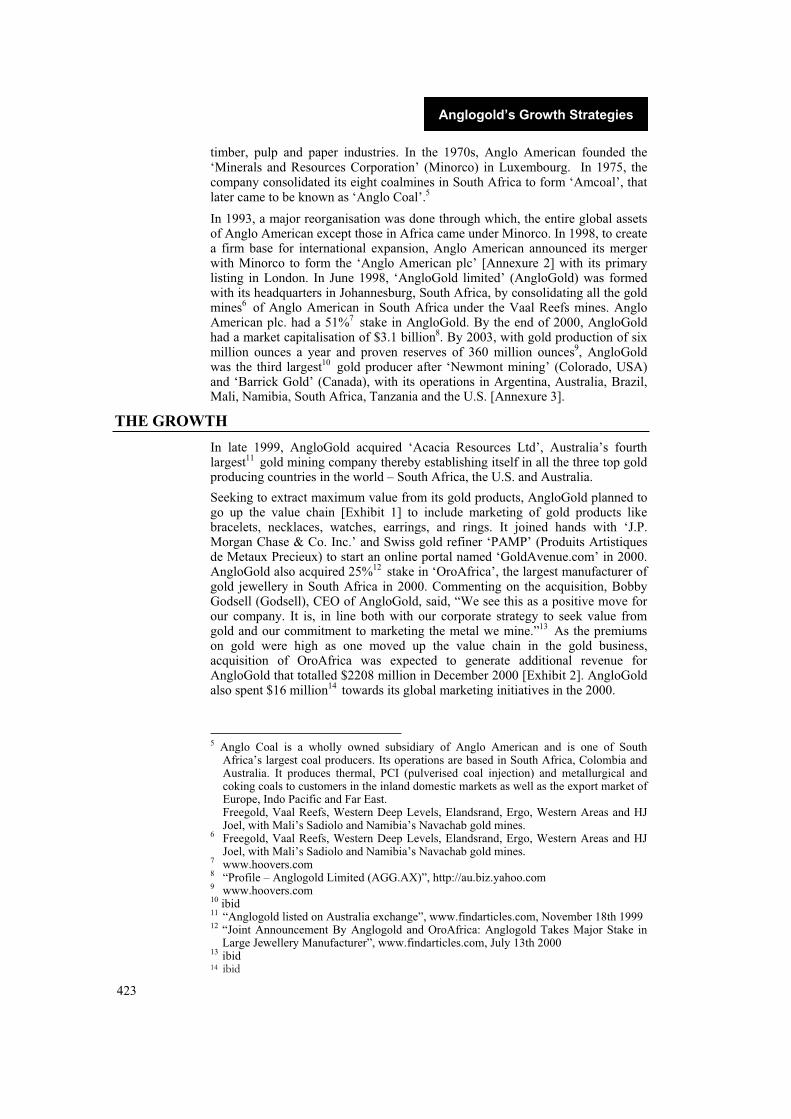
423
Anglogold’s Growth Strategies
timber, pulp and paper industries. In the 1970s, Anglo American founded the ‘Minerals and Resources Corporation’ (Minorco) in Luxembourg. In 1975, the company consolidated its eight coalmines in South Africa to form ‘Amcoal’, that later came to be known as ‘Anglo Coal’.5
In 1993, a major reorganisation was done through which, the entire global assets of Anglo American except those in Africa came under Minorco. In 1998, to create a firm base for international expansion, Anglo American announced its merger with Minorco to form the ‘Anglo American plc’ [Annexure 2] with its primary listing in London. In June 1998, ‘AngloGold limited’ (AngloGold) was formed with its headquarters in Johannesburg, South Africa, by consolidating all the gold mines6 of Anglo American in South Africa under the Vaal Reefs mines. Anglo American plc. had a 51%7 stake in AngloGold. By the end of 2000, AngloGold had a market capitalisation of $3.1 billion8. By 2003, with gold production of six million ounces a year and proven reserves of 360 million ounces9, AngloGold was the third largest10 gold producer after ‘Newmont mining’ (Colorado, USA) and ‘Barrick Gold’ (Canada), with its operations in Argentina, Australia, Brazil, Mali, Namibia, South Africa, Tanzania and the U.S. [Annexure 3].
THE GROWTH
In late 1999, AngloGold acquired ‘Acacia Resources Ltd’, Australia’s fourth largest11 gold mining company thereby establishing itself in all the three top gold producing countries in the world – South Africa, the U.S. and Australia.
Seeking to extract maximum value from its gold products, AngloGold planned to go up the value chain [Exhibit 1] to include marketing of gold products like bracelets, necklaces, watches, earrings, and rings. It joined hands with ‘J.P. Morgan Chase & Co. Inc.’ and Swiss gold refiner ‘PAMP’ (Produits Artistiques de Metaux Precieux) to start an online portal named ‘GoldAvenue.com’ in 2000. AngloGold also acquired 25%12 stake in ‘OroAfrica’, the largest manufacturer of gold jewellery in South Africa in 2000. Commenting on the acquisition, Bobby Godsell (Godsell), CEO of AngloGold, said, “We see this as a positive move for our company. It is, in line both with our corporate strategy to seek value from gold and our commitment to marketing the metal we mine.”13 As the premiums on gold were high as one moved up the value chain in the gold business, acquisition of OroAfrica was expected to generate additional revenue for AngloGold that totalled $2208 million in December 2000 [Exhibit 2]. AngloGold also spent $16 million14 towards its global marketing initiatives in the 2000.
5 Anglo Coal is a wholly owned subsidiary of Anglo American and is one of South Africa’s largest coal producers. Its operations are based in South Africa, Colombia and Australia. It produces thermal, PCI (pulverised coal injection) and metallurgical and coking coals to customers in the inland domestic markets as well as the export market of Europe, Indo Pacific and Far East.
Freegold, Vaal Reefs, Western Deep Levels, Elandsrand, Ergo, Western Areas and HJ Joel, with Mali’s Sadiolo and Namibia’s Navachab gold mines.
6 Freegold, Vaal Reefs, Western Deep Levels, Elandsrand, Ergo, Western Areas and HJ Joel, with Mali’s Sadiolo and Namibia’s Navachab gold mines.
7 www.hoovers.com 8 “Profile – Anglogold Limited (AGG.AX)”, http://au.biz.yahoo.com 9 www.hoovers.com 10 ibid 11 “Anglogold listed on Australia exchange”, www.findarticles.com, November 18th 1999 12 “Joint Announcement By Anglogold and OroAfrica: Anglogold Takes Major Stake in
Large Jewellery Manufacturer”, www.findarticles.com, July 13th 2000 13 ibid 14 ibid

424
Man
ag
eri
al E
co
no
mic
s
Exh
ibit
1
Min
ing
Val
ue C
hai
n
Lo
cate
Val
uat
eE
stab
lish
Min
eT
ran
spo
rtB
enef
icia
te
Mar
ket
D
ives
t
Def
init
ion
To
det
erm
ine
the
pre
sen
ce
of
a v
iab
le
min
eral
d
epo
sit
con
tain
ing
a
sale
able
pro
du
ct/s
.
Th
e d
eter
min
atio
n
of
the
pro
fita
bil
ity
o
f a
pro
ject
bas
ed
on
th
e id
enti
fied
min
eral
reso
urc
e.
Th
e p
lan
nin
g
and
ex
ecu
tio
n
of
a m
ine
pla
n.
To s
afel
y
rem
ov
e th
e m
iner
al
reso
urc
e co
nta
inin
gsa
leab
le
pro
du
ct/s
.
Th
e re
mo
val
o
f th
e m
ined
o
re
bo
dy
sto
ckp
ile
and
tr
ansp
ort
to
des
tin
atio
n.
Th
e o
pti
mal
ex
trac
tio
n o
f th
e sa
leab
le p
rod
uct
/s
and
saf
e d
isp
osa
l of
resi
du
es.
To
max
imiz
e p
rofi
t fr
om
th
e sa
le o
f th
e id
enti
fied
pro
du
ct/s
.
Cu
rtai
lmen
t o
f
op
erat
ion
s.
Inp
ut
Su
spec
ted
min
eral
dep
osi
t
Min
eral
res
ou
rce
mo
del
Ban
kab
le
feas
ibil
ity
Ex
po
sed
o
reb
od
y
con
tain
ing
min
eral
reso
urc
e
Qu
anti
fied
ore
bo
dy s
tock
pil
e
Qu
anti
fied
ore
bo
dy s
tock
pil
e
Sal
eab
le
pro
du
ct/s
.
Rev
enu
e an
d p
rofi
t
Ou
tpu
tM
iner
al
reso
urc
e
esti
mat
e
Ban
kab
le
feas
ibil
ity
Ore
bo
dy e
xp
ose
d
and
rea
dy
to
exp
loit
Qu
anti
fied
ore
bo
dy s
tock
pil
e
Sto
ckp
iled
ore
bo
dy
con
tain
ing
to
rmag
e
at a
ver
age
gra
de.
Sal
eab
le p
rod
uct
/s.
Rev
enu
e an
d
pro
fit
Ch
ang
e in
ec
on
om
ic
par
amet
ers
Par
tici
pan
ts
Geo
log
ical
exp
lora
tio
n
team
Geo
log
ical
team
an
d/
or
con
trac
tors
Des
ign
te
am,
con
stru
ctio
n
con
trac
tors
,
min
ing
Min
ing
tea
m o
r
con
trac
tors
Min
ing
tea
m o
r
con
trac
tor
Pla
nt
team
o
r o
per
atin
g
con
trac
tor
Mar
ket
ing
tea
m
Bo
ard
d
ecis
ion
, in
clu
din
gp
urc
has
er
of
the
asse
t b
ased
o
n
du
e d
ilig
ence
o
f
feas
ibil
ity
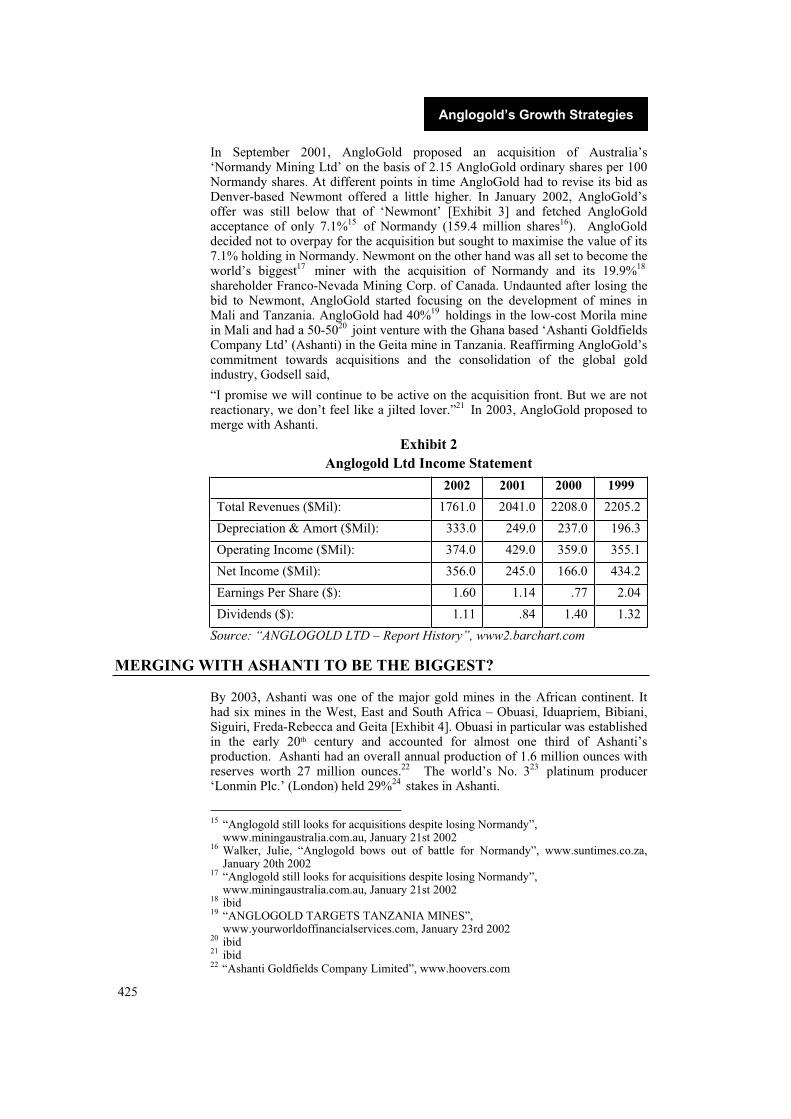
425
Anglogold’s Growth Strategies
In September 2001, AngloGold proposed an acquisition of Australia’s ‘Normandy Mining Ltd’ on the basis of 2.15 AngloGold ordinary shares per 100 Normandy shares. At different points in time AngloGold had to revise its bid as Denver-based Newmont offered a little higher. In January 2002, AngloGold’s offer was still below that of ‘Newmont’ [Exhibit 3] and fetched AngloGold acceptance of only 7.1%15 of Normandy (159.4 million shares16). AngloGold decided not to overpay for the acquisition but sought to maximise the value of its 7.1% holding in Normandy. Newmont on the other hand was all set to become the world’s biggest17 miner with the acquisition of Normandy and its 19.9%18
shareholder Franco-Nevada Mining Corp. of Canada. Undaunted after losing the bid to Newmont, AngloGold started focusing on the development of mines in Mali and Tanzania. AngloGold had 40%19 holdings in the low-cost Morila mine in Mali and had a 50-5020 joint venture with the Ghana based ‘Ashanti Goldfields Company Ltd’ (Ashanti) in the Geita mine in Tanzania. Reaffirming AngloGold’s commitment towards acquisitions and the consolidation of the global gold industry, Godsell said,
“I promise we will continue to be active on the acquisition front. But we are not reactionary, we don’t feel like a jilted lover.”21 In 2003, AngloGold proposed to merge with Ashanti.
Exhibit 2 Anglogold Ltd Income Statement
2002 2001 2000 1999
Total Revenues ($Mil): 1761.0 2041.0 2208.0 2205.2
Depreciation & Amort ($Mil): 333.0 249.0 237.0 196.3
Operating Income ($Mil): 374.0 429.0 359.0 355.1
Net Income ($Mil): 356.0 245.0 166.0 434.2
Earnings Per Share ($): 1.60 1.14 .77 2.04
Dividends ($): 1.11 .84 1.40 1.32
Source: “ANGLOGOLD LTD – Report History”, www2.barchart.com
MERGING WITH ASHANTI TO BE THE BIGGEST?
By 2003, Ashanti was one of the major gold mines in the African continent. It had six mines in the West, East and South Africa – Obuasi, Iduapriem, Bibiani, Siguiri, Freda-Rebecca and Geita [Exhibit 4]. Obuasi in particular was established in the early 20th century and accounted for almost one third of Ashanti’s production. Ashanti had an overall annual production of 1.6 million ounces with reserves worth 27 million ounces.22 The world’s No. 323 platinum producer ‘Lonmin Plc.’ (London) held 29%24 stakes in Ashanti.
15 “Anglogold still looks for acquisitions despite losing Normandy”, www.miningaustralia.com.au, January 21st 2002
16 Walker, Julie, “Anglogold bows out of battle for Normandy”, www.suntimes.co.za, January 20th 2002
17 “Anglogold still looks for acquisitions despite losing Normandy”, www.miningaustralia.com.au, January 21st 2002
18 ibid 19 “ANGLOGOLD TARGETS TANZANIA MINES”,
www.yourworldoffinancialservices.com, January 23rd 2002 20 ibid 21 ibid 22 “Ashanti Goldfields Company Limited”, www.hoovers.com

426
Managerial Economics
Exhibit 3
AngloGold Vs. Newmont Bids for Normandy (A$ NDY Implied Share Price by ANG & NEM Respectively)
Source: Best, Jonathan, “Cross boarder mergers & acquisitions”, www.gibs.co.za, May 29th 2002
May 2003, AngloGold announced its proposal for the $1.1 billion25 merger with
Ashanti on the basis of 2626 AngloGold shares for every 10027 Ashanti.
Subsequently, AngloGold entered into an agreement with the government of
Ghana for finalising the terms of the merger. The government, being a
shareholder of Ashanti (holding 17%28 of Ashanti’s shares) and the regulator, had
the power to veto the merger. ‘Lonmin plc’ also had the power to veto the
merger. Lonmin gave its support for the merger in August 2003, as it believed
that the merger would enhance the value of Lonmin’s investments in Ashanti.
With the approval of the government of Ghana, AngloGold expected the merger
to take effect from the first quarter of 2004. It was envisaged that the companies
when merged would boast an annual production of more than 7 million ounces
with a market capitalization of $11 billion.29 The combined group expected to
have an EBIT (earnings before interest and tax) of $1billion.30 AngloGold had
agreed to put in $570 million31 as capital expenditure for developing the massive
Obuasi mine of Ashanti in Ghana. It was expected that the combined company
would be better placed to hedge, given the reputation of AngloGold for hedging,
in the highly volatile market [Exhibit 5]. (Ashanti had a bad experience in 1999
when its plan to hedge against a low gold price went ‘disastrously wrong’32).
23 “Lonmin Plc”, www.hoovers.com 24 “Ashanti Goldfields Company Limited”, www.hoovers.com 25 “Anglogold, Ashanti in $1.1 bn merger”, http://business.iafrica.com, August 6th 2003 26 Bailey, Stewart, “Anglogold, Ashanti to create new number one”, www.mips1.net, May 15th
200327 Bailey, Stewart, “Anglogold, Ashanti to create new number one”, www.mips1.net, May 15th
200328 “Anglogold, Ashanti in $1.1 bn merger”, http://business.iafrica.com, August 6th 2003 29 “Mr Jonah goes to Jo’burg”, The Economist, January 17th 2004, pg. 56 30 “Mr Jonah goes to Jo’burg”, The Economist, January 17th 2004, pg. 56 31 “Anglogold, Ashanti in $1.1 bn merger”, http://business.iafrica.com, August 6th 2003 32 “Mr Jonah goes to Jo’burg”, The Economist, January 17th 2004, pg. 56

427
Anglogold’s Growth Strategies
Exhibit 4 Ashanti Gold Fields Company Ltd
(Mine wise production in 2003)
Obuasi Iduapriem Bibiani Siguiri Geita Freda-Rebecca
Production (ounces) 513,163 243,533 212,716 252,795 330,523 51,091
Cost per ounce ($) 217 240 216 279 170 268
Compiled by IBS-CDC from “Ashanti Goldfields Company Limited Preliminary Results for the Year Ended 31 December 2003”, http://biz.yahoo.com
Though the prospects of the merger looked bright, analysts were still skeptical about the approval from Ghana’s parliament. As John Mahama, spokesman for the main opposition party ‘National Democratic Congress’ said, “Parliament will not be a mere rubber stamp to the commitments that have been entered into with AngloGold. We will not be party to that”.33 As the AngloGold and Ashanti awaited the parliament’s decision, market observers looked expectant of the arrival of a new number one in the global gold industry.
Annexure 1
Timeline of Major Events1998 AngloGold Ltd formed by the merger of all the gold mines of Anglo
American plc.
1999 AngloGold Acquired Acacia Resources Ltd.
2000 An online portal ‘GoldAvenue’ formed for marketing gold products.
2000 African jewelley manufacturer, ‘OroAfrica’, was acquired.
2001 AngloGold proposed acquisition of Australia’s Normandy
2002 AngloGold withdrew the offer for Normandy as Newmont wins the bid.
2003 AngloGold proposed a merger with Ghana based Ashanti Goldfields
Company Ltd.
Exhibit 5
Trends in Gold Prices (1995-2003)
Source: www.kitco.com
33 Kwaku Sakyi-Addo “Anglogold-Ashanti deal may face opposition in Ghana”, www.forbes.com, December 12 203

428
Managerial Economics
Annexure 2Company Overview
Annexure 3
AngloGold’s Global Operations
Argentina AngloGold has 46.25% of a joint venture with Perez Companc S.A. and
the Santa Cruz Province on the Cerro Vanguardia gold mine located in
Santa Cruz.
Brazil AngloGold’s wholly owned subsidiary, Morro Velho is one of Brazil’s
largest gold producers. AngloGold also has 50% of the Serra Grande
joint venture with TVX Gold.
Mali AngloGold is involved in three mining operations in partnership with
other companies. Its second mining operation was acquired through a
40% purchase of Randgold Resources’ Morila Mine in July 2000.
AngloGold also has a 38% interest in the Sadiola Hill Gold Mine, with
Canadian IAMGold Corporation, the International Finance Corporation
and the Mali Government. Along with IAMGold and the Mali
Government, AngloGold has a 40% interest in the Yatela mine.
Namibia AngloGold solely owns and operates the Navachab Gold mine located in
central Namibia.
South Africa AngloGold is South Africa’s largest gold producer whose operations
consist of several wholly owned mining facilities situated in the Vaal
River, West Wits and East Rand areas.
Tanzania AngloGold purchased 50% of Ashanti Gold Fields’ Geita mine located
in the Lake Victoria Goldfields in late 1999.
U.S.A. AngloGold owns 67% of a joint venture with Golden Cycle Gold
Corporation on the Cripple Creek and Victor Gold Mines located
southwest of Colorado Springs in Colorado. The group also has a 70%
interest with Meridian Jerritt Canyon on the Jerritt Canyon Gold Mine
located near the town of Elko in Nevada.
Source: “Anglogold Ltd”, www.mbendi.co.za
© IBS Case Development Center. All rights reserved.
Anglo American Plc
Gold
51% Anglogold
Platinum
55% AngloPlatinum
Forest Products Mondi
Coal
Base Metal
Industrial Material
Tamac
Ferrous metals
Diamonds45% De Beers

Barbie Vs. Bratz: Competition In The Tween Girl Market
Barbie, introduced by toy-maker Mattel in 1959, has been the most popular fashion doll ever created. Barbie fascinated generations of little girls and Mattel has sold over a billion Barbies since 1959. However its undisputed leadership in the fashion doll market has been facing a challenge since January 2002 from Bratz, a rival fashion doll from MGA Entertainment. MGA Entertainment successfully marketed its Bratz to the tween girls, a marketing niche that Mattel has been struggling for years to target. The continued success of Bratz has been sending shockwaves through Mattel. In its 44-year history, Barbie has fought off many a rival. The case discusses the challenge from Bratz, the tween marketing niche, age compression and finally asks if Barbie can ward off the Bratz challenge and remain relevant to the tween girls.
“This is a very simple business to understand but not to manage. The difficult part is figuring out what items are going to generate that cash. Think about it: Our customers are zero to eight years old… can be very fickle. And unforgiving.”
– Robert A Eckert, CEO, Mattel Inc., on toy industry.1
Global toy industry was worth $60 billion as per 2003 estimates. The US toy industry accounted for one-third of the business. Mattel and Hasbro, two US toy makers were the world leaders in the toy business. Other top players included Bandai and Sanrio from Japan and Denmark’s LEGO2. American firms also dominated the global toy retail business. Ever since 1999, Wal-Mart has been the No.1 toy retailer followed by Toys “R” Us. Many toy retailers had both online and offline presence (e.g. toysrus.com). Traditional toys gradually yielded shelf space to newer robotic toys (e.g. Furreal Friends,3 a robotic puppy from Hasbro), chip-based interactive toys (MGA Entertainment’s Koby, the interactive bear4 for instance) and creative and educational toys (such as My First LeapPad Learning System5 from LeapFrog Enterprises).
US toy giant Mattel has been a world leader6 in design, manufacture and marketing of toys and family products (that included family-oriented entertainment products such as ‘Adventures with Barbie: Ocean Discovery’). Barbie the most popular fashion doll ever introduced7 was from Mattel. Till January 2002, Barbie enjoyed an undisputed leadership in fashion dolls. In January 2002 the ‘Bratz’, (Annexure 1) a doll from MGA Entertainment (Annexure 2) offered a challenge to Barbie. The Bratz doll line was limited compared to Barbie’s. Hence Barbie was in no danger of being eclipsed by Bratz. However MGA was planning to expand its Bratz line by adding lifestyle products (such as CD players, telephones and so on) consistent with the lifestyle of the Bratz dolls. The continued popularity of Bratz since January 2002 has been sending shock waves through Mattel. Barbie’s US sales fell by 2% in 2002. In the first quarter of 2003 Barbie sales dropped by 14%. According to market researcher NPD Group the overall doll category fell by 3% only during the first quarter of 2003. Barbie registered weak second quarter sales in 2003 (Annexure 3 & 4). It took Mattel more
1 “Mattel Recharges Its Batteries,” www.nyse.com, 2000. 2 “Toys And Games Industry Profile,” www.biz.yahoo.com, September 4, 2003. 3 “Furreal Friends Cat,” www.tigertoys.com, 2001. 4 “MGA Entertainment Introduces Koby, The Interactive Bear,” www.sensoryinc.com, 2000. 5 “My First LeapPad Learning System,” www.leapfrog.com, 2001-2003. 6 “Nickelodean Signs New Multi Year Licensing Contract,” www.shareholder.com, May 3,
2000.7 “Mattel Reports Second Quarter 2003 Financial Results,” www.shareholder.com, July 19,
2003.

430
Managerial Economics
than a year to launch a competitor to Bratz. It has become important for Mattel to prove that it could respond suitably to competition from upstarts such as Bratz. The platform for competition between Barbie and Bratz was the tween girl (8-14 year olds8) market. Mattel needed hot new toys that appealed to the tween girl. In its 44-year history Barbie has fought off many a rival. Can it do the same with Bratz?
THE US TOY INDUSTRY
It was estimated that on an average American families spent about $4009 per child each year on toys. The average for children outside the US was $34. Hence toy makers have been traditionally focusing on the US market. The US toy industry10 was reportedly worth US $20.3 billion in 2002. (See Table I )
Table I: The Size of The US Toy Industry
Year 1999 2000 2001 2002
Size of the US toy industry in billion $
19.8 20.4 20.5 20.3
Based on: www.toy-tia.org
The US had 60 million kids11 compared to 300 million in China. India had 400 million toy consumers. However Americans have been purchasing a staggering number of toys each year. For example 3.6 billion toys12 in the year 2000 alone.
Infant/pre-school toys, arts and crafts, models and accessories, building and construction sets, games and puzzles, learning and exploration toys and music and entertainment toys were the significant segments of the US toy market in 2002 (See Table II). In February 2003,13 the 100th Annual American International Toy Fair was held in New York City.
The US Toy Industry had humble beginnings in 1903.14 It was a year when America saw an entrepreneurial revolution. The first Ford vehicle was introduced. Harley-Davidson introduced its first motorcycle. The Wright Brothers flew the first motorized aircraft. The same year seven leading toy salesmen converged in Lower Manhattan's Broadway Central Hotel. Through their yeomen efforts these toy industry pioneers made New York the main marketplace for toys in the US. In 1903 an average American middle class family would spent less than $2015 on entertainment and recreation. In the beginning toys were imported for the most part. These were made of lead, wood, steel and porcelain. Later plastic was introduced. The arrival of plastic led to increased products that eventually expanded the toy industry. The rise of toy specialty stores throughout the US also contributed to the industry’s growth.
The Toy Industry Association, came into being in 1916.16 It was a New York City-based trade association of US producers and importers of toys, games and children's
8 “Monitor Tween’s Makeup,” www.caller2.com, April 15, 2001. 9 “Toys And Games Industry Profile,” www.biz.yahoo.com, September 4, 2003. 10 “US Toy Industry: Where It’s Been – Where It’s Heading,” www.toy-tia.org, February 12,
2003.11 “Toys And Games Industry Profile,” www.biz.yahoo.com, September 4, 2003. 12 Shah Anup, “Commercialisation of Childhood Itself, Festivals etc.,” www.globalissues.org,
May 1, 2003. 13 op.cit, “US Toy Industry: Where It's Been- Where It's Heading.” 14 “American International Toy Fair 100th Anniversary Celebration,” www.toy-tia.org, 2003. 15 ibid, “American International Toy Fair 100th Anniversary Celebration” 16 “About TIA,” www.toy-tia.org, 2003.

431
Barbie Vs. Bratz: Competition In The Tween Girl Market
entertainment products. It had over 30017 members who accounted for 85% of toy industry sales. The association has been managing the American International Toy Fair (popularly called 'Toy Fair'). A few dozen companies18 attended the first toy fair of 1903.
Table II: Significant Segments of the US Toy Market in 2002 Toy Segment Major Player (s) Top Selling
Brand(s) Business
Trends In The Segment
Infant/Preschool toys
LeapFrogEnterprises
LeapPad and LeapPad Books
Largest category in 2002
Over $2.8 billion in sales
Arts and Crafts Mattel Magna Doodle and Pixter
16% growth
Models and Accessories
Hasbro Zoids kit line Category that showed the biggest increase (26%) after being flat in previous years
Dolls and Accessories
MGA Entertainment
Bratz The second largest category with over $2.4 billion sales
Mattel Barbie Overall the segment was in decline
Fashion dolls held six of the top ten spots in the segment
MGA Entertainment's Bratz line held five of the top selling spots
Building and Construction Sets Segment
LEGO Bionicle Data not available
Games and Puzzles Segment
Konami Yu-Gi-Oh! The segment grew by 19.1%
17 ibid, “About TIA.” 18 “Hundred Years of Toy Fair Exhibitors,” www.toy-tia.org, 2002.

432
Managerial Economics
Learning and Exploration Segment
Data not available
Data not available
More than $370 million in sales
More companies were entering the segment
A category to watch out for in 2003
Music and EntertainmentSegment
KIDdesigns Inc.
Barbie Karaoke Machine
A growing segment
Based on: www.toy-tia.org
In 1925 there were 70019 exhibitors. More than 150020 toy manufacturers attended the 100th Anniversary celebrations of the Fair in February 2003.
MATTEL
Mattel’s vision21 has been to be The World’s Premier Toy Brands – Today and Tomorrow. It was launched in 1945 by Ruth and Elliot Handler and Harold ‘Matt’ Matson. In its early days Mattel operated out of a garage in Southern California. The earliest products were picture frames and dollhouse furniture. Mattel’s continued success with dollhouse furniture encouraged it to enter the toy business. Later in 1948, Mattel was incorporated with its headquarters in Hawthorne, California.
The company had its worldwide headquarters in El Segundo, California. Mattel (Annexure 5) has been selling its wares in over 150 nations, having 25,00022
employees. The company had its main manufacturing units in China, Indonesia, Italy, Malaysia and Thailand. Mattel also engaged independent contractors to make its products. Mattel’s largest customers were Wal-Mart, Toys “R” Us and Target. The three together accounted for 50% of Mattel’s consolidated net sales.
The toy giant signed license agreements with third parties. Such licenses allowed Mattel to use the trademark, character, or inventions of the licensor in its product lines. For instance in 1996 Mattel obtained a master toy license on Nickelodeon entertainment properties such as television programming services, Nickelodeon movies etc. Nickelodeon was a favorite television network with kids and the license allowed Mattel to market toys based on the Nickelodeon characters. Similarly in February 2000, it reached an agreement with Warner Bros. Worldwide Consumer Products for its Harry Potter toy line.
Mattel’s fashion doll Barbie appeared for the first time in 1959. ‘Barbie’ was the nickname of Ruth Handler’s daughter, Barbara. Cutout paper dolls fascinated Barbara. Her daughter’s fascination in turn inspired Ruth. She suggested making a three-dimensional doll through which “little girls could play out their dreams,”23
and Barbie was born. The Barbie doll line has expanded over the years (Annexure 6). It included a number of variations of the doll. Barbie has been taking different forms such as those of doctor, astronaut, firefighter, dentist, paleontologist and even Presidential candidate. Other interesting variations of the doll included Barbie with big hair,
19 “American International Toy Fair 100th Anniversary Celebration,” www.toy-tia.org, 2002. 20 ibid, “American International Toy Fair 100th Anniversary Celebration.” 21 www.mattel.com, 2003. 22 “Mattel Reports Second Quarter 2003 Financial Results,” www.shareholder.com, July 19,
2003.23 “Mattel History,” www.mattel.com, 2003.
433
Barbie Vs. Bratz: Competition In The Tween Girl Market
Barbie with a bendable body etc. Barbie led Mattel to the forefront of the toy industry and fascinated generations of young girls.24
Barbie started its television marketing in the 1960s.25 The earliest commercials were obviously in black and white. The other dolls of the time just couldn’t compete with Barbie. The television marketing of Barbie has continued unabated since the early 1960s. Most women in the US younger than 50 have played with Barbie dolls as kids. There is definitely a connection between playing with a Barbie as a child and later collecting a vintage Barbie as an adult. Mattel has brilliantly marketed Barbie collectibles to this collectible community. The company has sold over a billion Barbies since 1959 making it the best-selling fashion doll in almost every major market across the globe. As on December 6, 2001 Barbie commanded a 90 percent market share of the fashion doll industry.26 Barbie, the teenage fashion doll fetched Mattel an estimated $2 billion in annual revenue27 as in 2001. As in July 2003, Barbie accounted for about one-third of the company revenue.
Mattel presented Barbie as a role model. Barbie led a busy but balanced and socially acceptable life. Barbie gave the child realistic dreams. Besides entertaining the child, Barbie conveyed positive reflections of society and feminity. According to John Amerman, who was Chairman and CEO of Mattel for a decade from 1987-1997,28 the secret of Barbie’s success was that the product has been continually freshened. The success came largely from reinvention than invention. For instance Western Fun Barbie released in 1990 was a reinvention of Western Barbie of 1981. Likewise revised versions of My First Barbie and Fun To Dress Barbie were reintroduced in 1989. “Somewhere in the inner depths of Mattel there is a team that studies and ponders over spoken and unspoken current attitudes and convictions of the American public especially those of teenagers and parents of teenagers. They have followed current fads and fashions and chosen only those that will help Barbie to remain on top of the pedestal on which America has placed her.”29
However Barbie has been plagued with problems since early 1995. An obvious reason
for Barbie’s problems was overproduction. A case in point related to 1995. Mattel
entered its 50th year in 1995 . The company took pre-orders for the Limited Edition
50th Anniversary Barbie. The potential buyers were given to understand that
production of the Anniversary Barbie would be limited to 20,00030 porcelain Barbies
at a retail price of $495 per doll. Mattel actually produced 50,000 of these dolls.
Hundreds of dolls were returned. Many shopkeepers sold off the merchandise at prices
of $350-375 each. Another reason for Barbie’s decline was that doll collectors felt
Mattel was treating them with contempt. For instance, shortly after the Anniversary
debacle of 1995 Mattel released the VINYL Pink Splendor doll priced at $999. The
cost of production of this collectible doll was less than $40! Large dealers who
allocated precious shelf space to the doll found that it was difficult to sell it. On May
13, 199931Mattel acquired The Learning Company for $3.5 billion32 with the
ambition of tapping the growing market for interactive toys. A year later it reported a
$430 million loss.33 Investors and Board Members blamed Jill Barad, the then
Chairman and Chief Executive of Mattel for the failed acquisition of The Learning
24 ibid, “Mattel History.” 25 Denise Van Paten, “What Is It About Barbie?” www.collectdolls.about.com, 2003. 26 “Mattel Implements Microsoft Technologies,” www.microsoft.com, December 6, 2001. 27 ibid, “Mattel Implements Microsoft Technologies.” 28 “Barbie in the Nineties, We Girls Can Do Anything,” www.people.virginia.edu, 2000. 29 www.people.virginia.edu, 2000. 30 April Millican, “The Rise And Fall Of The Barbie Doll,” www.dollzine.com, January 1999. 31 “Investors' Frequently Asked Questions,” www.shareholder.com, August 8, 2000. 32 “Mattel Recharges Its Batteries,” www.nyse.com, 2000. 33 ibid, “Mattel Recharges Its Batteries.”

434
Managerial Economics
Company. In February 2000, Mattel's board of directors ousted34 Barad. Robert A
Eckert took over as Chairman and CEO of Mattel in May 2000.35 As on October 2,
2000 The Learning Company was reportedly losing in excess of $1 million per day.36
The loss making company was reportedly sold off to Gores37 for nothing38 in October
200039. Two months later it started making profits.40
Besides Barbie has been coming under fire from feminists on occasions. For them Barbie is a tangible representation of the sexism of society. Feminists have been critical of Barbie’s unrealistic body shape, which in their view made “young girls go crazy, become anorexic,41 and run out and get breast implants to be like her.”42
THE BRATZ CHALLENGE
Toy industry statistics for 2002 suggested that dolls and accessories constituted one of the largest toy categories with over US $2.4 billion43 in sales. Fashion dolls held six of the top ten positions in the dolls and accessories category. Barbie’s rival, Bratz held five of these top ten positions in the fashion doll category in 2002. According to Jamie Cygielman,44 Vice President of the worldwide marketing for the Barbie brand, the “signs were out there for some time that Barbie needed a change.” Mattel Chairman, Robert A Eckert admitted that the few top-selling toys during Spring 2003 were made by Mattel’s competitors such as MGA Entertainment’s Bratz doll line and these were “stealing market share.”45
Mattel’s Barbie Vs. MGA Entertainment’s Bratz
Bratz, Barbie’s rival fashion doll was introduced in June 2001.46 Mattel’s toughest challenge for the 2002 holiday season came from the Bratz doll line.47 MGA Entertainment was originally conceived in 1979 as an electronics distribution company. The company got its first toy license in 1993 for Power Ranger hand-held games. In 1997 the company came up with its first doll affectionately called the “Singing Bouncy Baby.” Isaac Larian was the CEO of MGA Entertainment.
MGA’s Bratz scored an upset over Barbie in a closely monitored toy index. According to NPD, the Bratz doll set was top-selling fashion doll item from January to October 2002. A four-doll Bratz set was ranked No. 4 among all toy items for October 2002 whereas Barbie Rapunzel was No. 8. By November 2002 Bratz was No. 2 amongst all toy items and Barbie Rapunzel, No. 6. In February 2003 Bratz ranked 6th in NPD’s list
34 “Mattel Ousts Barad,” www.cnn.com, February 3, 2000. 35 “Bob Eckert, Chairman and CEO,” www.mattel.com. 36 “Credit Card Management/Merchant Acquiring Story,” www.cardforum.com, October 2001. 37 Gores, a Los Angeles-based buy-out firm specialized in turning around troubled technology
companies. Founded by Alec Gores, an Israeli immigrant in 1992. 38 op.cit, “Credit Card Management/Merchant Acquiring Story.” 39 ibid, “Credit Card Management/Merchant Acquiring Story.” 40 “Mattel Sells TLC,” sony.gamerweb.com, Oct 2, 2000. 41 ‘Anorexia Nervosa’ is a serious disorder in eating behavior primarily of young women in
their teens and early twenties that is characterized especially by a pathological fear of weight gain leading to faulty eating patterns, malnutrition, and usually excessive weight loss.
42 Rhoades Dusty, “She Must Have Converted,” www.dusty.booksnbytes.com (Jerry D Rhoades, Jr), 2003
43 “US Toy Industry: Where It’s Been – Where It’s Heading,” www.toy-tia.org, February 12, 2003.
44Innocenzio Anne D,’ “Barbie Gets Hipper, Trendier To Fight Competition,” www.naplesnews.com, November 2002.
45 “Mattel Profit Up Despite Falling Sales,” www.foxmarketwire.com, July 18, 2003. 46 op.cit, Innocenzio Anne D,’ “Barbie Gets Hipper, Trendier To Fight Competition.” 47 “My Scene,” www.manbehindthedoll.com, 2002.

435
Barbie Vs. Bratz: Competition In The Tween Girl Market
of best-selling toys (Annexure 7). In May 2003 Bratz ranked 7th in NPD’s48 list (ranked on dollars) ahead of Mattel’s fashion dolls (Annexure 8). In July 2003 Bratz was in 5th position (Annexure 9).
A Bratz doll, Bratz Stylin’ Salon ‘N Spa with Dana, won the 2002 People’s Choice
Toy of the Year Award of the Toy Industry Association. MGA also won the 2003
Supplier Performance Award49 by Retail Category (SPARC) in the category of girls’
toys. Mattel won the 2nd place Silver Circle. This is the first instance since 1996 (when
the award for girls category was introduced) that the award has gone to a company
other than Mattel.
Bratz was available50 at such high-volume stores as Target Corp., Wal-Mart Stores
Inc. and Toys “R” Us Inc. The Bratz doll came in funky gear consisting of platform
shoes, hip huggers, tube tops and fur vests.51 Bratz was priced at $14.99 each. The
dolls were multiethnic and carried hip names like Yasmin, Cloe, Cameron, Jade and
Sasha. Their activity sets were of a cool kind such as spa with treadmill and bubble-
making Jacuzzi for instance. Bratz dolls were an inch shorter than Barbie and hence
the two could not share the same wardrobe.
MGA’s Isaac Larian was certainly prepared for battle. “It’s too late for Mattel now. They’re not going to stop this (Bratz) train now” he said. Mr Larian declined to reveal Bratz’s wholesale volume. He said in November 2002 that he expected sales of $25052
million in 2002. He expected this figure to double in 2003. Mr Larian dismissed Mattel’s My Scene as a cheap knockoff53 of Bratz.
Industry watchers said that Mattel had been struggling54 to target the older girls (6-9 year old girls) while retaining its core customers (3-5 year old girls). Amanda Hearnden,55 Barbie’s brand manager in Australia observed “Bratz has done a great job in keeping girls playing with dolls at an older age. It is good for industry.” Bratz achieved something Mattel had been trying to do for years: getting tweens (who represented one-fifth of the $20.3 billion US toy market) to play with dolls.56
Toys and the US Tween Market
The 1990s saw the discovery57 of the ‘tweens,’ a marketing niche consisting of 8 to 14 year old girls and boys (Annexure 10). These tweens were estimated to possess pocket money worth $39 billion58 per annum (Annexure 11).
Tweens influenced the spending of those around them (Annexure 12). The tween has been growing up more quickly, both physically and emotionally, than the tween in the past. Hence the age at which the transition from kid to tween occurred was getting
48 “Top 10 Toys Ranked On Dollars,” www.npdfunworld.com, May 2003. 49 “MGA Wins SPARC Award,” www.toymania.com, July 15, 2003. 50 “Marketing And Advertising: Fashion Coup? New Doll Grabs Some of Barbie’s Limelight,”
loper.org, November 2002. 51 ibid, “Marketing And Advertising: Fashion Coup? New Doll Grabs Some Of Barbie’s
Limelight.”52 ibid, “Marketing And Advertising: Fashion Coup? New Doll Grabs Some Of Barbie’s
Limelight.”53 ibid, “Marketing And Advertising: Fashion Coup? New Doll Grabs Some Of Barbie’s
Limelight.”54 “My Scene,” www.manbehindthedoll.com, March 2, 2003. 55 Hamer Michelle, “Barbie’s Got Competition,” www.theage.com.au, December 12, 2002. 56 “My Scene,” www.manbehindthedoll.com, 2002. 57 Lianne George, “This Aint OshKosh B’Gosh,” National Post, April 19, 2003. 58 Anfuso Dawn, “Tweens Have Buying Power, Influence,” www.imediaconnection.com, April
28, 2003.s

436
Managerial Economics
even lower. Bob Nakasone,59 CEO of Toys “R” Us, said that one of the big factors contributing to the decline in toy sales was age compression. For 46% of seven and eight year olds, toys were the favorite pastime. But this declined to 24% in the case of nine and ten year olds. This further dropped to 5% for eleven and twelve year olds. Young girls were drawing comparisons between themselves and adults at an early age. This was a consequence of age compression. As a result of age compression young girls were beginning to judge their bodies by idealized “adult” standards at an earlier age. A study on behalf of the Girl Scouts of the USA60 (GSUSA) revealed that 77% of 8-year-old girls liked the way they looked. When it came to 12 year olds, only 48% liked the way they looked (Annexure 13). In yester year girls used to be interested in Barbie until they were nine years old. Now they were leaving Barbie at five or six. In 2000 toy spending in the US peaked at the age of three reaching $1.6 billion whereas in 1990 it peaked at the age of four. It has been observed that after reaching the peak toy spending dropped “with twelve year olds buying one half the amount bought by three year olds.”61 (Annexure 14)
Products that captured the fancy of the tween demographic were those without any
‘kiddy’62 (informal expression for ‘child’) feel about them. “Making the tween feel
like more than just a kid is one of the simplest ways to earn her/his business.”63
Tweens expected to be treated as adults though they might go shopping with their
parents. Successful tween products typically advertised in a voice that respected the
independence of the tween. “You are going to see packaging (by companies) for
tweens now that’s more like adult consumer goods,” opined Christopher Byrne.64
Byrne believed that girls stopped buying Barbie dolls for they weren’t positioned in a
way that appealed to what was relevant to a tween today. Amanda Hearnden, Barbie’s
brand manager in Australia,65 said that the core market for Barbie dolls comprised
girls aged from three to six who liked fantasy, princess-style dolls. Girls loved Barbie.
Barbie’s fantastic proportions and squeaky-clean image continued to fascinate little
girls. But once they got older they wanted to move on to something else.
MATTEL’S RESPONSE TO THE BRATZ CHALLENGE
To counter the Bratz dolls Mattel launched My Scene Barbie (Annexure 15) in 2002.
According to Byrne, My Scene was a big hit with the tween age group.66 My Scene
was typical of the current approach being taken by most marketers to stimulate sales.
The approach involved extending existing lines that were already popular67 rather than
taking the risk of trying to establish an all-new brand. Mattel’s My Scene did not
replace the familiar Barbie, but it did feature extra-pouty lips and oversized eyes that
were inspired by Japanese-style animation cartoons. The My Scene dolls attempted to
tap into the mind-set of teen-wannabes.
Richard Dickson, Senior Vice President for the Mattel Brands division pointed out
that the company had made efforts to tap into the tween market. But the efforts had
59 “Trends “R” Us,” www.kotlermarketing.com, 2000. 60 Dr Jennifer Scott, “Age Compression: The Incredible Shrinking American Childhood,”
www.magazine.org, 2000. 61 “Trends “R” Us,” www.kotlermarketing.com, 2000. 62 op.cit, Anfuso Dawn, “Tweens Have Buying Power, Influence.” 63 Breen Martha Uniacke, “Making The Tween Scene,” Gifts And Tablewares, May/June 2003. 64 New York-based toy analyst as quoted by Lianne George, National Post, April 19, 2003. 65 Hamer Michelle, “Barbie’s Got Competition,” www.theage.com.au, December 12, 2002. 66 op.cit, New York-based toy analyst as quoted by Lianne George. 67 “My Scene,” www.manbehindthedoll.com, 2002.

437
Barbie Vs. Bratz: Competition In The Tween Girl Market
not taken root until My Scene. My Scene “captures68 the spirit of today’s informed,
independent and fiercely individualistic urban girl like never before. My Scenes are
inspired by the fashion-forward, high-energy, chic attitude of the big city.” Byrne
observed “This is not your average Barbie. My Scene Barbie is a very hip, urban
teenage Barbie whose style is informed by what the tweens are seeing in fashion
magazines and on MTV.”69 My Scene dolls had regular, proportioned bodies, exotic
faces and edgy wardrobes. The dolls came dressed in trendy clothes, wore an edgy
look and were designed for ages 7 to 9. My Scene was a line of three dolls bearing the
traditional names Chelsea and Madison besides Barbie. My Scene’s price tag of
$13.99 was lower than that of the Bratz doll.
However My Scene Barbie didn’t hit stores70 until October 2002 whereas Bratz first
appeared in the market in June 2001. My Scene was yet to make a dent in Bratz’s
success. In July 2003, at its Santa Monica (Calif.) store, Toys “R” Us devoted a small
portion of the shelf space to My Scene as against a larger portion allotted to Bratz.
“My Scene dolls were being offered at 2 for 1 and still it was not really catching
ground,” said Sean P McGowan,71 toy industry analyst at Harris Nesbitt Gerard Inc. In
2002, Mattel also released Rapunzel Barbie (Annexure 16). The launch was backed by
extensive national broadcast and print advertising, cross promotions, in-store events
and innovative merchandising. The video ‘Barbie as Rapunzel’ topped the charts and
the doll became a huge seller. Mattel received an award for “Marketing Campaign of
the Year” for Rapunzel Barbie.
On February 28, 2003 Mattel announced a reorganization of its business units. Mattel
consolidated its existing Girls and Boys/Entertainment divisions into one business
unit: Mattel Brands Business Unit. The company designated Matt Bousquette, head of
the Boys/Entertainment unit as the President of the combined division. This resulted
in the ouster of Adrienne Fontanella who had headed the Girls/Entertainment unit
(which included the Barbie brand) since January 2000. Linda Weiser, an analyst with
Fahnestock & Co., said that Fontanella may have chosen to leave, or the move may
reflect her failure to create successful new name brands.72
On June 10, 2003 it was announced that Mattel and Limited Too73 (a specialty retailer
of tweens lifestyle products such as apparel, swimwear, personal care products etc.)
were joining hands to create a trendy collection of fall (autumn) fashions called My
Scene by Limited Too.
During the last week of June 2003 a new fashion doll from Mattel hit the retail circuit:
Flavas (Annexure 17). ‘Flavas’ (pronounced FLAY-vuhz) meant ‘personal flavor or
style.’ It was a line of hip-hop74 fashion dolls designed to appeal to older girls who no
longer play with Barbie. This looked like a strategy to compete with MGA’s wildly
popular Bratz, that was stealing Barbie’s sales. CEO Eckert speaking to analysts
emphasized that My Scenes, with their larger heads and more pronounced features
than Barbie didn’t miss the mark. However he added “Barbie can only go so far,75 so
Flavas come in from the other side.” Eckert, Chairman and CEO, Mattel had big plans
68 ibid, “My Scene.” 69 op.cit, New York-based toy analyst as quoted by Lianne George. 70 Palmeri Christopher, “To Really Be A Player, Mattel Needs Hotter Toys,” BusinessWeek,
July 18, 2003. 71 ibid, Palmeri Christopher, “To Really Be A Player, Mattel Needs Hotter Toys.” 72 “Toy-maker Mattel To Consolidate Divisions,” www.bayarea.com, March 1, 2003. 73 “My Scene,” www.manbehindthedoll.com, 2002. 74 “Mattel Asks Girls What’s Your Flava?,” www.shareholder.com, July 29, 2003. 75 “Mattel Profit Up Despite Falling Sales,” www.foxmarketwire.com, July 18, 2003.

438
Managerial Economics
to reinvigorate sales through bolstering Mattel’s marketing and promotional programs
surrounding its core brands76 (such as Barbie), as well as introducing “exciting new
brands” (like Flavas, for instance).
Christopher Palmeri, a senior correspondent who has been covering (amongst other
things) the toy industry for BusinessWeek, declared “It (Mattel) can’t just rely on
Barbies.”77 He said that to really be a player, Mattel needed hotter toys. So, was
Barbie pretty much a thing of the past?
© IBS Case Development Center. All rights reserved.
76 “Mattel Reports Second Quarter 2003 Financial Results,” www.shareholder.com, July 18, 2003.
77Christopher Palmeri, “To Really Be A Player, Mattel Needs Hotter Toys,” www.businessweek.com, July 28, 2003.

439
Barbie Vs. Bratz: Competition In The Tween Girl Market
Annexure 1 The Bratz Dolls from MGA Entertainment
Source: www.bratzpack.com

440
Managerial Economics
Annexure 2
Product Lines of MGA Entertainment
Annexure 3
Mattel Inc.: Business Unit-wise breakup of Second Quarter 2003 Financial Results
I Mattel Brands Business Unit
Worldwide gross sales: $494.7 million
Barbie Growth in gross sales: (-8%)
Double digit increase in international
sales
Decline in domestic sales
Other Girls Brands Growth in worldwide gross sales: (-
12%)
Strong showing by Polly Pocket and
Ello brands
Sales of What's Her Face and Diva Starz
brands declined
MGA Entertainment’s
Product Lines
Games
One ManJam Plush
Dolls
Walk To Me
Daisy
R/CAction
Vehicles
Microblas
t Racers Sugar
Planet
Hulk
Lil’Bratz
Line
Bratz
Line*
*65% of MGA’s revenue came from Bratz
Based on: www.mgae.com/about.asp
www.loper.org
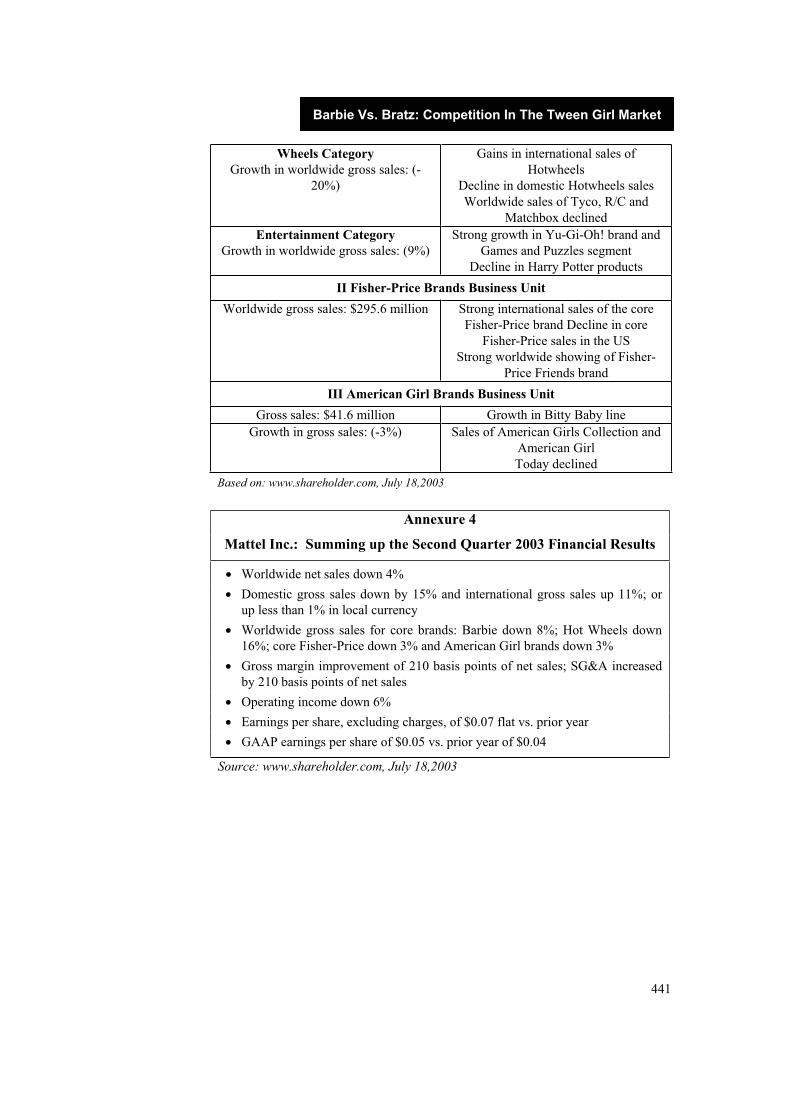
441
Barbie Vs. Bratz: Competition In The Tween Girl Market
Wheels Category Growth in worldwide gross sales: (-
20%)
Gains in international sales of
Hotwheels
Decline in domestic Hotwheels sales
Worldwide sales of Tyco, R/C and
Matchbox declined
Entertainment Category Growth in worldwide gross sales: (9%)
Strong growth in Yu-Gi-Oh! brand and
Games and Puzzles segment
Decline in Harry Potter products
II Fisher-Price Brands Business Unit
Worldwide gross sales: $295.6 million Strong international sales of the core
Fisher-Price brand Decline in core
Fisher-Price sales in the US
Strong worldwide showing of Fisher-
Price Friends brand
III American Girl Brands Business Unit
Gross sales: $41.6 million Growth in Bitty Baby line
Growth in gross sales: (-3%) Sales of American Girls Collection and
American Girl
Today declined
Based on: www.shareholder.com, July 18,2003
Annexure 4
Mattel Inc.: Summing up the Second Quarter 2003 Financial Results
Worldwide net sales down 4%
Domestic gross sales down by 15% and international gross sales up 11%; or
up less than 1% in local currency
Worldwide gross sales for core brands: Barbie down 8%; Hot Wheels down
16%; core Fisher-Price down 3% and American Girl brands down 3%
Gross margin improvement of 210 basis points of net sales; SG&A increased
by 210 basis points of net sales
Operating income down 6%
Earnings per share, excluding charges, of $0.07 flat vs. prior year
GAAP earnings per share of $0.05 vs. prior year of $0.04
Source: www.shareholder.com, July 18,2003

442
Managerial Economics
Annexure 5
Mattel’s Business Units
OthersMagic 8 Ball
Harry Potter Products
Games and Puzzles Segment
Masters of the Universe
Diva Starz
Tyco
Matchbox
Ello
Polly Pocket
Rock’em Sock’em
Little Mommy
Shining Stars
Max Steel
R/C
Mattel Classic Games
Licensed brands (e.g. Batman, Superman etc.)
*American Girls Brands were offered direct to the customer via the company’s website and proprietary retail shops. ** Barbie accounted for about one-third of Mattel’s revenue.
Based on : www.mattel.com Christopher Palmeri, “To Really Be A Player, Mattel Needs Hotter Toys,” www.businessweek.com, July 28, 2003
Mattel Inc.
Mattel Brands Business Unit
(Lifestyle Brands for Kids of All
Ages)
Fisher-Price Brands Business Unit (Infant and Pre-school Toys)
American Girls Brand Business Unit (Products* For Girls In the Age Group 3-12
Years
Mega BrandsBarbie**Hot Wheels
Power WheelsRescue Heroes Character Brands (e.g. Dora, the Explorer)Little People
American Girls CollectionAmerican Girl Today American Girl MagazineGirls of Many Lands Angelina Ballerina
443
Barbie Vs. Bratz: Competition In The Tween Girl Market
Annexure 6
Barbie Down the Years: 1959 to 2004
1959
1960
1977
2004
2003
1990

444
Managerial Economics
Annexure 7
Top 10 Toys Ranked on Dollars February, 2003
Rank Item Manufacturer Intro Date ARP
1 Leappad Books Asst Leapfrog Oct'99 14.11
2 Yu-gi-oh! Pharaoh Unlmtd
Blister
Konami Oct'02 4.02
3 Trivial Pursuit 20th Edition Hasbro Games Jun'02 30.47
4 Beyblade Starter Set Hasbro Dec'01 7.05
5 Hot Wheels Basic Cars Mattel Before 1986 0.89
6 Bratz Asst MGA
Entertainment
Jun'01 13.33
7 Yu-gi-oh! Magic Ruler
Unlmtd Blister
Konami Sep'02 3.95
8 Care Bears Classic Asst Play Along Jul'02 14.75
9 Yu-gi-oh! Metal Raider 1st Ed
Blister
Konami Jul'02 3.97
10 02 Yu-gi-oh! Starter Konami May'02 12.32
Source: www.npdfunworld.com, February 2003.
Annexure 8
Top 10 Toys Ranked on Dollars May 2003
Rank Item Manufacturer Intro Date ARP
1 Yu-gi-oh! Joey/Pegasus Pk Konami Mar’03 12.50
2 Yu-gi-oh! Metal Raiders 1st Edition Blister
Konami Jul’02 4.00
3 Beyblade Starter Set Hasbro Dec’01 7.04
4 Yu-gi-oh! Legacy Darkness Booster Konami May’03 3.97
5 Leappad Books Asst Leapfrog Oct’99 15.12
6 Yu-gi-oh! Deluxe Joey/Pegasus Starter
Konami Mar’03 25.74
7 Bratz Asst MGA Entertainment
Jun’01 13.87
8 Easyset Pool Intex Jan’03 158.46
9 Yu-gi-oh! Blue Eye Unlimited Blister Konami Mar’02 4.17
10 Fashion Polly Splash Fun Mattel Dec’02 14.46
Source: www.npdfunworld.com, May 2003.

445
Barbie Vs. Bratz: Competition In The Tween Girl Market
Annexure 9
Top 10 Toys Ranked on Dollars July 2003
Rank Item Manufacturer Intro Date ARP
1 Yu-gi-oh! Joey/Pegasus Pk
Konami Mar'03 12.57
2 Leappad Books Asst Leapfrog Oct'99 11.34
3 Yu-gi-oh! Guardian Pack
Konami Jul'03 3.98
4 Hulk Hands W/Sound Toy Biz Dec'02 17.48
5 Bratz Strut It Asst MGA Entertainment
Feb'02 13.64
6 Beyblade Starter Set Hasbro Dec'01 6.63
7 Razor Scooter Razor USA Jul'00 26.56
8 Crayola Crayon 24ct Binney & Smith Before 1986
0.37
9 Yu-gi-oh! Legacy Darkness Booster
Konami May'03 4.02
10 Color Pencils 12ct Binney & Smith Jun'87 0.89
Source: www.npdfunworld.com, July 2003.
Annexure 10
Approximate Size of the US Tween Market Vis-à-Vis Other Demographic Segments
Demographic Segment
Age group Size of the segment in millions
Baby Boomers 39 - 57 80
Generation X 21 - 37 20
Generation Y 09 - 24 60
Teens 13 - 19 40
Tweens 08 - 14 35
Kids 0 - 14 61
Based on: “Pre-teen US kids wield hefty wallets,” tdctrade.com
U.S. Census Bureau, Population Division maintained by Laura K Yax
www.census.gov, November 26, 2003.
2000 Kotler Marketing Group, www.kotlermarketing.com
446
Managerial Economics
Annexure 11
Purchasing Power* of The American Tween Vis-à-Vis The Other Age Groups
Age Kids Under 12
8 – 9 Year Olds
10 – 12 Year Olds
8 – 14 Year Olds (i.e. the
tweens)
Purchasing
Power
$30
billion/annum
$52/ annum/
person
$312/
annum/
person
$39
billion/annum
Based on: “Toy Industry Fact Book: Industry Economics and Marketing,”
www.toy-tma.com, 2001-2002
www.imediaconnection.com, April 28, 2003
* As in 2000.
Annexure 12
Annual US Spending That the Tweens Were Said To Influence
Buyers Products Purchased Amt Spent In Billion $
The tweens Candy, music and hobbies like videogames
10
The tweens’ parents/grandparents but influenced by the tween
Clothes, gifts, food and entertainment
170
The tweens’ parents/grandparents but influenced heavily by the tween
Choice of destination for family vacation
74
Based on: “Pre-teen US kids wield hefty wallets,” tdctrade.com
Annexure 13 How American Girl Tweens Saw Themselves As A Result of Age
Compression
Source: “Age Compression: The Incredible Shrinking American Childhood,” Dr Jennifer Scott, Applied Research and Consulting LLC, September 2000, www.magazine.org.

447
Barbie Vs. Bratz: Competition In The Tween Girl Market
Annexure 14
Toy Spending in the US
Age in Years (of the US kid)
Based on: 2000 Kotler Marketing Group, www.kotlermarketing.com
Annexure 15
MGA’s Bratz and Mattel’s My Scene
Based on: Christopher Palmeri, “To Really Be A Player, Mattel Needs Hotter Toys,” BusinessWeek July 28, 2003
Toyspendingin billion US $
Bratz
Maker MGA Entertainment
Debut 2001
Names Yasmin, Sasha, Cloe Jade, and Meygan
Motto The girls with a passion for fashion
Her Ride Late-night stretch limo
My Scene Barbie
Maker Mattel
Debut 2002
Names Barbie, Madison Chelsea, and Nolee
Motto My city. My style My scene.
Her Ride Vespa
motorscooter

448
Managerial Economics
Annexure 16
Mattel’s Barbie as Rapunzel
Based on: www.barbies.s5.com
Annexure 17
Flavas from Mattel
Based on: www.fashionwindows.com

Drug Price Distortions - US and Canada In recent times, the high prices of the branded prescription drugs in the US have been contrary to its commitments towards the welfare of its citizens, especially the elderly. This can be attributed to a misplaced patent regulatory mechanism, which on one hand limits the entry of cheaper generics and on the other hand, inflates costs as a result of a delayed drug approval process. This has lead to a thriving illegal importation of prescription drugs from overseas, especially Canada. In such a scenario, the US faces an unenviable task to not only restrict the inflow of these drugs into the US markets but also give impetus to the consumer access to cheaper drugs within the US.
INTRODUCTION
In recent times, the high prices of prescription drugs in the U.S have been contrary to the welfare of its elderly citizens who are the intended beneficiaries of the state-run Public HealthCare programs. And with a rising number of U.S citizens sourcing their drug needs from cheaper overseas markets, the issue of disparity between the drug prices in the United States and other countries is gaining potency. The potency is fueled by the inflated prescription drug prices in the U.S. The Americans pay the highest prices in the world for prescription drugs1 (Figure 1). Patent regulations by the Food & Drug Administration (FDA) means that the consumers pay an exorbitant price for their prescription drugs, than they would if their generics counterpart would be allowed in more readily. The U.S spends more money on healthcare than any other country in the world. Still 44 million of its population is denied health insurance2. In 2000, the total expenditure on health as a percentage of the GDP was 13% compared to only 9.1% in Canada and 10.6% in Germany. However, for the same period, the Government expenditure as a percentage of the total expenditure on health and total general government expenditure was only 44.3% and 16.7% respectively, as against 72% and 15.5% for Canada3.
THE U.S HEALTHCARE INDUSTRY
The US industry is one in which the top companies rake in huge profits, spending enormous amounts on marketing and advertising. For example, Pfizer’s Marketing & Administration accounted for nearly 50-52% of its expenses compared to only 22-25% for R&D4. The cost of healthcare in the U.S ranks among the highest in the world. But, according to a study by the World Health Organization (WHO), US ranked 37th in the world for its overall Healthcare quality in 20005. Compared to this, the countries, which rank above the U.S in the list, pay significantly less for the same, or better level of healthcare than the US. Before a new drug can be marketed in to the US markets, it has to undergo an independent review by the FDA. During the review, if it is ascertained that the drug is safe and effective, it is approved for subsequent sale. Apart from prescription drugs, the FDA also regulates over the counter drugs, generic of the prescription drugs and the ‘Orphan drugs6’. The FDA approval for a new medicine takes up to six to eight years and this lag is an important cost driver.
1 “Bush pushes for quick Medicare deal that could include Canadian imports”, 2 “Poll finds backing for Drug imports”, www.Washingtonpost.com, October 20th 2003 3 WHO website, www.who.int. 4 “Consolidated Statement of Income”, www.Pfizer.com 5 “Victory in the House and the Senate”, www.stopfda.org/ 6 “Drugs that are developed for diagnoses/treatment of rare diseases. The development of such
products is promoted under the Office of Orphan Products Development (OOPD)”

450
Managerial Economics
Even after the approval, the FDA maintains a regular vigil of drugs to determine quality and manufacturing practices, regulating the advertising and promotion, and surveillance for adverse uses and usage problems7. The lengthy patents and approvals process also results in a lack of competition for branded drugs. In a market-driven environment, the branded drugs firms would take up aggressive research and cut costs to compete with generics manufacturers, which would drive down the drug prices. In the U.S, a generic drug is available for up to 30-80% of its branded counterpart (Figure 2). Branded drug companies however, contend that they have to price the drugs high so that they can invest in R&D for new drug development. They argue that the government should do more on expanding the insurance coverage under the Medicare8 instead of contemplating pricing controls in the U.S. Normally, most patented drugs would sell at only 25% of their patent-protected price without an effective patent protection9. Intellectual patent protection delays the entry of generic drugs, which are far less expensive. The majority of the U.S market continues to be dominated by branded drugs. And the U.S firms continue to charge more because they are not dealing with a single large government buyer who can bargain down the prices. The higher price level in the U.S has abetted the growth of private Health Insurers’, primarily the Health Maintenance Organizations (HMOs). These are important players in the U.S pharmaceutical industry apart from the regular Public health schemes. The most prominent issue on the current political agenda is the prescription-drug insurance for the elderly10 and the rising cost of prescription drugs for the prescription drugs for the elderly.
PUBLIC HEALTH MAINTENANCE SCHEMES
In the United States, half of the expenditure on healthcare is borne by the public at large. The Public Health insurance schemes, which subsidize the healthcare, cover only 26% of the total population under Medicare and the Medicaid11. Of these two schemes, Medicare provides for insurance cover to the disabled, and the elderly and the Medicaid provides medical cover for the unemployed and the low-income groups. This results in a majority of the people staying outside the purview of the Public health care. The problem with this system is that not only is it very expensive (Figure 3), but also among its beneficiaries, are those who are very well off.12 Medicare started off in the 1960s when drugs made up only a small portion of the total cost of healthcare for the elderly. The important issue is that the Medicare does not pay for the prescription drugs administered outside hospitals. The elderly Americans make up the majority of the people currently enrolled with the Medicare and a majority of them require these drugs outside the hospitals. In 2002 alone, expenses on account of prescription drugs by the elderly were expected to be around $87 Billion13. The expenses on the prescription drugs are expected to rise in the future (Figure 4). Another important aspect to the ill health of the public health scheme remains the fact that the post-war ‘baby-boomers’, who were till now contributing to the Medicare by payroll contribution and taxations, are heading towards retirement. The number of beneficiaries has therefore grown as a proportion of those contributing to the Medicare14 (Figure 5). Moreover, the costs of the Medicare continue to increase due to the rising life expectancy. In 1965, Americans aged 65 constituted only 9% of the
7 “Human Drugs”, USFDA 8 A Federal Health Insurance Scheme offered by the U.S Government. 9 “Drug prices in Crisis”, www.findarticles.com, May 2001 10 “Critical conditions”, www.economist.com, September 28th 2000 11 “Medicare Rx drugs and Regulatory reform Update”, www.rxconference.org/ 12 “Uphill all the Way”, www.economist.com, January 30th 2003 13 “Say Yes to drugs”, www.economist.com, June 27th 2002 14 “More pills-Bigger pills”, www.economist.com, June 22nd 2000

451
Drug Price Distortions - US and Canada
population. By 2030, they are expected to be to be around 20%15 of the population. In 2000, the US spent nearly 13% of its GDP on the health care, but access continues to be a critical issue. While those with ample means have access to one of the most sophisticated healthcare systems in the world today, more than a sixth of the Americans have no guaranteed reach to health care16. In 1997, an audit investigation under the Department of Health and Human Service revealed an expected $23 billion annual loss due to fraudulent practices and mismanagement17.
THE PRIVATE INSURANCE SCHEME
In the U.S, the private health insurers such as, Health Maintenance Organization (HMO), Point-of-Service, and Preferred Provider Organizations are increasingly becoming important players. Cost-efficiency in the medical care is what is provided by these ‘managed care’ institutions. These institutions provide quality health care at subsidized prices. The enrollees pay a premium in lieu of the health coverage extended.
An HMO is an association that “combines the provision of health insurance” and “delivery of heath care services”18. They usually operate by a network of doctors and physicians to whom the enrollees are referred to, although they may receive specialized care from other physicians by referral.
A point-of-service implies that the enrollee pays less for a limited choice in selecting the physician. At the time of admission, the enrollee has to choose a ‘primary care’ physician who becomes his ‘point-of-service’. In case of references outside the network, only part of the compensation is made.
The PPO is an extension to the HMO managed care plan with the enrollee paying a higher premium if he requires the services of a physician outside the network operated by the managed care institution. He does not need a reference from a physician within the network for doing so. The enrollee may choose between a higher premium plan that gives him more freedom in his treatment and a lower costing HMO plan.
The Pharmacy Benefit Manager (PBMs) manages the prescription drug benefit schemes for the unions, employers, and private health plans by acting as an intermediary between the drug companies and the payers for the prescription drugs. They purchase in large quantities and are able to negotiate for discounts from the drug manufacturers19 on behalf of their members.
The private health insurance companies have been pressing the prescription drug manufacturers for discounts because they can move the market share between the drug makers who can offer them a discount.
THE CURRENT SCENARIO
More and more Americans are finding bringing in prescription drugs from overseas, mostly Canada, Mexico, and Europe, a better option (Table 1). The current flow of prescription drugs from Canada into the U.S is tantamount to parallel trade, which is contrary to the free and fair trade practices. The rising parallel trade of the prescription drugs has come under the purview of the provisions of the North American Free Trade Agreement (NAFTA) with US, Canada, and Mexico being the signatories to the agreement that provides for a tariff-free exchange of goods amongst the member
15 “The Boomers’ queasy future”, www.economist.com, December 3rd 1998 16 “Critical Conditions”, www.economist.com, September 20th 2000 17 “Fraudulent Behaviour”, www.economist.com, July 26th 1997 18 “The Rise of HMOs”, www.rand.org/ 19 “Pharmacy Benefit Mangers charger with inflating Prescription Drug prices”,
www.afscme.org/

452
Managerial Economics
countries (Annexure 1). And though the import of all kinds of medication is illegal under the provisions of the U.S laws except by the drug manufacturers, these ‘imported’ drugs are nevertheless finding their way in to the US in large numbers. This practice finds strong supporters among those who are looking forward to substantial saving as also the uninsured in the U.S struggling to pay for their medications. In the process, the nation’s own drug supply chain is coming under tremendous pressure. The FDA also points out to the prospective risk this entails for the customers due to non-compliance with the U.S safety laws and counterfeit or contaminated drugs. However, there are wide loopholes within the law enforcement itself. Under the US law, a traveler who is a U.S citizen, has a prescription and buys no more than three months’ supply of medication for own use is allowed in to the U.S. This is as under the “personal-use” exemption revised in 1988, when AIDS was surging. Under it, the FDA approved a few month’s import of life-saving prescription drugs. Also, travelers who obtained narcotics prescription, presumably for medical reason are also allowed to bring it into the U.S without any U.S prescription. In 1998, to curb rampant use, the law was amended which limited the traveler to carry not more than “50 dosage units” of any given drug. Some travelers simply shifted to carrying in their drugs in increments of 4920.
THE CANADIAN HEALTHCARE INDUSTRY
By contrast, the Canadian primary health sector is much under the control of the government, a universal health insurance system, which covers everything from public health care to physicians’ services. In 2002, seven out of ten dollars spent on healthcare came from the public purse21. In 2002 alone, the Government under social security program spent $79 billion on healthcare. A majority of the health expenditure in Canada comes from the government exchequer (Figure 6). As a total sum of the public and the private expenditure, Canada spent an estimated $112 billion in 2002. Comparatively, this figure has grown 43% over 1997 (Figure 7). A majority of this increase can be attributed to inflationary pressures (25%), an increase in the population (11%) and the rest to increased public and private spending per person for medical care (49% and 16% respectively). What makes the Canadian health system unique is the prevalence of what is known as ‘Regionalization’, whereby most of the provinces have divided their territories into regions for delivery of health care. These regions are responsible for providing quality healthcare (to their residents) under the governance of the ‘Regional Health Authority’. “Regional health authorities are autonomous healthcare organizations with responsibility for health administration within a defined geographic region within a province or territory. They have appointed or elected boards of governance and are responsible for funding and delivering community and institutional health services within their regions”22. In the early 1980s and the 1990s, most of the provinces delegated this responsibility to their sub-provincial bodies with the aim to make the public health system more focused, less fragmented and more localized to increase its responsiveness apart from an increased participation from the public in health matters, promoting health issues for prevention of diseases, and enhancing community-based services23. The Canadian health system also focuses more on preventive medical care i.e. focusing on elimination of risk factors and taking pre-emptive measures against spread of disease by promoting education, promotional campaigns etc.
20 “Millions of Americans look outside U.S. for drugs”, www.washingtonpost.com, October 23rd 2003
21 “Health Care in Canada”, www.cihi.ca 22 “What is Regionalization?”, www.regionalization.org/ 23 “Health care in Canada”, www.cihi.ca
453
Drug Price Distortions - US and Canada
THE CANADIAN PHARMACEUTICAL INDUSTRY
Canadian pharmaceutical companies into manufacturing of drugs operate at the facilities that are approved by the Health Canada, a federal health agency. The drug companies set the prices, but they do so within the purview of the rules set by the government. The government plays an effective role in curbing the price for the drugs available by advocating a ceiling price in lieu of patent protection. Prescription drugs are available to the consumers at anywhere between 20%-50% less than the drugs at US pharmacies24. The U.S manufactured drugs also have an active segment in the Canadian drug markets. However, the highest price at which these drugs can be sold in Canada is the ceiling price of similar drugs. For “breakthrough” drugs i.e. a drug that has no competitor in the market, the price cannot be more than the median price of the average price of similar drugs in seven other countries (Britain, France, Germany, Italy, Sweden, Switzerland and the U.S)25. The industry faces a slow regulatory mechanism, which results in drugs being available in the U.S far before they actually find their way in to the Canadian markets. A surging Internet growth has fuelled the rise of numerous online pharmacies that offer the drugs to the U.S citizens at Canadian prices. Four major companies, including Pfizer, have reduced their supply to Canadian pharmacies and online businesses that regularly sell to the Americans26.
THE INTELLECTUAL PATENT PROTECTION
Through 1990s, the U.S faced a rise in the prescription drugs spending among its consumer strata. Policy makers had related it to an aging population, increase in the number of prescriptions, expensive new drugs, an expanded insurance coverage and an extensive promotion exercise by the pharmaceutical companies. However, the role of the Intellectual Patent Protection, which protects the US firms and limits the competition, remained largely out of focus. The Intellectual Patent Protection (IPP) is a major issue in the US regulatory structure. A patent aims to give an impetus to the ‘innovation’ by virtue of securing the product from a direct competitive environment. The firm can, thus, sell the drug at a premium thereby recouping a part of its investment in the R&D. In an economic sense, the firm enjoys a virtual monopoly and hence sells above the marginal production cost. Comparatively, the generic drug makers usually price their product at a significantly lower level thus driving the prices down. In the U.S, the prescription drugs represent about 12% of total healthcare spending27. From 1995 to 2002, the expenditure on the prescription drugs increased from $60.8 million to $160.9 million28. Rising concerns about the prescription prices has also led to a legislation being proposed to increase the consumer access to the comparable generics to reduce the cost to the consumer. In the US, a generic drug is available for up to a 30% to 80% discount on branded counterparts. According to a US Congressional Budget Office (CBO) estimate, consumer access to generic drugs would have resulted in the average consumer spending up to $8 - 10 billion less in 1994, than on branded drugs29. The generic drugs are also becoming popular with the medical practitioners with more and more doctors prescribing generic drugs over the patented prescription drugs (Figure 8). But, a saving to the prospective consumer
24 “Canadian Pharmacy News”, www.canadian-online-pharmacies.net/25 Shepherd, Dr. Marv, “Illegal importation of prescription Drugs”, Presentation at The 2003
National Association of Chain Drug Stores 26 “Prescription Drug prices in Canada and the United States ”, Kaiser Foundation 27 Frank, Dr Richard G. & Seiguer Erica, “Generic drugs Competition in the US”
www.bbriefings.com/ 28 Gluck, Michael E., “Federal Policies affecting the Cost and Availability on new
pharmaceuticals”, Kaiser Family Foundation, July 2002 29 United States CBO, “How increased competition from Generic Drugs has affected Prices &
Returns in the pharmaceutical industry”, July 1998, www.cbo.gov/

454
Managerial Economics
under this mechanism implies declining revenue and profit trajectory for the drug manufacturers.
THE HATCH-WAXMAN ACT, 1984
The generics pharmaceutical market in the U.S got a boost under the Hatch-Waxman Act, which was passed in 1984. The Act was aimed at reducing the entry-level constraints for the generics while at the same time addressing the important issue of encouraging the ‘innovative’ companies by offering patent protection. Not only did the Act aim at increasing the access of the consumers to the cheap generics but it also addressed the profitability concerns of the drug makers at large. Under the U.S system, an inventor firm has to file a New Drug Application (NDA) with the FDA for the grant of a patent. The application for the NDA has to be substantiated along with intensive clinical trials as a proof that the new application meets the safety standards. The Act provides that any drug with a patent in effect on June 8, 1995 or pending gets a time frame of 20 years from the date of the filing for the patent, or 17 years from the grant of the patent, which ever is longer. The difference between these two dates is regarded as the “Delta Period”30. For a generic manufacturer, undergoing the same trials (for generics of the prescription drugs) will not only be costly but avoidable. Thus, the Act offered the unique concept of the Abbreviated New Drug Application (ANDA) under which the generic drug manufacturers would not have to conduct a full array of clinical studies to complement its drug approval. Instead, they would only have to prove that the drug is in fact bioequivalent to the branded drug and that they have a competitive manufacturing facility. However, the ANDA could not be filed during the ‘Delta Period’. One of the following four certifications has to be made before someone files for the ANDA31.
1. That the patent has expired
2. That the drug has not been patented
3. The dates on which the Patent is to expire, and that the generic drugs will not enter market before that period
4. That the patent is not infringed, or is invalid
Under the current laws, the original drug manufacture has 45 days for filing an infringement action against the generic (when the ANDA is filed), and it automatically triggers a 30-month stay32 during which the FDA cannot approve the generic product for sale. If the Generics manufacturer is the first company to file the ANDA and challenge the patent successfully, it is awarded a 180-day exclusivity33
during which the other generic manufacturers cannot enter the market. The Act also shortened the time period between the expiration of an existing Patent and the entry of the generic drugs into the market. Since the Act was passed, penetration by the generics has been on a consistent rise. In 1984, only 19% of all prescription drugs were generics, while, in 2001, this share increased to 45%.34
The Act addressed the important issue of effective patent life. Normally, a drug manufacturer files for a patent even as the prospective drug is still under development. Thus, the major part of the patent life is lost due to extensive clinical testing and subsequent FDA approval. Thus, the effective life is actually too short for a
30 Mossinghoff, Gerald J., “Overview of Hatch-Waxman Act and its Impact on the drug Development Process”, www.oblon.com/
31 ibid 32 Frank, Dr. Richard G. & Seiguer, Erica, “Generic drugs Competition in the US”,
www.bbriefings.com/ 33 op.cit, “Generic drugs Competition in the US” 34 op.cit, “Generic Drugs Competition in the US”

455
Drug Price Distortions - US and Canada
pioneering firm to earn an appropriate return on its investment. Increasing development time in the 1980s reduced the effective patent life from an average of 12.4 years in 1970s to just 8.1 in early 1980s35 . The government efforts are mainly directed towards providing an equitable financial remuneration to these manufacturers for the time lost, to promote innovation and at the same time ensuring the faster access to the generic drugs. However, the Act provided for patent extensions as well as for exclusivity to drive ‘innovation’ by the manufacturers. The law provided for the ‘data exclusivity” for New Molecular Entities (NME) for a period of five years during which the generic versions could not be approved (three years for new uses of existing drugs)36. The Act also provided for term restoration of the patent, subject to complicated provisions. Under it, the pioneer could receive an extension up to one-half of the time of the Investigational New Drug37 (IND) period plus the NDA period. The market extension is limited to a maximum of five years and the total market exclusivity window may not exceed fourteen years. The Hatch-Waxman Act was aimed to giving back nearly all the time that was lost in trials and the FDA review. According to a study, the average age of new compounds was 11.8 years in 1990s, 2.3 years longer than 9.5 year-period of a drug without a Hatch-Waxman Act provision (Figure 9).
THE ROLE OF INTERNET PHARMACY
The growth of the Internet during the last decade and the growing gulf between the
prices of the drugs in the U.S and Canada has led to a rapid growth of what are known
as ‘Internet Pharmacies’. They are the new source of cheap drugs for the U.S citizens.
Some prescription drugs are as much as 250% more expensive in the U.S than what
they sell at, on these online hubs. For example, Canadameds.com offers “PremPlus”,
an Estrogen replacement, for $18.17. The cost at a major drugstore chain here in the
U.S. is $80.00. The popular cholesterol drug “Lipitor” sells for only $133.00 online
but within the U.S, it is priced at $225.0038. These pharmacies basically cut a profit by
capitalizing on the cheap prices and availability of the prescription drugs in Canada
due to price ceiling, which are then sold in U.S at a lower price than the local price.
Both the parties are the beneficiaries to this cross-border shopping. The lower prices
being offered at these Internet pharmacies are very attractive for the U.S consumer but
do have a negative impact on the U.S pharmaceuticals firms (Figure 10). The drug
products are not listed on the ‘Export control list’. Therefore, the Canadian law does
not preclude pharmacies from exporting drug products into the US39. Recent reports
suggests that there are approximately 120 Canadian online pharmacies that account
for $700 million worth of prescription drugs each year to the US40. These pharmacies
are able to reduce the geographic barriers, owing to the reach of the Internet, to reach
out to their far-flung customers. In 2002, these pharmacies reported sales of Can$ 200
million with an estimated 50% coming from the American consumers. More so, now
that the U.S HMOs have actually started off reimbursing for the products from these
pharmacies, the volumes are expected to go up to Can$ 600 million in 200341. The
Internet pharmacy industry has also formed its own organization, Canadian
35 “Prescription Drugs and Intellectual Patent Protection”, www.nihcm.org/ 36 “Overview of Hatch-Waxman Act and its Impact on the drug Development Process”, Gerald
J. Mossinghoff 37 “The time from which the pioneer can begin Clinical Human Trials” 38 “Over the border Drugs”, www.canadameds.com/ 39 “Internet Pharmacies”, www.smithlyons.com/ 40 “Canada is a Discount Pharmacy for the Americans”, www.WashingtonPost.com, October
23rd 2003 41 “Crossing the Internet Line”, www.stacommunications.com/

456
Managerial Economics
International Pharmacies Association (CIPA) in 2002, which represents and supports
ethical and professional practice of international pharmacy and ensures that its
members carry out the highest standards of practice42. It also promotes the growth
and viability of the Canadian pharmacies as well as to ensure a unified voice to face
the challenges being faced by the industry at large.43
There are two prevalent prices, one each in the U.S and Canada and the spread
between these prices is usually large (Figure 11). These Internet pharmacies trade on
this discount.
The U.S authorities, especially the FDA, are taking a serious view of these Internet
pharmacies. The FDA argues that firstly, it is very difficult to determine the exact
location of these Internet sites. Also these sites change their names frequently and
may have a number of aliases, adding to the safety concerns44. And the probability of
the information filed for registration purposes being fake is high too. And recently, an
investigation revealed that some of these websites were registered with people
residing in Mexico, Pakistan, India, and the U.S itself45.
RE-IMPORTATION
Between the U.S and the Canadian markets, re-importation of prescription drugs has been a contentious issue in the U.S. It means that drugs are re-routed to the U.S markets through the Canadian route. Some of the U.S states, Iowa, Wisconsin, Minnesota, and Illinois are looking at buying prescription drugs from Canada for state workers or state-run Medicaid health programs46. As per the U.S legislation, importing prescription drugs is technically illegal except by manufacturers. Recently, under the Pharmaceuticals Marketing Access Act (2003), re-importation of FDA-approved prescription drugs made in FDA-approved facilities, from 25 industrialized countries into the U.S by pharmacists, wholesalers, and qualifying individuals was allowed. All other imports were deemed illegal. However, there is a gray area under which drugs can be imported for personal use. Over the years, FDA has warned of serious problems being posed by these drugs in terms of quality and safety and labeling standards. It has maintained a position that consumers are exposed to a number of risks in buying from foreign vendors or those sources that are not operating under a license of the State Pharmacy Boards. It contends that these outlets may sell expired, sub-optimal, contaminated, and counterfeit drugs to unsuspecting consumers apart from risk of lack of supervision and labeling language issue47, entailing a life-threatening exercise. Also, legally, the businesses that are involved with the importation of the prescription drugs must ensure a stringent compliance under the Federal Food, Drug, and Cosmetic Act48. With a growing public opinion in favor of legitimizing the importation, the Congress is seriously considering the possibility and fallouts of such legislation. Under the 21 USC § 381(d)(1), even if the drugs are approved in the U.S or are originally manufactured in the U.S, only a U.S manufacturer can legally import from an outside source49. Nearly all the other drugs imported by the individual US consumer are in violation of the law as they may be unapproved (21 U.S.C. § 355), labeled incorrectly (21 U.S.C. § 353(b)(2)), and/or
42 CIPA website, ciparx.com 43 ibid 44 op.cit, “Illegal importation of Prescription Drugs” 45 ibid 46 “US Reports back Import cheaper Canadian drugs”, YahooNews, October 26th 2003 47 “Looks can be deceiving”, www.fda.gov 48 “ORA imports, Response letter regarding importation of Foreign Medication”, www.fda.gov 49 op.cit, “Illegal importation of prescription drugs”,

457
Drug Price Distortions - US and Canada
dispensed without a valid prescription (21 U.S.C. § 353(b)(1))50. The reason that Canadian or other foreign versions of U.S approved drugs are generally considered unapproved in the U.S is that FDA approvals are manufacturer-specific, product-specific, and include many requirements relating to the product, such as manufacturing location, formulation, source and specifications of active ingredients, processing methods, manufacturing controls, container/closure system, and appearance51.
CHALLENGES
Oblivious to the U.S law and the preemptive measures of the FDA, the routed prescription drugs are gaining a major foothold in the U.S markets. The practice finds approval in some of the U.S states simply because of the cost benefits it ensures. Recent reports suggest that the State of Illinois is considering sourcing its medical supply for state-run Medicaid program from Canada on the grounds that it will save at least $90 million a year. Also, they contend that drugs from Canada are safe and effective. Canadian regulators provide protections that are about the same as those in the United States. Drugs sold in Canadian pharmacies are made in facilities approved by Health Canada, the federal health agency. Hence, the quality of these drugs is at par with those available in the US itself.
The re-importation is an important issue. If the proposed legislation for legitimizing re-importation becomes law, the U.S manufacturers would simply send their supplies across the border and re-import it at controlled Canadian prices. Assuming, that the supply of Prescription drugs to Canada were to be fixed and that the U.S consumers would buy all of their prescription fill from Canada, the subsequent loss to the drug manufacturers in the U.S will be $5.8 billion ($2.3 billion from the domestic profits & $3.5 billion from the lost profit in Canada). On the contrary, if they simply put a stop to their Canadian supplies, the loss will be limited to only $3.5 billion, which is a favorable option for the manufacturer52. In the event of a widespread re-importation, the Canadian market would not be able to withstand the pressure from US pharmaceutical companies as the volumes of these drugs in the US and the Canadian markets are very different, simply because US is a bigger market compared to its counterpart. Currently, the US constitutes 37% of the world’s pharmaceutical market while Canada accounts for just over 2%53. It would definitely not result in bridging the price gaps between the two markets. On the contrary, if the price controls were implemented, the incentive to re-import itself would be lost54.
The WHO has been advocating the concept of “differential pricing”55 for quite some time now. Also referred to as “equity pricing” or “preferential pricing”, it advocates that essential drugs prices should in some way reflect countries’ ability to pay as measured by their level of income. The concept of differential pricing can thus, also provide a mechanism to ensure not only the affordability of patented drug in a developing country but also advocating incentives for innovation. Assuming that demand elasticity is related to income, to achieve a sustainable price difference, either the higher-income countries have to forego “imports” of low-priced drugs or ensure that such practices become less feasible in the first place. The goal of differential pricing is to help ensure that price is not a barrier to low income countries securing
50 “ORA imports, Response letter regarding importation of Foreign Medication”, www.fda.gov 51 ibid 52 “Re-importation from Canada: Not so fast”, www.cnehealth.org/ 53 “Illegal cross-border trade in prescriptions threaten Canadian Medicine supply and may
violate free trade agreements”, September 24 2003 54 Calfee, John E., “Drug Re-importation from Canada: Not so Fast” 55 “Differential Pricing for Pharmaceuticals: Reconciling Access, R&D and Patents”

458
Managerial Economics
access to essential drugs for their populations, price being one of the four essential components of access to essential medicines.
A one-to-one comparison of the prices of the prescription drugs is a difficult task. This
is because not only can the drugs being sold in U.S and Canada sell at different doses
but also the consumption quantity may differ. So, the price difference measured will
depend on whether we use the U.S or the Canadian levels of consumption for drugs
having same molecular composition. For example, if we compare the prices of similar
drugs using the U.S levels of consumption, the Canadian prices are found to be 3%
higher than the U.S. On the contrary, if the Canadian levels of consumption are used,
the prices in Canada are found to be 43% less than the U.S56.
Both the countries can be expected to gain if free trade were to be allowed between
U.S & Canada, in prescription and generics drugs. From the Canadian point of view,
not only is the parallel trade more expensive due to the transport and the
administrative costs incurred but also the generics in the U.S are often cheaper than in
Canada. These generics may be routed into Canada to service the Canadian consumer
at a lower price. A parallel trade, instead, is a sub-optimal allocation of resources,
which may be used both ways for gain57.
The US authorities face a tough task of coming up with a potent solution to this issue,
one that not only addresses the cost concerns of the consumers’ but also upholds the
cause of the drug manufacturers, and gives innovation a boost. The ongoing drug
transport is also causing the economy substantial losses in terms of revenue and the
government remains committed to plugging it. At the same time there are rising
concerns about the declining share of the generic drugs (Figure 12) in the markets,
which no doubt is an important issue given its cost-benefit relationship. Thus, US is
under pressure to somewhat ease out the entry constraint of the generics to allow-in
more of competition that befits the free market fundamentals of its capitalistic
economy, more so with a large number of patents actually set to expire within the
2000-2005 period (Figure 13). A move by the U.S government to allow in more
generics is bound to have strong impact on the current pricing levels as far as the
prescription drugs are concerned owing to the vast gaps that exists as of now in the
prices of these two classes. In the past its efforts to restrict the inflow of drugs from
the Canadian markets have drawn flak from the public. In the current scenario, three
opponents to the early drug approval effort have already filed petition with the agency
to limit this backdoor process.
© IBS Case Development Center. All rights reserved.
Figure 1
Drug Manufacturer Quantity Avg. Foreign Price
(Monthly Supply)
US Price (Monthly Supply)
Price Differential
Dollar Percent
Prevacid TAPPharmaceuticals
30 mg, 30 tab
$56.69 $117.99 $61.30 108%
Prilosec A stra/Zeneca 20 mg, 30 tab
$63.89 $115.99 $52.10 82%
56 “Prescription Drug prices in Canada and the United States”, Fraser Institute 57 ibid

459
Drug Price Distortions - US and Canada
Celebrex Pfizer 200 mg, 30 tab
$41.15 $73.99 $32.84 80%
Zocor Pfizer 20 mg, 30 tab
$74.69 $116.99 $42.30 57%
Plavix Bristol-MyersSquibb
75 mg, 30 tab
$81.45 $107.99 $26.54 33%
Average 72%
Source: Drug Price Analysis
Figure 2
Source: Prescription Drugs & Intellectual Property Protection, www.nihcm.org/prescription.pdf
Figure 3
Source: Fraudulent Behaviour, www.economist.com

460
Managerial Economics
Figure 4 Projected spending on prescription drug, $bn
Source: “Say yes to drugs”, June 27th 2002, www.economist.com
Figure 5
Source: “Promises, Promises”, May 25th 1999, www.economist.com
Figure 6
Governments and other public sector payers funded the vast majority of
physicians’ services in 2002. In contrast, most dental core, vision core, and
services of other health professionals were paid for by private insurers or out-of-
pocket payments.
Source: Health Care in Canada, www.secure.chi.ca

461
Drug Price Distortions - US and Canada
Figure 7
Growth in total public and private spending on health core has regularly
outpaced inflation over the last 30 years. The graph below compares actual and
inflation-adjusted spending (in constant 1997 dollars) between 1975 and 2002
(forecast).
Figure 8
Figure 9
Source: Prescription Drugs & Intellectual Property Protection,
www.nihcm.org/prescription.pdf

462
Managerial Economics
Figure 10 Estimated revenues for the Canadian Internet pharmacy industry in 2003
Source: “Crossing the Internet Line”
Figure 11 Prescription Drug
US Dosage and Form
CanadianPrice
Mexican Price
Maryland Price
Canada- Maryland Price Differential
Mexico- Maryland Price Differential
percent Dollar Percent Dollar
Zocor 5 mg, 60 tab $46.17 $67.65 $113.97 147% $67.80 68% $46.32
Prilosec 20 mg, 30 cap $55.10 $32.10 $122.62 123% $67.52 282% $90.52
Procardia
XL
30 mg, 100
tab
$74.25 $76.60 $144.89 95% $70.64 89% $68.29
Zoloft 50 mg, 100
tab
$129.05 $219.35 $238.44 85% $109.39 9% $19.09
Norvasc 5 mg, 90 tab $89.91 $99.32 $127.17 41% $37.26 28% $27.85
AverageDifferential
98% 95%
Source: Prescription drug pricing in the 7th Congressional district of Maryland: An international price comparison

463
Drug Price Distortions - US and Canada
Figure 12
Source: Prescription Drugs and Intellectual Property Protection, www.nihcm.org
Figure 13
Source: Prescription Drugs and Intellectual Property Protection, www.nihcm.org
Table 1
Comparison of US, European and Canadian Prices
Drug Quantity Potency USPrice
European Price
Canadian Price
Augmentin 12 500 mg $55.50 $8.75 $12.00
Cipro 20 500 mg $87.99 $40.75 $53.55
Claritin 30 10 mg $89.00 $18.75 $37.50
Coumadin 100 5 mg $64.88 $15.80 $24.94
Glucophage 100 850 mg $124.65 $22.00 $26.47
Norvasc 30 10 mg $67.00 $33.00 $46.27
Paxil 30 20 mg $83.29 $49.00 $44.35
Parvachol 28 10 mg $85.60 $29.00 $40.00
Premarin 100 0.625 mg $55.42 $8.95 $22.46
Prempro 28 0.625 mg $31.09 $5.75 $14.33
Prilosec 30 20 mg $112.00 $49.25 $59.00
Prozac 20 20 mg $91.08 $18.50 $20.91
Synthroid 100 0.1 mg $33.93 $8.50 $13.22

464
Managerial Economics
Zestril 28 20 mg $40.49 $20.00 $20.44
Zocor 28 10 mg $123.43 $28.00 $45.49
Zoloft 30 100 mg $114.56 $52.50 $47.40
Source: the FDA versus American Consumer, www. Stopfda.org/oct2002.html
Annexure 1 The implication of the North American Free Trade Agreement (NAFTA)-
TradeAgreement
Countries Date of Agreement
Legislationintroduced
Took effect in
Features
Free Trade Agreement
United States of America, Canada,
1987 Bill C-22 passed in Canada
1987 7 years exemption from Compulsory Licensing was granted for New drugs or up to 10 years if active ingredients territory.
NorthAmerican Free Trade Agreement (NAFTA)
United States of America, Canada, Mexico
Signed in 1992
January 1, 1994
-Complete removal of tariff on most of the goods exchanges
-Time frame of 15 years set for removal of tariffs from protected industries- Automobiles, Energy, Agriculture, and Textiles.
Bill C-91 passed in Canada
1992 -Eliminated Compulsory Licensing
-Exemption up to 20 years from the date of filing the Patent (retroactive to Oct. 1, 1989
Chapter 11 of NAFTA
“Investment Chapter” dealing with ‘Investor State Disputes’. Foreign corporation may sue the government for passing Laws affecting their profits, under the ‘expropriation clause’. The parallel trade in prescription drugs violates Article 1105 of NAFTA which states: “Each party shall accord to the investment of the investors of another party treatment in accordance with international laws, including fait and equitable treatment and full protection and security”, because of erosion of investment of Multinational drug companies operating in Canada.
Patented Medicine Price Review Board (PMRPB) established in Canada to protect the consumer interest by ensuring that the Patentees do not charge excessive prices during the tenure of the patents.
NOTE: A ‘compulsory licensing’ allowed the domestic companies to receive a license to import the drug into Canada. A compulsory license is essentially a negation to the patent. Theoretically, the company owning the patent on a drug would be the exclusive supplier till the patent has expired. However, if other companies apply for, and are granted, a compulsory license against a drug, they can then market their version of the drug before the patent has expired. The compulsory aspect ensures that the company owing the original drug cannot block the grant of the license.

European Drug Pricing and its Implications Due to lower drug prices in the European Union, by the turn of the 21st century, the per capita spending on drugs in Europe had been much less when compared to that in the U.S. Lower drug prices in Europe had resulted in cumulative savings of $ 1 trillion since 1992. Although such huge savings were apparently lucrative, it was opined that Europe would be losing out to the U.S in the long run as higher drug prices in the U.S made it a more lucrative market for the drug makers. It was also opined that due to a higher probability of realising the money invested in the research and development of new drugs in the U.S., more and more drug manufacturers would shift their research centres to the U.S. resulting in R&D job losses in Europe.
The learning objectives of this case study are to understand the underlying causes for price distortions between EU and USA and how the European drug pricing regulations can be detrimental to the long-term health of the European drug industry.
By the turn of the 21st century, due to lower drug prices in the European Union (EU), the per capita spending on drugs in Europe was much lesser as compared to that in the U.S. [Annexure-1]. Drug prices in France averaged 42%1 of their price in the U.S. Pfizer’s cholesterol-lowering medicine ‘Lipitor’ that was sold at 60 cents a pill in Paris, cost $3.982 in Philadelphia, U.S.A. A bottle of ‘tamoxifen’ (used to fight breast cancer), which cost $360 in the U.S., was only $603 in Germany. Such low drug prices resulted in savings of $160 billion for Europe in 2002 with the cumulative savings (from 1992) of $1 trillion.4 Although such huge savings in absolute terms were apparently lucrative, analysts believed that the EU was actually destined to pay a huge price in the long run due to the hidden costs involved in this process. Economists opined that high drug prices in the U.S. made it a more attractive market than the EU for the big pharmaceutical companies, and as a result, the “competitive position of Europe, as a site for innovation and investment, is in decline compared to the situation in America.”5 Commenting on the implications of lower drug prices in Europe due to the price controls in different European countries, Daniel L. Vesella, Chief Executive of Novartis,6 said, “As a result of price controls, European consumers are heading towards second-class citizenship when it comes to access to medicine”.7 Drug price controls by the European government resulted in 25-30% lower prices8 in the EU when compared to that in the U.S.
1 “Europe’s Addiction”, www.cptech.org, (Wall Street Journal, January 2nd 2002) 2Capell, Kerry, “Commentary: Europe Pays a High Price for Cheap Drugs”,
www.businessweek.com, February 17th 2003 3 Gratzer, Dr. David, “Price controls stifle drug development”, www.manhattan-institute.org,
September 14th 2003 4 “The trouble with cheap drug”, www.economist.com, January 29th 2004 5 Holmer, Alan F. and Clemente, Frank, “Would Lower Drug Prices Stifle Research?”,
www.aarp.org, July/August 2002 6 The company’s prescription drugs include treatments for nervous system and ophthalmic
disorders, cardiovascular diseases, and cancer. It also makes dermatological products and drugs to prevent organ transplant rejection. Novartis’ consumer health unit includes such brands as Gerber baby foods, ExLax, Maalox, Tavist, and Theraflu. The CIBA Vision unit makes eye drops, contact lenses (Focus), and contact lens solutions.
7Capell, Kerry, “Commentary: Europe Pays a High Price for Cheap Drugs”, www.businessweek.com, February 17th 2003
8Giolbert, Jim & Rosenberg, Paul, “ADDRESSING THE INNOVATION DIVIDE”, www.bain.com, January 22nd 2003

466
Managerial Economics
HEALTH-CARE SYSTEMS AND DRUG PRICES IN EUROPE
Traditionally, European governments had been monopsonist price setters9 (public health being under the government) for drugs, there by keeping drug prices low. European nations followed two basic models of health-care systems. The first was a comprehensive social insurance model with public and private funding, followed by countries like Germany, France, Belgium, the Netherlands and Switzerland. In this model, the health-care service providers like hospitals and drug providers directly got their dues reimbursed from the government sickness funds, as in Germany, or the service providers were paid upfront by the patients who then reclaimed the amount from the government health insurance systems, as in France.
The second model was the ‘National Health Service’ (NHS) that was funded by the public. It was followed by the U.K, Sweden and Italy. The NHS in the U.K was funded through the taxpayers money. In addition to this, private health insurance schemes also shared the burden. Private health insurance, which was maintained mainly by the employers, covered 10% of the population with coverage for limited services. In Sweden, NHS was maintained by local county councils, which were funded by the national and local governments. Sweden had no private health care systems. In Italy, NHS was provided by private hospitals who had contracts with the government.
Between 1990 and 2000, European nations on an average spent 7.7% of their total GDP on Health Systems [Exhibit-1]. European nations adopted different kinds of drug price controls like - Reference Pricing, Profit Regulation and Product Price controls that would suite their public health-care systems.
Exhibit 1 Share of each EU Country in the Total of Drug-Related
Heath-Care Expenditure in the EU (Corrected by GDP Weight)
16%
11%
8.10% 7.70%7.20%
6.60% 6.10% 5.70% 5.60% 5.50%4.60%
3.80%
1
18.30%
0.00%
2.00%
4.00%
6.00%
8.00%
10.00%
12.00%
14.00%
16.00%
18.00%
20.00%
Ital
y
Swed
en
Bel
gium
Net
her
lan
ds
Ave
rage
UK
Spai
n
Lu
xem
bou
rg
Fra
nce
Ger
man
y
Gre
ece
Irel
and
Fin
land
Source: “Public spending on drugs in the European Union during the 1990s”, www.emcdda.eu.int
9 in the monopsony market there will be only one buyer for a product

467
European Drug Pricing and its Implications
Reference Pricing
Germany (1989) and the Netherlands (1991) were the first countries in Europe to adopt the concept of Reference Pricing. Under this concept, the government established a reimbursement level for a particular drug and if the price of any drug exceeded that level, the patient was to bear the difference. “In theory, reference pricing limits reimbursement, not prices.”10 However, as the patients were unwilling to pay a price for any drug higher than the reimbursement price, reference price became the market price. After Germany and the Netherlands, countries like Sweden and Denmark also followed this system. The reference price was equal to the average price of drugs in any category (as in Germany and the Netherlands), or the lowest priced drug in any particular category (as in New Zealand), or some percentage added to the price of the lowest priced generic drug (for example, 10% in Sweden). New drugs and the innovative drugs, often referred to as breakthrough drugs, were excluded from this system.
Profit Regulation
Some European nations followed the system of profit regulation whereby the government notified the maximum profit that a pharmaceutical company could generate. Spain allowed a maximum profit margin of 18% and in the U.K it was 21%.11 Under this system the government indulged only in profit regulation and not in price regulation. Companies had the freedom to set their product prices as far as they did not exceed the maximum profit range that was set by the government. The maximum profit range was also negotiable if the company could envisage that its profits would be less than 75% (on following the maximum price range that was set) of their target returns.
Product Pricing
In this system, the price of a drug was determined by comparing its prices with the prices in the neighbouring countries (also termed as ‘reference countries’), by using a standard formula that varied from nation to nation. For example, the price of any drug in Greece was determined by comparing its price in all the EU countries and then taking the minimum price as the price in Greece. On the other hand, Czech Republic took the lowest price of any drug in Greece, Poland, Spain and France as its maximum price [Annexure-2]
Apart from government regulations, another factor in lowering the drug price was the emergence of parallel trading, where in drugs from low price markets like Greece were sold in the high price markets like Britain and the Netherlands through the drug wholesalers. Parallel trading depressed the drug prices across Europe. For example in the Netherlands, drug prices went below the price set by the government, by 20%.
“The enactment of cost-containment programs, price controls, or both, on a national level often results in decreased levels of R&D spending in that these programs reduce revenues that can be reinvested in R&D programs.”12 These controls resulted in lowering the drug prices in Europe compared to prices in the U.S., leading to lower revenues and lower profits for the pharmaceutical companies [Exhibit-2].
10Furniss, Jim and Zammit-Lucia, Joseph, “Reference Pricing: Worth the Risks?”, www.pfizerforum.com
11 Bloor, Karen, and Maynard, Alan, and Freemantle, Nick, “Lessons from international experience in controlling pharmaceutical expenditure III: regulating industry”, www.bmj.bmjjournals.com
12 Holmer, Alan F., and Clemente, Frank, “Would Lower Drug Prices Stifle Research?”, www.aarp.org, July/August 2002

468
Managerial Economics
IMPLICATIONS OF LOW DRUG PRICES
Lower revenue and lower profit meant reduced rate of return on investment for the pharmaceutical industry, forcing the industry to move away from Europe to the U.S. for Research and Development (R&D). “The main economic factor driving where firms locate their R&D is how big, and quick, are the potential profits.”13 The 1% Internal Rate of Return (IRR) in Europe failed to provide any promise to the companies on their R&D investments, which averaged an investment of $802 million14 and took 10 years for the development of any new drug. While the drug industry in Europe was spending € 8 billion ($7 billon) in R&D in 1990 compared to €5 billion (4.3 billion)15 in the U.S, by 2000, the U.S had beaten Europe by spending € 24 billion ($20.9 billion) against Europe’s €17 billion (14.8 billion).16 The gap widened even further in the early 21st century when the U.S R&D expenditure reached $30 billion vis-à-vis European expenditure of $20 billion.17 The results were soon visible in the introduction of new drugs. While Europe had launched 81 New Molecular Entities (NMEs) against 48 from the U.S between 1993-1997, within the next four years (1998-2002), the U.S. had beaten Europe by launching 85 NMEs against 44 of Europe.18
Exhibit 2
Source: Giolbert, Jim & Rosenberg, Paul, “ADDRESSING THE INNOVATION
DIVIDE”, www.bain.com, January 22nd 2003
* ROW – Rest Of the World.
The shift in R&D activities from Europe to the U.S meant a loss of jobs in Europe. For example, British drug company ‘Glaxo SmithKlime’ (GSK) moved its R&D activities to Atlanta, U.S. and due to that, Britain lost some R&D jobs from its drug
13 “The trouble with cheap drug”, www.economist.com, January 29th 2004 14 Capell, Kerry, “Commentary: Europe Pays a High Price for Cheap Drugs”,
www.businessweek.com, February 17th 2003 15 Calfee, John E, “The High Price of Cheap Drugs”, www.weeklystandard.com, July 21st 2003 16 ibid 17 “The trouble with cheap drug”, www.economist.com, January 29th 2004 18 “The trouble with cheap drug”, www.economist.com, January 29th 2004

469
European Drug Pricing and its Implications
industry, which provided 65,000 jobs19 to the British economy in 2001. The impact was more visible on Germany, the biggest drug market in Europe, that accounted for one fifth of the total spending and total jobs in the European pharmaceutical industry. In 2002, although Germany saved $19 billion20, as compared to the U.S., due to lower drug prices, it lost out on many other areas - $4 billion on patents and other R&D related benefits, $8 billion on R&D jobs and the multiplier effect of those jobs, $3 billion in terms of profits that the German firms would have earned, $2 billion in shedding corporate headquarters and another $5 billion21 in terms of poorer public health. In total, Germany actually lost $3 billion in the bargain to lower its drug prices.
Besides, most Europeans were denied of the latest medicines. “Europe’s cash-strapped
national health-care systems rely on cheaper, older, and often less effective drugs.
Access to new and potentially lifesaving medicines is delayed, and frequently
restricted.”22 The entry of any new drug into the European markets, on an average,
was delayed by 18 months23 as compared to that in the U.S. “The delays stem from
lengthy negotiations over pricing and the willingness of state health systems to
reimburse consumers for the drugs.”24 An industry study found out that between 1990
and 1998, the launching of 21 drugs in Italy, France and Portugal, was delayed, on an
average, by 20, 39 and 42 months25 respectively, after their introduction in Britain.
Another prominent example was that of ‘Taxol’, an effective drug used in breast
cancer treatment. Although it was approved by the EU in 1995, it was only after four
and half years that the drug was available to the British patients. According to
Datamoniter, a London based consultancy, Britain had “the worst cancer survival rates
in the developed world,”26 and the reasons cited included insufficient screening and
lack of access to drugs like Taxol.
In 2002, a study titled “Diffusion of Medicines in Europe” conducted by Prof. Oliver
Schöffski of University of Erlangen-Nuremberg, noted that patients suffering from
several diseases in Europe were denied the latest medicines [Annexure-3]. He stated,
“The most important factors for the diffusion of innovative medicines are policy
related. Some examples are drug-pricing policies, insufficient recognition of the
(global and long term) economic benefits of innovative medicine, inadequate
governmental planning and last but not least cost containment strategies of every
kind.”27
Analysts believed that access to new and expensive medicines could lower the health
care budget of the European governments as they reduced expensive specialist care or
hospital treatment. For example Professor Oliver’s study pointed out that Italy could
save $890 million28 in a period of five years on prescribing drugs called ‘statins’29 to
19 Goldsmith, Rebecca, “U.K. mulls repeal of price caps on drugs” www.globalaging.org, November 16th 2003
20 “The trouble with cheap drug”, www.economist.com, January 29th 2004 21 ibid 22 Capell, Kerry, “Commentary: Europe Pays a High Price for Cheap Drugs”,
www.businessweek.com, February 17th 2003 23 Holmer, Alan F. and Clemente, Frank, “Would Lower Drug Prices Stifle Research?”,
www.aarp.org, July/August 2002 24 Buerkle, Tom, “EU Weighs Lifting Of Price Controls”, www.iht.com, November 18th 1998 25 ibid 26 Capell, Kerry, “Commentary: Europe Pays a High Price for Cheap Drugs”,
www.businessweek.com, February 17th 2003 27 Schöffski, Prof. Oliver, “Diffusion of Medicines in Europe”, www.lif.se, December 2002 28 Capell, Kerry, “Commentary: Europe Pays a High Price for Cheap Drugs”,
www.businessweek.com, February 17th 2003

470
Managerial Economics
the patients diagnosed with heart disease. In the U.S., statins were utilised by 56% of
6.2 million patients suffering from heart diseases, while in Italy only 17% of the 3.3
million accessed the drug.
Amidst all these, industry watchers opined that the European drug price controls were
proved expensive when all costs were added. Still, analysts were sceptical about
European governments abandoning price controls. As The Economist put it, “it seems
unlikely that they will abandon price controls, not least because of short-term budget
constraints for publicly financed health care. (More likely, America will impose its
own tougher price controls.) A more typical, though less effective, European response
would be to strive harder to attract, or at least keep, drugs R&D by offering a mix of
tax relief and subsidy.”30
© IBS Case Development Center. All rights reserved.
29 a costly category of lipid-lowering drugs 30 “The trouble with cheap drug”, www.economist.com, January 29th 2004

471
European Drug Pricing and its Implications
Annexure-1 Per Capita Spending on Drugs of Top Seven European Countries
Compared to U.S. and Japan
Source: Capell, Kerry, “Commentary: Europe Pays a High Price for Cheap
Drugs”, www.businessweek.com, February 17th 2003
Annexure 2
Pricing of Pharmaceutical Products: Reference Countries and Basis of Calculation, 2002
Country Reference countries Basis of calculation Conversion
Greece Lowest price in Europe Lowest price in Europe Exchange rates
Ireland Denmark, France,
Germany, Netherlands, UK
Average Exchange rates
Italy1 All EU countries Average Exchange rates
Netherlands Belgium, France, Germany,
UK
Average Exchange rates
Portugal France, Italy, Spain Average Exchange rates
Sweden Denmark, the Netherlands,
Germany, Switzerland,
Norway and Finland
Price is lower than Denmark, the
Netherlands, Germany,
Switzerland and similar to those
in Norway and Finland
Exchange rates
Slovenia Italy, France, Germany • 85% of the average for most
products
• 96% of the average for
innovative products
Exchange rates

472
Managerial Economics
Czech
Republic
Greece, Spain, France,
Poland
Lowest Exchange rates
Norway Sweden, Denmark, Finland,
UK, Ireland, France,
Germany, the Netherlands,
Belgium, Austria
Average of the two lowest
Note: 1 Used for pricing ‘old’products only. For new and innovative products, the price is set
through negotiation.
Source: Kanavos, Panos, “PHARMACEUTICAL REGULATION IN EUROPE”, www.irpp.org
Annexure-3
• People with mild to moderate Alzheimer’s disease would benefit from up-to-date medicines, which reduce the progression of this disease. Only a small fraction of those people affected are diagnosed and only a part of these are adequately treated (in France 56,000 patients out of 150,000 to 200,000 people who would potentially benefit from the treatment).
• Only one third of more than four million people with asthma in Germany are treated with any medicine at all, a much smaller portion is adequately treated. More than 2.5 million German asthmatics therefore receive no proper treatment and consequently the total costs of this disease in all sectors of the health care system are much higher than necessary.
• In Europe, it is assumed that at least 10 percent of the population is affected by chronic bronchitis. In Germany only 50 to 60 percent of patients with moderate to severe exacerbations are treated in the recommended way (with antibiotics).
• Cardiovascular disease is one of the most widespread health problems in Europe and is a major cause of death. The main risk factors, besides obesity and smoking, are high blood pressure and high cholesterol levels. Across Europe, the majority of high cholesterol cases receive no treatment with statins (after dieting as a first line approach). In the Netherlands 64 percent, in Switzerland 71 percent, in Germany 74 percent, in the United Kingdom 77 percent and in Italy 83 percent of all eligible patients do not receive up-to-date treatment.
• In comparison with other countries in Europe, such as Sweden, Spain, France and Austria, where modern preparations in the treatment of depression have long been standard, Germany provides only 4% of all eligible patients with selective serotonin reuptake inhibitors (SSRIs).
• If patients with diagnosed diabetes are treated in a proper way (especially by regulation of blood sugar level), other serious illnesses like strokes, amputations, heart attacks and blindness can be avoided or at least delayed for an extended time. In many cases diabetes is not diagnosed. For example in Switzerland, about 250,000 people suffer from type II diabetes, of whom about 100,000 are not diagnosed.
• Epilepsy is not always diagnosed and it is assumed that 20 to 30 percent of patients treated for epilepsy do not in fact suffer from epilepsy. The provision of second generation epilepsy drugs is often inadequate, despite evidence, that increasing drug expenditure may lead to decreasing total costs (e.g. due to lower hospital costs or productivity losses).
• In France, the National Hepatitis C Plan declared that at least 75 percent of all virus carriers should know their serological status and at least 80 percent of the people concerned should be treated by 2002. But actually only 40,000 to 50,000 people are being treated against a target of 200,000.
• Although the British Department of Health has increased funding to pay for combination HIV / AIDS therapy, the costs of this therapy cannot always be met by local authorities. The funding per patient differs nearly threefold between the most and least favourable regions.
Source: Schöffski, Prof. Oliver, “Diffusion of Medicines in Europe”, www.lif.se, December 2002

The U.S. Steel Industry and the Tariff Policy of Bush
The U.S steel industry has been facing many problems such as price instability,
overcapacity, high legacy costs etc. In June 2001, President George W. Bush
requested the U.S International Trade Commission (USITC) to conduct a Sec 201
investigation. In response to the findings of USITC, in March 2003, the President
ordered a three-year "safeguard" measure on many steel imports. The EU and other
Asian countries complained to the WTO that the tariffs imposed by the U.S broke the
international trade rules. They also threatened to impose retaliatory tariffs on U.S
made products, if U.S did not take back the safeguard measures. On one hand the U.S
steel producers wanted the tariffs to exist and on the other hand, the steel consumers
and the foreign countries wanted Bush to lift the tariffs. In either case, Bush will have
to pay the political cost for his decision, since the Presidential elections are to take
place in 2004. In November 2003, the WTO ruled that the tariffs imposed by the U.S
broke the international trade rules and ruled that they are illegal. Finally on
December 4th 2003, Bush took the decision to lift the steel tariffs, 16 months earlier
than originally planned.
“Bush’s steel policy is what results when intelligent people take up intellectual
slumming — abandoning of proven free-trade principles — for the pleasure of
political opportunism.”
– George F. Will, Washington Post columnist.1
“In terms of the steel issue, it’s an issue that the Prime Minister (Tony Blair) has
brought up not once, not twice, but three times. It’s on his mind. It’s also on my mind.
And I’m reviewing the findings about the restructuring of our steel industry, which is
the ITC ruling basically said that the industry needs some breathing time to
restructure.”
– George W. Bush, President of U.S.A.2
INTRODUCTION
The U.S steel industry had been facing many problems such as price instability,
overcapacity, high legacy costs etc. By 2001, many of the steel companies had filed
for bankruptcy. In June 2001, in response to the industry pressure, President George
W. Bush requested the U.S International Trade Commission (USITC) to conduct a
Sec 201 investigation.3 The USITC found that imports were a major cause of serious
injury to a segment of the U.S steel industry for 16 out of the 33 types of steel imports
under investigation. In March 2002, President George Bush ordered a three- year
“safeguard” tariff on many steel imports, to help the steel industry restructure and
make the U.S steel industry more competitive with foreign imports. The EU
(European Union) and eight other steel producing countries complained to the World
1 Jackson, Timothy R, “Politics as usual” www.marquette.edu March 8th 2002 2 “President Bush, Prime Minister Hold Joint Press Conference” www.whitehouse.gov
November 20th 2003 3 A Section 201 investigation seeks to determine whether imports are a “substantial cause of
serious injury or threat of serious injury” to the affected industry—the steel industry in this case

474
Managerial Economics
Trade Organisation (WTO), the body that regulates world trade. On November 2003,
the WTO ruled that the tariffs imposed by the U.S broke international trade rules. EU,
Japan and China had threatened to impose retaliatory tariffs on U.S made products, if
U.S did not take back the safeguard measures. The U.S steel unions and the steel
producers encouraged the tariff protection given to the steel industry. On the other end
the steel consumers complained that steel tariffs led to higher prices for domestic steel
which increased their costs.
BACKGROUND
In the late 1990s, the U.S steel industry faced an unfair competition from the foreign countries. Several foreign countries had less generous company benefit packages4,more generous government health care programs, and subsidies that gave their steel firms a cost advantage versus the integrated mills5 in the U.S.
In the beginning of 2002, the integrated steel industry of the U.S faced high legacy costs.6 The burden of legacy costs varied from firm to firm, but the United Steelworkers Association calculated the aggregate figure at about $1 billion annually.7
Comparatively the U.S minimills had cost advantage over the integrated steel mills. Their legacy costs were much lower and they required less capital also. The minimills’ share in U.S steel production had doubled since 1975 and reached 45% in 2000.8
The steel industry faced the problem of continuous overcapacity because of demand fluctuations. Due to this the firms had to incur higher costs. The U.S steel prices were declining and the steel firms received less profits. The firms like Bethlehem Steel and LTV filed for bankruptcy, as they had to incur high costs. To slow down the closure of high cost steel firms the U.S Government gave support to these firms in the form of subsidies and trade restraints.
STEEL INDUSTRY IN THE BUSH REGIME
In the 2000 Presidential election, Mr. Bush won in West Virginia and narrowly lost in Pennsylvania, which were the two leading steel producing states. During the campaign, the Bush administration had vowed to do more for the steel industry than what the Clinton regime did. In its early months, the Bush administration seemed indifferent to the crisis in the steel industry. But later it noticed the legislative pressures, led by the steel houses, which were building up in the Congress. Because of the continuous pressure from the steel industry, the Section 201 investigation was conducted.
The USITC that conducted the investigation reported that the imports caused injury to the U.S steel industry. Further USITC recommended that certain steel products should be provided remedies in the form of trade restraints, such as tariffs, quotas, and combinations of the two called tariff-rate quotas (TRQs). The products eligible for
4 Company benefit packages are those packages under which the company provides some
benefits to its employees. 5 Integrated mills make steel by processing iron ore and other raw materials in blast furnaces.
Technically, only the hot end differentiates integrated mills from mini-mills. However, the differing technological approaches to molten steel imply different scale efficiencies and, therefore, separate management styles, labor relations and product markets.
6 Generous health and pension benefits from the past years combined to form legacy costs. 7 Hufbauer, Gary Clyde and Goodrich, Ben, “Time for a grand bargain in steel” www.iie.com
January 2002 8 ibid

475
The U.S. Steel Industry and the Tariff Policy of Bush
Section 201 trade restraints accounted for 27 million short tons9, 74% of the steel imports under investigation, and $10.7 billion of imports in 2000.10 The ITC commissioners suggested different remedies and there was no consensus among their recommendations. The final decision about the remedies had to be taken by President Bush. He could give recommendations, which would fulfill his political, legal and the industry’s economical purpose. The EU condemned the measures suggested by ITC and stated that they were totally unjustified. The EU and other Asian countries would lose if the President took any strong measures, as the high tariffs would make it difficult for them to enter the U.S markets. The President’s choice depended on the support of the representatives from steel districts for Trade Promotion Authority (TPA). Out of the 30 representatives of TPA, eight were from the House Steel Caucus. TPA would give Bush, the flexibility he needed to secure the greatest possible trade opportunities for America. By attending to the needs of the steel industry, the President would get increased support to pass the legislation of TPA.
In December 2001, US Steel Corporation was the largest steel producer in the United States with a domestic production capacity of about 12 million short tons. Bethlehem Steel (11.3 million short tons) and LTV (7.6 million short tons) were the second and third largest integrated producers of steel in the United States, but both were on the verge of bankruptcy. National Steel was the fourth largest integrated U.S producer (6 million short tons) and was financially viable. Wheeling-Pittsburgh Steel was smaller (2.2 million short tons) and was going bankrupt.11 These firms had asked for the government’s assistance to facilitate the consolidation of the steel industry to stabilize it. They wanted the government to provide financial support for the legacy costs and to provide strong trade remedies as an outcome of the Section 201 investigation. They also wanted to renegotiate their labor contracts with the United Steelworkers in order to reduce the labor costs.12 The minimills wanted trade remedies against the increasing imports. The United Steelworkers wanted legacy aid and trade protection. They were ready to renegotiate compensation rates and so encouraged consolidation. Unlike the U.S steel producers, the steel consumers did not support the remedies, as it would raise the cost of steel.
Faced with intense pressure from the domestic steel industry, the U.S Government
imposed steel import tariffs of up to 30% on a range of steel products in March 2002.
The import duties covered 10 different steel products and ranged from 8% to 30%.
They came into effect from March 20th, 2002 and covered flat-rolled steel and other
steel imports from countries such as Brazil, South Korea, Japan, Taiwan, Russia,
Germany, Turkey, France, China, Australia and the Netherlands.13 (Exhibit 1). The
system was designed to impose duties over a period of three years in the amounts of
30% in 2002, 24% in 2003 and 18% in 2004.Imports from U.S partners in Free Trade
Agreement, Canada, Jordan, Mexico and Israel were excluded from these tariffs. Also
the imports from developing countries, which individually supplied small shares, were
excluded.
RESULTS OF MARCH 2002 SAFEGUARD MEASURES
Following the tariff decision, the steel industry was consolidated. It helped the steel producers to increase the prices and stabilize the production levels within a profit range. (Exhibit 2) In April 2002, a new steel plant named International Steel Group
9 500 short tons = 453.6 metric tons 10 op.cit, “Time for a grand bargain in steel” 11 op.cit, “Time for a grand bargain in steel” 12 ibid 13 Subramanian, K., “US’ rusty steel policy” www.blonnet.com April 19th 2002

476
Managerial Economics
(ISG) was established. Its chairman, Mr. Wilbur Ross gave preference to consolidation of the steel making companies. ISG had acquired LTV, Acme, and Bethlehem Steel. By purchasing and restructuring these formerly high cost, bankrupt facilities, ISG saved 11,000 direct steel jobs. Later Bethlehem Steel was also purchased by ISG, which resulted in a deal that brought Bethlehem out of bankruptcy and created the nation’s largest steel maker. In reply, US Steel purchased the assets of National Steel and regained its status as the country’s largest steel maker. On the electric furnace “mini-mill” side also, there was significant consolidation. Nucor purchased Birmingham Steel and Trico, Steel Dynamics purchased Qualitech, and Gerdau of Brazil bought AmeriSteel and merged it with Co-Steel of Canada, creating Gerdau AmeriSteel.14 The steel industry had consolidated in the years 2002-2003. Indeed, by raising the profitability of the weak firms, the tariffs had raised the price, which the stronger firms had to pay to acquire them.15
By the end of 2002, the steel industry had a supply deficiency. There was a rapid price increase, up to 70% for sheet products.16 Imports from NAFTA members rose from their customary 25% share of U.S finished steel imports to nearly one third of the total. Imports had also gone up from developing nations, which were exempted from the 201 tariffs. On March 2003, the U.S Steel industry issued a Progress Report showing that the steel 201 tariff program initiated by President Bush was succeeding. “The tariffs must be allowed to run for the full three-year term”, the report said.17
“After 18 months of the tariffs, it is clear that the steel industry has benefited as much as possible from the imposition of the tariffs in March 2002,” representatives of more than 200 companies and organizations wrote in a letter to Bush.18
The rise in the steel prices had caused difficulties for the U.S manufacturers that used steel in their products, as costs of production had increased. U.S companies such as Caterpillar Inc. and General Motors Corp. opposed the tariffs, saying that their manufacturing costs were rising as import prices went up.19 According to ITC, the steel tariffs had cost the U.S economy $680 million between March 2002 and March 2003.20 Moreover the safeguards had decreased the capital income of steel users by $601 million but had increased the capital income of steel producers by only $240 million.21 Because of the inflated cost for steel related products, within U.S companies, there was a huge loss of jobs. According to the Consuming Industries Trade Action Coalition, higher steel prices in 2002 accounted for the elimination of 200,000 jobs and $4 billion in lost wages over a nine-month period.22 The Morgal Machine Tool Company in Springfield, Ohio had to cut its jobs because of the tariffs. It used to import steel to the U.S and then process it. Later it imported to Canada and processed the steel there. When the steel product was shipped from Canada to U.S, then there was no 30% tariff on the steel.23 U.S steel imports in October 2003 fell
14 Anton, John, “U.S. Steel Prices Rising as Consolidated Aids Market Discipline”,
www.globalinsight.com 15 “Cold Steel”, www.economist.com November 13th 2003 16 Bulow, Wilfried von, “U.S. Steel Market Analysis” www.aiis.org December 3rd 2002 17 “U.S. Steel industry urges Bush administration: Keep steep program in place for the full three
years intended”, www.steel.org March 4th 2003 18 Fischer, Karin, “Poll shows voters back steel tariffs Industry official says figures may help
guide Bush”, www.dailymail.com October 31st 2003 19 “Bush steel tariffs pit votes at home against EU trade” www.quote.bloomberg.com November
24th 2003 20 Montana, Gina, “The U.S. Steel industry and President Bush: Damned if he does..”
www.seic.ca November 14th 2003 21 Hufbauer, Gary Clyde and Goodrich, Ben, “Next move in Steel: Revocation or Retaliation?”
www.iie.com October 2003 22 op.cit “The U.S. Steel industry and President Bush: Damned if he does..” 23 Evans, Stephen, “Steel trade war backfires for Bush”, www.news.bbc.co.uk October 28th,
2003

477
The U.S. Steel Industry and the Tariff Policy of Bush
43.7% to 1.543 million from 2.744 million in October 2002, the Commerce Department said.24 (Exhibit 3)
On September 19th 2003, the USITC released its analysis of the steel safeguards. “Most of the benefits of the steel safeguard go not to steel workers, nor even to steel producers, but to the U.S Government in the form of increased tariff revenue”, said the USITC report. In the 12 months following the safeguards, the U.S Customs Service collected $581 million in duties from steel imports, which represented an increase of $294 million over the 12 months before the safeguard.25
ACTIONS OF EUROPEAN UNION AND OTHER COUNTRIES
Immediately after the President imposed the safeguard measures, the EU, followed by Japan, Korea, China, Switzerland, Norway, New Zealand and Brazil, engaged WTO dispute settlement procedures against the U.S steel safeguard measures. In May 2003, the WTO dispute panel ruled that U.S steel safeguards imposed in March 2002 were illegal, (Box 1 & 2). The WTO Appellate Body confirmed the panel’s judgment on November 10th, 2003. It was noted that Members affected by the U.S measures would be entitled to apply re-balancing measures and take any other appropriate action in accordance with WTO rules, unless U.S withdrew the safeguard measures.26
Box 1 Summary of Article XIX of GATT 1994
The Agreement on Safeguards and Article XIX of GATT 1994 provide that a WTO member may apply safeguard measures only if, following an investigation by competent authorities, it determines that imports have increased, that the increase was a result of unforeseen developments and that the increased imports have caused, or threatened to cause, its domestic industry to suffer serious injury. The Agreement further provides that the competent authorities must issue a “report setting forth their findings and reasoned conclusions reached on all pertinent issues of fact and law.”
Source: Patterson, Eliza, “WTO Rules Against US Safeguard Measures on Steel”, www.asil.org November 2003.
Box 2 Ruling of the WTO Panel
The WTO Panel of 11 July 2003 ruled in favour of the co-complainants that the US steel
safeguards are inconsistent with WTO rules because:
1. The US failed to demonstrate that the alleged increased imports were the result of unforeseen developments;
2. For most products, imports have not increased;
3. The US did not properly establish the causal link between the alleged increased imports and the purported serious injury faced by the US steel industry;
4. The US excluded imports from Canada, Mexico, Israel and Jordan from the measures in violation of WTO obligations.
Source: “US steel safeguard measures”, www.europa.eu.int November 10th, 2003
By December 10th, the EU had threatened to retaliate with up to $2.2 billion of tariffs of its own. The goods targeted by the EU sanctioned plan were designed to have a
24 “U.S. Sept steel imports off 43.7 pct from year ago”, www.forbes.com November 25th, 2003 25 op.cit “Next move in Steel: Revocation or Retaliation?” 26 “US-STEEL: The inconsistency of the US steel safeguards with WTO rules is confirmed in
appeal”, www.europa.eu.int November 10th 2003

478
Managerial Economics
political as well as economic impact as Bush sought a second presidential term in 2004. One group was citrus products from Florida, where Bush’s brother was the governor and which was the key to the President’s 2000 election win.27 The products also included Harley Davidson motorcycles and Carolinian textiles. If Bush did not stop protecting the steel producers, then Europe’s tariffs might be imposed on apple pickers in the Pacific Northwest, paper mill workers in the upper Midwest and citrus and garment workers in the Southeast.28 The EU might not be after Mr. Bush, but its proposed sanctions showed that EU attempted to cut down the jobs and also the votes in the U.S. states, such as North Carolina, Wisconsin and Florida.29 Under U.S law, the U.S President had been invested with the legal authority to reduce, modify or terminate the safeguard measures since the U.S International Trade Commission (ITC) issued its mid-term report assessing the impact of the measures on the benefiting industry on September 19th 2003. If the U.S made the right move and fully terminated its steel safeguards, the EU would proceed to repeal its re-balancing measures.30
“These illegal tariffs are not only damaging to industry outside the US,” said
Confederation of British Industry leader, Digby Jones of Britain, “they are actually
harming America’s reputation and American industry, which is paying above the odds
for steel both from home and abroad.”31 Apart from EU, other Asian countries like
Japan, China and South Korea said that they would retaliate if the U.S did not remove
tariffs on imported steel. Japan said it would impose levies of about 30% on U.S iron
and steel products by the end of 2003 if the U.S tariffs remained. Japan would also
raise duties on clothing, leather goods and other household items by about 5% points,
trade ministry officials said. Japan’s sanctions would be worth about $98 million.32
THE PRESIDENT’S DECISION
The U.S. President George W. Bush risked losing support in four states (Exhibit 4)
that cast almost a quarter of the votes he needed to win a second term if he bowed to
pressure from EU and lifted steel tariffs. “There are a lot of steel workers who
recognize Bush did something with tariffs, where past administrations did nothing,”
Tom Usher, chief executive officer of Pittsburgh-based U.S. Steel Corp., the nation’s
largest steel producer, said in an interview. “If he terminates these things early, they
will be passionate in voting against him.”33 According to Wilbur Ross, a decision to
end the steel tariffs might cost the industry as many as 50,000 jobs at steel companies,
as of November 2003, which were on the verge of bankruptcy. Most of those jobs
were in Ohio, Michigan and Pennsylvania. ``If the steel tariffs are lifted, most if not
all of those companies will have to liquidate, and most of those jobs will be lost,’’
Ross said.34 The Bush Administration had argued from the beginning that the tariffs
were needed to give U.S steel producers a breathing space to restructure. However,
the tariffs had become a political embarrassment in the U.S as well as abroad.35 (Box
3)
27 “Bush mulls steel tariff response” www.cnn.com November 11th 2003 28 Moritsugu, Ken, “Bush caught in steel trap”, www.twincities.com November 18th 2003 29 op.cit “Cold Steel” 30 “US Steel Safeguard Measures: Questions & Answers”, www.europa.eu.int November 10th 2003 31 Osborn, Andrew, and Gow, David, “Fear of trade war after US steel tariffs ruled illegal”,
www.guardian.co.uk November 11th 2003 32 op.cit “Bush steel tariffs pit votes at home against EU trade” 33 ibid 34 ibid 35 “Bush mulls end to steel tariffs”, www.news.bbc.co.uk November 13th 2003

479
The U.S. Steel Industry and the Tariff Policy of Bush
Box 3 Statement of Richard Mills, United States Trade Representative Spokesman, after the WTO Appellate Body gave its Judgment.
Statement of Richard Mills USTR Spokesman
Re: WTO Appellate Body Report in the Steel Safeguard Case
The temporary steel safeguard measures the President imposed over a year and a half ago were intended to provide the domestic industry with the breathing space needed to restructure and consolidate, thereby becoming stronger and more competitive. WTO rules specifically allow for the imposition of safeguards for just this purpose, and we believe that the steel safeguard measures are consistent with those rules. An integral part of our commitment to free trade is our commitment to enforcing our trade laws.
“While we are pleased to see the Appellate Body upheld the Panel’s rejection of some of the arguments raised by the complainants, we disagree with the overall Appellate Body findings. We will be reviewing the WTO report carefully.”
Source: www.ustr.gov November 10th, 2003
“If you believe this election is going to be a close election and if you believe the White House has a strategy of hanging onto West Virginia and Ohio and making a play in Pennsylvania and Michigan, then you realize a lot is at stake here,” said William Klinefelter, legislative and political director for the United Steelworkers of America. “They understand the steelworkers’ union is an organized political force in these states.”36
Bush was pressurized from different directions to take some action regarding the tariffs. Finally on December 4th 2003, the President took the decision to lift the steel tariffs, 16 months earlier than originally planned. “I signed a proclamation ending the temporary steel safeguard measures I put in place in March 2002. I took action to give the industry a chance to adjust to the surge in foreign imports and to give relief to the workers and communities that depend on steel for their jobs and livelihoods. These safeguard measures have now achieved their purpose, and as a result of changed economic circumstances it is time to lift them”, said Bush in his statement on December 4th 2003.37 The President also promised to be tough on illegal dumping of steel by the foreign producers and said he would keep a steel import licensing and monitoring system in place to help trade officials respond to unexpected import surges.
The Bush administration had to face an important choice. It could keep the safeguards in place, pleasing steel producers and important constituencies in West Virginia, Pennsylvania, and Ohio. However, doing so would have angered steel users, who had lost more business and jobs as a direct consequence of the safeguards than steel producers had gained. Maintaining the safeguards would also send a signal to the world’s trading nations that the U.S was not prepared to endure the political cost of eliminating steel protection. Also, the administration would run the risk that, in the middle of a presidential election season, foreign countries would exercise their rights under the WTO to retaliate.38
© IBS Case Development Center. All rights reserved.
36 op.cit “Bush steel tariffs pit votes at home against EU trade” 37 “President’s statement on steel”, www.whitehouse.gov December 4th 2003 38 op.cit “Next move in Steel: Revocation or Retaliation?”

480
Managerial Economics
Exhibit 1 Steel Products Subject to U.S Tariffs,
Commencing March 20th, 2002
Year 1 Year 2 Year 3
Certain Flat products
a) Slab Quota of 5.4
million tonnes,
plus a tariff
of30% for
shipments in
excess of quota
Quota of 5.0
million
tonnes, plus a
tariff of
24% for
shipments in
excess of
quota
Quota of 6.4
million
tonnes, plus a
tariff
of 18% for
shipments in
excess
of quota
30% tariff 24% tariff 18% tariff
b) Finished flat products (plate, hot-
rolled sheet and coil, cold- rolled sheet
and coil, coated sheet)
Hot-rolled bar 30% tariff 24% tariff 18% tariff
Cold-finished bar 30% tariff 24% tariff 18% tariff
Rebar 15% tariff 12% tariff 9% tariff
Certain welded tubular products 15% tariff 12% tariff 9% tariff
Carbon and alloy fittings and flanges 13% tariff 10% tariff 7% tariff
Stainless steel bar 15% tariff 12% tariff 9% tariff
Stainless steel rod 15% tariff 12% tariff 9% tariff
Stainless steel wire 8% tariff 7% tariff 9% tariff Tin mill products 30% tariff 24% tariff 18% tariff Source: www.aph.gov.au
Exhibit 2 Actual and Estimated Steel prices of U.S (in Dollars Per Short Ton)
Source: Anton, John, “U.S. Steel Prices Rising as Consolidated Aids Market Discipline”, www.globalinsight.com

481
The U.S. Steel Industry and the Tariff Policy of Bush
Exhibit 3
Results of the U.S Presidential Elections 2000 in the Major Steel Producing States
States Votes for Bush Votes for Gore % of Votes for Bush
% of Votes for Gore
Michigan 1,947,100 2,141,721 47% 51%
Ohio 2,294,167 2,117,741 50% 46%
Virginia 1,431,654 1,221,094 52% 45%
Pennsylvania 2,264,309 2,465,412 47% 51%
Compiled from www.cnn.com
Exhibit 4
U.S Steel Imports (000s of Short Tons) for October, 2003
October2003
September 2003
PercentChange (of Sept, 2003 over Sept,
2002)
October2002
PercentChange (of Oct, 2003 over Oct,
2002)
Total 1,700 1,859 -8.5% 3,024 -43.8%
Japan 91 87 5.1% 112 -18.3%
EU 305 213 43.3% 454 -32.8%
Canada 479 438 9.4% 485 -1.2%
Brazil 150 139 7.8% 400 -62.5%
Korea 58 132 -55.8% 158 -63.0%
Mexico 248 263 -5.7% 422 -41.2%
Russia 7 65 -89.8% 244 -97.3%
China 36 65 -44.1% 97 -62.5%
Australia 28 69 -60.1% 60 -54.1%
South Africa 37 8 368.4% 59 -36.5%
Indonesia 1 5 -78.0% 21 -94.8%
Turkey 53 128 -58.7% 106 -50.1%
Ukraine 1 - 100.0% 8 -86.2%
India 36 20 81.8% 89 -59.1%
Others 169 246 -31.6% 246 -31.6%
Source: www.aiis.org
Transfer Pricing
Rapid globalization has seen increasing levels of intra-firm trade between affiliates
situated in different countries. Companies frequently shift profits to low tax jurisdictions in order to maximize returns. This is most commonly done through
'transfer pricing' of tangibles and intangibles between group companies. However,
despite the tightening of transfer pricing litigation around the world, laws are difficult to implement because they involve significant levels of interpretation as to where
value is actually created. The case highlights this with the help of three caselets:
GlaxoSmithKline, Compaq Computer Corporation and Seagate Technology Inc.. Each of these companies faced litigations related to transfer pricing. The case helps
discuss issues relating to tax avoidance/evasion by shifting profits to low tax countries through transfer pricing.
“Every man is entitled if he can to order his affairs so that the tax attaching under the
appropriate Acts is less than it otherwise would be. If he succeeds in ordering them so as to secure this result, then, however unappreciative the Commissioners of Inland
Revenue or his fellow tax-payers may be of his ingenuity, he cannot be compelled to
pay an increased tax.”
(Lord Tomlin, House of Lords - Duke of Westminster case, 1935)
“On closer inspection, however, one can detect what may be called “fiscal termites” gnawing away at the foundations of their tax systems.”
(Vito Tanzi, former Director Fiscal Affairs Department – IMF Currently Senior Associate, Carnegie Endowment for International Peace,
Washington)
United Nations Conference for Trade and Development (UNCTAD) figures revealed
that there were 37,000 international companies with 175,000 subsidiaries existing in
the early 1990s. These figures swelled to 64,000 international companies with
870,000 subsidiaries in 2003.1 There was also a steady increase in the trade between
affiliates of the same firm. Bureau of Economic Analysis (BEA) data revealed that
while U.S. manufacturing parents’ intra-firm exports as a percentage of total U.S.
manufacturing exports remained steady at about 28% during 1966-1997, its share as a
percentage of total U.S. manufacturing parents’ exports increased from about 39% to
about 49.6% in the same period.2 Intra-firm imports roughly constituted about 40% of
all US imports during the period between 1987 and 2000. Out of this, intra-firm
imports by U.S. parent companies accounted for 14-17% of total U.S. imports (and for
about 40% of U.S. intra-firm imports). More than 80% of these intra-firm imports
related to manufacturing affiliates3.
The major issue that cropped up as a result of this burgeoning intra-firm trade was that
of transfer pricing between parent companies and their affiliates. In the beginning of
2004, GlaxoSmithKline was charged of misappropriating profits between the U.S and
U.K and hence avoiding paying taxes in the U.S.. This was also the case with Compaq
Computer Corporation, which sourced an important component used in the
manufacture of the CPU from Compaq Asia, its subsidiary in Singapore. IRS claimed
1 “A Taxing Battle”, The Economist, January 29th 2004 2Rangan, Subramanian, “Explaining Tranquility in the Midst of Turbulence: U.S.
Multinationals’ Intra firm Trade, 1966-1997”, Bureau of Labor Statistics Working Paper 336, , INSEAD
3 Zeile, William J., “Trade in Goods Within Multinational Companies: Survey-Based Data and Findings for the United States of America”, U.S. Bureau of Economic Analysis
483
Transfer Pricing
that Compaq U.S paid higher prices for this component than what was reasonable and
hence shifted profits to Singapore. Another case was that of Seagate Technology Inc..
Seagate also had a subsidiary in Singapore, which supplied it with disk drives and
components used in the manufacturing process. The IRS contended that not only had
Seagate U.S overpaid its subsidiary for imports, but also undercharged it for the
intangibles supplied to it.
GLAXO SMITHKLINE
A $74 billion4 merger between British rivals Glaxo Wellcome and SmithKline Beecham created Glaxo SmithKline (GSK), the world’s second largest pharmaceuticals company. The company, though incorporated on December 6th 1999 under English law, started its operations on December 27th 2000, the day the merger was completed.
Immediately after the merger, GSK had annual sales of $24.9 billion, a market capitalization of $189 billion and a 7.3% share of the global drug market.5 In the beginning of 2004, GSK had operational headquarters in Philadelphia, USA, and operating companies in about 70 countries, with products sold in over 191 countries. The principal research and development (R&D) facilities were in the U.K, U.S, Japan, Italy and Belgium and products were manufactured in about 41 countries. (Annexure 1). The major markets for the Group’s products were the U.S, Japan, the U.K, France, Germany and Italy.
The Glaxo Wellcome Group was created in March 1995, when Glaxo took over Wellcome for £9 billion. It was principally engaged in the creation and discovery, development, manufacture and marketing of pharmaceutical products. It had operating companies in 57 countries and manufacturing facilities in 33 countries. The company’s products were sold in about 150 countries.
The SmithKline Beecham Group was formed by the merger of SmithKline Beckman and the Beecham Group in 1989. It was also headquartered in U.K with similar activities and had manufacturing facilities in 30 countries and operations in 160 countries.
GLAXO SMITHKLINE - TAXATION BLUES
On January 7th 2004, the Internal Revenue Service (IRS) slammed GSK with a tax claim of $2.7 billion. This tax claim was attributed to the activities of the constituent company, Glaxo Wellcome’s activities during the period 1989-1996. Interest would have added another $2.5 billion to the claim, according to the company’s calculations.6 The IRS claimed that the US subsidiary of Glaxo Wellcome avoided paying taxes in the host country by transferring profits to its parent company in the U.K. An undaunted GSK, however maintained that the taxes it paid were “more than sufficient” to reflect its predecessor’s activities in the U.S.7
The ruling followed a long running battle between GSK and the IRS over charges that the Anglo-American company had transferred profits to its parent in the U.K and hence dodged tax liabilities in the U.S. The IRS had, since 1992, been involved in an audit of Glaxo’s accounts for the period 1989-1999 following the tightening of legislation relating to ‘transfer pricing’ worldwide. Since the current tax bill related only to the period 1989-1996, GSK expected a further bill from the IRS relating to the years 1997-1999.
The controversy stemmed from the sale of such smash hit drugs as the anti-ulcer drug, Zantac, which at one point of time contributed more than half of Glaxo’s total U.S
4 Yahoo Finance 5 GSK Website, www.gsk.com 6 Stewart, Heather, “Glaxo hit by $5bn US tax demand, The Guardian, January 8th 2004 7 GSK Website, www.gsk.com

484
Managerial Economics
revenue. During the decade 1989-1999, Zantac sales amounted to $16 billion.8 Other drugs, which the IRS believed Glaxo America overpaid its British parent for, during the period under question, were the anti-nausea treatment Zofran, the antibiotic Ceftin, the anti-asthmatics Serevent and Ventolin, and Imitrex, which eased migraines. The sale of these drugs amounted to about $13.5 billion during the decade ended 1999. Imitrex, Zofran and Serevent continued to be stars in Glaxo’s drug portfolio and were among the 50 top selling drugs worldwide.9
The moot point about drugs was that once researched and developed, they were cheap to manufacture.10 The research and development of these drugs was undertaken in the U.K while the U.S arm of Glaxo was responsible for their sales and marketing on U.S soil. The government contended that Glaxo had overvalued the cost of research and development in Britain while undermining the marketing costs incurred in the U.S, which had been instrumental in the drug’s success in America. What resulted, was the American arm of Glaxo over-paying its parent for drug imports and thus effectively shifting earnings onto British soil (Exhibit A). Glaxo however, said that it had correctly allocated profits between Britain and the U.S.
GSK planned to contend the case in court. But, the trials were not likely to begin until 2005-2006.
TRANSFER PRICING ISSUES
As GSK prepared for a long drawn out court battle, a statement from the company downplayed the issue by stating, “Disagreements with and between revenue authorities as to tax allocations between related companies in different tax jurisdictions are inevitable for a global business such as GSK.”11
Analyst, Christian Wenk at Standard & Poor’s credit-rating agency in London said that it was not unusual for companies to locate their manufacturing facilities in low-tax countries, such as Ireland, Singapore and Puerto Rico and then import and sell the products into the United States. He believed that most pharmaceutical companies did this.12
8 Simpson, Glenn R., “Glaxo in Major Battle with IRS Over Taxes on Years of U.S. Sales”, The
Wall Street Journal, June 11th 2002 9 Simpson, Glenn R., “Glaxo in Major Battle with IRS Over Taxes on Years of U.S. Sales”, The
Wall Street Journal, June 11th 2002 10 www.corpwatch.org 11 GSK Website, www.gsk.com 12 The Philadelphia Inquirer Online (January 8th 2004)
Exhibit A
Glaxo America
Sales and Marketing
Glaxo U.K.
Research & Development
PROFITS
(Excessive) payments
Drug imports

485
Transfer Pricing
The case involved “issues about where value is created,” Glaxo’s lawyer John Magee told Tax Court Chief Judge Thomas B. Wells during a hearing in 2003.13 In the drug industry, there were lots of room for interpretation because the cost of raw materials was negligible, while the value of research, marketing and other overheads were much higher; but ultimately very subjective. “You are dealing with fundamental questions, such as what creates value,” said KPMG’s Ted Keen. “And the answer is different every time.”14
Newspapers like ‘The Guardian’ felt that Glaxo was being victimized because it was a pioneer in manufacturing in low tax countries. Along with Wellcome (which Glaxo acquired in 1995) it was among the first to invest in Singapore. The ulcer pill ‘Zantac’ was being manufactured in Singapore during its heyday15.
In December 1999, Glaxo had formally requested relief under the ‘U.S - U.K Convention for the Avoidance of Double Taxation’. Britain’s Inland Revenue department had been siding with Glaxo, asserting that the company’s profits had already been taxed in Britain and that any new levies from the U.S constituted double taxation.16 But discussions between the tax authorities of the two countries broke down without any result.
Glaxo had faced similar charges from the Canadian Tax Authorities relating to the period between 1990 and 1993. The authorities claimed that Glaxo had paid three times the normal price for sourcing ranitidine, an active ingredient in the manufacture of Zantac, from its Swiss subsidiary. Glaxo had made an appeal on this case.
COMPAQ COMPUTER CORPORATION
In 1982, three former employees of Texas Instruments managed to assemble a personal portable computer on a paper mat in a Houston Restaurant. This feat of developing a computer which could run all software being developed for the IBM PC at that time encouraged them (with help from Sevin-Rosen Partners, a high-tech venture capital firm) to form the Compaq Computer Corporation. Ben Rosen (from Sevin-Rosen Partners) continued as chairman of Compaq’s board of directors until September 2000 when Compaq CEO Michael Capellas was elected chairman of the board by a unanimous vote.
Compaq became the world’s largest manufacturer of PCs in 199417 and the numero uno company in high-performance technical computing worldwide - shipping more than a million servers and raking in $42 billion in sales in the year 200018. This success was attributable to Compaq’s uncanny ability of developing high-quality products quickly and efficiently. It also built up a vast empire setting up manufacturing subsidiaries around the globe including Singapore, China and Brazil and expanding sales in developing markets such as in the Asia-Pacific and Latin America.
COMPAQ AND TRANSFER PRICING
In 1999, Compaq Computer Corporation, Houston (Compaq US) was slapped with tax deficiency notices and penalties (Exhibit B) by the IRS, which claimed that the Houston based company, had underpaid its taxes in the US for years 1991 and 1992. This related to transactions between Compaq US and its Singapore subsidiary, Compaq Asia (Pte) Ltd. (Compaq Asia) for the purchase of printed circuit assemblies
13 ibid 14 “A Taxing Battle”, The Economist, 29 January, 2004 15 www.corpwatch.org 16 “GSK Vows to Fight $5.2bn US Tax Bill”, www.THISDAYOnline.com, January 12th 2004 17 Compaq Computer Corporation and Subsidiaries V. Commissioner of Internal Revenue,
United States Tax Court, Tax Ct. Docket No. 24238-96, Filed on July 2nd 1999 18 Compaq website, Investor Relations <h18020.www1.hp.com/corporate/ir/co/irco.html>

486
Managerial Economics
(PCAs) during the period 1990-1993. The IRS claimed that these transactions were not carried out at arms’ length prices and hence profits were shifted to Singapore.
Exhibit B Taxes Claimed by the IRS from Compaq US
Taxable Year Ended Deficiency Penalty Sec. 6662(a)Nov. 30, 1991 $42,422,470 –
Nov. 30, 1992 $33,533,968 $547,619
Source: Compaq Computer Corporation and Subsidiaries V. Commissioner of Internal Revenue, United States Tax Court, Tax Ct. Docket No. 24238-96, Filed on July 2nd 1999
Sourcing PCAs
The PCA is an important electronic component of the Central Processing Unit (CPU) of a computer. It consists of a printed circuit board, the communication platform to which components are attached, and any number of combinations of chips, resistors, and capacitors. These circuits and boards interconnect to deliver a desired electronic function. PCAs fall into five different categories viz. processors, power supplies, memory boards, video boards, and a general category entitled backplane/other.
Compaq US, which was engaged in the CPU manufacturing process decided in the mid-1980s to leverage on the low cost of manufacturing of PCs and PCAs in the Asian markets. But, after two failed attempts at sourcing PCAs from Singapore – one in 1984 involving Automated Assembly of Singapore and the other in 1986 involving Bolnar, Compaq finally decided to set up its wholly owned subsidiary, Compaq Asia in Singapore in 1986. The company so formed was primarily engaged in the business of manufacturing PCAs using latest technology supplied by its parent company. It was this advanced technology that enabled Compaq Asia to produce PCAs that were far superior from a quality point of view than other local manufacturers in Singapore. Hence it did not have to compete with them in meeting the stringent requirements of Compaq US.
Compaq US manufactured CPUs at its facilities in Houston(Compaq US), Singapore(Compaq Asia) and Scotland(Compaq Computer Manufacturing Ltd.). It had three sources from which to meet its PCA requirements. These were Compaq Asia, various unrelated PCA contractors primarily from the US, and Compaq US itself. However, Compaq Asia met 50% of all PCA requirements during 1990 through 1993 (Exhibit C).
Exhibit C Purchase of PCAs by Compaq US, Houston from Compaq Asia, Singapore
Power Supplies
Processors MemoryBoards
VideoBoards
Backplane/ Other
Total
1991 Unit sales 1,065,966 382,286 30,191 74,090 180,611 1,733,144
Revenue $143,474,373 $167,151,642 $5,570,843 $11,632,130 $11,919,452 $339,748,440
1992 Unit sales 1,293,140 514,154 0 195,751 1,571,896 3,574,941
Revenue $94,643,303 $187,135,315 $0 $24,260,291 $73,486,057 $379,524,966
Total for 1991 and 1992 Unit sales 2,359,106 896,440 30,191 269,841 1,752,507 5,308,085
Revenue $238,117,676 $354,286,957 $5,570,843 $35,892,421 $85,405,509 $719,273,406
Source: Compaq Computer Corporation and Subsidiaries V. Commissioner of Internal Revenue, United States Tax Court, Tax Ct. Docket No. 24238-96, Filed on July 2nd 1999

487
Transfer Pricing
Pricing PCAs
Both Compaq US and Compaq Asia tracked their manufacturing costs using a standard cost system that assigned specific costs to arrive at material, labor and overhead standards. Standard material costs (for both the Houston and Singapore locations) were determined on the basis of estimates of future costs expected to be paid for purchase of materials from vendors on the Compaq US Approved Vendor List (AVL). However the standard labor and overhead costs for the two facilities varied, based on forecasted production at the two locations. The standard costs for material, labor, and overhead for Compaq Asia were generally much lower than that of the parent company.
Purchases of PCAs from Compaq Asia were made at prices set semiannually by the Compaq US tax department. These prices were based on Compaq US’s standard manufacturing costs, which it also used as a benchmark for purchasing PCAs from other unrelated subcontractors. Compaq U.S. paid what is recognized in the industry as the turnkey price for the PCAs sourced from Compaq Asia with some adjustments (Annexure 2). Compaq Asia sales to Compaq U.S. during 1991 and 1992 were 101.5 and 88.1 percent of Compaq US’s standard cost to produce the PCAs, respectively. On an aggregate basis, Compaq Asia sold PCAs to Compaq US at an average transfer price that was equal to 93.9% of Compaq US’s standard costs for 1991 and 199219.
This was not acceptable to the IRS, which believed that this transfer price was too high considering the low cost of manufacturing in Singapore and was intended at shifting earnings to the low-tax country. On an enquiry (and subsequent notice) for the sale price charged for the transactions with Compaq Asia, the parent company justified its “Cost Plus” pricing by resorting to the Comparable Uncontrolled Price (CUP) method of determining transfer prices. Compaq US argued that the prices as paid to Compaq Asia were justified as the latter also incurred costs involving compensation for overtime, rework performed, changes in material prices, changes in the delivery schedule, material cancellation costs, inventory shrinkage, production scrap, setup charges, or obsolete inventory. There was a difference in the way Compaq US treated the management of leftover materials for Compaq Asia and other subcontractors (Compaq Asia was responsible for leftover parts while Compaq US reimbursed unrelated subcontractors for leftover parts). Also, Compaq US paid Compaq Asia in 90.9 days while unrelated subcontractors were generally paid in 30.3 days on an average. Another transactional difference was that Compaq US paid for setup charges in transactions with unrelated subcontractors (which amounted to a whopping $2.9 million during 1991 and 1992) while not making comparable payments to Compaq Asia20.
During 1990 through 1993, 93% of Compaq U.S. purchases from subcontractors were from subcontractors located in the United States21. The prices that Compaq US paid to these unrelated subcontractors were used as a benchmark for its standard manufacturing costs. Since the whole issue was about pricing, the difficulty was to prove that transactions with the US unrelated parties could be viewed at an even keel with transactions with the Asian subsidiary for pricing purposes.
With a focus on quality, Compaq US had concentrated on developing its vendors. Its vendor selection process was also very stringent and parameters like manufacturing technology, financial stability and management excellence were used to select a vendor. Compaq US also insisted (barring a few exceptions) that its vendors use the same technology that it (and Compaq Asia) used in its manufacturing process. Hence
19 Compaq Computer Corporation and Subsidiaries V. Commissioner of Internal Revenue, United States Tax Court, Tax Ct. Docket No. 24238-96, Filed on July 2nd 1999
20 ibid 21 Compaq Computer Corporation and Subsidiaries V. Commissioner of Internal Revenue,
United States Tax Court, Tax Ct. Docket No. 24238-96, Filed on July 2nd 1999

488
Managerial Economics
the technology as used by the U.S subcontractors could be considered to be the same as that used by Compaq Asia for all practical purposes.
It was ultimately determined that the PCAs that Compaq US sourced from unrelated subcontractors were nearly identical to PCAs sourced from Compaq Asia. After adjustment for differences in physical property and circumstances of the sales, the prices that Compaq US paid to the unrelated subcontractors for PCAs were comparable to the prices that Compaq U.S. paid to Compaq Asia for PCAs. Hence the court ruled that the IRS’s claim for more tax did not hold good.
SEAGATE TECHNOLOGY INC.
Founded in 1979 in Scott’s Valley, California, Seagate Technology, Inc. (Seagate US) was a worldwide leader in designing, manufacturing and marketing of hard disc drives. According to data pertaining to the year 2000, it had 48% share of the enterprise drives market and 35% of the personal storage sector. According to IDC, Seagate was the largest manufacturer of hard disc drives in terms of unit shipments, with a 30.5% market share for the 12 months ended December 27th 2002.22 The company’s revenue for fiscal year 2003 was $6.49 billion.23
Seagate achieved its dominant market share through ownership of critical component technologies, dedication to advanced research and development and focus on manufacturing and supply chain efficiency and flexibility. In addition to disk drive system development and manufacture, Seagate US also developed and manufactured disk drive components.
Seagate Singapore
Seagate US has several subsidiaries around the world (Annexure 3). It conducted all of its manufacturing activities in Scott’s Valley, California, and Watsonville, California, prior to the time Seagate Singapore was formed. In 1983-1984, Seagate Singapore acquired proprietary information relating to the manufacture of disk drives and disk drive components from Seagate US. Subsequently, during October 1983, Seagate US began moving some of its disk drive manufacturing operations to Seagate Singapore to take advantage of Singapore’s large, qualified and cheap labor supply24.This, the senior management at Seagate believed would help the company remain competitive by reducing costs (on August 12th 1983, the Economic Development Board approved Seagate Singapore’s application for certain investment incentives, including exemption from Singapore taxation, and granted tax relief to Seagate Singapore for 10 years commencing October, 1982), as also help it capture a fair share of the growing East Asian market.
Seagate Singapore began selling component parts for disk drives to Seagate US in the taxable year ended June 30th 1983, and disk drives in the taxable year ended June 30th
1984 (Exhibit D) and paid royalty to its parent for making use of its know-how.
Exhibit D Volumes of Seagate Singapore’s Disk Drive Sales
Year Volume 1984 125,919
1985 568,753
1986 1,397,823
1987 3,413,463
22 www.seagate.com 23 ibid 24 Seagate Technology Inc. and Consolidated Subsidiaries V. Commissioner of internal
Revenue, United States Tax Court, Tax Ct. Docket No. 11660-90, Filed on February 8th 1994

489
Transfer Pricing
Source: Seagate Technology Inc. and Consolidated Subsidiaries V. Commissioner of internal Revenue, United States Tax Court, Tax Ct. Docket No. 11660-90, Filed on February 8th 1994
Transfer Pricing Issues
Upon audit, the IRS claimed that transactions between Seagate US and Seagate Singapore were not at arms length. The major issues revolved around ‘royalty payments’ made by the Singapore subsidiary to its parent company and the payments made by the parent company to the subsidiary on purchase of component parts and disk drives.
Royalty
Royalty was to be paid by Seagate Singapore to its parent for the use of the latter’s corporate name, logos, trademarks, know-how including engineering, manufacturing and operating information relating to the use and application of the disc drive technology, etc. Under the Royalty Agreement, Seagate Singapore was to pay Seagate US a royalty of 1% on sales, into the United States, of products in lieu of using the disk drive technology acquired from and any technical assistance received from the parent company. In mid-1986, the two companies also entered into a marketing contract, which stipulated that Seagate Singapore would pay Seagate US a sales and marketing commission of 5% on all its third party sales, excluding sales to distributors in Southeast Asia, the Indian Subcontinent, and the China Basin in exchange for sales and marketing support from Seagate US including sales effort, marketing surveys and analyses, identification of product requirements and state of technology in the United States, and assistance in negotiating sales and contracts with customers25.
The IRS claimed that Seagate US had developed for itself a wide-ranging set of marketing and other intangibles, which had enabled it to become a leading disk drive supplier. Referring to other marketing and trading agreements between the parent company and unrelated third parties, which it deemed to be comparable, the IRS claimed that Seagate Singapore should pay to its parent an additional royalty of atleast 2% for the use of the latter’s marketing intangibles. This, the IRS said, would value the benefit of the royalty arrangement at arms length.
Seagate US argued that the need for an additional 2% royalty did not exist because of the relative insignificance of trade names and trademarks in the disk drive industry. It further stated that because the nature of the disk drive industry where intangibles did not permit an above-normal return, no entity in the industry would pay 2% of sales to find potential customers. According to Seagate, intangibles in the industry did not protect against competition and profitability depended purely on efficient manufacturing. It further contended that additional royalty was unjustified in the light of the fact that the technology it licensed to Seagate Singapore was not distinguishable from that of its competitors.
Pricing Component Parts
As far as the issue of pricing of components and disk drives went, in the beginning, Seagate US used its own standard costs as the transfer price for buying components and disk drives from Seagate Singapore. Later it changed this price to the standard costs of Seagate Singapore (including an estimate for scrap and obsolescence costs) plus a markup of 25%. This price was not adjusted for any difference between actual and standard costs. Standard costs were, however, changed from time to time to reflect changed circumstances or to correct errors26.
Besides Seagate US, Seagate Singapore also sold some of its component parts to other unrelated disk manufacturers. These sales, however, represented only a minuscule
25 Seagate Technology Inc. and Consolidated Subsidiaries V. Commissioner of internal Revenue, United States Tax Court, Tax Ct. Docket No. 11660-90, Filed on February 8th 1994
26 ibid

490
Managerial Economics
percentage of Seagate Singapore’s total sales and ranged from less than 0.5% to 4% of total sales for the years 1985-1987.
In July 1984, Seagate Singapore had sold some component parts (480 pieces each of two components which together formed a subassembly) to Bull Peripheriques. During the trials, Seagate US contended that prices for these two component parts sold to Bull Peripheriques were arms’ length and, under the CUP (Comparable Uncontrolled Price) method, should be used to determine the transfer price for its intercompany sales. It further said that Seagate Singapore had earned Gross Profit Margins of 43% and 42% respectively on the sale of the two components. This compared favorably to the profit percentages earned by Seagate Singapore on it overall transactions (Exhibit E). This showed that the subsidiary was not earning an above normal return from its transactions with its parent and hence no adjustment of transfer prices was required.
Exhibit E Profit Margins Earned by Seagate Singapore
Period Ended Gross Profit as a Percent of Sales
Gross Profit as a Percent of Cost of Sales
30-Jun-83 17.60% 21.39%
30-Jun-84 18.40% 22.57%
30-Jun-85 16.60% 19.86%
30-Jun-86 22% 28.33%
30-Jun-87 8.79% 0.51%
Source: Seagate Technology Inc. and Consolidated Subsidiaries V. Commissioner of internal Revenue, United States Tax Court, Tax Ct. Docket No. 11660-90, Filed on February 8th 1994
The court however turned down this argument on three counts. First, separate data on Seagate Singapore’s gross profit percentages earned for sales made to its parent and to other unrelated parties was not available. Second, gross profit percentage calculated on the transaction with Bull Peripheriques was arrived at using standard costs which might or might not have approximated the actual costs. And third, the court was wary of reliance on the Bull Peripheriques transaction because of its insignificant volume and the uncertainty as to whether the other economic circumstances relating to those sales were sufficiently similar to the circumstances of sales of component parts to the parent company.
Pricing Disk Drives
Seagate US purchased disk drives from Seagate Singapore and resold them to third parties. It also provided a 12-18 month warranty on these products. The IRS believed that with a motive of shifting profits to Singapore, Seagate US paid its subsidiary excessive prices for the disk drives. Further, it said that a reasonable transfer price would have been a discount of 20% of the resale price of the disk drive sales marketed and contracted by Seagate US.
Seagate US put forward data regarding Seagate Singapore’s transactions with other unrelated parties (partial list as Exhibit F) and, based on the weighted average sale price for these sales, contended that as per the CUP method of determination of transfer prices, the dealings with its subsidiary had been done at arms’ length.
The court held that while it was convinced that the disk drives involved in Seagate US’s CUP analysis were similar to the disk drives it purchased from its subsidiary, it remained skeptical of the similarity between the circumstances involving the uncontrolled sales and the circumstances involving the controlled sales.27 Differences in circumstances (like volume of sale, level of market, geographic market, and timing
27Seagate Technology Inc. and Consolidated Subsidiaries V. Commissioner of internal Revenue, United States Tax Court, Tax Ct. Docket No. 11660-90, Filed on February 8th 1994

491
Transfer Pricing
of sale) became material in the light of the fact that they had a bearing on the price of sale.
Finally, the court was doubtful if the usage of the weighted average sale price for all third party sales could be used as comparable price for the controlled transactions. This was because the average price charged by Seagate Singapore from third party customers, who were at the same level of the market for identical disk drive models often varied significantly (Exhibit F). Such contrasting prices indicated that a number of factors, including timing of sales were involved in setting the prices for the uncontrolled sales. Thus Seagate US’s contention that its transfer prices were reasonable based on the CUP method, was turned down.
Exhibit F Partial List of Sales made by Seagate Singapore to Outside Unrelated
Parties
1984
ST412
Third Party Net sales Average Net
Customer Units Sales Price
IBM (Australia) 1,152 $410.76
IBM (Scotland) 18,688 343.83
IBM Boca 40,320 420.00
Wang (Scotland) 94 440.00
1985
ST212
Third Party Net Sales Average Net
Customer Units Sales Price
Carion Industrial Corp. 2,086 $219.43
Corion Industrial Corp. 136 326.91
Dynatech Singapore Pte,
Ltd.
5 450.00
Ing. C. Olivetti & C, Spa 2,020 270.00
Laser Computer, Ltd. 1,477 274.27
MCAB 168 265.00
NCR Germany 3,460 260.92
Powermatic Data Systems 851 240.24
Ras America Co., Ltd. 1 290.00
Ras America Co., Ltd. 497 267.06
Source: Seagate Technology Inc. and Consolidated Subsidiaries V. Commissioner of internal Revenue, United States Tax Court, Tax Ct. Docket No. 11660-90, Filed on February 8th 1994
© IBS Case Development Center. All rights reserved.

492
Managerial Economics
Annexure 1 Partial List of GSK Group Companies
Region Country Location Subsidiary undertaking
Segment Activity
Europe England Greenford Glaxo Wellcome
plc
Ph h
Glaxo Group Ltd Ph h
Glaxo Wellcome
Export Ltd
Ph e
France Paris Groupe Glaxo
Wellcome
Ph r p m
Germany Hamburg Glaxo Wellcome
GmbH & Co
Ph p m
Ireland Dublin Glaxo Wellcome
Ltd
Ph p m
Italy Verona Glaxo Wellcome
Finanziaria SpA
Ph h f
Netherlands Zeist Glaxo Wellcome
BV
Ph m
Switzerland Berne Glaxo Wellcome
AG
Ph m
USA USA Research
Triangle Park
Glaxo Wellcome
Inc
Ph r p m
Americas Bermuda Hamilton Glaxo Wellcome
Insurance
(Bermuda) Ltd
Ph i
Asia India Mumbai Glaxo India Ltd Ph p m
Singapore Singapore Glaxo Wellcome
Singapore Pte Ltd
Ph m
Latin Argentina Buenos Aires Glaxo Wellcome
SA
Ph p m
America
Brazil Rio de
Janeiro
Glaxo Wellcome
SA
Ph p m
Chile Santiago Glaxo Wellcome
Farmaceutica Ltda
Ph m
Africa Kenya Nairobi Glaxo Wellcome
(Kenya) Ltd
Ph p m
Morocco Casablanca Glaxo Wellcome
Maroc SA
Ph m
South Africa Midrand Glaxo Wellcome South Africa (Pty) Ltd
Ph p m
493
Transfer Pricing
Ph Pharmaceuticals,
CH Consumer Healthcare
d development,
e exporting,
f finance,
h holding company,
i insurance,
m marketing,
p production,
r research
Source: www.gsk.com
Annexure 2
In turnkey transactions, unrelated subcontractors purchase materials and components from suppliers on the Compaq U.S. AVL, paying the same prices as Compaq U.S. The turnkey price paid by Compaq U.S. compensated unrelated subcontractors for materials, labor, and overhead as well as a profit markup on each. In contrast, Compaq U.S. purchased other PCA’s on a consignment basis. In consignment transactions, Compaq U.S. consigned raw materials and components to the subcontractor, and the consignment price paid by Compaq U.S. compensated unrelated subcontractors for their labor and overhead costs plus a profit on the labor and overhead.
In 1991 and 1992, the transfer prices for Compaq Asia PCA’s were set using a cost-plus formula. The formula was Compaq U.S. labor and overhead costs minus Compaq U.S. overhead costs that would continue to be incurred by Compaq U.S. despite manufacture of PCA’s at Compaq Asia (Compaq U.S. fixed overhead costs) multiplied by 1.15 plus Compaq U.S. material costs. Compaq Asia costs were not used as part of the transfer price analysis.
In 1992, the formula was amended, and Compaq Asia material, labor, and overhead costs were multiplied by 1.3, plus a total location savings times 0.3. The total location savings was calculated by subtracting Compaq Asia material, labor, and overhead costs and Compaq U.S. fixed overhead costs from Compaq U.S. standard material, labor, and overhead costs.
Source: Compaq Computer Corporation and Subsidiaries V. Commissioner of Internal Revenue, United States Tax Court, Tax Ct. Docket No. 24238-96, Filed on July 2nd 1999

494
Managerial Economics
Annexure 3
Seagate Subsidiary Incorporated in
Principal Activities
Seagate Singapore (Singapore) July 1982 Assembles and
manufactures disk
drives and disk drive
components
Seagate Technology
(Thailand). Ltd.
October 1983 Assemble disk drive
components, including
E-bolds and head
assembles
Seagate Technology Gmbh
(Germany)
February 1984 Primarily to market disk
drives to European-
based customers
Seagate Technology
International (Cayman Islands)
May 1984 n.a.
Seagate Technology Scotland,
Ltd (Scotland)
January 1985 Service, test, and repair
Seagate US’s disk
drives and related
components
Seagate Technology Japan,
Ltd (Japan)
March 1985 Procure materials on
behalf of Seagate US’s
manufacturing facilities
Seagate Magnetics (US)* 1985 U.S. manufacture of
disks used in disk drives
*Formerly Grenex Inc. (acquired by Seagate US in 1985)
Source: Seagate Technology Inc. and Consolidated Subsidiaries V. Commissioner
of internal Revenue, United States Tax Court, Tax Ct. Docket No. 11660-90, Filed
on February 8th 1994

Standard Chartered Bank’s Accounting Policies
INTRODUCTION
Headquartered in London, Standard Chartered (Stanchart) a global bank with a strong presence in the emerging markets1 had completed 150 years of worldwide operations in 2003. The bank offered both Consumer and Wholesale banking services and employed 30,000 people in 50 countries (over 500 locations). It was one of the note-issuing banks, in Hong Kong2 with approximately 80 branches. Stanchart had operations in every Asia Pacific market with the exception of North Korea. The bank generated approximately 60% of its profits from the Asia Pacific region and 30% of its profits from Hong Kong. Stanchart was listed on both the London Stock Exchange and the Stock Exchange of Hong Kong. In December 2002, the company generated revenues of $4.5 billion3 and net profit of $1.9 billion4. The bank believed its principal strength was in corporate and institutional banking, and supporting regional and international cross-border trade and investments.
BACKGROUND NOTE
Stanchart began in 1853, as the Chartered Bank of India, Australia and China to finance trade between the UK and its Asian colonies. Over the next 40 years, the bank expanded throughout Asia. In the 20th century, the bank opened branches in Germany and USA. In 1957, it entered the Middle East by acquiring Eastern Bank. In 1969, it merged with the Standard Bank Limited (founded in 1862) and formed Stanchart. The bank took advantage of the Asian financial crisis of the late 1990s, to buy up operations in Indonesia and Thailand, and moved into China through a pact with the Bank of China. In March 1999, the bank acquired the trade finance operation of Schweizerische Bankgesellschaft-Union Bank of Switzerland (UBS). This acquisition made Stanchart one of the leading clearers of dollar payments in the US. In late 1999, the bank opened a new subsidiary, Stanchart Nigeria in Lagos, and also acquired a 75% stake in Nakornthon Bank, Thailand and an 89% stake in Metropolitan Bank of the Lebanon.
In the early 2000s, Stanchart made two large acquisitions. It purchased Grindlays Bank from the ANZ Group and then acquired the Chase Consumer banking operations in Hong Kong. These acquisitions expanded Stanchart’s reach in emerging markets. The Greenwich survey for 2001, nominated Stanchart the "Best Cash Management Service Quality Bank" in India. In 2003, Stanchart won the Banker magazine’s ”Bank of the Year” Award for Africa. Stanchart was the first bank in India to introduce ‘On-Line Treasury’, a browser-based dealing system that enabled real-time transactions. It was also recognized as a leading market maker for Indian Rupees.
BUSINESS SEGMENTS
Stanchart’s Consumer banking segment offered a wide range of premium banking products and services including domestic and NRI transaction accounts with several value-added products and services like ATM and globally valid Debit Card, phone banking, extended banking, 24-hour banking, any branch banking, door step banking and investment advisory services, distribution of capital market and insurance
1 Markets of Asia, Africa and Middle East. 2 The Chartered Bank opened its first branch in Hong Kong in 1859 and was given a license to
issue Hong Kong bank notes in 1862.
3 Annual Report 2002. 4 Annual Report 2002.

498
Accounting for Managers
products, dematerialization services and loans against shares. Stanchart also offered Priority Banking, essentially personalized banking for high net-worthy individuals. The Credit Cards and Personal Loans division provided co-branded cards with unique value propositions. It offered a range of personal loan products and also a personal line of credit through various products. The Card division was the first in South Asia
to be accorded ISO 9002 certification5.
The Wholesale banking segment operated through a network of Corporate and Institutional banking units. The bank’s representative offices were responsible for the marketing, advisory and support services. They assisted in the identification of
business opportunities for other units in the group such as Treasury (NDF's6, FX
7,
Options, Derivatives, etc.), Trade Finance (L/C's8, Export and Import Financing),
Cash Management and Structured Trade and Export Financing (Pre-shipment Financing, Export Credit Agencies, etc.). Stanchart attempted to offer services with a unique combination of both global and local perspectives. The bank’s fixed income strategists, technical analysts and economists were located in London, Dubai, Hong Kong, Singapore, India and Indonesia. Stanchart provided a complete 24-hour coverage of the world's foreign exchange markets.
Exhibit I
Stanchart Bank: Net Revenue
2002 2001 $ Million Consumer
Banking Wholesale Banking Total Consumer
Banking Wholesale Banking Total
Net interest income
1,867 1,196 3,063 1,702 1,198 2,900
Other income 549 927 1,476 520 985 1,505
Net Revenue 2,416 2,123 4,539 2,222 2,183 4,405
Source: Annual Report 2002
Figure I Stanchart Bank: Geographical Segment Revenue
��������������������������������������������������������������������������������������������������������������������
����������������������������������������
����������������������������������������������������
��������������������������������������������������������
������������������������������������������������
��������������������������������
������������������������������������������
US $ in Million2002
30%
10%
5%12%
8%
11%
7%
17%
��������HongKong��������
Singapore����
Malayasia����Other Asia Pacific����
����India region��������
Middle East & Other South Asia����
Africa����United Kingdom & the Americas
Source: Annual Report 2002
5 www.standardchartered.com 6 A synthetic forward contract on a non-convertible or thinly traded currency. 7 The common term for the foreign exchange market. Brokerage firms and banks were
connected over an electronic network that allowed them to convert the currencies of most countries.
8 Letter of Credit (L/C) was an instrument issued by a bank in favor of a Beneficiary, which substituted the bank's credit for that of its customer. This reduced the risk that payment might be delayed or otherwise jeopardized by political or foreign exchange problems in the customer's country, or by the customer's refusal or inability to pay the bank for any reason.

499
Standard Chartered Bank’s Accounting Policies
ACCOUNTING POLICIES
Stanchart prepared its consolidated financial statement along with its subsidiaries in
accordance with the UK Companies Act 1985, applicable accounting standards and
the British Bankers’ Association’s Statements of Recommended Accounting
Practices.
BAD AND DOUBTFUL DEBTS
Stanchart maintained two types of provisions against loans and advances – specific
and general. Specific provisions were made where the repayment of identified loans
was in doubt and reflected an estimated amount of loss expected. The general
provision was the inherent risk of loan losses, which had not been separately
identified, but was known from experience to be present in any loan portfolio.
Provisions were also made against cross border exposures where a country had
experienced external liquidity problems and doubts existed over their full recovery.
Provisions were applied to write off advances, when considered wholly or partly
irrecoverable. Interest on loans and advances was accrued till such time as reasonable
doubt existed about its collectability or until all or part of the loan was written off.
Interest continued to accrue on customers’ accounts, but was not included in income.
Such suspended interest was deducted from loans and advances in the balance sheet.
Exhibit II
Stanchart Bank: Segment Wise Provision for Bad and Doubtful Debts
$ million 2002 2001
Loans to individuals
Mortgages 76 74
Other 51 136
Consumer Banking 127 210
Agriculture, Forestry and Fishing 5 8
Construction 7 43
Commerce 129 218
Electricity, Gas & Water 11 1
Financing, Insurance& Business Services 13 70
Loans to Government - 5
Mining & Quarrying 28 39
Manufacturing 244 262
Commercial Real Estate 1 3
Transport, Storage &Communication 3 13
Other 17 42
Wholesale Banking 458 704
Provision for Bad and doubtful debts against loans & advances to customers
585 914
Provision for Bad and doubtful debts against loans & advances to Banks
103 37
Total provisions for bad &doubtful debts 688 951
Source: Annual Report 2002

500
Accounting for Managers
Exhibit III
Stanchart Bank: Provision for Bad and Doubtful Debts
2002 2001 $ million
Specific General Specific General Provisions held at 1 January 951 - 1,146 468
Exchange translation differences 1 - (12) -
Amounts written off (1,008) - (633) -
Amounts written down (23) - (368) -
Recoveries of amounts previously written off 65 - 51 -
Other (3) - 35 -
New provisions 1,012 - 994 -
Recoveries /Provisions no longer required (307) - (262) -
Net charge against profit 705 - 732 -
Provisions held at 31 December 688 468 951 468
Source: Annual Report 2002
INVESTMENT SECURITIES
Investment Securities included the company’s equity shares, debt and treasury bills, which were declared at cost less any provision for permanent reduction in value. The cost of dated investment securities was adjusted to reflect the amortization or accretion of premiums and discounts on acquisition on a straight-line basis over the residual period to maturity. The amortization and accretion of premiums and discounts were included in interest income. Securities other than investment securities were classified as dealing securities and were held at market value or cost whichever was higher.
Exhibit IV Stanchart Bank: Investment Securities Listed on Recognized UK
Exchange
2002 2001
$ Million
Book amount
Investment Securities
Valuation Investment Securities
Book amount Investment Securities
Valuation Investment Securities
Listed on recognized UK exchange
Own shares 57 58 1 1
Other 1 1 - -
Listed elsewhere 69 66 10 12
Unlisted 123 123 98 98
250 248 109 111 One year or less 6 5 - -
One to five years 45 46 26 27
More than five years - - 4 4
Undated 199 197 79 80
250 249 109 111 Source: Annual Report 2002

501
Standard Chartered Bank’s Accounting Policies
Exhibit V
Stanchart Bank: Investment Securities
$ Million Book amount Investment Securities
Book amount Dealing
Securities
Book amount Total Debt Securities
ValuationInvestment Securities
2002 2001 2002 2001 2002 2001 2002 2001
Issued by public bonds:
Government securities 5,498 4,454 733 1,006 6,231 5,460 5,606 4,532
Other public sector securities
599 607 - 20 599 627 607 613
6,097 5,061 733 1,026 6,830 6,087 6,213 5,145
Issued by banks:
Certificates of deposit 4,260 3,872 32 61 4,292 3,993 4,258 3,841
Other debt securities 4,494 2,260 247 33 4,741 2,293 4,492 2,261
8,754 6,132 279 94 9,033 6,226 8,750 6,102
Issued by issuers:
Bills discountable with recognized markets
- - 113 137 113 137 - -
Other debt securities 3,547 3,252 664 269 4,211 3,521 3,556 3,258
3,547 3,252 777 406 4,324 3,658 3,556 3,258
Total debt securities 18,398 14,445 1,789 1,526 20,187 15,971 18,519 14,505
Of which:
Listed on a recognized UK exchange
4,167 4,208 24 - 4,191 4,208 4,169 4,219
Listed elsewhere 7,244 4,109 692 108 7,936 4,217 7,350 4,145
Unlisted 6,987 6,128 1,073 1,428 8,060 7,546 7,000 6,141
18,398 14,445 1,789 1,526 20,187 15,971 18,519 14,505
Source: Annual Report 2002.

502
Accounting for Managers
DEFERRED TAXATION
Deferred taxation was the tax attributable to timing differences9 or a liability that
resulted from income already earned and recognized for accounting purposes, but not
for tax purposes, that was recorded on the balance sheet. Stanchart adopted FRS1910
in 2002. FRS19 specified the provisions that were required for deferred tax, which
were different Statement of Standard Accounting Practice15. Stanchart made full
provision for deferred tax assets and liabilities arising from the differences between
the financial statements and the tax computation on a non-discounted basis. Deferred
tax assets and liabilities were recognized if the tax obligation existed on the balance
sheet date. The adjustments had no effect on current or prior periods tax charge but
affected the deferred tax balances, and reserves. Provision was made, under the
liability method11, for the tax effect that arose from all material timing differences,
which were likely to materialize in the foreseeable future.
Exhibit VI
Stanchart Bank: Deferred Taxation
$ Million 2002 2001
Deferred taxation comprises:
Accelerated tax depreciation 1 17
Provisions for bad debt (173) (171)
Other timing differences (64) (34)
(236) (188)
At 1 January (188) (185)
Exchange translation differences (4) 2
Charge (credit to)/ against profit (42) 22
Other (2) (27)
At 31 December (236) (188)
Source: Annual Report 2002
9 Timing differences were differences between profits or losses as computed for tax purposes and results as stated in financial statements, which arise from the inclusion of items of income and expenditure in tax computation in periods different from those in which they were dealt within the financial statements.
10 The FRS required deferred tax to be provided for on a ‘full provision’ basis—rather than the ‘partial provision’ basis previously required by SSAP 15—on most types of timing difference. It permitted but did not require entities to discount long-term deferred tax balances. It also required reporting entities to explain (by reconciliation) the differences between their effective tax rates and the standard rate of tax. Financial Reporting Standard19 – Deferred Tax (FRS19) was effective for accounting periods ending on or after 23 January 2002.
11 The liability method was a method of computing deferred tax whereby it was calculated at the rate of tax that it was estimated would be applicable when the timing differences reversed.

503
Standard Chartered Bank’s Accounting Policies
Exhibit VII
Stanchart Bank: Potential Deferred Taxation Assets/Liabilities
$ Million 2002 2001
No account has been taken of the following potential deferred taxation assets/liabilities:
Accelerated tax depreciation - 52
Tax losses carried forward 53 137
Provisions for bad debts 20 20
Other 10 10
Unrelieved foreign tax 76 31
Premises revaluation (16) (16)
Source: Annual Report 2002
EQUIPMENT LEASED TO CUSTOMERS AND INSTALLMENT CREDIT AGREEMENTS
Assets leased to customers under agreements, which transferred significantly the risks and rewards associated with ownership, other than legal title, were classified as finance leases. The balance sheet amount represented total minimum lease payments receivable less unearned income. Income from finance leases was recognized in the profit and loss account in proportion to the funds invested. Fixed rate installment credit agreements were treated in a similar manner to finance leases.
Lease agreements other than finance leases were classified as operating leases. These were included in loans and advances but treated as fixed assets and depreciated over the shorter lease term. The profits arising from operating leases were recognized in the profit and loss account on a straight-line basis over the duration of each lease. Income arising from the residual interest in installment credit agreements, which had been sold, was credited to the profit and loss account as it accrued. Expenses incurred in generating the income were deferred and amortized over the duration of the income flow and in proportion to it.
Exhibit VIII
Stanchart Bank: Lease & Installment Credit Agreements
$ Million 2002 2001
Finance lease 315 457
Installment credit agreements 832 787
1,147 1,244
Source: Annual Report 2002
FOREIGN CURRENCY TRANSACTIONS
Assets and liabilities in foreign currencies were expressed in terms of US dollar at the exchange rate on the balance sheet date. The profits and losses earned were expressed in US dollar terms at the average exchange rate of each currency against the US dollar during the year. Exchange differences between the balance sheet period end rate and the profit and loss average rate were taken to reserves. Gains or losses arising from hedging positions were included in the profit and loss account.
Translation differences that arose from the application of closing rates of exchange to opening net assets denominated in foreign currencies were taken directly to reserves. Exchange differences that arose on the translation of opening net monetary assets and
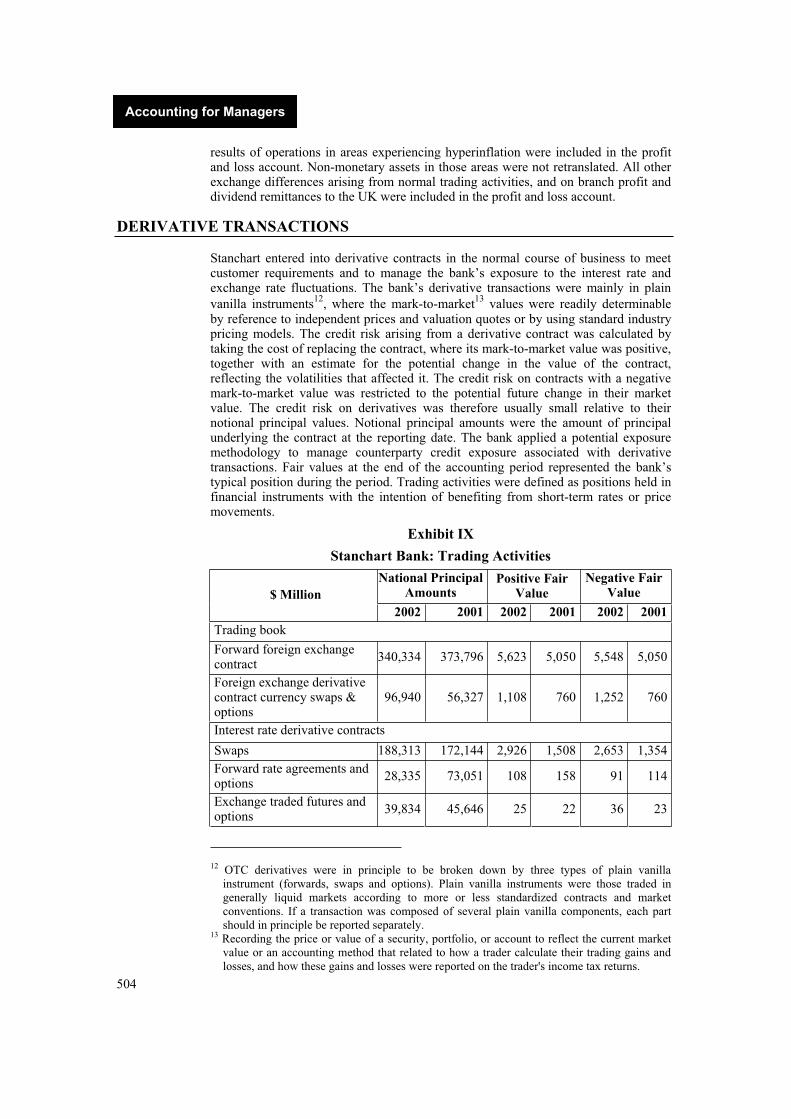
504
Accounting for Managers
results of operations in areas experiencing hyperinflation were included in the profit and loss account. Non-monetary assets in those areas were not retranslated. All other exchange differences arising from normal trading activities, and on branch profit and dividend remittances to the UK were included in the profit and loss account.
DERIVATIVE TRANSACTIONS
Stanchart entered into derivative contracts in the normal course of business to meet customer requirements and to manage the bank’s exposure to the interest rate and exchange rate fluctuations. The bank’s derivative transactions were mainly in plain
vanilla instruments12
, where the mark-to-market13
values were readily determinable by reference to independent prices and valuation quotes or by using standard industry pricing models. The credit risk arising from a derivative contract was calculated by taking the cost of replacing the contract, where its mark-to-market value was positive, together with an estimate for the potential change in the value of the contract, reflecting the volatilities that affected it. The credit risk on contracts with a negative mark-to-market value was restricted to the potential future change in their market value. The credit risk on derivatives was therefore usually small relative to their notional principal values. Notional principal amounts were the amount of principal underlying the contract at the reporting date. The bank applied a potential exposure methodology to manage counterparty credit exposure associated with derivative transactions. Fair values at the end of the accounting period represented the bank’s typical position during the period. Trading activities were defined as positions held in financial instruments with the intention of benefiting from short-term rates or price movements.
Exhibit IX
Stanchart Bank: Trading Activities
National Principal Amounts
Positive Fair Value
Negative Fair Value$ Million
2002 2001 2002 2001 2002 2001 Trading book
Forward foreign exchange contract
340,334 373,796 5,623 5,050 5,548 5,050
Foreign exchange derivative contract currency swaps & options
96,940 56,327 1,108 760 1,252 760
Interest rate derivative contracts
Swaps 188,313 172,144 2,926 1,508 2,653 1,354
Forward rate agreements and options
28,335 73,051 108 158 91 114
Exchange traded futures and options
39,834 45,646 25 22 36 23
12 OTC derivatives were in principle to be broken down by three types of plain vanilla instrument (forwards, swaps and options). Plain vanilla instruments were those traded in generally liquid markets according to more or less standardized contracts and market conventions. If a transaction was composed of several plain vanilla components, each part should in principle be reported separately.
13 Recording the price or value of a security, portfolio, or account to reflect the current market value or an accounting method that related to how a trader calculate their trading gains and losses, and how these gains and losses were reported on the trader's income tax returns.

505
Standard Chartered Bank’s Accounting Policies
Total 256,482 290,841 3,059 1,688 2,780 1,491 Equity and stock index derivatives
- 123 - - - -
Total trade book derivative
Financial instruments 693,756 721,087 9,790 7,498 9,580 6,903
Effect of netting (5,691) (3,558) (5,691) (3,558)
4,099 3,940 3,889 3,345
Source: Annual Report 2002
Exhibit X
Stanchart Bank: Non-Trading Activities
National Principal Amount
Positive Fair Value
Negative Fair Value$ Million
2002 2001 2002 2001 2002 2001
Non trading book
Forward foreign exchange derivative contract currency swaps & options
524 - 2 - - -
Interest rate derivative contracts
Swaps 1,313 1,639 - 2 2 7
Forward rate agreements and options
181 6 2 - 1 -
Exchange traded futures and options
2,231 2,781 2 - 1 1
Total 3,725 4,426 4 2 4 8
Commodity derivative contracts 1,812 954 14 39 14 39
Total non-trading book derivative
Financial instruments 6,061 5,380 20 41 18 47
Source: Annual Report 2002
RETIREMENT BENEFITS
Stanchart offered about 50 retirement benefit schemes throughout the world. Retirement benefits for staff were made in a variety of ways in accordance with local regulations and customs. The major schemes were of the defined benefit type14. The pension costs related to these schemes were assessed with the advice of qualified actuaries. The assets of the schemes were held in separate funds administered by trustees. The cost of providing pensions and other post-retirement benefits for employees were charged to the profit and loss account over their expected working lives. The company believed it complied with the transitional requirements of FRS17– Retirement Benefits (See Exhibit XVI).
14 Under this plan, the benefit payable to the employee was determined with reference to factors such as a percentage of final salary (e.g. the average of one, three or five years’ salary), number of years of service and the grade of the employee. The contribution required to finance such a scheme was actuarially determined and was generally expressed as a percentage of salary for the entire group of employees covered by the scheme.

506
Accounting for Managers
Exhibit XI
Stanchart Bank: Pension Expenses on Defined Benefit Schemes, 2002
$ Million UK Fund
Overseas pension and post retirement medical pension
schemes
Total
Current service cost 10 23 33
Past service cost 2 - 2
Loss on settlement & curtailments 1 7 8
Total charge to operating profit 13 30 43
Expected return on pension scheme assets (65) (71) (82)
Interest on pension scheme liabilities 64 18 82
(Credit)/charge to investment income (1) 1 -
Total charge to profit before deduction oftax
12 31 43
Loss on assets 63 36 99
Experience gain on liabilities (41) (15) (29)
Loss on charge of assumptions 71 13 84
Total loss recognized in statement of total recognized gains and loss before tax
120 34 154
Source: Annual Report 2002
Exhibit XII
Stanchart Bank: Pension Schemes & Post Retirement Medical Surplus/ (Deficit), 2002
$ Million UK
FundOverseas pension and post retirement
medical pension schemes
Surplus/(deficit) at beginning of the year
7 (66)
Contributions 16 39
Current service cost (10) (23)
Past service cost (2) -
Settlement/Curtailment cost (1) (7)
Other finance income 1 (1)
Actuarial loss (120) (34)
Exchange rate adjustment 2 (6)
Deficit at the end of the year (107) (98)
Source: Annual Report 2002

507
Standard Chartered Bank’s Accounting Policies
Exhibit XIII
Stanchart Bank: Retirement Benefits
$ Million 2002 2001
Net assets excluding pension assets 7,327 7,538
Pension liability (144) (41)
Net assets including pension assets 7,183 7,497
Profit & Loss account excluding pension asset 3,643 3,850
Pension liability (144) (41)
Profit & Loss account 3,499 3,809
Source: Annual Report 2002
INTANGIBLE ASSETS
Goodwill was capitalized and amortized on a straight-line basis over its estimated useful life. The amortization period of capitalized goodwill was up to 20 years. Goodwill that arose in respect of acquisitions before January 1, 1998, was written off through reserves in the year of acquisition and had not been restated. Any goodwill previously written off through reserves was charged to the profit and loss account in the year of disposal.
Exhibit XIV
Stanchart Bank: Intangible Assets
Goodwill $ million
Cost
At 1 January 2002 2,493
Movements during the year 5
At 31 December 2002 2,498
Provisions for amortization
At 1 January 2002 224
Amortization charged in the year 156
At 31 December 2002 380
Net book value at 31 December 2002 2,118
Net book value at 31 December 2001 2,269
Source: Annual Report 2002
TANGIBLE ASSETS
Freehold and long leasehold premises (premises with unexpired lease terms of 50
years or more) were recorded at their historical cost or at the amount of any
subsequent valuation. Freehold premises were amortized on a straight-line basis over
their estimated residual lives whereas leasehold premises were amortized over the
remaining term of each lease on a straight-line basis. Leasehold premises with no
long-term premium value were not revalued. Land was not depreciated. Equipment,
including fixed plant in buildings, computers and capitalized software development

508
Accounting for Managers
expenditure, was stated at cost and was depreciated on a straight-line basis over its
expected economic life, which was six years on a weighted average basis.
Exhibit XV
Stanchart Bank: Tangible Assets & Depreciation
$ Million Premises Equipment Total
Cost of Assets
At 1 January 2002 742 724 1,466
Exchange translation differences (7) 7 -
Additions 51 158 209
Disposals & fully depreciated assets written off (63) (118) (181)
Net deficit on revaluation (92) - (92)
Other (17) 17 -
At 31 December 2002 614 788 1,402
Depreciation
Accumulated at 1January 2002 148 326 474
Exchange translation differences - 3 3
Charge for the year 37 143 180
Impairment losses 9 - 9
Write back of depreciation (46) - (46)
Other (5) 5 -
Attributable to assets sold on written off (34) (112) (146)
Accumulated at 31December 2002 109 365 474
Net book value at 31 December 2002 505 423 928
Net book value at 31 December 2001 594 398 992
Source: Annual Report 2002
Exhibit XVI
Financial Reporting Standards (FRS) 17 Retirement Benefits
Issued November 2000
Amended November 2002
FRS 17 sets out the accounting treatment for pensions and medical care during retirement. It replaced SSAP 24 ‘Accounting for pension costs’ and UITF Abstract 6 ‘Accounting for post-retirement benefits other than pensions’.
The main requirements of FRS 17 are:
1. Pension scheme assets are measured using market values.
2. Pension scheme liabilities are measured using a projected unit method and discounted at an AA corporate bond rate.
3. The pension scheme surplus (to the extent it can be recovered) or deficit is recognised in full on the balance sheet.
4. The movement in the scheme surplus/deficit is analysed into:

509
Standard Chartered Bank’s Accounting Policies
a. The current service cost and any past service costs; these were recognised in operating profit.
b. The interest cost and expected return on assets; these were recognised as other finance costs.
c. Actuarial gains and losses; these were recognised in the statement of total recognised gains and losses.
FRS 17 (as amended in November 2002) includes the following transitional arrangements:
1. For accounting periods ending on or after 22 June 2001, closing balance sheet information (no comparatives required) is to be given in the notes only.
2. For accounting periods ending on or after 22 June 2002, opening and closing balance sheet information and performance statement information for the period (no comparatives required) is to be given in the notes only.
3. For accounting periods beginning on or after 1 January 2005, the standard is fully effective.
4. Early adoption is encouraged.
Source: www.asb.org.uk
Exhibit XVII Financial Reporting Standards (FRS) 19 Deferred Taxation
Deferred Tax - Issued December 2000
Overview
FRS 19 ‘Deferred Tax’ was issued on 7 December 2000. It supersedes SSAP 15 ‘Accounting for deferred tax’, becoming effective for years ending on or after 23 January 2002. Earlier adoption is encouraged.
The FRS requires deferred tax to be provided for on a ‘full provision’ basis—rather than the ‘partial provision’ basis previously required by SSAP 15—on most types of timing difference. It permits but does not require entities to discount long-term deferred tax balances. It also requires reporting entities to explain (by reconciliation) the differences between their effective tax rates and the standard rate of tax.
The new requirements bring accounting practice in the UK and the Republic of Ireland more closely into line with international requirements. However, there are differences between the requirements of the FRS and the equivalent International Accounting Standard, IAS 12 (revised 1996) ‘Income Taxes’, reflecting differences in the conceptual approaches underlying them.
Summary of requirements
FRS 19 ‘Deferred Tax’ requires full provision to be made for deferred tax assets and liabilities arising from timing differences between the recognition of gains and losses in the financial statements and their recognition in a tax computation.
The general principle underlying the requirements is that deferred tax should be recognised as a liability or asset if the transactions or events that give the entity an obligation to pay more tax in future or a right to pay less tax in future have occurred by the balance sheet date. The FRS:
a. requires deferred tax to be recognised on most types of timing difference, including those attributable to:
accelerated capital allowances
accruals for pension costs and other post-retirement benefits that will be deductible for tax purposes only when paid

510
Accounting for Managers
elimination of unrealised intragroup profits on consolidation
unrelieved tax losses
other sources of short-term timing differences
b. prohibits the recognition of deferred tax on timing differences arising when:
a non-monetary asset is revalued without there being any commitment to sell the asset (subject to the exception outlined below)
the gain on sale of an asset is rolled over onto replacement assets
a non-monetary asset is adjusted to its fair value on the acquisition of a business
the remittance of a subsidiary, associate or joint venture’s earnings would cause tax to be payable, but no commitment has been made to the remittance of the earnings.
c. requires deferred tax assets to be recognised to the extent that it is regarded as more likely than not that they will be recovered.
As an exception to the general requirement not to recognise deferred tax on revaluation gains and losses, the FRS requires deferred tax to be recognised when assets are continuously revalued to fair value, with changes in fair value being recognised in the profit and loss account.
The FRS permits but does not require entities to adopt a policy of discounting deferred tax assets and liabilities.
The FRS includes other requirements regarding the measurement and presentation of deferred tax assets and liabilities. These include requirements for the deferred tax to be:
measured using tax rates that have been enacted or substantively enacted
presented separately on the face of the balance sheet if the amounts are so material that, in the absence of such disclosure, readers may misinterpret the accounts.
The FRS requires information to be disclosed about factors affecting current and future tax charges. A key element of this is a requirement to disclose a reconciliation of the current tax charge for the period to the charge that would arise if the profits reported in the accounts were charged at a standard rate of tax.
The FRS amends FRS 7 ‘Fair Values in Acquisition Accounting’. The amendment requires deferred tax recognised in a fair value exercise to be measured in the same way as it would have been if the adjustments to fair values had been gains and losses reflected in the acquired entity’s own financial statements.
Comparison with IAS 12
The requirements of the FRS are similar to those of the equivalent International Accounting Standard (IAS) 12 (revised 1996)—both require deferred tax to be provided for in full on most types of timing difference.
However, there are significant differences between the two standards. The ASB does not agree with the conceptual arguments underpinning the requirements of IAS 12 (revised 1996), which it believes lead to companies making excessive provisions. It has therefore taken a different conceptual approach. The most important practical consequence is that, unlike IAS 12 (revised 1996), the FRS does not in general require deferred tax to be provided for when non-monetary assets are revalued or when they are adjusted to their fair values on the acquisition of a business.

511
Standard Chartered Bank’s Accounting Policies
A second significant difference is that the FRS allows (but does not require) deferred tax liabilities that will not be settled for some time to be discounted to reflect the time value of money. In contrast, IAS 12 (revised 1996) prohibits discounting.
There are a number of other differences between the requirements of the FRS and those of the IAS. These are set out in Appendix IV to the FRS.
Background to FRS requirements
The changes introduced by the FRS reflect an acceptance of the need to harmonize the way in which deferred tax is accounted for in the UK and the Republic of Ireland with the way in which it is accounted for in other countries.
In recent years, the partial provision method of accounting for deferred tax required by SSAP 15 has lost favour internationally, primarily because it is subjective (relying heavily on management expectations about future events) and inconsistent with other areas of accounting. Other major standard-setters and IAS 12 (revised 1996), now require deferred tax to be provided for in full. Whilst the ASB could see the merits of the partial provision method, it accepted some of the arguments against it and concluded that deferred tax was not an area where a good case could be made for taking a stand against the direction of international opinion.
Appendix V to the FRS provides a detailed analysis of the features of and rationale for the various approaches to deferred tax considered by the ASB, including that adopted in IAS 12 (revised 1996).
In particular, the analysis develops two different approaches to full provision accounting. The first argues that deferred tax should be provided for only when it reflects an existing obligation at the balance sheet date (the ‘incremental liability’ approach). The second argues that provisions should be made for all the future tax inherent in the carrying value of an asset (the ‘valuation adjustment’ approach).
The valuation adjustment approach developed by the Board has similar objectives to the ‘temporary difference’ approach on which IAS 12 (revised 1996) is based. However, it is framed differently and does not require exceptions to its basic principles to avoid some of the more controversial consequences of the temporary difference approach.
The Appendix also explains in detail why the Board:
decided to issue an FRS requiring full rather than partial provision for deferred tax
did not pursue the option of moving to flow-through accounting (whereby no provision is made for deferred tax)
chose not to adopt the requirements of IAS 12 (revised 1996)
chose to adopt an incremental liability rather than a valuation adjustment approach as the basis for the requirements in the FRS
decided to permit but not require entities to discount deferred tax
Finally, the appendix explains how the ASB applied the approach it developed to arrive at the detailed requirements of the FRS and it took into consideration the views of those commenting on earlier consultation papers.
Source: www.asb.org.uk

512
Accounting for Managers
Bibliography1. “Standard Chartered PLC to cut presence in Africa”, Wall Street Journal - Eastern Edition;
15th December 1994, p10.
2. “Blessings for a Secure Future Bangkok”, www.standardcharterednakornthon.co.th, 29th
October 1999.
3. Raghavan, Anita, Portanger, Erik, “Standard Chartered of U.K. Is in Talks To Buy ANZ Unit for About $1.6 Billion”, Wall Street Journal - Eastern Edition, 19th April 2000, p26.
4. McGinley, Jo, “Standard Chartered steams ahead in Asia Pacific”, Global Investor, Dec 2001/Jan 2002, p26.
5. “Come and buy”, The Economist, 3rd May 2003, Vol. 367 Issue 8322, p69.
6. Hasenfuss, Marc, “The real banking chartered” Finance Week, 2nd June 2003, p40.
7. “Industry News”, Asia Weekly Financial Alert, 8th September 2003, Vol. 7 Issue 1, p7.
8. “Standard Chartered Adopts Equator Principles”, Standard Chartered PLC Press release, www.standardchartered.com, 8th October 2003.
9. Adele, Sam, “Award for Standard Chartered” African Business, November 2003, Issue 292, p55.
10. Standard Chartered Bank - Annual Report, 1999, 2000, 2001 and 2002.
11. www.standardchartered.com
12. www.datamonitor.com
13. www.hoovers.com
14. www.asb.org.uk
15. http://investopedia.com

Microsoft’s Accounting Policies Will help the company continue to attract and retain the best employees, and better align their interests with those of our shareholders. These changes are a key step in our ongoing effort to position Microsoft for long-term success.
-Steve Ballmer, Chief Executive Officer, Microsoft Inc.
INTRODUCTION
Microsoft, the world leader in computer software, offered a wide range of software products to both personal and business users. Microsoft operated through subsidiaries in more than 60 countries worldwide and its products were available in 30 languages. In 2003, Microsoft posted revenues of $ 32.2 billion and a net income of $ 10 billion, with a gross profit margin of 86%. Bill Gates, Microsoft’s ex-CEO and Chief Software Architect, was the richest man in the world with a personal net worth of US$ 46 billion.1
Microsoft was structured around four core groups: The Business Group, The Worldwide Sales, Marketing, and Services group, Microsoft Research, and The Operations group and seven product segments (See Exhibit I). It had demarcated three geographical segments: The Americas, Europe, Middle East and Africa region and The Japan and Asia Pacific region.
For Microsoft, accounting disclosures was an issue of major concern since the accounting scandals broke out in the late 1990s. In 2002, the US Securities and Exchange Commission (SEC) alleged that Microsoft's accounting practices from July 1994, through June 1998, caused its income to be substantially misstated. But the SEC did not allege fraud in the Microsoft case. Under a settlement with the SEC, Microsoft neither admitted to nor denied the offense. The government imposed no fine.
In October 20022, Microsoft was rated as one of the corporations that required improvement in its governance practices. The company did not have a Nominating Committee3 until August 2002. The absence of this committee had given more control to the CEO on Board composition matters. Moreover, a former president4 of Microsoft was a member of the Audit Committee5.
BACKGROUND NOTE
William H. Gates III (Bill Gates) co-founded Microsoft with high school friend Paul Allen in 1975, after dropping out of Harvard, to sell a version of the popular programming language, BASIC. While Gates was at Harvard, the pair wrote the language for Altair6, the first commercial microcomputer. Microsoft started off by
1 Forbes, September 2003. 2 “The Best & Worst Boards,” Business week, 7th October 2002, p 50. 3 Nomination Committee was responsible for selecting candidates for nomination to the board,
based on certain preset criteria. 4 Jon A. Shirley had been a President and Director of Microsoft since 1983. Though Shirley had
retired in 1990, he continued to be the director of the Board and was a member of the audit committee since 1994 (as of latest information available from SEC), in spite of SEC’s regulation that the audit committee should consist only of independent directors.
5 Audit Committee took care of internal audit control and reporting. The chairman of the Audit Committee had to be independent and could not have any material relationship with the company for the last five years.
6 This was the first computer language program for a personnel computer and was sold to the company's first customer MITS.

514
Managerial Economics
modifying BASIC for other computers. In November 1976, the trade name "Microsoft" was registered. Gates moved Microsoft to his native city Seattle in 1979 and began developing software that enabled others to write programs. In 19817,Microsoft was set-up as a privately held corporation with Bill Gates as President and Chairman of the Board and Paul Allen as Executive Vice President.
A turning point for the PC industry came in 1980, when IBM chose Microsoft to write the operating system for its new machines. Gates bought QDOS (quick and dirty operating system), for $50,000 from a Seattle programmer and renamed it as Microsoft Disk Operating System (MS-DOS). The company’s sales exceeded $1 million after only three years.
In 1983, Microsoft unveiled Microsoft Windows, an extension of the MS-DOS operating system that provided a GUI (Graphical User Interface)8. In November 1985, Microsoft released the first versions of its internationally recognized Windows operating system. Over the next two years, Microsoft Windows version 1.0 was followed by several upgrades to support the international market and to provide drivers for additional video displays and printers. In 1986, the company’s stock went public with shares offered at $21. They rose to $28 per share by the end of the first trading day. The initial public offering raised $61 million for the company. Gates became the industry's first billionaire a year later.
In May 1990, Microsoft introduced Windows 3.0, the first version of the product to become common on many users’ machines, both in the home and the office. President George Bush presented the National Medal of Technology for Technological Achievement to Bill Gates in 1992. Microsoft introduced Windows NT in 1993 to compete with the UNIX operating system, popular on mainframes and large networks.
Exhibit I
Microsoft Corporation: Business Segments
Segment Products & Services %
Contribution
Windows Client
Windows XP Professional and Home, Windows 2000 Professional, Windows NT Workstation, Windows Me, Windows 98, Tablet PC, and operating system software PCs (embedded systems).
32
ServerPlatforms
Microsoft Windows Server System™ integrated server software, software developer tools, and MSDN®
20
Information Worker
Microsoft Office, Microsoft Publisher, Microsoft Visio®, Microsoft Project, and other stand-alone desktop applications.
30
Business Solutions
Encompassing Great Plains and Navision business process applications, and bCentral™ business services.
2
Windows CE & Mobility
Mobile devices including the Windows Powered Pocket PC, the Mobile Explorer microbrowser, and the Windows Powered Smartphone software platform.
7
7 The corporation was incorporated in 25th June 1981, and became an incorporated business in the state of Washington.
8 Windows features a window management capability that allows a user to view unrelated application programs simultaneously. It also provides the capability to transfer data from one application program to another.

515
Microsoft’s Accounting Policies
MSN MSN® network, MSN Internet Access, MSNTV, MSN Hotmail® and other Web-based services. 0
Home & Entertainment
Microsoft Xbox®, consumer hardware and software, online games, and our TV platform.
9
Source: www.microsoft.com
Exhibit II
Microsoft Corporation: Net Revenue & Operating Income
Year Ended June 30 2002 2003
(In $ Million) Revenue OperatingIncome/(Loss)
Revenue OperatingIncome/(Loss)
Client 9,350 7,529 10,286 8,281
Server and Tools 5,632 1,409 6,519 1,848
Information Worker 8,328 6,440 9,718 7,393
Microsoft Business Solutions 308 (196) 577 (308)
MSN 1,924 (746) 2,363 (394)
Mobile and Embedded Devices 124 (240) 153 (175)
Home and Entertainment 2,411 (866) 2,779 (940)
Reconciling Amounts 288 (1,420) (208) (2,488)
Total 28,365 11,910 32,187 13,217
Source: Annual Report 2003
In the early 1990s, Microsoft was charged with monopoly practices. Analysts felt that Microsoft was taking undue advantage of its competitive position to suppress competitors. This hampered Microsoft’s $1.5 billion acquisition of Intuit (a personal finance software maker) in 1995. In the same year, Microsoft got the license for Java Web programming language from Sun and introduced its Internet Explorer Web browser. It also launched Expedia, an online travel site.
In 1997, Sun Microsystems sued Microsoft for allegedly creating an incompatible version of Sun’s Java. Microsoft settled the court battle in 2001, for $20 million and was prevented from releasing new Java tools or accessing any of Sun's advances. In 2001, Microsoft purchased WebTV Networks for $425. In 1999, Microsoft spent $5 billion to acquire a minority stake in AT&T as part of that company's move to acquire cable operator Media One. In addition, Microsoft bought Windows-based technical drawing software specialist Visio for $1.3 billion, and sold a stake in Expedia to the public.
On 7th June 2000, a US District judge ordered that Microsoft be split into two companies stating that it was a monopoly. However, on 28th June 2001, the US Court of appeals overturned the ruling, but recognised Microsoft as a monopoly. On 18th
November 2002, Microsoft and the Justice Department finally reached a settlement to resolve the longstanding antitrust case. In the proposed agreement, Microsoft agreed to give more power to the hardware vendors to decide which icons would appear on the first screen users saw when they started their computers. The settlement also directed the company to create an in-house Antitrust Compliance Committee.
In 2001, Microsoft entered the games console market with the launch of the Xbox. The company also released the Windows XP operating system, which reunified Microsoft’s OS’s product line of home use and the Windows NT/2000 product line of office use.

516
Managerial Economics
In 2002, Be-Inc. (Operating System Vendor) charged Microsoft with anti-competitive
business practices as the reason for its destruction and demanded $23 million.9 Be-Inc
later dropped the charges. Microsoft denied any wrongdoing but agreed to bear the
company's legal fee.
In July 2003, Microsoft agreed to settle charges of $1.1 billion10 against a class action antitrust settlement in California. The plaintiffs accused Microsoft of overcharging them for its products. In December 2003, Real Networks Inc. the maker of Real Player digital software filed a $1billion antitrust lawsuit, accusing Microsoft of adopting anticompetitive practices by bundling its Windows Media Player with its OS.
ACCOUNTING PRINCIPLES
Microsoft along with Deloitte and Touché (Microsoft’s external auditor) prepared its financial statements along with those of its subsidiaries in accordance with the accounting principles generally accepted (GAAP) in the US. Inter-company transactions and balances were eliminated in the consolidated financial statements. Equity investments in which the company owned at least 20% of the voting securities were accounted for, using the equity method.11 Investments, in which the company was not able to exercise significant influence over the investee, were accounted for, using the cost method12.
REVENUE RECOGNITION
Revenue from retail packaged products, products licensed to original equipment
manufacturers (OEMs), and perpetual licenses for existing products under the
company’s open and select volume licensing programs was generally recognized as
products were shipped. The Open and select License (OSL) lasted for three years and
payments were made annually. The OSL was a cost effective way for small to
medium organizations with 5 to 500 or more desktop PCs, to acquire Microsoft
software licenses. Open volume licensing program was targeted for small and medium
sized organizations. It was available through the reseller channel and offered
discounts based on initial purchased volumes. Select volume program offered flexible
software acquisition, licensing and maintenance option specially customized to meet
the need of multinational organizations. Marketing efforts and fulfillment were
generally co-coordinated with large account resellers.
A portion of the revenue was recorded as unearned due to undelivered elements that
included, free post-delivery telephone support and the right to receive unspecified
upgrades/enhancements of Microsoft Internet Explorer on available basis. Unearned
revenue also included payments for online advertising for which the advertisement
was yet to be displayed and payments for post-delivery supported services, which
were to be performed in the future. The amount of revenue allocated to undelivered
elements was based on the sales price of those elements when sold separately (vendor-
9 “Microsoft Pays $23m to Settle BeOS Antitrust Suit,” Wall Street Journal, 9th August 2003. 10 Patrick Thibodeau, “California Users Eager to Cash In On $1.1B Microsoft Settlement,”
Computerworld, 28th July 2003. 11 Under equity method, the investor company adjusted the investment account for its share in
the investee’s reported income, losses, and dividend. 12 Under the cost method, the investor company recorded its investment at the price paid at the
acquisition and did not adjust the investment account balance subsequently. The cost method was used for all short-term investments, long-term investments of less than 20% of equity stake of the investee company, where the purchasing company did not exercise significant influence over them.

517
Microsoft’s Accounting Policies
specific objective evidence) using the residual method13. Unearned revenue due to
undelivered elements was recognized proportionately on a straight-line basis over the
related product's life cycle. This was estimated to be three and a half years for
Windows operating systems and two years for desktop applications (primarily office).
Exhibit III
Microsoft Corporation: Unearned Revenue
$ Million
Year Ended June 30 2002 2003
Volume licensing programs 4,158 5,472
Undelivered elements 2,830 2,847
Other 755 696
Unearned revenue 7,743 9,015
Source: Annual Report 2003
Revenues from multi-year licensing arrangements were recognized proportionately
over the billing coverage period. Multi-year licensing arrangements were a volume
licensing agreement for organizations with five or more PCs. It was especially suited
to a business that wanted the right to use the latest versions of chosen software, with
the flexibility to spread the payments annually over three years. Software Assurance
automatically covered licenses bought under the arrangement, for the term of the
agreement and the right to use the software indefinitely. Certain multi-year licensing
arrangements included rights to receive future versions of software products on
available basis under open and select volume-licensing programs. MSN Internet
Access subscriptions, Microsoft bCentral subscriptions, and Microsoft Developer
Network subscriptions revenues were also recognised proportionately over the billing
coverage period.
In 2001, Microsoft entered the games console market with the launch of the Xbox.
Revenues related to Xbox game console were recognized upon its shipment to
retailers. Online advertising revenues were recognized when advertisements were
displayed. Consulting services revenue was recognized when services were rendered
(generally based on the negotiated hourly rate in the consulting arrangement and the
number of hours worked during the period). Costs related to insignificant obligations
(telephone support for developer tools software, PC games, computer hardware, and
Xbox) were accrued on recognition of related revenue. Provisions were made for
estimated sales returns, concessions, and bad debts.
INVESTMENTS
Microsoft considered all highly liquid interest-earning investments maturing within
three months from date of purchase as cash equivalents. The investments, which
generally matured between three months to one year from the purchase date, were
called short-term investments. But sometimes, maturities beyond one year were also
13 Under the residual method, the total fair value of the undelivered elements, as indicated by vendor-specific objective evidence, was recorded as unearned, and the difference between the total arrangement fee and the amount recorded as unearned was recognized as revenue related to delivered elements.

518
Managerial Economics
classified as short-term, if they were highly liquid. Such marketable securities also
represented the investment of cash that was available for current operations. All cash
and short-term investments were classified as available for sale and were recorded at
market value using the specific identification method. Unrealized gains and losses
were reflected in other comprehensive income (OCI).
Investments in debt securities and publicly traded equity securities were classified as
available for sale and were recorded at market prices using the specific identification
method. Unrealized gains and losses (excluding other-than-temporary impairments)
were reflected in OCI. All other investments, excluding those accounted for, by using
the equity method, were recorded at cost.
Exhibit IV
Microsoft Corporation: Accumulated Other Comprehensive Income
$ Million
Year Ended June 30 2002 2003
Net gains/(losses) on derivative instruments 86 (16)
Net unrealized investment gains 603 1,846
Translation adjustments and other (106) 10
Accumulated other comprehensive income 583 1,840
Source: Annual Report 2003
Investments were considered to be impaired when a decline in fair value was judged to be other-than-temporary. The company employed a systematic methodology that considered available evidence in evaluating the potential impairment of its investments. If the cost of an investment exceeded its fair value, it was evaluated with respect to the general market conditions, the duration and the extent to which the fair value was less than cost, as well as the intent and ability to hold the investment. Once a decline in fair value was determined to be other-than-temporary, an impairment charge was recorded and a new cost basis14 in the investment was established.
Exhibit V
Microsoft Corporation: Other than Temporary Impairments
$ Million
Year Ended June 30 2001 2002 2003
Due to general market conditions 1,692 2,793 943
Due to specific adverse conditions 3,112 1,530 205
Total Impairments 4,804 4,323 1,148
Source: Annual Report 2003
Exhibit VI
Microsoft Corporation: Investment Income/ (Loss)
$ Million
Year Ended June 30 2001 2002 2003
Dividends 377 357 260
Interest 1,808 1,762 1,697
14 The cost or book value of an investment or the gain or loss on an investment is the sale price less the basis. Cost basis is also called Basis.

519
Microsoft’s Accounting Policies
Net recognized gains/(losses) on investments:
Net gains on the sales of investments 3,175 2,379 909
Other-than-temporary impairments (4,804) (4,323) (1,148)
Net unrealized losses attributable to derivative instruments
(592) (480) (141)
Net recognized gains/(losses) on investments (2,221) (2,424) (380)
Investment income/(loss) (36) (305) 1,577
Source: Annual Report 2003
FOREIGN EXCHANGE TRANSLATION
Assets and liabilities denominated in foreign currencies were translated at the
exchange rate on the balance sheet date. Revenues and expenses were translated at
average rates of exchange that prevailed during the year. Translation adjustments
resulting from this process were charged or credited to OCI.
Exhibit VII
Microsoft Corporation: Other Comprehensive Income
$ Million
Year Ended June 30 2001 2002 2003
Cumulative effect of accounting change, net of tax effect
of $(37) (75) - -
Net gains/(losses) on derivative instruments:
Unrealized gains/(losses), net of tax effect of $246 in 2001,
$30 in 2002, and $(69) in 2003 499 55 (129)
Reclassification adjustment for (gains)/losses included in
net income, net of tax effect of $67 in 2001, $(79) in 2002,
and $15 in 2003
135 (146) 27
Net gains/(losses) on derivative instruments 634 (91) (102)
Net unrealized investment gains/(losses):
Unrealized holding gains/(losses), net of tax effect of
$(351) in 2001, $(955) in 2002, and $610 in 2003 (1,200) (1,774) 1,132
Reclassification adjustment for (gains)/losses included in
net income, net of tax effect of $(128) in 2001, $958 in
2002, and $60 in 2003
(260) 1,779 111
Net unrealized investment gains/(losses) (1,460) 5 1,243
Translation adjustments and other (39) 82 116
Other comprehensive income/(loss) (940) (4) 1,257
Source: Annual Report 2003

520
Managerial Economics
PROPERTY AND EQUIPMENT
Property and equipment was stated at cost and depreciated using the straight-line
method15 over the shorter of the estimated life of the asset or the lease term, ranging
from one to 15 years. Computer software developed or obtained for internal use was
depreciated using the straight-line method over the estimated useful life of the
software, generally three years or less.
Exhibit VIII
Microsoft Corporation: Property and Equipment
$ MillionYear Ended June 30 2002 2003Land 197 248
Buildings 1,701 1,854
Computer equipment and software 2,621 2,464
Other 1,372 1,512
Property and equipment - at cost 5,891 6,078
Accumulated depreciation (3,623) (3,855)
Property and equipment – net 2,268 2,223 Source: Annual Report 2003
INVENTORIES
Inventories were stated at the lower of cost or market, using the average cost method. Cost included materials, labor, and manufacturing overhead, related to the purchase and production of inventories.
Exhibit IX
Microsoft Corporation: Inventories
$ MillionYear Ended June 30 2002 2003 Finished goods 505 393
Raw materials and work in process 168 247
Inventories 673 640 Source: Annual Report 2003
GOODWILL AND OTHER INTANGIBLE ASSETS
Prior to fiscal 2002, goodwill was amortized using the straight-line method over its estimated period of benefit. With the adoption of SFAS 142 (see Exhibit: XIII), Microsoft did not amortize goodwill but instead tested for impairment at least once a year
Other intangible assets were amortized using the straight-line method over their estimated period of benefit, ranging from one to ten years. The company periodically evaluated the recoverability of intangible assets and took into account events or circumstances that warranted revised estimates of useful lives or that indicated that impairment existed.
15 A method of calculating the depreciation of an asset, which assumes the asset, will lose an equal amount of value each year. By subtracting the salvage value of the asset from the purchase price, and then dividing this number by the estimated useful life of the asset we can calculate the annual depreciation.

521
Microsoft’s Accounting Policies
Exhibit X
Microsoft Corporation: Goodwill
$ Million
Year Ended June 30 2002 2003
Client 26 37
Server and Tools 97 106
Information Worker - 180
Microsoft Business Solutions 1,021 2,219
MSN 160 154
Mobile and Embedded Devices 5 28
Home and Entertainment 117 404
Goodwill 1,426 3,128
Source: Annual Report 2003
Exhibit XI
Microsoft Corporation: Intangible Assets
$ Million Gross
Carrying Amount
Accumulated Amortization
Gross Carrying Amount
Accumulated Amortization
Year Ended June 30 2002 2003
Contract-based 421 (290) 584 (376)
Technology-based 172 (71) 261 (137)
Marketing-related 15 (4) 34 (9)
Customer-related - - 28 (1)
Total Intangible Assets 608 (365) 907 (523)
Source: Annual Report 2003
EMPLOYEE STOCK PLANS
Microsoft followed Accounting Principles Board Opinion 25 (Accounting for stock
issued to employees), which generally did not require income statement recognition of
options granted at the market price on the date of issuance. However, certain events,
such as the accelerated vesting of options and the exchange of options in a business
combination, could lead to recording of an expense. In July 2003,16 Microsoft
announced changes in employee compensation designed to attract and retain the best
employees, and to better align employee interests with those of its shareholders.
Microsoft announced it would begin a new practice of granting employees restricted
16 Source: Business Week, 21st July 2003.
522
Managerial Economics
stock awards/grants17 instead of stock options18, a move that would allow employees
to make money even if the company's share price declined. While many companies
provided stock awards, commonly known as restricted stock units, to executives,
Microsoft was one of the first major corporations in which every employee would be
eligible to become a direct owner of the company through stock awards.
In case of a stock grant, an employee would receive actual shares from the company at the market price. But in case of stock option, the employee would receive an option to purchase shares at a fixed price on a future date. Like stock options, Microsoft’s restricted stock awards vested gradually over a five-year period from the date of issue. Under accounting rules, the grant of restricted stock award was treated as an expense and charged against earnings. The restricted stock grants were also much easier to value, than the options, thereby, improving transparency in corporate accounting.19
This shift from options to restricted stock grants seemed to be in response to the disappointment of the employees who held underwater20 options. The employees who held options in the 1990s had become millionaires due to favorable stock price movements (See Fig (ii)), but employees, who were granted stock after year 2000, did not see any significant favorable movements in the stock prices. The stock prices fell from close to $60 in December 1999, and by December 2000, were trading at around just above $20. Microsoft had been struggling since then to regain the confidence of investors, with its share prices fluctuating in the $20-30 range.
The stock award program offered employees the opportunity to earn actual shares of Microsoft stock over time, rather than options that gave employees the right to purchase stock at a set price.
Microsoft also indicated that it was working on a plan to enable employees to realize some value on the portion of their stock options that were currently out-of-the-money21, by selling their options to JP MorganChase (Investment and Research Firm).22 In July 2003, the company not only announced changes to employee compensation arrangements but also indicated the adoption of the fair value recognition provisions of SFAS 123 and reported changes in accounting principles using the retroactive restatement method described in SFAS 148(see Exhibit: XIV).
© ICFAI Knowledge Center. All rights reserved.
17 Restricted stock award/grants used in stock compensation programs, was a grant of company stock, generally given to a top-level employee or executive of a company in which the recipient's rights in the stock are restricted until the shares "vest". Typically, these shares must be held for a predetermined period, called a vesting period. Vesting periods could be met by the passage of time or driven by either company or individual performance.
18 A privilege, sold by one party to another, that give the buyer the right, but not the obligation, to buy (call) or sell (put) a stock at an agreed-upon price during a certain period of time or on a specific date or an option in which the underlier was the common stock of a corporation, giving the holder the right to buy or sell its stock, at a specified price, by a specific date. Also known as equity option.
19 “Microsoft’s Bold New Pay Plan,” Business Week, 21st July 2003. 20 Under the stock options plan, the employees could buy stock at a fixed price, called the
"strike price," at a future date. If the market price for the stock increased before that date, employees could generate profit by buying at the fixed price and selling at the market price. However, if the market price of the stock fell below the fixed price, the options would be considered underwater, or worthless.
21 An option that had no value. In the case of a call option, the option whose exercise price was greater than the market price of the underlying asset. In the case of a put option, the option whose exercise price was less than the market price of the underlying asset. Also known as underwater stock.
22 Seattle Post-Intelligencer Staff And News Services, 17th September 2003.

523
Microsoft’s Accounting Policies
Figure I
Microsoft: Stock Performance
Source: www.globeinvestor.com
Exhibit XII
Microsoft Corporation: Employee Stock Plans
$ Million, except earnings per share
Year Ended June 30 2001 2002 2003
Net income, as reported 7,346 7,829 9,993
Add: Stock-based employee compensation expense included in reported net income, net of tax
144 99 52
Deduct: Total stock-based employee compensation expense determined under fair value based method for all awards, net of tax
(2,406) (2,573) (2,514
)
Pro forma net income 5,084 5,355 7,531
Earnings per share:
Basic - as reported 0.69 0.72 0.93
Basic - pro forma 0.48 0.50 0.70
Diluted - as reported 0.66 0.70 0.92
Diluted - pro forma 0.46 0.48 0.69
Source: Annual Report 2003
Exhibit XIII
SFAS 142
Goodwill and Other Intangible Assets - (Issued June 2001)
Summary
The provisions of this Statement are required to be applied starting with fiscal years beginning after December 15, 2001. Early application is permitted for entities with fiscal years beginning after March 15, 2001, provided that the first interim financial statements have not previously been issued. This Statement addresses financial accounting and reporting for acquired goodwill and other intangible assets and supersedes APB Opinion No.17, Intangible Assets. It addresses how intangible assets that are acquired individually or with a group of other assets (but not those acquired in a

524
Managerial Economics
business combination) should be accounted for in financial statements upon their acquisition. This Statement also addresses how goodwill and other intangible assets should be accounted for, after they have been initially recognized in the financial statements.
Differences between This Statement and Opinion 17
This Statement changes the unit of account for goodwill and takes a very different approach to how goodwill and other intangible assets are accounted for subsequent to their initial recognition. Because goodwill and some intangible assets will no longer be amortized, the reported amounts of goodwill and intangible assets (as well as total assets) will not decrease at the same time and in the same manner as under previous standards. There may be more volatility in reported income than under previous standards because impairment losses are likely to occur irregularly and in varying amounts.
Acquiring entities usually integrate acquired entities into their operations, and thus the acquirers' expectations of benefits from the resulting synergies usually are reflected in the premium that they pay to acquire those entities. However, the transaction-based approach to accounting for goodwill under Opinion 17 treated the acquired entity as if it remained a stand-alone entity rather than being integrated with the acquiring entity; as a result, the portion of the premium related to expected synergies (goodwill) was not accounted for appropriately. This Statement adopts a more aggregate view of goodwill and bases the accounting for goodwill on the units of the combined entity into which an acquired entity is integrated (those units are referred to as reporting units).
Opinion 17 presumed that goodwill and all other intangible assets were wasting assets and thus the amounts assigned to them should be amortized in determining net income; Opinion 17 also mandated an arbitrary ceiling of 40 years for that amortization. This Statement does not presume that those assets are wasting assets. Instead, goodwill and intangible assets that have indefinite useful lives will not be amortized but rather will be tested at least annually for impairment. Goodwill will be tested for impairment at least annually using a two-step process that begins with an estimation of the fair value of a reporting unit. The first step is a screen for potential impairment, and the second step measures the amount of impairment, if any. However, if certain criteria are met, the requirement to test goodwill for impairment annually can be satisfied without a re-measurement of the fair value of a reporting unit. Intangible assets that have finite useful lives will continue to be amortized over their useful lives, but without the constraint of an arbitrary ceiling.
This Statement requires disclosure of information about goodwill and other intangible assets in the years subsequent to their acquisition. Required disclosures include information about the changes in the carrying amount of goodwill from period to period, the carrying amount of intangible assets for those assets subject to amortization and for those not subject to amortization, and the estimated intangible asset amortization expense for the next five years.
How the Conclusions in This Statement Relate to the Conceptual Framework
The Board concluded that amortization of goodwill was not consistent with the concept of representational faithfulness, as discussed in FASB Concepts Statement No. 2, Qualitative Characteristics of Accounting Information. The Board concluded that non-amortization of goodwill coupled with impairment testing is consistent with that concept. The appropriate balance of both relevance and reliability and costs and benefits also was central to the Board's conclusion that this Statement will improve financial reporting. This Statement utilizes the guidance in FASB Concepts Statement No. 7, Using Cash Flow Information and Present Value in Accounting Measurements, for estimating the fair values used in testing both goodwill and other intangible assets that are not being amortized for impairment.
Source: www.fasb.org

525
Microsoft’s Accounting Policies
Exhibit XIV
SFAS 148
Accounting for Stock-Based Compensation—Transition and Disclosure—an amendment of FASB Statement No. 123 - (Issued December 2002)
Summary
This Statement amends FASB Statement No. 123, Accounting for Stock-Based Compensation, to provide alternative methods of transition for a voluntary change to the fair value based method of accounting for stock-based employee compensation. In addition, this Statement amends the disclosure requirements of Statement 123 to require prominent disclosures in both annual and interim financial statements about the method of accounting for stock-based employee compensation and the effect of the method used on reported results by more prominently specifying the form, content, and location of those disclosures.
How the Changes in This Statement Improve Financial Reporting
This Statement permits two additional transition methods for entities that adopt the preferable method of accounting for stock-based employee compensation. Both of those methods avoid the ramp-up effect arising from prospective application of the fair value based method. In addition, to address concerns raised by some constituents about the lack of comparability caused by multiple transition methods.
Also, in the absence of a single accounting method for stock-based employee compensation, this Statement requires disclosure of comparable information for all companies regardless of whether, when, or how an entity adopts the preferable, fair value based method of accounting. This Statement improves the prominence and clarity of the pro forma disclosures required by Statement 123 improves the timeliness of those disclosures by requiring their inclusion in financial reports for interim periods.
International Convergence
The Board did not reconsider the recognition and measurement provisions of Statement 123 in this Statement because of the ongoing International Accounting Standards Board (IASB) project on share-based payment. The IASB concluded its deliberations on the accounting for share-based payments, including employee stock options, and issued an exposure draft for public comment in November 2002. That proposal would require companies using IASB standards to recognize as an expense, starting in 2004, the fair value of employee stock options granted.
While there are some important differences between the recognition and measurement provisions in the IASB proposal and those contained in Statement 123, the basic approach is the same-fair value measurement of stock-based employee compensation at the date of grant with expense recognition over the vesting period.
The Board has been actively working with the IASB and other major national standard setters to bring about convergence of accounting standards across the major world capital markets. In particular, the Board and the FASB staff in November 2002, issued an Invitation to Comment summarizing the IASB’s proposal and explaining the key similarities of and differences between its provisions and current U.S. accounting standards. In the near future, the Board plans to consider whether it should propose changes to the U.S. standards on accounting for stock-based compensation.
Source: www.fasb.org

526
Managerial Economics
Bibliography
1. “Microsoft Agrees to Refrain from Accounting Violations,” Xinhua (China), 3rd June 2002.
2. “Windows Market Share Rises But PC Sales Flatten,” www.wininformant.com, 10th
September 2002.
3. “Microsoft’s Windows OS global market share is more than 97% according to OneStat.com,” www.onestat.com, 10th September 2002.
4. “The Best & Worst Boards,” Business week, 7th October 2002, p 50.
5. “Our Commitment to Our Customers,” The Business of Microsoft, www.microsoft.com, 25th October 2002.
6. “The Top Ten of the global 500 after industries,” www.ftd.de/ub/di, 25th May 2003.
7. Philip Coggan and Arne Storn, “Ranking –FT 500: Microsoft pulls on GE past,” www.ftd.de/FT500, 28th May 2003.
8. “Microsoft’s Bold New Pay Plan,” Business Week, 21st July 2003.
9. Patrick Thibodeau, “California Users Eager to Cash In On $1.1B Microsoft Settlement,” Computerworld, 28th July 2003.
10. “Microsoft Pays $23m to Settle BeOS Antitrust Suit,” Wall Street Journal, 9th August 2003.
11. “Seattle Post-Intelligencer Staff And News Services,” 17th September 2003.
12. “Computer History,” www.computerhope.com.
13. www.hoovers.com
14. Microsoft Corporation Annual Report-2001, 2002,2003.
15. Microsoft Corporation Proxy Report, 2003.
16. www.microsoft.com
17. www.fasb.org
18. www.sec.gov
19. www.datamonitor.com
20. www.investorwords.com
21. www.thestudentclub.net
22. www.investiopedia.com

Program Accounting System at Boeing
INTRODUCTION
Established by William Boeing in 1916, Boeing was the world’s largest aerospace and
defense company. It had three major business segments: Commercial Airplanes,
Defense (specializing in military aircraft and missile systems) and Space and
Communications. Boeing also had a captive finance company, Boeing Capital Corp
(“BCC”). In 2002, Boeing employed 78,400 people in the Seattle area and was
Washington State’s largest private employer. It achieved net earnings of $2.3 billion,
earning per share of $2.87, revenues of $54.1 billion and operating margins of 7.2%.
Exhibit I
Boeing: Financial Highlights
(Dollars in millions except share data)
2002 2001 2000 1999 1998 1997
Revenues 54069 58198 51321 57993 56154 45800
Net Earnings 2319 2827 2128 2309 110 -178
Earnings per share 2.87 3.41 2.44 2.49 1.15 -0.18
Operating margin rate 7.20% 6.70% 6.00% 5.50% 2.80% -
0.60%
Free cash flow 3374 2705 5161 4809 300 560
Source: Annual Report 2002.
Boeing’s commercial airplanes segment manufactured and marketed commercial jet
aircraft and provided related support services to the commercial airline industry
worldwide. It also offered commercial jetliners designed to meet a wide range of
passenger and cargo requirements for domestic and foreign airlines. This segment
primarily focused on the 767-400ER, the Next-Generation 737 family of short to
medium jetliners (737-600/700/800/900 models), the 717 program, the 757-300
derivative and the 777-300 derivative. New products under consideration included
larger and longer-range versions of the 777. Boeing believed, sufficient market
demand had not developed to justify substantial investment commitments required to
develop either a very large all-new aircraft or significantly larger versions of the 747.
The Military Aircraft and Missiles segment was involved in the research,
development, production, modification and support of products and related systems,
which included military aircraft, such as fighter, transport and attack aircraft;
helicopters; and missiles. The principal revenue contributors to this segment were the
C-17, F-15, F/A-18 C/D, F/A-18 E/F, AH-64 Apache, T-45 Goshawk Training
System, AV-8B Harrier, and the Harpoon missile, along with Aerospace Support. The
US government was the primary customer for this segment.
The Space and Communications segment focused on space systems, missile defense
systems, satellites and satellite-launching vehicles, rocket engines and information and
battle management systems. The principal revenue contributors to this segment
included the International Space Station, National Missile Defense Lead Systems
Integrator (NMD LSI), E-3 AWACS (Airborne Warning and Control System) and 767

528
Accounting for Managers
AWACS, Space Shuttle Flight Operations and Delta space launch services. The US
government was again the primary customer for this business segment.
Figure I
Boeing: Revenue Segmentation
Source: Annual Report 2002
The Military Aircraft & Missile Systems and Space & Communications segments operations principally consisted of performing work under contract. So these segments used the contract accounting method. Commercial aircraft programs were planned, committed and executed based on long-term delivery forecasts, normally for quantities in excess of contractually firm orders. So this segment used the program accounting method.
CONTRACT ACCOUNTING
Contract accounting was used predominantly by the Military Aircraft and Missile Systems and the Space and Communications segments. The bulk of the business conducted in these segments was performed under contracts for the US government and foreign governments that extended over a number of years. Contract accounting was a form of specific job costing, which was undertaken for special requirements of the customers. It applied to contracts, where substantial time was taken to complete and normally continued for more than one accounting period. If the number of contracts were more, a distinguishing number or name was given to each contract for accounting and administration convenience. A separate contract account was maintained for each contract. All costs related to contracts were charged to the respective contract accounts.
Total contract revenues were estimated on the basis of negotiated contract price but modified by assumptions regarding contract options, change orders, incentive and award provisions associated with technical performance, and contract terms that provided for the adjustment of prices in the event of variations from projected

529
Program Accounting System at Boeing
inflationary trends. Revenues under fixed price contracts were generally recognized when deliveries were made. For certain fixed-price contracts that required substantial performance over an extended period before deliveries began, revenues were recorded based on the attainment of performance milestones. Contracts contained provisions to earn incentive and award fees if targets were achieved. Incentive and award fees that could be reasonably estimated were recorded over the performance period of the contract, while those that could not be estimated were recorded when awarded.
Profit was recognized for each accounting period, based on estimated gross margin and cost of sales percentages. The amount reported as cost of sales was determined by applying the estimated cost of sales percentages to the amount of revenue recognized for each contract.
The estimation of gross margin and cost of sales percentages involved procedures and personnel in all areas of the company that provided financial or production information on the status of contracts. This contract management process produced Boeing’s best estimate of contract cost and contract revenue. Estimates of each significant contract’s cost and revenue were reviewed and reassessed quarterly. Changes in these estimates resulted in recognition of cumulative adjustments to the contract profit in the period in which changes were made.
Total contract costs were estimated on historical performance trends, business base and other economic projections, and information provided by suppliers. Factors that influenced these estimates included technical and schedule risk, internal and subcontractor performance trends, business volume assumptions, asset utilization, anticipated labor agreements, and inflationary trends.
Boeing experienced a range of plus or minus 0.5% for the combined gross margin of all contracts in the Military Aircraft and Missile Systems and the Space and Communications segments during 2000-02. If combined gross margin for all contracts in the Military Aircraft and Missile Systems and the Space and Communications segments for all of 2002 had been estimated to be higher or lower by 0.5%, it would have increased or decreased income for the year by approximately $125 million, as estimated by the company.
PROGRAM ACCOUNTING
The program accounting method was an extended version of contract accounting. When the contract period was very large and several contracts were undertaken simultaneously, program accounting was used. The method was developed by Boeing and other players in the aerospace industry in the 1960s. Boeing used program accounting for its 7-series commercial airplane. Under 7-series commercial airplane program, most of the costs of creating a new plane were incurred in its early years, while revenues rolled in during later years. To smooth out costs and revenues, Boeing averaged them over the entire duration of an airplane "program", usually defined as an initial production run (say, 400 aircraft). Boeing did this by establishing a projected profit margin up front (say, 10%) for the entire program. This number, which was continuously updated, was based on estimates of the average costs and revenues over the remainder of the program. Every quarter, the profit that the company reported was based on these projected averages, rather than its actual costs or revenues.
According to Lew Platt, Retired Chairman of Boeing Board and former CEO of Hewlett- Packard,
“Program accounting is the best way to deal with the cost structure of the airline business. It puts a lot of responsibility on management to be honest with estimates. Certainly program accounting requires more judgments than cash accounting, but many people take frequent independent looks at the estimates to ensure they are still

530
Accounting for Managers
reasonable. That includes the board and the auditors, neither of whom assume the judgments are correct just because management proposed them.”1
The program accounting method was based on the assumption that aerospace companies could come up with accurate long-term forecasts. To a degree unmatched in nearly any other industry, aerospace companies' disclosures were based on their own private estimates.
Harry Stonecipher, retired Vice Chairman of the Boeing Board, had railed against the venerable program-accounting system for airliners,
“You have to know the cost of the airplane as you go along the production line: what the wing costs, what every piece of the airplane costs. You cannot reduce the cost of a wing if you don't know where you're starting.”2
Under program accounting, production costs (including overhead), program tooling costs and warranty costs were accumulated and charged to revenue by program instead of by individual units or contracts. To match the revenue with cost of sales, program accounting required estimates of (a) the number of units to be produced and sold in a program (accounting quantity), (b) the period over which the units could reasonably be expected to be produced, and (c) their expected selling prices, production costs, program tooling, and warranty costs for the total program.
ACCOUNTING QUANTITY
Accounting quantity was the estimated number of units of airplane to be produced in a continuing, long-term production effort for delivery under existing and anticipated contracts. The company had a policy that determined the appropriate accounting quantity for each commercial aircraft program. This policy took into account several factors that influenced the demand for the particular product. The company reviewed and reassessed its program accounting quantities on a quarterly basis in compliance with relevant program accounting guidance.
The accounting quantity included the units that had been delivered, undelivered units under contract, and units anticipated to be under contract in the future (anticipated orders). In developing total program estimates, Boeing addressed all of these conditions within the accounting quantity.
In the early 2000s, the sluggish market for commercial aircraft adversely affected all commercial aircraft programs. This resulted in lower production rates and extended the time frame for production and delivery of the accounting quantities for the 747, 757 and 767 programs. The 757 and 767 programs experienced the most difficulty acquiring new orders. The market projections indicated that the company would be successful in selling the unsold units within the current accounting quantity for all programs. Therefore no accounting quantities had been reduced.
Exhibit III
The Estimates of Total Program Accounting Quantities and Changes
717 737 Next-Generation
747 757 767 777
2002 140 2,000 1,401 1,100 1,000 600
Additions 5 200
2001 135 1,800 1,401 1,100 1,000 600
1 “Stormy skies, and a silver lining, for Boeing,” Knowledge@Wharton, Website: http://knowledge.wharton.upenn.edu, 3rd July 2002.
2 Roy Harris, “Fearless in Seattle.” CFO Magazine, 1st April 1999.

531
Program Accounting System at Boeing
Additions/(deletions) (65) 150 50 50 50
2000 200 1,650 1,351 1,050 950 600
Source: Annual Report 2002
The accounting quantity for the 717 program was based on firm orders. The increase
of five units in the 717 program accounting quantity during the second quarter of 2002
was the result of net new orders. The reduction of 65 units in the 717 program
accounting quantity during the fourth quarter of 2001 was driven by a lack of firm
demand subsequent to September 11, 2001 terrorist attack. This resulted in a sharp
decrease in the 717 program’s anticipated orders as a percentage of cumulative firm
orders between December 31, 2001 and December 31, 2000. Accounting quantity
increase between December 31, 2002 and December 31, 2000 on other programs was
the result of the normal progression of business; delivery of aircraft; and obtaining
additional orders.
Cumulative firm orders represented the cumulative number of commercial jet aircraft
deliveries as of December 31 (end of the year) plus undelivered units under firm
order. Cumulative firm orders included orders that fell within the current accounting
quantities as well as orders that extended beyond the current accounting quantities.
Cumulative firm orders excluded program test aircraft that would not be refurbished
for sale.
Exhibit IV
Cumulative Firm Orders
717 737 Next-
Generation
747 757 767 777
2002
Cumulative firm orders (CFO) 139 2,012 1,371 1,050 931 597
Anticipated orders 0 n/a 29 49 67 3
Anticipated orders as a % of
CFO
0% n/a 2% 5% 7% 1%
2001
Cumulative firm orders (CFO) 123 1,881 1,351 1,048 934 575
Anticipated orders 11 n/a 49 51 64 25
Anticipated orders as a % of
CFO
9% n/a 4% 5% 7% 4%
2000
Cumulative firm orders (CFO) 151 1,722 1,338 1,042 899 557
Anticipated orders 48 n/a 12 7 49 43
Anticipated orders as a % of
CFO
32% n/a 1% 1% 5% 8%
Source: Annual Report 2002

532
Accounting for Managers
REVENUE AND COST ESTIMATION
Boeing believed, the use of program accounting required the ability to estimate reliably the cost revenue relationship for the defined program accounting quantity. The factors to be estimated included selling price, labor and employee benefit costs, material costs, procured parts and major component costs, and overhead costs. To meet this requirement the company employed a rigorous estimating process that was reviewed and updated on a quarterly basis. Changes in estimates were recognized on a prospective basis.
Many experts were cynical about the accuracy of estimates made by the Program Accounting Method. According to Lynn E. Turner, Director of the Center for Quality Financial Reporting at Colorado State University and former Chief Accountant at the SEC:
“The problem with program accounting is that it is virtually impossible to audit. No one really knows whether the company will produce as many planes as [are] needed to recover the costs.”3
Boeing recognized the revenue for commercial airplanes when a unit was completed and accepted by the customer. The revenue recognized was the price negotiated with the customer including special features adjusted by an escalation formula. The total program revenue was determined by estimating the model mix and sales price for all unsold units within the accounting quantity added together with the revenue for all undelivered units under contract. The sales prices for all undelivered units within the accounting quantity included an escalation adjustment that was based on projected escalation rates.
Cost estimates were based largely on historical performance trends, business base and other economic projections (production rates, internal and subcontractor performance trends, asset utilization, anticipated labor agreements, and inflationary trends), and information provided by suppliers. The amount reported as cost of sales was determined by applying the estimated cost of sales percentage for the total remaining program to the amount of revenue recognized for the quarter. Because of the learning curve effect, the actual costs incurred for production of the early units in the program would exceed the amount reported as cost of sales for those units. This difference, known as deferred production costs, was included in inventory along with unamortized tooling costs.
Exhibit V Unamortized Tooling and Deferred Production Costs
2002 2001
Unamortized tooling
737 Next-Generation $239 $305
777 709 821
Deferred production costs
737 Next-Generation 57 429
777 785 863
Source: Annual Report 2002
© ICFAI Knowledge Center. All rights reserved.
3 Stanley Holmes and Mike France, “Boeing’s Secret,” Business Week, 20th May 2002.
533
Program Accounting System at Boeing
Bibliography
Roy Harris, “Fearless in Seattle.” CFO Magazine, 1st April 1999.
Jan R Williams, “Miller GAAP Guide – Restatement and Analysis of Current FASB Standards,” Harcourt Professional Publishing, Copyright @ 2001.
Joel G Siegel, Marc Levine, Anique Qureshi, Jae K Shim, “GAAP 2002 Handbook of Policies and Procedures,” Prentice Hall, Copyright @ 2002.
Stanley Holmes, Mike France, “Boeing’s Secret,” Business Week, 20th May 2002.
“Stormy skies, and a silver lining, for Boeing,” Knowledge@Wharton, Website: http://knowledge.wharton.upenn.edu, 3rd July 2002.
Michael Mecham, Neelam Mathews, William Dennis, “Don't Come to Work,” Aviation Week & Space Technology, 19th May 2003.
Holmes, Stanley; Sager, Ira, “Getting in on Boeing’s name game,” Business Week, 2nd June 2003.
Lorraine Woellert, Louis Lavelle, Stan Crock, Stanley Holmes, “Why Boeing is suddenly making so much noise,” Business Week, 23rd June 2003.
Lois Gilman, Bridget Finn, “A Day at the Factory,” Business 2.0, June 2003.
J.A Donoghue, “Maintaining a future focus,” Air Transport World, June 2003.
Albert Antoine, Carl B Frank, Hideaki Murata, Edward Roberts, “Acquisitions and alliances in the aerospace industry: an unusual triad,” International Journal of Technology Management, 2003.
Boeing Annual Reports 2001, 2002.
www.boeing.com
www.hoovers.com

Real Foods In 2003, Real Foods, a mango juice manufacturer had a predominant market presence
in south India. Enjoy, the bottled mango juice from Real Foods enjoyed a comfortable
position in the branded fruit juices market. For the first time, Real Foods ventured into
another product – an orange juice concentrate. Since the market was already full of
canned and bottled orange juices, Real Foods opted for the concentrate form, targeting
the home consumption segment. Liquid concentrates were available in the market
already but Real Foods had developed a powder concentrate available in tetra packs.
The powder concentrate when mixed with water gave a litre of orange juice. Real
foods decided to market the new product under the ‘Enjoy’ brand name, to leverage
the brand’s equity.
The new product had several attractive features. First of all, the powder concentrate
was much more convenient than the canned and bottled orange juices. Secondly, Real
Foods believed the quality of the juice made out of the concentrate was better because
unlike canned juices, the juice from the concentrate could be prepared just before
consumption. Another very important feature was that the powder concentrate was
available at a much lower price than the other juices. The marketing manager was in a
dilemma as to how to advertise the new product. He could opt for advertising that
emphasized the convenience of the product, the quality attribute or the price
advantage. To facilitate a decision, he conducted an experiment in three cities –
Bangalore, Chennai and Hyderabad.
In Bangalore, the marketing manager launched the new product backed by
advertisements stressing the convenience of the product. The product was easy to
carry from the store to home. The powder did not require storage in the refrigerator.
Even households without a refrigerator could buy the product without fearing
spoilage. The advertisements also highlighted the ease with which one litre of juice
was ready in a short time. In Chennai, the advertisements emphasized the quality of
the product – the freshness proposition, how it tasted better than bottled juices etc. In
Hyderabad, the advertisements stressed the price advantage.
The marketing manager recorded the weekly sales of the new concentrate in tetra
packs, for 20 weeks in all the three cities. He wanted to know if the difference in sales
was on account of the different communication strategies adopted for the three cities.
Weekly Sales (for 20 Weeks) in 3 Cities
WeekBangalore
(Convenience) Chennai (Quality)
Hyderabad (Price)
1 75 45 65
2 60 54 45
3 75 65 56
4 45 56 60
5 55 65 64
6 72 70 54
7 65 62 80
8 80 70 56

538
Quantitative Methods
9 75 71 67
10 89 60 50
11 95 67 67
12 87 64 70
13 64 56 72
14 71 65 65
15 84 57 65
16 75 54 63
17 54 67 56
18 65 70 64
19 65 59 68
20 55 63 72
© ICFAI Knowledge Center. All rights reserved.

Care Hygiene
In 2003, Mumbai based Care Hygiene Co (Care Hygiene), a well-known company
dealing in healthcare products, recorded sales of Rs. 665 crores and a net income of
Rs.45.6 crores. ‘Nutravit’, a chocolate flavoured health drink, was one of its flagship
products. But of late, Nutravit had been facing stiff competition from a number of
other chocolate-based beverages that had flooded the market. Its market share had
significantly come down. Care Hygiene decided it was high time it took some efforts
to tackle competition and regain market share. The company decided to market a new
variant of Nutravit, with an improved formulation and in a new flavour.
By mid-2003, Care Hygiene was ready with its new variant – a powdered mix which
when mixed with milk gave a nutritious as well as tasty vanilla cum chocolate
flavoured drink. Care Hygiene’s marketing manager decided to test market the new
product. He selected Mumbai and Nagpur as the test cities because there were
significant similarities in the consumption patterns of its health drink ‘Nutravit’ in
these two cities. In Mumbai, Care continued to market its established health beverage,
while in Nagpur it replaced it with the new vanilla cum chocolate flavour.
In each city, a sample of 200 households was selected and interviewed over a six-
month period. Based on each household’s reported consumption of the beverages,
Care’s marketing manager charted the results showing the different household
consumption rates in Mumbai and Nagpur.
Household consumption rates
Nagpur (Vanilla cum chocolate)
Mumbai (Chocolate) Consumption
Rate Number
% of households
Number% of
households
Heavy 34 17 28 14
Moderate 52 26 44 22
Light 50 25 42 21
Non-user 64 32 86 43
Total 200 100 200 100
In Mumbai, where the chocolate flavour was marketed, 114 households reported using
the beverage. In Nagpur, where the new variant was test marketed, 136 households
reported using the beverage mix.
1. Care’s marketing manager wondered if the difference in usage rates (57% in
Mumbai and 68% in Nagpur) could be attributed to the new vanilla formulation
or if the difference had merely resulted by chance due to sampling.
2. Since the new formulation was an improved one with a new flavour, it was more
expensive. The management decided to proceed with it only if there was
sufficient evidence that the new variant would yield better results. While test
marketing the new variant, Care’s marketing manager had decided that if it

540
Quantitative Methods
achieved a 75% usage rate among target households, he would recommend the
launching of the product. What should he do? Based on the sample of 200
households, the new variant had achieved a usage rate of 68%. Should he
recommend to the management for or against launching of the new product?
3. Among the 200 households sampled in each city, Care found different
consumption rates. While 86 heavy and moderate consumption households were
reported in Nagpur, 72 heavy and moderate consuming households were reported
in Mumbai. Care’s marketing manager wanted to know if the difference between
the consumption rates in the two cities was statistically significant. If there was a
statistically significant difference, he could conclude that the new flavour was
causing a heavier consumption pattern.
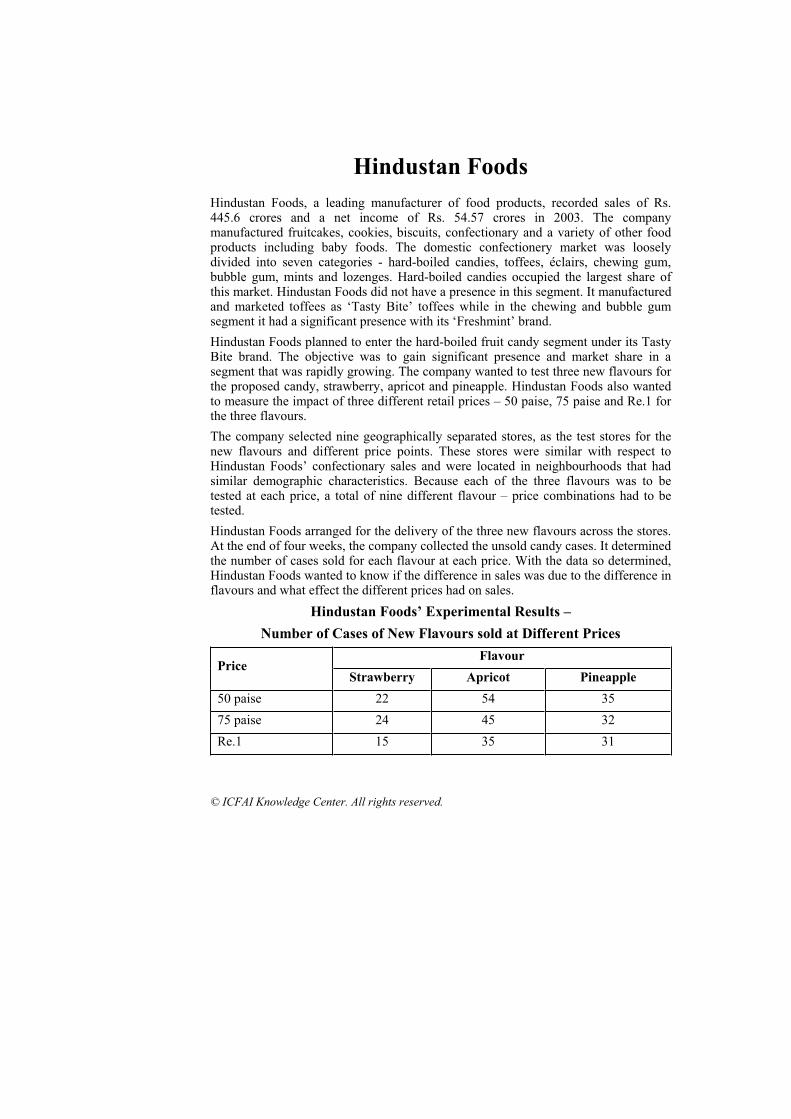
Hindustan Foods Hindustan Foods, a leading manufacturer of food products, recorded sales of Rs. 445.6 crores and a net income of Rs. 54.57 crores in 2003. The company manufactured fruitcakes, cookies, biscuits, confectionary and a variety of other food products including baby foods. The domestic confectionery market was loosely divided into seven categories - hard-boiled candies, toffees, éclairs, chewing gum, bubble gum, mints and lozenges. Hard-boiled candies occupied the largest share of this market. Hindustan Foods did not have a presence in this segment. It manufactured and marketed toffees as ‘Tasty Bite’ toffees while in the chewing and bubble gum segment it had a significant presence with its ‘Freshmint’ brand.
Hindustan Foods planned to enter the hard-boiled fruit candy segment under its Tasty Bite brand. The objective was to gain significant presence and market share in a segment that was rapidly growing. The company wanted to test three new flavours for the proposed candy, strawberry, apricot and pineapple. Hindustan Foods also wanted to measure the impact of three different retail prices – 50 paise, 75 paise and Re.1 for the three flavours.
The company selected nine geographically separated stores, as the test stores for the new flavours and different price points. These stores were similar with respect to Hindustan Foods’ confectionary sales and were located in neighbourhoods that had similar demographic characteristics. Because each of the three flavours was to be tested at each price, a total of nine different flavour – price combinations had to be tested.
Hindustan Foods arranged for the delivery of the three new flavours across the stores. At the end of four weeks, the company collected the unsold candy cases. It determined the number of cases sold for each flavour at each price. With the data so determined, Hindustan Foods wanted to know if the difference in sales was due to the difference in flavours and what effect the different prices had on sales.
Hindustan Foods’ Experimental Results –
Number of Cases of New Flavours sold at Different Prices
Flavour Price
Strawberry Apricot Pineapple
50 paise 22 54 35
75 paise 24 45 32
Re.1 15 35 31
© ICFAI Knowledge Center. All rights reserved.

Designer Exports In 2003, Designer Exports (Designer) a leading manufacturer and marketer of leather products, based in Kanpur, recorded a turnover of Rs. 443.25 crores and a net income of Rs. 43.24 crores. The company had emerged as a leading player in the leather industry with its wide range of products, which included leather bags, leather portfolios, leather accessories, wallets and garments. All these products could be customized as per the requirements of the customers. Customers could even get their logos and designs printed or embossed on these products. The company had tanning facilities of about 3,00,000 square feet of leather, in the outskirts of Kanpur. It had its own leather-finishing unit where the leather obtained from the tannery was processed and finished.
Exports contributed to 80% of Designer’s turnover. It had major clients in USA, South Korea, Germany, Turkey and Dubai. Quality was an essential pre-requisite. The firm ensured that the products underwent stringent quality checks at all stages of production. The company was also very strict in hiring people. It hired those with hands on experience in the concerned field in similar firms. It also had a rigorous training programme for its production line workers. The incumbent candidates had to undergo a 15-day training before starting work in the shop floor.
Ashok Kapur (Ashok) was the new personnel manager who had taken over a month back at Designer Exports. Ashok was a management graduate from one of India’s leading business schools. He had a specialization in personnel management and industrial relations. He also had six years of experience in two other firms in the same industry. His previous stint was with Crescent International, another leading exporter of leather products based in Chennai. Within a couple of weeks of his joining, the production manager of Designer had approached Ashok, as he was not very satisfied with the performance of some of his production line workers, in spite of their having undergone induction training. The two were interested in examining the relationship between the training scores and the performance ratings received by the workers three months after commencing work. Ashok took a random sample of 20 shop floor workers and tabulated their training scores and performance ratings. Ashok believed the findings would help him in deciding how much weight to give to the training programme relative to other parameters like work history, references etc.
The training scores ranged from 0 to 100. The performance ratings were;
1. Employee’s performance is bad
2. Employee’s performance is below average
3. Employee’s performance is average
4. Employee’s performance is above average
5. Employee’s performance is good.
Training Scores and Performance Ratings
Employee Training Score Performance rating
1 51 2
2 40 3
3 67 4
4 60 2
5 68 3

543
Designer Exports
6 57 4
7 56 3
8 77 2
9 69 5
10 66 3
11 47 2
12 61 3
13 71 5
14 65 3
15 48 3
16 76 3
17 36 1
18 62 3
19 58 4
20 59 3
© ICFAI Knowledge Center. All rights reserved.

Roja Silks Roja Silks (Roja), a leading apparel retailer in Madras, had started operations in 1996. It had three separate sections for children, ladies and men. Roja offered casuals, formals and western wears. For ladies, there were salwars in soft velvets, cool cottons, printed clothes and also accessories like branded leather bags, shoes, nightwear etc. For men, there were formal shirts, trousers, jeans, t-shirts, suits, ties, socks, and undergarments and accessories like sunglasses and leather products. The company had two manufacturing units in Trichy and Salem.
The silk saree business had suddenly seen a big boom in ad spending during 2002. According to industry estimates, the category accounted for Rs 30 crores worth of ad spends in Chennai alone (2003). Roja spent around Rs. 2 crores on its launch alone. Another big spender was Nandhini Silks (Nandhini), which spent around Rs. 1 crore on advertising to drive home the message that it was not a force that could be easily ignored. In the past, well-entrenched players such as Aruna Silks (Aruna) had released ads through local outfits only on occasions such as Diwali, Christmas and Pongal. Now the needs had changed. The key issue was differentiation and brand building, in what was turning out to be a highly competitive market. This probably explained the boom in ad spending.
Roja believed it was possible to generate faster growth. The retailer believed capacity had to be built ahead of the market demand. The promoters had asked the General Manager (GM) had to decide the location of the plant. With two options before him, GM was somewhat confused:
Construction of a large plant to meet possible demand in future.
Construction of a small plant to meet a low demand and expanding it when the demand increased.
After detailed discussions with his colleagues, GM decided to get the help of a consultant for conducting market research to find out more about the demand pattern. The consultant believed the probabilities of low, medium, and high demand were 0.3, 0.4, and 0.3 respectively. The following data was also collected as part of the market research exercise.
If a large plant was constructed at a cost of Rs. 12 lakhs, it would be able to meet the demand in the future. The operating returns for low, medium and high demand were estimated at Rs. 10 lakhs, Rs. 16 lakhs and 24 lakhs respectively.
If a small plant was constructed at a cost of Rs. 6 lakhs, it would meet only low demand and it would have to be expanded if demand increased in the future.
Depending upon the demand, a small plant might require no expansion (for low demand), or might require a small expansion at a cost of Rs. 3 lakhs (for medium demand), or might require a large expansion at a cost of Rs. 5 lakhs (for high demand).
In future, for the sudden expansion of the plant to meet the demand, some revenues might be lost. The operating returns to be realized in case of small plant expansion and large plant expansion were projected at Rs. 14 lakhs and Rs. 22 lakhs respectively.
The GM was wondering which of the options he must pursue.
© ICFAI Knowledge Center. All rights reserved.

Ram Publishers On 20th February 2004, Siva Raman, President of Ram Publishers met R.K.Mohan, Vice President, Marketing, and Robert Wilson, Chief Editor, to exchange notes on the negotiations under way with N.Periyasamy regarding his soon-to-be-written autobiography. Periyasamy, a 65 year old retired IAS officer, had been appointed to the Election commission by the government in 2000. Periyasamy planned to resign before his term expired in 2005. He had approached Ram Publishers, as well as two other publishing houses, to publish his memoirs.
Periyasamy was widely respected and his advice had been sought by friend and foe alike. He had cultivated friendships with various national political leaders. Periyasamy was a regular participant in various meetings convened by political leaders.
A year back, Periyasamy had decided to cash in on these experiences by writing a book. Ram Publishers had queried him about the likely content of the autobiography. While it was clear he intended to narrate the political intrigues he had known, he also seemed to be well-informed on other issues. Ram Publishers believed Periyasamy’s autobiography might become a best seller.
Periyasamy was very clear about his profit expectation-Rs. 2 lakhs to sign a deal and another Rs. 2 lakhs upon delivery of the script. It was also understood that the manuscript would be ghost-written. Periyasamy would tell his reminiscences to Ram Publishers’ staff who would compile them into a book.
At a meeting between Siva Raman, Mohan, and Robert Wilson, the conversation went as follows:
Mohan: I think this book could be a big hit of 2005 and the sales could be as much as one lakh copies assuming a price of Rs.250 retail. This is first and foremost a political book. But let us not get too excited. We have to consider the possibility that Periyasamy’s personal appeal, which is at its peak at the moment, might dissipate over the next year. We also don't know which other politicians might publish their memoirs around the same time. Remember, 2004 is an election year. The situation is quite fluid. I believe that at a retail price of Rs.250, there is a 40% chance of sales of around one lakh books, a 30% chance of sales of around 40,000 books, and a 30% chance of sales of around 10,000 books. Those are just representative scenarios for the purpose of our calculations, of course.
Wilson: One thing is important. The book has to be written before we can sell it. He has never written a book before, so he doesn't know what it involves.
Siva Raman: We are also not completely confident that his memoirs are going to be as exciting as we are expecting. Let's face it, when our staff start looking at his stories, they may find that the book is dull.
Mohan: We should be careful. We have to be sure, we can make a profit if we publish it. One good thing, Periyasamy has accepted the possibility that we may not wish to publish the book once we get to look at the manuscript.
Wilson: That's right. But after his delivery of manuscript, we have to pay him the second Rs.2 lakhs, whether we publish it or not.
Siva Raman: I think there is only a 70% chance Periyasamy will actually deliver a manuscript. Even after his delivery of manuscript, there's a 30% chance of a poor script that we cannot publish. If we decide to publish the book, then we have to examine the sales forecasts accurately. I don't see how we can learn much more about our likely sales before we make our final decision about going to press.

546
Quantitative Methods
Wilson: Why should we hand over Rs. 2 lakhs to someone who may never deliver a manuscript?
Siva Raman: Before we get into that, let us use these sales projections and probabilities and check to see if this deal makes sense.
Mohan: Let us first look at the costs. The cost of editorial services (editing, proofreading and obtaining permissions for photographs, etc) will be Rupees One lakh, which will be incurred even if we decide to stop publishing. If we decide to publish the book, we will also incur the cost of preparing camera-ready proofs, about Rs.50,000. Printing costs will be Rs.75 per copy.
Siva Raman: Will the unit cost come down, if we generate more volume?
Mohan: Yes, but we'll need to print 10,000 copies no matter what. So, although it would cost much more per copy if we were printing, say, 1,000 copies, for the numbers we are talking about, it is effectively a flat rate. Furthermore, for orders of our size, the printer will allow us to order copies on an "as-needed" basis, and we'll still get the same rate. This means we won't get stuck with unsold inventory. We'll get returns if the retailers cannot sell them.
Mohan: My proposed retail price of Rs.250 assumes a wholesale price of Rs.160. For a generous margin like that we will not permit returns. That's a common enough practice with books of a very topical nature. Distribution costs will be about Rs.5 per copy. Marketing costs make up about 40% of the wholesale price.
Siva Raman: But much of that marketing cost is fixed. We have a marketing department and sales force whether we sell Periyasamy's book or not. What are our incremental marketing costs?
Mohan: We will pay 5% of the wholesale price as a commission to the sales force. We will also spend about Rs.15 lakhs on advance publicity. We can prevent this cost, if we decide not to publish the book based on our judgment.
Wilson: I feel that if we're only considering incremental expenses, then the cost of editorial services, would be more like Rs.50 thousand rather than Rupees One lakh, since the permanent editorial staff are not very busy these days.
Ram Publishers’ senior management wondered whether they should go ahead with the agreement.
© ICFAI Knowledge Center. All rights reserved.

Universal Home Care Products
In 2003, Universal Home Care Products Ltd., (Universal) was one of India’s largest producers of detergents and cleaning agents with sales of Rs. 1775 crores and a net income of Rs. 112.3 crores. The company’s product line consisted of over 1000 products ranging from industrial chemicals to a variety of household cleaners and detergents. Consumer products accounted for around 50% of the company’s turnover. Some of its brands had been highly successful over a long period of time, while others had been modified or dropped depending upon market conditions. The company had an active new product development function.
Universal’s policy with respect to any of its household cleaning products was very rigid. The product had to capture at least 5% share in that particular market within a year of its introduction, failing which the product was dropped. Recently, the company had developed an all-purpose household cleaner, ‘Sparkle’, which was the first of its kind. The cleaner differed from the traditional cleaners in its versatility. It could clean a variety of surfaces like wood, glass, metal, plastic and ceramic. According to Universal, Sparkle could remove the toughest of stains on any kind of surface. In addition, the new product was available as a spray cleaner offering ease of use.
The company’s product management group saw in the new spray cleaner, an opportunity to market a new product that could improve the company’s position in the household cleaner market. Sparkle was tested among 500 housewives. Though the product was not complete in all respects, it got instant sampling. After making minor changes in the packaging and fragrance, the product would be ready for the market. Universal projected market share of 6% by the first year, 10% by the second year and 14% after two years.
Daychem Ltd. was an aggressive competitor known for its proactive strategies. In the past, Universal and Daychem had fought fierce battles for market leadership in almost all the segments in which the companies had a presence. Past experience had proved that Daychem was fast in coming out with substitute products in a very short period. For all that Universal knew, Daychem might already be planning to launch a similar multi purpose household cleaner, with similar positioning, targeting the same segments.
The success of ‘Sparkle’ depended on Daychem’s ability to bring out a competing product and the relationship between the firm’s pricing structure for Sparkle and the competitor’s pricing structure for the competing product. Daychem’s ability to bring out a competing product was estimated at 60 %. Universal estimated the profits for its new product for three different prices, in the absence of competition. If Universal set a low price, the estimated profits were Rs. 60000, Rs. 75000 at a medium price and Rs. 90000 at a high price. There was another dimension to the problem because Universal had to take into account the competing product’s pricing as well.
Estimated Profits in Rs.’ 000
If competitor’s price is If Universal’s price is
Low Medium High
Low 32 40 49
Medium 35 48 50
High 12 30 49

548
Quantitative Methods
Universal had to set its price first because it was entering the market first with its
product. Estimates of the probability of competitor’s prices are as follows;
Competitor’s price expected to be If Universal’s price is
Low Medium High Low 80% 15% 5%
Medium 20% 70% 10%
High 5% 30% 65%
What should Universal do with respect to pricing Sparkle taking into account all these dimensions?
© ICFAI Knowledge Center. All rights reserved.

Alexander Machine Company On 6th January 2004, Alexander Machine Company’s (AMC) monthly planning meeting was going on. The company’s General Manager, S.Vimal was worried about the company’s financial performance during the past six months. As he remarked to his colleagues, “We are doing well only in some of our production lines. We have to do something to improve our financial position. We are not generating profit on our Model I printing presses. Why don’t we just stop producing it? Instead we can purchase gears from an outside supplier, to resolve the capacity problem in our gear-cutting department. Why don’t you get together, consider the various options, and arrive at an optimum solution?”
AMC manufactured two types of printing presses, Model I and Model II. Manufacturing operations involved were: gear cutting, roller polishing, and final assembly for each model.
Figure I AMC: Manufacturing Process
Gear Cutting could be done through various processes like gear hobbing, gear
milling1, and gear shaping
2. AMC used gear hobbing to produce the gears.
Gear hobbing was a highly customized and flexible manufacturing process for cutting external gears. Gear teeth were generally formed on the gear blank (raw material) by hobbing. Gear was cut on the gear blank using a cutter called hob. The hob had grooves, which could form cutting edges. The hob traversed slowly across the face of the blank as it rotated.
In the printing press, the paper and plate passed under a large metal roller that applied pressure, transferring the image from the plate to the paper. In the roller polishing lathe, the roller was polished to reduce the circumference of printing rollers to specifications and remove defects, such as turning and polishing lines, high spots, and scratches. The roller was mounted on mandrel of lathe. The circumference of the roller was measured at several points to locate irregular spots, using girth tape while the surface of the roller was examined for defects. Polishing of the roller was done by a polishing stone, which moved back and forth across the length of the roller, changing from coarse to finer grades of stone to impart acceptably smooth finish. Again, the polished roller was examined for rough spots, pinholes, and scratches and verified for size. The roller was cleaned before and after polishing, using cloth, water, and detergents or cleaning solution. In the assembly shop, the gears and rollers were assembled and finally checked for quality.
AMC’s gear cutting capacity was adequate to cut gears for either 2000 Model I printing presses per month or 1000 Model II printing presses per month, if committed fully to either model. AMC could also cut gears for both models: for example, it could produce 1000 Model I printing presses and 500 Model II printing presses. The machine-hour requirements for each printing press Model and the monthly machine-
1 Here the gears are made by a rotating multi-edge cutter having a cross-section similar to that of the generated gear teeth.
2 Here gears are made by a reciprocating cutter with the work piece. The gear-shaped cutter is reciprocated and rotated in relationship

550
Quantitative Methods
hour availability in the departments are shown in Exhibit I. The company believed it could sell as many printing presses as it could produce.
Exhibit I Machine-Hours: Requirements and Availability
Machine-Hours required per model of printing presses
Total Machine-Hours available per month Department
Model I Model II Gear cutting 1 2 2000
Roller polishing 2 2 4000
Final assembly I 2 - 4000
Final assembly II - 4 2,000
AMC’s production schedule for the last six months of 2003 had resulted in a monthly output of 1000 Model I printing presses and 500 Model II printing presses. At this level of production, Model II assembly and gear cutting were operating at capacity. However, roller polishing and Model I assembly were operating only at 50% capacity. See Exhibit II for details of costs.
Exhibit II Details of costs (in Rupees)
Model I Model II Direct materials 2,70,000 2,40,000
Direct labor
Gear cutting 19,500 23,000
Roller polishing 10,000 7,000
Final assembly 30,000 20,000
59,500 50,000
Overhead
Gear cutting 30,725 40,950
Roller polishing 40,680 40,000
Final assembly 89,200 50,000
1,60,605 1,30,950
Total 4,90,105 4,20,950 The finance manager, sales manager, and production manager discussed the problem in detail in their conference room.
“I have been observing the cost data for the two Models,” the sales manager began. “Why don’t we just stop production of Model I printing presses? We are not generating any profit on Model I printing presses. As we know, the selling prices for Model I are Rs.4,70,000, and for Model II are Rs.4,40,000”.
The finance manager interrupted, “We are trying to absorb the entire fixed overhead of Model I printing presses over only 1000 printing presses. We would be better off increasing production of Model I printing presses, stopping if necessary production of Model II.”
The production manager said, “There is a way to increase Model I production without stopping Model II production. If we purchase gears from an outside supplier, the gear-cutting problem can be solved. We can supply the necessary materials and reimburse the supplier for labor and overhead”. The team wondered how the problem could be resolved.
© ICFAI Knowledge Center. All rights reserved.

Best Fibre In 2003, Best Fibre (Best), a leading manufacturer of paper products, recorded sales of Rs.102 crores and a net income of Rs.46 crores. The company’s flexible manufacturing system had 12 paper machines. Best manufactured three types of products- linerboard (natural, white-top and full bleached), corrugating medium, wrapping and bag papers, and multiwall sack paper which included special colored papers used to make custom paper bags, school craft papers, and special colored paper unique to certain products.
In paper manufacturing, wood chips were converted into pulp through a chemical process. The pulp was then converted to paper.
All chips came directly from the harvest site, or as a by-product from sawmills. Chips were delivered by trucks and trailers and unloaded by large hydraulic dumpers.
The chips were screened to quality and size specifications and transported to the digester, a large pressure vessel, where they were combined with sodium hydroxide and sodium sulphide at high temperature. This process removed some of the lignin (natural "glue" which held the wood fibres together) to soften the fibres, reduced the discolouration and stabilized the brightness of the pulp. The used chemicals and lignin, known as black liquor, were collected through the recovery boiler in order to recover chemicals and generate steam and power, which in turn reduced both effluents and costs. The pulp moved on through a series of washers and screens, in preparation for further processing. This was known as natural fibre. The pulp was then diluted and bleached in a five-stage process. The bleached wet pulp was ready to be formed by the pulp machine. Here, a moving belt of woven nylon mesh, or "wire", formed the pulp into a thick mat by removing much of the water.
Next, a series of presses removed more water, until the sheet was about 45 % dry. Then steam-heated, "air borne" dryers dried the sheet to 94 %. The sheet, moving at a speed of up to 120 metres per minute, was cooled and cut into smaller sheets of a thick, porous, paper-like card. These sheets were compressed, wrapped in 245-kilogram bales and shipped to customers. In case of coloured fibres, the required colours were added to the pulp.
Papers were made using natural, bleached and colored fibres. Some were made with different surface characteristics and with high percentages of recycled fibres. The production supervisor was responsible for the required raw material mix. He had to decide the mix according to the type of product to be produced, depending upon the production plan for the day. The available units were 6000, 5000 and 5000. The raw material requirements per unit of the products are given in Table I.
Table I
Requirement per unit of product
Raw material Line board
Wrapping papers
Multiwall sack paper
Specialcolour paper
Natural fibre 4 2 3 3
Bleached fibre 3 4 2 3
Coloured fibre 2 3 4 5
The minimum demand for the products was 300, 500, 200, and 300 units respectively. The profits per unit were Rs.40, Rs.60, Rs.50, and Rs.80. The production supervisor had to work out the optimum mix.
© ICFAI Knowledge Center. All rights reserved.

Lakshmi Engines In 2004, Lakshmi Engines (Lakshmi), a leading manufacturer of diesel engines, based in Coimbatore, was a dominant player in South India. All the required parts were made by Lakshmi’s own manufacturing facilities.
Lakshmi’s manufacturing plant had three main areas: machine shop, where the most important parts of the engine like cylinder block, cylinder head, crankshaft, camshaft, piston, and piston pins and connecting rod were made; Engine assembly, where parts made in the engine machine shop were assembled; Engine testing, where engines were tested for power and leaks. For machining of the components, Lakshmi used CNC lathes, drilling machines, milling machines, and Jig boring machines. After passing quality control tests, the engines were sent to a storage area.
In recent times, Lakshmi had been sharpening its focus on what it considered to be its core products. These included camshaft, piston, and crankshaft. The company had decided to continue manufacturing these items. Lakshmi had decided in principle to source the remaining items like cylinder head, cylinder block, piston pins and connecting rod, from suppliers. Lakshmi wanted to develop a vendor base committed to continuous improvement to meet quality, cost and delivery standards.
The company’s policy was to consider new suppliers for required components, based on the ability of vendors to meet specification, price and delivery schedules. To qualify as a vendor, a bidder had to meet various requirements. First the company would send the drawings to the vendor for obtaining a quotation. After receiving the quotation, the vendor was given adequate feedback and a survey was undertaken at a mutually agreed date. If the vendor met all expectations in terms of price, quality and delivery, he would get a trial order. Both on-line and off-line inspections were carried out at the time of processing the trial order. Based on the outcome of the trial order, the company would approve the vendor.
A separate team was entrusted with the responsibility of developing the vendor base. The team worked with some of the bidders and identified four suppliers for outsourcing the components. The team reported this to the top management. The Managing Director, K.David suggested, “Even though all the four are equally good, we have to get the supplies without any problem. So what I suggest you is to source only one type of component from one supplier”. So the team decided to allocate the component based on the cost. The team wondered how it could allocate the components to each supplier efficiently. Table I gives the cost details.
Table I
Details of Cost (per component) of each Supplier
Component Supplier
1 2 3 4
A 18 14 10 17
B 22 18 15 20
C 16 8 12 20
D 12 16 18 15
© ICFAI Knowledge Center. All rights reserved.