Embed Size (px)
Citation preview
r e f l e c t …
2006 Annual Report
cruise brands in North and South America, the United Kingdom, Germany,
Southern Europe and Australia, offer a wide range of holiday and vacation prod-
ucts to a customer base that is broadly varied in terms of cultures, languages
and leisure-time preferences. We also own two leading tour companies in Alaska
and the Canadian Yukon that complement our cruise operations, Holland America
Tours and Princess Tours. Combined, our vacation companies attract over seven
million guests annually.
Carnival’s product offerings provide our guests with exceptional vacation experi-
ences at an outstanding value, and our success in this regard has made us the most
profitable company in the leisure industry. Our company is dually listed on both
the New York Stock Exchange and the London Stock Exchange under the symbol
CCL. Carnival is the only company in the world to be included in both the S&P 500
Index in the United States and the FTSE 100 Index in the United Kingdom.
Headquartered in Miami, Florida, U.S.A. and London, England, Carnival has over
75,000 employees worldwide. We operate a fleet of 81 ships, and we have another
20 vessels scheduled for delivery by 2011. With approximately 144,000 guests
and 60,000 crew members, there are over 200,000 people at sea with Carnival
at any given time.
Carnival Corporation & plc is a global cruise company and one of the largest
vacation companies in the world. Our portfolio of leading cruise brands includes
Carnival Cruise Lines, Princess Cruises, Holland America Line, Windstar Cruises
and Seabourn Cruise Line in North America; P&O Cruises, Cunard Line and Ocean
Village in the United Kingdom; AIDA Cruises in Germany; Costa Cruises in Europe;
and P&O Cruises in Australia. These brands, which comprise the most-recognized
the power of our gl bal brands
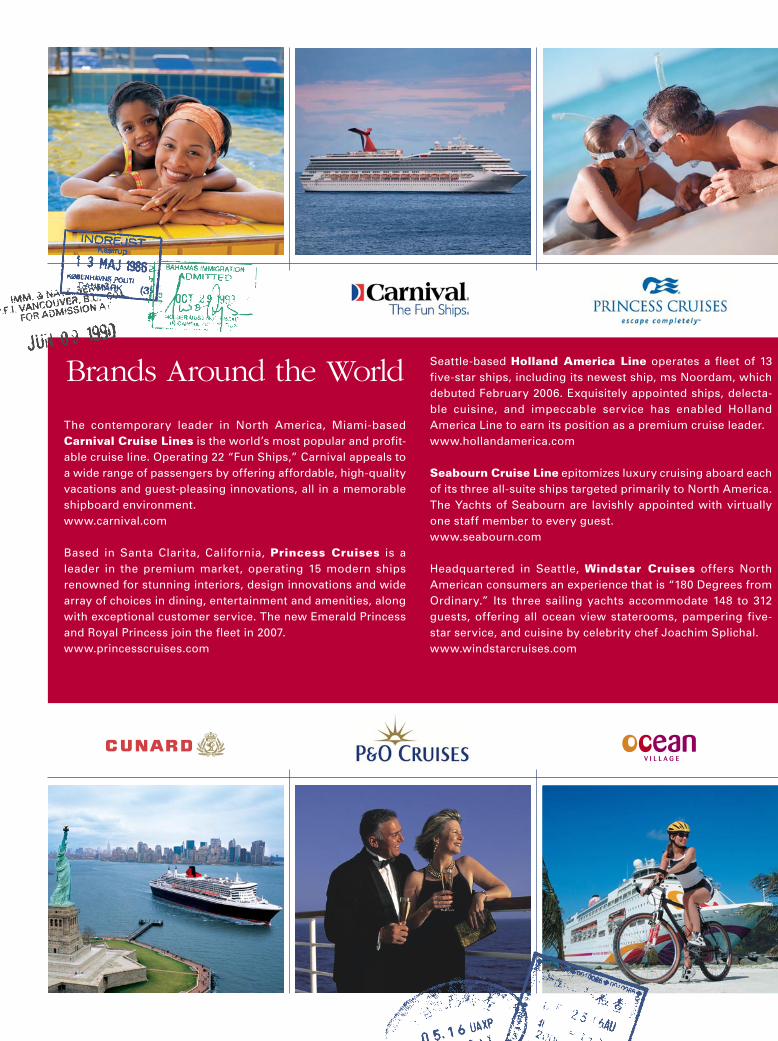
Brands Around the World
The contemporary leader in North America, Miami-based Carnival Cruise Lines is the world’s most popular and profit-able cruise line. Operating 22 “Fun Ships,” Carnival appeals to a wide range of passengers by offering affordable, high-quality vacations and guest-pleasing innovations, all in a memorable shipboard environment. www.carnival.com
Based in Santa Clarita, California, Princess Cruises is a leader in the premium market, operating 15 modern ships renowned for stunning interiors, design innovations and wide array of choices in dining, entertainment and amenities, along with exceptional customer service. The new Emerald Princess and Royal Princess join the fleet in 2007. www.princesscruises.com
Seattle-based Holland America Line operates a fleet of 13 five-star ships, including its newest ship, ms Noordam, which debuted February 2006. Exquisitely appointed ships, delecta-ble cuisine, and impeccable service has enabled Holland America Line to earn its position as a premium cruise leader. www.hollandamerica.com
Seabourn Cruise Line epitomizes luxury cruising aboard each of its three all-suite ships targeted primarily to North America. The Yachts of Seabourn are lavishly appointed with virtually one staff member to every guest. www.seabourn.com
Headquartered in Seattle, Windstar Cruises offers North American consumers an experience that is “180 Degrees from Ordinary.” Its three sailing yachts accommodate 148 to 312 guests, offering all ocean view staterooms, pampering five-star service, and cuisine by celebrity chef Joachim Splichal. www.windstarcruises.com
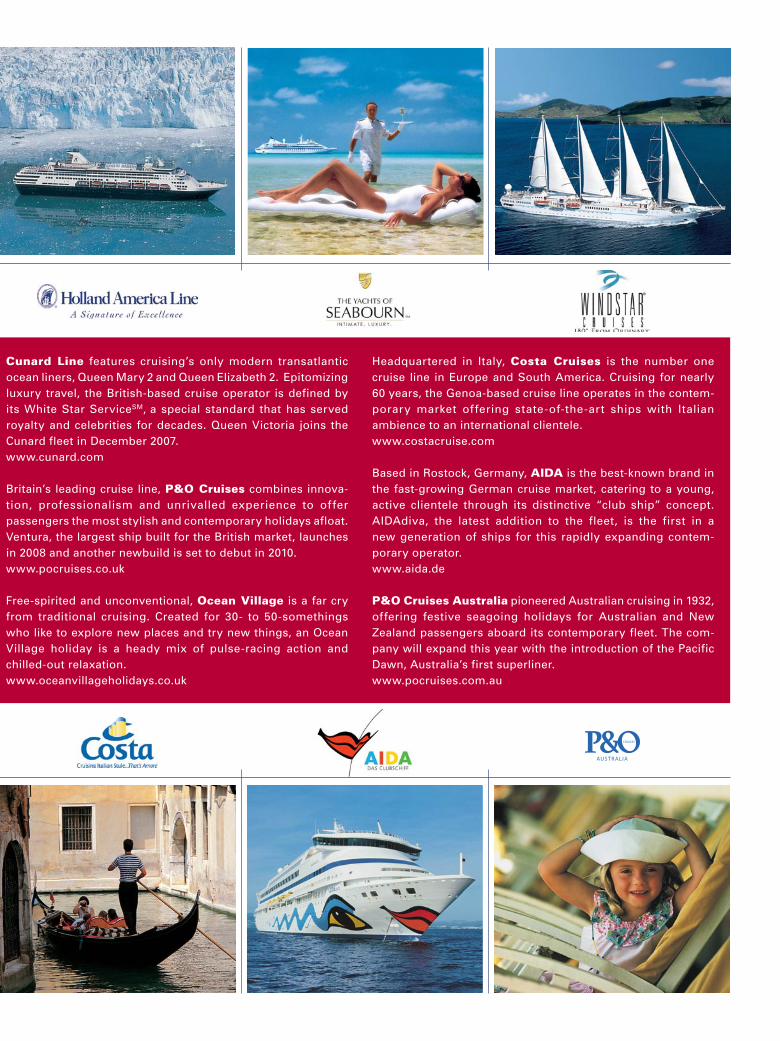
Cunard Line features cruising’s only modern transatlantic ocean liners, Queen Mary 2 and Queen Elizabeth 2. Epitomizing luxury travel, the British-based cruise operator is defined by its White Star ServiceSM, a special standard that has served royalty and celebrities for decades. Queen Victoria joins the Cunard fleet in December 2007. www.cunard.com
Britain’s leading cruise line, P&O Cruises combines innova-tion, professionalism and unrivalled experience to offer passengers the most stylish and contemporary holidays afloat. Ventura, the largest ship built for the British market, launches in 2008 and another newbuild is set to debut in 2010. www.pocruises.co.uk
Free-spirited and unconventional, Ocean Village is a far cry from traditional cruising. Created for 30- to 50-somethings who like to explore new places and try new things, an Ocean Village holiday is a heady mix of pulse-racing action and chilled-out relaxation. www.oceanvillageholidays.co.uk
Headquartered in Italy, Costa Cruises is the number one cruise line in Europe and South America. Cruising for nearly 60 years, the Genoa-based cruise line operates in the contem-porary market offering state-of-the-art ships with Italian ambience to an international clientele. www.costacruise.com
Based in Rostock, Germany, AIDA is the best-known brand in the fast-growing German cruise market, catering to a young, active clientele through its distinctive “club ship” concept. AIDAdiva, the latest addition to the fleet, is the first in a new generation of ships for this rapidly expanding contem-porary operator.www.aida.de
P&O Cruises Australia pioneered Australian cruising in 1932, offering festive seagoing holidays for Australian and New Zealand passengers aboard its contemporary fleet. The com-pany will expand this year with the introduction of the Pacific Dawn, Australia’s first superliner. www.pocruises.com.au
Brands Around the World
The contemporary leader in North America, Miami-based Carnival Cruise Lines is the world’s most popular and profit-able cruise line. Operating 22 “Fun Ships,” Carnival appeals to a wide range of passengers by offering affordable, high-quality vacations and guest-pleasing innovations, all in a memorable shipboard environment. www.carnival.com
Based in Santa Clarita, California, Princess Cruises is a leader in the premium market, operating 15 modern ships renowned for stunning interiors, design innovations and wide array of choices in dining, entertainment and amenities, along with exceptional customer service. The new Emerald Princess and Royal Princess join the fleet in 2007. www.princesscruises.com
Seattle-based Holland America Line operates a fleet of 13 five-star ships, including its newest ship, ms Noordam, which debuted February 2006. Exquisitely appointed ships, delecta-ble cuisine, and impeccable service has enabled Holland America Line to earn its position as a premium cruise leader. www.hollandamerica.com
Seabourn Cruise Line epitomizes luxury cruising aboard each of its three all-suite ships targeted primarily to North America. The Yachts of Seabourn are lavishly appointed with virtually one staff member to every guest. www.seabourn.com
Headquartered in Seattle, Windstar Cruises offers North American consumers an experience that is “180 Degrees from Ordinary.” Its three sailing yachts accommodate 148 to 312 guests, offering all ocean view staterooms, pampering five-star service, and cuisine by celebrity chef Joachim Splichal. www.windstarcruises.com
Cunard Line features cruising’s only modern transatlantic ocean liners, Queen Mary 2 and Queen Elizabeth 2. Epitomizing luxury travel, the British-based cruise operator is defined by its White Star ServiceSM, a special standard that has served royalty and celebrities for decades. Queen Victoria joins the Cunard fleet in December 2007. www.cunard.com
Britain’s leading cruise line, P&O Cruises combines innova-tion, professionalism and unrivalled experience to offer passengers the most stylish and contemporary holidays afloat. Ventura, the largest ship built for the British market, launches in 2008 and another newbuild is set to debut in 2010. www.pocruises.co.uk
Free-spirited and unconventional, Ocean Village is a far cry from traditional cruising. Created for 30- to 50-somethings who like to explore new places and try new things, an Ocean Village holiday is a heady mix of pulse-racing action and chilled-out relaxation. www.oceanvillageholidays.co.uk
Headquartered in Italy, Costa Cruises is the number one cruise line in Europe and South America. Cruising for nearly 60 years, the Genoa-based cruise line operates in the contem-porary market offering state-of-the-art ships with Italian ambience to an international clientele. www.costacruise.com
Based in Rostock, Germany, AIDA is the best-known brand in the fast-growing German cruise market, catering to a young, active clientele through its distinctive “club ship” concept. AIDAdiva, the latest addition to the fleet, is the first in a new generation of ships for this rapidly expanding contem-porary operator.www.aida.de
P&O Cruises Australia pioneered Australian cruising in 1932, offering festive seagoing holidays for Australian and New Zealand passengers aboard its contemporary fleet. The com-pany will expand this year with the introduction of the Pacific Dawn, Australia’s first superliner. www.pocruises.com.au
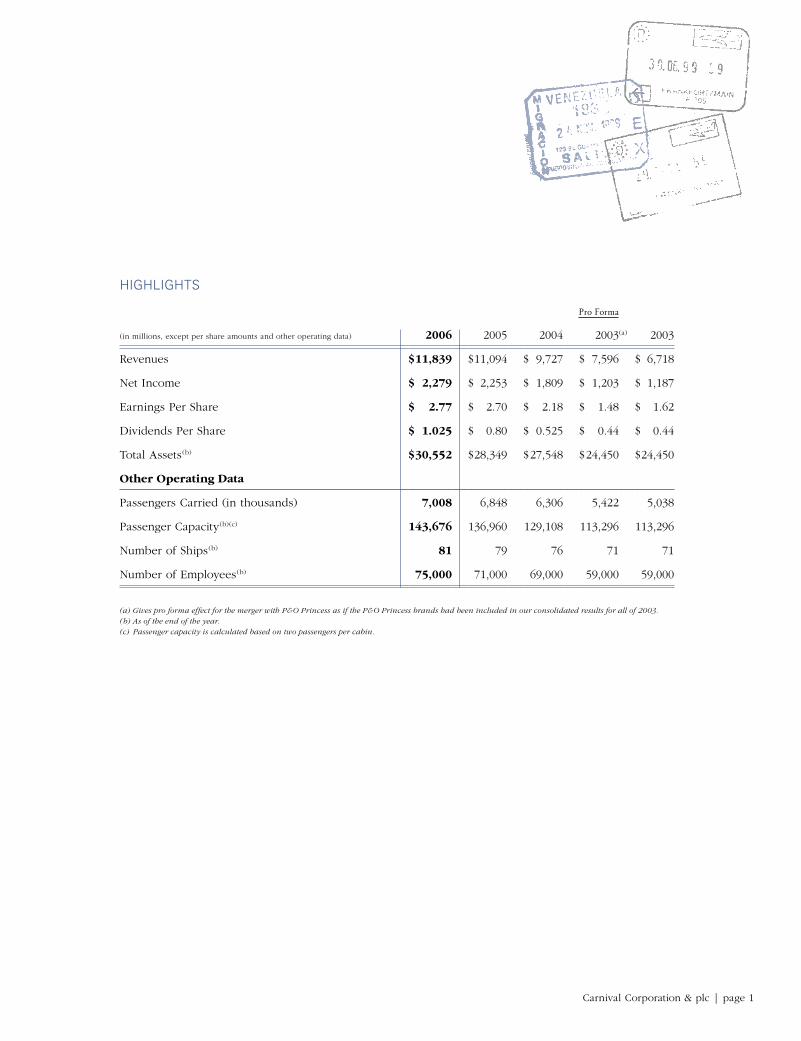
Pro Forma
(in millions, except per share amounts and other operating data) 2006 2005 2004 2003(a) 2003
Revenues $ 11,839 $ 11,094 $ 9,727 $ 7,596 $ 6,718
Net Income $ 2,279 $ 2,253 $ 1,809 $ 1,203 $ 1,187
Earnings Per Share $ 2.77 $ 2.70 $ 2.18 $ 1.48 $ 1.62
Dividends Per Share $ 1.025 $ 0.80 $ 0.525 $ 0.44 $ 0.44
Total Assets(b) $ 30,552 $ 28,349 $ 27,548 $ 24,450 $ 24,450
Other Operating Data
Passengers Carried (in thousands) 7,008 6,848 6,306 5,422 5,038
Passenger Capacity(b)(c) 143,676 136,960 129,108 113,296 113,296
Number of Ships(b) 81 79 76 71 71
Number of Employees(b) 75,000 71,000 69,000 59,000 59,000
(a) Gives pro forma effect for the merger with P&O Princess as if the P&O Princess brands had been included in our consolidated results for all of 2003.(b) As of the end of the year.(c) Passenger capacity is calculated based on two passengers per cabin.
HIGHLIGHTS
Carnival Corporation & plc | page 1
Our annual report provides an opportunity to reflect on the challenges and accomplishments of 2006, while looking forward to the exciting days ahead.
Overall, 2006 was a challenging year for us but in many ways also a successful year. We remained the world’s most profitable vacation company, achieving revenues approaching $12 billion and record net income of $2.3 billion or $2.77 per share. Our dedicated employees delivered memorable vacation experiences to more than 7 million guests worldwide, and we continued to build a base of loyal repeat guests across our portfolio of global brands.
Revenues grew 6.7 percent during 2006, driven by a 4.6 percent increase in capacity with the introduction of three new ships—Holland America’s Noordam, Princess Cruises’ Crown Princess and Costa Cruises’ Costa Concordia—and a rise in revenue yields of 1.5 percent from a combination of higher ticket prices and onboard guest spending.
We benefited from strong consumer demand in Europe in 2006. Our European brands posted record revenues and earnings as we pursued our global strategy. Our North American brands maintained strong pricing for their European and Alaskan departures but Caribbean cruise prices were weakened by a variety of factors, including hurricane and economic.
While the 2006 hurricane season fortunately did not fulfill well-publicized storm predictions, many consumers still were reluctant to book a Caribbean cruise, and we priced our Caribbean product aggres-sively to stimulate demand.
We continue to explore destination development opportunities to enhance the Caribbean’s appeal. Among strategic Caribbean initiatives recently implemented are the opening of the $42 million Grand Turk Cruise Center in the Turks & Caicos Islands and the addition of new facilities and activities at our private Bahamian island Half Moon Cay. We also have begun the rebuilding process at Puerta Maya, our port in Cozumel that was destroyed by Hurricane Wilma in 2005.
An Eye on the Bottom Line Maintaining disciplined control over manageable costs is ingrained in our corporate culture. While other operating costs on a unit basis were flat this year, record fuel prices increased operating expenses by $210 million and reduced earnings by $0.25 per share.
While a 30 percent increase in the cost of fuel is difficult to overcome, our fuel conservation working group launched dozens of initiatives aimed at reducing consumption. Those efforts reduced fuel consumption on a unit basis by 2 percent fleetwide, thus providing significant benefits to our bottom line.
We continue to return value to shareholders through our stock repurchase program and increased dividends. In 2006, we repurchased approximately 20 million shares, for a total repurchase since program inception of approximately 27 million shares at a cost of $1.2 billion.
We also increased our annual dividend 10 percent to $1.10 per share, which represents a cumulative increase in dividends of more than 80 percent over the past two years.
Strategic Growth InitiativesOur growth strategy has been to establish a presence in a geographic region and then add capacity to stimulate cruise growth in the region. As the region develops, we may further segment it, using multiple brands targeting different demographic groups to achieve maximum penetration. This strategy has worked well in the United States, the UK and Continental Europe.
Shipbuilding is an essential part of our brand-building efforts, and in 2006, we ordered seven new ships, bringing our order book to 20 new vessels valued at $11 billion.
We are building four ships for contemporary brand Carnival Cruise Lines, which attracts the broadest demographic offering fun affordable vacations. Three vessels have been ordered for premium brands Princess and Holland America, which are well positioned to capture affluent baby boomers as they seek longer, more exotic vacation experiences.
And during 2006, we reached a decision to expand the ultra-luxury segment of the North American cruise business by ordering two 450-passenger all-suite ships for Seabourn Cruise Line—the first ships built for that brand in 15 years. While Seabourn has operated small, 200-passenger all-suite ships, the larger vessels will offer better economies of scale and facilities and amenities aimed at Seabourn’s discriminating guests—the wealthiest segment of the population.
The decision to more than double Seabourn’s capacity demonstrates our commitment to the luxury cruise segment and our confidence in the growing consumer interest in Seabourn’s unique yacht-like cruise experience.
Globalization ContinuesIn 2006, we continued to extend the global reach of our company through expansion in Europe and the launch of a cruise venture in China.
The United Kingdom, Italy and Germany enjoy especially strong cruise demand, and Carnival operates the leading cruise brands in the UK and Continental Europe. We believe Europe has tremendous potential for growth and have ordered 11 ships for our European brands which are scheduled for delivery over the next four years.
Our Costa Cruises brand is the largest cruise line in Europe and serves a broad European clientele. Costa has four ships on order for delivery through 2010, representing a capacity increase of more than 50 percent.
P&O Cruises and Cunard, the two leading UK brands, have three ships on order. Building on the success of Queen Mary 2, Cunard will
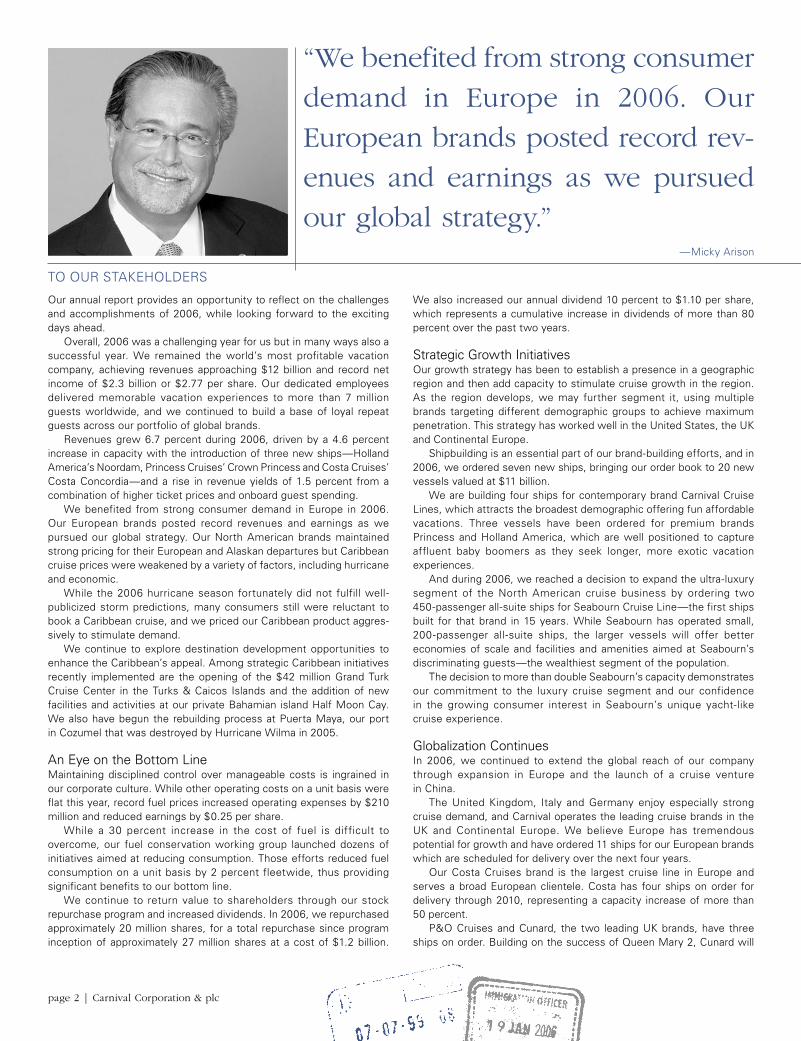
TO OUR STAKEHOLDERS
“We benefited from strong consumer demand in Europe in 2006. Our European brands posted record rev-enues and earnings as we pursued our global strategy.”
page 2 | Carnival Corporation & plc
—Micky Arison
welcome Queen Victoria later this year. P&O Cruises, which serves traditional British cruise customers, also has two 3,000-passenger ships on order scheduled for delivery in 2008 and 2010.
Our AIDA brand—Germany’s most popular cruise line—will add four new ships over the next four years, beginning with the AIDAdiva which is scheduled for delivery in April 2007. We also recently announced the signing of a letter of intent to form a joint venture with TUI AG, Germany’s largest tour operator. TUI carried more than 7.5 million tour passengers last year and has a remarkable 95 percent brand awareness among German consumers.
Through the TUI joint venture, we plan to develop a second brand aimed at a different demographic of the German customer. AIDA will continue its highly successful “club cruises” concept geared toward younger and more active cruisers while a new TUI-branded cruise ship is planned, which will target a slightly older and more affluent German traveler.
Spain is another region primed for expansion and though our Costa Cruises brand already has a strong presence there, we believe huge potential for expansion exists as it is one of the fastest-growing areas of the European vacation industry. To capitalize on this, we signed a letter of intent to form a new joint venture with Orizonia Corporación, Spain’s largest travel company which operates its own two-ship fleet under its Iberojet division. The new joint venture would eventually be comprised of a multi-ship fleet aimed at a different demographic than the premium market that Costa currently serves.
2006 marked our entry into China, where there is great potential. Long-standing government travel restrictions have been relaxed, giving more Chinese the ability to travel abroad. As China’s economy matures and its middle class expands, the number of Chinese travelers is expected to grow and we intend to convert those tourists into cruisers.
The Costa China initiative was launched in July 2006 with five-day cruises from Shanghai aboard Costa Allegra, which was refurbished to serve Chinese and Asian tastes. Although we anticipated challenges entering China, the program has developed more slowly than expected during 2006. We have made a number of modifications to the program for 2007, including changing itineraries and marketing the China cruises to other Asian countries and Europe. We believe these changes will result in improved performance for the China/Asia program in 2007.
An Industry Leader While we are proud of our leading role in the cruise industry, we also strive to provide leadership on environmental issues and social responsibility. In 2006, all of our operating companies successfully achieved implementation and certification of their environmental management systems to the ISO 14001 standard. These certifications recognize our commitment to management of our environmental processes, products and services in our effort to minimize our environmental footprint.
As the world’s largest cruise operator, we have a duty to be a responsible global citizen. As part of our ongoing commitment to corporate responsibility, the Health, Environmental, Safety and Security Committee of the board of directors was formed in 2006. This committee has specific responsibility for monitoring compliance with health, environmental, safety and security policies, as well as to review enterprise risk and assess mitigation measures in those areas of our business. Looking Forward to 2007In 2007, we mark the 35th anniversary of Carnival Cruise Lines, the flagship brand of our company. It is remarkable to reflect on the dramatic changes in our company and in the cruise industry over three and a half decades. We have come a long way since my father, Ted Arison, created a new style of cruising with the launch of a refurbished trans-Atlantic ocean liner, the Mardi Gras, in March 1972.
2007 also is the 20th year since our initial public offering. In 1987, when Carnival Cruise Lines went public, the company had seven ships and $150 million in income. Today, Carnival Corporation & plc is a global company with a portfolio of industry-leading brands that produce $2.3 billion of earnings from its 81-ship fleet. Based on our current order book, we will have approximately 100 ships in service by 2011.
I take this opportunity to thank our 75,000 employees worldwide for their hard work and dedication in creating unforgettable vacation experiences for our guests. I also want to thank our board of directors for their support during the past year.
I would especially like to thank retiring board member Kirk Lanterman for his dedicated service over the past 17 years as chairman and CEO of Holland America Line. Kirk was one of the pioneers of Alaska cruising and his hard work was instrumental in making Holland America Line the leading premium cruise brand.
I also would like to acknowledge the contributions of Deborah Natansohn, president of Seabourn Cruise Line, who died suddenly and unexpectedly late last year. Debbie was a very talented executive, and her leadership, creativity and humor will be missed.
Finally, we express our gratitude to our shareholders for their continued support. And, on behalf of our shareholders, shoreside staff and shipboard crew, we thank the 7 million-plus guests who chose to spend their vacations with us last year. We hope to see you again soon.
Sincerely,
Micky ArisonChairman and CEO
February 14, 2007
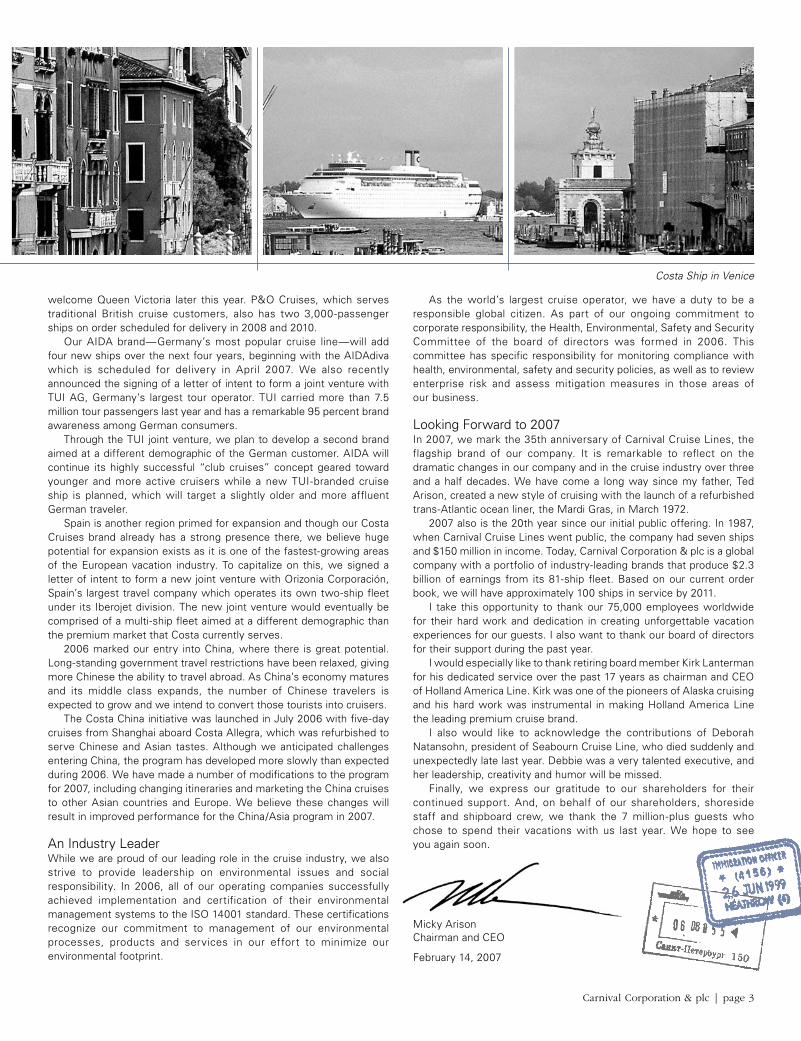
Costa Ship in Venice
Carnival Corporation & plc | page 3
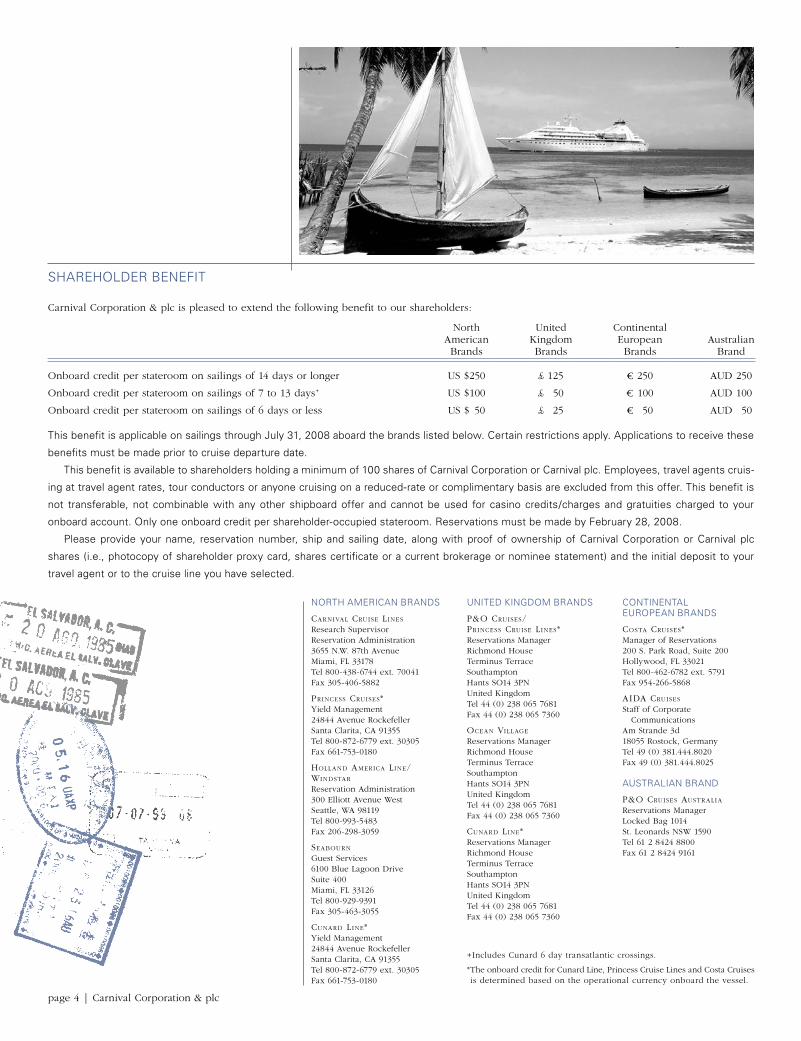
Carnival Corporation & plc is pleased to extend the following benefit to our shareholders:
North United ContinentalAmerican Kingdom European AustralianBrands Brands Brands Brand
Onboard credit per stateroom on sailings of 14 days or longer US $250 £ 125 ¤ 250 AUD 250
Onboard credit per stateroom on sailings of 7 to 13 days+ US $100 £ 50 ¤ 100 AUD 100
Onboard credit per stateroom on sailings of 6 days or less US $ 50 £ 25 ¤ 50 AUD 50
This benefit is applicable on sailings through July 31, 2008 aboard the brands listed below. Certain restrictions apply. Applications to receive these
benefits must be made prior to cruise departure date.
This benefit is available to shareholders holding a minimum of 100 shares of Carnival Corporation or Carnival plc. Employees, travel agents cruis-
ing at travel agent rates, tour conductors or anyone cruising on a reduced-rate or complimentary basis are excluded from this offer. This benefit is
not transferable, not combinable with any other shipboard offer and cannot be used for casino credits/charges and gratuities charged to your
onboard account. Only one onboard credit per shareholder-occupied stateroom. Reservations must be made by February 28, 2008.
Please provide your name, reservation number, ship and sailing date, along with proof of ownership of Carnival Corporation or Carnival plc
shares (i.e., photocopy of shareholder proxy card, shares certificate or a current brokerage or nominee statement) and the initial deposit to your
travel agent or to the cruise line you have selected.
+ Includes Cunard 6 day transatlantic crossings.
* The onboard credit for Cunard Line, Princess Cruise Lines and Costa Cruises is determined based on the operational currency onboard the vessel.
NORTH AMERICAN BRANDS
CARNIVAL CRUISE LINES
Research SupervisorReservation Administration3655 N.W. 87th AvenueMiami, FL 33178Tel 800-438-6744 ext. 70041Fax 305-406-5882
PRINCESS CRUISES*Yield Management24844 Avenue RockefellerSanta Clarita, CA 91355Tel 800-872-6779 ext. 30305Fax 661-753-0180
HOLLAND AMERICA LINE/WINDSTAR
Reservation Administration300 Elliott Avenue WestSeattle, WA 98119Tel 800-993-5483Fax 206-298-3059
SEABOURN
Guest Services6100 Blue Lagoon DriveSuite 400Miami, FL 33126Tel 800-929-9391Fax 305-463-3055
CUNARD LINE*Yield Management24844 Avenue RockefellerSanta Clarita, CA 91355Tel 800-872-6779 ext. 30305Fax 661-753-0180
UNITED KINGDOM BRANDS
P&O CRUISES/PRINCESS CRUISE LINES*Reservations ManagerRichmond HouseTerminus TerraceSouthamptonHants SO14 3PNUnited KingdomTel 44 (0) 238 065 7681Fax 44 (0) 238 065 7360
OCEAN VILLAGE
Reservations ManagerRichmond HouseTerminus TerraceSouthamptonHants SO14 3PNUnited KingdomTel 44 (0) 238 065 7681Fax 44 (0) 238 065 7360
CUNARD LINE*Reservations ManagerRichmond HouseTerminus TerraceSouthamptonHants SO14 3PNUnited KingdomTel 44 (0) 238 065 7681Fax 44 (0) 238 065 7360
CONTINENTAL EUROPEAN BRANDS
COSTA CRUISES*Manager of Reservations200 S. Park Road, Suite 200Hollywood, FL 33021Tel 800-462-6782 ext. 5791Fax 954-266-5868
AIDA CRUISES
Staff of Corporate CommunicationsAm Strande 3d18055 Rostock, GermanyTel 49 (0) 381.444.8020Fax 49 (0) 381.444.8025 AUSTRALIAN BRAND
P&O CRUISES AUSTRALIA Reservations Manager Locked Bag 1014 St. Leonards NSW 1590 Tel 61 2 8424 8800 Fax 61 2 8424 9161
page 4 | Carnival Corporation & plc
SHAREHOLDER BENEFIT
Carnival Corporation & plc | page 5
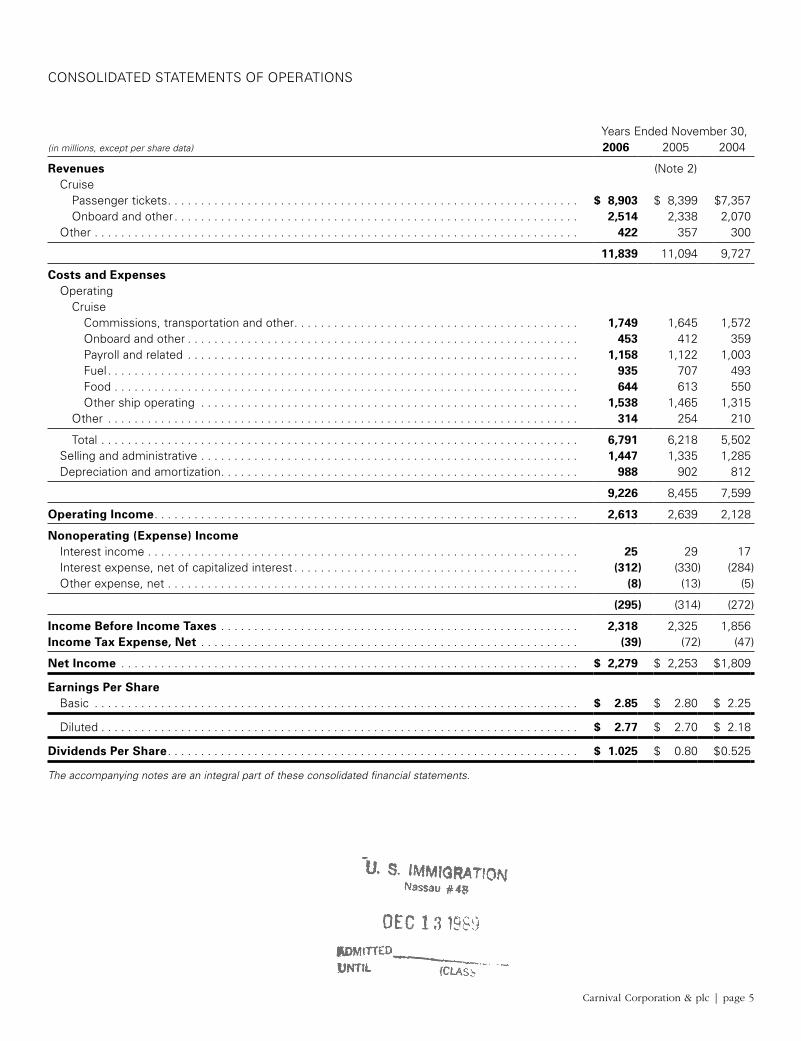
CONSOLIDATED STATEMENTS OF OPERATIONS
Years Ended November 30,(in millions, except per share data) 2006 2005 2004
Revenues (Note 2) Cruise Passenger tickets . . . . . . . . . . . . . . . . . . . . . . . . . . . . . . . . . . . . . . . . . . . . . . . . . . . . . . . . . . . . . . $ 8,903 $ 8,399 $7,357 Onboard and other . . . . . . . . . . . . . . . . . . . . . . . . . . . . . . . . . . . . . . . . . . . . . . . . . . . . . . . . . . . . . 2,514 2,338 2,070 Other . . . . . . . . . . . . . . . . . . . . . . . . . . . . . . . . . . . . . . . . . . . . . . . . . . . . . . . . . . . . . . . . . . . . . . . . . 422 357 300
11,839 11,094 9,727
Costs and Expenses Operating Cruise Commissions, transportation and other . . . . . . . . . . . . . . . . . . . . . . . . . . . . . . . . . . . . . . . . . . . 1,749 1,645 1,572 Onboard and other . . . . . . . . . . . . . . . . . . . . . . . . . . . . . . . . . . . . . . . . . . . . . . . . . . . . . . . . . . . 453 412 359 Payroll and related . . . . . . . . . . . . . . . . . . . . . . . . . . . . . . . . . . . . . . . . . . . . . . . . . . . . . . . . . . . 1,158 1,122 1,003 Fuel . . . . . . . . . . . . . . . . . . . . . . . . . . . . . . . . . . . . . . . . . . . . . . . . . . . . . . . . . . . . . . . . . . . . . . . 935 707 493 Food . . . . . . . . . . . . . . . . . . . . . . . . . . . . . . . . . . . . . . . . . . . . . . . . . . . . . . . . . . . . . . . . . . . . . . 644 613 550 Other ship operating . . . . . . . . . . . . . . . . . . . . . . . . . . . . . . . . . . . . . . . . . . . . . . . . . . . . . . . . . 1,538 1,465 1,315 Other . . . . . . . . . . . . . . . . . . . . . . . . . . . . . . . . . . . . . . . . . . . . . . . . . . . . . . . . . . . . . . . . . . . . . . . 314 254 210
Total . . . . . . . . . . . . . . . . . . . . . . . . . . . . . . . . . . . . . . . . . . . . . . . . . . . . . . . . . . . . . . . . . . . . . . . . 6,791 6,218 5,502 Selling and administrative . . . . . . . . . . . . . . . . . . . . . . . . . . . . . . . . . . . . . . . . . . . . . . . . . . . . . . . . . 1,447 1,335 1,285 Depreciation and amortization . . . . . . . . . . . . . . . . . . . . . . . . . . . . . . . . . . . . . . . . . . . . . . . . . . . . . . 988 902 812
9,226 8,455 7,599
Operating Income . . . . . . . . . . . . . . . . . . . . . . . . . . . . . . . . . . . . . . . . . . . . . . . . . . . . . . . . . . . . . . . . 2,613 2,639 2,128
Nonoperating (Expense) Income Interest income . . . . . . . . . . . . . . . . . . . . . . . . . . . . . . . . . . . . . . . . . . . . . . . . . . . . . . . . . . . . . . . . . 25 29 17 Interest expense, net of capitalized interest . . . . . . . . . . . . . . . . . . . . . . . . . . . . . . . . . . . . . . . . . . . (312) (330) (284) Other expense, net . . . . . . . . . . . . . . . . . . . . . . . . . . . . . . . . . . . . . . . . . . . . . . . . . . . . . . . . . . . . . . (8) (13) (5)
(295) (314) (272)
Income Before Income Taxes . . . . . . . . . . . . . . . . . . . . . . . . . . . . . . . . . . . . . . . . . . . . . . . . . . . . . . 2,318 2,325 1,856Income Tax Expense, Net . . . . . . . . . . . . . . . . . . . . . . . . . . . . . . . . . . . . . . . . . . . . . . . . . . . . . . . . . (39) (72) (47)
Net Income . . . . . . . . . . . . . . . . . . . . . . . . . . . . . . . . . . . . . . . . . . . . . . . . . . . . . . . . . . . . . . . . . . . . . $ 2,279 $ 2,253 $ 1,809
Earnings Per Share Basic . . . . . . . . . . . . . . . . . . . . . . . . . . . . . . . . . . . . . . . . . . . . . . . . . . . . . . . . . . . . . . . . . . . . . . . . . $ 2.85 $ 2.80 $ 2.25
Diluted . . . . . . . . . . . . . . . . . . . . . . . . . . . . . . . . . . . . . . . . . . . . . . . . . . . . . . . . . . . . . . . . . . . . . . . . $ 2.77 $ 2.70 $ 2.18
Dividends Per Share . . . . . . . . . . . . . . . . . . . . . . . . . . . . . . . . . . . . . . . . . . . . . . . . . . . . . . . . . . . . . . $ 1.025 $ 0.80 $ 0.525
The accompanying notes are an integral part of these consolidated financial statements.

page 6 | Carnival Corporation & plc
CONSOLIDATED BALANCE SHEETS
November 30,(in millions, except par value) 2006 2005
ASSETS (Note 2)Current Assets Cash and cash equivalents . . . . . . . . . . . . . . . . . . . . . . . . . . . . . . . . . . . . . . . . . . . . . . . . . . . . . . . . . . . . . . . . $ 1,163 $ 1,178 Trade and other receivables, net . . . . . . . . . . . . . . . . . . . . . . . . . . . . . . . . . . . . . . . . . . . . . . . . . . . . . . . . . . . . 280 430 Inventories . . . . . . . . . . . . . . . . . . . . . . . . . . . . . . . . . . . . . . . . . . . . . . . . . . . . . . . . . . . . . . . . . . . . . . . . . . . . . 263 250 Prepaid expenses and other . . . . . . . . . . . . . . . . . . . . . . . . . . . . . . . . . . . . . . . . . . . . . . . . . . . . . . . . . . . . . . . 289 263
Total current assets . . . . . . . . . . . . . . . . . . . . . . . . . . . . . . . . . . . . . . . . . . . . . . . . . . . . . . . . . . . . . . . . . . . . 1,995 2,121
Property and Equipment, Net . . . . . . . . . . . . . . . . . . . . . . . . . . . . . . . . . . . . . . . . . . . . . . . . . . . . . . . . . . . . . 23,458 21,312Goodwill . . . . . . . . . . . . . . . . . . . . . . . . . . . . . . . . . . . . . . . . . . . . . . . . . . . . . . . . . . . . . . . . . . . . . . . . . . . . . . . 3,313 3,206Trademarks . . . . . . . . . . . . . . . . . . . . . . . . . . . . . . . . . . . . . . . . . . . . . . . . . . . . . . . . . . . . . . . . . . . . . . . . . . . . . 1,321 1,282Other Assets . . . . . . . . . . . . . . . . . . . . . . . . . . . . . . . . . . . . . . . . . . . . . . . . . . . . . . . . . . . . . . . . . . . . . . . . . . . . 465 428
$ 30,552 $ 28,349
LIABILITIES AND SHAREHOLDERS’ EQUITYCurrent Liabilities Short-term borrowings . . . . . . . . . . . . . . . . . . . . . . . . . . . . . . . . . . . . . . . . . . . . . . . . . . . . . . . . . . . . . . . . . . . $ 438 $ 300 Current portion of long-term debt . . . . . . . . . . . . . . . . . . . . . . . . . . . . . . . . . . . . . . . . . . . . . . . . . . . . . . . . . . . 1,054 1,042 Convertible debt subject to current put option . . . . . . . . . . . . . . . . . . . . . . . . . . . . . . . . . . . . . . . . . . . . . . . . . 283 Accounts payable . . . . . . . . . . . . . . . . . . . . . . . . . . . . . . . . . . . . . . . . . . . . . . . . . . . . . . . . . . . . . . . . . . . . . . . 438 477 Accrued liabilities and other . . . . . . . . . . . . . . . . . . . . . . . . . . . . . . . . . . . . . . . . . . . . . . . . . . . . . . . . . . . . . . . 1,149 1,032 Customer deposits . . . . . . . . . . . . . . . . . . . . . . . . . . . . . . . . . . . . . . . . . . . . . . . . . . . . . . . . . . . . . . . . . . . . . . 2,336 2,051
Total current liabilities . . . . . . . . . . . . . . . . . . . . . . . . . . . . . . . . . . . . . . . . . . . . . . . . . . . . . . . . . . . . . . . . . . 5,415 5,185
Long-Term Debt . . . . . . . . . . . . . . . . . . . . . . . . . . . . . . . . . . . . . . . . . . . . . . . . . . . . . . . . . . . . . . . . . . . . . . . . . 6,355 5,727Other Long-Term Liabilities and Deferred Income . . . . . . . . . . . . . . . . . . . . . . . . . . . . . . . . . . . . . . . . . . . . 572 554Commitments and Contingencies (Notes 6 and 7)Shareholders’ Equity Common stock of Carnival Corporation; $.01 par value; 1,960 shares authorized; 641 shares at 2006 and 639 shares at 2005 issued . . . . . . . . . . . . . . . . . . . . . . . . . . . . . . . . . . . . . . . . . . . 6 6 Ordinary shares of Carnival plc; $1.66 par value; 226 shares authorized; 213 shares at 2006 and 212 shares at 2005 issued . . . . . . . . . . . . . . . . . . . . . . . . . . . . . . . . . . . . . . . . . . . 354 353 Additional paid-in capital . . . . . . . . . . . . . . . . . . . . . . . . . . . . . . . . . . . . . . . . . . . . . . . . . . . . . . . . . . . . . . . . . . 7,479 7,381 Retained earnings . . . . . . . . . . . . . . . . . . . . . . . . . . . . . . . . . . . . . . . . . . . . . . . . . . . . . . . . . . . . . . . . . . . . . . . 11,600 10,141 Unearned stock compensation . . . . . . . . . . . . . . . . . . . . . . . . . . . . . . . . . . . . . . . . . . . . . . . . . . . . . . . . . . . . . (13) Accumulated other comprehensive income . . . . . . . . . . . . . . . . . . . . . . . . . . . . . . . . . . . . . . . . . . . . . . . . . . . 661 159 Treasury stock; 18 shares at 2006 and 2 shares at 2005 of Carnival Corporation and 42 shares at 2006 and 2005 of Carnival plc, at cost . . . . . . . . . . . . . . . . . . . . . . . . . . . . . . . . . . . . . . . . . . . (1,890) (1,144)
Total shareholders’ equity . . . . . . . . . . . . . . . . . . . . . . . . . . . . . . . . . . . . . . . . . . . . . . . . . . . . . . . . . . . . . . . 18,210 16,883
$ 30,552 $ 28,349
The accompanying notes are an integral part of these consolidated financial statements.
Carnival Corporation & plc | page 7
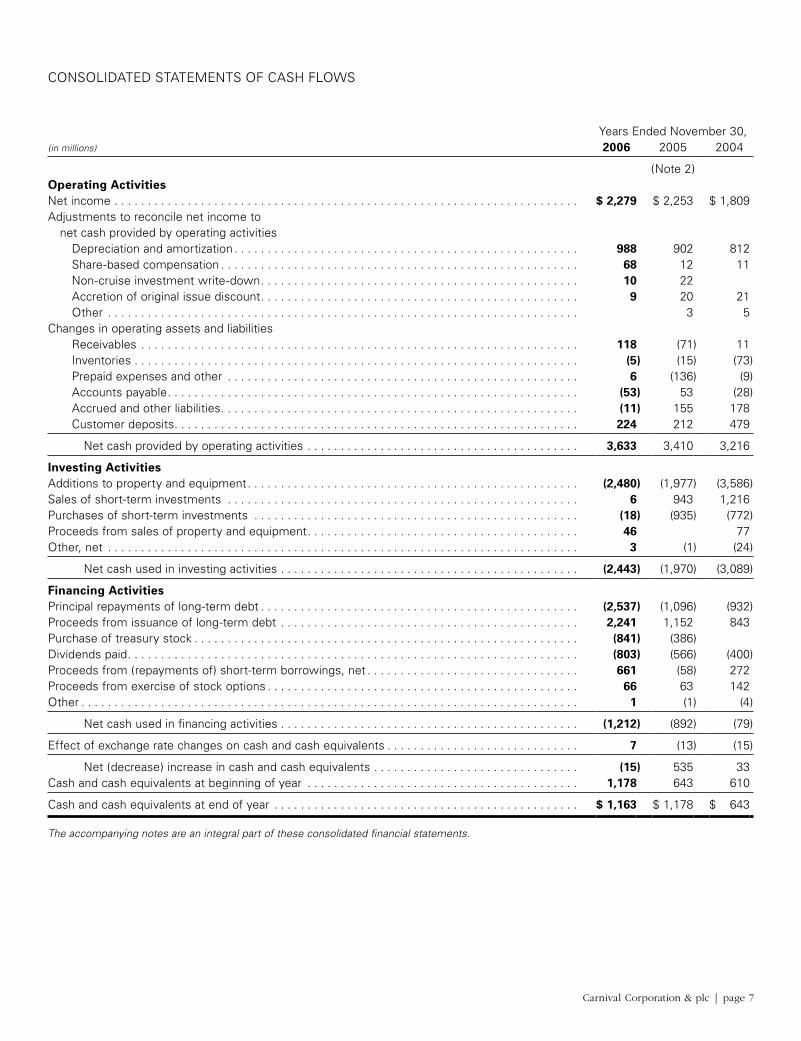
CONSOLIDATED STATEMENTS OF CASH FLOWS
Years Ended November 30,(in millions) 2006 2005 2004
(Note 2)Operating ActivitiesNet income . . . . . . . . . . . . . . . . . . . . . . . . . . . . . . . . . . . . . . . . . . . . . . . . . . . . . . . . . . . . . . . . . . . . . . $ 2,279 $ 2,253 $ 1,809Adjustments to reconcile net income to net cash provided by operating activities Depreciation and amortization . . . . . . . . . . . . . . . . . . . . . . . . . . . . . . . . . . . . . . . . . . . . . . . . . . . . 988 902 812 Share-based compensation . . . . . . . . . . . . . . . . . . . . . . . . . . . . . . . . . . . . . . . . . . . . . . . . . . . . . . 68 12 11 Non-cruise investment write-down . . . . . . . . . . . . . . . . . . . . . . . . . . . . . . . . . . . . . . . . . . . . . . . . 10 22 Accretion of original issue discount . . . . . . . . . . . . . . . . . . . . . . . . . . . . . . . . . . . . . . . . . . . . . . . . 9 20 21 Other . . . . . . . . . . . . . . . . . . . . . . . . . . . . . . . . . . . . . . . . . . . . . . . . . . . . . . . . . . . . . . . . . . . . . . . 3 5Changes in operating assets and liabilities Receivables . . . . . . . . . . . . . . . . . . . . . . . . . . . . . . . . . . . . . . . . . . . . . . . . . . . . . . . . . . . . . . . . . . 118 (71) 11 Inventories . . . . . . . . . . . . . . . . . . . . . . . . . . . . . . . . . . . . . . . . . . . . . . . . . . . . . . . . . . . . . . . . . . . (5) (15) (73) Prepaid expenses and other . . . . . . . . . . . . . . . . . . . . . . . . . . . . . . . . . . . . . . . . . . . . . . . . . . . . . 6 (136) (9) Accounts payable . . . . . . . . . . . . . . . . . . . . . . . . . . . . . . . . . . . . . . . . . . . . . . . . . . . . . . . . . . . . . . (53) 53 (28) Accrued and other liabilities . . . . . . . . . . . . . . . . . . . . . . . . . . . . . . . . . . . . . . . . . . . . . . . . . . . . . . (11) 155 178 Customer deposits . . . . . . . . . . . . . . . . . . . . . . . . . . . . . . . . . . . . . . . . . . . . . . . . . . . . . . . . . . . . . 224 212 479
Net cash provided by operating activities . . . . . . . . . . . . . . . . . . . . . . . . . . . . . . . . . . . . . . . . . 3,633 3,410 3,216
Investing ActivitiesAdditions to property and equipment . . . . . . . . . . . . . . . . . . . . . . . . . . . . . . . . . . . . . . . . . . . . . . . . . . (2,480) (1,977) (3,586)Sales of short-term investments . . . . . . . . . . . . . . . . . . . . . . . . . . . . . . . . . . . . . . . . . . . . . . . . . . . . . 6 943 1,216Purchases of short-term investments . . . . . . . . . . . . . . . . . . . . . . . . . . . . . . . . . . . . . . . . . . . . . . . . . (18) (935) (772)Proceeds from sales of property and equipment . . . . . . . . . . . . . . . . . . . . . . . . . . . . . . . . . . . . . . . . . 46 77Other, net . . . . . . . . . . . . . . . . . . . . . . . . . . . . . . . . . . . . . . . . . . . . . . . . . . . . . . . . . . . . . . . . . . . . . . . 3 (1) (24)
Net cash used in investing activities . . . . . . . . . . . . . . . . . . . . . . . . . . . . . . . . . . . . . . . . . . . . . (2,443) (1,970) (3,089)
Financing ActivitiesPrincipal repayments of long-term debt . . . . . . . . . . . . . . . . . . . . . . . . . . . . . . . . . . . . . . . . . . . . . . . . (2,537) (1,096) (932)Proceeds from issuance of long-term debt . . . . . . . . . . . . . . . . . . . . . . . . . . . . . . . . . . . . . . . . . . . . . 2,241 1,152 843Purchase of treasury stock . . . . . . . . . . . . . . . . . . . . . . . . . . . . . . . . . . . . . . . . . . . . . . . . . . . . . . . . . . (841) (386)Dividends paid . . . . . . . . . . . . . . . . . . . . . . . . . . . . . . . . . . . . . . . . . . . . . . . . . . . . . . . . . . . . . . . . . . . . (803) (566) (400)Proceeds from (repayments of) short-term borrowings, net . . . . . . . . . . . . . . . . . . . . . . . . . . . . . . . . 661 (58) 272Proceeds from exercise of stock options . . . . . . . . . . . . . . . . . . . . . . . . . . . . . . . . . . . . . . . . . . . . . . . 66 63 142Other . . . . . . . . . . . . . . . . . . . . . . . . . . . . . . . . . . . . . . . . . . . . . . . . . . . . . . . . . . . . . . . . . . . . . . . . . . . 1 (1) (4)
Net cash used in financing activities . . . . . . . . . . . . . . . . . . . . . . . . . . . . . . . . . . . . . . . . . . . . . (1,212) (892) (79)
Effect of exchange rate changes on cash and cash equivalents . . . . . . . . . . . . . . . . . . . . . . . . . . . . . 7 (13) (15)
Net (decrease) increase in cash and cash equivalents . . . . . . . . . . . . . . . . . . . . . . . . . . . . . . . (15) 535 33Cash and cash equivalents at beginning of year . . . . . . . . . . . . . . . . . . . . . . . . . . . . . . . . . . . . . . . . . 1,178 643 610
Cash and cash equivalents at end of year . . . . . . . . . . . . . . . . . . . . . . . . . . . . . . . . . . . . . . . . . . . . . . $ 1,163 $ 1,178 $ 643
The accompanying notes are an integral part of these consolidated financial statements.
page 8 | Carnival Corporation & plc
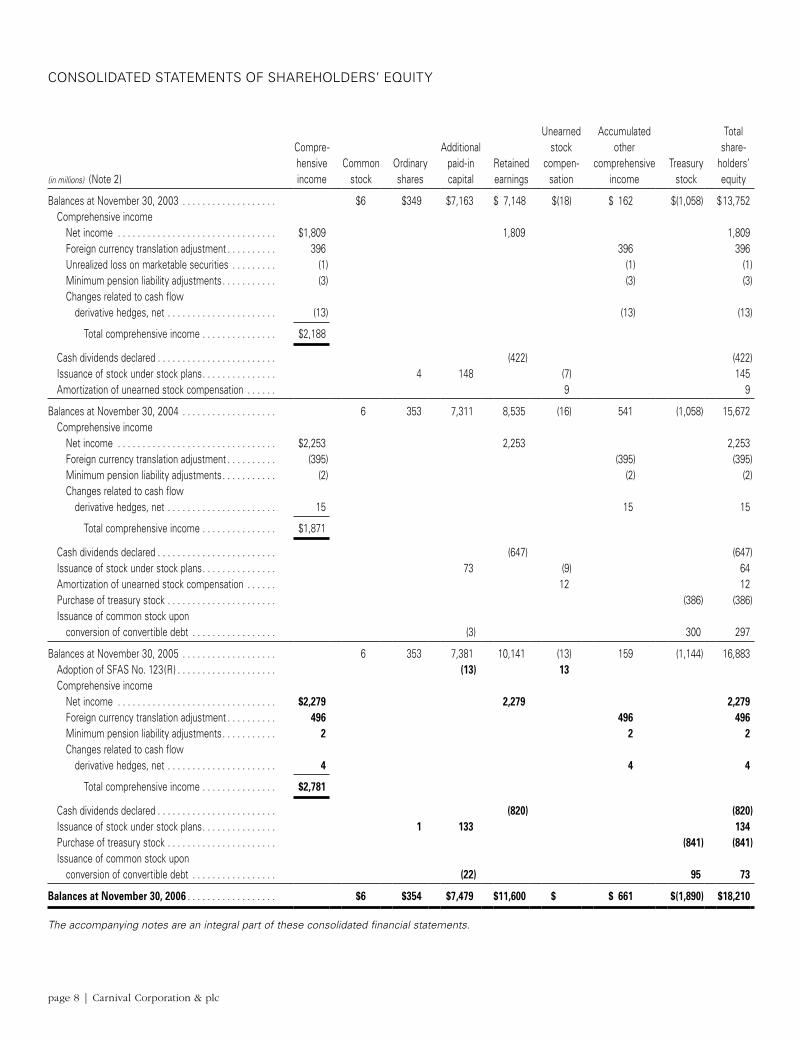
CONSOLIDATED STATEMENTS OF SHAREHOLDERS’ EQUITY
Unearned Accumulated TotalCompre- Additional stock other share-hensive Common Ordinary paid-in Retained compen- comprehensive Treasury holders’
(in millions) (Note 2) income stock shares capital earnings sation income stock equity
Balances at November 30, 2003 . . . . . . . . . . . . . . . . . . . $6 $349 $7,163 $ 7,148 $(18) $ 162 $(1,058) $ 13,752 Comprehensive income Net income . . . . . . . . . . . . . . . . . . . . . . . . . . . . . . . . $1,809 1,809 1,809 Foreign currency translation adjustment . . . . . . . . . . 396 396 396 Unrealized loss on marketable securities . . . . . . . . . (1) (1) (1) Minimum pension liability adjustments . . . . . . . . . . . (3) (3) (3) Changes related to cash flow derivative hedges, net . . . . . . . . . . . . . . . . . . . . . . (13) (13) (13)
Total comprehensive income . . . . . . . . . . . . . . . $2,188
Cash dividends declared . . . . . . . . . . . . . . . . . . . . . . . . (422) (422) Issuance of stock under stock plans . . . . . . . . . . . . . . . 4 148 (7) 145 Amortization of unearned stock compensation . . . . . . 9 9
Balances at November 30, 2004 . . . . . . . . . . . . . . . . . . . 6 353 7,311 8,535 (16) 541 (1,058) 15,672 Comprehensive income Net income . . . . . . . . . . . . . . . . . . . . . . . . . . . . . . . . $2,253 2,253 2,253 Foreign currency translation adjustment . . . . . . . . . . (395) (395) (395) Minimum pension liability adjustments . . . . . . . . . . . (2) (2) (2) Changes related to cash flow derivative hedges, net . . . . . . . . . . . . . . . . . . . . . . 15 15 15
Total comprehensive income . . . . . . . . . . . . . . . $1,871
Cash dividends declared . . . . . . . . . . . . . . . . . . . . . . . . (647) (647) Issuance of stock under stock plans . . . . . . . . . . . . . . . 73 (9) 64 Amortization of unearned stock compensation . . . . . . 12 12 Purchase of treasury stock . . . . . . . . . . . . . . . . . . . . . . (386) (386) Issuance of common stock upon conversion of convertible debt . . . . . . . . . . . . . . . . . (3) 300 297
Balances at November 30, 2005 . . . . . . . . . . . . . . . . . . . 6 353 7,381 10,141 (13) 159 (1,144) 16,883 Adoption of SFAS No. 123(R) . . . . . . . . . . . . . . . . . . . . (13) 13 Comprehensive income Net income . . . . . . . . . . . . . . . . . . . . . . . . . . . . . . . . $2,279 2,279 2,279 Foreign currency translation adjustment . . . . . . . . . . 496 496 496 Minimum pension liability adjustments . . . . . . . . . . . 2 2 2 Changes related to cash flow derivative hedges, net . . . . . . . . . . . . . . . . . . . . . . 4 4 4
Total comprehensive income . . . . . . . . . . . . . . . $2,781
Cash dividends declared . . . . . . . . . . . . . . . . . . . . . . . . (820) (820) Issuance of stock under stock plans . . . . . . . . . . . . . . . 1 133 134 Purchase of treasury stock . . . . . . . . . . . . . . . . . . . . . . (841) (841) Issuance of common stock upon conversion of convertible debt . . . . . . . . . . . . . . . . . (22) 95 73
Balances at November 30, 2006 . . . . . . . . . . . . . . . . . . $6 $354 $7,479 $11,600 $ $ 661 $(1,890) $18,210
The accompanying notes are an integral part of these consolidated financial statements.
Carnival Corporation & plc | page 9
NOTES TO CONSOLIDATED FINANCIAL STATEMENTS
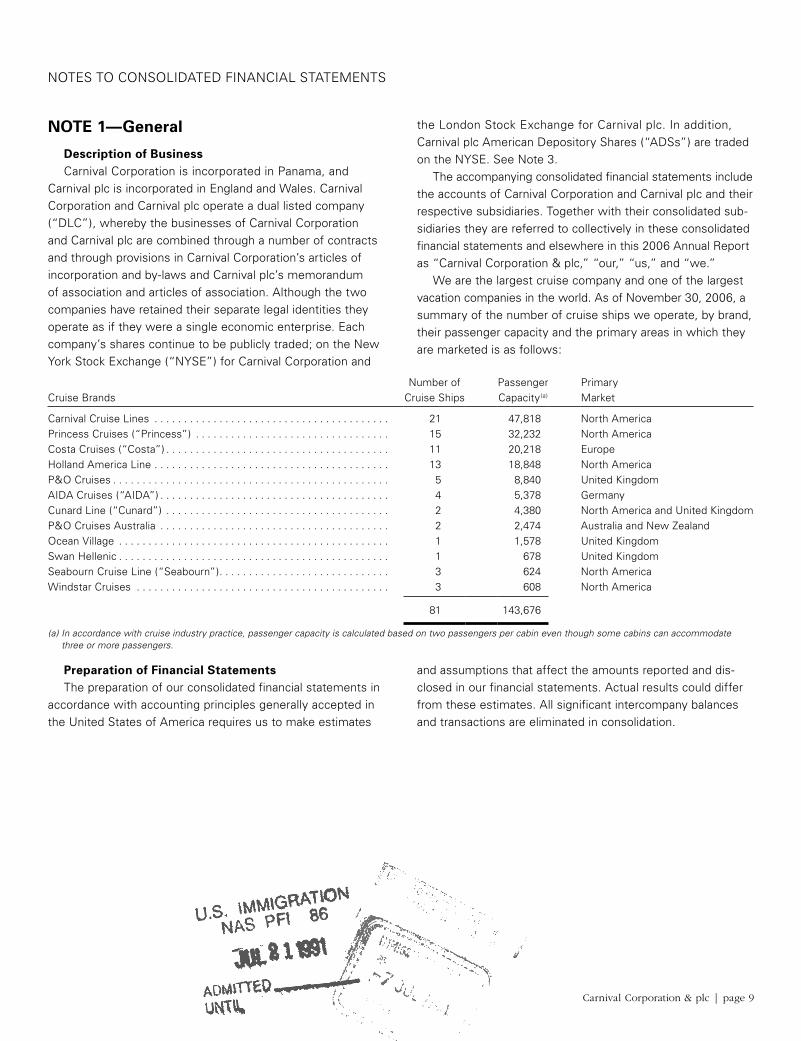
NOTE 1—General
Description of BusinessCarnival Corporation is incorporated in Panama, and
Carnival plc is incorporated in England and Wales. Carnival Corporation and Carnival plc operate a dual listed company (“DLC”), whereby the businesses of Carnival Corporation and Carnival plc are combined through a number of contracts and through provisions in Carnival Corporation’s articles of incorporation and by-laws and Carnival plc’s memorandum of association and articles of association. Although the two companies have retained their separate legal identities they operate as if they were a single economic enterprise. Each company’s shares continue to be publicly traded; on the New York Stock Exchange (“NYSE”) for Carnival Corporation and
the London Stock Exchange for Carnival plc. In addition, Carnival plc American Depository Shares (“ADSs”) are traded on the NYSE. See Note 3.
The accompanying consolidated financial statements include the accounts of Carnival Corporation and Carnival plc and their respective subsidiaries. Together with their consolidated sub-sidiaries they are referred to collectively in these consolidated financial statements and elsewhere in this 2006 Annual Report as “Carnival Corporation & plc,” “our,” “us,” and “we.”
We are the largest cruise company and one of the largest vacation companies in the world. As of November 30, 2006, a summary of the number of cruise ships we operate, by brand, their passenger capacity and the primary areas in which they are marketed is as follows:
Number of Passenger PrimaryCruise Brands Cruise Ships Capacity(a) Market
Carnival Cruise Lines . . . . . . . . . . . . . . . . . . . . . . . . . . . . . . . . . . . . . . . . 21 47,818 North AmericaPrincess Cruises (“Princess”) . . . . . . . . . . . . . . . . . . . . . . . . . . . . . . . . . 15 32,232 North AmericaCosta Cruises (“Costa”) . . . . . . . . . . . . . . . . . . . . . . . . . . . . . . . . . . . . . . 11 20,218 EuropeHolland America Line . . . . . . . . . . . . . . . . . . . . . . . . . . . . . . . . . . . . . . . . 13 18,848 North AmericaP&O Cruises . . . . . . . . . . . . . . . . . . . . . . . . . . . . . . . . . . . . . . . . . . . . . . . 5 8,840 United KingdomAIDA Cruises (“AIDA”) . . . . . . . . . . . . . . . . . . . . . . . . . . . . . . . . . . . . . . . 4 5,378 GermanyCunard Line (“Cunard”) . . . . . . . . . . . . . . . . . . . . . . . . . . . . . . . . . . . . . . 2 4,380 North America and United KingdomP&O Cruises Australia . . . . . . . . . . . . . . . . . . . . . . . . . . . . . . . . . . . . . . . 2 2,474 Australia and New ZealandOcean Village . . . . . . . . . . . . . . . . . . . . . . . . . . . . . . . . . . . . . . . . . . . . . . 1 1,578 United KingdomSwan Hellenic . . . . . . . . . . . . . . . . . . . . . . . . . . . . . . . . . . . . . . . . . . . . . . 1 678 United KingdomSeabourn Cruise Line (“Seabourn”) . . . . . . . . . . . . . . . . . . . . . . . . . . . . . 3 624 North AmericaWindstar Cruises . . . . . . . . . . . . . . . . . . . . . . . . . . . . . . . . . . . . . . . . . . . 3 608 North America
81 143,676
(a) In accordance with cruise industry practice, passenger capacity is calculated based on two passengers per cabin even though some cabins can accommodate three or more passengers.
Preparation of Financial StatementsThe preparation of our consolidated financial statements in
accordance with accounting principles generally accepted in the United States of America requires us to make estimates
and assumptions that affect the amounts reported and dis-closed in our financial statements. Actual results could differ from these estimates. All significant intercompany balances and transactions are eliminated in consolidation.
page 10 | Carnival Corporation & plc
NOTE 2— Summary of Significant Accounting Policies
Basis of PresentationWe consolidate entities over which we have control (see
Note 3), as typically evidenced by a direct ownership interest of greater than 50%. For affiliates where significant influence over financial and operating policies exists, as typically evi-denced by a direct ownership interest from 20% to 50%, the investment is accounted for using the equity method.
Cash and Cash Equivalents and Short-Term InvestmentsCash and cash equivalents include investments with matur-
ities of three months or less at acquisition, which are stated at cost. At November 30, 2006 and 2005, cash and cash equiva-lents included $936 million and $980 million of investments, respectively, primarily comprised of money market funds, time deposits and commercial paper.
As of November 30, 2006 and 2005, our short-term invest-ments were not significant. Purchases and sales of short-term investments included in our Consolidated Statements of Cash Flows consisted of investments with original maturities greater than three months with variable interest rates, which typically reset every 28 days. Despite the long-term nature of their stated contractual maturities, we have the ability to quickly liquidate these securities. All income generated from these investments was recorded as interest income.
InventoriesInventories consist of provisions, gift shop and art merchan-
dise held for resale, fuel and supplies carried at the lower of cost or market. Cost is determined using the weighted-average or first-in, first-out methods.
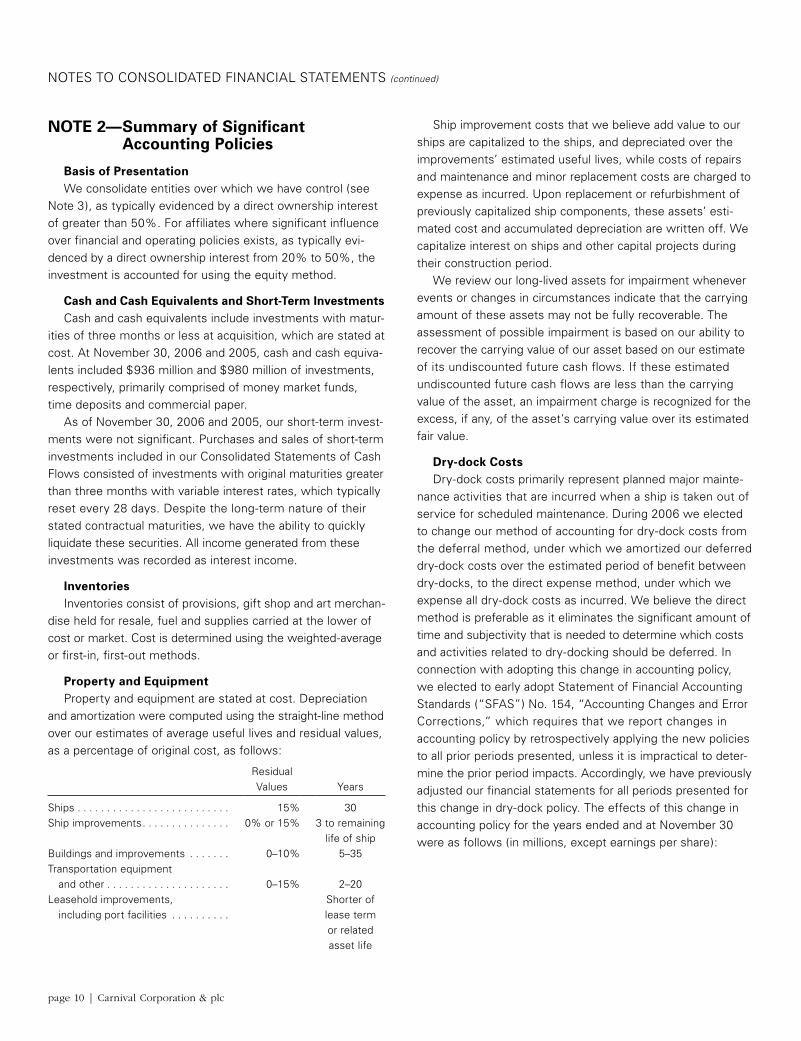
Property and EquipmentProperty and equipment are stated at cost. Depreciation
and amortization were computed using the straight-line method over our estimates of average useful lives and residual values, as a percentage of original cost, as follows:
ResidualValues Years
Ships . . . . . . . . . . . . . . . . . . . . . . . . . . 15% 30Ship improvements . . . . . . . . . . . . . . . 0% or 15% 3 to remaining
life of shipBuildings and improvements . . . . . . . 0–10% 5–35Transportation equipment and other . . . . . . . . . . . . . . . . . . . . . 0–15% 2–20Leasehold improvements, including port facilities . . . . . . . . . .
Shorter of lease term or related asset life
Ship improvement costs that we believe add value to our ships are capitalized to the ships, and depreciated over the improvements’ estimated useful lives, while costs of repairs and maintenance and minor replacement costs are charged to expense as incurred. Upon replacement or refurbishment of previously capitalized ship components, these assets’ esti-mated cost and accumulated depreciation are written off. We capitalize interest on ships and other capital projects during their construction period.
We review our long-lived assets for impairment whenever events or changes in circumstances indicate that the carrying amount of these assets may not be fully recoverable. The assessment of possible impairment is based on our ability to recover the carrying value of our asset based on our estimate of its undiscounted future cash flows. If these estimated undiscounted future cash flows are less than the carrying value of the asset, an impairment charge is recognized for the excess, if any, of the asset’s carrying value over its estimated fair value.
Dry-dock CostsDry-dock costs primarily represent planned major mainte-
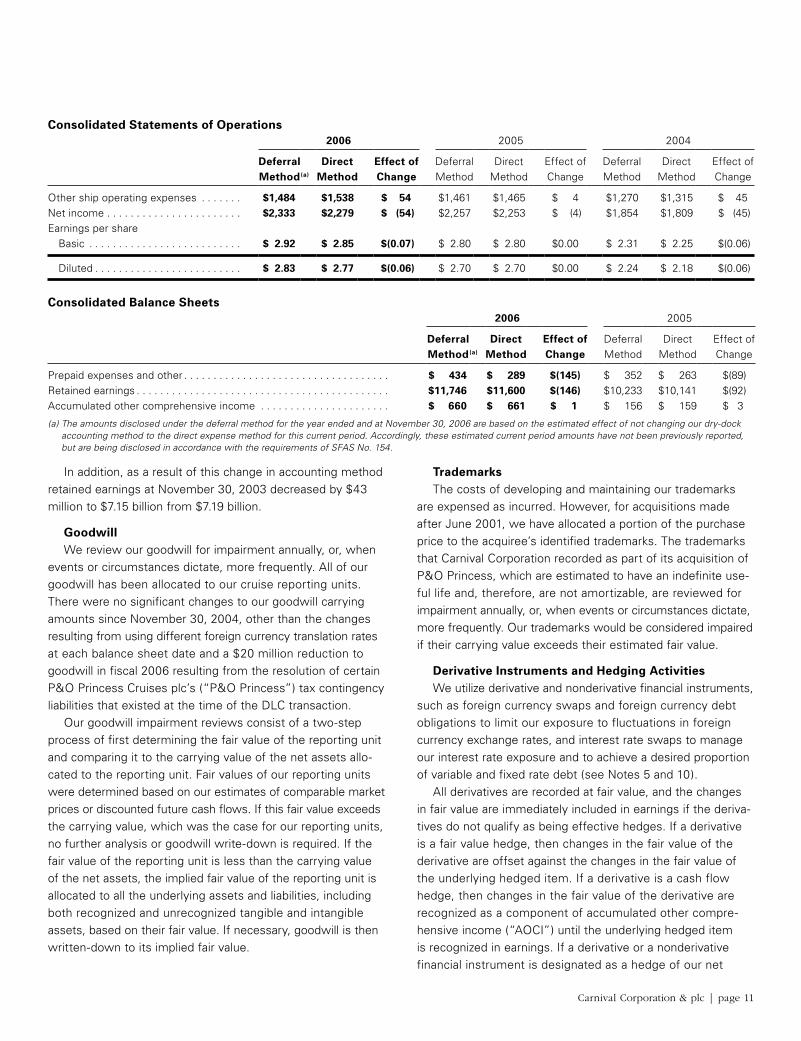
nance activities that are incurred when a ship is taken out of service for scheduled maintenance. During 2006 we elected to change our method of accounting for dry-dock costs from the deferral method, under which we amortized our deferred dry-dock costs over the estimated period of benefit between dry-docks, to the direct expense method, under which we expense all dry-dock costs as incurred. We believe the direct method is preferable as it eliminates the significant amount of time and subjectivity that is needed to determine which costs and activities related to dry-docking should be deferred. In connection with adopting this change in accounting policy, we elected to early adopt Statement of Financial Accounting Standards (“SFAS”) No. 154, “Accounting Changes and Error Corrections,” which requires that we report changes in accounting policy by retrospectively applying the new policies to all prior periods presented, unless it is impractical to deter-mine the prior period impacts. Accordingly, we have previously adjusted our financial statements for all periods presented for this change in dry-dock policy. The effects of this change in accounting policy for the years ended and at November 30 were as follows (in millions, except earnings per share):
NOTES TO CONSOLIDATED FINANCIAL STATEMENTS (continued)
Carnival Corporation & plc | page 11
Consolidated Statements of Operations2006 2005 2004
Deferral Direct Effect of Deferral Direct Effect of Deferral Direct Effect ofMethod(a) Method Change Method Method Change Method Method Change
Other ship operating expenses . . . . . . . $1,484 $1,538 $ 54 $1,461 $1,465 $ 4 $1,270 $1,315 $ 45Net income . . . . . . . . . . . . . . . . . . . . . . . $2,333 $2,279 $ (54) $2,257 $2,253 $ (4) $1,854 $1,809 $ (45)Earnings per share Basic . . . . . . . . . . . . . . . . . . . . . . . . . . $ 2.92 $ 2.85 $(0.07) $ 2.80 $ 2.80 $0.00 $ 2.31 $ 2.25 $(0.06)
Diluted . . . . . . . . . . . . . . . . . . . . . . . . . $ 2.83 $ 2.77 $(0.06) $ 2.70 $ 2.70 $0.00 $ 2.24 $ 2.18 $(0.06)
Consolidated Balance Sheets2006 2005
Deferral Direct Effect of Deferral Direct Effect ofMethod(a) Method Change Method Method Change
Prepaid expenses and other . . . . . . . . . . . . . . . . . . . . . . . . . . . . . . . . . . . $ 434 $ 289 $(145) $ 352 $ 263 $(89)Retained earnings . . . . . . . . . . . . . . . . . . . . . . . . . . . . . . . . . . . . . . . . . . . $11,746 $11,600 $(146) $ 10,233 $ 10,141 $(92)Accumulated other comprehensive income . . . . . . . . . . . . . . . . . . . . . . $ 660 $ 661 $ 1 $ 156 $ 159 $ 3
(a) The amounts disclosed under the deferral method for the year ended and at November 30, 2006 are based on the estimated effect of not changing our dry-dock accounting method to the direct expense method for this current period. Accordingly, these estimated current period amounts have not been previously reported, but are being disclosed in accordance with the requirements of SFAS No. 154.
In addition, as a result of this change in accounting method retained earnings at November 30, 2003 decreased by $43 million to $7.15 billion from $7.19 billion.
GoodwillWe review our goodwill for impairment annually, or, when
events or circumstances dictate, more frequently. All of our goodwill has been allocated to our cruise reporting units. There were no significant changes to our goodwill carrying amounts since November 30, 2004, other than the changes resulting from using different foreign currency translation rates at each balance sheet date and a $20 million reduction to goodwill in fiscal 2006 resulting from the resolution of certain P&O Princess Cruises plc’s (“P&O Princess”) tax contingency liabilities that existed at the time of the DLC transaction.
Our goodwill impairment reviews consist of a two-step process of first determining the fair value of the reporting unit and comparing it to the carrying value of the net assets allo-cated to the reporting unit. Fair values of our reporting units were determined based on our estimates of comparable market prices or discounted future cash flows. If this fair value exceeds the carrying value, which was the case for our reporting units, no further analysis or goodwill write-down is required. If the fair value of the reporting unit is less than the carrying value of the net assets, the implied fair value of the reporting unit is allocated to all the underlying assets and liabilities, including both recognized and unrecognized tangible and intangible assets, based on their fair value. If necessary, goodwill is then written-down to its implied fair value.
TrademarksThe costs of developing and maintaining our trademarks
are expensed as incurred. However, for acquisitions made after June 2001, we have allocated a portion of the purchase price to the acquiree’s identified trademarks. The trademarks that Carnival Corporation recorded as part of its acquisition of P&O Princess, which are estimated to have an indefinite use-ful life and, therefore, are not amortizable, are reviewed for impairment annually, or, when events or circumstances dictate, more frequently. Our trademarks would be considered impaired if their carrying value exceeds their estimated fair value.
Derivative Instruments and Hedging ActivitiesWe utilize derivative and nonderivative financial instruments,
such as foreign currency swaps and foreign currency debt obligations to limit our exposure to fluctuations in foreign currency exchange rates, and interest rate swaps to manage our interest rate exposure and to achieve a desired proportion of variable and fixed rate debt (see Notes 5 and 10).
All derivatives are recorded at fair value, and the changes in fair value are immediately included in earnings if the deriva-tives do not qualify as being effective hedges. If a derivative is a fair value hedge, then changes in the fair value of the derivative are offset against the changes in the fair value of the underlying hedged item. If a derivative is a cash flow hedge, then changes in the fair value of the derivative are recognized as a component of accumulated other compre-hensive income (“AOCI”) until the underlying hedged item is recognized in earnings. If a derivative or a nonderivative financial instrument is designated as a hedge of our net

page 12 | Carnival Corporation & plc
investment in a foreign subsidiary, then changes in the fair value of the financial instrument are recognized as a compo-nent of AOCI to offset a portion of the change in the translated value of the net investment being hedged, until the investment is liquidated. We formally document all hedging relationships for all derivative and nonderivative hedges and the underlying hedged items, as well as our risk management objectives and strategies for undertaking the hedge transactions.
We classify the fair value of our derivative contracts and the fair value of our offsetting hedged firm commitments as either current or long-term, which are included in prepaid and other assets and accrued and other liabilities, depending on whether the maturity date of the derivative contract is within or beyond one year from our balance sheet dates. The cash flows from derivatives treated as hedges are classified in our Consolidated Statements of Cash Flows in the same category as the item being hedged.
During fiscal 2006, 2005 and 2004, all net changes in the fair value of both our fair value hedges and the offsetting hedged firm commitments and our cash flow hedges were immaterial, as were any ineffective portions of these hedges. No fair value hedges or cash flow hedges were derecognized or discontinued in fiscal 2006, 2005 or 2004. In addition, the amount of realized net losses or gains from cash flow hedges that were reclassified into earnings during fiscal 2006, 2005 and 2004 were not significant. The amount of estimated cash flow hedges unrealized net losses which are expected to be reclassified to earnings in the next twelve months is not significant.
Finally, if any shipyard with which we have contracts to build our ships is unable to perform, we would be required to perform under our foreign currency swaps related to these shipbuilding contracts. Accordingly, based upon the circum-stances, we may have to discontinue the accounting for those currency swaps as hedges, if the shipyard cannot perform. However, we believe that the risk of shipyard nonperformance is remote.
Revenue and Expense RecognitionGuest cruise deposits represent unearned revenues and
are initially recorded as customer deposit liabilities when received. Customer deposits are subsequently recognized as cruise revenues, together with revenues from onboard and other activities, which include transportation and shore excur-sion revenues and all associated direct costs of a voyage, upon completion of voyages with durations of ten nights or less
and on a pro rata basis for voyages in excess of ten nights. Future travel discount vouchers issued to guests are typically recorded as a reduction of revenues when such vouchers are utilized. Cancellation fees are recognized in revenues at the time of the cancellation. Revenues and expenses from our tour and travel services are recognized at the time the services are performed or expenses are incurred.
Our sale to passengers of air and other transportation to and from our ships and the related cost of purchasing this service is recorded as cruise passenger ticket revenues and cruise transportation costs, respectively, in the accompanying Consolidated Statements of Operations. The proceeds that we collect from the sale of third party shore excursions and on behalf of onboard concessionaires, net of the amounts remitted to them, are recorded as concession revenues, on a net basis, in onboard and other cruise revenues.
Insurance/Self-InsuranceWe use a combination of insurance and self-insurance for
a number of risks including claims related to crew and passen-gers, hull and machinery, war risk, workers’ compensation, property damage and general liability. Liabilities associated with certain of these risks, including crew and passenger claims, are estimated based on, among other things, historical claims experience, severity factors and other actuarial assumptions. Our expected loss accruals are based on estimates, and while we believe the amounts accrued are adequate the ultimate loss may differ from the amounts provided.
Selling and Administrative ExpensesSelling expenses include items such as advertising, market-
ing, promotional and related costs. Advertising costs are charged to expense as incurred except for brochures and media production costs. The brochures and media production costs are recorded as prepaid expenses and charged to expense as consumed or upon the first airing of the advertisement, respectively. Advertising expenses totaled $464 million, $455 million and $464 million in fiscal 2006, 2005 and 2004, respec-tively. At November 30, 2006 and 2005, the amount of adver-tising costs included in prepaid expenses was not significant. Administrative expenses represent the costs of our shoreside ship support, reservation and other administrative functions and include items such as salaries and related benefits, professional fees and occupancy costs, which are typically expensed as incurred.
NOTES TO CONSOLIDATED FINANCIAL STATEMENTS (continued)
Carnival Corporation & plc | page 13
Foreign Currency Translations and TransactionsOur foreign subsidiaries and affiliates that have functional
currencies other than the U.S. dollar translate their assets and liabilities at exchange rates in effect at the balance sheet dates. Revenues and expenses of these foreign subsidiaries and affiliates are translated at weighted-average exchange rates for the period. Equity is translated at historical rates, and the resulting cumulative foreign currency translation adjust-ments are included as a component of AOCI. Therefore, the U.S. dollar value of these non-equity translated items in our financial statements will fluctuate from period to period, depending on the changing value of the dollar against these local functional currencies.
Exchange gains and losses arising from the remeasurement of monetary assets and liabilities, and foreign currency trans-actions denominated in a currency other than the functional currency of the entity involved are immediately included in nonoperating earnings, unless such net liabilities have been designated to act as hedges of a net investment in our foreign subsidiaries. In addition, the unrealized exchange gains or losses on our long-term intercompany receivables denomi-nated in a non-functional currency, which are not expected to be repaid in the foreseeable future and are therefore con-sidered to form part of our net investment, are recorded as a foreign currency translation adjustment, which is included as a component of AOCI. Finally, net foreign currency transaction gains or losses recorded in our earnings were not significant in fiscal 2006, 2005 and 2004.
Earnings Per ShareBasic earnings per share is computed by dividing net income
by the weighted-average number of shares of common stock and ordinary shares outstanding during each period. Diluted earnings per share is computed by dividing adjusted net income by the weighted-average number of shares of com-mon stock and ordinary shares, common stock equivalents and other potentially dilutive securities outstanding during each period. All shares that are issuable under our outstanding convertible notes that have contingent share conversion fea-tures have been considered outstanding for our diluted earnings per share computations, if dilutive, using the “if converted” method of accounting from the date of issuance.
Share-Based CompensationEffective December 1, 2005, we adopted the provisions
of SFAS No. 123 (revised 2004), “Share-Based Payment” (“SFAS No. 123(R)”), which requires us to measure and rec-ognize compensation expense for all share-based compensa-tion awards. We adopted SFAS No. 123(R) using the modified prospective application transition method. Under this method, the share-based compensation cost recognized beginning December 1, 2005 includes compensation cost for (i) all share-based payments granted prior to, but not vested as of, December 1, 2005, based on the grant date fair value originally estimated in accordance with the provisions of SFAS No. 123, “Accounting for Stock-Based Compensation” (“SFAS No. 123”), and (ii) all share-based payments granted subsequent to November 30, 2005, based on the grant date fair value esti-mated in accordance with the provisions of SFAS No. 123(R). Prior to December 1, 2005, as allowed under the then out-standing accounting principles, we did not recognize compen-sation expense for the issuance of stock options with an exercise price equal to or greater than the market price of the underlying shares at the date of grant.
Compensation cost under SFAS No. 123(R) is recognized ratably using the straight-line attribution method over the expected vesting period or to the retirement eligibility date, if less than the vesting period, when vesting is not contingent upon any future performance. In addition, pursuant to SFAS No. 123(R) we are required to estimate the amount of expected forfeitures, which we estimate based on historical forfeiture experience, when calculating compensation cost. If the actual forfeitures that occur are different than the estimate, then we will revise our estimates. The effect of adopting SFAS No. 123(R) has been to reduce our net income by $57 million and our basic and diluted earnings per share by $0.07 for the year ended November 30, 2006. Prior periods are not restated under this transition method.
Concentrations of Credit RiskAs part of our ongoing control procedures, we monitor
concentrations of credit risk associated with financial and other institutions with which we conduct significant business. Credit risk, including counterparty nonperformance under derivative instruments, contingent obligations and new ship progress payment guarantees, is considered minimal, as we
page 14 | Carnival Corporation & plc
primarily conduct business with large, well-established finan-cial institutions who have long-term credit ratings of A or above and we seek to diversify our counterparties. In addition, we have established guidelines regarding credit ratings and investment maturities that we follow to maintain safety and liquidity. We do not anticipate nonperformance by any of our significant counterparties.
We also monitor the creditworthiness of foreign travel agencies and tour operators to which we grant credit terms in the normal course of our business. Concentrations of credit risk associated with these receivables are considered minimal primarily due to their short maturities and the large number of accounts within our customer base. We have experienced only minimal credit losses on our trade receivables. We do not normally require collateral or other security to support normal credit sales. However, we do normally require collateral and/or guarantees to support notes receivable on significant asset sales and new ship progress payments to shipyards.
ReclassificationsWe have reclassified certain prior period amounts to con-
form them to the current period presentation primarily as a result of our adopting a new chart of accounts in conjunction with our initial implementation of a new worldwide accounting system in the second quarter of 2006. During this implemen-tation, we identified certain differences among our operating subsidiaries and, accordingly, we have recorded the appropriate reclassifications in the prior periods to improve comparability.
NOTE 3—DLC Structure
On April 17, 2003, Carnival Corporation and Carnival plc (formerly known as P&O Princess) completed a DLC transac-tion, which implemented Carnival Corporation & plc’s DLC structure. The contracts governing the DLC structure provide that Carnival Corporation and Carnival plc each continue to have separate boards of directors, but the boards and senior executive management of both companies are identical. The amendments to the constituent documents of each of the companies also provide that, on most matters, the holders of the common equity of both companies effectively vote as a single body. On specified matters where the interests of Carnival Corporation’s shareholders may differ from the inter-ests of Carnival plc’s shareholders (a “class rights action”), each shareholder body will vote separately as a class, such as transactions primarily designed to amend or unwind the DLC structure. Generally, no class rights action will be implemented unless approved by both shareholder bodies.
NOTES TO CONSOLIDATED FINANCIAL STATEMENTS (continued)
Carnival Corporation & plc | page 15
Upon the closing of the DLC transaction, Carnival Corporation and Carnival plc also executed the Equalization and Governance Agreement, which provides for the equalization of dividends and liquidation distributions based on an equalization ratio and contains provisions relating to the governance of the DLC structure. Because the current equalization ratio is 1 to 1, one Carnival plc ordinary share is entitled to the same distributions, subject to the terms of the Equalization and Governance Agreement, as one share of Carnival Corporation common stock. In a liquidation of either company or both companies, if the hypothetical potential per share liquidation distributions to each company’s shareholders are not equivalent, taking into account the relative value of the two companies’ assets and the indebtedness of each company, to the extent that one company has greater net assets so that any liquidation distri-bution to its shareholders would not be equivalent on a per share basis, the company with the ability to make a higher net distribution is required to make a payment to the other company to equalize the possible net distribution to share-holders, subject to certain exceptions.
At the closing of the DLC transaction, Carnival Corporation and Carnival plc also executed deeds of guarantee. Under the terms of Carnival Corporation’s deed of guarantee, Carnival Corporation has agreed to guarantee all indebtedness and certain other monetary obligations of Carnival plc that are incurred under agreements entered into on or after the closing date of the DLC transaction. The terms of Carnival plc’s deed of guarantee are identical to those of Carnival Corporation’s. In addition, Carnival Corporation and Carnival plc have each extended their respective deeds of guarantee to the other’s pre-DLC indebtedness and certain other monetary obligations, or alternatively have provided standalone guarantees in lieu of utilization of these deeds of guarantee, thus effectively cross guaranteeing all Carnival Corporation and Carnival plc indebt-edness and certain other monetary obligations. Each deed of
guarantee provides that the creditors to whom the obligations are owed are intended third party beneficiaries of such deed of guarantee.
The deeds of guarantee are governed and construed in accordance with the laws of the Isle of Man. Subject to the terms of the guarantees, the holders of indebtedness and other obligations that are subject to the guarantees will have recourse to both Carnival plc and Carnival Corporation though a Carnival plc creditor must first make written demand on Carnival plc and a Carnival Corporation creditor on Carnival Corporation. Once the written demand is made by letter or other form of notice, the holders of indebtedness or other obligations may immediately commence an action against the relevant guarantor. Accordingly, there is no requirement under the deeds of guarantee to obtain a judgment, take other enforcement actions or wait any period of time prior to taking steps against the relevant guarantor. All actions or proceedings arising out of or in connection with the deeds of guarantee must be exclusively brought in courts in England.
Under the terms of the DLC transaction documents, Carnival Corporation and Carnival plc are permitted to transfer assets between the companies, make loans or investments in each other and otherwise enter into intercompany transactions. The companies have entered into some of these types of transactions and expect to enter into additional transactions in the future to take advantage of the flexibility provided by the DLC structure and to operate both companies as a single unified economic enterprise in the most effective manner. In addition, under the terms of the Equalization and Governance Agreement and the deeds of guarantee, the cash flow and assets of one company are required to be used to pay the obligations of the other company, if necessary.
page 16 | Carnival Corporation & plc
NOTES TO CONSOLIDATED FINANCIAL STATEMENTS (continued)
Given the DLC structure as described above, we believe that providing separate financial statements for each of Carnival Corporation and Carnival plc would not present a true and fair view of the economic realities of their operations. Accordingly, separate financial statements for both Carnival Corporation and Carnival plc have not been presented.
Simultaneously with the completion of the DLC transaction, a partial share offer (“PSO”) for 20% of Carnival plc’s shares was made and accepted, which enabled 20% of Carnival plc shares to be exchanged for 41.7 million Carnival Corporation shares. The 41.7 million shares of Carnival plc held by Carnival Corporation as a result of the PSO, which cost $1.05 billion, are being accounted for as treasury stock in the accompany-ing balance sheets.
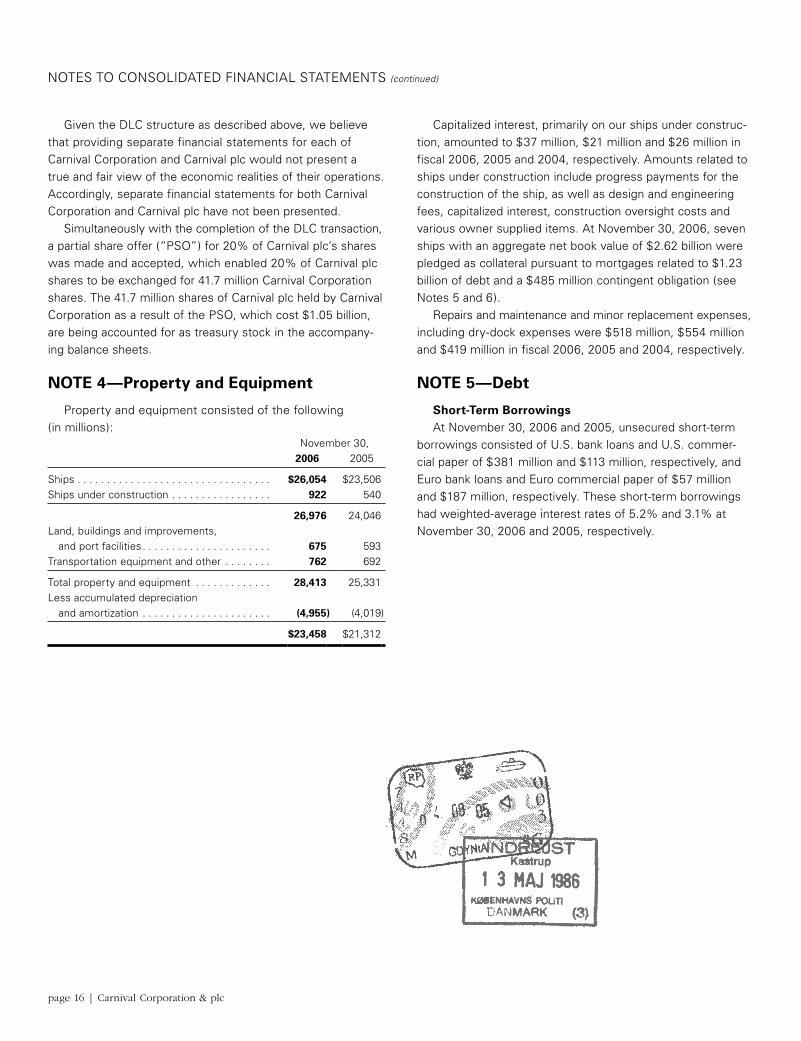
NOTE 4—Property and Equipment
Property and equipment consisted of the following (in millions):
November 30,2006 2005
Ships . . . . . . . . . . . . . . . . . . . . . . . . . . . . . . . . . $26,054 $23,506Ships under construction . . . . . . . . . . . . . . . . . 922 540
26,976 24,046Land, buildings and improvements, and port facilities . . . . . . . . . . . . . . . . . . . . . . 675 593Transportation equipment and other . . . . . . . . 762 692
Total property and equipment . . . . . . . . . . . . . 28,413 25,331Less accumulated depreciation and amortization . . . . . . . . . . . . . . . . . . . . . . (4,955) (4,019)
$23,458 $21,312
Capitalized interest, primarily on our ships under construc-tion, amounted to $37 million, $21 million and $26 million in fiscal 2006, 2005 and 2004, respectively. Amounts related to ships under construction include progress payments for the construction of the ship, as well as design and engineering fees, capitalized interest, construction oversight costs and various owner supplied items. At November 30, 2006, seven ships with an aggregate net book value of $2.62 billion were pledged as collateral pursuant to mortgages related to $1.23 billion of debt and a $485 million contingent obligation (see Notes 5 and 6).
Repairs and maintenance and minor replacement expenses, including dry-dock expenses were $518 million, $554 million and $419 million in fiscal 2006, 2005 and 2004, respectively.
NOTE 5—Debt
Short-Term BorrowingsAt November 30, 2006 and 2005, unsecured short-term
borrowings consisted of U.S. bank loans and U.S. commer- cial paper of $381 million and $113 million, respectively, and Euro bank loans and Euro commercial paper of $57 million and $187 million, respectively. These short-term borrowings had weighted-average interest rates of 5.2% and 3.1% at November 30, 2006 and 2005, respectively.
Carnival Corporation & plc | page 17
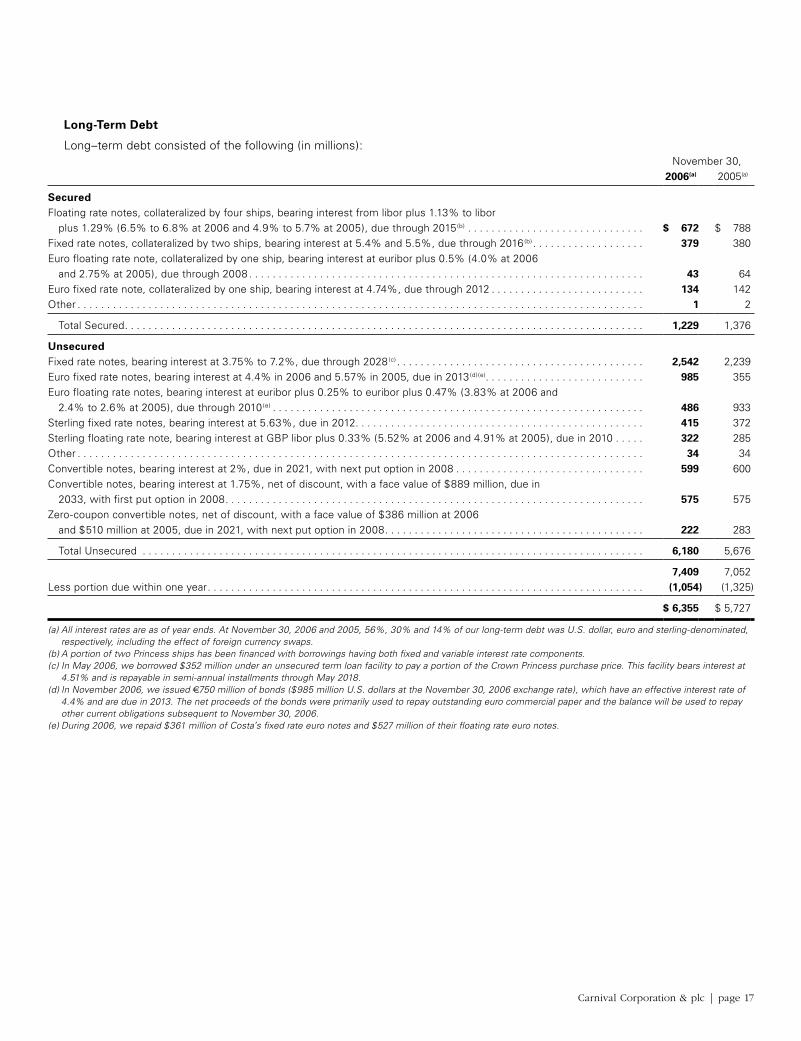
Long-Term Debt
Long–term debt consisted of the following (in millions):November 30,
2006(a) 2005(a)
SecuredFloating rate notes, collateralized by four ships, bearing interest from libor plus 1.13% to libor plus 1.29% (6.5% to 6.8% at 2006 and 4.9% to 5.7% at 2005), due through 2015(b) . . . . . . . . . . . . . . . . . . . . . . . . . . . . . . $ 672 $ 788Fixed rate notes, collateralized by two ships, bearing interest at 5.4% and 5.5%, due through 2016(b) . . . . . . . . . . . . . . . . . . . 379 380Euro floating rate note, collateralized by one ship, bearing interest at euribor plus 0.5% (4.0% at 2006 and 2.75% at 2005), due through 2008 . . . . . . . . . . . . . . . . . . . . . . . . . . . . . . . . . . . . . . . . . . . . . . . . . . . . . . . . . . . . . . . . . . . 43 64Euro fixed rate note, collateralized by one ship, bearing interest at 4.74%, due through 2012 . . . . . . . . . . . . . . . . . . . . . . . . . . 134 142Other . . . . . . . . . . . . . . . . . . . . . . . . . . . . . . . . . . . . . . . . . . . . . . . . . . . . . . . . . . . . . . . . . . . . . . . . . . . . . . . . . . . . . . . . . . . . . . . . 1 2
Total Secured . . . . . . . . . . . . . . . . . . . . . . . . . . . . . . . . . . . . . . . . . . . . . . . . . . . . . . . . . . . . . . . . . . . . . . . . . . . . . . . . . . . . . . . . 1,229 1,376
UnsecuredFixed rate notes, bearing interest at 3.75% to 7.2%, due through 2028(c) . . . . . . . . . . . . . . . . . . . . . . . . . . . . . . . . . . . . . . . . . . 2,542 2,239Euro fixed rate notes, bearing interest at 4.4% in 2006 and 5.57% in 2005, due in 2013(d)(e) . . . . . . . . . . . . . . . . . . . . . . . . . . . 985 355Euro floating rate notes, bearing interest at euribor plus 0.25% to euribor plus 0.47% (3.83% at 2006 and 2.4% to 2.6% at 2005), due through 2010(e) . . . . . . . . . . . . . . . . . . . . . . . . . . . . . . . . . . . . . . . . . . . . . . . . . . . . . . . . . . . . . . . 486 933Sterling fixed rate notes, bearing interest at 5.63%, due in 2012 . . . . . . . . . . . . . . . . . . . . . . . . . . . . . . . . . . . . . . . . . . . . . . . . . 415 372Sterling floating rate note, bearing interest at GBP libor plus 0.33% (5.52% at 2006 and 4.91% at 2005), due in 2010 . . . . . 322 285Other . . . . . . . . . . . . . . . . . . . . . . . . . . . . . . . . . . . . . . . . . . . . . . . . . . . . . . . . . . . . . . . . . . . . . . . . . . . . . . . . . . . . . . . . . . . . . . . . 34 34Convertible notes, bearing interest at 2%, due in 2021, with next put option in 2008 . . . . . . . . . . . . . . . . . . . . . . . . . . . . . . . . 599 600Convertible notes, bearing interest at 1.75%, net of discount, with a face value of $889 million, due in 2033, with first put option in 2008 . . . . . . . . . . . . . . . . . . . . . . . . . . . . . . . . . . . . . . . . . . . . . . . . . . . . . . . . . . . . . . . . . . . . . . . 575 575Zero-coupon convertible notes, net of discount, with a face value of $386 million at 2006 and $510 million at 2005, due in 2021, with next put option in 2008 . . . . . . . . . . . . . . . . . . . . . . . . . . . . . . . . . . . . . . . . . . . . 222 283
Total Unsecured . . . . . . . . . . . . . . . . . . . . . . . . . . . . . . . . . . . . . . . . . . . . . . . . . . . . . . . . . . . . . . . . . . . . . . . . . . . . . . . . . . . . . 6,180 5,676
7,409 7,052Less portion due within one year . . . . . . . . . . . . . . . . . . . . . . . . . . . . . . . . . . . . . . . . . . . . . . . . . . . . . . . . . . . . . . . . . . . . . . . . . . (1,054) (1,325)
$ 6,355 $ 5,727
(a) All interest rates are as of year ends. At November 30, 2006 and 2005, 56%, 30% and 14% of our long-term debt was U.S. dollar, euro and sterling-denominated, respectively, including the effect of foreign currency swaps.
(b) A portion of two Princess ships has been financed with borrowings having both fixed and variable interest rate components.(c) In May 2006, we borrowed $352 million under an unsecured term loan facility to pay a portion of the Crown Princess purchase price. This facility bears interest at
4.51% and is repayable in semi-annual installments through May 2018.(d) In November 2006, we issued €750 million of bonds ($985 million U.S. dollars at the November 30, 2006 exchange rate), which have an effective interest rate of
4.4% and are due in 2013. The net proceeds of the bonds were primarily used to repay outstanding euro commercial paper and the balance will be used to repay other current obligations subsequent to November 30, 2006.
(e) During 2006, we repaid $361 million of Costa’s fixed rate euro notes and $527 million of their floating rate euro notes.
page 18 | Carnival Corporation & plc
NOTES TO CONSOLIDATED FINANCIAL STATEMENTS (continued)
At November 30, 2006, the scheduled annual maturities of our long-term debt was as follows (in millions): $1,054, $1,930, $202, $1,108, $202 and $2,913 in fiscal 2007 through 2011 and thereafter, respectively. The fiscal 2008 maturities include $1.40 billion of Carnival Corporation’s Zero-Coupon Notes, 2% Notes and 1.75% Notes based on the date of the noteholders’ next put option.
Debt issuance costs are generally amortized to interest expense using the straight-line method, which amount approx-imates the effective interest method, over the term of the notes or the noteholders first put option date, whichever is earlier. In addition, all loan issue discounts are amortized to interest expense using the effective interest rate method over the term of the notes.
Convertible NotesCarnival Corporation’s 2% convertible notes (“2% Notes”),
1.75% convertible notes (“1.75% Notes”) and zero-coupon convertible notes (“Zero-Coupon Notes”) are convertible into 15.3 million shares, a maximum of 20.9 million shares (10.8 million shares during fiscal 2006) and 6.4 million shares, respectively, of Carnival Corporation common stock.
The 2% Notes are convertible at a conversion price of $39.14 per share, subject to adjustment, during any fiscal quarter for which the closing price of the Carnival Corporation common stock is greater than $43.05 per share for a defined duration of time in the preceding fiscal quarter. The conditions for conversion of the 2% Notes were satisfied throughout 2005 and during the first and last quarters of fiscal 2006. A nominal amount of 2% Notes were converted in fiscal 2006, 2005 and 2004.
The 1.75% Notes are convertible at a conversion price of $53.11 per share, subject to adjustment, during any fiscal quarter for which the closing price of the Carnival Corporation common stock is greater than a specified trigger price for a defined duration of time in the preceding fiscal quarter. During the fiscal quarters ending from August 31, 2003 through
April 29, 2008, the trigger price is $63.73 per share. Thereafter, this conversion trigger price increases each quarter based on an annual rate of 1.75%, until maturity. In addition, holders may also surrender the 1.75% Notes for conversion if they have been called for redemption or for other specified occur-rences, including the credit rating assigned to the 1.75% Notes being Baa3 or lower by Moody’s Investors Service and BBB– or lower by Standard & Poor’s Rating Services, as well as certain corporate transactions. The 1.75% Notes interest is payable in cash semi-annually in arrears through April 29, 2008. Effective April 30, 2008, the 1.75% Notes no longer require a cash interest payment, but interest will accrete at a 1.75% yield to maturity.
The Zero-Coupon Notes have a 3.75% yield to maturity and are convertible during any fiscal quarter for which the closing price of the Carnival Corporation common stock is greater than a specified trigger price for a defined duration of time in the preceding fiscal quarter. The trigger price increases at an annual rate of 3.75% until maturity. The trigger price was $38.11 for the 2006 fourth quarter, and the conversion price was $34.64. During fiscal 2006 and 2005, $69 million and $297 million of our Zero-Coupon Notes were converted at their accreted value into 2.1 million and 9.0 million shares of Carnival Corporation common stock, of which 1.9 million and 6.2 million shares were issued from treasury stock, respectively. No Zero-Coupon Notes were converted prior to fiscal 2005.
At November 30, 2005, the Zero-Coupon Notes were classified as a current liability, since the noteholders had the right to require us to repurchase them on October 24, 2006. At November 30, 2006, we have again classified our Zero-Coupon Notes as long-term debt, since the next date that the noteholders can require us to repurchase them is on October 24, 2008.
Subsequent to April 28, 2008 and October 23, 2008, we may redeem all or a portion of the 1.75% Notes and Zero-Coupon Notes, respectively, at their accreted values and
Carnival Corporation & plc | page 19
subsequent to April 14, 2008, we may redeem all or a portion of our 2% Notes at their face value plus any unpaid accrued interest, subject to the noteholders’ right to convert.
In addition, on April 29 of 2008, 2013, 2018, 2023 and 2028 the 1.75% noteholders, on April 15 of 2008 and 2011 the 2% noteholders and on October 24 of 2008, 2011 and 2016 the Zero-Coupon noteholders may require us to repurchase all or a portion of the outstanding 1.75% Notes and Zero-Coupon Notes at their accreted values and the 2% Notes at their face value plus any unpaid accrued interest.
Upon conversion, redemption or repurchase of the 1.75% Notes, the 2% Notes and the Zero-Coupon Notes, we may choose to deliver Carnival Corporation common stock, cash or a combination of cash and common stock with a total value equal to the value of the consideration otherwise deliverable.
Revolving Credit and Committed Financing FacilitiesCarnival Corporation, Carnival plc and certain of Carnival plc’s
subsidiaries are parties to an unsecured multi-currency revolv-ing credit facility for $1.2 billion, €400 million and £200 million (aggregating $2.12 billion U.S. dollars at the November 30, 2006 exchange rates) (the “Facility”). The Facility currently bears interest at libor/euribor plus a margin of 17.5 basis points (“BPS”). In addition, we are required to pay a commitment fee of 30% of the margin per annum. Both the margin and the commitment fee will vary based on changes to Carnival Corporation’s senior unsecured credit ratings. In September 2006, this Facility’s expiration date was extended from October 2010 to October 2011.
Our multi-currency commercial paper programs are supported by this Facility and, accordingly, any amounts outstanding
under our commercial paper programs effectively reduce the aggregate amount available under this Facility. At November 30, 2006, we had borrowed $160 million under our commercial paper program, which is classified as a short-term borrowing since we do not expect to refinance it using proceeds from our long-term Facility. This Facility also supports £46 million ($91 million U.S. dollars at the November 30, 2006 exchange rate) of bonds issued by the Facility lenders on behalf of Carnival Corporation & plc. At November 30, 2006, $1.87 billion was available under the Facility, based on the November 30, 2006 exchange rates.
At November 30, 2006, we had a total of seven separate unsecured long-term ship loan financing facilities under which we have the option to borrow up to an aggregate of $2.55 billion to finance a portion of the purchase price of seven new ships currently under contract. These ships are expected to be delivered through 2009. These facilities are repayable semi-annually over a 12 year period. However, we have the option to terminate each facility up until 60 days prior to the underlying ship’s delivery date.
The Facility and our other loan and derivative agreements contain covenants that require us, among other things, to maintain minimum debt service coverage and minimum share-holders’ equity, and to limit our debt to capital and debt to equity ratios, and the amounts of our secured assets and secured indebtedness. Generally, if an event of default under any loan agreement is triggered, then pursuant to cross default acceleration clauses, substantially all of our outstanding debt and derivative contract payables could become due and the underlying facilities could be terminated. At November 30, 2006, we were in compliance with all of our debt covenants.
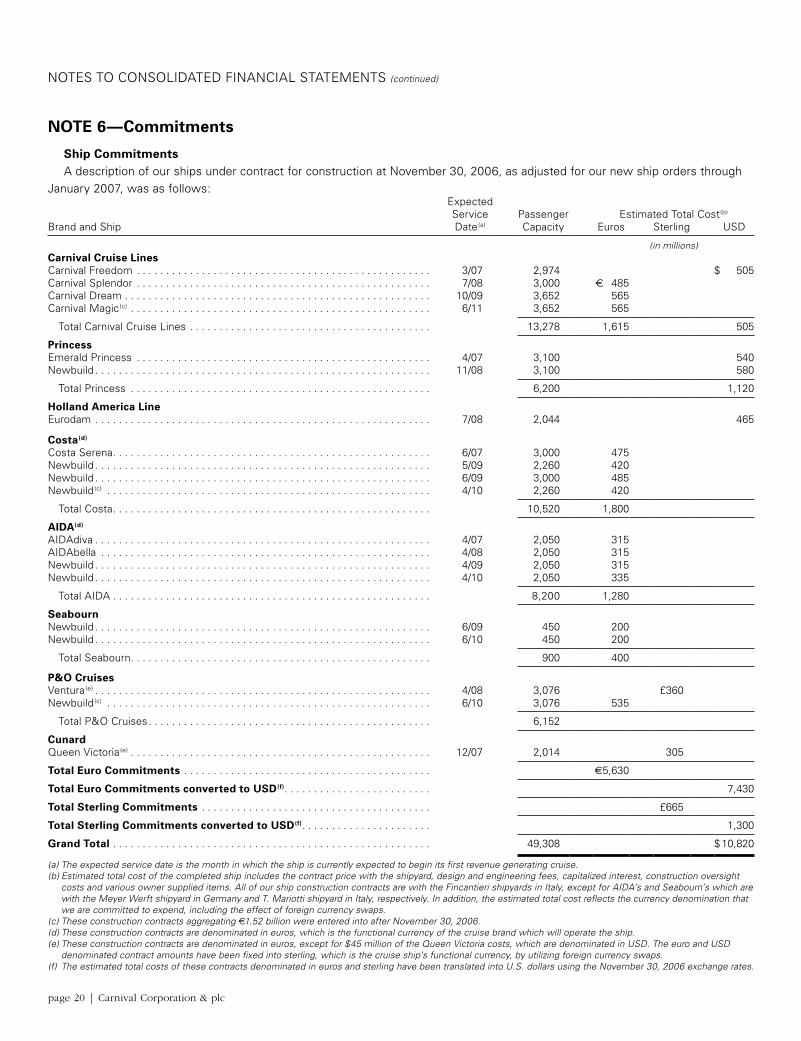
page 20 | Carnival Corporation & plc
NOTES TO CONSOLIDATED FINANCIAL STATEMENTS (continued)
NOTE 6—Commitments
Ship CommitmentsA description of our ships under contract for construction at November 30, 2006, as adjusted for our new ship orders through
January 2007, was as follows:ExpectedService Passenger Estimated Total Cost(b)
Brand and Ship Date(a) Capacity Euros Sterling USD
(in millions)Carnival Cruise LinesCarnival Freedom . . . . . . . . . . . . . . . . . . . . . . . . . . . . . . . . . . . . . . . . . . . . . . . . . . 3/07 2,974 $ 505Carnival Splendor . . . . . . . . . . . . . . . . . . . . . . . . . . . . . . . . . . . . . . . . . . . . . . . . . . 7/08 3,000 € 485Carnival Dream . . . . . . . . . . . . . . . . . . . . . . . . . . . . . . . . . . . . . . . . . . . . . . . . . . . . 10/09 3,652 565Carnival Magic(c) . . . . . . . . . . . . . . . . . . . . . . . . . . . . . . . . . . . . . . . . . . . . . . . . . . . 6/11 3,652 565
Total Carnival Cruise Lines . . . . . . . . . . . . . . . . . . . . . . . . . . . . . . . . . . . . . . . . . 13,278 1,615 505
PrincessEmerald Princess . . . . . . . . . . . . . . . . . . . . . . . . . . . . . . . . . . . . . . . . . . . . . . . . . . 4/07 3,100 540Newbuild . . . . . . . . . . . . . . . . . . . . . . . . . . . . . . . . . . . . . . . . . . . . . . . . . . . . . . . . . 11/08 3,100 580
Total Princess . . . . . . . . . . . . . . . . . . . . . . . . . . . . . . . . . . . . . . . . . . . . . . . . . . . 6,200 1,120
Holland America LineEurodam . . . . . . . . . . . . . . . . . . . . . . . . . . . . . . . . . . . . . . . . . . . . . . . . . . . . . . . . . 7/08 2,044 465
Costa(d)
Costa Serena . . . . . . . . . . . . . . . . . . . . . . . . . . . . . . . . . . . . . . . . . . . . . . . . . . . . . . 6/07 3,000 475Newbuild . . . . . . . . . . . . . . . . . . . . . . . . . . . . . . . . . . . . . . . . . . . . . . . . . . . . . . . . . 5/09 2,260 420Newbuild . . . . . . . . . . . . . . . . . . . . . . . . . . . . . . . . . . . . . . . . . . . . . . . . . . . . . . . . . 6/09 3,000 485Newbuild(c) . . . . . . . . . . . . . . . . . . . . . . . . . . . . . . . . . . . . . . . . . . . . . . . . . . . . . . . 4/10 2,260 420
Total Costa . . . . . . . . . . . . . . . . . . . . . . . . . . . . . . . . . . . . . . . . . . . . . . . . . . . . . . 10,520 1,800
AIDA(d)
AIDAdiva . . . . . . . . . . . . . . . . . . . . . . . . . . . . . . . . . . . . . . . . . . . . . . . . . . . . . . . . . 4/07 2,050 315AIDAbella . . . . . . . . . . . . . . . . . . . . . . . . . . . . . . . . . . . . . . . . . . . . . . . . . . . . . . . . 4/08 2,050 315Newbuild . . . . . . . . . . . . . . . . . . . . . . . . . . . . . . . . . . . . . . . . . . . . . . . . . . . . . . . . . 4/09 2,050 315Newbuild . . . . . . . . . . . . . . . . . . . . . . . . . . . . . . . . . . . . . . . . . . . . . . . . . . . . . . . . . 4/10 2,050 335
Total AIDA . . . . . . . . . . . . . . . . . . . . . . . . . . . . . . . . . . . . . . . . . . . . . . . . . . . . . . 8,200 1,280
SeabournNewbuild . . . . . . . . . . . . . . . . . . . . . . . . . . . . . . . . . . . . . . . . . . . . . . . . . . . . . . . . . 6/09 450 200Newbuild . . . . . . . . . . . . . . . . . . . . . . . . . . . . . . . . . . . . . . . . . . . . . . . . . . . . . . . . . 6/10 450 200
Total Seabourn . . . . . . . . . . . . . . . . . . . . . . . . . . . . . . . . . . . . . . . . . . . . . . . . . . . 900 400
P&O CruisesVentura(e) . . . . . . . . . . . . . . . . . . . . . . . . . . . . . . . . . . . . . . . . . . . . . . . . . . . . . . . . . 4/08 3,076 £360Newbuild(c) . . . . . . . . . . . . . . . . . . . . . . . . . . . . . . . . . . . . . . . . . . . . . . . . . . . . . . . 6/10 3,076 535
Total P&O Cruises . . . . . . . . . . . . . . . . . . . . . . . . . . . . . . . . . . . . . . . . . . . . . . . . 6,152
CunardQueen Victoria(e) . . . . . . . . . . . . . . . . . . . . . . . . . . . . . . . . . . . . . . . . . . . . . . . . . . . 12/07 2,014 305
Total Euro Commitments . . . . . . . . . . . . . . . . . . . . . . . . . . . . . . . . . . . . . . . . . . €5,630
Total Euro Commitments converted to USD(f) . . . . . . . . . . . . . . . . . . . . . . . . . 7,430
Total Sterling Commitments . . . . . . . . . . . . . . . . . . . . . . . . . . . . . . . . . . . . . . . £665
Total Sterling Commitments converted to USD(f) . . . . . . . . . . . . . . . . . . . . . . 1,300
Grand Total . . . . . . . . . . . . . . . . . . . . . . . . . . . . . . . . . . . . . . . . . . . . . . . . . . . . . . 49,308 $ 10,820
(a) The expected service date is the month in which the ship is currently expected to begin its first revenue generating cruise.(b) Estimated total cost of the completed ship includes the contract price with the shipyard, design and engineering fees, capitalized interest, construction oversight
costs and various owner supplied items. All of our ship construction contracts are with the Fincantieri shipyards in Italy, except for AIDA’s and Seabourn’s which are with the Meyer Werft shipyard in Germany and T. Mariotti shipyard in Italy, respectively. In addition, the estimated total cost reflects the currency denomination that we are committed to expend, including the effect of foreign currency swaps.
(c) These construction contracts aggregating €1.52 billion were entered into after November 30, 2006.(d) These construction contracts are denominated in euros, which is the functional currency of the cruise brand which will operate the ship.(e) These construction contracts are denominated in euros, except for $45 million of the Queen Victoria costs, which are denominated in USD. The euro and USD
denominated contract amounts have been fixed into sterling, which is the cruise ship’s functional currency, by utilizing foreign currency swaps.(f) The estimated total costs of these contracts denominated in euros and sterling have been translated into U.S. dollars using the November 30, 2006 exchange rates.
Carnival Corporation & plc | page 21
In connection with our cruise ships under contract for construction listed above, we have paid $922 million through November 30, 2006 and anticipate paying the remaining esti-mated total costs as follows: $2.65 billion, $2.51 billion, $2.43 billion, $1.69 billion and $617 million in fiscal 2007, 2008, 2009, 2010 and 2011, respectively.
Operating LeasesRent expense under our operating leases, primarily for office
and warehouse space, was $47 million in fiscal 2006 and $50 million in each of fiscal 2005 and 2004. At November 30, 2006, minimum annual rentals for our operating leases, with initial or remaining terms in excess of one year, were as follows (in millions): $40, $36, $34, $31, $29 and $180 in fiscal 2007 through 2011 and thereafter, respectively.
Port Facilities and OtherAt November 30, 2006, we had commitments through
2052, with initial or remaining terms in excess of one year, to pay minimum amounts for our annual usage of port facilities and other contractual commitments as follows (in millions): $107, $97, $83, $74, $61 and $217 in fiscal 2007 through 2011 and thereafter, respectively.
NOTE 7—Contingencies
LitigationOn September 21, 2006, a class action complaint was filed
on behalf of a purported class of past passengers against Holland America Line (“HAL”) in the U.S. The complaint alleges that HAL (a) failed to disclose that shore excursion vendors paid HAL to promote their services as required by an Alaska statute, and (b) collected and retained payment from passengers for Passenger Vessel Service Act (“PSVA”) viola-tions in certain instances when HAL did not actually incur the fines. The complaint seeks (i) certification as a class action, (ii) statutory damages under Alaska’s consumer protection statutes, (iii) damages for each PSVA fine collected and addi-tional damages for each PSVA fine collected where no fine was imposed, (iv) injunctive relief and (v) attorneys’ fees, costs and interest. The ultimate outcome of this action cannot be determined at this time. However, we believe that we have meritorious defenses to these claims and intend to vigorously defend this matter.
In January 2006, a lawsuit was filed against Carnival Corporation and its subsidiaries and affiliates, and other non-affiliated cruise lines in New York on behalf of a purported class of owners of intellectual property rights to musical plays and other works performed in the U.S. The plaintiffs claim infringement of copyrights to Broadway, off Broadway and other plays. The suit seeks payment of (i) damages, (ii) disgorgement of alleged profits and (iii) an injunction against future infringe-ment. In the event that an award is given in favor of the plain-tiffs, the amount of damages, if any, which Carnival Corporation and its subsidiaries and affiliates would have to pay is not currently determinable. The ultimate outcome of this matter cannot be determined at this time. However, we intend to vigorously defend this matter.
In the normal course of our business, various other claims and lawsuits have been filed or are pending against us. Most of these claims and lawsuits are covered by insurance and, accordingly, the maximum amount of our liability, net of any insurance recoverables, is typically limited to our self-insurance retention levels. However, the ultimate outcome of these claims and lawsuits which are not covered by insurance cannot be determined at this time.
Contingent ObligationsAt November 30, 2006, Carnival Corporation had contingent
obligations totaling approximately $1.07 billion to participants in lease out and lease back type transactions for three of its ships. At the inception of the leases, the entire amount of the contingent obligations was paid by Carnival Corporation to major financial institutions to enable them to directly pay these obligations. Accordingly, these obligations were considered extinguished, and neither the funds nor the contingent obliga-tions have been included on our balance sheets. Carnival Corporation would only be required to make any payments under these contingent obligations in the remote event of nonperformance by these financial institutions, all of which have long-term credit ratings of AA or higher. In addition, Carnival Corporation obtained a direct guarantee from AA or higher rated financial institutions for $284 million of the above noted contingent obligations, thereby further reducing the already remote exposure to this portion of the contingent obligations. In certain cases, if the credit ratings of the major financial institutions who are directly paying the contingent
page 22 | Carnival Corporation & plc
NOTES TO CONSOLIDATED FINANCIAL STATEMENTS (continued)
obligations fall below AA–, then Carnival Corporation will be required to move those funds being held by those institutions to other financial institutions whose credit ratings are AA– or above. If Carnival Corporation’s credit rating, which is A–, falls below BBB, it would be required to provide a standby letter of credit for $80 million, or alternatively provide mortgages in the aggregate amount of $80 million on two of its ships.
In the unlikely event that Carnival Corporation was to termi-nate the three lease agreements early or default on its obliga-tions, it would, as of November 30, 2006, have to pay a total of $176 million in stipulated damages. As of November 30, 2006, $180 million of standby letters of credit have been issued by a major financial institution in order to provide further secu-rity for the payment of these contingent stipulated damages. In addition, in 2004, a $170 million back-up letter of credit was issued in support of these standby letters of credit. Between 2017 and 2022, we have the right to exercise options that would terminate these three lease transactions at no cost to us. As a result of these three transactions, we have $37 million and $40 million of deferred income recorded on our balance sheets as of November 30, 2006 and 2005, respectively, which is being amortized to nonoperating other income through 2022.
Some of the debt agreements that we enter into include indemnification provisions that obligate us to make payments to the counterparty if certain events occur. These contingen-cies generally relate to changes in taxes, changes in laws that increase lender capital costs and other similar costs. The indemnification clauses are often standard contractual terms and were entered into in the normal course of business. There are no stated or notional amounts included in the indemnifi-cation clauses and we are not able to estimate the maximum potential amount of future payments, if any, under these indemnification clauses. We have not been required to make any material payments under such indemnification clauses in the past and, under current circumstances, we do not believe a request for material future indemnification payments is probable.
War Risk InsuranceWe maintain war risk insurance, subject to coverage limits,
deductibles and exclusions for claims such as those arising from chemical, nuclear and biological attacks, on all of our ships covering our legal liability to crew, passengers and other third parties as well as loss or damage to our vessels arising
from war or war-like actions, including terrorist risks. Under the terms of our war risk insurance coverage, which is typical for war risk policies in the marine industry, underwriters can give seven days notice to the insured that the policies will be cancelled.
NOTE 8—Income and Other Taxes
We are foreign corporations primarily engaged in the inter-national operation of vessels. Generally, income from the international operation of vessels is subject to preferential tax regimes in the countries where the vessel owning companies are incorporated and exempt from income tax in other coun-tries where the vessels call due to the application of income tax treaties or, in the case of the U.S., Section 883 of the Internal Revenue Code. Income we earn that is not associated with the international operation of ships, primarily the trans-portation, hotel and tour businesses of Holland America Tours and Princess Tours, is subject to income tax in the countries where such income is earned.
For fiscal 2004, we believe that substantially all of our income, with the exception of our U.S. source income princi-pally from the transportation, hotel and tour businesses of Holland America Tours and Princess Tours, was derived from, or incidental to, the international operation of ships, and is therefore exempt from U.S. federal income taxes. For fiscal 2005, regulations under Section 883 of the Internal Revenue Code limiting the types of income considered to be derived from the international operation of a ship first became effec-tive. Section 883 is the primary provision upon which we rely to exempt most of our international ship operation earnings from U.S. income taxes. Accordingly, the 2006 and 2005 pro-visions for U.S. federal income taxes include taxes on a portion of our ship operating income that is in addition to the U.S. source transportation, hotel and tour income on which U.S. taxes have historically been provided. In addition, during the fourth quarter of 2005 and first quarter of 2006 we chartered three ships to the Military Sealift Command in connection with the Hurricane Katrina relief effort. Income from these charters is not considered to be income from the international operation of our ships and, accordingly, approximately $11 mil-lion and $18 million of income taxes were provided on the net earnings of these charters in fiscal 2006 and 2005, respec-tively, at an effective tax rate of approximately 57%.
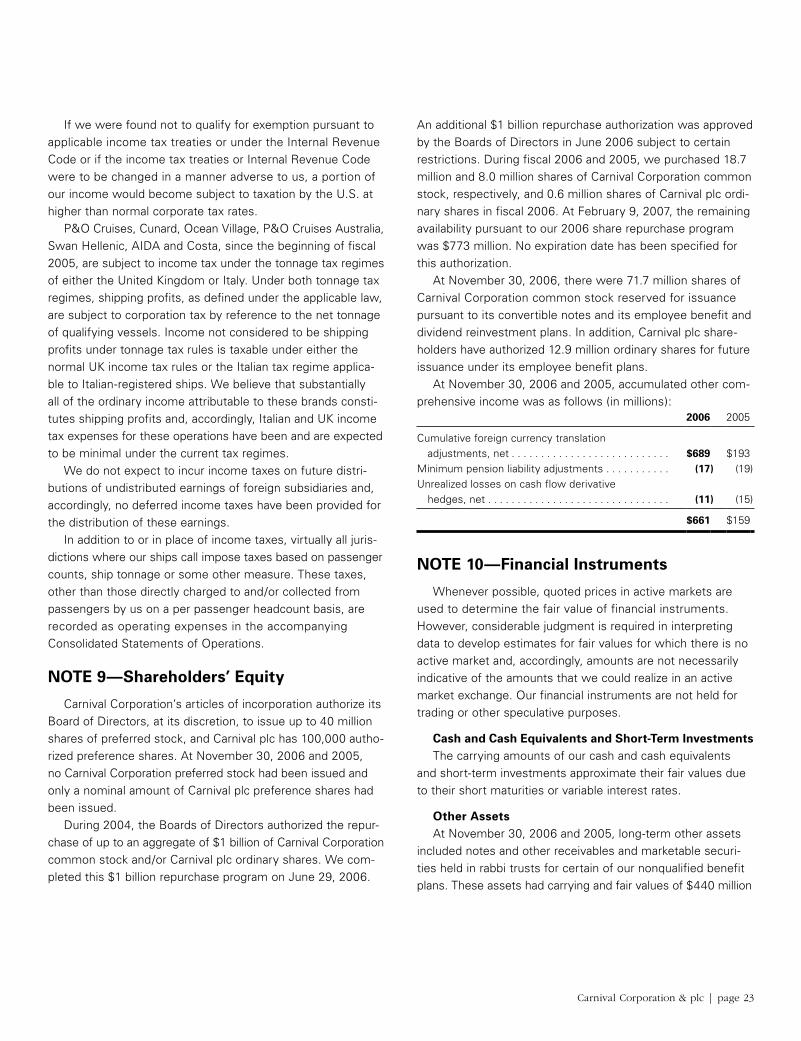
Carnival Corporation & plc | page 23
If we were found not to qualify for exemption pursuant to applicable income tax treaties or under the Internal Revenue Code or if the income tax treaties or Internal Revenue Code were to be changed in a manner adverse to us, a portion of our income would become subject to taxation by the U.S. at higher than normal corporate tax rates.
P&O Cruises, Cunard, Ocean Village, P&O Cruises Australia, Swan Hellenic, AIDA and Costa, since the beginning of fiscal 2005, are subject to income tax under the tonnage tax regimes of either the United Kingdom or Italy. Under both tonnage tax regimes, shipping profits, as defined under the applicable law, are subject to corporation tax by reference to the net tonnage of qualifying vessels. Income not considered to be shipping profits under tonnage tax rules is taxable under either the normal UK income tax rules or the Italian tax regime applica-ble to Italian-registered ships. We believe that substantially all of the ordinary income attributable to these brands consti-tutes shipping profits and, accordingly, Italian and UK income tax expenses for these operations have been and are expected to be minimal under the current tax regimes.
We do not expect to incur income taxes on future distri-butions of undistributed earnings of foreign subsidiaries and, accordingly, no deferred income taxes have been provided for the distribution of these earnings.
In addition to or in place of income taxes, virtually all juris-dictions where our ships call impose taxes based on passenger counts, ship tonnage or some other measure. These taxes, other than those directly charged to and/or collected from passengers by us on a per passenger headcount basis, are recorded as operating expenses in the accompanying Consolidated Statements of Operations.
NOTE 9—Shareholders’ Equity
Carnival Corporation’s articles of incorporation authorize its Board of Directors, at its discretion, to issue up to 40 million shares of preferred stock, and Carnival plc has 100,000 autho-rized preference shares. At November 30, 2006 and 2005, no Carnival Corporation preferred stock had been issued and only a nominal amount of Carnival plc preference shares had been issued.
During 2004, the Boards of Directors authorized the repur-chase of up to an aggregate of $1 billion of Carnival Corporation common stock and/or Carnival plc ordinary shares. We com-pleted this $1 billion repurchase program on June 29, 2006.
An additional $1 billion repurchase authorization was approved by the Boards of Directors in June 2006 subject to certain restrictions. During fiscal 2006 and 2005, we purchased 18.7 million and 8.0 million shares of Carnival Corporation common stock, respectively, and 0.6 million shares of Carnival plc ordi-nary shares in fiscal 2006. At February 9, 2007, the remaining availability pursuant to our 2006 share repurchase program was $773 million. No expiration date has been specified for this authorization.
At November 30, 2006, there were 71.7 million shares of Carnival Corporation common stock reserved for issuance pursuant to its convertible notes and its employee benefit and dividend reinvestment plans. In addition, Carnival plc share-holders have authorized 12.9 million ordinary shares for future issuance under its employee benefit plans.
At November 30, 2006 and 2005, accumulated other com-prehensive income was as follows (in millions):
2006 2005
Cumulative foreign currency translation adjustments, net . . . . . . . . . . . . . . . . . . . . . . . . . . . $689 $193Minimum pension liability adjustments . . . . . . . . . . . (17) (19)Unrealized losses on cash flow derivative hedges, net . . . . . . . . . . . . . . . . . . . . . . . . . . . . . . . (11) (15)
$661 $159
NOTE 10—Financial Instruments
Whenever possible, quoted prices in active markets are used to determine the fair value of financial instruments. However, considerable judgment is required in interpreting data to develop estimates for fair values for which there is no active market and, accordingly, amounts are not necessarily indicative of the amounts that we could realize in an active market exchange. Our financial instruments are not held for trading or other speculative purposes.
Cash and Cash Equivalents and Short-Term InvestmentsThe carrying amounts of our cash and cash equivalents
and short-term investments approximate their fair values due to their short maturities or variable interest rates.
Other AssetsAt November 30, 2006 and 2005, long-term other assets
included notes and other receivables and marketable securi-ties held in rabbi trusts for certain of our nonqualified benefit plans. These assets had carrying and fair values of $440 million
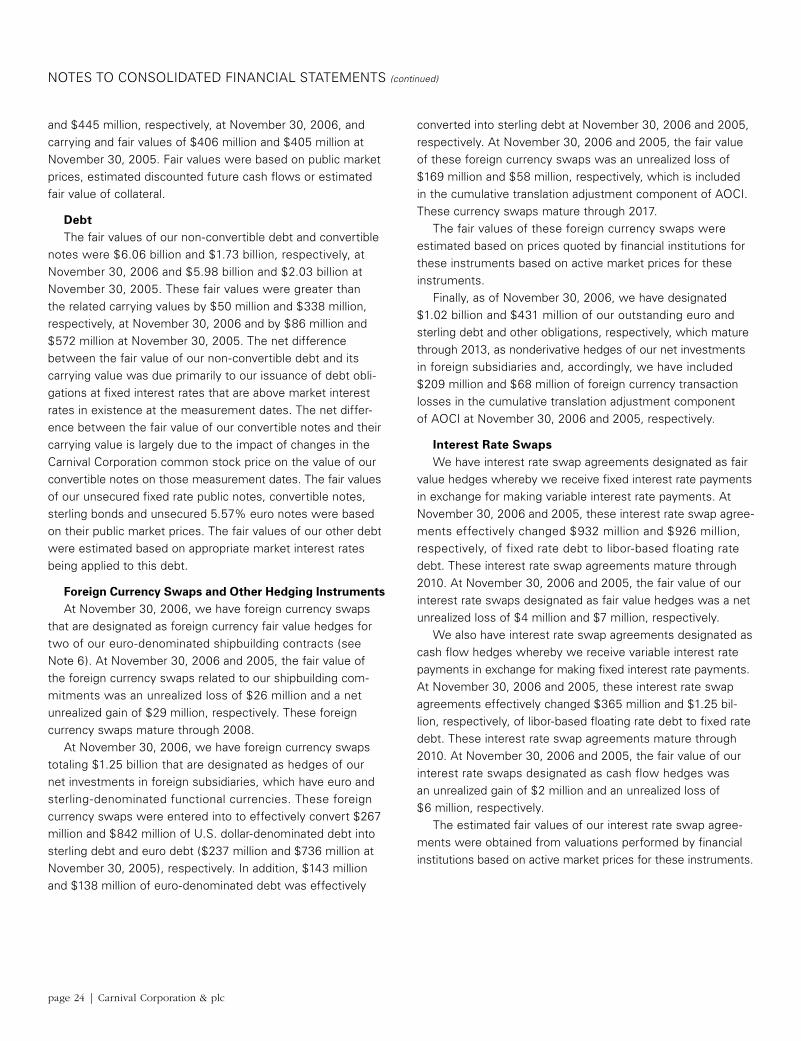
page 24 | Carnival Corporation & plc
NOTES TO CONSOLIDATED FINANCIAL STATEMENTS (continued)
and $445 million, respectively, at November 30, 2006, and carrying and fair values of $406 million and $405 million at November 30, 2005. Fair values were based on public market prices, estimated discounted future cash flows or estimated fair value of collateral.
DebtThe fair values of our non-convertible debt and convertible
notes were $6.06 billion and $1.73 billion, respectively, at November 30, 2006 and $5.98 billion and $2.03 billion at November 30, 2005. These fair values were greater than the related carrying values by $50 million and $338 million, respectively, at November 30, 2006 and by $86 million and $572 million at November 30, 2005. The net difference between the fair value of our non-convertible debt and its carrying value was due primarily to our issuance of debt obli-gations at fixed interest rates that are above market interest rates in existence at the measurement dates. The net differ-ence between the fair value of our convertible notes and their carrying value is largely due to the impact of changes in the Carnival Corporation common stock price on the value of our convertible notes on those measurement dates. The fair values of our unsecured fixed rate public notes, convertible notes, sterling bonds and unsecured 5.57% euro notes were based on their public market prices. The fair values of our other debt were estimated based on appropriate market interest rates being applied to this debt.
Foreign Currency Swaps and Other Hedging InstrumentsAt November 30, 2006, we have foreign currency swaps
that are designated as foreign currency fair value hedges for two of our euro-denominated shipbuilding contracts (see Note 6). At November 30, 2006 and 2005, the fair value of the foreign currency swaps related to our shipbuilding com-mitments was an unrealized loss of $26 million and a net unrealized gain of $29 million, respectively. These foreign currency swaps mature through 2008.
At November 30, 2006, we have foreign currency swaps totaling $1.25 billion that are designated as hedges of our net investments in foreign subsidiaries, which have euro and sterling-denominated functional currencies. These foreign currency swaps were entered into to effectively convert $267 million and $842 million of U.S. dollar-denominated debt into sterling debt and euro debt ($237 million and $736 million at November 30, 2005), respectively. In addition, $143 million and $138 million of euro-denominated debt was effectively
converted into sterling debt at November 30, 2006 and 2005, respectively. At November 30, 2006 and 2005, the fair value of these foreign currency swaps was an unrealized loss of $169 million and $58 million, respectively, which is included in the cumulative translation adjustment component of AOCI. These currency swaps mature through 2017.
The fair values of these foreign currency swaps were estimated based on prices quoted by financial institutions for these instruments based on active market prices for these instruments.
Finally, as of November 30, 2006, we have designated $1.02 billion and $431 million of our outstanding euro and sterling debt and other obligations, respectively, which mature through 2013, as nonderivative hedges of our net investments in foreign subsidiaries and, accordingly, we have included $209 million and $68 million of foreign currency transaction losses in the cumulative translation adjustment component of AOCI at November 30, 2006 and 2005, respectively.
Interest Rate SwapsWe have interest rate swap agreements designated as fair
value hedges whereby we receive fixed interest rate payments in exchange for making variable interest rate payments. At November 30, 2006 and 2005, these interest rate swap agree-ments effectively changed $932 million and $926 million, respectively, of fixed rate debt to libor-based floating rate debt. These interest rate swap agreements mature through 2010. At November 30, 2006 and 2005, the fair value of our interest rate swaps designated as fair value hedges was a net unrealized loss of $4 million and $7 million, respectively.
We also have interest rate swap agreements designated as cash flow hedges whereby we receive variable interest rate payments in exchange for making fixed interest rate payments. At November 30, 2006 and 2005, these interest rate swap agreements effectively changed $365 million and $1.25 bil-lion, respectively, of libor-based floating rate debt to fixed rate debt. These interest rate swap agreements mature through 2010. At November 30, 2006 and 2005, the fair value of our interest rate swaps designated as cash flow hedges was an unrealized gain of $2 million and an unrealized loss of $6 million, respectively.
The estimated fair values of our interest rate swap agree-ments were obtained from valuations performed by financial institutions based on active market prices for these instruments.
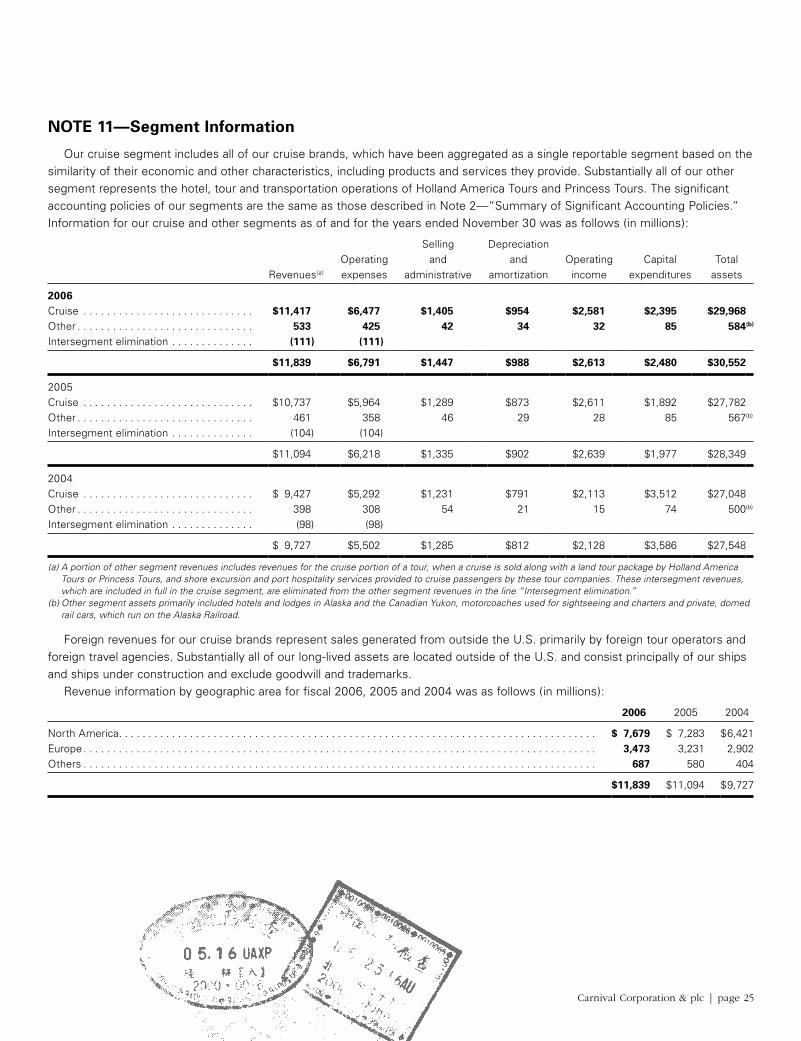
Carnival Corporation & plc | page 25
NOTE 11—Segment Information
Our cruise segment includes all of our cruise brands, which have been aggregated as a single reportable segment based on the similarity of their economic and other characteristics, including products and services they provide. Substantially all of our other segment represents the hotel, tour and transportation operations of Holland America Tours and Princess Tours. The significant accounting policies of our segments are the same as those described in Note 2—“Summary of Significant Accounting Policies.” Information for our cruise and other segments as of and for the years ended November 30 was as follows (in millions):
Selling DepreciationOperating and and Operating Capital Total
Revenues(a) expenses administrative amortization income expenditures assets
2006Cruise . . . . . . . . . . . . . . . . . . . . . . . . . . . . . $11,417 $6,477 $1,405 $954 $2,581 $2,395 $29,968Other . . . . . . . . . . . . . . . . . . . . . . . . . . . . . . 533 425 42 34 32 85 584(b)
Intersegment elimination . . . . . . . . . . . . . . (111) (111)
$11,839 $6,791 $1,447 $988 $2,613 $2,480 $30,552
2005Cruise . . . . . . . . . . . . . . . . . . . . . . . . . . . . . $10,737 $5,964 $1,289 $873 $2,611 $1,892 $27,782Other . . . . . . . . . . . . . . . . . . . . . . . . . . . . . . 461 358 46 29 28 85 567(b)
Intersegment elimination . . . . . . . . . . . . . . (104) (104)
$11,094 $6,218 $1,335 $902 $2,639 $1,977 $28,349
2004Cruise . . . . . . . . . . . . . . . . . . . . . . . . . . . . . $ 9,427 $5,292 $1,231 $791 $2,113 $3,512 $27,048Other . . . . . . . . . . . . . . . . . . . . . . . . . . . . . . 398 308 54 21 15 74 500(b)
Intersegment elimination . . . . . . . . . . . . . . (98) (98)
$ 9,727 $5,502 $1,285 $812 $2,128 $3,586 $27,548
(a) A portion of other segment revenues includes revenues for the cruise portion of a tour, when a cruise is sold along with a land tour package by Holland America Tours or Princess Tours, and shore excursion and port hospitality services provided to cruise passengers by these tour companies. These intersegment revenues, which are included in full in the cruise segment, are eliminated from the other segment revenues in the line “Intersegment elimination.”
(b) Other segment assets primarily included hotels and lodges in Alaska and the Canadian Yukon, motorcoaches used for sightseeing and charters and private, domed rail cars, which run on the Alaska Railroad.
Foreign revenues for our cruise brands represent sales generated from outside the U.S. primarily by foreign tour operators and foreign travel agencies. Substantially all of our long-lived assets are located outside of the U.S. and consist principally of our ships and ships under construction and exclude goodwill and trademarks.
Revenue information by geographic area for fiscal 2006, 2005 and 2004 was as follows (in millions):
2006 2005 2004
North America . . . . . . . . . . . . . . . . . . . . . . . . . . . . . . . . . . . . . . . . . . . . . . . . . . . . . . . . . . . . . . . . . . . . . . . . . . . . . . . . . $ 7,679 $ 7,283 $ 6,421Europe . . . . . . . . . . . . . . . . . . . . . . . . . . . . . . . . . . . . . . . . . . . . . . . . . . . . . . . . . . . . . . . . . . . . . . . . . . . . . . . . . . . . . . . 3,473 3,231 2,902Others . . . . . . . . . . . . . . . . . . . . . . . . . . . . . . . . . . . . . . . . . . . . . . . . . . . . . . . . . . . . . . . . . . . . . . . . . . . . . . . . . . . . . . . 687 580 404
$ 11,839 $ 11,094 $ 9,727
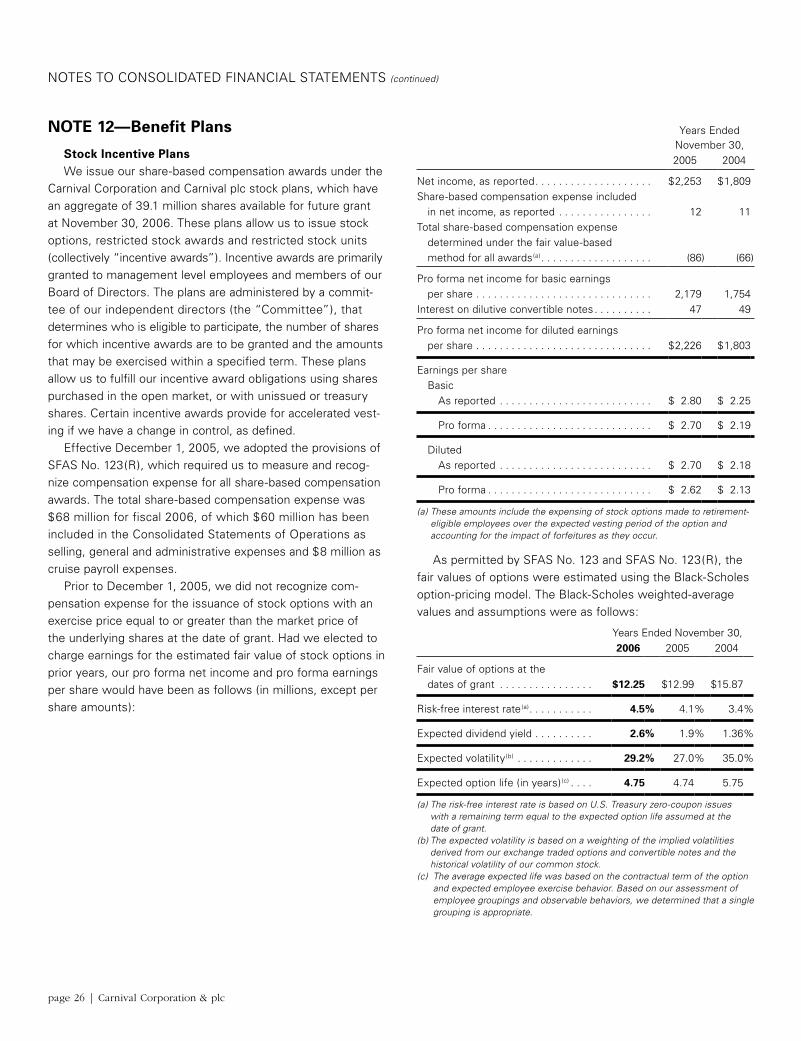
page 26 | Carnival Corporation & plc
NOTES TO CONSOLIDATED FINANCIAL STATEMENTS (continued)
NOTE 12—Benefit Plans
Stock Incentive PlansWe issue our share-based compensation awards under the
Carnival Corporation and Carnival plc stock plans, which have an aggregate of 39.1 million shares available for future grant at November 30, 2006. These plans allow us to issue stock options, restricted stock awards and restricted stock units (collectively “incentive awards”). Incentive awards are primarily granted to management level employees and members of our Board of Directors. The plans are administered by a commit-tee of our independent directors (the “Committee”), that determines who is eligible to participate, the number of shares for which incentive awards are to be granted and the amounts that may be exercised within a specified term. These plans allow us to fulfill our incentive award obligations using shares purchased in the open market, or with unissued or treasury shares. Certain incentive awards provide for accelerated vest-ing if we have a change in control, as defined.
Effective December 1, 2005, we adopted the provisions of SFAS No. 123(R), which required us to measure and recog-nize compensation expense for all share-based compensation awards. The total share-based compensation expense was $68 million for fiscal 2006, of which $60 million has been included in the Consolidated Statements of Operations as selling, general and administrative expenses and $8 million as cruise payroll expenses.
Prior to December 1, 2005, we did not recognize com-pensation expense for the issuance of stock options with an exercise price equal to or greater than the market price of the underlying shares at the date of grant. Had we elected to charge earnings for the estimated fair value of stock options in prior years, our pro forma net income and pro forma earnings per share would have been as follows (in millions, except per share amounts):
Years Ended November 30,2005 2004
Net income, as reported . . . . . . . . . . . . . . . . . . . . $ 2,253 $ 1,809Share-based compensation expense included in net income, as reported . . . . . . . . . . . . . . . . 12 11Total share-based compensation expense determined under the fair value-based method for all awards(a) . . . . . . . . . . . . . . . . . . . (86) (66)
Pro forma net income for basic earnings per share . . . . . . . . . . . . . . . . . . . . . . . . . . . . . . 2,179 1,754Interest on dilutive convertible notes . . . . . . . . . . 47 49
Pro forma net income for diluted earnings per share . . . . . . . . . . . . . . . . . . . . . . . . . . . . . . $ 2,226 $ 1,803
Earnings per share Basic As reported . . . . . . . . . . . . . . . . . . . . . . . . . . $ 2.80 $ 2.25
Pro forma . . . . . . . . . . . . . . . . . . . . . . . . . . . . $ 2.70 $ 2.19
Diluted As reported . . . . . . . . . . . . . . . . . . . . . . . . . . $ 2.70 $ 2.18
Pro forma . . . . . . . . . . . . . . . . . . . . . . . . . . . . $ 2.62 $ 2.13
(a) These amounts include the expensing of stock options made to retirement-eligible employees over the expected vesting period of the option and accounting for the impact of forfeitures as they occur.
As permitted by SFAS No. 123 and SFAS No. 123(R), the fair values of options were estimated using the Black-Scholes option-pricing model. The Black-Scholes weighted-average values and assumptions were as follows:
Years Ended November 30,2006 2005 2004
Fair value of options at the dates of grant . . . . . . . . . . . . . . . . $12.25 $12.99 $15.87
Risk-free interest rate(a) . . . . . . . . . . . 4.5% 4.1% 3.4%
Expected dividend yield . . . . . . . . . . 2.6% 1.9% 1.36%
Expected volatility(b) . . . . . . . . . . . . . 29.2% 27.0% 35.0%
Expected option life (in years)(c) . . . . 4.75 4.74 5.75
(a) The risk-free interest rate is based on U.S. Treasury zero-coupon issues with a remaining term equal to the expected option life assumed at the date of grant.
(b) The expected volatility is based on a weighting of the implied volatilities derived from our exchange traded options and convertible notes and the historical volatility of our common stock.
(c) The average expected life was based on the contractual term of the option and expected employee exercise behavior. Based on our assessment of employee groupings and observable behaviors, we determined that a single grouping is appropriate.
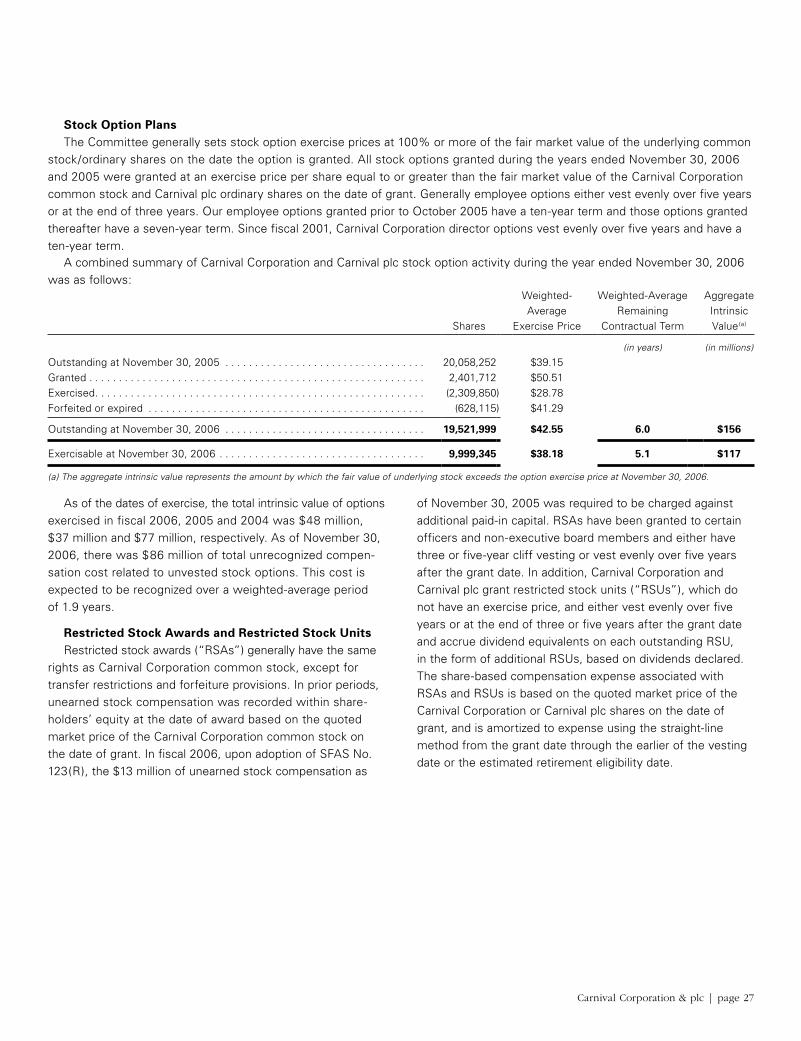
Carnival Corporation & plc | page 27
Stock Option PlansThe Committee generally sets stock option exercise prices at 100% or more of the fair market value of the underlying common
stock/ordinary shares on the date the option is granted. All stock options granted during the years ended November 30, 2006 and 2005 were granted at an exercise price per share equal to or greater than the fair market value of the Carnival Corporation common stock and Carnival plc ordinary shares on the date of grant. Generally employee options either vest evenly over five years or at the end of three years. Our employee options granted prior to October 2005 have a ten-year term and those options granted thereafter have a seven-year term. Since fiscal 2001, Carnival Corporation director options vest evenly over five years and have a ten-year term.
A combined summary of Carnival Corporation and Carnival plc stock option activity during the year ended November 30, 2006 was as follows:
Weighted- Weighted-Average AggregateAverage Remaining Intrinsic
Shares Exercise Price Contractual Term Value(a)
(in years) (in millions)
Outstanding at November 30, 2005 . . . . . . . . . . . . . . . . . . . . . . . . . . . . . . . . . . 20,058,252 $39.15Granted . . . . . . . . . . . . . . . . . . . . . . . . . . . . . . . . . . . . . . . . . . . . . . . . . . . . . . . . . 2,401,712 $50.51Exercised . . . . . . . . . . . . . . . . . . . . . . . . . . . . . . . . . . . . . . . . . . . . . . . . . . . . . . . . (2,309,850) $28.78Forfeited or expired . . . . . . . . . . . . . . . . . . . . . . . . . . . . . . . . . . . . . . . . . . . . . . . (628,115) $41.29
Outstanding at November 30, 2006 . . . . . . . . . . . . . . . . . . . . . . . . . . . . . . . . . . 19,521,999 $42.55 6.0 $156
Exercisable at November 30, 2006 . . . . . . . . . . . . . . . . . . . . . . . . . . . . . . . . . . . 9,999,345 $38.18 5.1 $117
(a) The aggregate intrinsic value represents the amount by which the fair value of underlying stock exceeds the option exercise price at November 30, 2006.
As of the dates of exercise, the total intrinsic value of options exercised in fiscal 2006, 2005 and 2004 was $48 million, $37 million and $77 million, respectively. As of November 30, 2006, there was $86 million of total unrecognized compen-sation cost related to unvested stock options. This cost is expected to be recognized over a weighted-average period of 1.9 years.
Restricted Stock Awards and Restricted Stock UnitsRestricted stock awards (“RSAs”) generally have the same
rights as Carnival Corporation common stock, except for transfer restrictions and forfeiture provisions. In prior periods, unearned stock compensation was recorded within share-holders’ equity at the date of award based on the quoted market price of the Carnival Corporation common stock on the date of grant. In fiscal 2006, upon adoption of SFAS No. 123(R), the $13 million of unearned stock compensation as
of November 30, 2005 was required to be charged against additional paid-in capital. RSAs have been granted to certain officers and non-executive board members and either have three or five-year cliff vesting or vest evenly over five years after the grant date. In addition, Carnival Corporation and Carnival plc grant restricted stock units (“RSUs”), which do not have an exercise price, and either vest evenly over five years or at the end of three or five years after the grant date and accrue dividend equivalents on each outstanding RSU, in the form of additional RSUs, based on dividends declared. The share-based compensation expense associated with RSAs and RSUs is based on the quoted market price of the Carnival Corporation or Carnival plc shares on the date of grant, and is amortized to expense using the straight-line method from the grant date through the earlier of the vesting date or the estimated retirement eligibility date.
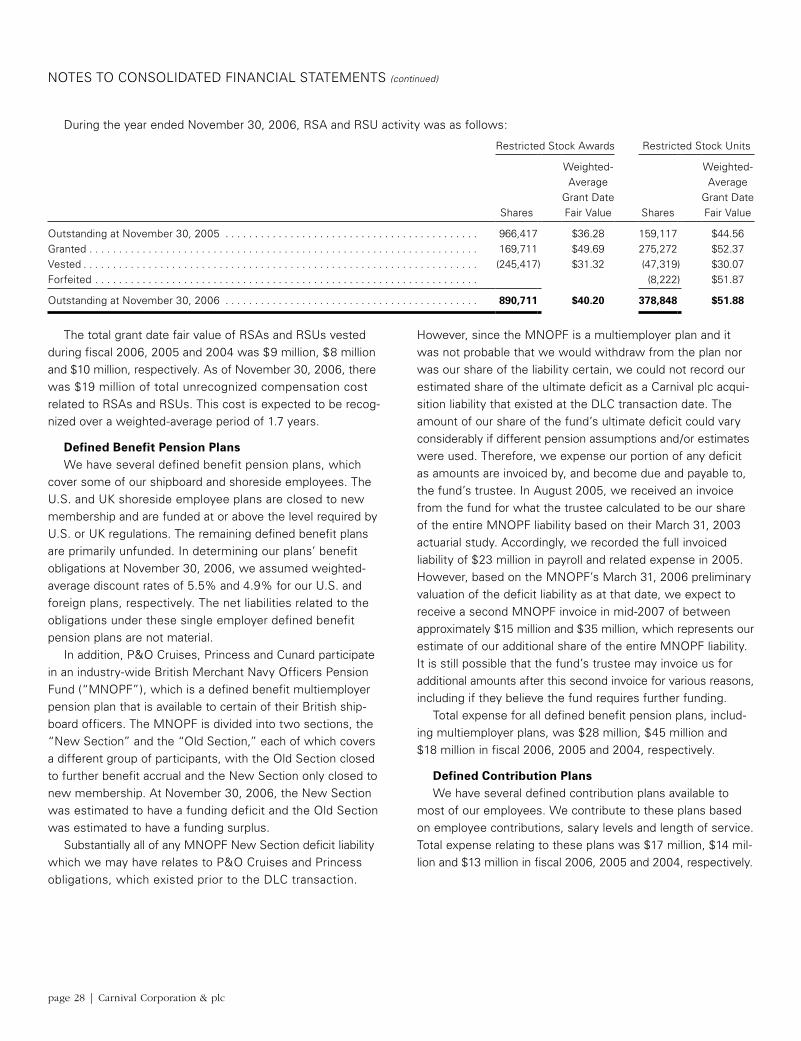
page 28 | Carnival Corporation & plc
NOTES TO CONSOLIDATED FINANCIAL STATEMENTS (continued)
During the year ended November 30, 2006, RSA and RSU activity was as follows:
Restricted Stock Awards Restricted Stock Units
Weighted- Weighted-Average Average
Grant Date Grant DateShares Fair Value Shares Fair Value
Outstanding at November 30, 2005 . . . . . . . . . . . . . . . . . . . . . . . . . . . . . . . . . . . . . . . . . . . 966,417 $36.28 159,117 $44.56Granted . . . . . . . . . . . . . . . . . . . . . . . . . . . . . . . . . . . . . . . . . . . . . . . . . . . . . . . . . . . . . . . . . . 169,711 $49.69 275,272 $52.37Vested . . . . . . . . . . . . . . . . . . . . . . . . . . . . . . . . . . . . . . . . . . . . . . . . . . . . . . . . . . . . . . . . . . . (245,417) $31.32 (47,319) $30.07Forfeited . . . . . . . . . . . . . . . . . . . . . . . . . . . . . . . . . . . . . . . . . . . . . . . . . . . . . . . . . . . . . . . . . (8,222) $51.87
Outstanding at November 30, 2006 . . . . . . . . . . . . . . . . . . . . . . . . . . . . . . . . . . . . . . . . . . . 890,711 $40.20 378,848 $51.88
The total grant date fair value of RSAs and RSUs vested during fiscal 2006, 2005 and 2004 was $9 million, $8 million and $10 million, respectively. As of November 30, 2006, there was $19 million of total unrecognized compensation cost related to RSAs and RSUs. This cost is expected to be recog-nized over a weighted-average period of 1.7 years.
Defined Benefit Pension PlansWe have several defined benefit pension plans, which
cover some of our shipboard and shoreside employees. The U.S. and UK shoreside employee plans are closed to new membership and are funded at or above the level required by U.S. or UK regulations. The remaining defined benefit plans are primarily unfunded. In determining our plans’ benefit obligations at November 30, 2006, we assumed weighted-average discount rates of 5.5% and 4.9% for our U.S. and foreign plans, respectively. The net liabilities related to the obligations under these single employer defined benefit pension plans are not material.
In addition, P&O Cruises, Princess and Cunard participate in an industry-wide British Merchant Navy Officers Pension Fund (“MNOPF”), which is a defined benefit multiemployer pension plan that is available to certain of their British ship-board officers. The MNOPF is divided into two sections, the “New Section” and the “Old Section,” each of which covers a different group of participants, with the Old Section closed to further benefit accrual and the New Section only closed to new membership. At November 30, 2006, the New Section was estimated to have a funding deficit and the Old Section was estimated to have a funding surplus.
Substantially all of any MNOPF New Section deficit liability which we may have relates to P&O Cruises and Princess obligations, which existed prior to the DLC transaction.
However, since the MNOPF is a multiemployer plan and it was not probable that we would withdraw from the plan nor was our share of the liability certain, we could not record our estimated share of the ultimate deficit as a Carnival plc acqui-sition liability that existed at the DLC transaction date. The amount of our share of the fund’s ultimate deficit could vary considerably if different pension assumptions and/or estimates were used. Therefore, we expense our portion of any deficit as amounts are invoiced by, and become due and payable to, the fund’s trustee. In August 2005, we received an invoice from the fund for what the trustee calculated to be our share of the entire MNOPF liability based on their March 31, 2003 actuarial study. Accordingly, we recorded the full invoiced liability of $23 million in payroll and related expense in 2005. However, based on the MNOPF’s March 31, 2006 preliminary valuation of the deficit liability as at that date, we expect to receive a second MNOPF invoice in mid-2007 of between approximately $15 million and $35 million, which represents our estimate of our additional share of the entire MNOPF liability. It is still possible that the fund’s trustee may invoice us for additional amounts after this second invoice for various reasons, including if they believe the fund requires further funding.
Total expense for all defined benefit pension plans, includ-ing multiemployer plans, was $28 million, $45 million and $18 million in fiscal 2006, 2005 and 2004, respectively.
Defined Contribution PlansWe have several defined contribution plans available to
most of our employees. We contribute to these plans based on employee contributions, salary levels and length of service. Total expense relating to these plans was $17 million, $14 mil-lion and $13 million in fiscal 2006, 2005 and 2004, respectively.
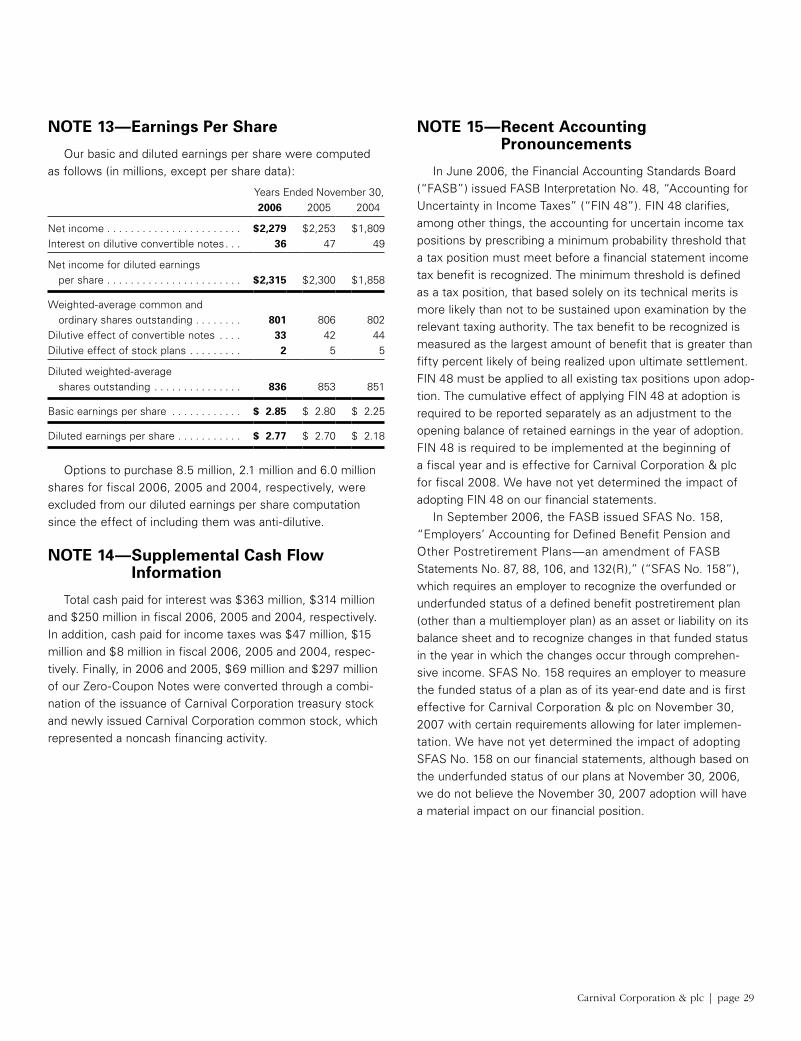
Carnival Corporation & plc | page 29
NOTE 13—Earnings Per Share
Our basic and diluted earnings per share were computed as follows (in millions, except per share data):
Years Ended November 30,2006 2005 2004
Net income . . . . . . . . . . . . . . . . . . . . . . . $ 2,279 $ 2,253 $ 1,809Interest on dilutive convertible notes . . . 36 47 49
Net income for diluted earnings per share . . . . . . . . . . . . . . . . . . . . . . . $ 2,315 $ 2,300 $ 1,858
Weighted-average common and ordinary shares outstanding . . . . . . . . 801 806 802Dilutive effect of convertible notes . . . . 33 42 44Dilutive effect of stock plans . . . . . . . . . 2 5 5
Diluted weighted-average shares outstanding . . . . . . . . . . . . . . . 836 853 851
Basic earnings per share . . . . . . . . . . . . $ 2.85 $ 2.80 $ 2.25
Diluted earnings per share . . . . . . . . . . . $ 2.77 $ 2.70 $ 2.18
Options to purchase 8.5 million, 2.1 million and 6.0 million shares for fiscal 2006, 2005 and 2004, respectively, were excluded from our diluted earnings per share computation since the effect of including them was anti-dilutive.
NOTE 14— Supplemental Cash Flow Information
Total cash paid for interest was $363 million, $314 million and $250 million in fiscal 2006, 2005 and 2004, respectively. In addition, cash paid for income taxes was $47 million, $15 million and $8 million in fiscal 2006, 2005 and 2004, respec-tively. Finally, in 2006 and 2005, $69 million and $297 million of our Zero-Coupon Notes were converted through a combi-nation of the issuance of Carnival Corporation treasury stock and newly issued Carnival Corporation common stock, which represented a noncash financing activity.
NOTE 15— Recent Accounting Pronouncements
In June 2006, the Financial Accounting Standards Board (“FASB”) issued FASB Interpretation No. 48, “Accounting for Uncertainty in Income Taxes” (“FIN 48”). FIN 48 clarifies, among other things, the accounting for uncertain income tax positions by prescribing a minimum probability threshold that a tax position must meet before a financial statement income tax benefit is recognized. The minimum threshold is defined as a tax position, that based solely on its technical merits is more likely than not to be sustained upon examination by the relevant taxing authority. The tax benefit to be recognized is measured as the largest amount of benefit that is greater than fifty percent likely of being realized upon ultimate settlement. FIN 48 must be applied to all existing tax positions upon adop-tion. The cumulative effect of applying FIN 48 at adoption is required to be reported separately as an adjustment to the opening balance of retained earnings in the year of adoption. FIN 48 is required to be implemented at the beginning of a fiscal year and is effective for Carnival Corporation & plc for fiscal 2008. We have not yet determined the impact of adopting FIN 48 on our financial statements.
In September 2006, the FASB issued SFAS No. 158, “Employers’ Accounting for Defined Benefit Pension and Other Postretirement Plans—an amendment of FASB Statements No. 87, 88, 106, and 132(R),” (“SFAS No. 158”), which requires an employer to recognize the overfunded or underfunded status of a defined benefit postretirement plan (other than a multiemployer plan) as an asset or liability on its balance sheet and to recognize changes in that funded status in the year in which the changes occur through comprehen-sive income. SFAS No. 158 requires an employer to measure the funded status of a plan as of its year-end date and is first effective for Carnival Corporation & plc on November 30, 2007 with certain requirements allowing for later implemen-tation. We have not yet determined the impact of adopting SFAS No. 158 on our financial statements, although based on the underfunded status of our plans at November 30, 2006, we do not believe the November 30, 2007 adoption will have a material impact on our financial position.
page 30 | Carnival Corporation & plc
MANAGEMENT’S REPORT ON INTERNAL CONTROL OVER FINANCIAL REPORTING
Our management is responsible for establishing and maintaining adequate internal control over financial reporting, as such term is defined in Exchange Act Rule 13a-15(f). Under the supervision and with the participation of our management, including our Chief Executive Officer, Chief Operating Officer and Chief Financial and Accounting Officer, we conducted an evaluation of the effectiveness of our internal control over financial reporting based on the framework in Internal Control—Integrated Framework, issued by the Committee of Sponsoring Organizations of the Treadway Commission (“COSO Framework”). Based on our evalua-tion under the COSO Framework, our management concluded that our internal control over financial reporting was effective as of November 30, 2006.
Our management’s assessment of the effectiveness of our internal control over financial reporting as of November 30, 2006 has been audited by PricewaterhouseCoopers LLP, an independent registered certified public accounting firm as stated in their report, which is included in this 2006 Annual Report.
Micky Arison Howard S. Frank Gerald R. CahillChairman of the Board and Vice Chairman of the Board and Executive Vice President andChief Executive Officer Chief Operating Officer Chief Financial and Accounting OfficerFebruary 12, 2007 February 12, 2007 February 12, 2007
Carnival Corporation & plc | page 31
To the Boards of Directors and Shareholders of Carnival Corporation and Carnival plc:
We have completed integrated audits of Carnival Corporation & plc’s consolidated financial statements and of its internal control over financial reporting as of November 30, 2006 in accordance with the standards of the Public Company Accounting Oversight Board (United States). Our opinions, based on our audits, are presented below.
Consolidated Financial StatementsIn our opinion, the accompanying consolidated balance sheets and the related consolidated statements of operations, cash flows
and shareholders’ equity present fairly, in all material respects, the financial position of Carnival Corporation & plc (comprising Carnival Corporation and Carnival plc and their respective subsidiaries, the “Company”) at November 30, 2006 and November 30, 2005, and the results of their operations and their cash flows for each of the three years in the period ended November 30, 2006 in conformity with accounting principles generally accepted in the United States of America. These financial statements are the responsibility of the Company’s management. Our responsibility is to express an opinion on these financial statements based on our audits. We conducted our audits of these statements in accordance with the standards of the Public Company Accounting Oversight Board (United States). Those standards require that we plan and perform the audit to obtain reasonable assurance about whether the financial statements are free of material misstatement. An audit of financial statements includes examining, on a test basis, evidence supporting the amounts and disclosures in the financial statements, assessing the accounting principles used and significant estimates made by management, and evaluating the overall financial statement presentation. We believe that our audits provide a reasonable basis for our opinion.
As discussed in Note 2 to the consolidated financial statements, effective December 1, 2005 the Company adopted Statement of Financial Accounting Standards No. 123 (revised 2004), “Share-Based Payment.”
In addition, as discussed in Note 2 to the consolidated financial statements, effective March 1, 2006 the Company elected to change its method of accounting for costs incurred in connection with its dry-dock activities.
Internal Control over Financial ReportingAlso, in our opinion, management’s assessment, included in the accompanying Management’s Report on Internal Control Over
Financial Reporting, that the Company maintained effective internal control over financial reporting as of November 30, 2006 based on criteria established in Internal Control—Integrated Framework issued by the Committee of Sponsoring Organizations of the Treadway Commission (“COSO”), is fairly stated, in all material respects, based on those criteria. Furthermore, in our opinion, the Company maintained, in all material respects, effective internal control over financial reporting as of November 30, 2006, based on criteria established in Internal Control—Integrated Framework issued by the COSO. The Company’s management is responsible for maintaining effective internal control over financial reporting and for its assessment of the effectiveness of internal control over financial reporting. Our responsibility is to express opinions on management’s assessment and on the effectiveness of the Company’s internal control over financial reporting based on our audit. We conducted our audit of internal control over financial reporting in accordance with the standards of the Public Company Accounting Oversight Board (United States). Those standards require that we plan and perform the audit to obtain reasonable assurance about whether effective internal control over financial reporting was maintained in all material respects. An audit of internal control over financial reporting includes obtaining an under-standing of internal control over financial reporting, evaluating management’s assessment, testing and evaluating the design and operating effectiveness of internal control, and performing such other procedures as we consider necessary in the circumstances. We believe that our audit provides a reasonable basis for our opinions.
A company’s internal control over financial reporting is a process designed to provide reasonable assurance regarding the reliability of financial reporting and the preparation of financial statements for external purposes in accordance with generally accepted accounting principles. A company’s internal control over financial reporting includes those policies and procedures that (i) pertain to the maintenance of records that, in reasonable detail, accurately and fairly reflect the transactions and dispositions of the assets of the company; (ii) provide reasonable assurance that transactions are recorded as necessary to permit preparation of financial statements in accordance with generally accepted accounting principles, and that receipts and expenditures of the company are being made only in accordance with authorizations of management and directors of the company; and (iii) provide reasonable assurance regarding prevention or timely detection of unauthorized acquisition, use, or disposition of the company’s assets that could have a material effect on the financial statements.
Because of its inherent limitations, internal control over financial reporting may not prevent or detect misstatements. Also, projections of any evaluation of effectiveness to future periods are subject to the risk that controls may become inadequate because of changes in conditions, or that the degree of compliance with the policies or procedures may deteriorate.
Miami, FloridaFebruary 12, 2007
REPORT OF INDEPENDENT REGISTERED CERTIFIED PUBLIC ACCOUNTING FIRM
page 32 | Carnival Corporation & plc
MANAGEMENT’S DISCUSSION AND ANALYSIS OF FINANCIAL CONDITION AND RESULTS OF OPERATIONS
Cautionary Note Concerning Factors That May Affect Future Results
Some of the statements contained in this 2006 Annual Report are “forward-looking statements” that involve risks, uncertainties and assumptions with respect to us, including some statements concerning future results, outlook, plans, goals and other events which have not yet occurred. These statements are intended to qualify for the safe harbors from liability provided by Section 27A of the Securities Act of 1933 and Section 21E of the Securities Exchange Act of 1934. We have tried, wherever possible, to identify these statements by using words like “will,” “may,” “believes,” “expects,” “anticipates,” “forecast,” “future,” “intends,” “plans,” and “estimates” and similar expressions.
Because forward-looking statements involve risks and uncertainties, there are many factors that could cause our actual results, performance or achievements to differ materially from those expressed or implied in this 2006 Annual Report. Forward-looking statements include those statements which may impact the forecasting of our earnings per share, net revenue yields, booking levels, pricing, occupancy, operating, financing and/or tax costs, fuel costs, costs per available lower berth day (“ALBD”), estimates of ship depreciable lives and residual values, outlook or business prospects. These factors include, but are not limited to, the following:
• general economic and business conditions, which may adversely impact the levels of our potential vacationers’ discretionary income and this group’s confidence in the U.S. economy, and thereby reduce the net revenue yields for our cruise brands;
• the international political and economic climate, armed conflicts, terrorist attacks and threats thereof, availability of air service and other world events, and their impact on the demand for cruises;
• accidents, unusual weather conditions or natural disasters, such as hurricanes and earthquakes and other incidents (including machinery and equipment failures or improper operation thereof) which could cause the alteration of itineraries or cancellation of a cruise or series of cruises, and the impact of the spread of contagious diseases, affecting the health, safety, security and vacation satis-faction of passengers;
• adverse publicity concerning the cruise industry in general, or us in particular, could impact the demand for our cruises;
• conditions in the cruise and land-based vacation industries, including competition from other cruise ship operators and providers of other vacation alternatives and increases in capacity offered by cruise ship and land-based vacation alternatives;
• changing consumer preferences, which may, among other things, adversely impact the demand for cruises;
• changes in and compliance with the environmental, health, safety, security, tax and other regulatory regimes under which we operate, including the implementation of U.S. regulations requiring U.S. citizens to obtain passports for sea travel to or from additional foreign destinations;
• the impact of changes in operating and financing costs, including changes in foreign currency exchange rates and interest rates and fuel, food, insurance, payroll and security costs;
• our ability to implement our shipbuilding programs and brand strategies and to continue to expand our business worldwide;
• our future operating cash flow may not be sufficient to fund future obligations and we may not be able to obtain financing, if necessary, on terms that are favorable or consistent with our expectations;
• lack of acceptance of new itineraries, products and services by our guests;
• our ability to attract and retain qualified shipboard crew and maintain good relations with employee unions;
• continuing financial viability of our travel agent distribution system and air service providers;
• our decisions to self-insure against various risks or inability to obtain insurance for certain risks;
• disruptions to our software and other information technology systems;
• continued availability of attractive port destinations;
• risks associated with the DLC structure, including the uncertainty of its tax status;
• risks associated with operating internationally;
• the impact of pending or threatened litigation; and
• our ability to successfully implement cost reduction plans.
Carnival Corporation & plc | page 33
Forward-looking statements should not be relied upon as a prediction of actual results. Subject to any continuing obli-gations under applicable law or any relevant listing rules, we expressly disclaim any obligation to disseminate, after the date of this 2006 Annual Report, any updates or revisions to any such forward-looking statements to reflect any change in expectations or events, conditions or circumstances on which any such statements are based.
Executive Overview
Since the beginning of 2004 and continuing through 2005, we experienced a substantial improvement in our net cruise revenue yields per ALBD (“net revenue yields”). The improve-ment in net revenue yields was primarily the result of higher passenger ticket prices, onboard revenues and occupancy and, to a lesser extent, a weaker U.S. dollar relative to the euro and sterling. Towards the spring of 2006, the impact of the severe 2005 hurricane season and higher fuel costs and interest rates on vacationers’ discretionary income, we believe caused a softening in demand, principally for cruises in the Caribbean. The weaker Caribbean demand was offset by strong demand and pricing for our European brands and for our North American brands when sailing outside of the Caribbean. Consequently, in 2006, we continued to increase our net revenue yields, however, by a much smaller percentage than 2005 and 2004.
From 2003 through 2006, the cruise industry was adversely impacted by substantial increases in fuel prices, which reduced earnings per share for the 2006 fiscal year by $0.25 compared to fiscal 2005. Towards the end of 2006, fuel prices decreased slightly and were below the prior year comparable amount. It is possible that fuel prices may once again begin to increase in 2007 and thereafter.
Throughout this period we generated significant cash flows and remained in a strong financial position, which is a high priority for us and we believe provides us with a competitive advantage in the capital intensive cruise industry. We continue to distribute excess cash to shareholders in an opportunistic manner either through dividends or through our share buy-back programs. However, our operations are subject to many risks, as briefly noted under the caption “Cautionary Note Concerning Factors That May Affect Future Results,” which could adversely impact our future results.
Since June 2006, we ordered seven additional ships, which are expected to be delivered between 2009 and 2011. As of February 12, 2007, we had signed agreements with three
shipyards providing for the construction of 20 additional cruise ships, the majority of which have been designated for our European brands (see Note 6 in the accompanying financial statements). These new ships are expected to continue to help us maintain our leadership position within the cruise industry. Excluding any future ship orders, acquisitions or retirements, the year-over-year percentage increase in our ALBD capacity for fiscal 2007, 2008, 2009, 2010 and 2011, resulting substantially all from new ships entering service, is currently expected to be 8.4%, 7.9%, 7.5%, 6.7% and 3.9%, respectively.
Outlook for Fiscal 2007 (“2007”)
As of December 21, 2006, we said that we expected our 2007 full year earnings per share will be in the range of $2.90 to $3.10. We also said that we expected our first quarter 2007 earnings per share to be in the range of $0.33 to $0.35. Our guidance was based on the then current forward fuel price for all of 2007 of $339 per metric ton for the full year. In addition, this guidance was also based on currency exchange rates of $1.33 to the euro and $1.98 to sterling.
Since the date of our December earnings release, the cruise industry has begun a period of heavy bookings generally referred to as “wave season,” which begins in early January. Bookings since the beginning of January are up compared to the same period in 2006, however, the increase is less than our 2007 capacity increase. Pricing on bookings taken in 2007 was less than in the comparable period last year, primarily because of the continuing price pressure on Caribbean sailings. As of February 4, 2007, occupancy on cumulative advance bookings taken for the full year 2007 is approximately the same as the comparable date last year. Pricing on those advance bookings is also approximately equal to last year (down 1% in constant dollars).
Based on bookings taken to date, we now expect our net revenue yields to be flat to up slightly for the full year 2007 (down 1% to 2% in constant dollars), which is a little less than our previous guidance. Largely offsetting this, our estimate of forward prices for fuel for the year 2007 has decreased to $315 per metric ton compared to the $339 per metric ton we used in our December guidance. Our earnings per share for the first quarter of 2007 is now expected to come in at the high end of the range of our December guidance of $0.33 to $0.35 per share because of lower fuel costs. Our earnings guidance for the full year 2007 remains $2.90 to $3.10 per share.
page 34 | Carnival Corporation & plc
MANAGEMENT’S DISCUSSION AND ANALYSIS OF FINANCIAL CONDITION AND RESULTS OF OPERATIONS(continued)
Key Performance Indicators
We use net cruise revenues per ALBD and net cruise costs per ALBD as significant non-GAAP financial measures of our cruise segment financial performance. We believe that net revenue yields are commonly used in the cruise industry to measure a company’s cruise segment revenue performance. This measure is also used for revenue management purposes. In calculating net revenue yields, we use “net cruise revenues” rather than “gross cruise revenues.” We believe that net cruise revenues is a more meaningful measure in determining revenue yield than gross cruise revenues because it reflects the cruise revenues earned by us net of our most significant variable costs, which are travel agent commissions, cost of air transportation and certain other variable direct costs asso-ciated with onboard and other revenues. Substantially all of our remaining cruise costs are largely fixed once our ship capacity levels have been determined, except for the impact of changing prices.
Net cruise costs per ALBD is the most significant measure we use to monitor our cruise segment costs rather than gross cruise costs per ALBD. In calculating net cruise costs, we exclude the same variable costs that are included in the calcu-lation of net cruise revenues. This is done to avoid duplicating these variable costs in these two non-GAAP financial measures.
We have not provided estimates of future gross revenue yields because the reconciliations of forecasted net cruise revenues to forecasted gross cruise revenues would require us to forecast, with reasonable accuracy, the amount of air and other transportation costs that our forecasted cruise pas-sengers would elect to purchase from us (the “air/sea mix”). Since the forecasting of future air/sea mix involves several significant variables that are relatively difficult to forecast and the revenues from the sale of air and other transportation approximate the costs of providing that transportation, man-agement focuses primarily on forecasts of net cruise revenues rather than gross cruise revenues. This does not impact, in any material respect, our ability to forecast our future results, as any variation in the air/sea mix has no material impact on our forecasted net cruise revenues. As such, management does not believe that this reconciling information would be meaningful.
In addition, because a significant portion of our operations utilize the euro or sterling to measure their results and financial condition, the translation of those operations to our U.S. dollar reporting currency results in increases in reported U.S. dollar revenues and expenses if the U.S. dollar weakens against these foreign currencies, and decreases in reported U.S. dollar revenues and expenses if the U.S. dollar strengthens against these foreign currencies. Accordingly, we also monitor our
two non-GAAP financial measures assuming the current period currency exchange rates have remained constant with the prior year’s rates, or on a “constant dollar basis,” in order to remove the impact of changes in exchange rates on our non-U.S. cruise operations. We believe that this is a useful measure indicating the actual growth of our operations in a fluctuating currency exchange rate environment.
On a constant dollar basis, net cruise revenues and net cruise costs would be $9.21 billion and $5.69 billion for fiscal 2006, respectively. On a constant dollar basis, gross cruise revenues and gross cruise costs would be $11.42 billion and $7.91 billion for fiscal 2006, respectively. In addition, our non-U.S. cruise operations’ depreciation and net interest expense were impacted by the changes in exchange rates for fiscal 2006 compared to 2005.
All the prior periods financial information presented herein have been adjusted to reflect the retrospective application of the change in our method of accounting for dry-dock costs, as more fully discussed in Note 2 in the accompanying finan-cial statements.
Critical Accounting Estimates
Our critical accounting estimates are those which we believe require our most significant judgments about the effect of matters that are inherently uncertain. A discussion of our critical accounting estimates, the underlying judgments and uncertainties used to make them and the likelihood that materially different estimates would be reported under differ-ent conditions or using different assumptions is as follows:
Ship AccountingOur most significant assets are our ships and ships under
construction, which represent 88% of our total assets. We make several critical accounting estimates dealing with our ship accounting. First, we compute our ships’ depreciation expense, which represented approximately 10% of our cruise costs and expenses in fiscal 2006, which requires us to esti-mate the average useful life of each of our ships, as well as their residual values. Secondly, we account for ship improve-ment costs by capitalizing those costs which we believe will add value to our ships and depreciate those improvements over their estimated useful lives, while expensing repairs and maintenance and minor replacement costs as they are incurred. Finally, when we record the retirement of a ship component that is included within the ship’s cost basis, we estimate its net book value to determine the amount of ship component retired.
We determine the average useful life of our ships and their residual values based primarily on our estimates of the weighted-average useful lives and residual values of the ships’
Carnival Corporation & plc | page 35
major component systems, such as cabins, main diesels, main electric, superstructure and hull. In addition, we consider, among other things, long-term vacation market conditions and competition and historical useful lives of similarly-built ships. We have estimated our new ships’ average useful lives at 30 years and their average residual values at 15% of our origi-nal ship cost.
Given the very large and complex nature of our ships, ship accounting estimates require considerable judgment and are inherently uncertain. We do not have cost segregation studies performed to specifically componentize our ship systems. In addition, since we do not separately componentize our ships, we do not identify and track depreciation of specific compo-nent systems. Therefore, we have to estimate the net book value of components that are replaced or refurbished, based primarily upon their replacement or refurbishment cost and their age.
If materially different conditions existed, or if we materially changed our assumptions of ship lives and residual values, our depreciation expense or loss on replacement or refurbishment of ship assets and net book value of our ships would be mate-rially different. In addition, if we change our assumptions in making our determinations as to whether improvements to a ship add value, the amounts we expense each year as repair and maintenance costs could increase, partially offset by a decrease in depreciation expense, as less costs would have been initially capitalized to our ships. Our fiscal 2006 ship depreciation expense would have increased by approximately $25 million for every year we reduced our estimated average 30 year ship useful life. In addition, if our ships were estimated to have no residual value, our fiscal 2006 depreciation expense would have increased by approximately $125 million.
We believe that the estimates we made for ship account-ing purposes are reasonable and our methods are consistently applied and, accordingly, result in depreciation expense that is based on a rational and systematic method to equitably allo-cate the costs of our ships to the periods during which services are obtained from their use. In addition, we believe that the estimates we made are reasonable and our methods consis-tently applied (1) in determining the average useful life and average residual values of our ships; (2) in determining which ship improvement costs add value to our ships; and (3) in determining the net book value of ship component assets being replaced or refurbished. Finally, we believe our critical ship accounting estimates are generally comparable with those of other major cruise companies.
Asset ImpairmentThe impairment reviews of our ships, trademarks and
goodwill, which has been allocated to our cruise line reporting units, require us to make significant estimates to determine the fair values of these assets or reporting units.
The determination of fair value includes numerous uncer-tainties, unless a viable actively traded market exists for the asset or for a comparable reporting unit, which is usually not the case for cruise ships, cruise lines and trademarks. For example, in determining fair values of ships and cruise lines utilizing discounted forecasted cash flows, significant judg-ments are made concerning, among other things, future net revenue yields, net cruise costs per ALBD, interest and dis-count rates, cruise itineraries, ship additions and retirements, technological changes, consumer demand, governmental regulations and the effects of competition. In addition, third party appraisers are sometimes used to determine fair values and some of their valuation methodologies are also subject to similar types of uncertainties. Also, the determination of fair values of reporting units using a price earnings multiple approach also requires significant judgments, such as deter-mining reasonably comparable multiples. Finally, determining trademark fair values also requires significant judgments in determining both the estimated trademark cash flows, and the appropriate royalty rates to be applied to those cash flows to determine their fair value. We believe that we have made reasonable estimates and judgments in determining whether our ships, goodwill and trademarks have been impaired. However, if there is a material change in the assumptions used in our determination of fair value or if there is a material change in the conditions or circumstances influencing fair value, we could be required to recognize a material impair-ment charge.
ContingenciesWe periodically assess the potential liabilities related to
any lawsuits or claims brought against us, as well as for other known unasserted claims, including environmental, legal, passenger and crew, and tax matters. While it is typically very difficult to determine the timing and ultimate outcome of these matters, we use our best judgment to determine if it is probable that we will incur an expense related to the settle-ment or final adjudication of such matters and whether a reasonable estimation of such probable loss, if any, can be made. In assessing probable losses, we make estimates of the amount of probable insurance recoveries, if any, which are recorded as assets. We accrue a liability when we believe a
page 36 | Carnival Corporation & plc
MANAGEMENT’S DISCUSSION AND ANALYSIS OF FINANCIAL CONDITION AND RESULTS OF OPERATIONS(continued)
loss is probable and the amount of the loss can be reasonably estimated, in accordance with the provisions of SFAS No. 5, “Accounting for Contingencies,” as amended. Such accruals are typically based on developments to date, management’s estimates of the outcomes of these matters, our experience in contesting, litigating and settling other similar matters, historical claims experience and actuarially determined assumptions of liabilities, and any related insurance coverage. See Note 7 in the accompanying financial statements for addi-tional information concerning our contingencies.
Given the inherent uncertainty related to the eventual out-come of these matters and potential insurance recoveries, it is possible that all or some of these matters may be resolved for amounts materially different from any provisions or disclo-sures that we may have made with respect to their resolution. In addition, as new information becomes available, we may need to reassess the amount of probable liability that needs to be accrued related to our contingencies. All such revisions in our estimates could materially impact our results of opera-tions and financial position.
Results of Operations
We earn our cruise revenues primarily from the following:
• sales of passenger cruise tickets and, in some cases, the sale of air and other transportation to and from our ships. The cruise ticket price includes accommodations, most meals, some non-alcoholic beverages, entertainment and many onboard activities, and
• the sale of goods and/or services primarily onboard our ships, which include bar and some beverage sales, casino gaming, shore excursions, gift shop and spa sales, photo and art sales, and pre and post-cruise land packages. These goods and services are either provided directly by
us or by independent concessionaires, from which we receive a percentage of their revenues or a fee.
We incur cruise operating costs and expenses for the following:
• the costs of passenger cruise tickets, which represent costs that vary directly with passenger cruise ticket reve-nues, and include travel agent commissions, air and other travel related costs,
• onboard and other cruise costs, which represent costs that vary directly with onboard and other revenues, and include the costs of liquor and some beverages, costs of tangible goods sold by us from our gift, photo and art auction activities, pre and post-cruise land packages and credit card fees. Concession revenues do not have any significant amount of costs associated with them, as the costs and services incurred for these activities are pro-vided by our concessionaires,
• payroll and related costs, which represent costs for all our shipboard personnel, including deck and engine offi-cers and crew and hotel and administrative employees,
• fuel costs, which include fuel delivery costs,
• food costs, which include both our passenger and crew food costs, and
• other ship operating costs, which include repairs and maintenance, including minor replacements and dry-dock expenses, port charges, insurance, entertainment and all other shipboard operating costs and expenses.
For segment information related to our revenues, expenses, operating income and other financial information see Note 11 in the accompanying financial statements.
Carnival Corporation & plc | page 37
Gross and net revenue yields were computed by dividing the gross or net revenues, without rounding, by ALBDs as follows:
Years Ended November 30,(in millions, except ALBDs and yields) 2006 2005 2004
Cruise revenues Passenger tickets . . . . . . . . . . . . . . . . . . . . . . . . . . . . . . . . . . . . . . . . . . . . . . . . . . . . . . . . . . . . . . . . . $ 8,903 $ 8,399 $ 7,357 Onboard and other . . . . . . . . . . . . . . . . . . . . . . . . . . . . . . . . . . . . . . . . . . . . . . . . . . . . . . . . . . . . . . . . 2,514 2,338 2,070
Gross cruise revenues . . . . . . . . . . . . . . . . . . . . . . . . . . . . . . . . . . . . . . . . . . . . . . . . . . . . . . . . . . . . . . . 11,417 10,737 9,427Less cruise costs Commissions, transportation and other . . . . . . . . . . . . . . . . . . . . . . . . . . . . . . . . . . . . . . . . . . . . . . . . (1,749) (1,645) (1,572) Onboard and other . . . . . . . . . . . . . . . . . . . . . . . . . . . . . . . . . . . . . . . . . . . . . . . . . . . . . . . . . . . . . . . . (453) (412) (359)
Net cruise revenues . . . . . . . . . . . . . . . . . . . . . . . . . . . . . . . . . . . . . . . . . . . . . . . . . . . . . . . . . . . . . . . . . $ 9,215 $ 8,680 $ 7,496
ALBDs(a) . . . . . . . . . . . . . . . . . . . . . . . . . . . . . . . . . . . . . . . . . . . . . . . . . . . . . . . . . . . . . . . . . . . . . . . . . . 49,945,184 47,754,627 44,009,061
Gross revenue yields . . . . . . . . . . . . . . . . . . . . . . . . . . . . . . . . . . . . . . . . . . . . . . . . . . . . . . . . . . . . . . . . $228.58 $224.84 $214.21
Net revenue yields . . . . . . . . . . . . . . . . . . . . . . . . . . . . . . . . . . . . . . . . . . . . . . . . . . . . . . . . . . . . . . . . . . $184.50 $181.77 $170.32
Gross and net cruise costs per ALBD were computed by dividing the gross or net cruise costs, without rounding, by ALBDs as follows:
Years Ended November 30,(in millions, except ALBDs and costs per ALBD) 2006 2005 2004
Cruise operating expenses . . . . . . . . . . . . . . . . . . . . . . . . . . . . . . . . . . . . . . . . . . . . . . . . . . . . . . . . . . . . $ 6,477 $ 5,964 $ 5,292Cruise selling and administrative expenses . . . . . . . . . . . . . . . . . . . . . . . . . . . . . . . . . . . . . . . . . . . . . . . 1,405 1,289 1,231
Gross cruise costs . . . . . . . . . . . . . . . . . . . . . . . . . . . . . . . . . . . . . . . . . . . . . . . . . . . . . . . . . . . . . . . . . . 7,882 7,253 6,523Less cruise costs included in net cruise revenues Commissions, transportation and other . . . . . . . . . . . . . . . . . . . . . . . . . . . . . . . . . . . . . . . . . . . . . . . . (1,749) (1,645) (1,572) Onboard and other . . . . . . . . . . . . . . . . . . . . . . . . . . . . . . . . . . . . . . . . . . . . . . . . . . . . . . . . . . . . . . . . (453) (412) (359)
Net cruise costs . . . . . . . . . . . . . . . . . . . . . . . . . . . . . . . . . . . . . . . . . . . . . . . . . . . . . . . . . . . . . . . . . . . . $ 5,680 $ 5,196 $ 4,592
ALBDs(a) . . . . . . . . . . . . . . . . . . . . . . . . . . . . . . . . . . . . . . . . . . . . . . . . . . . . . . . . . . . . . . . . . . . . . . . . . . 49,945,184 47,754,627 44,009,061
Gross cruise costs per ALBD . . . . . . . . . . . . . . . . . . . . . . . . . . . . . . . . . . . . . . . . . . . . . . . . . . . . . . . . . . $157.81 $151.89 $148.24
Net cruise costs per ALBD . . . . . . . . . . . . . . . . . . . . . . . . . . . . . . . . . . . . . . . . . . . . . . . . . . . . . . . . . . . . $113.73 $108.81 $104.34
(a) Available lower berth days is a standard measure of passenger capacity for the period. It assumes that each cabin we offer for sale accommodates two passengers. ALBDs are computed by multiplying passenger capacity by revenue producing ship operating days in the period.
Selected Information and Non-GAAP Financial Measures
Selected information was as follows:Years Ended November 30,
2006 2005 2004
Passengers carried (in thousands) . . . . . . . . . . . . . . . . . . . . . . . . . . . . . . . . . . . . . . . . . . . . . . . . . . . . . . 7,008 6,848 6,306
Occupancy percentage . . . . . . . . . . . . . . . . . . . . . . . . . . . . . . . . . . . . . . . . . . . . . . . . . . . . . . . . . . . . . . . 106.0%(a) 105.6%(a) 104.5%
Fuel cost per metric ton(b) . . . . . . . . . . . . . . . . . . . . . . . . . . . . . . . . . . . . . . . . . . . . . . . . . . . . . . . . . . . . . $334 $259 $194
(a) Occupancy percentage includes the three ships chartered to the Military Sealift Command (“MSC”) in connection with our Hurricane Katrina relief efforts in the first quarter of 2006 and the fourth quarter of 2005 at 100%.
(b) Fuel cost per metric ton is calculated by dividing the cost of our fuel by the number of metric tons consumed.
page 38 | Carnival Corporation & plc
MANAGEMENT’S DISCUSSION AND ANALYSIS OF FINANCIAL CONDITION AND RESULTS OF OPERATIONS(continued)
Fiscal 2006 (“2006”) Compared to Fiscal 2005 (“2005”)
RevenuesNet cruise revenues increased $535 million, or 6.2%, to
$9.22 billion in 2006 from $8.68 billion in 2005. The 4.6% increase in ALBDs between 2006 and 2005 accounted for $398 million of the increase, and the remaining $137 million was from increased net revenue yields, which increased 1.5% on both a current and constant dollar basis in 2006 compared to 2005 (gross revenue yields increased by 1.7% in current dollars). Net revenue yields increased in 2006 primarily from higher cruise ticket prices, higher onboard revenues and, to a lesser extent, a 0.4% increase in occupancy. Gross cruise revenues increased $680 million, or 6.3%, in 2006 to $11.42 billion from $10.74 billion in 2005 for largely the same reasons as net cruise revenues.
Our 2006 cruise ticket prices for Caribbean itineraries were less than 2005, which was offset by price increases we achieved primarily from our Alaska and European cruises. We believe that this reduction in Caribbean pricing was the result of weaker consumer demand caused primarily from the lingering effects of the unusually strong 2005 hurricane sea-son and higher fuel and other costs’ adverse impacts on our customers’ discretionary income.
Onboard and other revenues included concession revenues of $694 million in 2006 and $638 million in 2005. Onboard and other revenues increased in 2006 compared to 2005, pri-marily because of the 4.6% increased ALBDs and increased passenger spending on our ships.
Other non-cruise revenues increased $72 million, or 15.6%, to $533 million in 2006 from $461 million in 2005 primarily due to the increase in the number of cruise/tours sold in Alaska.
Costs and ExpensesNet cruise costs increased $484 million, or 9.3%, to $5.68
billion in 2006 from $5.20 billion in 2005. The 4.6% increase in ALBDs between 2005 and 2006 accounted for $238 million of the increase whereas $246 million was from increased net cruise costs per ALBD, which increased 4.5% in 2006 com-pared to 2005 (gross cruise costs per ALBD increased 3.9%). Net cruise costs per ALBD increased primarily due to a $75 increase in fuel cost per metric ton, or 29.0%, to $334 per metric ton in 2006, which resulted in an additional $209 million of expense, and a $57 million increase in share-based com-pensation expense, which was as the result of our adoption of SFAS No. 123(R) (see Notes 2 and 12 in the accompanying financial statements). This increase was partially offset by the non-recurrence in 2006 of a $23 million MNOPF contribution. Net cruise costs per ALBD as measured on a constant dollar basis increased 4.8% in 2006 compared to 2005. On a constant dollar basis, net cruise costs per ALBD, excluding increased fuel prices and incremental share-based compen-sation expenses were flat, compared to 2005. Gross cruise costs increased $629 million, or 8.7%, in 2006 to $7.88 billion from $7.25 billion in 2005 for largely the same reasons as net cruise costs.
Other non-cruise operating expenses increased $67 million, or 18.7%, to $425 million in 2006 from $358 million in 2005 primarily due to the increase in the number of cruise/tours sold in Alaska.
Depreciation and amortization expense increased by $86 million, or 9.5%, to $988 million in 2006 from $902 million in 2005 largely due to the 4.6% increase in ALBDs through the addition of new ships, and additional ship improvement expenditures.
Carnival Corporation & plc | page 39
Nonoperating (Expense) IncomeNet interest expense, excluding capitalized interest, was
$323 million in both 2006 and 2005. This flat interest expense was primarily due to lower average borrowings offsetting the impact of higher average interest rates on borrowings. Capitalized interest increased $16 million during 2006 com-pared to 2005 primarily due to higher average levels of invest-ment in ship construction projects and higher average interest rates on borrowings.
Other expense in 2006 included a $10 million expense for the write-down of a non-cruise investment.
Income TaxesIncome tax expense decreased by $33 million to $39 million
in 2006 from $72 million in 2005 primarily as a result of lower U.S. income taxes related to the MSC charter in 2006 com-pared to 2005, and the reversal in 2006 of previously recorded tax liabilities and deferred tax valuation allowances, which were no longer required based upon the results of tax authority audits and other factors.
Fiscal 2005 (“2005”) Compared to Fiscal 2004 (“2004”)
RevenuesNet cruise revenues increased $1.18 billion, or 15.8%, to
$8.68 billion in 2005 from $7.50 billion in 2004. The 8.5% increase in ALBDs between 2005 and 2004 accounted for $638 million of the increase, and the remaining $546 million was from increased net revenue yields, which increased 6.7% in 2005 compared to 2004 (gross revenue yields increased by 5.0%). Net revenue yields increased in 2005 primarily from higher cruise ticket prices, a 1.1% increase in occupancy and higher onboard revenues. Net revenue yields as measured on a constant dollar basis increased 6.4% in 2005. Gross cruise
revenues increased $1.31 billion, or 13.9%, in 2005 to $10.74 billion from $9.43 billion in 2004 for largely the same reasons as net cruise revenues.
Onboard and other revenues included concession revenues of $638 million in 2005 and $561 million in 2004. Onboard and other revenues increased in 2005 compared to 2004, pri-marily because of the 8.5% increase in ALBDs and increased passenger spending on our ships.
Other non-cruise revenues increased $63 million, or 15.8%, to $461 million in 2005 from $398 million in 2004 primarily due to the increase in the number of cruise/tours sold in Alaska.
Costs and ExpensesNet cruise costs increased $604 million, or 13.2%, to
$5.20 billion in 2005 from $4.59 billion in 2004. The 8.5% increase in ALBDs between 2004 and 2005 accounted for $391 million of the increase, and the remaining $213 million was from increased net cruise costs per ALBD, which increased 4.3% in 2005 compared to 2004 (gross cruise costs per ALBD increased 2.5%). Net cruise costs per ALBD increased primarily due to a $65 increase in fuel cost per metric ton, or 33.5%, to $259 per metric ton in 2005 and a $23 million MNOPF contribution (see Note 12 in the accom-panying financial statements). Net cruise costs per ALBD as measured on a constant dollar basis compared to 2004 increased 3.9% in 2005 and were flat excluding increased fuel prices and the MNOPF contribution, compared to 2004. Gross cruise costs increased $730 million, or 11.2%, in 2005 to $7.25 billion from $6.52 billion in 2004, which was a lower percentage increase than net cruise costs primarily because of the lower proportion of passengers who purchased air transportation from us in 2005.
page 40 | Carnival Corporation & plc
Other non-cruise operating expense increased $50 million, or 16.2%, to $358 million in 2005 from $308 million in 2004 primarily due to the increase in the number of cruise/tours sold in Alaska.
Depreciation and amortization expense increased by $90 million, or 11.1%, to $902 million in 2005 from $812 million in 2004 largely due to the 8.5% increase in ALBDs through the addition of new ships, and additional ship improvement expenditures.
Nonoperating (Expense) IncomeNet interest expense, excluding capitalized interest,
increased $31 million in 2005 to $323 million in 2005 from $292 million in 2004. This increase was primarily due to a $36 million increase in interest expense from higher average interest rates on borrowings and a weaker U.S. dollar, partially offset by a $5 million increase in interest income due to higher average invested fund balances.
Other expense in 2005 included a $22 million expense for the write-down of a non-cruise investment, partially offset by $7 million income from the settlement of litigation associated with the DLC transaction.
Income TaxesIncome tax expense increased by $25 million from 2004 to
$72 million in 2005 from $47 million in 2004 primarily because we recorded approximately $18 million for U.S. income taxes related to the MSC charter. Commencing in September 2005, these three ships were chartered for six months, and pursu-ant to our agreement with the MSC, the net earnings from the charter will be equal to the amount of net earnings we would have earned on these ships if we had not entered into this charter.
Liquidity and Capital Resources
Sources and Uses of CashOur business provided $3.63 billion of net cash from oper-
ations during fiscal 2006, an increase of $223 million, or 6.5%, compared to fiscal 2005. We continue to generate substantial cash from operations and remain in a strong financial position, thus providing us with substantial financial flexibility in meet-ing operating, investing and financing needs.
During fiscal 2006, our net expenditures for capital projects were $2.48 billion, of which $1.97 billion was spent for our ongoing new shipbuilding program, including $1.23 billion for the final delivery payments for Holland America Line’s Noordam, Princess Cruises’ Crown Princess and the Costa Concordia. In addition to our new shipbuilding program, we had capital expenditures of $335 million for ship improvements and refur-bishments and $176 million for Alaska tour assets, cruise port facility developments and information technology assets.
Our fiscal 2006 long-term debt borrowings were $2.24 billion, consisting of $904 million of euro-denominated long-term commercial paper, the issuance of a €750 million bond ($985 million U.S. dollars at the November 30, 2006 exchange rate) and $352 million under the Crown Princess debt financ-ing facility. Our fiscal 2006 long-term debt repayments were $2.54 billion, consisting of $1.46 billion of long-term euro commercial paper, $888 million of Costa’s indebtedness and $190 million of other long-term debt amounts. We also received proceeds from short-term borrowings of $661 million under our short-term commercial paper programs and short-term bank loans during fiscal 2006. Finally, during 2006, we purchased $841 million of Carnival Corporation common stock and Carnival plc ordinary shares in open market transactions and paid cash dividends of $803 million.
MANAGEMENT’S DISCUSSION AND ANALYSIS OF FINANCIAL CONDITION AND RESULTS OF OPERATIONS(continued)
Carnival Corporation & plc | page 41
Future Commitments and Funding SourcesAt November 30, 2006, our contractual cash obligations, including ship construction contracts entered into through January 2007,
and the effects such obligations are expected to have on our liquidity and cash flow in future periods were as follows (in millions):
Payments Due by Fiscal YearContractual Cash Obligations Total 2007 2008 2009 2010 2011 Thereafter
Recorded Contractual ObligationsLong-term debt(a) . . . . . . . . . . . . . . . . . . . . . . . . . . . . . . . . . . . . . . . . . . . $ 7,409 $ 1,054 $ 1,930 $ 202 $ 1,108 $ 202 $2,913Short-term borrowings(a) . . . . . . . . . . . . . . . . . . . . . . . . . . . . . . . . . . . . . . 438 438Other long-term liabilities reflected on the balance sheet(b) . . . . . . . . . . 495 29 79 62 47 40 238Unrecorded Contractual ObligationsShipbuilding(a) . . . . . . . . . . . . . . . . . . . . . . . . . . . . . . . . . . . . . . . . . . . . . . 9,898 2,653 2,514 2,426 1,688 617Port facilities and other(a) . . . . . . . . . . . . . . . . . . . . . . . . . . . . . . . . . . . . . 639 107 97 83 74 61 217Purchase obligations(c) . . . . . . . . . . . . . . . . . . . . . . . . . . . . . . . . . . . . . . . 643 571 43 24 3 1 1Operating leases(a) . . . . . . . . . . . . . . . . . . . . . . . . . . . . . . . . . . . . . . . . . . 350 40 36 34 31 29 180Fixed rate interest payments(d) . . . . . . . . . . . . . . . . . . . . . . . . . . . . . . . . . 1,700 217 192 169 165 158 799Variable rate interest payments(d) . . . . . . . . . . . . . . . . . . . . . . . . . . . . . . . 330 123 73 65 33 13 23
Total contractual cash obligations(e) . . . . . . . . . . . . . . . . . . . . . . . . . . . . . $ 21,902 $ 5,232 $ 4,964 $ 3,065 $ 3,149 $ 1,121 $4,371
(a) See Notes 5 and 6 in the accompanying financial statements for additional information regarding these contractual cash obligations.(b) Represents cash outflows for certain of our long-term liabilities that could be reasonably estimated. The primary outflows are for estimates of our employee benefit
plan obligations, crew and passenger claims, certain deferred income taxes, derivative contracts payable, and other long-term liabilities. Other long-term liabilities, such as deferred income, fair value of hedged commitments and certain deferred income taxes, have been excluded from the table as they do not require cash settlement in the future or the timing of the cash outflow cannot be reasonably estimated.
(c) Represents legally-binding commitments to purchase inventory and other goods and services made in the normal course of business to meet operational require-ments. Many of our contracts contain clauses that allow us to terminate the contract with notice, and with or without a termination penalty. Termination penalties are generally an amount less than the original obligation. Historically, we have not had any significant defaults of our contractual obligations or incurred significant penalties for termination of our contractual obligations.
(d) Fixed rate interest payments represent cash outflows for fixed interest payments, including interest swapped from a variable rate to a fixed rate. Variable rate interest payments represent forecasted cash outflows for interest payments on variable rate debt, including interest swapped from a fixed rate to a variable rate, using the November 30, 2006 forward interest rate curve for the terms of the loans.
(e) Foreign currency payments are based on the November 30, 2006 exchange rates.
page 42 | Carnival Corporation & plc
In June 2006, a $1 billion stock repurchase authorization was approved by the Boards of Directors subject to certain restrictions (“2006 Purchase Program”). This 2006 Purchase Program does not have an expiration date and may be discon-tinued by our Boards of Directors at any time. At February 9, 2007, the remaining availability pursuant to our 2006 Purchase Program was $773 million.
At November 30, 2006, we had liquidity of $5.60 billion, which consisted of $1.18 billion of cash, cash equivalents and short-term investments, $1.87 billion available for borrowing under our revolving credit facility and $2.55 billion under com-mitted ship financing facilities. Our revolving credit facility matures in 2011. A key to our access to liquidity is the main-tenance of our strong credit ratings.
Based primarily on our historical results, current financial condition and future forecasts, we believe that our existing liquidity and cash flow from future operations will be sufficient to fund most of our expected capital projects, debt service requirements, dividend payments, working capital and other firm commitments. In addition, based on our future forecasted operating results and cash flows for fiscal 2007, we expect to be in compliance with our debt covenants during 2007. How-ever, our forecasted cash flow from future operations, as well as our credit ratings, may be adversely affected by various factors including, but not limited to, those factors noted under “Cautionary Note Concerning Factors That May Affect Future Results.” To the extent that we are required, or choose, to fund future cash requirements, including our future shipbuilding commitments, from sources other than as discussed above, we believe that we will be able to secure such financing from banks or through the offering of debt and/or equity securities in the public or private markets. However, we cannot be cer-tain that our future operating cash flow will be sufficient to fund future obligations or that we will be able to obtain addi-tional financing, if necessary.
Off-Balance Sheet Arrangements
We are not a party to any off-balance sheet arrangements, including guarantee contracts, retained or contingent interests, certain derivative instruments and variable interest entities, that either have, or are reasonably likely to have, a current or future material effect on our financial statements.
Foreign Currency Exchange Rate Risks
Our growing international business operations are con-ducted primarily through AIDA in Germany, Costa in Southern Europe and China, P&O Cruises and Ocean Village in the UK and P&O Cruises Australia in Australia, which subject us to an increasing level of foreign currency exchange risk related to the euro, sterling and Australian dollar because these opera-tions have either the euro, sterling or Australian dollar as their functional currency. Accordingly, exchange rate fluctuations of the euro, sterling or Australian dollar against the U.S. dollar will affect our reported financial results since the reporting currency for our consolidated financial statements is the U.S. dollar and the functional currency for our international opera-tions is generally the local currency. Any weakening of the U.S. dollar against these local functional currencies has the financial statement effect of increasing the U.S. dollar values reported for cruise revenues and cruise expenses in our Consolidated Statements of Operations. Strengthening of the U.S. dollar has the opposite effect.
We seek to minimize the impact of fluctuations in foreign currency exchange rates through our normal operating and financing activities, including netting certain exposures to take advantage of any natural offsets and, when considered appro-priate, through the use of derivative financial instruments. The financial impacts of these hedging instruments are generally offset by corresponding changes in the underlying exposures being hedged. Our policy is to not use any financial instruments for trading or other speculative purposes.
MANAGEMENT’S DISCUSSION AND ANALYSIS OF FINANCIAL CONDITION AND RESULTS OF OPERATIONS(continued)
Carnival Corporation & plc | page 43
One of our primary foreign currency exchange rate risks is related to our outstanding commitments under ship con-struction contracts denominated in a currency other than the functional currency of the cruise brand that is expected to be operating the ship. These currency commitments are affected by fluctuations in the value of the functional currency as com-pared to the currency in which the shipbuilding contract is denominated. We use foreign currency swaps to manage foreign currency exchange rate risk from some of our ship construction contracts (see Notes 2, 6 and 10 in the accom-panying financial statements). Accordingly, increases and decreases in the fair value of these foreign currency swaps offset changes in the fair value of the foreign currency denom-inated ship construction commitments, thus resulting in the elimination of such risk.
Specifically, we have foreign currency swaps for two of our euro-denominated shipbuilding contracts. At November 30, 2006, the fair value of these foreign currency swaps was an unrealized loss of $26 million which is recorded, along with an offsetting $26 million fair value asset related to our shipbuild-ing firm commitments, on our accompanying 2006 balance sheet. Based upon a 10% strengthening or weakening of the sterling compared to the euro as of November 30, 2006, assuming no changes in comparative interest rates, the estimated fair value of these foreign currency swaps would decrease or increase by $96 million, which would be offset by a decrease or increase of $96 million in the U.S. dollar value of the related foreign currency ship construction com-mitments resulting in no net dollar impact to us.
However, at November 30, 2006, as adjusted for our ship orders through January 2007, we have six euro-denominated shipbuilding commitments aggregating €2.55 billion assigned to certain of our U.S. dollar or sterling functional currency operations, for which we have not entered into any foreign currency swaps. Therefore, the U.S. dollar cost of these ships
will increase or decrease based upon changes in the exchange rates until the payments are made under the shipbuilding con-tracts or we enter into foreign currency swaps. These euro commitments effectively act as an economic hedge against a portion of our net investment in euro and sterling-denominated cruise operations. Accordingly, any increase or decrease in our ship costs resulting from changes in the exchange rates will be offset by a corresponding change in the net assets of our euro and sterling-denominated cruise operations. Based upon a 10% hypothetical increase or decrease in the November 30, 2006 U.S. dollar and sterling to the euro foreign currency exchange rates, the cost of these ships would increase or decrease by $336 million. Decisions regarding whether or not to hedge a given ship commitment are made on a case-by-case basis, taking into consideration the amount and duration of the exposure, market volatility, and economic trends.
The cost of shipbuilding orders that we may place in the future for our cruise lines who generate their cash flows in a currency that is different than the shipyard’s operating currency, generally the euro, is expected to be affected by foreign currency exchange rate fluctuations. Given the decline in the U.S. dollar relative to the euro over the past several years, the U.S. dollar cost to order new cruise ships at current exchange rates has increased significantly. If the U.S. dollar remains at current levels or declines further, this may affect our ability to order future new cruise ships for U.S. dollar func-tional currency brands.
Finally, we consider our investments in foreign subsidiaries to be denominated in relatively stable currencies and of a long-term nature. In addition to the strategy discussed above, we also partially address these exposures by denominating a portion of our debt, or entering into foreign currency swaps, in our subsidiaries’ functional currencies (generally euros or sterling). Specifically, we have debt of $1.02 billion in euros and $419 million in sterling and have $1.25 billion of foreign
page 44 | Carnival Corporation & plc
MANAGEMENT’S DISCUSSION AND ANALYSIS OF FINANCIAL CONDITION AND RESULTS OF OPERATIONS(continued)
currency swaps, whereby we have converted $267 million of U.S. dollar debt into sterling debt, $842 million of U.S. dollar debt into euro debt and $143 million of euro debt into sterling debt, thus partially offsetting this foreign currency exchange rate risk. At November 30, 2006, the fair value of these foreign currency swaps was an unrealized loss of $169 million, which is recorded in AOCI and offsets a portion of the gains recorded in AOCI upon translating these foreign subsidiaries net assets into U.S. dollars. Based upon a 10% hypothetical increase or decrease in the November 30, 2006 foreign currency exchange rates, we estimate that these derivative contracts’ fair values would increase or decrease by $125 million, which would be offset by a decrease or increase of $125 million in the U.S. dollar value of our net investments.
Interest Rate Risks
We seek to minimize the impact of fluctuations in interest rates through our long-term investment and debt portfolio strategies, which include entering into a substantial amount of fixed rate debt instruments. We continuously evaluate our debt portfolio, and make periodic adjustments to the mix of floating rate and fixed rate debt based on our view of interest rate movements through the use of interest rate swaps. At both November 30, 2006 and 2005, 72% of the interest cost on our long-term debt was effectively fixed and 28% was variable, including the effect of our interest rate swaps.
Specifically, we have interest rate swaps at November 30, 2006, which effectively changed $932 million of fixed rate debt to libor-based floating rate debt. In addition, we have interest rate swaps at November 30, 2006 which effectively changed $365 million of libor-based floating rate debt to fixed rate debt. The fair value of our long-term debt and interest rate swaps at November 30, 2006 was $7.79 billion.
Based upon a hypothetical 10% decrease or increase in the November 30, 2006 market interest rates, the fair value of our long-term debt and interest rate swaps would increase or decrease by approximately $120 million and annual interest expense on our variable rate debt, including the effect of our interest rate swaps, would increase or decrease by approxi-mately $12 million.
In addition, based upon a hypothetical 10% decrease or increase in Carnival Corporation’s November 30, 2006 com-mon stock price, the fair value of our convertible notes would increase or decrease by approximately $145 million.
These hypothetical amounts are determined by considering the impact of the hypothetical interest rates and common stock price on our existing long-term debt and interest rate swaps. This analysis does not consider the effects of the changes in the level of overall economic activity that could exist in such environments or any relationships which may exist between interest rate and stock price movements. Furthermore, since substantially all of our fixed rate long-term debt cannot currently be called or prepaid and $365 million of our variable rate long-term debt is subject to interest rate swaps which effectively fix the interest rate, it is unlikely we would be able to take any significant steps in the short-term to mitigate our exposure in the event of a significant decrease in market interest rates.
Bunker Fuel Price Risks
We have typically not used financial instruments to hedge our exposure to the bunker fuel price market risk. We esti-mate that our fiscal 2007 fuel cost would increase or decrease by approximately $3 million for each $1 per metric ton increase or decrease in our average bunker fuel price.
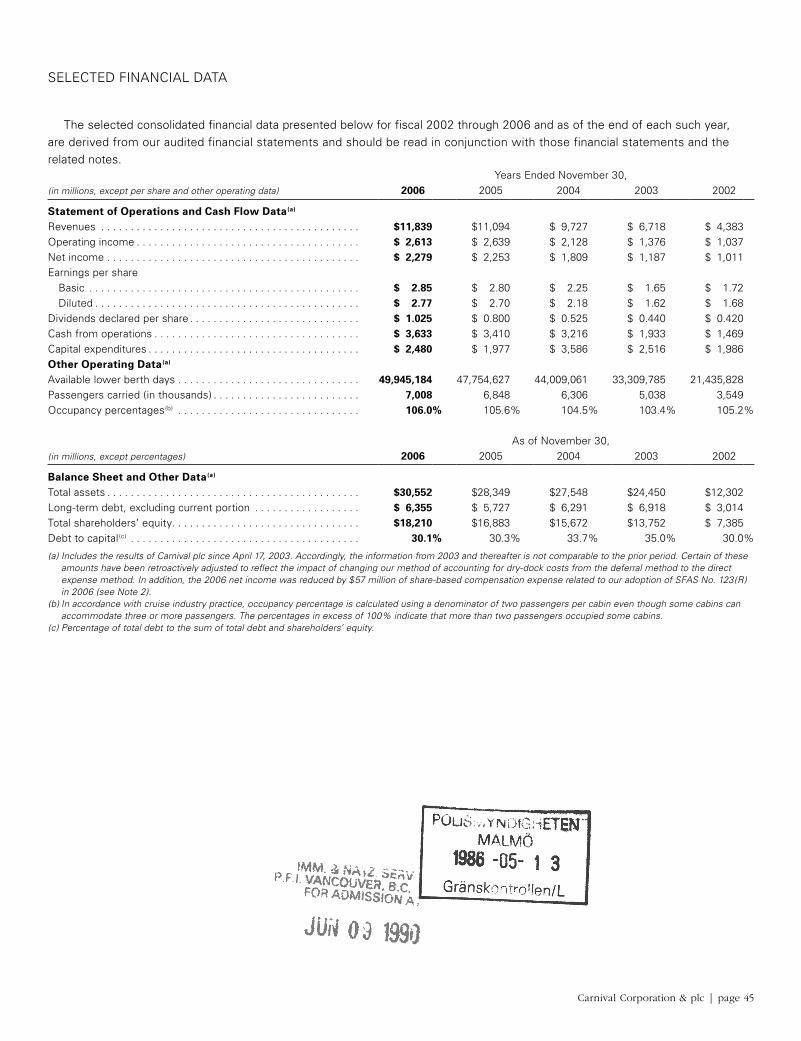
Carnival Corporation & plc | page 45
SELECTED FINANCIAL DATA
The selected consolidated financial data presented below for fiscal 2002 through 2006 and as of the end of each such year, are derived from our audited financial statements and should be read in conjunction with those financial statements and the related notes.
Years Ended November 30,(in millions, except per share and other operating data) 2006 2005 2004 2003 2002
Statement of Operations and Cash Flow Data(a)
Revenues . . . . . . . . . . . . . . . . . . . . . . . . . . . . . . . . . . . . . . . . . . . . $11,839 $11,094 $ 9,727 $ 6,718 $ 4,383Operating income . . . . . . . . . . . . . . . . . . . . . . . . . . . . . . . . . . . . . . $ 2,613 $ 2,639 $ 2,128 $ 1,376 $ 1,037Net income . . . . . . . . . . . . . . . . . . . . . . . . . . . . . . . . . . . . . . . . . . . $ 2,279 $ 2,253 $ 1,809 $ 1,187 $ 1,011Earnings per share Basic . . . . . . . . . . . . . . . . . . . . . . . . . . . . . . . . . . . . . . . . . . . . . . $ 2.85 $ 2.80 $ 2.25 $ 1.65 $ 1.72 Diluted . . . . . . . . . . . . . . . . . . . . . . . . . . . . . . . . . . . . . . . . . . . . . $ 2.77 $ 2.70 $ 2.18 $ 1.62 $ 1.68Dividends declared per share . . . . . . . . . . . . . . . . . . . . . . . . . . . . . $ 1.025 $ 0.800 $ 0.525 $ 0.440 $ 0.420Cash from operations . . . . . . . . . . . . . . . . . . . . . . . . . . . . . . . . . . . $ 3,633 $ 3,410 $ 3,216 $ 1,933 $ 1,469Capital expenditures . . . . . . . . . . . . . . . . . . . . . . . . . . . . . . . . . . . . $ 2,480 $ 1,977 $ 3,586 $ 2,516 $ 1,986Other Operating Data(a)
Available lower berth days . . . . . . . . . . . . . . . . . . . . . . . . . . . . . . . 49,945,184 47,754,627 44,009,061 33,309,785 21,435,828Passengers carried (in thousands) . . . . . . . . . . . . . . . . . . . . . . . . . 7,008 6,848 6,306 5,038 3,549Occupancy percentages(b) . . . . . . . . . . . . . . . . . . . . . . . . . . . . . . . 106.0% 105.6% 104.5% 103.4% 105.2%
As of November 30,(in millions, except percentages) 2006 2005 2004 2003 2002
Balance Sheet and Other Data(a)
Total assets . . . . . . . . . . . . . . . . . . . . . . . . . . . . . . . . . . . . . . . . . . . $30,552 $28,349 $27,548 $24,450 $12,302Long-term debt, excluding current portion . . . . . . . . . . . . . . . . . . $ 6,355 $ 5,727 $ 6,291 $ 6,918 $ 3,014Total shareholders’ equity . . . . . . . . . . . . . . . . . . . . . . . . . . . . . . . . $18,210 $16,883 $15,672 $13,752 $ 7,385Debt to capital(c) . . . . . . . . . . . . . . . . . . . . . . . . . . . . . . . . . . . . . . . 30.1% 30.3% 33.7% 35.0% 30.0%
(a) Includes the results of Carnival plc since April 17, 2003. Accordingly, the information from 2003 and thereafter is not comparable to the prior period. Certain of these amounts have been retroactively adjusted to reflect the impact of changing our method of accounting for dry-dock costs from the deferral method to the direct expense method. In addition, the 2006 net income was reduced by $57 million of share-based compensation expense related to our adoption of SFAS No. 123(R) in 2006 (see Note 2).
(b) In accordance with cruise industry practice, occupancy percentage is calculated using a denominator of two passengers per cabin even though some cabins can accommodate three or more passengers. The percentages in excess of 100% indicate that more than two passengers occupied some cabins.
(c) Percentage of total debt to the sum of total debt and shareholders’ equity.
page 46 | Carnival Corporation & plc
Carnival Corporation’s common stock, together with paired trust shares of beneficial interest in the P&O Princess Special Voting Trust (which holds a Special Voting Share of Carnival plc) is traded on the NYSE under the symbol “CCL.” Carnival plc’s ordinary shares trade on the London Stock Exchange under the symbol “CCL.” Carnival plc’s ADSs, each one of which represents one Carnival plc ordinary share, are traded on the NYSE under the symbol “CUK.” The depository for the ADSs is JPMorgan Chase Bank. The high and low stock sales price for the periods indicated was as follows:
Carnival plc
Carnival CorporationPrice per Ordinary
Share (GBP)Price per ADS
(USD)High Low High Low High Low
Fiscal 2006 Fourth Quarter . . . . . . . . . . . . . . . . . . . . . . . . . . . . . . . . . . . . . . . $50.99 $41.63 £26.68 £22.21 $50.78 $42.65 Third Quarter . . . . . . . . . . . . . . . . . . . . . . . . . . . . . . . . . . . . . . . . $42.14 $36.40 £23.34 £19.62 $43.49 $37.00 Second Quarter . . . . . . . . . . . . . . . . . . . . . . . . . . . . . . . . . . . . . . $52.16 $39.36 £31.57 £21.02 $55.64 $40.01 First Quarter . . . . . . . . . . . . . . . . . . . . . . . . . . . . . . . . . . . . . . . . $56.14 $50.81 £34.16 £30.85 $59.47 $54.40
Fiscal 2005 Fourth Quarter . . . . . . . . . . . . . . . . . . . . . . . . . . . . . . . . . . . . . . . $54.98 $45.78 £33.19 £26.60 $56.48 $47.32 Third Quarter . . . . . . . . . . . . . . . . . . . . . . . . . . . . . . . . . . . . . . . . $55.75 $48.76 £33.40 £28.31 $58.10 $51.46 Second Quarter . . . . . . . . . . . . . . . . . . . . . . . . . . . . . . . . . . . . . . $55.96 $46.76 £31.45 £25.90 $59.21 $50.02 First Quarter . . . . . . . . . . . . . . . . . . . . . . . . . . . . . . . . . . . . . . . . $58.98 $48.90 £32.69 £29.13 $62.17 $56.50
As of February 5, 2007, there were 3,769 holders of record of Carnival Corporation common stock and 43,702 holders of record of Carnival plc ordinary shares and 90 holders of record of Carnival plc ADSs. The past performance of our stock prices cannot be relied on as a guide to their future performance.
All dividends for both Carnival Corporation and Carnival plc are declared in U.S. dollars. Holders of Carnival Corporation common stock or Carnival plc ADSs receive a dividend payable in U.S. dollars. The dividends payable for Carnival plc ordinary shares are payable in sterling, unless the shareholders elect to receive the dividends in U.S. dollars. Dividends payable in sterling will be converted from U.S. dollars into sterling based upon a current U.S. dollar to sterling exchange rate announced prior to the dividend payment date.
MARKET PRICE FOR COMMON STOCK AND ORDINARY SHARES
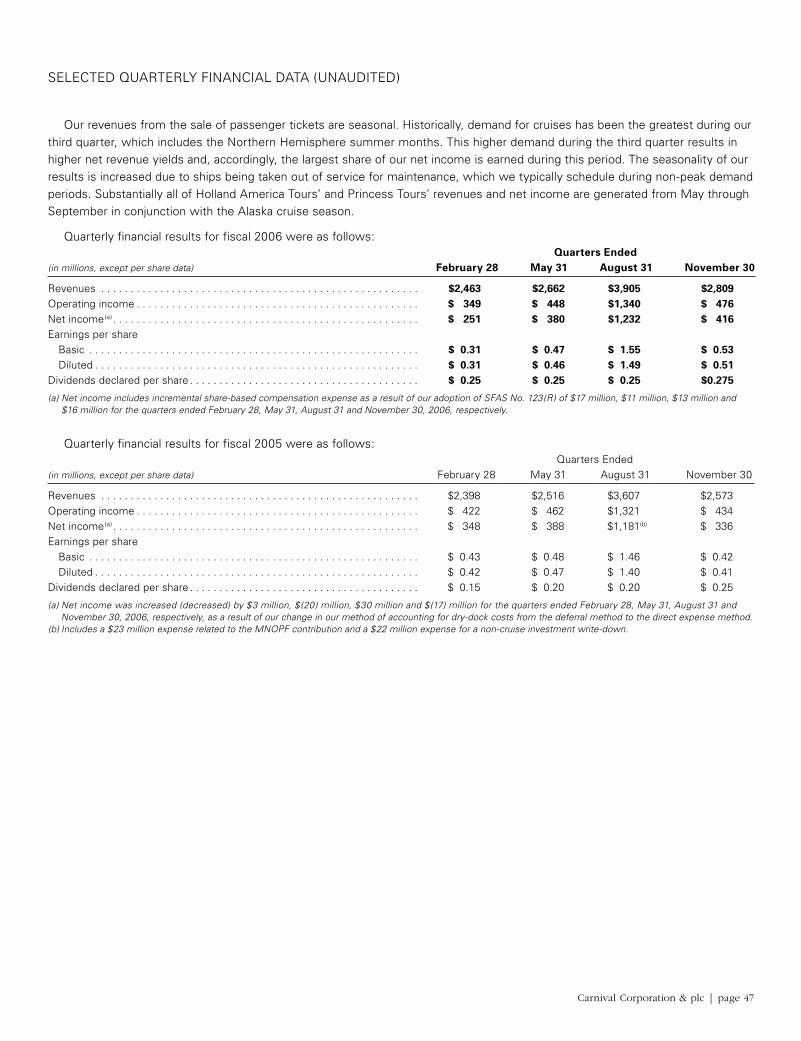
Carnival Corporation & plc | page 47
Our revenues from the sale of passenger tickets are seasonal. Historically, demand for cruises has been the greatest during our third quarter, which includes the Northern Hemisphere summer months. This higher demand during the third quarter results in higher net revenue yields and, accordingly, the largest share of our net income is earned during this period. The seasonality of our results is increased due to ships being taken out of service for maintenance, which we typically schedule during non-peak demand periods. Substantially all of Holland America Tours’ and Princess Tours’ revenues and net income are generated from May through September in conjunction with the Alaska cruise season.
Quarterly financial results for fiscal 2006 were as follows:Quarters Ended
(in millions, except per share data) February 28 May 31 August 31 November 30
Revenues . . . . . . . . . . . . . . . . . . . . . . . . . . . . . . . . . . . . . . . . . . . . . . . . . . . . . . $2,463 $2,662 $3,905 $2,809Operating income . . . . . . . . . . . . . . . . . . . . . . . . . . . . . . . . . . . . . . . . . . . . . . . . $ 349 $ 448 $1,340 $ 476Net income(a) . . . . . . . . . . . . . . . . . . . . . . . . . . . . . . . . . . . . . . . . . . . . . . . . . . . . $ 251 $ 380 $1,232 $ 416Earnings per share Basic . . . . . . . . . . . . . . . . . . . . . . . . . . . . . . . . . . . . . . . . . . . . . . . . . . . . . . . . $ 0.31 $ 0.47 $ 1.55 $ 0.53 Diluted . . . . . . . . . . . . . . . . . . . . . . . . . . . . . . . . . . . . . . . . . . . . . . . . . . . . . . . $ 0.31 $ 0.46 $ 1.49 $ 0.51Dividends declared per share . . . . . . . . . . . . . . . . . . . . . . . . . . . . . . . . . . . . . . . $ 0.25 $ 0.25 $ 0.25 $0.275
(a) Net income includes incremental share-based compensation expense as a result of our adoption of SFAS No. 123(R) of $17 million, $11 million, $13 million and $16 million for the quarters ended February 28, May 31, August 31 and November 30, 2006, respectively.
Quarterly financial results for fiscal 2005 were as follows:Quarters Ended
(in millions, except per share data) February 28 May 31 August 31 November 30
Revenues . . . . . . . . . . . . . . . . . . . . . . . . . . . . . . . . . . . . . . . . . . . . . . . . . . . . . . $2,398 $2,516 $3,607 $2,573Operating income . . . . . . . . . . . . . . . . . . . . . . . . . . . . . . . . . . . . . . . . . . . . . . . . $ 422 $ 462 $1,321 $ 434Net income(a) . . . . . . . . . . . . . . . . . . . . . . . . . . . . . . . . . . . . . . . . . . . . . . . . . . . . $ 348 $ 388 $1,181(b) $ 336Earnings per share Basic . . . . . . . . . . . . . . . . . . . . . . . . . . . . . . . . . . . . . . . . . . . . . . . . . . . . . . . . $ 0.43 $ 0.48 $ 1.46 $ 0.42 Diluted . . . . . . . . . . . . . . . . . . . . . . . . . . . . . . . . . . . . . . . . . . . . . . . . . . . . . . . $ 0.42 $ 0.47 $ 1.40 $ 0.41Dividends declared per share . . . . . . . . . . . . . . . . . . . . . . . . . . . . . . . . . . . . . . . $ 0.15 $ 0.20 $ 0.20 $ 0.25
(a) Net income was increased (decreased) by $3 million, $(20) million, $30 million and $(17) million for the quarters ended February 28, May 31, August 31 and November 30, 2006, respectively, as a result of our change in our method of accounting for dry-dock costs from the deferral method to the direct expense method.
(b) Includes a $23 million expense related to the MNOPF contribution and a $22 million expense for a non-cruise investment write-down.
SELECTED QUARTERLY FINANCIAL DATA (UNAUDITED)
page 48 | Carnival Corporation & plc
Carnival Corporation & plc
CORPORATE INFORMATION
EXECUTIVE OFF I C ERS
C A R N I VA L C O R P O R AT I O N & P L C
Micky ArisonChairman of the Board and Chief Executive Officer
Howard S. FrankVice Chairman of the Board and Chief Operating Officer
Gerald R. CahillExecutive Vice President and Chief Financial Officer
Arnaldo PerezSenior Vice President, General Counsel and Secretary
C A R N I VA L C R U I S E L I N E S
Robert H. DickinsonPresident and Chief Executive Officer
C O S TA C R O C I E R E , S .p . A .
Pier Luigi FoschiChairman and Chief Executive Officer
H O L L A N D A M E R I C A L I N E I N C .
Stein KrusePresident and Chief Executive Officer
P& O P R I N C E S S C R U I S E S I N T E R N AT I O N A L
Peter G. RatcliffeChief Executive Officer
OTHER SEN IOR EXECUTIVES
Richard D. AmesSenior Vice President Shared Services Carnival Corporation & plc
Alan B. BuckelewPresidentPrincess Cruises
Pamela C. ConoverPresident and Chief Executive OfficerSeabourn Cruise Line
David K. DingleManaging DirectorP&O Cruises
Ian J. GauntSenior Vice President InternationalCarnival Corporation & plc
Carol MarlowPresident and Managing DirectorCunard Line
Gianni OnoratoPresidentCosta Crociere, S.p.A.
Gavin SmithManaging DirectorP&O Cruises Australia
Michael ThammPresidentAIDA Cruises
1 Audit Committee 2 Compensation Committee 3 Executive Committee 4 Health, Environmental, Safety &
Security Committee5 Nominating & Governance Committee
BOARD OF D I R ECTORS
Micky Arison3
Chairman of the Board and Chief Executive Officer Carnival Corporation & plc
Richard G. Capen, Jr.1Former United States Ambassador to SpainCorporate Director, Author and Business Consultant
Robert H. DickinsonPresident and Chief Executive Officer Carnival Cruise Lines
Arnold W. Donald2 4
President and Chief Executive Officer Juvenile Diabetes Research Foundation International
Pier Luigi FoschiChairman and Chief Executive Officer Costa Crociere, S.p.A.
Howard S. Frank3
Vice Chairman of the Board and Chief Operating Officer Carnival Corporation & plc
Richard J. Glasier1 2
Former President and Chief Executive Officer Argosy Gaming Company
Baroness Sarah Hogg2 4
Chairman 3i Group plc and Frontier Economics Ltd.
A. Kirk LantermanChairman Emeritus Holland America Line Inc.
Modesto A. Maidique1
President Florida International University
Sir John Parker4 5
Chairman National Grid plc and The Peninsular and Oriental Steam Navigation Company
Peter G. RatcliffeChief Executive Officer P&O Princess Cruises International
Stuart Subotnick1 5
General Partner and Executive Vice President Metromedia Company
Laura Weil1
Former Chief Financial Officer and Executive Vice President American Eagle Outfitters, Inc.
Uzi Zucker3 5
Private Investor
DIRECTORS EMERITUS AND LIFE PRESIDENTS
Ted Arison (1924–1999)Chairman Emeritus, Carnival Corporation
Maks BirnbachDirector Emeritus, Carnival Corporation
Meshulam ZonisDirector Emeritus, Carnival Corporation
The Lord Sterling of Plaistow GCVO, CBELife President of P&O Cruises
Horst RaheLife President of AIDA Cruises
OTHER INFORMATION
Corporate HeadquartersCarnival Corporation Carnival Place 3655 N.W. 87th Avenue Miami, Florida 33178-2428 U.S.A. 305-599-2600
Registered OfficeCarnival plcCarnival House 5 Gainsford Street London SE1 2NE UK +44 20 7940 5381
Independent Registered Certified Public Accounting Firm PricewaterhouseCoopers LLP 1441 Brickell Avenue Suite 1100 Miami, Florida 33131-2330 U.S.A.
Registrars, Stock Transfer Agents andDividend Reinvestment Plan AdministratorsCarnival Corporation Computershare Investor Services P.O. Box 43078Providence, Rhode Island 02940-3078 U.S.A.800-568-3476
Carnival plcLloyds TSB RegistrarsThe Causeway, WorthingWest Sussex BN 99 6DA UK0870 609 4532 (UK) +44 121 415 7107 (Outside UK)
Legal CounselPaul, Weiss, Rifkind, Wharton & Garrison LLP 1285 Avenue of the Americas New York, New York 10019-6064 U.S.A.
Freshfields Bruckhaus Deringer 65 Fleet Street London EC4Y 1HS UK
Other Shareholder InformationCopies of our joint Annual Report on Form 10-K, joint Quarterly Reports on Form 10-Q, joint Current Reports on Form 8-K, Carnival plc Annual Accounts and all amendments to those reports, press releases, and other documents, as well as information on our cruise brands are available through our website at www.carnivalcorp.com and www.carnivalplc.com.
You may also obtain copies of this information by contacting our investor relations department at our corporate headquarters or registered office. Our chief executive, chief operating and chief financial and accounting officers have fur-nished the Sections 302 and 906 certifications required by the U.S. Securities and Exchange Commission in our joint Annual Report on Form 10-K. In addition, our chief executive officer has certified to the NYSE that he is not aware of any violation by us of NYSE corporate governance listing standards.

C A R N I VA L C O R P O R A T I O N & P L C
Carnival Place | 3655 N.W. 87th Avenue | Miami, Florida 33178-2428 | U.S.A. | www.carnivalcorp.comCarnival House | 5 Gainsford Street | London SE1 2NE | UK | www.carnivalplc.com