Embed Size (px)
Citation preview
Delivering sustainable solutions in a more competitive world
Capricorn Greenland Exploration - 1
Environmental Impact Assessment, Exploration Drilling Programme, Sigguk Block, Disko West, Greenland March 2010 www.erm.com
Environmental Resources Management Limited Incorporated in the United Kingdom with registration number 1014622 Registered Office: 2nd Floor, Exchequer Crt, 33 St Mary Axe, London, EC3A 8AA
Capricorn Greenland Exploration-1
Capricorn Sigguk Exploration Drilling EIA
March 2010
Reference 0108885
Prepared by: Jonathan Perry and Rachel Bright
This report has been prepared by Environmental Resources Management the trading name of Environmental Resources Management Limited, with all reasonable skill, care and diligence within the terms of the Contract with the client, incorporating our General Terms and Conditions of Business and taking account of the resources devoted to it by agreement with the client. We disclaim any responsibility to the client and others in respect of any matters outside the scope of the above. This report is confidential to the client and we accept no responsibility of whatsoever nature to third parties to whom this report, or any part thereof, is made known. Any such party relies on the report at their own risk.
For and on behalf of Environmental Resources Management Approved by: Dr Kevin Murphy
Signed: Position: Partner Date: 1 March 2010
CONTENTS
1 INTRODUCTION 1-1
1.1 BACKGROUND 1-1 1.2 SCOPE 1-1 1.3 PROPONENT 1-4 1.4 PROJECT SCHEDULE 1-4 1.5 EXPLORATION HISTORY – DISKO WEST 19720 TO 2005 1-4 1.6 SOURCES OF INFORMATION 1-7
2 POLICY, REGULATORY AND ADMINISTRATIVE FRAMEWORK 2-1
2.1 APPLICABILITY TO THE EIA AND SIA 2-1 2.2 NATIONAL LEGISLATIVE FRAMEWORK 2-1 2.3 INTERNATIONAL TREATIES AND CONVENTIONS 2-3 2.3.1 TRANSBOUNDARY AGREEMENTS 2-7 2.4 INTERNATIONAL GUIDELINES AND STANDARDS FOR THE EXPLORATION AND
PRODUCTION INDUSTRY 2-9
3 ASSESSMENT METHODOLOGY 3-1
3.1 INTRODUCTION AND OVERVIEW OF THE IMPACT ASSESSMENT PROCESS 3-1 3.2 SCREENING 3-1 3.3 SCOPING 3-2 3.4 BASELINE DATA COLLECTION 3-5 3.5 INTERFACE WITH PROJECT PLANNING AND DESIGN 3-6 3.6 ASSESSMENT OF IMPACTS 3-7 3.7 MANAGEMENT AND MONITORING 3-12 3.8 REPORTING AND NEXT STEPS 3-12
4 ENVIRONMENTAL SETTING 4-1
4.1 PHYSICAL ENVIRONMENT 4-1 4.2 BIOLOGICAL ENVIRONMENT 4-26 4.3 RESOURCE USE 4-62 4.4 SOCIO-ECONOMIC ENVIRONMENT 4-62 4.5 PROTECTED AREAS AND THREATENED SPECIES 4-63
5 PROJECT DESCRIPTION 5-1
5.1 PROJECT OVERVIEW 5-1 5.2 PROPOSED WELL LOCATIONS 5-3 5.3 PROPOSED PROJECT SCHEDULE 5-5 5.4 PROPOSED DRILL UNITS 5-5 5.5 RESERVOIR RESOURCES 5-10 5.6 RIG MOBILISATION 5-12
5.7 DRILLING AND WELL CONSTRUCTION 5-12 5.8 MUD AND CUTTINGS DISPOSAL 5-15 5.9 WELL CLEANING, TESTING AND COMPLETION 5-17 5.10 CHEMICALS 5-18 5.12 SUPPORT OPERATIONS 5-24 5.13 OTHER DEVELOPMENT OPTIONS 5-30
6 IMPACT ANALYSIS AND MITIGATION 6-1
6.1 INTRODUCTION 6-1 6.2 IMPACT IDENTIFICATION 6-2 6.3 IMPACTS FROM PLANNED EVENTS 6-4 6.4 IMPACTS FROM UNPLANNED EVENTS 6-26 6.5 ASSESSMENT OF IMPACTS - CONCLUSIONS 6-38
7 ENVIRONMENTAL MITIGATION AND MONITORING 7-1
7.1 INTRODUCTION 7-1 7.2 ENVIRONMENTAL MANAGEMENT 7-2 7.3 OPERATING PROCEDURES AND EMERGENCY RESPONSE 7-4 7.4 MONITORING AND REPORTING 7-6 7.5 ENVIRONMENTAL PROTECTION PLAN 7-8 7.6 SUMMARY 7-10 7.7 ENVIRONMENTAL STUDY PLAN 7-17
ENVIRONMENTAL RESOURCES MANAGEMENT CAPRICORN GREENLAND EXPLORATION-1
i
NON-TECHNICAL SUMMARY
INTRODUCTION
This is the Non Technical Summary of an Environmental Impact Assessment
(EIA) for an offshore multiple well exploration drilling programme (the
Project). The programme will be conducted within the Sigguk exclusive licence
2008/10 (Sigguk Licence) off west Greenland between June and October 2010,
with a two month contingency window over November and December in case
relief well drilling is required. The EIA has been produced by Environmental
Resources Management (ERM) on behalf of Capricorn Greenland Exploration-
1 Ltd (Capricorn), a subsidiary of Cairn Energy PLC (Cairn).
This EIA includes details related to the entire drilling programme as it is
important that the impacts associated with drilling individual wells are not
assessed in isolation, but considered as part of the wider drilling project.
Detailed environmental survey data is only included for the first two wells of
this programme (Alpha and T8) and this EIA is therefore only intended to
accompany the drilling application for these two wells. Further revisions of
the EIA which include the results of environmental surveys for subsequent
wells will therefore be produced for any drilling application beyond the first
two wells.
The EIA has been undertaken in accordance with applicable Greenland
legislation and standards, international guidance and the corporate policies
and expectations of Cairn.
EIA Standards and Permitting
The regulatory framework for offshore oil and gas activities in Greenland is
currently being revised. The Bureau of Minerals and Petroleum (BMP) is the
main implementing agency for laws relating to hydrocarbon exploration, and
has been consulted throughout this EIA process.
Scope
As well as the EIA, a separate Social Impact Assessments (SIA) has been
produced for the Project by ERM on behalf of Capricorn. Social, economic and
health factors are therefore excluded from the EIA and covered by the SIA.
In preparing this EIA, a range of existing information sources and new studies
have been used. A comprehensive literature review has been conducted using
reports prepared by environmental organisations from Greenland and
Denmark, as well as information sourced during internet research and the
results of computer modelling and simulations. Field surveys have been
conducted to investigate the physical, chemical and biological environment

ENVIRONMENTAL RESOURCES MANAGEMENT CAPRICORN GREENLAND EXPLORATION-1
ii
and studies have been undertaken on weather patterns, ice movements and
currents.
The geographical scope of the EIA includes the Sigguk Licence (also referred to
as the Sigguk Block or the Licence Area) together with the wider marine and
coastal environment where relevant to the potential impacts of the Project.
The focus of the EIA is on the locations within the Sigguk Licence where the
exploration wells are to be drilled (see Figure 1 below).
Figure 1 Sigguk Exclusive Licence 2008/10 Off West Greenland
Proponent and EIA Practitioner
Capricorn Greenland Exploration-1 is a subsidiary of Cairn Energy PLC based
in Edinburgh, UK. Cairn is an independent, public oil and gas exploration
and production company quoted on the London Stock Exchange.
ENVIRONMENTAL RESOURCES MANAGEMENT CAPRICORN GREENLAND EXPLORATION-1
iii
ERM is a leading global provider of environmental, health and safety, risk,
and social consulting services, with 137 offices in 39 countries employing
approximately 3,300 staff. ERM is a corporate member of the Institute of
Environmental Management and Assessment (IEMA) and has worldwide
expertise in environmental and social impact assessment for offshore oil and
gas projects, including operations in Arctic waters.
ASSESSMENT METHODOLOGY
Overview of the Impact Assessment Process
This EIA has been undertaken following a systematic process that predicts
and evaluates the probable impacts of the Project on aspects of the physical
and biological environments; it identifies measures to mitigate adverse
impacts, and to provide benefits, as far as is reasonably practicable.
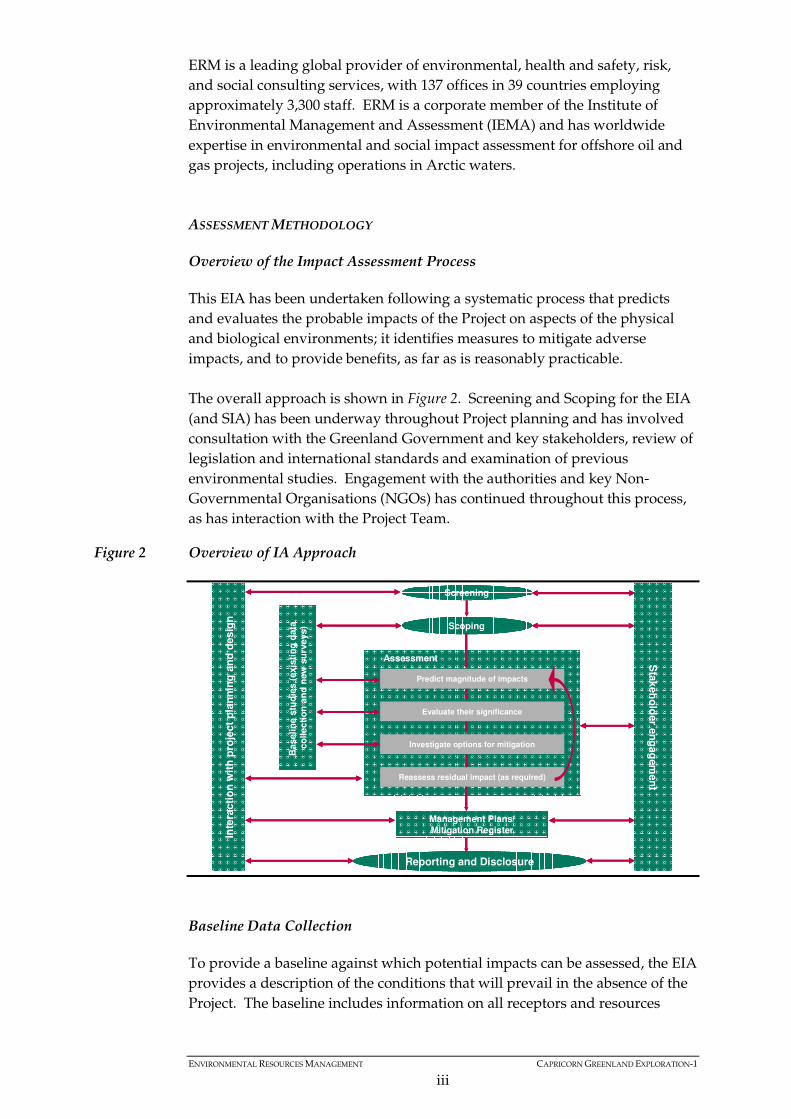
The overall approach is shown in Figure 2. Screening and Scoping for the EIA
(and SIA) has been underway throughout Project planning and has involved
consultation with the Greenland Government and key stakeholders, review of
legislation and international standards and examination of previous
environmental studies. Engagement with the authorities and key Non-
Governmental Organisations (NGOs) has continued throughout this process,
as has interaction with the Project Team.
Figure 2 Overview of IA Approach
Baseline Data Collection
To provide a baseline against which potential impacts can be assessed, the EIA
provides a description of the conditions that will prevail in the absence of the
Project. The baseline includes information on all receptors and resources
Screening
Scoping
Sta
keh
old
er e
ng
ag
em
en
t
Inte
racti
on
wit
h p
roje
ct
pla
nn
ing
an
d d
esig
n
Baseli
ne s
tud
ies (
exis
tin
g d
ata
co
lle
cti
on
an
d n
ew
su
rveys)
Predict magnitude of impacts
Evaluate their significance
Investigate options for mitigation
Reassess residual impact (as required)
Assessment
Management Plans/
Mitigation Register
Reporting and Disclosure
ENVIRONMENTAL RESOURCES MANAGEMENT CAPRICORN GREENLAND EXPLORATION-1
iv
identified as having the potential to be significantly affected by the proposed
Project. For this IA, baseline data collection proceeded in several stages:
• Collection of available data from existing sources including:
o government agencies;
o research and academic organisations;
o published sources;
o external stakeholders and the public; and
o previous offshore exploration Preliminary EIAs held by the client.
• Environmental and geophysical surveys of the well site locations to inform
the physical and biological components of the baseline, including physical,
chemical and biological analysis of samples taken.
• In-country information gathering and stakeholder interviews to inform oil
spill sensitivity mapping and socio-economic baseline for the SIA.
Assessment of Impacts
The assessment describes what will happen by predicting and quantifying as
far as possible the magnitude of impacts. The term ‘magnitude’ is used as
shorthand to encompass all the dimensions of the predicted impact including:
• the nature of the change (what is affected and how);
• its size, scale or intensity;
• its geographical extent and distribution;
• its duration, frequency, reversibility, etc; and
• where relevant, the probability of the impact occurring.
Magnitude also includes any uncertainty about the occurrence or scale of the
impact. An overall grading is provided to determine whether an impact is of
negligible, small, medium or large magnitude.
The next step in the assessment process is to explain what the magnitude of an
impact means in terms of its importance to people and the environment. This
is referred to as Evaluation of Significance. Criteria for assessing the
significance of impacts are clearly defined and take into account whether the
Project will:
• Cause legal or accepted environmental standards to be exceeded, or make
a substantial contribution to the likelihood of a standard being exceeded.
• Adversely affect protected areas or valuable resources, conservation areas,
rare or protected species, protected landscapes, historic features.
• Conflict with established government policy, for example to reduce CO2
emissions or recycle waste.
ENVIRONMENTAL RESOURCES MANAGEMENT CAPRICORN GREENLAND EXPLORATION-1
v
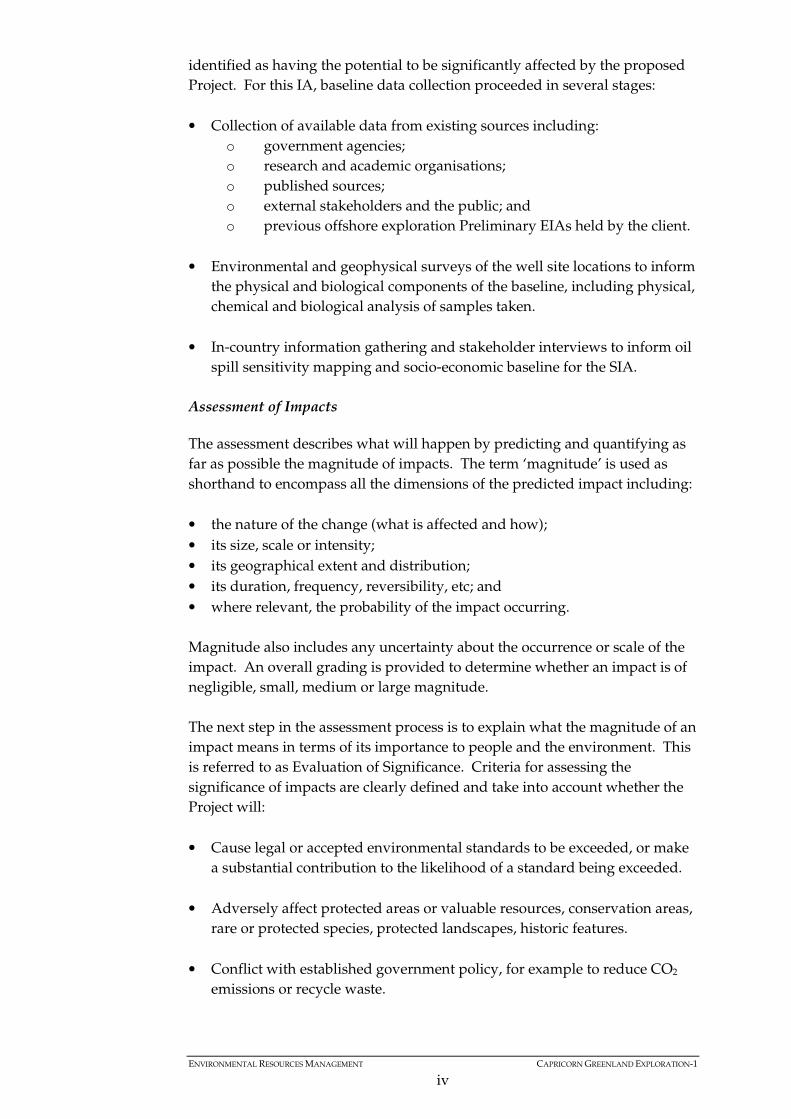
Magnitude and sensitivity are looked at in combination to evaluate whether
an impact is significant and if so its degree of significance (see Figure 3).
Figure 3 Evaluation of Significance
Mitigation and Residual Impacts
Where the assessment results in significant impacts, methods for practical and
affordable mitigation are identified. These measures have been agreed with
the Project proponent and integrated into the Project design. Following
agreement on feasible mitigation, impacts are re-assessed taking into account
the mitigation measures now integrated into the Project. Where an impact
could not be completely avoided the residual impact has been reassessed and
the possibility for further mitigation considered.
ENVIRONMENTAL SETTING
Physical Environment
Climate
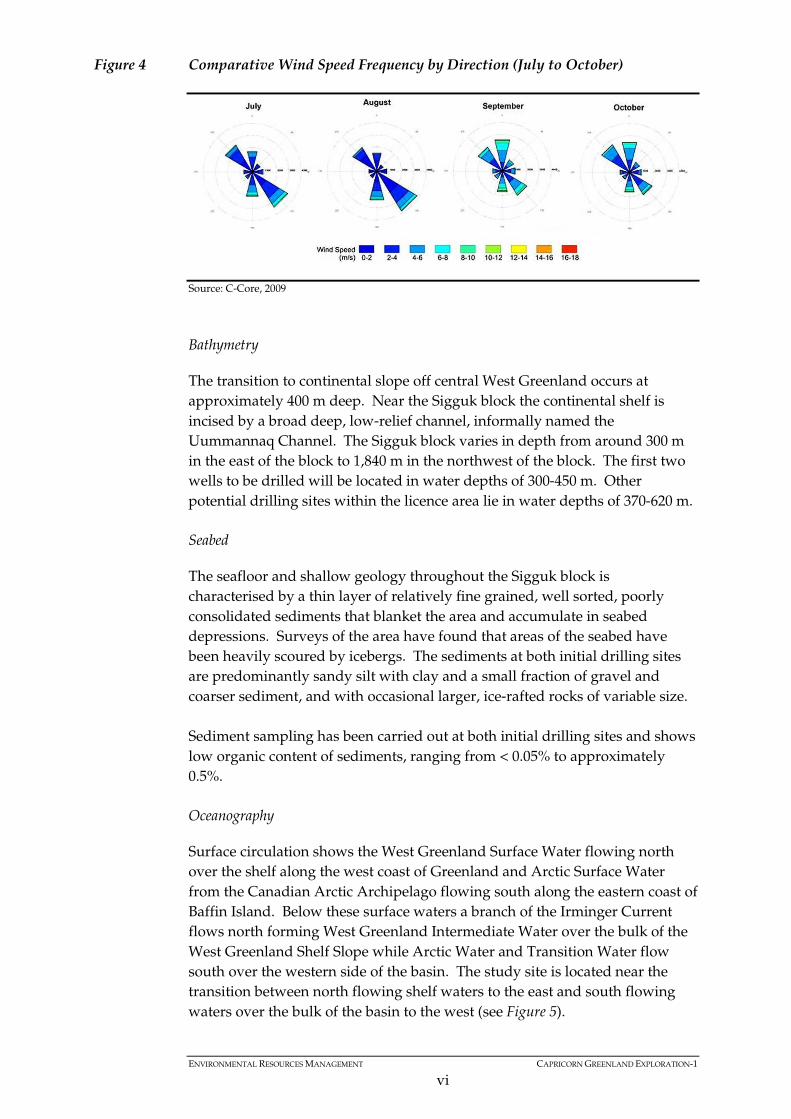
The mean monthly air temperatures for sampling sites to the north and south
of the block varied from a minimum of -21.96 °C to the north of Sigguk and a
maximum of 13.15 °C to the south of Sigguk. Average precipitation at the
nearest towns of Aasiaat and Sisimiut varied from 16 mm at Aasiaat in
January and February to 52 mm at Sisimiut in August. Wind speeds at the
Alpha wellsite location varied between an average of 2.9 m/s in July and
6.17 m/s in October (see Figure 4).
Magnitude of Impact
Va
lue
/Se
nsiti
vity
of
Reso
urc
e/R
ece
pto
r
Small Medium Large
Hig
hM
ediu
m
Low
Not Significant
Minor
Moderate
Major
ENVIRONMENTAL RESOURCES MANAGEMENT CAPRICORN GREENLAND EXPLORATION-1
vi
Figure 4 Comparative Wind Speed Frequency by Direction (July to October)
Source: C-Core, 2009
Bathymetry
The transition to continental slope off central West Greenland occurs at
approximately 400 m deep. Near the Sigguk block the continental shelf is
incised by a broad deep, low-relief channel, informally named the
Uummannaq Channel. The Sigguk block varies in depth from around 300 m
in the east of the block to 1,840 m in the northwest of the block. The first two
wells to be drilled will be located in water depths of 300-450 m. Other
potential drilling sites within the licence area lie in water depths of 370-620 m.
Seabed
The seafloor and shallow geology throughout the Sigguk block is
characterised by a thin layer of relatively fine grained, well sorted, poorly
consolidated sediments that blanket the area and accumulate in seabed
depressions. Surveys of the area have found that areas of the seabed have
been heavily scoured by icebergs. The sediments at both initial drilling sites
are predominantly sandy silt with clay and a small fraction of gravel and
coarser sediment, and with occasional larger, ice-rafted rocks of variable size.
Sediment sampling has been carried out at both initial drilling sites and shows
low organic content of sediments, ranging from < 0.05% to approximately
0.5%.
Oceanography
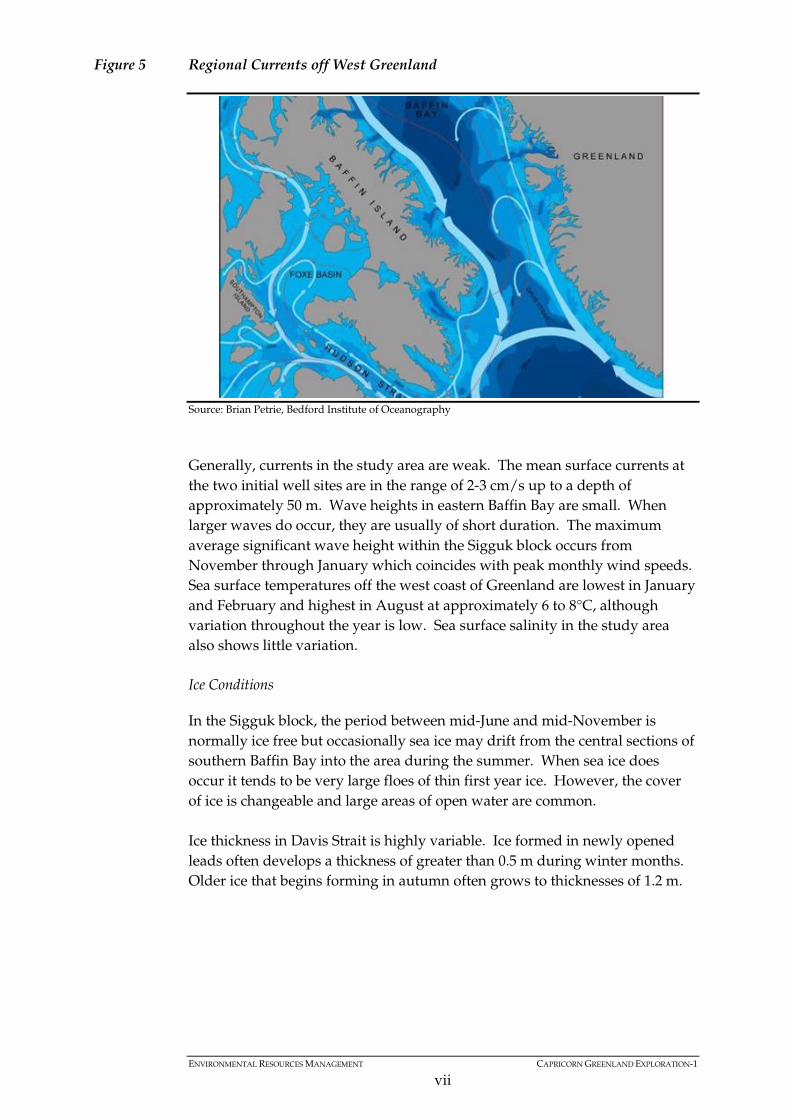
Surface circulation shows the West Greenland Surface Water flowing north
over the shelf along the west coast of Greenland and Arctic Surface Water
from the Canadian Arctic Archipelago flowing south along the eastern coast of
Baffin Island. Below these surface waters a branch of the Irminger Current
flows north forming West Greenland Intermediate Water over the bulk of the
West Greenland Shelf Slope while Arctic Water and Transition Water flow
south over the western side of the basin. The study site is located near the
transition between north flowing shelf waters to the east and south flowing
waters over the bulk of the basin to the west (see Figure 5).
ENVIRONMENTAL RESOURCES MANAGEMENT CAPRICORN GREENLAND EXPLORATION-1
vii
Figure 5 Regional Currents off West Greenland
Source: Brian Petrie, Bedford Institute of Oceanography
Generally, currents in the study area are weak. The mean surface currents at
the two initial well sites are in the range of 2-3 cm/s up to a depth of
approximately 50 m. Wave heights in eastern Baffin Bay are small. When
larger waves do occur, they are usually of short duration. The maximum
average significant wave height within the Sigguk block occurs from
November through January which coincides with peak monthly wind speeds.
Sea surface temperatures off the west coast of Greenland are lowest in January
and February and highest in August at approximately 6 to 8°C, although
variation throughout the year is low. Sea surface salinity in the study area
also shows little variation.
Ice Conditions
In the Sigguk block, the period between mid-June and mid-November is
normally ice free but occasionally sea ice may drift from the central sections of
southern Baffin Bay into the area during the summer. When sea ice does
occur it tends to be very large floes of thin first year ice. However, the cover
of ice is changeable and large areas of open water are common.
Ice thickness in Davis Strait is highly variable. Ice formed in newly opened
leads often develops a thickness of greater than 0.5 m during winter months.
Older ice that begins forming in autumn often grows to thicknesses of 1.2 m.
ENVIRONMENTAL RESOURCES MANAGEMENT CAPRICORN GREENLAND EXPLORATION-1
viii
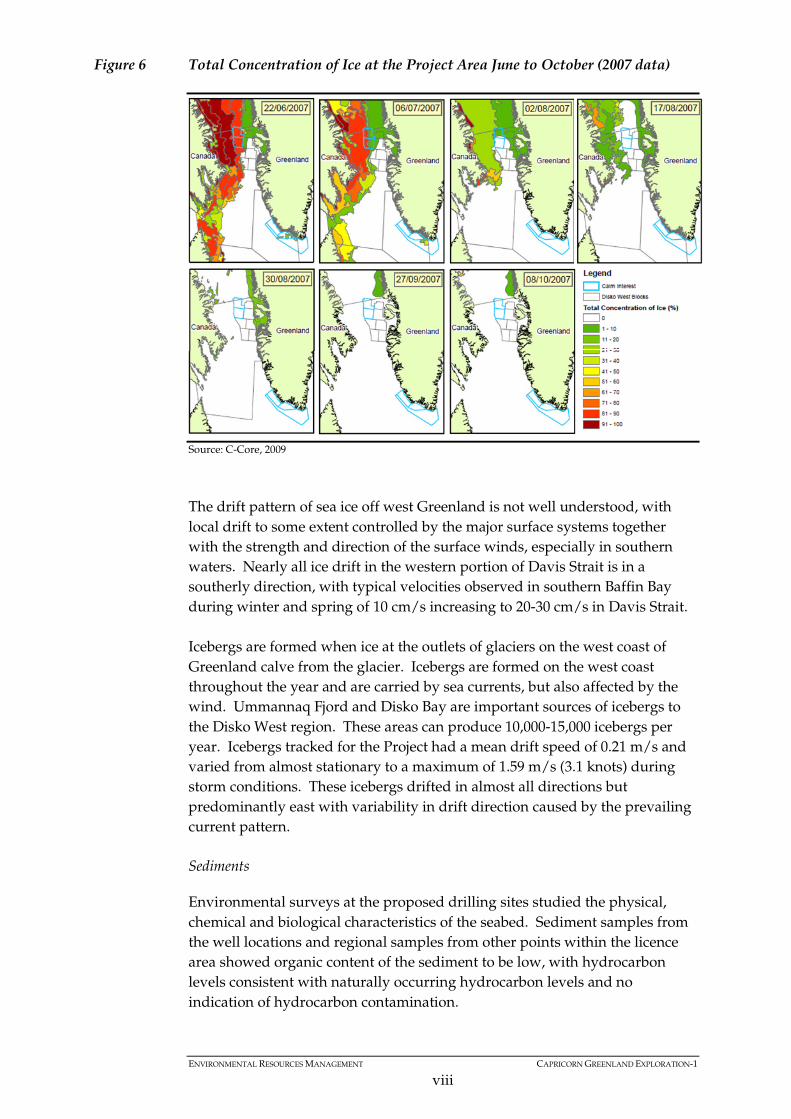
Figure 6 Total Concentration of Ice at the Project Area June to October (2007 data)
Source: C-Core, 2009
The drift pattern of sea ice off west Greenland is not well understood, with
local drift to some extent controlled by the major surface systems together
with the strength and direction of the surface winds, especially in southern
waters. Nearly all ice drift in the western portion of Davis Strait is in a
southerly direction, with typical velocities observed in southern Baffin Bay
during winter and spring of 10 cm/s increasing to 20-30 cm/s in Davis Strait.
Icebergs are formed when ice at the outlets of glaciers on the west coast of
Greenland calve from the glacier. Icebergs are formed on the west coast
throughout the year and are carried by sea currents, but also affected by the
wind. Ummannaq Fjord and Disko Bay are important sources of icebergs to
the Disko West region. These areas can produce 10,000-15,000 icebergs per
year. Icebergs tracked for the Project had a mean drift speed of 0.21 m/s and
varied from almost stationary to a maximum of 1.59 m/s (3.1 knots) during
storm conditions. These icebergs drifted in almost all directions but
predominantly east with variability in drift direction caused by the prevailing
current pattern.
Sediments
Environmental surveys at the proposed drilling sites studied the physical,
chemical and biological characteristics of the seabed. Sediment samples from
the well locations and regional samples from other points within the licence
area showed organic content of the sediment to be low, with hydrocarbon
levels consistent with naturally occurring hydrocarbon levels and no
indication of hydrocarbon contamination.
ENVIRONMENTAL RESOURCES MANAGEMENT CAPRICORN GREENLAND EXPLORATION-1
ix
Biological Environment
Primary Production
Primary production (organic matter produced by photosynthesis eg
phytoplankton or algae) off western Greenland is high, although the
important spring bloom usually starts in late April and develops throughout
May, therefore coming before the planned operations. Most primary
production occurs close to the coast and in fjords, with high levels of primary
production also occurring at marginal ice zones.
Zooplankton
Various types of zooplankton (eg shrimp, crustaceans) are present in the
waters off west Greenland and form a key food source for many other species
in this area such as fish, whales and seabirds. More than 85% of the
zooplankton present are crustaceans. The most common are Calanus
copepods which have been found in high numbers over the fishing banks and
deeper waters of Disko Bay.
Invertebrates
Benthic communities are an important ecosystem component on the West
Greenland continental shelf in Baffin Bay, although relative importance
decreases with increasing depth and distance from shore. The benthic
communities found at the two initial wellsite locations were very similar as
they have similar seabed substrates (ice modified silty sediments). No
protected or particularly sensitive habitats were found (eg coral reefs).
Species abundance was comparable or higher than other studies in western
Baffin Bay or southern Davis Strait but was lower for comparable depth
ranges and had similar abundances to those studies conducted in deeper
waters. The diversity of benthic animals was also lower than the southern
Davis Strait.
Fish
The waters around Greenland contain approximately 250 species of fish. Of
these, 18 species of particular importance or common off West Greenland have
been described in the EIA baseline. Thorny skate and Atlantic cod have been
assessed to be Vulnerable on the IUCN Red List, the Greenland shark has been
assessed to be Near Threatened and all other species are of Least Concern.
Most fish will spawn inshore, away from the exploration block, or at other
times of the year when drilling will not take place. The only species that may
spawn in the shallow areas of the block in June is herring.
Seabirds
Within Greenland there are 58 established breeding species of seabird, with a
further 17 species which are regular summer visitors. Due to the harsh
climate very few species overwinter in Greenland, although a number of
ENVIRONMENTAL RESOURCES MANAGEMENT CAPRICORN GREENLAND EXPLORATION-1
x
seabirds winter off the coast around the edge of the fast coastal ice. Seabirds
also aggregate in colonies along the coastline and up to 84% of all colonies in
Greenland are on the west coast. There are 14 species of seabird known to
breed in colonies that are found in the vicinity of the Sigguk block.
Some species of seabird moult their feathers whilst at sea and can form large
rafts of birds. These birds include common eider, king eider, Brünnich’s
guillemot and little auk. During this time they are unable to fly but are still
able to swim at some speed.
Marine Mammals
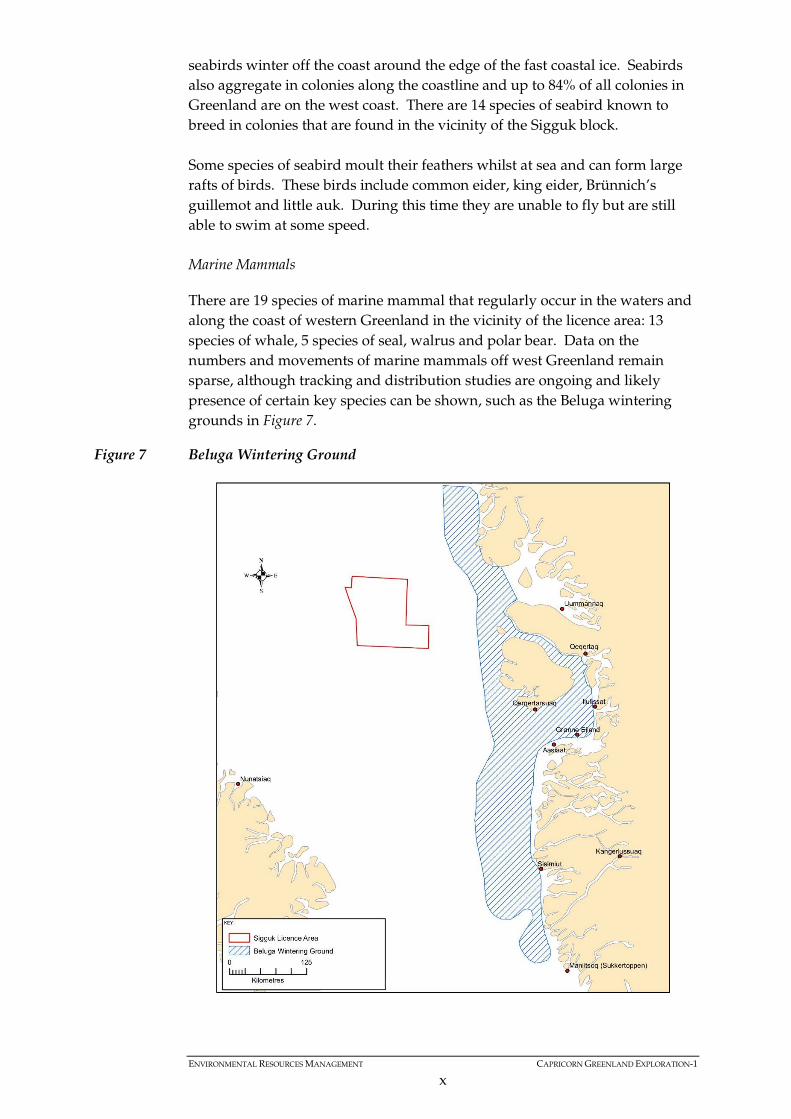
There are 19 species of marine mammal that regularly occur in the waters and
along the coast of western Greenland in the vicinity of the licence area: 13
species of whale, 5 species of seal, walrus and polar bear. Data on the
numbers and movements of marine mammals off west Greenland remain
sparse, although tracking and distribution studies are ongoing and likely
presence of certain key species can be shown, such as the Beluga wintering
grounds in Figure 7.
Figure 7 Beluga Wintering Ground
ENVIRONMENTAL RESOURCES MANAGEMENT CAPRICORN GREENLAND EXPLORATION-1
xi
Protected Areas and Threatened Species
Fin and blue whale are listed as Endangered on the IUCN Red List. Beluga
and narwhal are listed as Critically Endangered and bowhead whale is listed
as Near Threatened on Greenland’s Red List. All five seal species are listed as
Least Concern or Vulnerable on the IUCN Red List. The harbour seal is listed
as Critically Endangered on Greenland’s Red List. Walrus is listed as
Endangered on the IUCN Red List and polar bears as Vulnerable on both the
IUCN and Greenland Red List.
Atlantic cod and Thorny skate appear as ‘Vulnerable’ on the IUCN red list,
with Greenland shark listed as ‘Near Threatened’. A number of other species
are placed in the category of ’Least Concern’, including Arctic skate, three-
spined stickleback, Atlantic salmon, Arctic char and common grenadier.
The ivory gull is listed as Near Threatened on the IUCN list, with other
species listed as being of Least Concern. This differs from Greenland’s red list,
which lists the common eider, thick-billed murre and ivory gull as Vulnerable;
the Arctic tern, Atlantic puffin and Sabine’s gull as Near Threatened; and the
black-legged kittiwake is listed as Endangered.
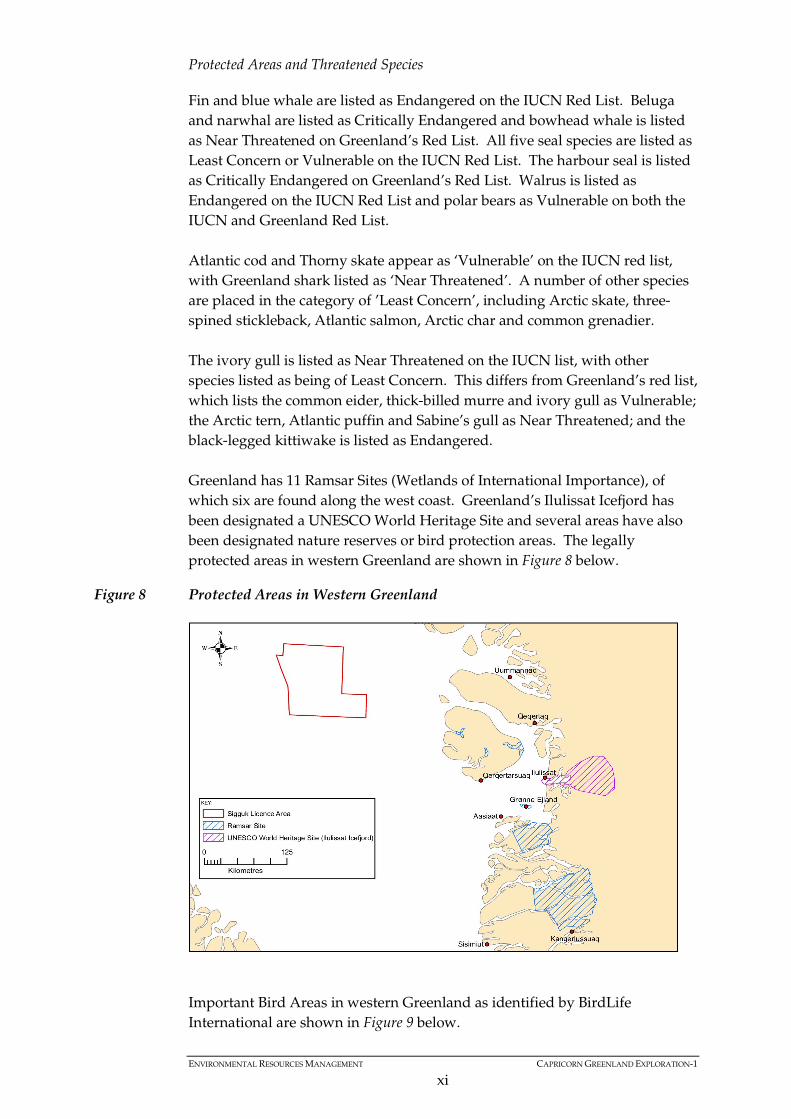
Greenland has 11 Ramsar Sites (Wetlands of International Importance), of
which six are found along the west coast. Greenland’s Ilulissat Icefjord has
been designated a UNESCO World Heritage Site and several areas have also
been designated nature reserves or bird protection areas. The legally
protected areas in western Greenland are shown in Figure 8 below.
Figure 8 Protected Areas in Western Greenland
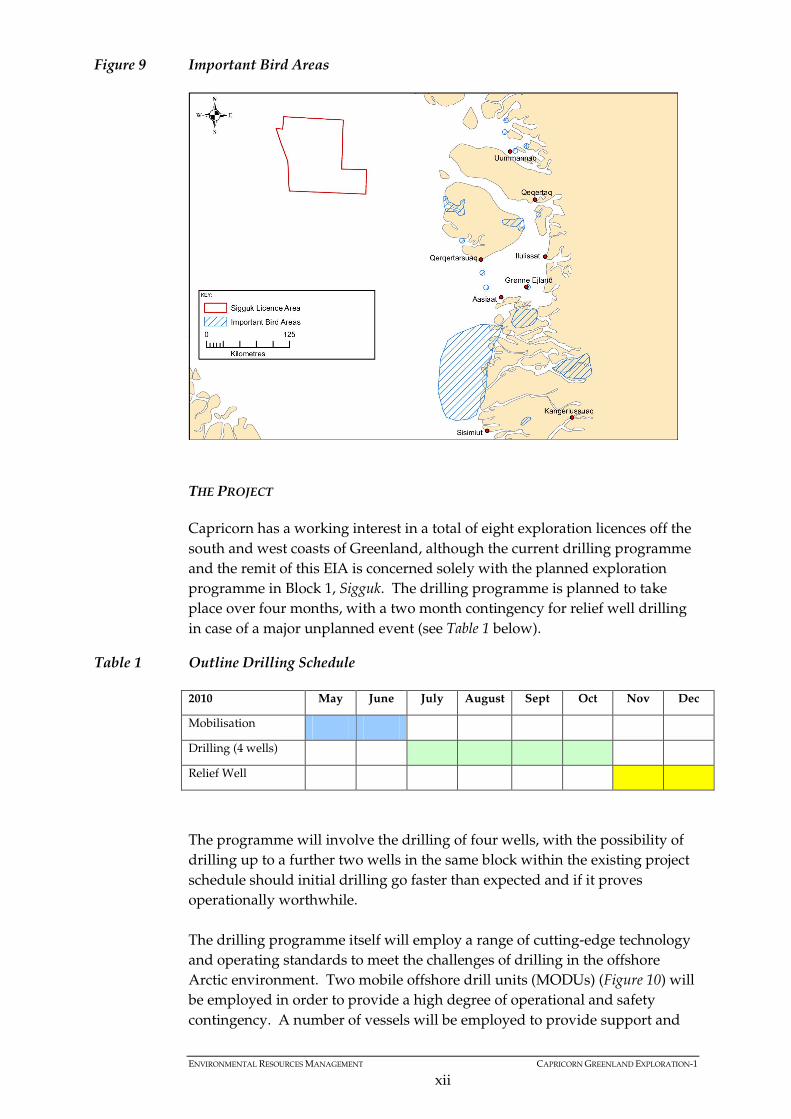
Important Bird Areas in western Greenland as identified by BirdLife
International are shown in Figure 9 below.
ENVIRONMENTAL RESOURCES MANAGEMENT CAPRICORN GREENLAND EXPLORATION-1
xii
Figure 9 Important Bird Areas
THE PROJECT
Capricorn has a working interest in a total of eight exploration licences off the
south and west coasts of Greenland, although the current drilling programme
and the remit of this EIA is concerned solely with the planned exploration
programme in Block 1, Sigguk. The drilling programme is planned to take
place over four months, with a two month contingency for relief well drilling
in case of a major unplanned event (see Table 1 below).
Table 1 Outline Drilling Schedule
2010 May June July August Sept Oct Nov Dec
Mobilisation
Drilling (4 wells)
Relief Well
The programme will involve the drilling of four wells, with the possibility of
drilling up to a further two wells in the same block within the existing project
schedule should initial drilling go faster than expected and if it proves
operationally worthwhile.
The drilling programme itself will employ a range of cutting-edge technology
and operating standards to meet the challenges of drilling in the offshore
Arctic environment. Two mobile offshore drill units (MODUs) (Figure 10) will
be employed in order to provide a high degree of operational and safety
contingency. A number of vessels will be employed to provide support and
ENVIRONMENTAL RESOURCES MANAGEMENT CAPRICORN GREENLAND EXPLORATION-1
xiii
emergency cover for the operations, including supply boats, support vessels
and ice breakers. A ‘wareship’ will provide offshore storage and contingency
accommodation, with helicopters and fixed wing aircraft used to transfer
personnel to and from the field area, the support facilities and the
international airport at Kangerlussuaq. Existing onshore facilities at Nuuk,
Aasiaat, Sisimiut and Ilulissat will be utilised for material lay down, helicopter
operating base, handling of some wastes, supply of fuel, water and materials
and limited onshore accommodation for up to 12 project personnel.
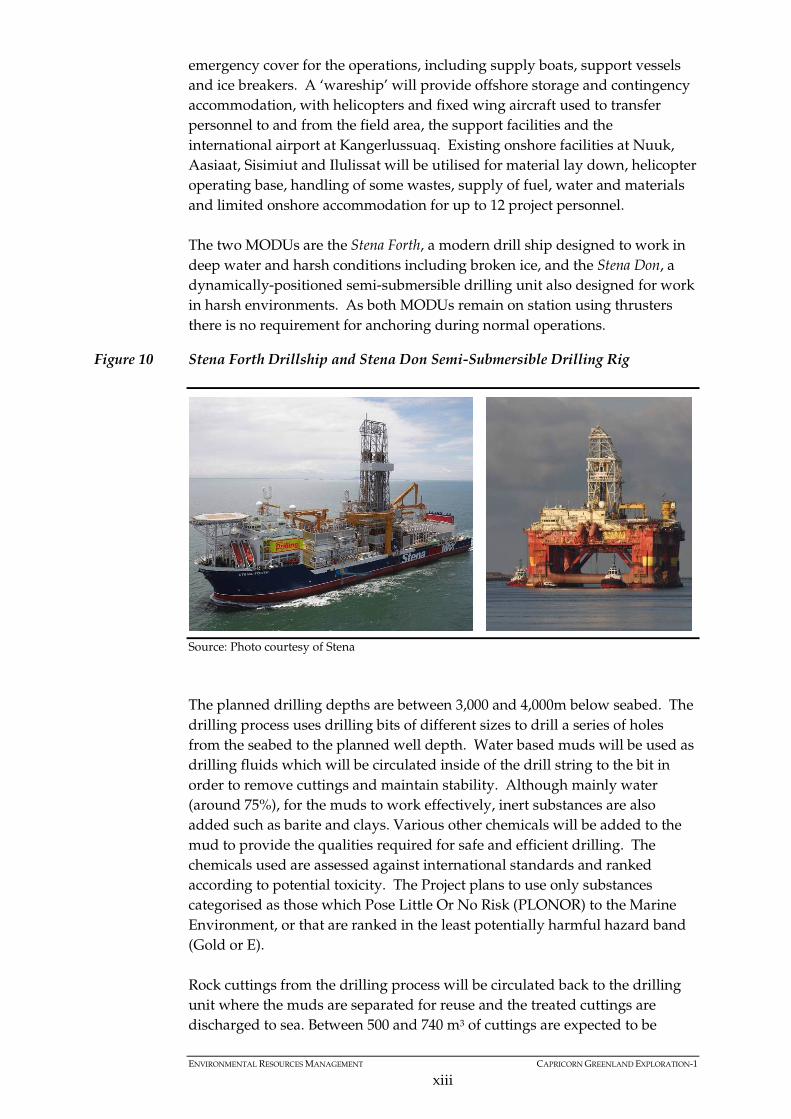
The two MODUs are the Stena Forth, a modern drill ship designed to work in
deep water and harsh conditions including broken ice, and the Stena Don, a
dynamically-positioned semi-submersible drilling unit also designed for work
in harsh environments. As both MODUs remain on station using thrusters
there is no requirement for anchoring during normal operations.
Figure 10 Stena Forth Drillship and Stena Don Semi-Submersible Drilling Rig
Source: Photo courtesy of Stena
The planned drilling depths are between 3,000 and 4,000m below seabed. The
drilling process uses drilling bits of different sizes to drill a series of holes
from the seabed to the planned well depth. Water based muds will be used as
drilling fluids which will be circulated inside of the drill string to the bit in
order to remove cuttings and maintain stability. Although mainly water
(around 75%), for the muds to work effectively, inert substances are also
added such as barite and clays. Various other chemicals will be added to the
mud to provide the qualities required for safe and efficient drilling. The
chemicals used are assessed against international standards and ranked
according to potential toxicity. The Project plans to use only substances
categorised as those which Pose Little Or No Risk (PLONOR) to the Marine
Environment, or that are ranked in the least potentially harmful hazard band
(Gold or E).
Rock cuttings from the drilling process will be circulated back to the drilling
unit where the muds are separated for reuse and the treated cuttings are
discharged to sea. Between 500 and 740 m3 of cuttings are expected to be
ENVIRONMENTAL RESOURCES MANAGEMENT CAPRICORN GREENLAND EXPLORATION-1
xiv
produced from each well. Modelling has shown that the majority of cuttings
will be deposited within 300-800 m of the well location, with bottom
deposition greater than 1 mm extending less than 200 m from each site. Once
each section of the hole has been drilled, the drill string will be lifted out and
casing will be lowered into the hole and cemented into place. At the end of
the drilling programme the used muds will be discharged to sea.
If drilling results indicate the presence of hydrocarbons, the wells may be
tested. Testing is used to establish reservoir and fluid characteristics such as
pressure and flow rate. If required, there will be a controlled flow of
hydrocarbons back to the drill unit where they will be tested and flared. The
likelihood of flaring being undertaken is estimated at less than 6% per well. If
flaring is carried out it will involve an estimated 48 hrs of flow time spread
over 5 days, with the total volume flared from each well estimated at around
30,000 barrels of oil, or 80 million cubic feet of gas. Any flaring will require
permitting by the Greenland authorities and will be monitored for signs of
incomplete combustion. An oil recovery vessel with full dispersant capability
will be on standby throughout the process.
Following completion, the wells will be plugged and suspended. Each well
will have an industry standard wellhead at the surface, with a protective cover
to prevent damage to or from the wellhead due to snagging or collision. Once
all wells have been drilled, the MODUs and support vessels will demobilise to
their next job or home base.
SUMMARY OF IMPACTS AND MITIGATION
The proposed exploration activity has the potential for sources of noise and
atmospheric emissions, as well as physical disturbance and a variety of
discharges and wastes. Those sources identified in this assessment are typical
of drilling activities in waters around the world. There are no unusual or
unique emissions, discharges or other potential sources of environmental
impact. A detailed study of the potential impacts, sensitivity of receptors,
mitigation measures and any residual impact has been carried out and is
included within the EIA report. An overview of the main areas of impact,
related operations and mitigation measures is shown in Table 2 below.
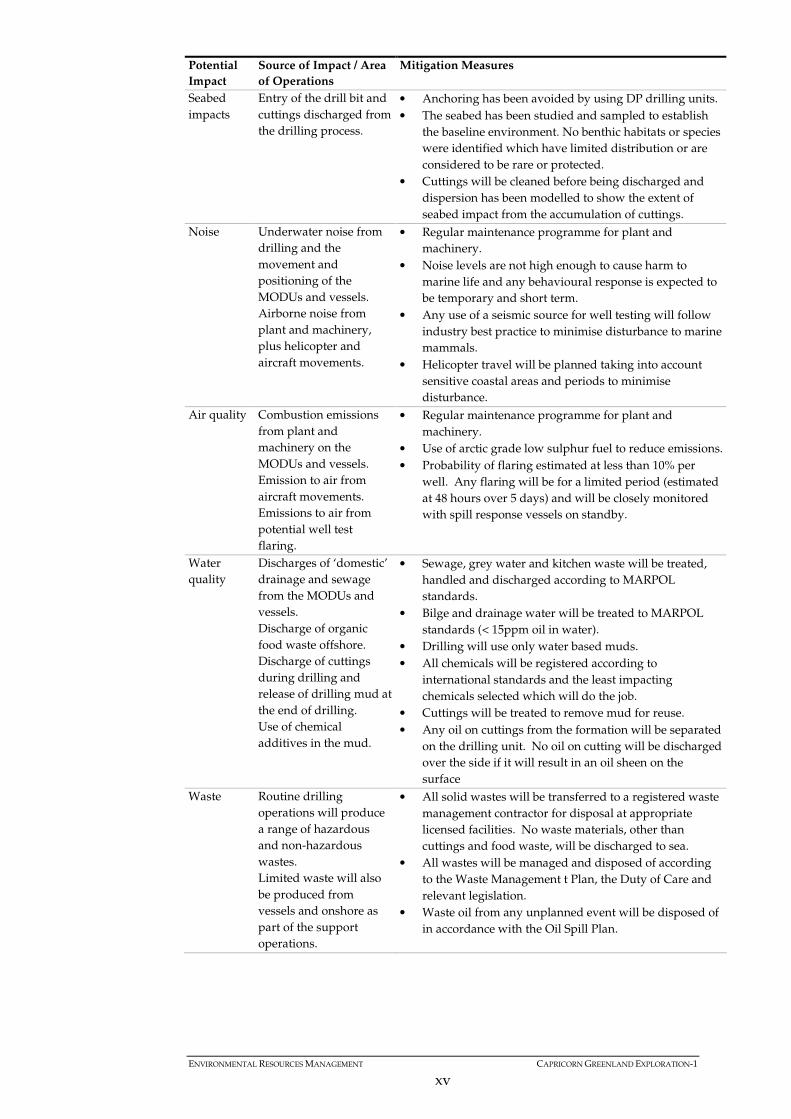
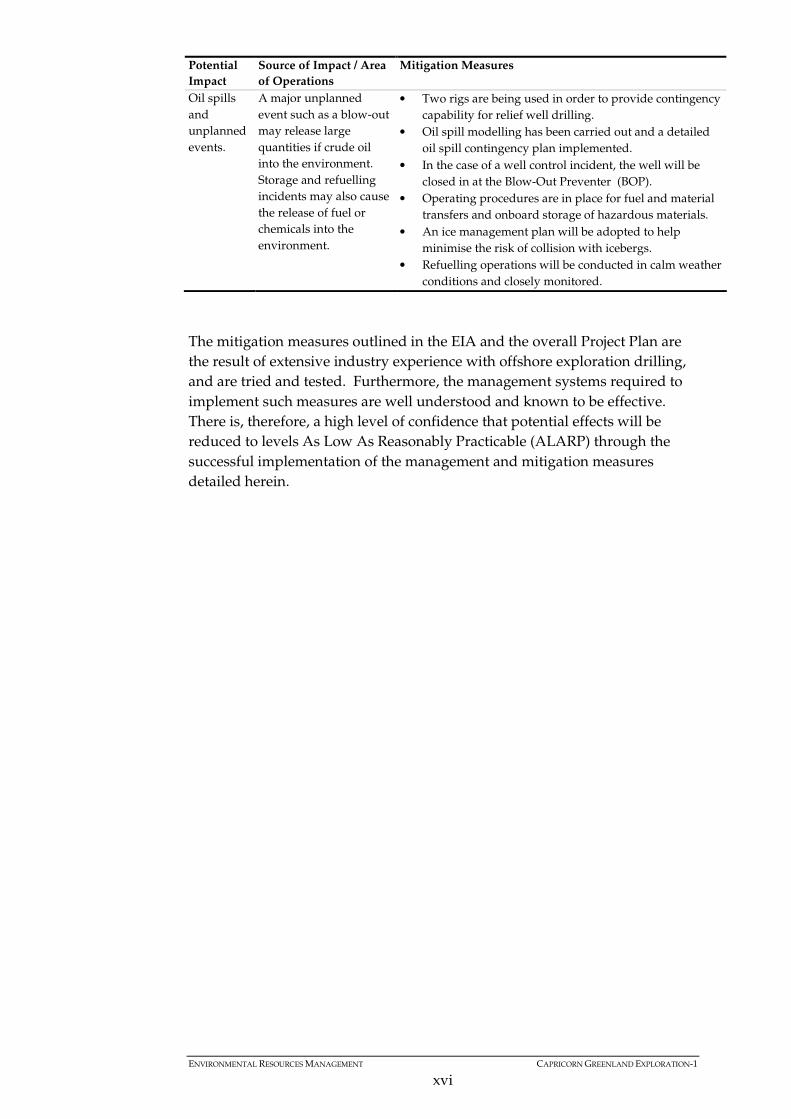
Table 2 Summary of Main Impact Areas, Operations and Mitigation Measures
Potential
Impact
Source of Impact / Area
of Operations
Mitigation Measures
Disruption
to other sea
users
Mobilisation, the 500m
exclusion zone around
drilling operations and
vessel movements to and
from the Project areas.
• Early and ongoing consultation with local communities,
authorities and other key stakeholders. Use of support
vessels to alert other marine craft of the operations.
ENVIRONMENTAL RESOURCES MANAGEMENT CAPRICORN GREENLAND EXPLORATION-1
xv
Potential
Impact
Source of Impact / Area
of Operations
Mitigation Measures
Seabed
impacts
Entry of the drill bit and
cuttings discharged from
the drilling process.
• Anchoring has been avoided by using DP drilling units.
• The seabed has been studied and sampled to establish
the baseline environment. No benthic habitats or species
were identified which have limited distribution or are
considered to be rare or protected.
• Cuttings will be cleaned before being discharged and
dispersion has been modelled to show the extent of
seabed impact from the accumulation of cuttings.
Noise Underwater noise from
drilling and the
movement and
positioning of the
MODUs and vessels.
Airborne noise from
plant and machinery,
plus helicopter and
aircraft movements.
• Regular maintenance programme for plant and
machinery.
• Noise levels are not high enough to cause harm to
marine life and any behavioural response is expected to
be temporary and short term.
• Any use of a seismic source for well testing will follow
industry best practice to minimise disturbance to marine
mammals.
• Helicopter travel will be planned taking into account
sensitive coastal areas and periods to minimise
disturbance.
Air quality Combustion emissions
from plant and
machinery on the
MODUs and vessels.
Emission to air from
aircraft movements.
Emissions to air from
potential well test
flaring.
• Regular maintenance programme for plant and
machinery.
• Use of arctic grade low sulphur fuel to reduce emissions.
• Probability of flaring estimated at less than 10% per
well. Any flaring will be for a limited period (estimated
at 48 hours over 5 days) and will be closely monitored
with spill response vessels on standby.
Water
quality
Discharges of ‘domestic’
drainage and sewage
from the MODUs and
vessels.
Discharge of organic
food waste offshore.
Discharge of cuttings
during drilling and
release of drilling mud at
the end of drilling.
Use of chemical
additives in the mud.
• Sewage, grey water and kitchen waste will be treated,
handled and discharged according to MARPOL
standards.
• Bilge and drainage water will be treated to MARPOL
standards (< 15ppm oil in water).
• Drilling will use only water based muds.
• All chemicals will be registered according to
international standards and the least impacting
chemicals selected which will do the job.
• Cuttings will be treated to remove mud for reuse.
• Any oil on cuttings from the formation will be separated
on the drilling unit. No oil on cutting will be discharged
over the side if it will result in an oil sheen on the
surface
Waste Routine drilling
operations will produce
a range of hazardous
and non-hazardous
wastes.
Limited waste will also
be produced from
vessels and onshore as
part of the support
operations.
• All solid wastes will be transferred to a registered waste
management contractor for disposal at appropriate
licensed facilities. No waste materials, other than
cuttings and food waste, will be discharged to sea.
• All wastes will be managed and disposed of according
to the Waste Management t Plan, the Duty of Care and
relevant legislation.
• Waste oil from any unplanned event will be disposed of
in accordance with the Oil Spill Plan.
ENVIRONMENTAL RESOURCES MANAGEMENT CAPRICORN GREENLAND EXPLORATION-1
xvi
Potential
Impact
Source of Impact / Area
of Operations
Mitigation Measures
Oil spills
and
unplanned
events.
A major unplanned
event such as a blow-out
may release large
quantities if crude oil
into the environment.
Storage and refuelling
incidents may also cause
the release of fuel or
chemicals into the
environment.
• Two rigs are being used in order to provide contingency
capability for relief well drilling.
• Oil spill modelling has been carried out and a detailed
oil spill contingency plan implemented.
• In the case of a well control incident, the well will be
closed in at the Blow-Out Preventer (BOP).
• Operating procedures are in place for fuel and material
transfers and onboard storage of hazardous materials.
• An ice management plan will be adopted to help
minimise the risk of collision with icebergs.
• Refuelling operations will be conducted in calm weather
conditions and closely monitored.
The mitigation measures outlined in the EIA and the overall Project Plan are
the result of extensive industry experience with offshore exploration drilling,
and are tried and tested. Furthermore, the management systems required to
implement such measures are well understood and known to be effective.
There is, therefore, a high level of confidence that potential effects will be
reduced to levels As Low As Reasonably Practicable (ALARP) through the
successful implementation of the management and mitigation measures
detailed herein.
ENVIRONMENTAL RESOURCES MANAGEMENT CAPRICORN GREENLAND EXPLORATION 1
1-1
1 INTRODUCTION
1.1 BACKGROUND
This study constitutes an Environmental Impact Assessment (EIA) for an exploration drilling programme to be conducted within the Sigguk exclusive licence 2008/10, Disko West area off western Greenland, due to start in the summer of 2010 and finish before the end of the year (the Project). This EIA has been produced by Environmental Resources Management (ERM) on behalf of Capricorn Greenland Exploration-1 (Capricorn). Capricorn is planning to drill four exploration wells in the Sigguk exclusive licence 2008/10 between June and October 2010. Sigguk is located over 100 km from the nearest coastline in water depths ranging from approximately 250 to 1,800m.
1.2 SCOPE
The purpose of the EIA is to: Describe the physical, biological and human components of the
environment within the study area and to assess their sensitivities in the context of the intended exploration drilling programme.
Present details of the Project.
Identify potential environmental impacts associated with the proposed
exploration drilling programme. Assess the nature, significance and probability of impacts on
environmental and resources and receptors. Develop appropriate mitigation measures, together with management and
monitoring procedures that will seek to avoid, minimise or reduce potential impacts to a level as low as reasonably practicable.
This report has been compiled in order to meet with applicable Greenland legislation and standards, international guidance and the corporate policies and expectations of Cairn Energy (Cairn), the parent company of Capricorn. A full description of the legislation, standards and guidance applicable to the Project is provided in Chapter 2. Although human components of the environment are described within the Baseline Chapter where relevant to the outcome of the environmental impact assessment; social, economic and health factors are excluded from this scope
ENVIRONMENTAL RESOURCES MANAGEMENT CAPRICORN GREENLAND EXPLORATION 1
1-2
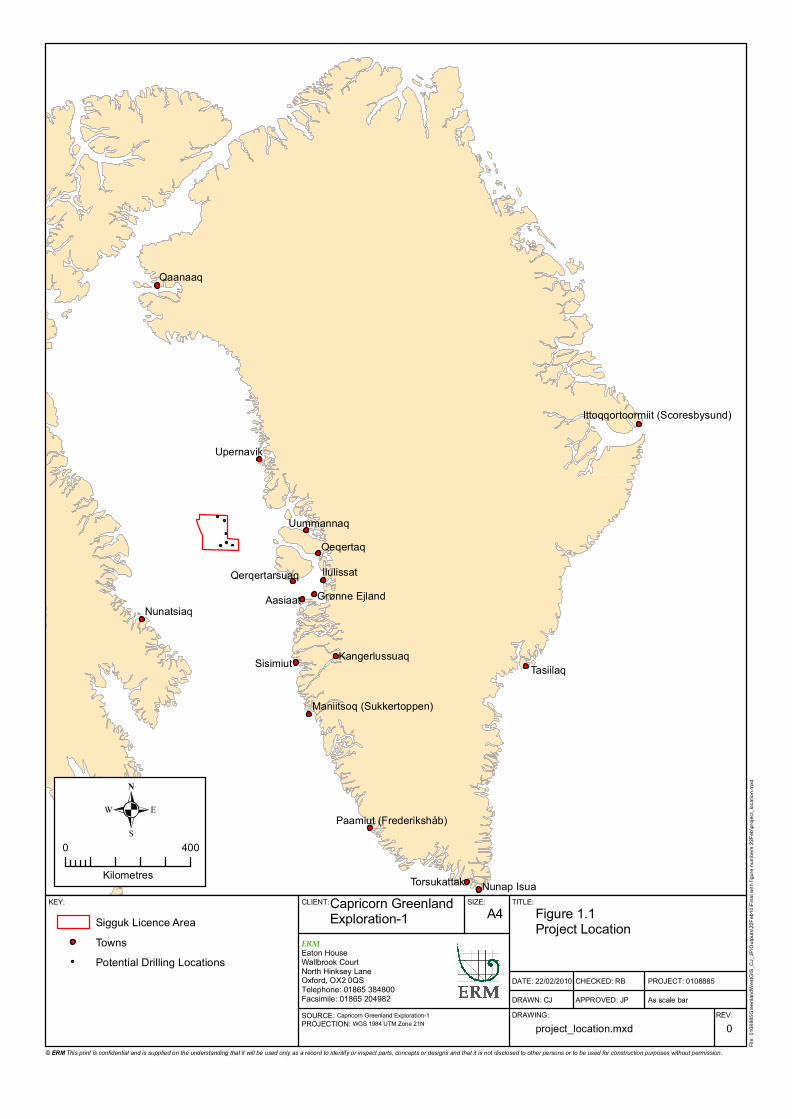
of work as they are covered by the accompanying Social Impact Assessment (SIA) also produced by ERM on behalf of Capricorn. In preparation of this EIA, a comprehensive desktop study has been undertaken to inform the baseline environment. A literature review was conducted using reports provided by environmental organisations from Denmark and Greenland as well as information sourced during internet research. Field surveys have also been conducted to investigate the physical, chemical and biological environment and reports by the Marine Mammal Observers (MMOs) employed during seismic surveys have been incorporated to provide up-to-date information on marine mammal sightings in the area. The geographical scope of the EIA encompasses the Sigguk exclusive licence 2008/10 (also referred to herein as the Licence Area) together with the wider marine and coastal environment where relevant to the potential impacts of the Project, although the EIA focuses in particular on the proposed drilling locations (refer to Figure 1.1; Project Location). The EIA is prefaced by a Non-Technical Summary (NTS) and in addition to this Chapter 1, it contains the following: Chapter 2 presents the policy, regulatory and administrative framework and
discusses certain relevant standards and guidelines; Chapter 3 describes the approach and assessment methodology; Chapter 4 presents the ‘baseline’ information on existing environmental
conditions pertinent to the study areas and intended Project activities ; Chapter 5 describes the Project and discusses the different project options
considered; Chapter 6 assesses potential impacts, describes proposed mitigation
measures and summarises the likely residual impacts, ie those predicted to remain after the application of mitigation measures;
Chapter 7 sets out the Environmental Mitigation and Monitoring Plans that
Capricorn propose to apply to the Project; and Chapter 8 summarises the key findings and conclusions of the EIA. In addition, the Appendices contain a number of items of supporting information relevant to the EIA, such as species lists and modelling data.
Qaanaaq
Aasiaat
Qeqertaq
TasiilaqSisimiut
Nunatsiaq
Upernavik
Uummannaq
Ilulissat
Nunap IsuaTorsukattak
Kangerlussuaq
Grønne EjlandQerqertarsuaq
Paamiut (Frederikshåb)
Maniitsoq (Sukkertoppen)
Ittoqqortoormiit (Scoresbysund)
CLIENT: SIZE: TITLE:
DATE: 22/02/2010
DRAWN: CJ
CHECKED: RB
APPROVED: JP
PROJECT: 0108885
As scale barDRAWING: REV:
KEY: Capricorn Greenland Exploration-1 A4 Figure 1.1
Project Location
project_location.mxd 0
Sigguk Licence AreaTownsPotential Drilling Locations
.0 400
Kilometres
SOURCE: Capricorn Greenland Exploration-1PROJECTION: WGS 1984 UTM Zone 21N
File:
0108
885G
reenla
ndW
estG
IS_C
J_JP
\Outp
uts\22
Feb1
0\Fina
l with
figure
numb
ers 22
Feb\p
rojec
t_loc
ation
.mxd
ERMEaton HouseWallbrook CourtNorth Hinksey LaneOxford, OX2 0QSTelephone: 01865 384800Facsimile: 01865 204982
© ERM This print is confidential and is supplied on the understanding that it will be used only as a record to identify or inspect parts, concepts or designs and that it is not disclosed to other persons or to be used for construction purposes without permission.
ENVIRONMENTAL RESOURCES MANAGEMENT CAPRICORN GREENLAND EXPLORATION 1
1-4
1.3 PROPONENT
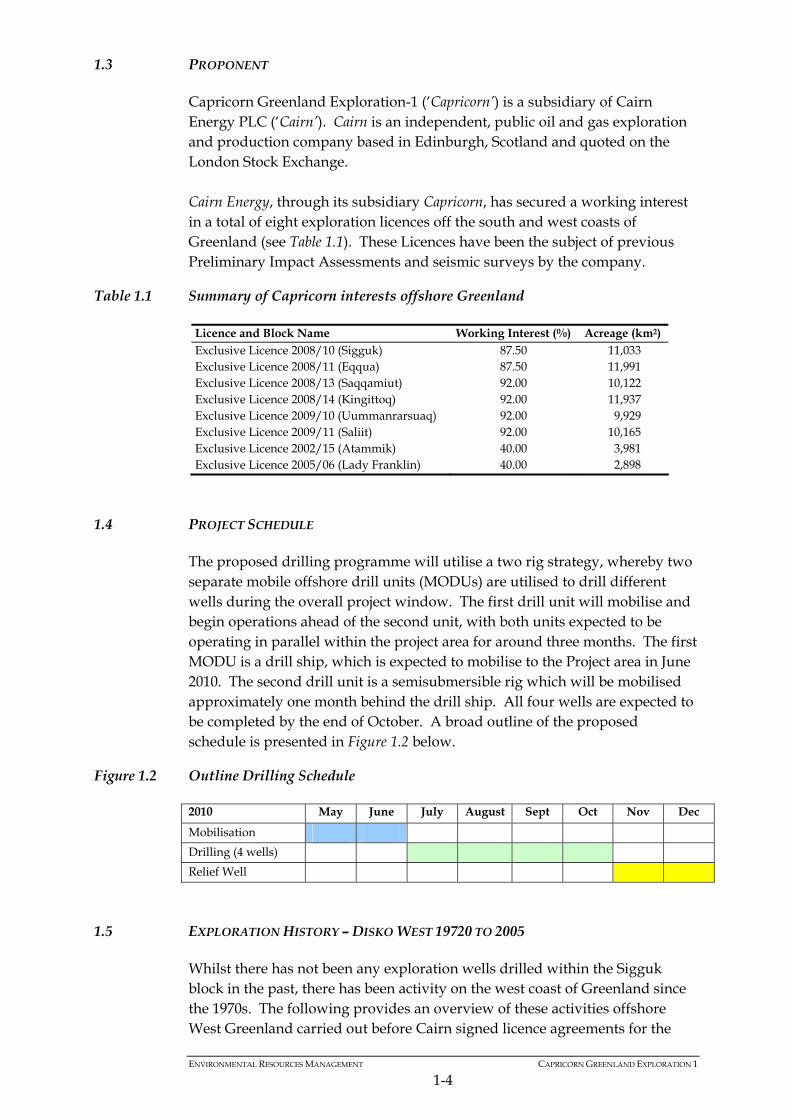
Capricorn Greenland Exploration-1 (‘Capricorn’) is a subsidiary of Cairn Energy PLC (‘Cairn’). Cairn is an independent, public oil and gas exploration and production company based in Edinburgh, Scotland and quoted on the London Stock Exchange. Cairn Energy, through its subsidiary Capricorn, has secured a working interest in a total of eight exploration licences off the south and west coasts of Greenland (see Table 1.1). These Licences have been the subject of previous Preliminary Impact Assessments and seismic surveys by the company.
Table 1.1 Summary of Capricorn interests offshore Greenland
Licence and Block Name Working Interest (%) Acreage (km2) Exclusive Licence 2008/10 (Sigguk) 87.50 11,033 Exclusive Licence 2008/11 (Eqqua) 87.50 11,991 Exclusive Licence 2008/13 (Saqqamiut) 92.00 10,122 Exclusive Licence 2008/14 (Kingittoq) 92.00 11,937 Exclusive Licence 2009/10 (Uummanrarsuaq) 92.00 9,929 Exclusive Licence 2009/11 (Saliit) 92.00 10,165 Exclusive Licence 2002/15 (Atammik) 40.00 3,981 Exclusive Licence 2005/06 (Lady Franklin) 40.00 2,898
1.4 PROJECT SCHEDULE
The proposed drilling programme will utilise a two rig strategy, whereby two separate mobile offshore drill units (MODUs) are utilised to drill different wells during the overall project window. The first drill unit will mobilise and begin operations ahead of the second unit, with both units expected to be operating in parallel within the project area for around three months. The first MODU is a drill ship, which is expected to mobilise to the Project area in June 2010. The second drill unit is a semisubmersible rig which will be mobilised approximately one month behind the drill ship. All four wells are expected to be completed by the end of October. A broad outline of the proposed schedule is presented in Figure 1.2 below.
Figure 1.2 Outline Drilling Schedule
2010 May June July August Sept Oct Nov Dec
Mobilisation
Drilling (4 wells)
Relief Well
1.5 EXPLORATION HISTORY – DISKO WEST 19720 TO 2005
Whilst there has not been any exploration wells drilled within the Sigguk block in the past, there has been activity on the west coast of Greenland since the 1970s. The following provides an overview of these activities offshore West Greenland carried out before Cairn signed licence agreements for the
ENVIRONMENTAL RESOURCES MANAGEMENT CAPRICORN GREENLAND EXPLORATION 1
1-5
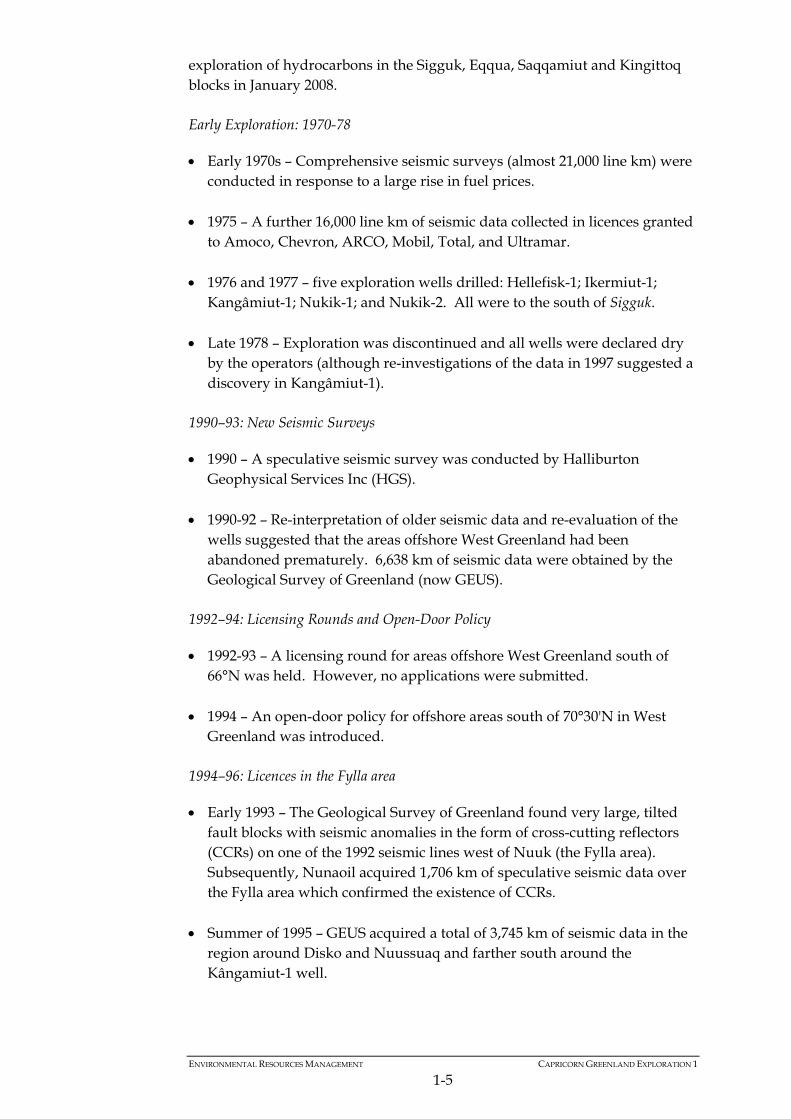
exploration of hydrocarbons in the Sigguk, Eqqua, Saqqamiut and Kingittoq blocks in January 2008. Early Exploration: 1970-78
Early 1970s – Comprehensive seismic surveys (almost 21,000 line km) were conducted in response to a large rise in fuel prices.
1975 – A further 16,000 line km of seismic data collected in licences granted
to Amoco, Chevron, ARCO, Mobil, Total, and Ultramar. 1976 and 1977 – five exploration wells drilled: Hellefisk-1; Ikermiut-1;
Kangâmiut-1; Nukik-1; and Nukik-2. All were to the south of Sigguk. Late 1978 – Exploration was discontinued and all wells were declared dry
by the operators (although re-investigations of the data in 1997 suggested a discovery in Kangâmiut-1).
1990–93: New Seismic Surveys
1990 – A speculative seismic survey was conducted by Halliburton Geophysical Services Inc (HGS).
1990-92 – Re-interpretation of older seismic data and re-evaluation of the
wells suggested that the areas offshore West Greenland had been abandoned prematurely. 6,638 km of seismic data were obtained by the Geological Survey of Greenland (now GEUS).
1992–94: Licensing Rounds and Open-Door Policy
1992-93 – A licensing round for areas offshore West Greenland south of 66°N was held. However, no applications were submitted.
1994 – An open-door policy for offshore areas south of 70°30'N in West
Greenland was introduced. 1994–96: Licences in the Fylla area
Early 1993 – The Geological Survey of Greenland found very large, tilted fault blocks with seismic anomalies in the form of cross-cutting reflectors (CCRs) on one of the 1992 seismic lines west of Nuuk (the Fylla area). Subsequently, Nunaoil acquired 1,706 km of speculative seismic data over the Fylla area which confirmed the existence of CCRs.
Summer of 1995 – GEUS acquired a total of 3,745 km of seismic data in the
region around Disko and Nuussuaq and farther south around the Kângamiut-1 well.
ENVIRONMENTAL RESOURCES MANAGEMENT CAPRICORN GREENLAND EXPLORATION 1
1-6
1996 – A licence covering 9,487 km² was awarded to a consortium consisting of Statoil (operator), Phillips Petroleum, Dansk Olie og Naturgas (DONG) and Nunaoil (as carried partner) in response to the Fylla data.
1997–98: Sisimiut West Licence Signed; Further Seismic Acquisition
1997 – 2,300 km of speculative seismic data were acquired by Nunaoil, mainly in the Hecla Rise area to the west of the Fylla area.
June 1998 – A new licence off Sisimiut in West Greenland was signed
covering an area of 4,744 km². The licence is held by Phillips Petroleum (operator), Statoil, and DONG, with Nunaoil as carried partner in the exploration phase.
1998 – Speculative surveys were carried out by Fugro-Geoteam acquiring
3,098 km of data north and south of the Fylla area and by Nunaoil who acquired 1,760 km in the region around the Sisimiut West licence.
1999: New Petroleum Licensing Policy for Greenland; More Speculative Seismic Surveys
April 1999 – A new petroleum licensing policy for Greenland was announced which included a licensing round in the region between 63°N and 68°N and a re-establishment of the open-door policy for other areas both onshore and offshore.
1999 – Seismic surveys were carried out in both the Fylla and the Sisimiut
West licence areas. 1999 – TGS-NOPEC acquired 2,897 km of speculative seismic data in the
area designated for the 2001 licensing round. 2000-2001: Drilling of Exploration Well in the Fylla Licence; More Speculative Seismic Surveys; Relinquishment of Licences
10th July 2000 – The exploration well in the eastern part of the Fylla Licence (Qulleq-1) spudded. The well was plugged and abandoned on 25 September after being declared dry.
TGS-NOPEC acquired a further 6,332 km of speculative seismic data in the
Sisimiut West licence area. Melville Bay (northernmost Baffin Bay) acquisition of 1,340 km of seismic
data to follow up on the KANUMAS project, funded by BMP. Shallow seismic survey undertaken around Nuussuaq by GEUS. A total of
2740 km of data were acquired.
ENVIRONMENTAL RESOURCES MANAGEMENT CAPRICORN GREENLAND EXPLORATION 1
1-7
Summer 2001 - three seismic surveys acquired: a regional survey by TGS-NOPEC and BMP, a survey in the northern open-door area by TGS-NOPEC; and a survey in the western part of the Fylla licence area by the Statoil group.
15th January 2002 – BMP announces the Fylla and the Sisimiut-West licences
relinquished as of 31st December 2001. 2002: Licensing Round offshore West Greenland and new seismic surveys
Offshore west Greenland Licensing Round (2002) announced. EnCana granted a licence covering 3985 sq. km. in the Nuuk Basin in October 2002.
Four seismic surveys completed offshore West Greenland during 2002. 2003: Seismic data acquisition, seabed sampling programme and preparations for 2004 Licensing Round
BMP announces new licensing round offshore West Greenland. Seabed sampling programme carried out on selected locations offshore
West Greenland. Nearly 9000 km of seismic data acquired offshore West and South
Greenland. 2004-2005: Licence Round and granting of Licences
1st April 2004 Licence Round opens. Four areas offered for licensing. July 2004 - Arctic Petroleum Assessment Conference and Excursion held in
Ilulissat. August 2004 - Major sea bed sampling programme carried out offshore
West Greenland. January 2005 - licence granted to EnCana and Nunaoil in the Lady Franklin
Basin.
1.6 SOURCES OF INFORMATION
Key information sources used in the preparation of this EIA were provided by:
National Environmental Research Institute (NERI), Aarhus University,
Denmark; Greenland Institute of Natural Resources (GINR); Danish Meteorological Institute (DMI);
ENVIRONMENTAL RESOURCES MANAGEMENT CAPRICORN GREENLAND EXPLORATION 1
1-8
Geological Survey of Denmark and Greenland (GEUS); and Bureau of Minerals and Petroleum (BMP), Greenland. In addition to operational and management information provided by the client and relevant subcontractors. The information sources used in the preparation of this EIA are referenced throughout the report and include the following categories of data: Biological studies, observations and distribution mapping; Coastal sensitivity mapping; Metocean (meteorological and oceanographic) reports; Environmental survey results and geophysical site survey data; Current modelling studies; Oil spill trajectory and cuttings dispersion studies; Ice studies; Applicable legislation, standards, guidelines and codes of practice; Equipment specifications and operational plans, including logistics; Well designs and subsurface studies; and Previous EIAs and SEAs for the Project area.
ENVIRONMENTAL RESOURCES MANAGEMENT CAPRICORN GREENLAND EXPLORATION 1
2-1
2 POLICY, REGULATORY AND ADMINISTRATIVE FRAMEWORK
2.1 APPLICABILITY TO THE EIA AND SIA
This section includes information on the relevant national and international legislative tools that apply to the exploration and extraction of hydrocarbons offshore Western Greenland. Due to the overlap in scope, legislation and policy is outlined that is relevant to both the Environmental and Social Impact Assessments and a single Chapter on the policy, regulatory and administrative framework has been therefore been prepared for inclusion in both the EIA and SIA reports. The applicability of the legislation to either the environmental or social assessment has been stated below where relevant.
2.2 NATIONAL LEGISLATIVE FRAMEWORK
Greenland has been under home-rule from Denmark since 1979, with more competencies being transferred to the local government in 2008. Since the creation of the Home Rule Government, Greenland has been steadily increasing its self-governance, particularly with regard to the exploitation of natural resources. In 2009, the country's status changed as 'self rule' was introduced and reference is now simply made to the 'Greenland Government' rather than to the 'Home Rule Government'. Greenland and other Nordic countries and autonomous regions are members of the Nordic Council and the Nordic Council of Ministers which facilitates parliamentary cooperation between member states. The Nordic countries have close cooperation on nature and environmental issues. Co-operation on environmental issues operates using four year environmental action plans which set out the priorities of Nordic cooperation on environmental matters and formulates the political themes and areas of focus of this cooperation. The Environmental Action Programme 2009-2012 has recently been published (www.norden.org) and focuses on climate change, the use and discharge of hazardous chemicals, protection of marine ecosystems and protection and utilisation of biological diversity. Greenland was also one of the founders of the environmental Arctic Council cooperation in 1996. The following national legislation and guidelines will apply to the proposed 2010 Sigguk exploration drilling program (the Project) which is the focus of the assessments:
ENVIRONMENTAL RESOURCES MANAGEMENT CAPRICORN GREENLAND EXPLORATION 1
2-2
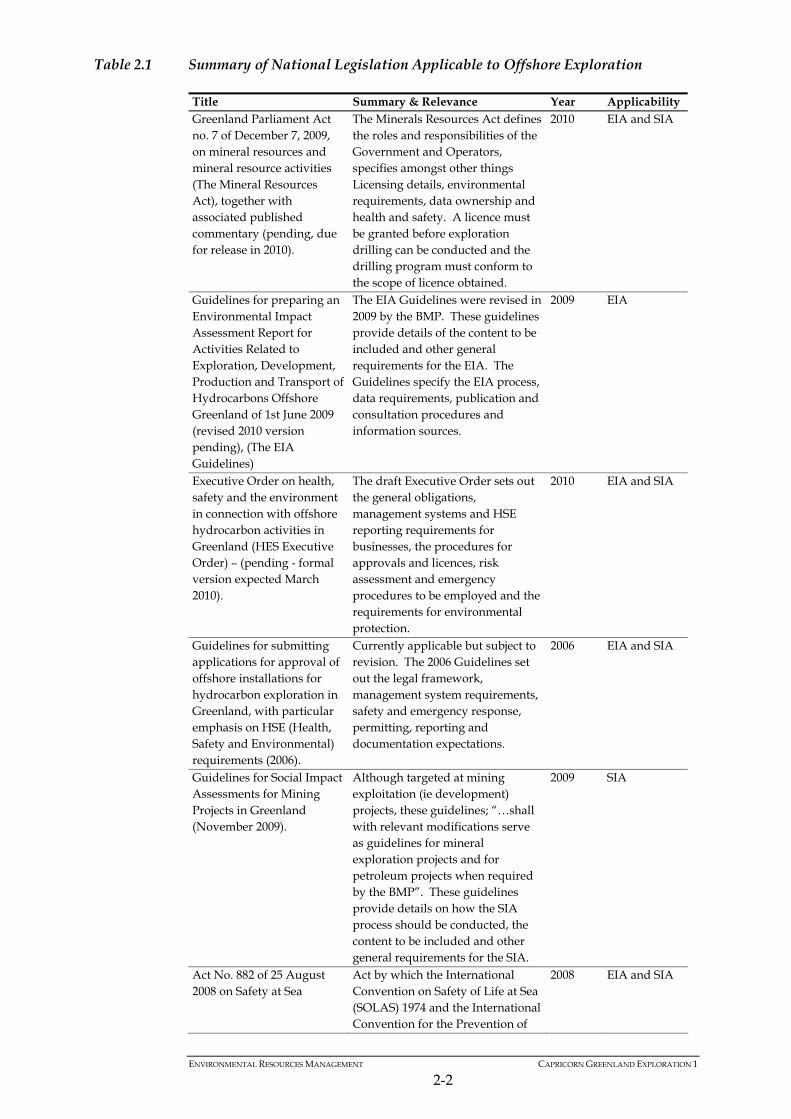
Table 2.1 Summary of National Legislation Applicable to Offshore Exploration
Title Summary & Relevance Year Applicability Greenland Parliament Act no. 7 of December 7, 2009, on mineral resources and mineral resource activities (The Mineral Resources Act), together with associated published commentary (pending, due for release in 2010).
The Minerals Resources Act defines the roles and responsibilities of the Government and Operators, specifies amongst other things Licensing details, environmental requirements, data ownership and health and safety. A licence must be granted before exploration drilling can be conducted and the drilling program must conform to the scope of licence obtained.
2010 EIA and SIA
Guidelines for preparing an Environmental Impact Assessment Report for Activities Related to Exploration, Development, Production and Transport of Hydrocarbons Offshore Greenland of 1st June 2009 (revised 2010 version pending), (The EIA Guidelines)
The EIA Guidelines were revised in 2009 by the BMP. These guidelines provide details of the content to be included and other general requirements for the EIA. The Guidelines specify the EIA process, data requirements, publication and consultation procedures and information sources.
2009 EIA
Executive Order on health, safety and the environment in connection with offshore hydrocarbon activities in Greenland (HES Executive Order) – (pending - formal version expected March 2010).
The draft Executive Order sets out the general obligations, management systems and HSE reporting requirements for businesses, the procedures for approvals and licences, risk assessment and emergency procedures to be employed and the requirements for environmental protection.
2010 EIA and SIA
Guidelines for submitting applications for approval of offshore installations for hydrocarbon exploration in Greenland, with particular emphasis on HSE (Health, Safety and Environmental) requirements (2006).
Currently applicable but subject to revision. The 2006 Guidelines set out the legal framework, management system requirements, safety and emergency response, permitting, reporting and documentation expectations.
2006 EIA and SIA
Guidelines for Social Impact Assessments for Mining Projects in Greenland (November 2009).
Although targeted at mining exploitation (ie development) projects, these guidelines; “…shall with relevant modifications serve as guidelines for mineral exploration projects and for petroleum projects when required by the BMP”. These guidelines provide details on how the SIA process should be conducted, the content to be included and other general requirements for the SIA.
2009 SIA
Act No. 882 of 25 August 2008 on Safety at Sea
Act by which the International Convention on Safety of Life at Sea (SOLAS) 1974 and the International Convention for the Prevention of
2008 EIA and SIA
ENVIRONMENTAL RESOURCES MANAGEMENT CAPRICORN GREENLAND EXPLORATION 1
2-3
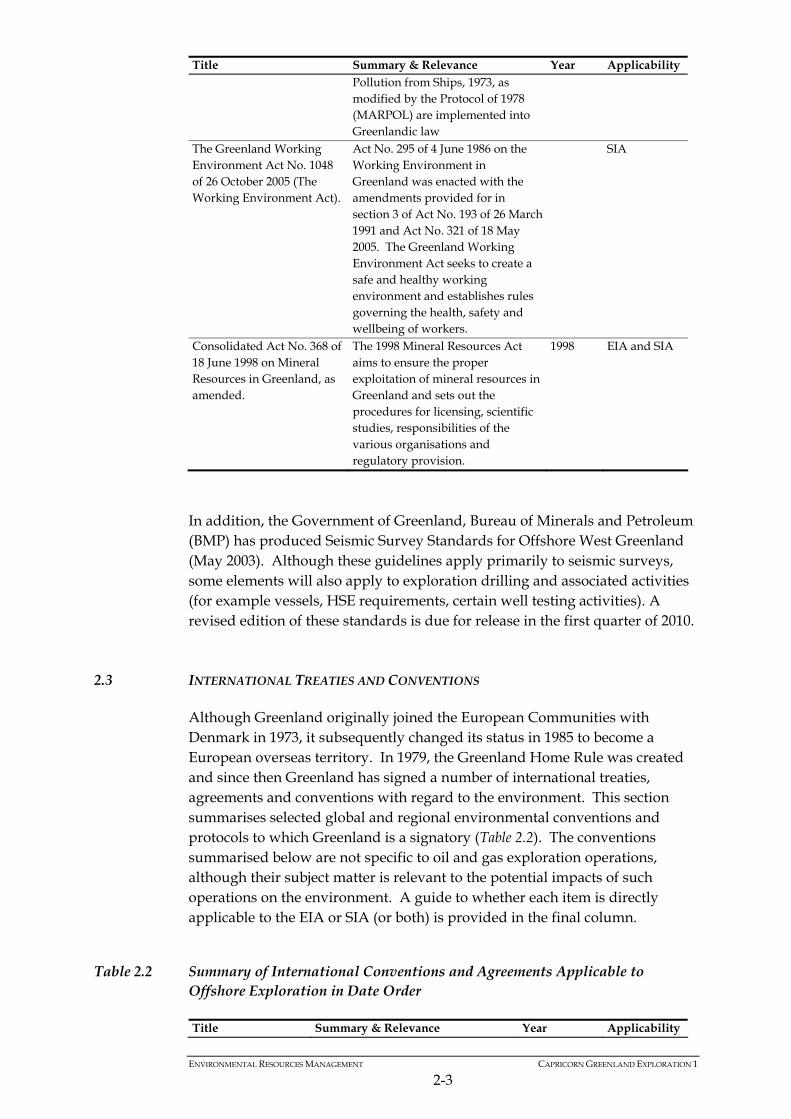
Title Summary & Relevance Year Applicability Pollution from Ships, 1973, as modified by the Protocol of 1978 (MARPOL) are implemented into Greenlandic law
The Greenland Working Environment Act No. 1048 of 26 October 2005 (The Working Environment Act).
Act No. 295 of 4 June 1986 on the Working Environment in Greenland was enacted with the amendments provided for in section 3 of Act No. 193 of 26 March 1991 and Act No. 321 of 18 May 2005. The Greenland Working Environment Act seeks to create a safe and healthy working environment and establishes rules governing the health, safety and wellbeing of workers.
SIA
Consolidated Act No. 368 of 18 June 1998 on Mineral Resources in Greenland, as amended.
The 1998 Mineral Resources Act aims to ensure the proper exploitation of mineral resources in Greenland and sets out the procedures for licensing, scientific studies, responsibilities of the various organisations and regulatory provision.
1998 EIA and SIA
In addition, the Government of Greenland, Bureau of Minerals and Petroleum (BMP) has produced Seismic Survey Standards for Offshore West Greenland (May 2003). Although these guidelines apply primarily to seismic surveys, some elements will also apply to exploration drilling and associated activities (for example vessels, HSE requirements, certain well testing activities). A revised edition of these standards is due for release in the first quarter of 2010.
2.3 INTERNATIONAL TREATIES AND CONVENTIONS
Although Greenland originally joined the European Communities with Denmark in 1973, it subsequently changed its status in 1985 to become a European overseas territory. In 1979, the Greenland Home Rule was created and since then Greenland has signed a number of international treaties, agreements and conventions with regard to the environment. This section summarises selected global and regional environmental conventions and protocols to which Greenland is a signatory (Table 2.2). The conventions summarised below are not specific to oil and gas exploration operations, although their subject matter is relevant to the potential impacts of such operations on the environment. A guide to whether each item is directly applicable to the EIA or SIA (or both) is provided in the final column.
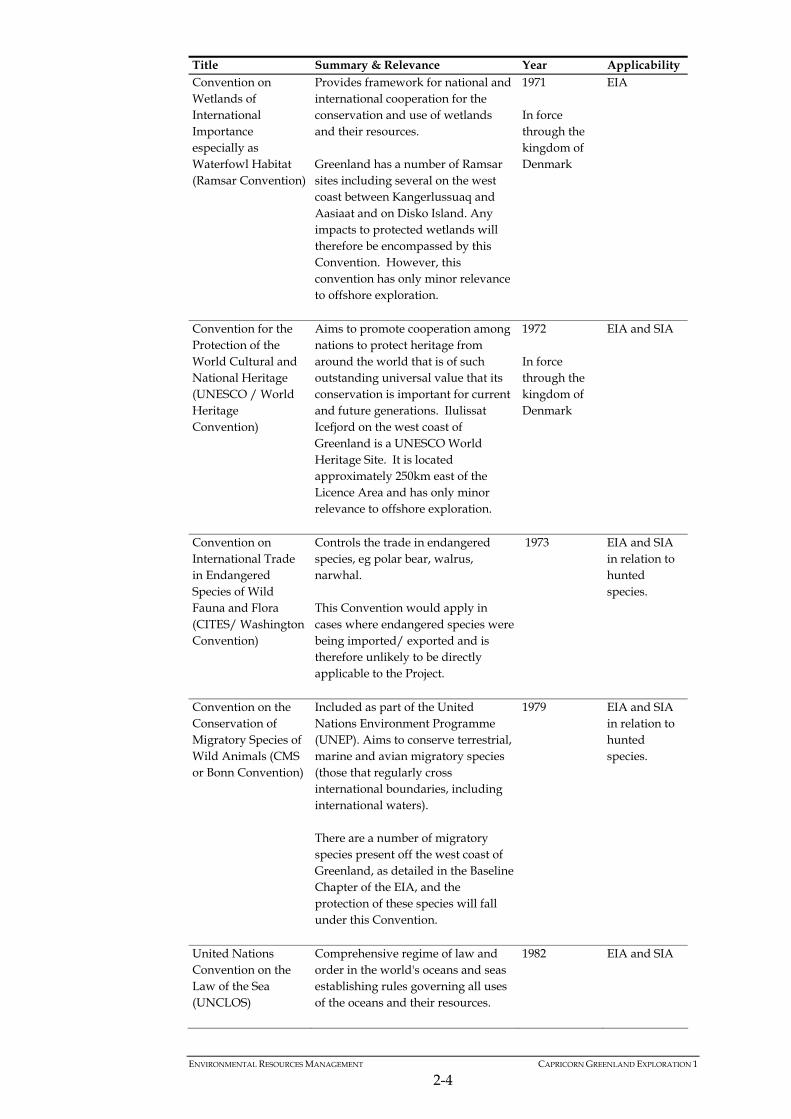
Table 2.2 Summary of International Conventions and Agreements Applicable to Offshore Exploration in Date Order
Title Summary & Relevance Year Applicability
ENVIRONMENTAL RESOURCES MANAGEMENT CAPRICORN GREENLAND EXPLORATION 1
2-4
Title Summary & Relevance Year Applicability Convention on Wetlands of International Importance especially as Waterfowl Habitat (Ramsar Convention)
Provides framework for national and international cooperation for the conservation and use of wetlands and their resources. Greenland has a number of Ramsar sites including several on the west coast between Kangerlussuaq and Aasiaat and on Disko Island. Any impacts to protected wetlands will therefore be encompassed by this Convention. However, this convention has only minor relevance to offshore exploration.
1971 In force through the kingdom of Denmark
EIA
Convention for the Protection of the World Cultural and National Heritage (UNESCO / World Heritage Convention)
Aims to promote cooperation among nations to protect heritage from around the world that is of such outstanding universal value that its conservation is important for current and future generations. Ilulissat Icefjord on the west coast of Greenland is a UNESCO World Heritage Site. It is located approximately 250km east of the Licence Area and has only minor relevance to offshore exploration.
1972 In force through the kingdom of Denmark
EIA and SIA
Convention on International Trade in Endangered Species of Wild Fauna and Flora (CITES/ Washington Convention)
Controls the trade in endangered species, eg polar bear, walrus, narwhal. This Convention would apply in cases where endangered species were being imported/ exported and is therefore unlikely to be directly applicable to the Project.
1973 EIA and SIA in relation to hunted species.
Convention on the Conservation of Migratory Species of Wild Animals (CMS or Bonn Convention)
Included as part of the United Nations Environment Programme (UNEP). Aims to conserve terrestrial, marine and avian migratory species (those that regularly cross international boundaries, including international waters). There are a number of migratory species present off the west coast of Greenland, as detailed in the Baseline Chapter of the EIA, and the protection of these species will fall under this Convention.
1979 EIA and SIA in relation to hunted species.
United Nations Convention on the Law of the Sea (UNCLOS)
Comprehensive regime of law and order in the world's oceans and seas establishing rules governing all uses of the oceans and their resources.
1982 EIA and SIA
ENVIRONMENTAL RESOURCES MANAGEMENT CAPRICORN GREENLAND EXPLORATION 1
2-5
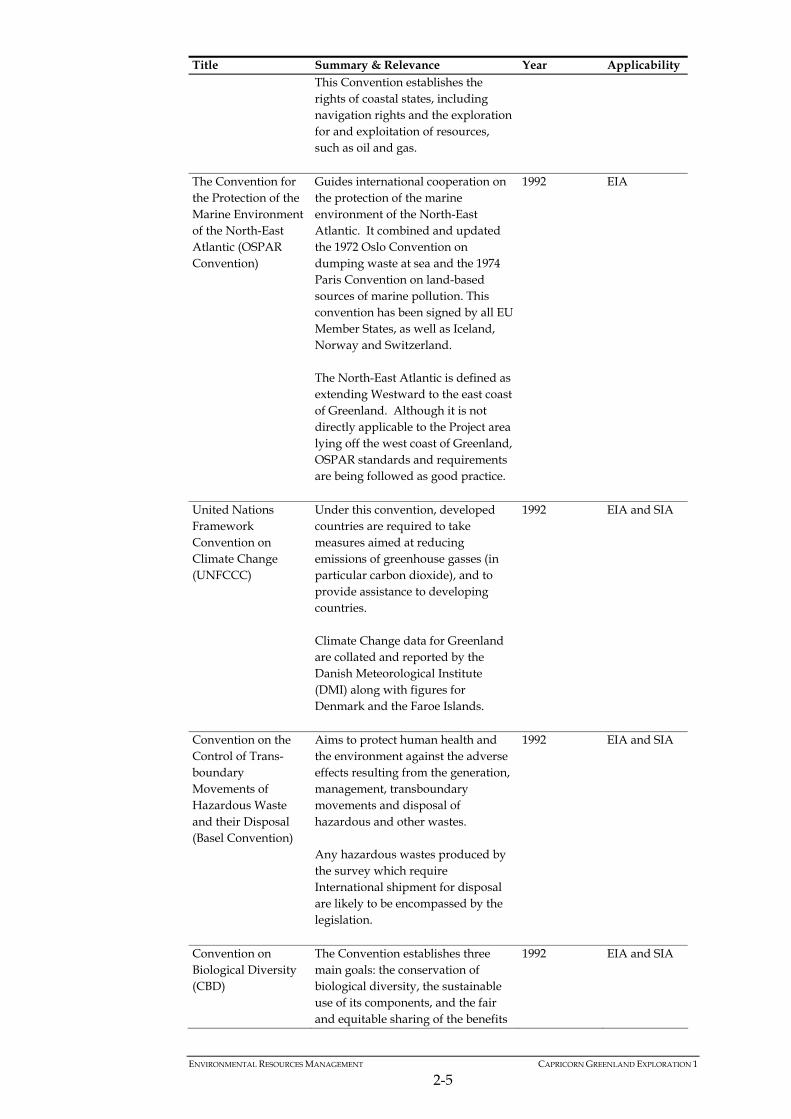
Title Summary & Relevance Year Applicability This Convention establishes the rights of coastal states, including navigation rights and the exploration for and exploitation of resources, such as oil and gas.
The Convention for the Protection of the Marine Environment of the North-East Atlantic (OSPAR Convention)
Guides international cooperation on the protection of the marine environment of the North-East Atlantic. It combined and updated the 1972 Oslo Convention on dumping waste at sea and the 1974 Paris Convention on land-based sources of marine pollution. This convention has been signed by all EU Member States, as well as Iceland, Norway and Switzerland. The North-East Atlantic is defined as extending Westward to the east coast of Greenland. Although it is not directly applicable to the Project area lying off the west coast of Greenland, OSPAR standards and requirements are being followed as good practice.
1992 EIA
United Nations Framework Convention on Climate Change (UNFCCC)
Under this convention, developed countries are required to take measures aimed at reducing emissions of greenhouse gasses (in particular carbon dioxide), and to provide assistance to developing countries. Climate Change data for Greenland are collated and reported by the Danish Meteorological Institute (DMI) along with figures for Denmark and the Faroe Islands.
1992 EIA and SIA
Convention on the Control of Trans-boundary Movements of Hazardous Waste and their Disposal (Basel Convention)
Aims to protect human health and the environment against the adverse effects resulting from the generation, management, transboundary movements and disposal of hazardous and other wastes. Any hazardous wastes produced by the survey which require International shipment for disposal are likely to be encompassed by the legislation.
1992 EIA and SIA
Convention on Biological Diversity (CBD)
The Convention establishes three main goals: the conservation of biological diversity, the sustainable use of its components, and the fair and equitable sharing of the benefits
1992 EIA and SIA
ENVIRONMENTAL RESOURCES MANAGEMENT CAPRICORN GREENLAND EXPLORATION 1
2-6
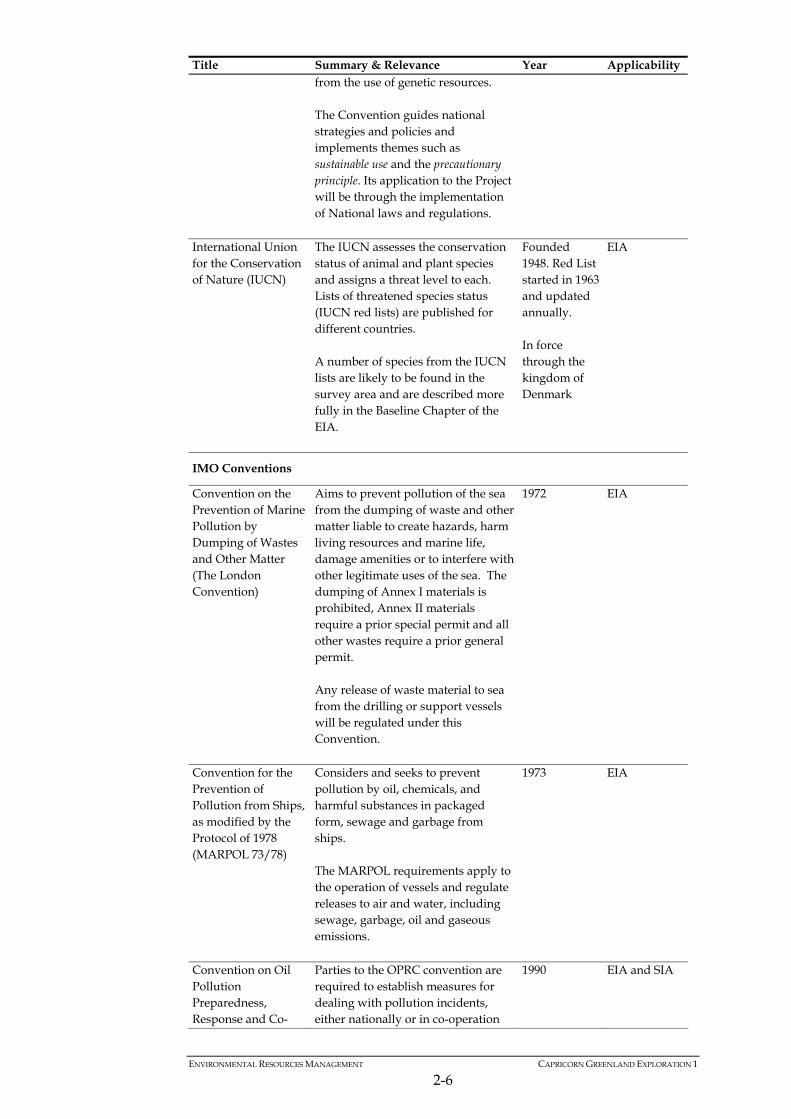
Title Summary & Relevance Year Applicability from the use of genetic resources. The Convention guides national strategies and policies and implements themes such as sustainable use and the precautionary principle. Its application to the Project will be through the implementation of National laws and regulations.
International Union for the Conservation of Nature (IUCN)
The IUCN assesses the conservation status of animal and plant species and assigns a threat level to each. Lists of threatened species status (IUCN red lists) are published for different countries. A number of species from the IUCN lists are likely to be found in the survey area and are described more fully in the Baseline Chapter of the EIA.
Founded 1948. Red List started in 1963 and updated annually. In force through the kingdom of Denmark
EIA
IMO Conventions
Convention on the Prevention of Marine Pollution by Dumping of Wastes and Other Matter (The London Convention)
Aims to prevent pollution of the sea from the dumping of waste and other matter liable to create hazards, harm living resources and marine life, damage amenities or to interfere with other legitimate uses of the sea. The dumping of Annex I materials is prohibited, Annex II materials require a prior special permit and all other wastes require a prior general permit. Any release of waste material to sea from the drilling or support vessels will be regulated under this Convention.
1972 EIA
Convention for the Prevention of Pollution from Ships, as modified by the Protocol of 1978 (MARPOL 73/78)
Considers and seeks to prevent pollution by oil, chemicals, and harmful substances in packaged form, sewage and garbage from ships. The MARPOL requirements apply to the operation of vessels and regulate releases to air and water, including sewage, garbage, oil and gaseous emissions.
1973 EIA
Convention on Oil Pollution Preparedness, Response and Co-
Parties to the OPRC convention are required to establish measures for dealing with pollution incidents, either nationally or in co-operation
1990 EIA and SIA
ENVIRONMENTAL RESOURCES MANAGEMENT CAPRICORN GREENLAND EXPLORATION 1
2-7
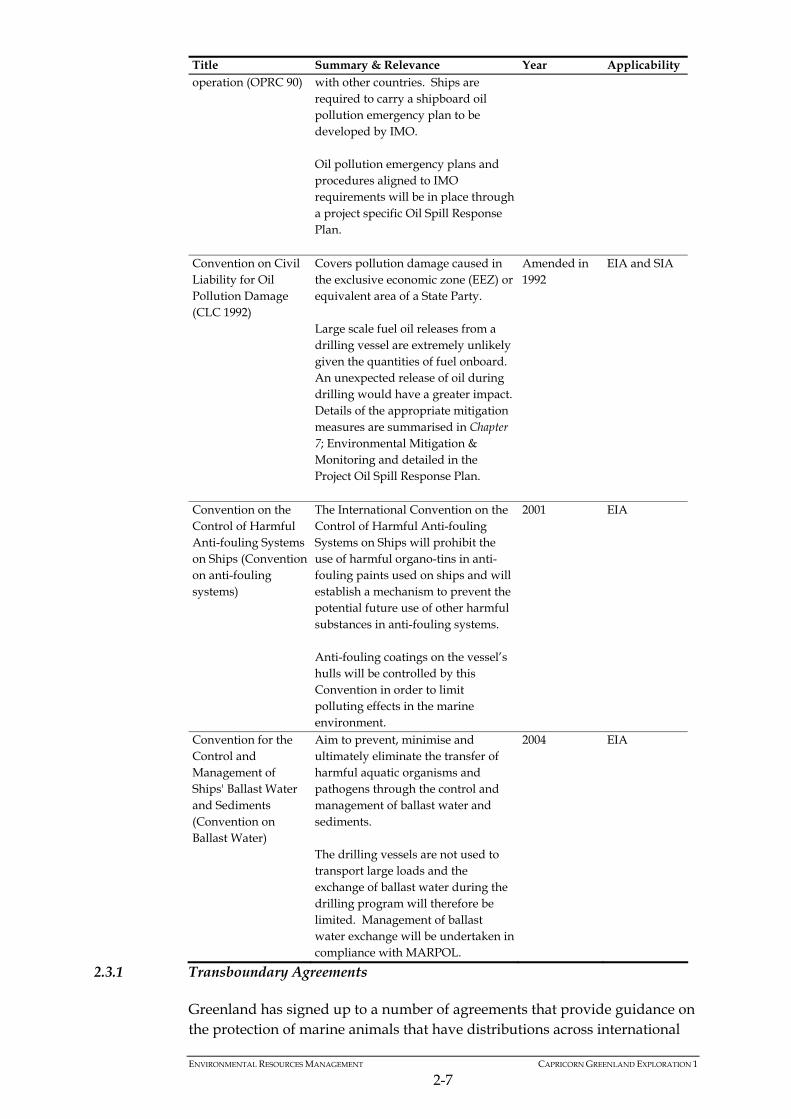
Title Summary & Relevance Year Applicability operation (OPRC 90) with other countries. Ships are
required to carry a shipboard oil pollution emergency plan to be developed by IMO. Oil pollution emergency plans and procedures aligned to IMO requirements will be in place through a project specific Oil Spill Response Plan.
Convention on Civil Liability for Oil Pollution Damage (CLC 1992)
Covers pollution damage caused in the exclusive economic zone (EEZ) or equivalent area of a State Party. Large scale fuel oil releases from a drilling vessel are extremely unlikely given the quantities of fuel onboard. An unexpected release of oil during drilling would have a greater impact. Details of the appropriate mitigation measures are summarised in Chapter 7; Environmental Mitigation & Monitoring and detailed in the Project Oil Spill Response Plan.
Amended in 1992
EIA and SIA
Convention on the Control of Harmful Anti-fouling Systems on Ships (Convention on anti-fouling systems)
The International Convention on the Control of Harmful Anti-fouling Systems on Ships will prohibit the use of harmful organo-tins in anti-fouling paints used on ships and will establish a mechanism to prevent the potential future use of other harmful substances in anti-fouling systems. Anti-fouling coatings on the vessel’s hulls will be controlled by this Convention in order to limit polluting effects in the marine environment.
2001 EIA
Convention for the Control and Management of Ships' Ballast Water and Sediments (Convention on Ballast Water)
Aim to prevent, minimise and ultimately eliminate the transfer of harmful aquatic organisms and pathogens through the control and management of ballast water and sediments. The drilling vessels are not used to transport large loads and the exchange of ballast water during the drilling program will therefore be limited. Management of ballast water exchange will be undertaken in compliance with MARPOL.
2004 EIA
2.3.1 Transboundary Agreements
Greenland has signed up to a number of agreements that provide guidance on the protection of marine animals that have distributions across international
ENVIRONMENTAL RESOURCES MANAGEMENT CAPRICORN GREENLAND EXPLORATION 1
2-8
boundaries (Table 2.3). In addition, Greenland is a member of several international organisations that advise on the sustainable use of Greenland’s marine resources such as the North East Atlantic Fishery Commission (NEAFC), North Atlantic Salmon Conservation Organisation (NASCO), and International Whaling Commission (IWC).
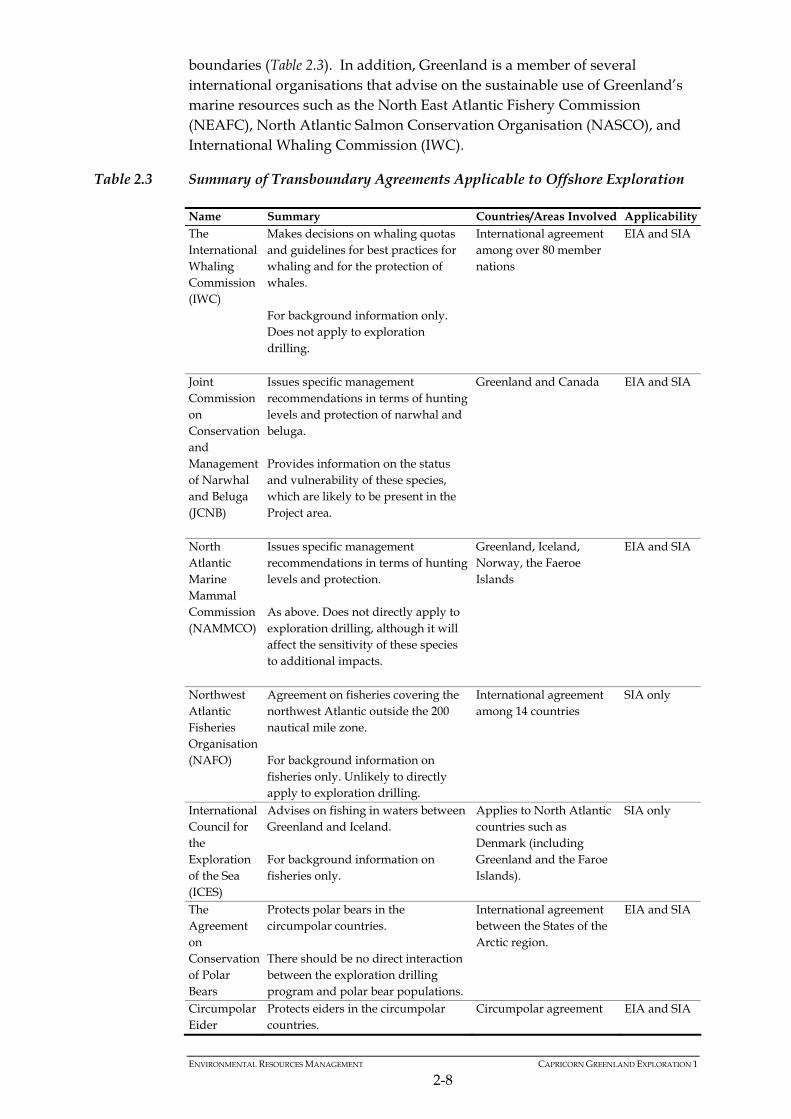
Table 2.3 Summary of Transboundary Agreements Applicable to Offshore Exploration
Name Summary Countries/Areas Involved Applicability The International Whaling Commission (IWC)
Makes decisions on whaling quotas and guidelines for best practices for whaling and for the protection of whales. For background information only. Does not apply to exploration drilling.
International agreement among over 80 member nations
EIA and SIA
Joint Commission on Conservation and Management of Narwhal and Beluga (JCNB)
Issues specific management recommendations in terms of hunting levels and protection of narwhal and beluga. Provides information on the status and vulnerability of these species, which are likely to be present in the Project area.
Greenland and Canada EIA and SIA
North Atlantic Marine Mammal Commission (NAMMCO)
Issues specific management recommendations in terms of hunting levels and protection. As above. Does not directly apply to exploration drilling, although it will affect the sensitivity of these species to additional impacts.
Greenland, Iceland, Norway, the Faeroe Islands
EIA and SIA
Northwest Atlantic Fisheries Organisation (NAFO)
Agreement on fisheries covering the northwest Atlantic outside the 200 nautical mile zone. For background information on fisheries only. Unlikely to directly apply to exploration drilling.
International agreement among 14 countries
SIA only
International Council for the Exploration of the Sea (ICES)
Advises on fishing in waters between Greenland and Iceland. For background information on fisheries only.
Applies to North Atlantic countries such as Denmark (including Greenland and the Faroe Islands).
SIA only
The Agreement on Conservation of Polar Bears
Protects polar bears in the circumpolar countries. There should be no direct interaction between the exploration drilling program and polar bear populations.
International agreement between the States of the Arctic region.
EIA and SIA
Circumpolar Eider
Protects eiders in the circumpolar countries.
Circumpolar agreement EIA and SIA
ENVIRONMENTAL RESOURCES MANAGEMENT CAPRICORN GREENLAND EXPLORATION 1
2-9
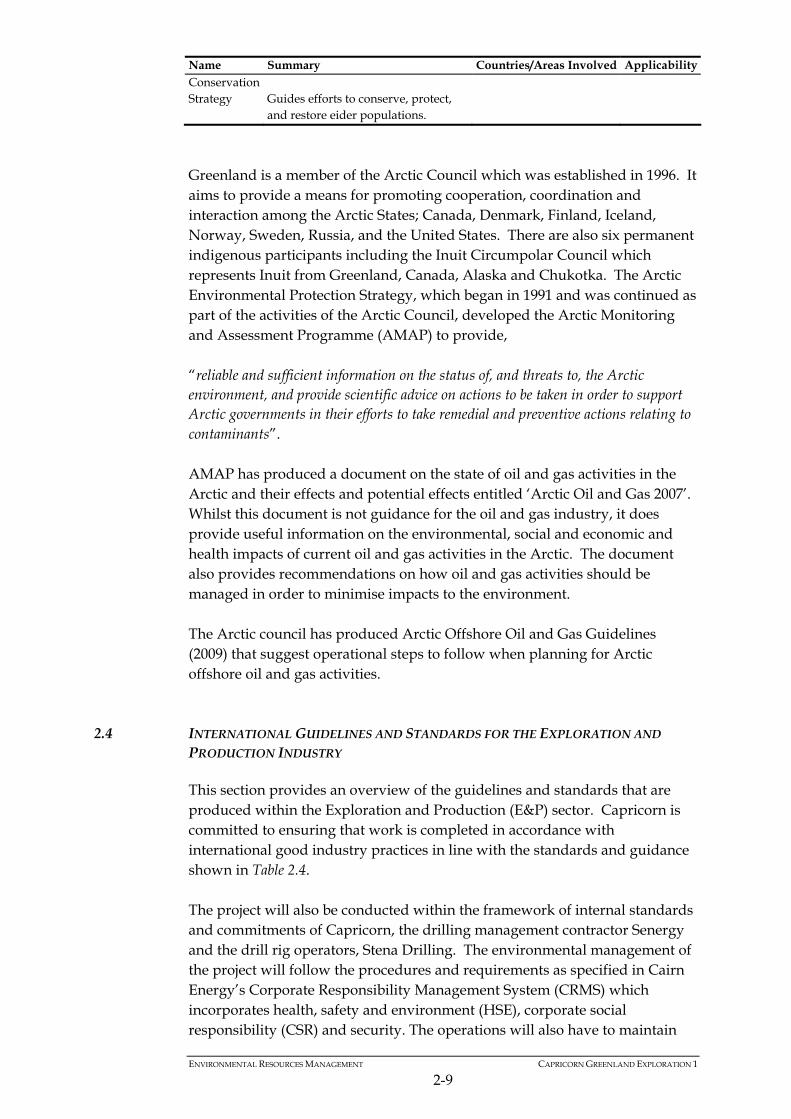
Name Summary Countries/Areas Involved Applicability Conservation Strategy
Guides efforts to conserve, protect, and restore eider populations.
Greenland is a member of the Arctic Council which was established in 1996. It aims to provide a means for promoting cooperation, coordination and interaction among the Arctic States; Canada, Denmark, Finland, Iceland, Norway, Sweden, Russia, and the United States. There are also six permanent indigenous participants including the Inuit Circumpolar Council which represents Inuit from Greenland, Canada, Alaska and Chukotka. The Arctic Environmental Protection Strategy, which began in 1991 and was continued as part of the activities of the Arctic Council, developed the Arctic Monitoring and Assessment Programme (AMAP) to provide, “reliable and sufficient information on the status of, and threats to, the Arctic environment, and provide scientific advice on actions to be taken in order to support Arctic governments in their efforts to take remedial and preventive actions relating to contaminants”. AMAP has produced a document on the state of oil and gas activities in the Arctic and their effects and potential effects entitled ‘Arctic Oil and Gas 2007’. Whilst this document is not guidance for the oil and gas industry, it does provide useful information on the environmental, social and economic and health impacts of current oil and gas activities in the Arctic. The document also provides recommendations on how oil and gas activities should be managed in order to minimise impacts to the environment. The Arctic council has produced Arctic Offshore Oil and Gas Guidelines (2009) that suggest operational steps to follow when planning for Arctic offshore oil and gas activities.
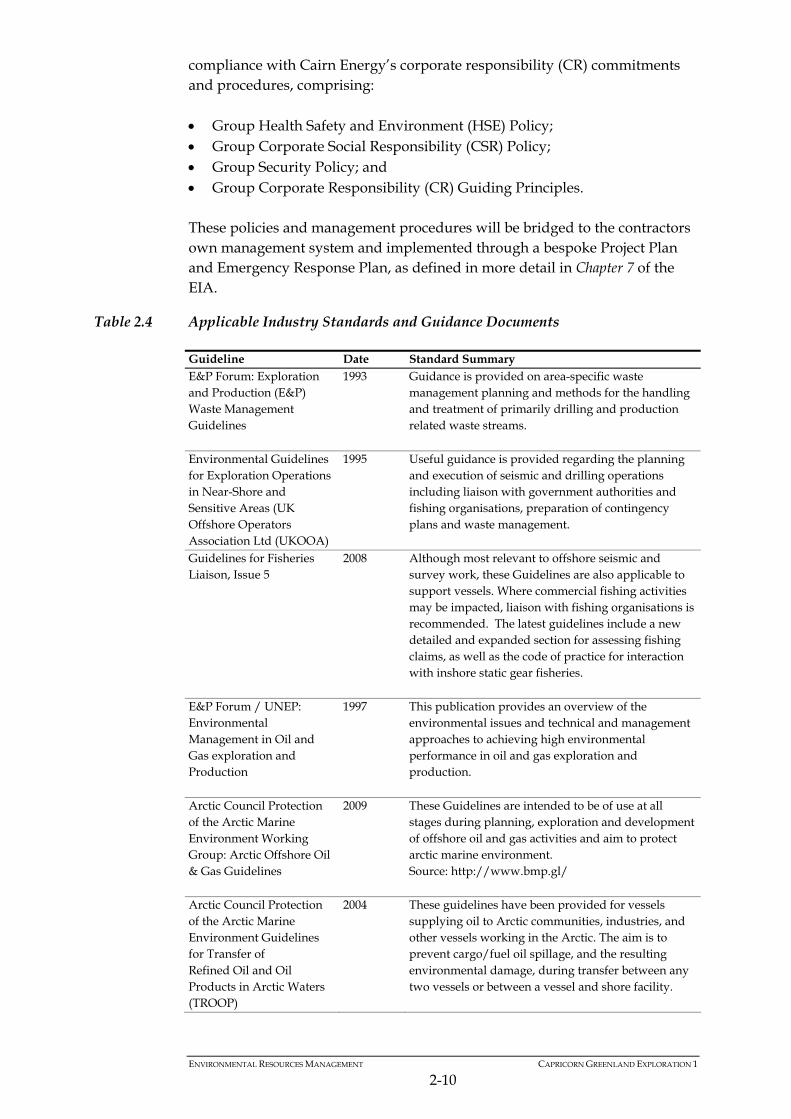
2.4 INTERNATIONAL GUIDELINES AND STANDARDS FOR THE EXPLORATION AND
PRODUCTION INDUSTRY
This section provides an overview of the guidelines and standards that are produced within the Exploration and Production (E&P) sector. Capricorn is committed to ensuring that work is completed in accordance with international good industry practices in line with the standards and guidance shown in Table 2.4. The project will also be conducted within the framework of internal standards and commitments of Capricorn, the drilling management contractor Senergy and the drill rig operators, Stena Drilling. The environmental management of the project will follow the procedures and requirements as specified in Cairn Energy’s Corporate Responsibility Management System (CRMS) which incorporates health, safety and environment (HSE), corporate social responsibility (CSR) and security. The operations will also have to maintain
ENVIRONMENTAL RESOURCES MANAGEMENT CAPRICORN GREENLAND EXPLORATION 1
2-10
compliance with Cairn Energy’s corporate responsibility (CR) commitments and procedures, comprising: Group Health Safety and Environment (HSE) Policy; Group Corporate Social Responsibility (CSR) Policy; Group Security Policy; and Group Corporate Responsibility (CR) Guiding Principles. These policies and management procedures will be bridged to the contractors own management system and implemented through a bespoke Project Plan and Emergency Response Plan, as defined in more detail in Chapter 7 of the EIA.
Table 2.4 Applicable Industry Standards and Guidance Documents
Guideline Date Standard Summary E&P Forum: Exploration and Production (E&P) Waste Management Guidelines
1993 Guidance is provided on area-specific waste management planning and methods for the handling and treatment of primarily drilling and production related waste streams.
Environmental Guidelines for Exploration Operations in Near-Shore and Sensitive Areas (UK Offshore Operators Association Ltd (UKOOA)
1995 Useful guidance is provided regarding the planning and execution of seismic and drilling operations including liaison with government authorities and fishing organisations, preparation of contingency plans and waste management.
Guidelines for Fisheries Liaison, Issue 5
2008 Although most relevant to offshore seismic and survey work, these Guidelines are also applicable to support vessels. Where commercial fishing activities may be impacted, liaison with fishing organisations is recommended. The latest guidelines include a new detailed and expanded section for assessing fishing claims, as well as the code of practice for interaction with inshore static gear fisheries.
E&P Forum / UNEP: Environmental Management in Oil and Gas exploration and Production
1997
This publication provides an overview of the environmental issues and technical and management approaches to achieving high environmental performance in oil and gas exploration and production.
Arctic Council Protection of the Arctic Marine Environment Working Group: Arctic Offshore Oil & Gas Guidelines
2009
These Guidelines are intended to be of use at all stages during planning, exploration and development of offshore oil and gas activities and aim to protect arctic marine environment. Source: http://www.bmp.gl/
Arctic Council Protection of the Arctic Marine Environment Guidelines for Transfer of Refined Oil and Oil Products in Arctic Waters (TROOP)
2004 These guidelines have been provided for vessels supplying oil to Arctic communities, industries, and other vessels working in the Arctic. The aim is to prevent cargo/fuel oil spillage, and the resulting environmental damage, during transfer between any two vessels or between a vessel and shore facility.
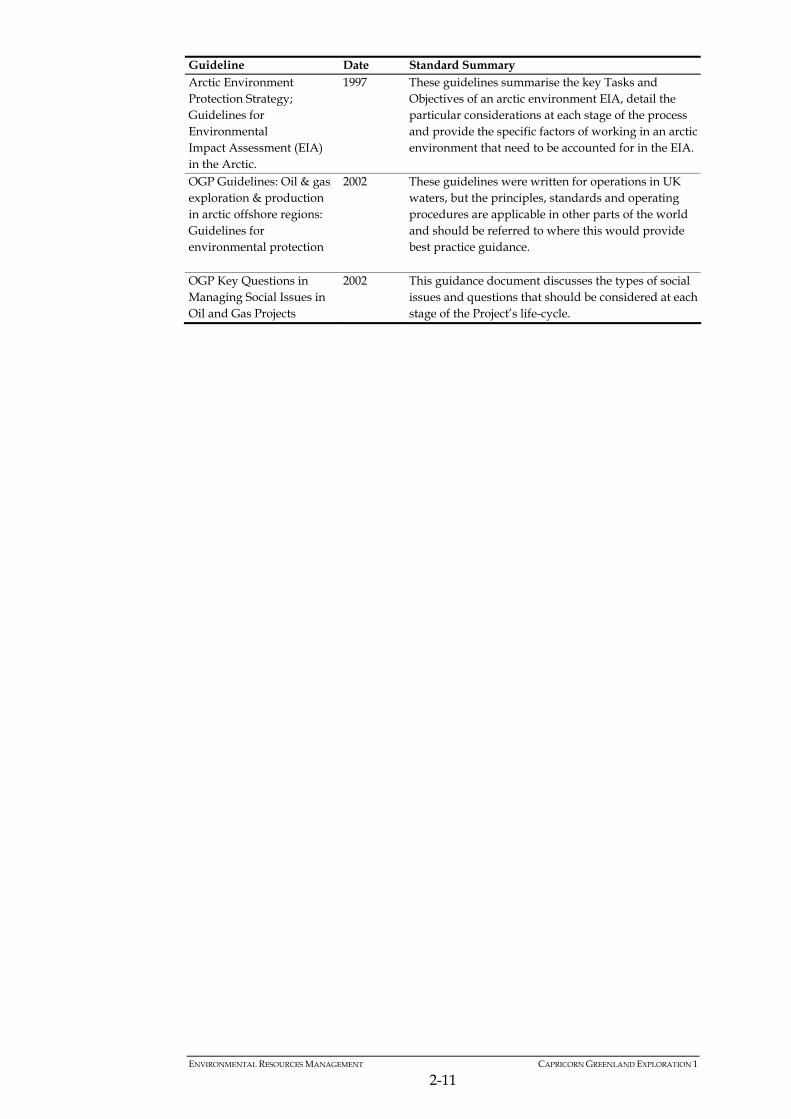
ENVIRONMENTAL RESOURCES MANAGEMENT CAPRICORN GREENLAND EXPLORATION 1
2-11
Guideline Date Standard Summary Arctic Environment Protection Strategy; Guidelines for Environmental Impact Assessment (EIA) in the Arctic.
1997 These guidelines summarise the key Tasks and Objectives of an arctic environment EIA, detail the particular considerations at each stage of the process and provide the specific factors of working in an arctic environment that need to be accounted for in the EIA.
OGP Guidelines: Oil & gas exploration & production in arctic offshore regions: Guidelines for environmental protection
2002
These guidelines were written for operations in UK waters, but the principles, standards and operating procedures are applicable in other parts of the world and should be referred to where this would provide best practice guidance.
OGP Key Questions in Managing Social Issues in Oil and Gas Projects
2002 This guidance document discusses the types of social issues and questions that should be considered at each stage of the Project’s life-cycle.
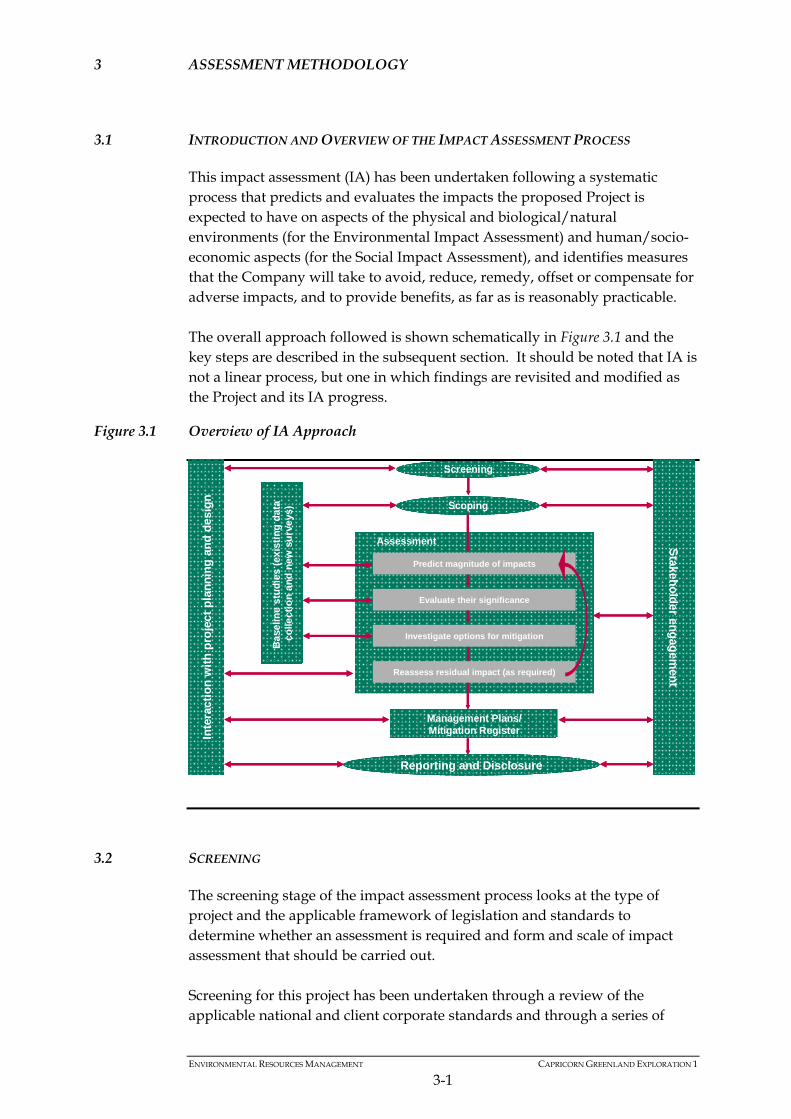
ENVIRONMENTAL RESOURCES MANAGEMENT CAPRICORN GREENLAND EXPLORATION 1
3-1
3 ASSESSMENT METHODOLOGY
3.1 INTRODUCTION AND OVERVIEW OF THE IMPACT ASSESSMENT PROCESS
This impact assessment (IA) has been undertaken following a systematic process that predicts and evaluates the impacts the proposed Project is expected to have on aspects of the physical and biological/natural environments (for the Environmental Impact Assessment) and human/socio-economic aspects (for the Social Impact Assessment), and identifies measures that the Company will take to avoid, reduce, remedy, offset or compensate for adverse impacts, and to provide benefits, as far as is reasonably practicable. The overall approach followed is shown schematically in Figure 3.1 and the key steps are described in the subsequent section. It should be noted that IA is not a linear process, but one in which findings are revisited and modified as the Project and its IA progress.
Figure 3.1 Overview of IA Approach
3.2 SCREENING
The screening stage of the impact assessment process looks at the type of project and the applicable framework of legislation and standards to determine whether an assessment is required and form and scale of impact assessment that should be carried out. Screening for this project has been undertaken through a review of the applicable national and client corporate standards and through a series of
Screening
Scoping
Stakeh
old
er eng
agem
ent
Inte
ract
ion
wit
h p
roje
ct p
lan
nin
g a
nd
des
ign
Bas
elin
e st
ud
ies
(ex
isti
ng
dat
a
colle
ctio
n a
nd
new
su
rve
ys)
Predict magnitude of impacts
Evaluate their significance
Investigate options for mitigation
Reassess residual impact (as required)
Assessment
Management Plans/Mitigation Register
Reporting and Disclosure
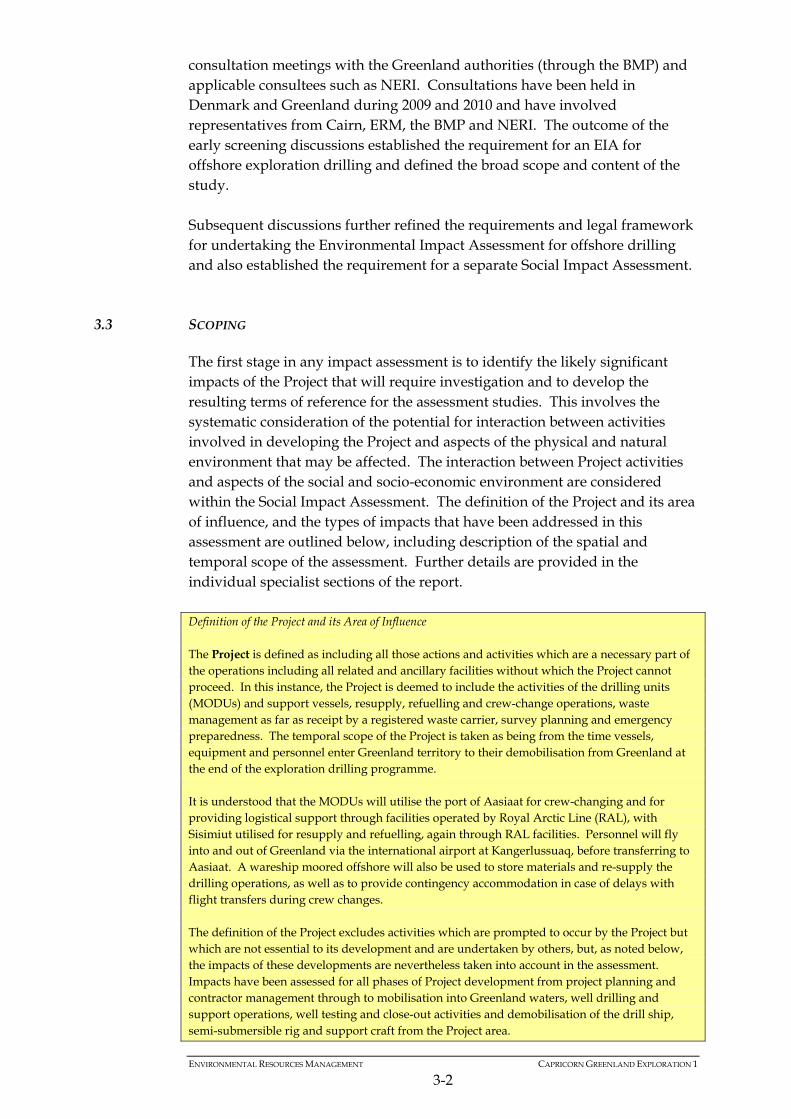
ENVIRONMENTAL RESOURCES MANAGEMENT CAPRICORN GREENLAND EXPLORATION 1
3-2
consultation meetings with the Greenland authorities (through the BMP) and applicable consultees such as NERI. Consultations have been held in Denmark and Greenland during 2009 and 2010 and have involved representatives from Cairn, ERM, the BMP and NERI. The outcome of the early screening discussions established the requirement for an EIA for offshore exploration drilling and defined the broad scope and content of the study. Subsequent discussions further refined the requirements and legal framework for undertaking the Environmental Impact Assessment for offshore drilling and also established the requirement for a separate Social Impact Assessment.
3.3 SCOPING
The first stage in any impact assessment is to identify the likely significant impacts of the Project that will require investigation and to develop the resulting terms of reference for the assessment studies. This involves the systematic consideration of the potential for interaction between activities involved in developing the Project and aspects of the physical and natural environment that may be affected. The interaction between Project activities and aspects of the social and socio-economic environment are considered within the Social Impact Assessment. The definition of the Project and its area of influence, and the types of impacts that have been addressed in this assessment are outlined below, including description of the spatial and temporal scope of the assessment. Further details are provided in the individual specialist sections of the report. Definition of the Project and its Area of Influence The Project is defined as including all those actions and activities which are a necessary part of the operations including all related and ancillary facilities without which the Project cannot proceed. In this instance, the Project is deemed to include the activities of the drilling units (MODUs) and support vessels, resupply, refuelling and crew-change operations, waste management as far as receipt by a registered waste carrier, survey planning and emergency preparedness. The temporal scope of the Project is taken as being from the time vessels, equipment and personnel enter Greenland territory to their demobilisation from Greenland at the end of the exploration drilling programme. It is understood that the MODUs will utilise the port of Aasiaat for crew-changing and for providing logistical support through facilities operated by Royal Arctic Line (RAL), with Sisimiut utilised for resupply and refuelling, again through RAL facilities. Personnel will fly into and out of Greenland via the international airport at Kangerlussuaq, before transferring to Aasiaat. A wareship moored offshore will also be used to store materials and re-supply the drilling operations, as well as to provide contingency accommodation in case of delays with flight transfers during crew changes. The definition of the Project excludes activities which are prompted to occur by the Project but which are not essential to its development and are undertaken by others, but, as noted below, the impacts of these developments are nevertheless taken into account in the assessment. Impacts have been assessed for all phases of Project development from project planning and contractor management through to mobilisation into Greenland waters, well drilling and support operations, well testing and close-out activities and demobilisation of the drill ship, semi-submersible rig and support craft from the Project area.
ENVIRONMENTAL RESOURCES MANAGEMENT CAPRICORN GREENLAND EXPLORATION 1
3-3
Impacts have been assessed throughout the Area of Influence of the Project. This varies depending on the type of impact being considered and is defined in later specialist sections of the report. In each case it includes all that area within which it is considered that significant impacts could occur and takes into account: the physical extent of the operations, defined by the limits of the Exploration License Area; the nature of the baseline environment (biological, physical and socio-economic) and
manner in which impacts are likely to be propagated beyond the Project boundary (for example underwater sound).
The area of influence may also extend across administrative or national boundaries and the assessment includes such trans-boundary effects.
Types of Impact The assessment has considered positive and negative impacts of the Project on physical natural, social and socio-economic resources and receptors. Positive or beneficial impacts are those which are considered to present an improvement to
the baseline or to introduce a new desirable factor. Negative or adverse impacts are the reverse. Aspects of the environment include: The physical environment includes geology and soils, land (eg coastlines), hydrology and
hydrogeology, surface and ground water resources, air, noise, vibration, light and other forms of radiation.
The biological or natural environment includes aquatic and terrestrial habitats, flora and fauna; biodiversity and the community, species and genetic levels; protected areas and ecosystem values.
The cultural environment includes tangible and intangible sites and features of archaeological, historic, traditional, cultural or aesthetic interest, together with traditions and cultural practices and events. These aspects of the environment are considered within the Social Impact Assessment.
The social and socioeconomic environment includes people and their homes, lands and other resources; their health, welfare, amenity, safety and security; lifestyles including subsistence activities, employment and incomes; business premises and economic activity; community facilities; infrastructure; local, regional and national economies. These aspects of the environment are considered within the Social Impact Assessment.
The term resources is used to describe features of the environment such as water resources, habitats, species, landscapes, etc which are valued by society for their intrinsic worth and/or their social or economic contribution. The term receptors is used to define people and communities who may be affected by the Project.
Timeframe Impacts include: permanent impacts that will arise from irreversible changes in conditions such as the removal of features; temporary impacts that will arise during short term activities such as construction or decommissioning; and longer term impacts that will arise over the duration of operational project activities. Short and long term impacts will cease on completion of the drilling activities although there may be a period before the environment returns to its previous condition. Within each of these categories, the assessment considers impacts which are one-off or recurrent, and continuous or intermittent. If intermittent they may occur at varying frequency, and at regular (eg seasonally) or irregular intervals (eg depending on operating or weather conditions).
ENVIRONMENTAL RESOURCES MANAGEMENT CAPRICORN GREENLAND EXPLORATION 1
3-4
Direct, Induced and Higher Order Impacts The assessment includes direct impacts arising from activities associated with the Project (primary impacts) and impacts that follow on as a consequence of these (secondary and higher order impacts). So for example underwater sound from dynamic positioning thrusters on the MODUs may have a direct short term behavioural affect on the movement of fish. This temporary displacement of fish stocks may subsequently have either a positive or negative secondary effect on catch levels (depending on whether fish are displaced towards or away from established fishing grounds), however given the short-term nature there is unlikely to be any tertiary impact on economic performance or livelihoods. Projects can also have induced impacts by stimulating other developments to take place which are not directly within the scope of or essential to the development of the Project. So for example, a Project may encourage people to move into an area attracted by the possibility of employment even though they may not actually obtain jobs at the facility, and as a result lead to building of new homes and other facilities. A new road or harbour improvement could encourage business to relocate because of access improvements, although this may not have been the intention of the developer. Given the short duration of the exploration drilling programme, it is not likely that there will be any induced impacts from further stimulated developments. Should this current phase of exploration drilling lead to subsequent production, induced impacts could potentially become pertinent and this is considered further within the Social Impact Assessment.
Cumulative Impacts The Project may also be taking place at the same time as other operations causing impacts affecting the same resources or receptors, such that there will be cumulative effects with the proposed Project. The impacts of other projects already underway or committed have been taken into account in describing the future baseline for the Project (ie the without Project situation against which the impacts of the Project are assessed), however, if there are other developments in the area which are in preparation or envisaged, but which are not yet committed, the cumulative effect of these with the Project is considered. The Project definition encompasses the activities of both MODUs and the associated support operations. As such, the most likely potential cumulative impact from exploration drilling occurs where other operators are intending to drill or acquire seismic data in areas which may cause impacts affecting the same resources or receptors (eg marine mammals or fish). Where a particular resource of receptor is affected by more than one type of impact from the Project the combined impact of these on the receptor will also be taken into account.
Routine and Non-Routine Impacts Finally the EIA has assessed both: routine impacts resulting from planned activities of the Project; and non-routine impacts arising from: unplanned or accidental events within the Project such as equipment breakdown or
catastrophic failure; and external events affecting the operation such as extreme weather activity. The impact of non-routine events is assessed in terms of the Risk ie taking into account both the consequence of the event and the probability of occurrence (Risk = probability x consequence)
The aim of scoping has been to focus the assessment on the likely significant impacts. An initial scan of the Project and its environment was undertaken using early project and baseline data to identify all possible impacts. Those which might be expected to be significant were then identified taking into
ENVIRONMENTAL RESOURCES MANAGEMENT CAPRICORN GREENLAND EXPLORATION 1
3-5
account legislation, policy and good practice, the judgement of the specialists within the team and the views of consultees.
3.3.1 Consultation
Initial consultation has been undertaken with a limited number of key stakeholders, primarily for the purposes of initial EIA screening, verifying the scope of work and gathering baseline data. This entailed communications with the Bureau of Minerals and Petroleum (BMP), The National Environmental Research Institute (NERI) – part of Aarhus University in Denmark and the Greenland Institute of Natural Resources (GINR). The views of key stakeholders, together with relevant guidance documents published by the BMP and NERI have been taken into account in developing the scope and approach of this assessment. Further stakeholder consultation has been undertaken as part of the Social Impact Assessment, with full details included within the relevant Chapter of the SIA report. During Scoping the team also considered: The methods to be used to characterise the baseline environment and to
predict and evaluate impacts - the details of these are described in each specialist section.
The likely availability of information given the relative scarcity of
environmental data for certain topics such as marine mammal distribution. The alternatives to be considered - these are described further in Chapter 4
of the EIA. It should be noted that although initial scoping was carried out early in the IA process, it is an activity that continues as new issues and information emerge during studies and stakeholder consultations, and as a result of development of the Project design. The results of scoping have been used to develop the structure of this assessment, to inform project workshops held with the client and to identify areas where baseline information is scarce and additional research may be warranted in future.
3.4 BASELINE DATA COLLECTION
To provide a baseline against which the impacts of the Project can be assessed the assessment provides a description of the conditions that will prevail in the absence of the Project. The baseline includes information on all receptors and resources that were identified during scoping as having the potential to be significantly affected by the proposed Project. The description of the baseline has the following main objectives:
ENVIRONMENTAL RESOURCES MANAGEMENT CAPRICORN GREENLAND EXPLORATION 1
3-6
To identify the key environmental and socio-economic conditions in areas potentially affected by the Project and highlight those that may be vulnerable to aspects of the Project.
To describe and where possible quantify their characteristics (nature,
condition, quality, extent, etc) now and in the future in the absence of the Project (1).
To provide data to aid the prediction and evaluation of possible impacts. To inform judgements about the importance, value and sensitivity of
resources and receptors. For this IA, baseline data collection proceeded in stages: Collection of available data from existing sources including:
o government agencies; o research and academic organisations; o published sources; o external stakeholders and the public; and o previous exploration PEIAs held by the client.
Geophysical and environmental surveys of the well site locations to inform
the physical and biological components of the baseline. In-country information gathering and stakeholder interviews to inform the
socio-economic baseline for the SIA.
3.5 INTERFACE WITH PROJECT PLANNING AND DESIGN
3.5.1 Developing the Project Description
A key aspect of the IA has been the interface between the IA Team and the Project team. The Project team has provided information for the assessment on details relating to the planning and operation of the Project. As impacts have been investigated the results have been fed back and appropriate mitigation measures agreed and integrated into the Project. This has been an iterative process throughout the studies. As the Project has developed the description of the Project in Chapter 5 has been revised to include all planned mitigation reflecting the commitment that has been made by the Project proponent to the agreed proposals. All the planned mitigation is identified in the Environmental Mitigation and
(1) As noted above, the future baseline takes into account trends that are apparent in the baseline (eg depletion of fisheries, hunting statistics). The future baseline also takes into consideration other developments in the area which are underway or
committed, however in the context of a short-term activity such as exploration drilling, future baseline trends are less pertinent. The future baseline can be considered as the No Project scenario against which the impacts of the Project are
assessed.
ENVIRONMENTAL RESOURCES MANAGEMENT CAPRICORN GREENLAND EXPLORATION 1
3-7
Monitoring Plan which forms Chapter 7 of the EIA report and in the draft Benefit and Impact Plan within the SIA.
3.5.2 Consideration of Alternatives
As part of the PEIA process, the IA team has reviewed alternatives to the proposed operations. These have included alternative methodologies and equipment, as well as the ‘no development option’. Further details are provided in Chapter 5.
3.6 ASSESSMENT OF IMPACTS
3.6.1 General Considerations
The assessment of impacts has proceeded through an iterative process considering four questions: 1. Prediction – What will happen to the human or natural environment as a
consequence of this Project? 2. Evaluation – Does this impact matter? How important or significant is it? 3. Mitigation – If it is significant can anything be done about it? 4. Residual Impact – Is it still significant? Where significant residual impacts remain further options for mitigation may be considered and impacts re-assessed until they are as low as reasonably practicable.
3.6.2 Predicting the Magnitude of Impacts
The IA describes what will happen by predicting the magnitude of impacts and quantifying these to the extent practicable. The term ‘magnitude’ is used as shorthand to encompass all the dimensions of the predicted impact including: the nature of the change (what is affected and how); its size, scale or intensity; its geographical extent and distribution; its duration, frequency, reversibility, etc; and where relevant, the probability of the impact occurring as a result of
accidental or unplanned events. It also includes any uncertainty about the occurrence or scale of the impact, expressed as ranges, confidence limits or likelihood (1).
(1) A distinction is made here between the probability of impact arising from a non-routine event such as an accidental explosion or spill, and the likelihood of an uncertain impact; for example it may not be certain that migrating species will
be present during operations.
ENVIRONMENTAL RESOURCES MANAGEMENT CAPRICORN GREENLAND EXPLORATION 1
3-8
Magnitude therefore describes the actual change that is predicted to occur in the resource or receptor (eg the area and duration over which water may become polluted and the level of increase in concentration; the degree and probability of impact on the livelihood of a local community; the probability and consequences in terms of fatalities from a major accident). An overall grading of the magnitude of impacts is provided taking into account all the various dimensions to determine whether an impact is of negligible, small, medium or large magnitude. This scale is defined differently according to the type of impact and a more or less detailed scale may be used for particular impacts depending on the circumstances. For readily quantifiable impacts such as noise numerical values can be used whilst for other topics a more qualitative classification is necessary. The details of how magnitude is predicted and described for each impact are presented in the relevant chapters of the IA Report.
3.6.3 Evaluation of Significance
The next step in the assessment is to take the information on the magnitude of impacts, and explain what this means in terms of its importance to people and the environment, so that decision makers and stakeholders understand how much weight should be given to the issue in deciding on their view of the Project. This is referred to as Evaluation of Significance. There is no statutory definition of significance; however, for the purposes of this IA, the following practical definition of when an impact is judged to be significant is used:
An impact is significant if, in isolation or in combination with other impacts, it should, in the judgement of the IA team, be reported in the IA report so that it can be taken into account in the decision on whether or not the Project should proceed and if so under what conditions.
This recognises that evaluation requires an exercise of judgement and that judgements may vary between parties in the process. The evaluation of impacts that is presented in this IA Report is based on the judgement of the IA team, informed by reference to legal standards, government policy, current good practice and the views of stakeholders. Criteria for assessing the significance of impacts are clearly defined for each topic area and types of impact taking into account whether the Project will: Cause legal or accepted environmental standards to be exceeded – eg air,
water or soil quality, noise levels – or make a substantial contribution to the likelihood of a standard being exceeded.
Adversely affect protected areas or features, or valuable resources – nature
conservation areas, rare or protected species, protected landscapes, historic features.
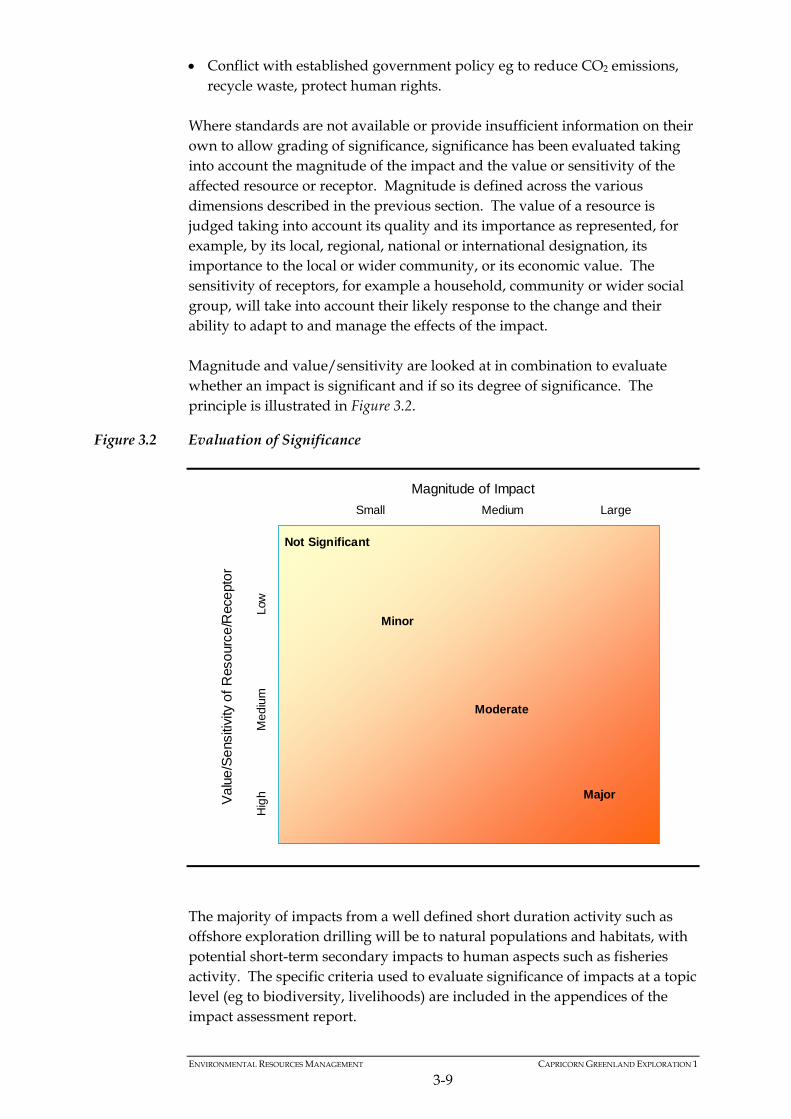
ENVIRONMENTAL RESOURCES MANAGEMENT CAPRICORN GREENLAND EXPLORATION 1
3-9
Conflict with established government policy eg to reduce CO2 emissions, recycle waste, protect human rights.
Where standards are not available or provide insufficient information on their own to allow grading of significance, significance has been evaluated taking into account the magnitude of the impact and the value or sensitivity of the affected resource or receptor. Magnitude is defined across the various dimensions described in the previous section. The value of a resource is judged taking into account its quality and its importance as represented, for example, by its local, regional, national or international designation, its importance to the local or wider community, or its economic value. The sensitivity of receptors, for example a household, community or wider social group, will take into account their likely response to the change and their ability to adapt to and manage the effects of the impact. Magnitude and value/sensitivity are looked at in combination to evaluate whether an impact is significant and if so its degree of significance. The principle is illustrated in Figure 3.2.
Figure 3.2 Evaluation of Significance
The majority of impacts from a well defined short duration activity such as offshore exploration drilling will be to natural populations and habitats, with potential short-term secondary impacts to human aspects such as fisheries activity. The specific criteria used to evaluate significance of impacts at a topic level (eg to biodiversity, livelihoods) are included in the appendices of the impact assessment report.
Magnitude of Impact
Va
lue
/Se
nsiti
vity
of
Res
our
ce/R
ece
pto
r
Small Medium Large
Hig
hM
ediu
m
Lo
w
Not Significant
Minor
Moderate
Major
ENVIRONMENTAL RESOURCES MANAGEMENT CAPRICORN GREENLAND EXPLORATION 1
3-10
3.6.4 Mitigation
Impact assessment is designed to ensure that decisions on Projects are made in full knowledge of their likely impacts on the environment and society. A vital step within the process is the identification of measures that can be taken to mitigate impacts so that these can be incorporated into the Project. An important outcome of this IA has been the improvements it has generated in the environmental performance of the Project. This has been achieved by integrating mitigation into the design of the Project, the methods for its operation, and the management of the development process. The process has involved identifying where significant impacts could occur and then working with the Project proponent to identify practical and affordable ways of mitigating those impacts as far as possible. These measures have been agreed with the Project proponent and integrated into the Project design. Where a significant impact is identified, a hierarchy of options for mitigation has been considered to identify the preferred approach: Avoid at source – remove the source of the impact, eg avoid water
pollution by not using oil based muds for drilling. Abate at source – reduce the source of the impact, eg reduce the level of air
emissions through maintenance programmes and the use of modern equipment.
Attenuate – reduce the impact between the source and the receptor, eg
reducing fisheries impacts through prior notification and good communications with fisheries groups.
Abate at the receptor – reduce the impact at the receptor, eg use of
appropriate waste disposal (lined pits) to reduce groundwater impacts from landfill.
Remedy – repair the damage after it has occurred, eg clean-up and
restoration activities following an accidental oil spill. Compensate / offset – replace in kind or with a different resource of equal
value, eg re-establishing / relocating habitats due to road building or major onshore infrastructure projects.
3.6.5 Assessing Residual Impacts
Following agreement on feasible mitigation the IA team has re-assessed the impacts taking into account the mitigation now integrated into design and operation of the Project. Where an impact could not be completely avoided the residual impact has been reassessed and the possibility for further
ENVIRONMENTAL RESOURCES MANAGEMENT CAPRICORN GREENLAND EXPLORATION 1
3-11
mitigation considered. All residual significant impacts are described in this report with commentary on why further mitigation is not feasible. Where the impact is of more than minor significance the IA explains how the impact has been reduced to as low as reasonably practicable. The degree of significance attributed to residual impacts is related to the weight the IA team considers should be given to them in reaching a decision on the Project. Any residual major impacts, whether positive or negative, are considered
to warrant substantial weight, when compared with other environmental, social or economic costs and benefits, in the decision on whether the Project should be permitted to proceed; conditions should be imposed to ensure adverse impacts are strictly controlled and monitored and beneficial impacts are fully delivered.
Residual moderate impacts are considered to be of reducing importance to
the decision, but still warranting careful attention to conditions regarding mitigation and monitoring, to ensure best available techniques are used to keep adverse impacts as low as reasonably practicable, and to ensure beneficial impacts are delivered.
Minor impacts should be brought to the attention of the decision-maker but
are identified as warranting little if any weight in the decision; mitigation can be achieved using normal good practice and monitoring should be carried out to confirm that impacts do not exceed predicted levels.
3.6.6 Dealing with Uncertainty
Even with a firm Project design and an unchanging environment, predictions are by definition uncertain. In this IA predictions have been made using methods ranging from qualitative assessment and expert judgement to quantitative modelling. The accuracy of predictions will depend on the method and the quality of the input data on the Project and the environment. Where assumptions have been made, the natures of any uncertainties which stem from these are presented in the topic specific descriptions. Uncertainty can also arise as a result of the stage in the planning process at the time of preparation of this IA report. Where this results in uncertainty that is material to the findings of the IA, this is clearly stated. The general approach has then been to take a conservative view of the likely residual impacts, to identify standards of performance which the Project will meet where firm predictions cannot be made, and to propose monitoring and further contingency measures. In order to facilitate decision-making, areas of uncertainty, data gaps and deficiencies, and additional work required during further stages of Project development have been highlighted within the report.
ENVIRONMENTAL RESOURCES MANAGEMENT CAPRICORN GREENLAND EXPLORATION 1
3-12
3.7 MANAGEMENT AND MONITORING
A range of different measures to mitigate impacts have been identified through the assessment and the developer is committed to their implementation within the Project. Within the EIA, these measures are set out in the Project description and the specialist chapters of the report and, to assist the reader, they have been brought together in the Environmental Mitigation and Monitoring Chapter (Chapter 7 of the EIA). Included in the Environmental Mitigation and Monitoring Chapter is the Environmental Protection Plan (EPP) as specified in the applicable EIA guidance documents referenced previously. The EPP is provided in tabular format for ease of use and quick referencing with the identified impacts in Chapter 6 of the EIA report. Within the SIA, the measures for addressing impacts from the Project on the human environment are included in a draft Benefit and Impact Plan, which forms the basis for negotiating the Impact Benefit Agreement between the client and applicable Greenland authorities. A draft Monitoring Plan is also included within the SIA which sets out the necessary actions for measuring the implementation of the programmes in the Benefit and Impact Plan. Based on the Monitoring Plan, an Evaluation Plan is also implemented in order to propose how the monitoring results should be evaluated and whether monitoring needs to be supplemented or adjusted, and if the Benefit and Impact Plan is sufficient and realistic etc.
3.8 REPORTING AND NEXT STEPS
The EIA and SIA reports will be submitted by Capricorn to the Greenland authorities (specifically the Bureau of Minerals and Petroleum) as part of the application to undertake exploration drilling activities. Also included within this application will be details of the Capricorn drilling management team, drilling contractor, emergency response procedures, Capricorn Corporate Responsibility ‘Guiding Principles’, company HSE policies and commitments, detailed oil spill response plan and Capricorn’s corporate management structure. Public presentations giving the details of the Project have been undertaken as part of the Social Impact Assessment. Details of this and other stakeholder engagement activities are provided within the SIA report. Subsequent dissemination of the EIA and SIA is managed by the Bureau of Minerals and Petroleum and it is understood that the documents will be made available for public release by the Greenland authorities.
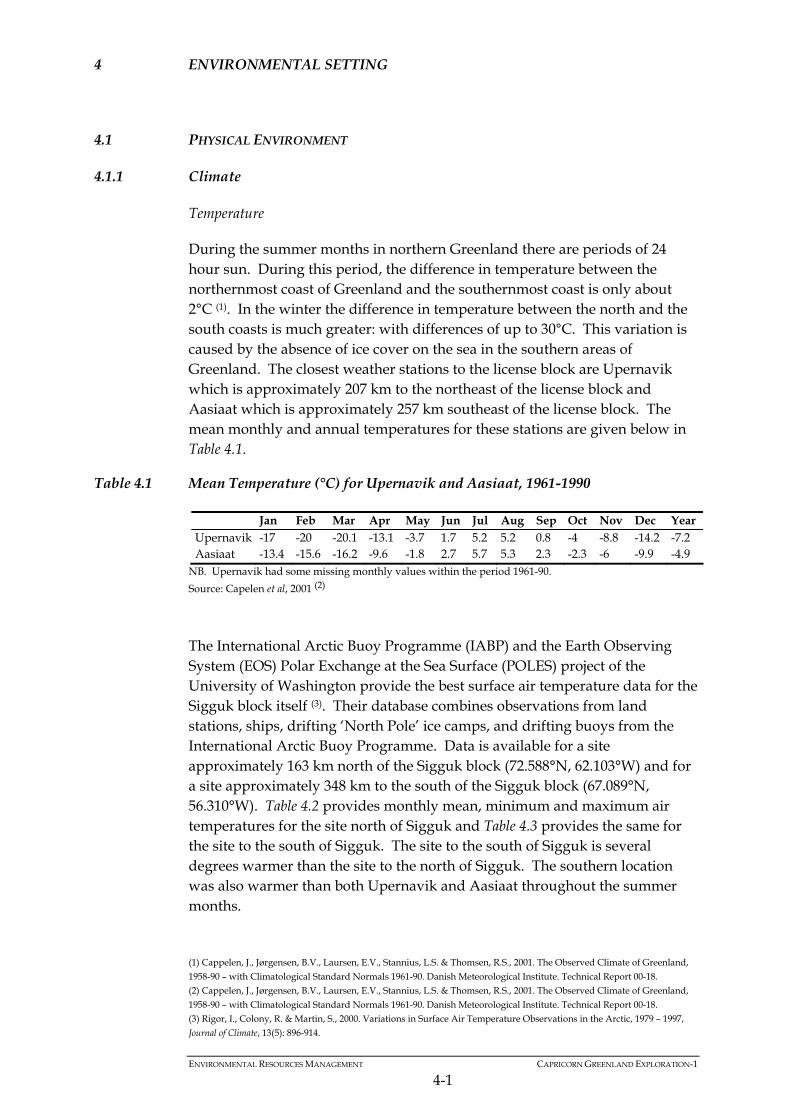
ENVIRONMENTAL RESOURCES MANAGEMENT CAPRICORN GREENLAND EXPLORATION-1
4-1
4 ENVIRONMENTAL SETTING
4.1 PHYSICAL ENVIRONMENT
4.1.1 Climate
Temperature
During the summer months in northern Greenland there are periods of 24 hour sun. During this period, the difference in temperature between the northernmost coast of Greenland and the southernmost coast is only about 2°C (1). In the winter the difference in temperature between the north and the south coasts is much greater: with differences of up to 30°C. This variation is caused by the absence of ice cover on the sea in the southern areas of Greenland. The closest weather stations to the license block are Upernavik which is approximately 207 km to the northeast of the license block and Aasiaat which is approximately 257 km southeast of the license block. The mean monthly and annual temperatures for these stations are given below in Table 4.1.
Table 4.1 Mean Temperature (°C) for Upernavik and Aasiaat, 1961-1990
Jan Feb Mar Apr May Jun Jul Aug Sep Oct Nov Dec Year Upernavik -17 -20 -20.1 -13.1 -3.7 1.7 5.2 5.2 0.8 -4 -8.8 -14.2 -7.2 Aasiaat -13.4 -15.6 -16.2 -9.6 -1.8 2.7 5.7 5.3 2.3 -2.3 -6 -9.9 -4.9
NB. Upernavik had some missing monthly values within the period 1961-90.
Source: Capelen et al, 2001 (2) The International Arctic Buoy Programme (IABP) and the Earth Observing System (EOS) Polar Exchange at the Sea Surface (POLES) project of the University of Washington provide the best surface air temperature data for the Sigguk block itself (3). Their database combines observations from land stations, ships, drifting ‘North Pole’ ice camps, and drifting buoys from the International Arctic Buoy Programme. Data is available for a site approximately 163 km north of the Sigguk block (72.588°N, 62.103°W) and for a site approximately 348 km to the south of the Sigguk block (67.089°N, 56.310°W). Table 4.2 provides monthly mean, minimum and maximum air temperatures for the site north of Sigguk and Table 4.3 provides the same for the site to the south of Sigguk. The site to the south of Sigguk is several degrees warmer than the site to the north of Sigguk. The southern location was also warmer than both Upernavik and Aasiaat throughout the summer months.
(1) Cappelen, J., Jørgensen, B.V., Laursen, E.V., Stannius, L.S. & Thomsen, R.S., 2001. The Observed Climate of Greenland,
1958-90 – with Climatological Standard Normals 1961-90. Danish Meteorological Institute. Technical Report 00-18. (2) Cappelen, J., Jørgensen, B.V., Laursen, E.V., Stannius, L.S. & Thomsen, R.S., 2001. The Observed Climate of Greenland,
1958-90 – with Climatological Standard Normals 1961-90. Danish Meteorological Institute. Technical Report 00-18. (3) Rigor, I., Colony, R. & Martin, S., 2000. Variations in Surface Air Temperature Observations in the Arctic, 1979 – 1997,
Journal of Climate, 13(5): 896-914.
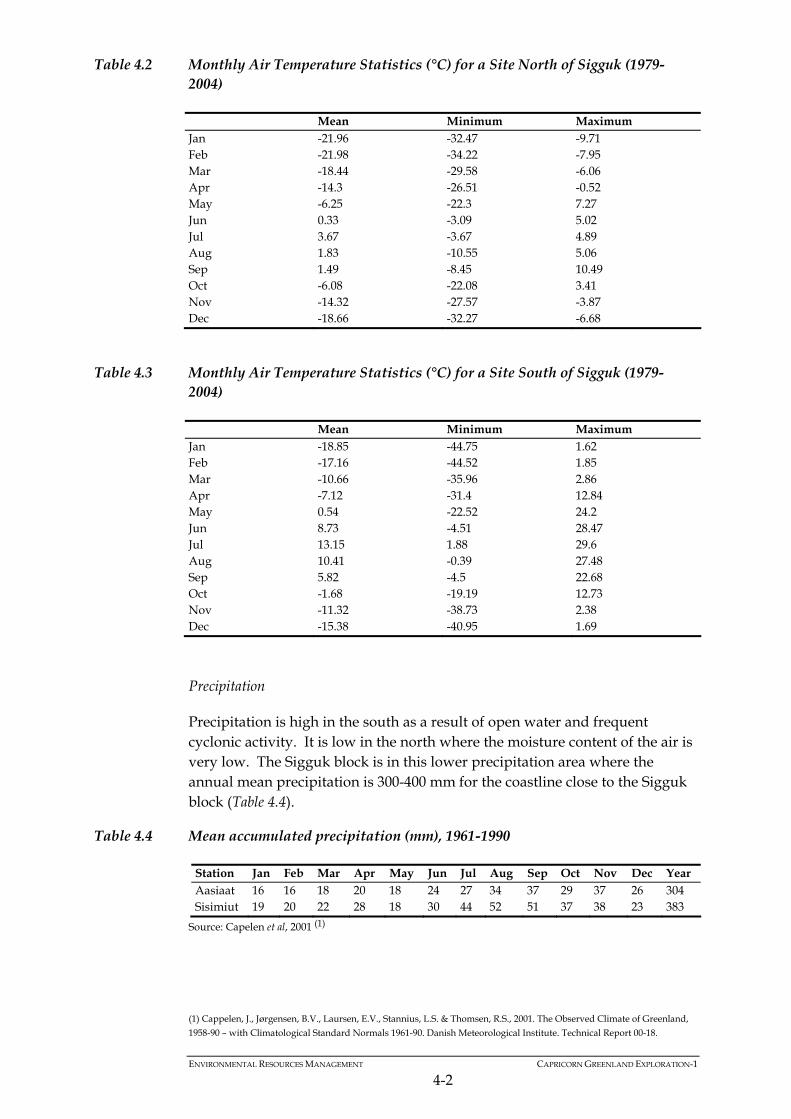
ENVIRONMENTAL RESOURCES MANAGEMENT CAPRICORN GREENLAND EXPLORATION-1
4-2
Table 4.2 Monthly Air Temperature Statistics (°C) for a Site North of Sigguk (1979-2004)
Mean Minimum Maximum Jan -21.96 -32.47 -9.71 Feb -21.98 -34.22 -7.95 Mar -18.44 -29.58 -6.06 Apr -14.3 -26.51 -0.52 May -6.25 -22.3 7.27 Jun 0.33 -3.09 5.02 Jul 3.67 -3.67 4.89 Aug 1.83 -10.55 5.06 Sep 1.49 -8.45 10.49 Oct -6.08 -22.08 3.41 Nov -14.32 -27.57 -3.87 Dec -18.66 -32.27 -6.68
Table 4.3 Monthly Air Temperature Statistics (°C) for a Site South of Sigguk (1979-2004)
Mean Minimum Maximum Jan -18.85 -44.75 1.62 Feb -17.16 -44.52 1.85 Mar -10.66 -35.96 2.86 Apr -7.12 -31.4 12.84 May 0.54 -22.52 24.2 Jun 8.73 -4.51 28.47 Jul 13.15 1.88 29.6 Aug 10.41 -0.39 27.48 Sep 5.82 -4.5 22.68 Oct -1.68 -19.19 12.73 Nov -11.32 -38.73 2.38 Dec -15.38 -40.95 1.69
Precipitation
Precipitation is high in the south as a result of open water and frequent cyclonic activity. It is low in the north where the moisture content of the air is very low. The Sigguk block is in this lower precipitation area where the annual mean precipitation is 300-400 mm for the coastline close to the Sigguk block (Table 4.4).
Table 4.4 Mean accumulated precipitation (mm), 1961-1990
Station Jan Feb Mar Apr May Jun Jul Aug Sep Oct Nov Dec Year Aasiaat 16 16 18 20 18 24 27 34 37 29 37 26 304 Sisimiut 19 20 22 28 18 30 44 52 51 37 38 23 383
Source: Capelen et al, 2001 (1)
(1) Cappelen, J., Jørgensen, B.V., Laursen, E.V., Stannius, L.S. & Thomsen, R.S., 2001. The Observed Climate of Greenland,
1958-90 – with Climatological Standard Normals 1961-90. Danish Meteorological Institute. Technical Report 00-18.
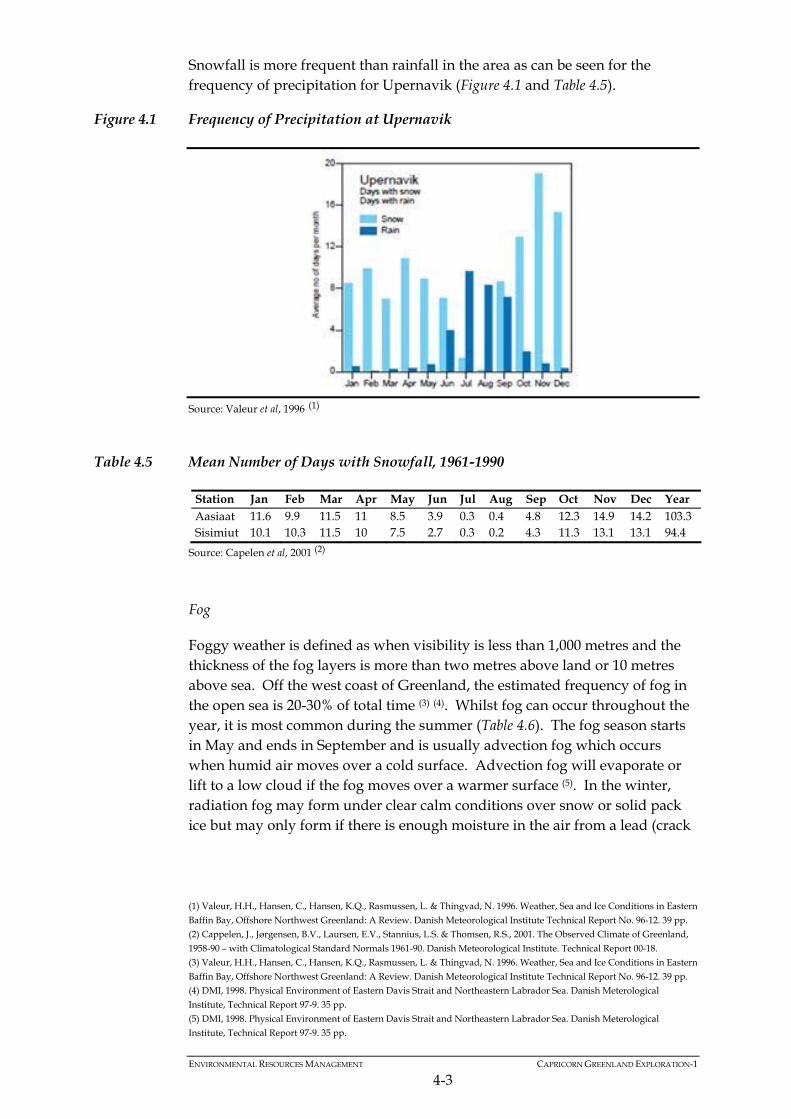
ENVIRONMENTAL RESOURCES MANAGEMENT CAPRICORN GREENLAND EXPLORATION-1
4-3
Snowfall is more frequent than rainfall in the area as can be seen for the frequency of precipitation for Upernavik (Figure 4.1 and Table 4.5).
Figure 4.1 Frequency of Precipitation at Upernavik
Source: Valeur et al, 1996 (1)
Table 4.5 Mean Number of Days with Snowfall, 1961-1990
Station Jan Feb Mar Apr May Jun Jul Aug Sep Oct Nov Dec Year Aasiaat 11.6 9.9 11.5 11 8.5 3.9 0.3 0.4 4.8 12.3 14.9 14.2 103.3 Sisimiut 10.1 10.3 11.5 10 7.5 2.7 0.3 0.2 4.3 11.3 13.1 13.1 94.4
Source: Capelen et al, 2001 (2) Fog
Foggy weather is defined as when visibility is less than 1,000 metres and the thickness of the fog layers is more than two metres above land or 10 metres above sea. Off the west coast of Greenland, the estimated frequency of fog in the open sea is 20-30% of total time (3) (4). Whilst fog can occur throughout the year, it is most common during the summer (Table 4.6). The fog season starts in May and ends in September and is usually advection fog which occurs when humid air moves over a cold surface. Advection fog will evaporate or lift to a low cloud if the fog moves over a warmer surface (5). In the winter, radiation fog may form under clear calm conditions over snow or solid pack ice but may only form if there is enough moisture in the air from a lead (crack
(1) Valeur, H.H., Hansen, C., Hansen, K.Q., Rasmussen, L. & Thingvad, N. 1996. Weather, Sea and Ice Conditions in Eastern
Baffin Bay, Offshore Northwest Greenland: A Review. Danish Meteorological Institute Technical Report No. 96-12. 39 pp. (2) Cappelen, J., Jørgensen, B.V., Laursen, E.V., Stannius, L.S. & Thomsen, R.S., 2001. The Observed Climate of Greenland,
1958-90 – with Climatological Standard Normals 1961-90. Danish Meteorological Institute. Technical Report 00-18. (3) Valeur, H.H., Hansen, C., Hansen, K.Q., Rasmussen, L. & Thingvad, N. 1996. Weather, Sea and Ice Conditions in Eastern
Baffin Bay, Offshore Northwest Greenland: A Review. Danish Meteorological Institute Technical Report No. 96-12. 39 pp. (4) DMI, 1998. Physical Environment of Eastern Davis Strait and Northeastern Labrador Sea. Danish Meterological
Institute, Technical Report 97-9. 35 pp. (5) DMI, 1998. Physical Environment of Eastern Davis Strait and Northeastern Labrador Sea. Danish Meterological
Institute, Technical Report 97-9. 35 pp.
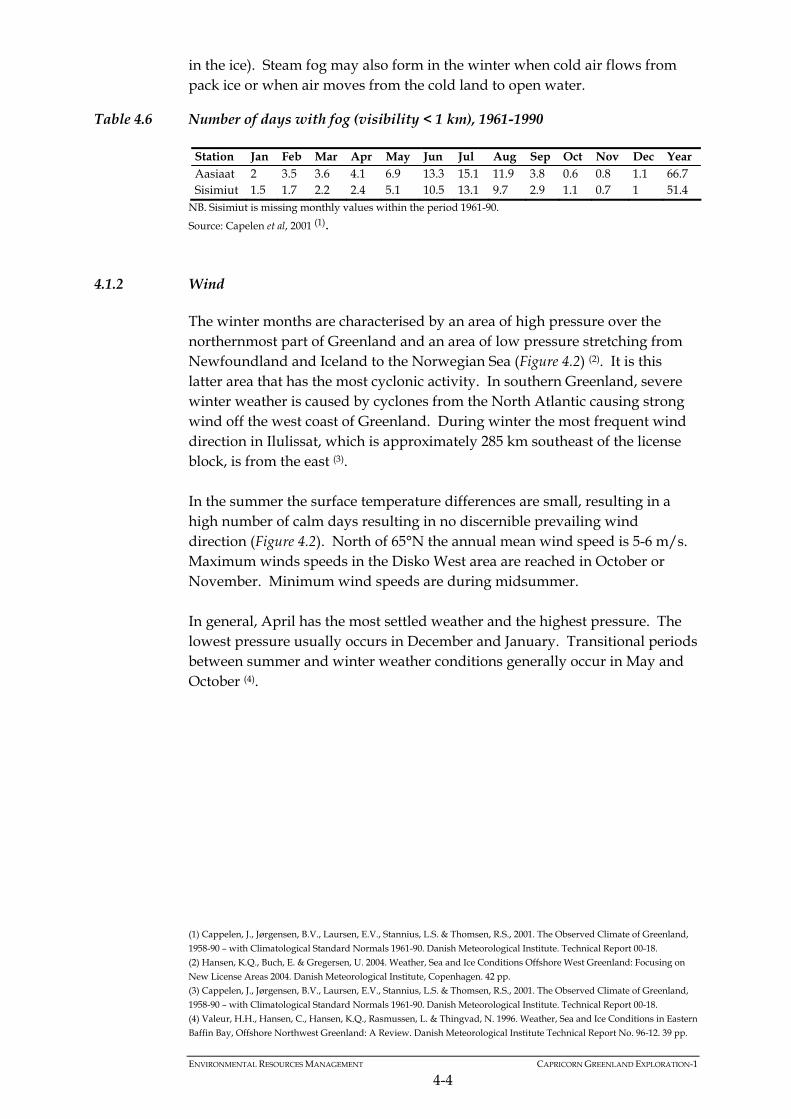
ENVIRONMENTAL RESOURCES MANAGEMENT CAPRICORN GREENLAND EXPLORATION-1
4-4
in the ice). Steam fog may also form in the winter when cold air flows from pack ice or when air moves from the cold land to open water.
Table 4.6 Number of days with fog (visibility < 1 km), 1961-1990
Station Jan Feb Mar Apr May Jun Jul Aug Sep Oct Nov Dec Year Aasiaat 2 3.5 3.6 4.1 6.9 13.3 15.1 11.9 3.8 0.6 0.8 1.1 66.7 Sisimiut 1.5 1.7 2.2 2.4 5.1 10.5 13.1 9.7 2.9 1.1 0.7 1 51.4
NB. Sisimiut is missing monthly values within the period 1961-90.
Source: Capelen et al, 2001 (1).
4.1.2 Wind
The winter months are characterised by an area of high pressure over the northernmost part of Greenland and an area of low pressure stretching from Newfoundland and Iceland to the Norwegian Sea (Figure 4.2) (2). It is this latter area that has the most cyclonic activity. In southern Greenland, severe winter weather is caused by cyclones from the North Atlantic causing strong wind off the west coast of Greenland. During winter the most frequent wind direction in Ilulissat, which is approximately 285 km southeast of the license block, is from the east (3). In the summer the surface temperature differences are small, resulting in a high number of calm days resulting in no discernible prevailing wind direction (Figure 4.2). North of 65°N the annual mean wind speed is 5-6 m/s. Maximum winds speeds in the Disko West area are reached in October or November. Minimum wind speeds are during midsummer. In general, April has the most settled weather and the highest pressure. The lowest pressure usually occurs in December and January. Transitional periods between summer and winter weather conditions generally occur in May and October (4).
(1) Cappelen, J., Jørgensen, B.V., Laursen, E.V., Stannius, L.S. & Thomsen, R.S., 2001. The Observed Climate of Greenland,
1958-90 – with Climatological Standard Normals 1961-90. Danish Meteorological Institute. Technical Report 00-18. (2) Hansen, K.Q., Buch, E. & Gregersen, U. 2004. Weather, Sea and Ice Conditions Offshore West Greenland: Focusing on
New License Areas 2004. Danish Meteorological Institute, Copenhagen. 42 pp. (3) Cappelen, J., Jørgensen, B.V., Laursen, E.V., Stannius, L.S. & Thomsen, R.S., 2001. The Observed Climate of Greenland,
1958-90 – with Climatological Standard Normals 1961-90. Danish Meteorological Institute. Technical Report 00-18. (4) Valeur, H.H., Hansen, C., Hansen, K.Q., Rasmussen, L. & Thingvad, N. 1996. Weather, Sea and Ice Conditions in Eastern
Baffin Bay, Offshore Northwest Greenland: A Review. Danish Meteorological Institute Technical Report No. 96-12. 39 pp.
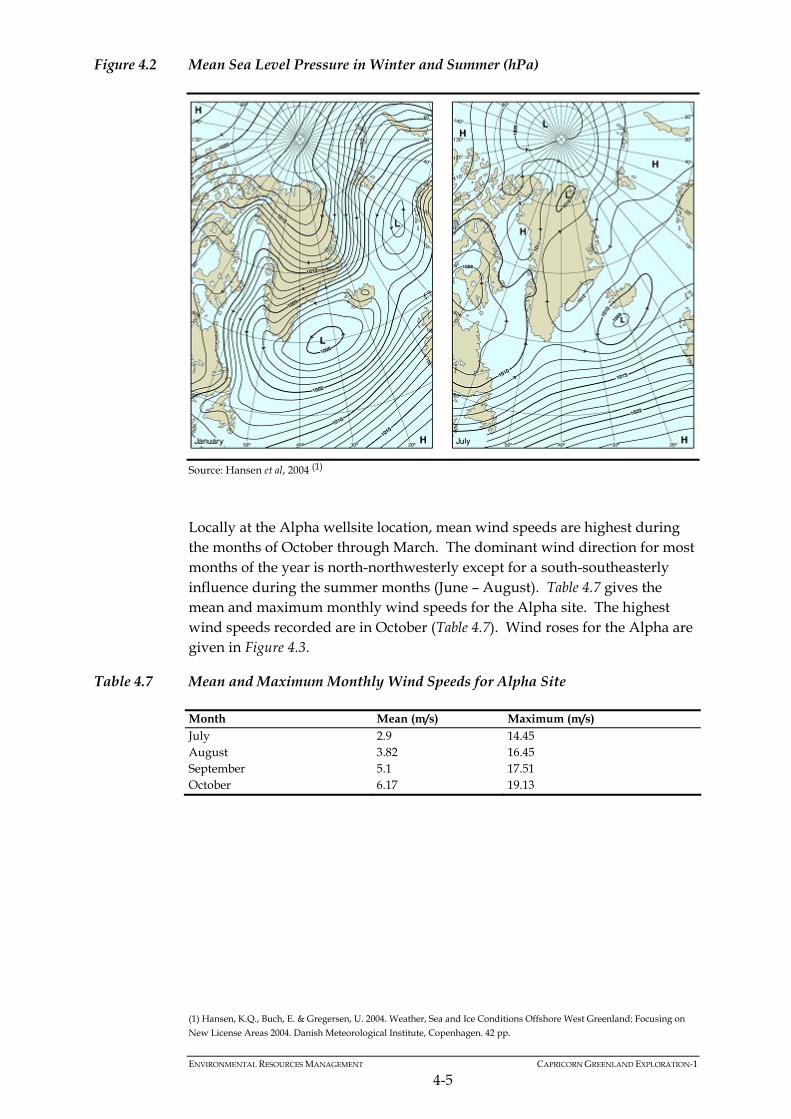
ENVIRONMENTAL RESOURCES MANAGEMENT CAPRICORN GREENLAND EXPLORATION-1
4-5
Figure 4.2 Mean Sea Level Pressure in Winter and Summer (hPa)
Source: Hansen et al, 2004 (1)
Locally at the Alpha wellsite location, mean wind speeds are highest during the months of October through March. The dominant wind direction for most months of the year is north-northwesterly except for a south-southeasterly influence during the summer months (June – August). Table 4.7 gives the mean and maximum monthly wind speeds for the Alpha site. The highest wind speeds recorded are in October (Table 4.7). Wind roses for the Alpha are given in Figure 4.3.
Table 4.7 Mean and Maximum Monthly Wind Speeds for Alpha Site
Month Mean (m/s) Maximum (m/s) July 2.9 14.45 August 3.82 16.45 September 5.1 17.51 October 6.17 19.13
(1) Hansen, K.Q., Buch, E. & Gregersen, U. 2004. Weather, Sea and Ice Conditions Offshore West Greenland: Focusing on
New License Areas 2004. Danish Meteorological Institute, Copenhagen. 42 pp.
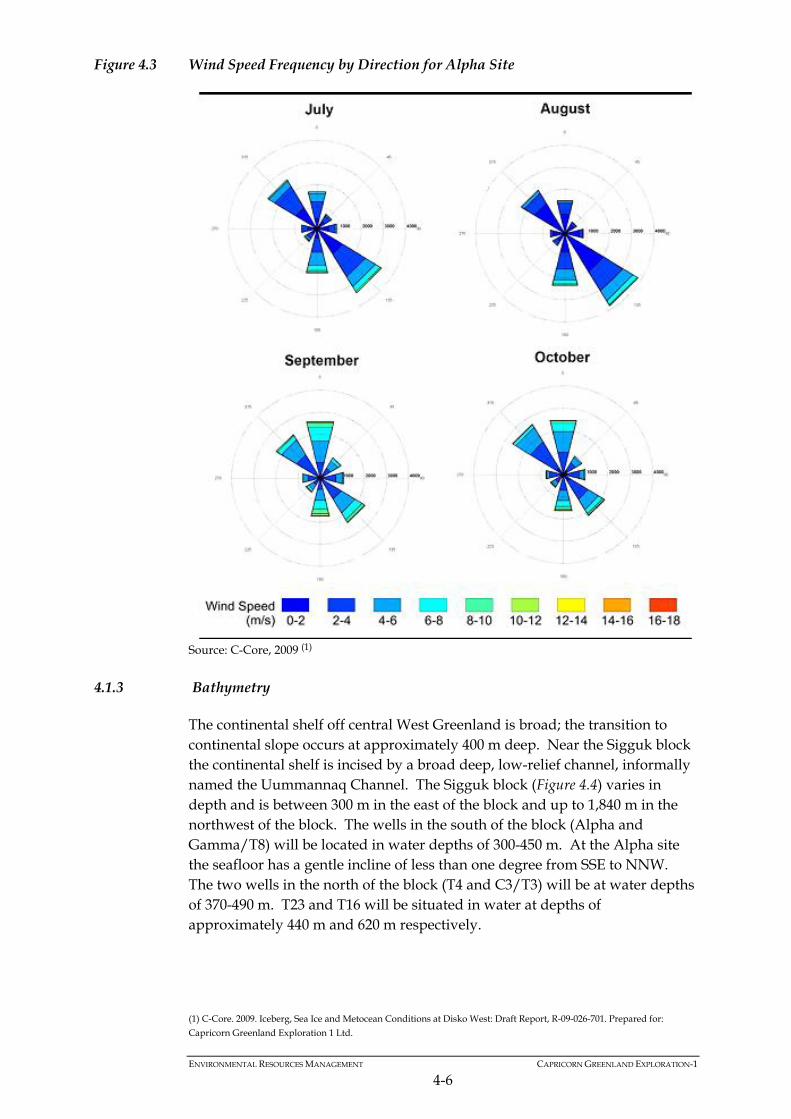
ENVIRONMENTAL RESOURCES MANAGEMENT CAPRICORN GREENLAND EXPLORATION-1
4-6
Figure 4.3 Wind Speed Frequency by Direction for Alpha Site
Source: C-Core, 2009 (1)
4.1.3 Bathymetry
The continental shelf off central West Greenland is broad; the transition to continental slope occurs at approximately 400 m deep. Near the Sigguk block the continental shelf is incised by a broad deep, low-relief channel, informally named the Uummannaq Channel. The Sigguk block (Figure 4.4) varies in depth and is between 300 m in the east of the block and up to 1,840 m in the northwest of the block. The wells in the south of the block (Alpha and Gamma/T8) will be located in water depths of 300-450 m. At the Alpha site the seafloor has a gentle incline of less than one degree from SSE to NNW. The two wells in the north of the block (T4 and C3/T3) will be at water depths of 370-490 m. T23 and T16 will be situated in water at depths of approximately 440 m and 620 m respectively.
(1) C-Core. 2009. Iceberg, Sea Ice and Metocean Conditions at Disko West: Draft Report, R-09-026-701. Prepared for:
Capricorn Greenland Exploration 1 Ltd.
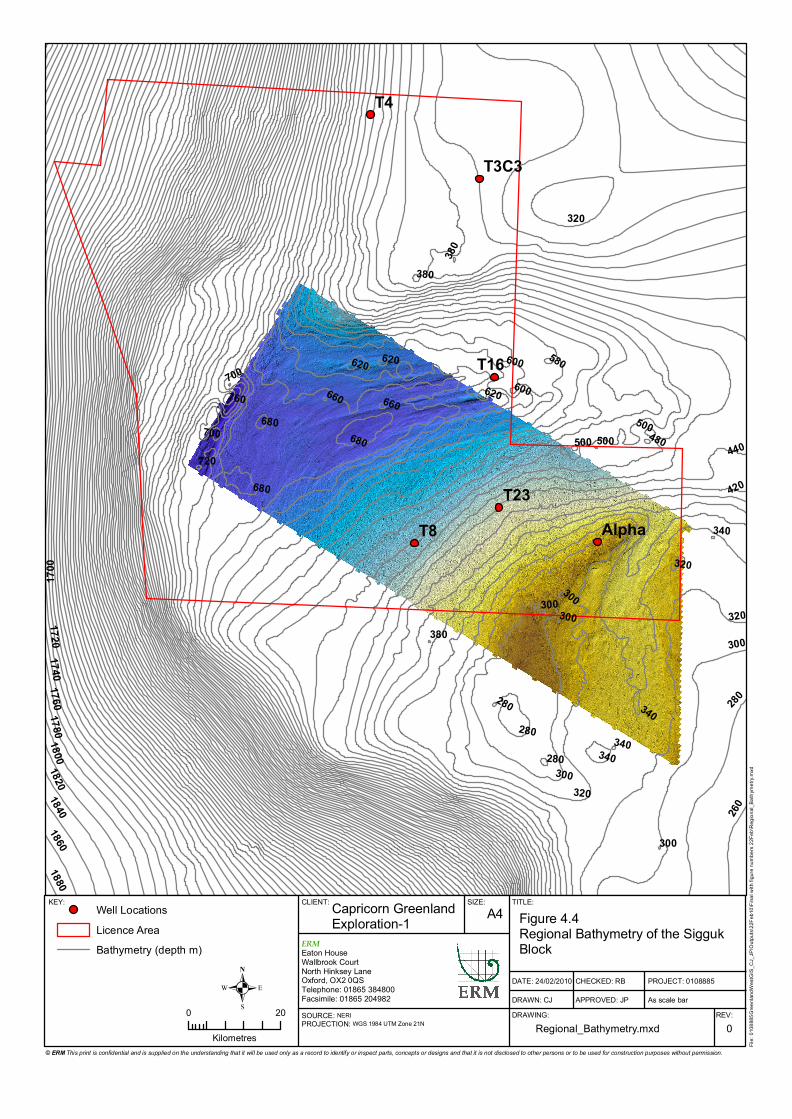
760
720
700
680
660620 600
580
500 480440
420
380
1700
3401720
320
1740
300
2801760
178018001820
2601840
18601880
280
500
340
600
340
320
680500
320
300300
280
300
620
660680
320
700
280
380
300
380
340
620
300
T4
T8T23
T16
T3C3
Alpha
CLIENT: SIZE: TITLE:
DATE: 24/02/2010
DRAWN: CJ
CHECKED: RB
APPROVED: JP
PROJECT: 0108885
As scale barDRAWING: REV:
KEY: Capricorn Greenland Exploration-1 A4 Figure 4.4
Regional Bathymetry of the Sigguk Block
Regional_Bathymetry.mxd 0
Well LocationsLicence AreaBathymetry (depth m)
SOURCE: NERIPROJECTION: WGS 1984 UTM Zone 21N
File:
0108
885G
reenla
ndW
estG
IS_C
J_JP
\Outp
uts\22
Feb1
0\Fina
l with
figure
numb
ers 22
Feb\R
egion
al_Ba
thyme
try.m
xd
ERMEaton HouseWallbrook CourtNorth Hinksey LaneOxford, OX2 0QSTelephone: 01865 384800Facsimile: 01865 204982.0 20
Kilometres© ERM This print is confidential and is supplied on the understanding that it will be used only as a record to identify or inspect parts, concepts or designs and that it is not disclosed to other persons or to be used for construction purposes without permission.
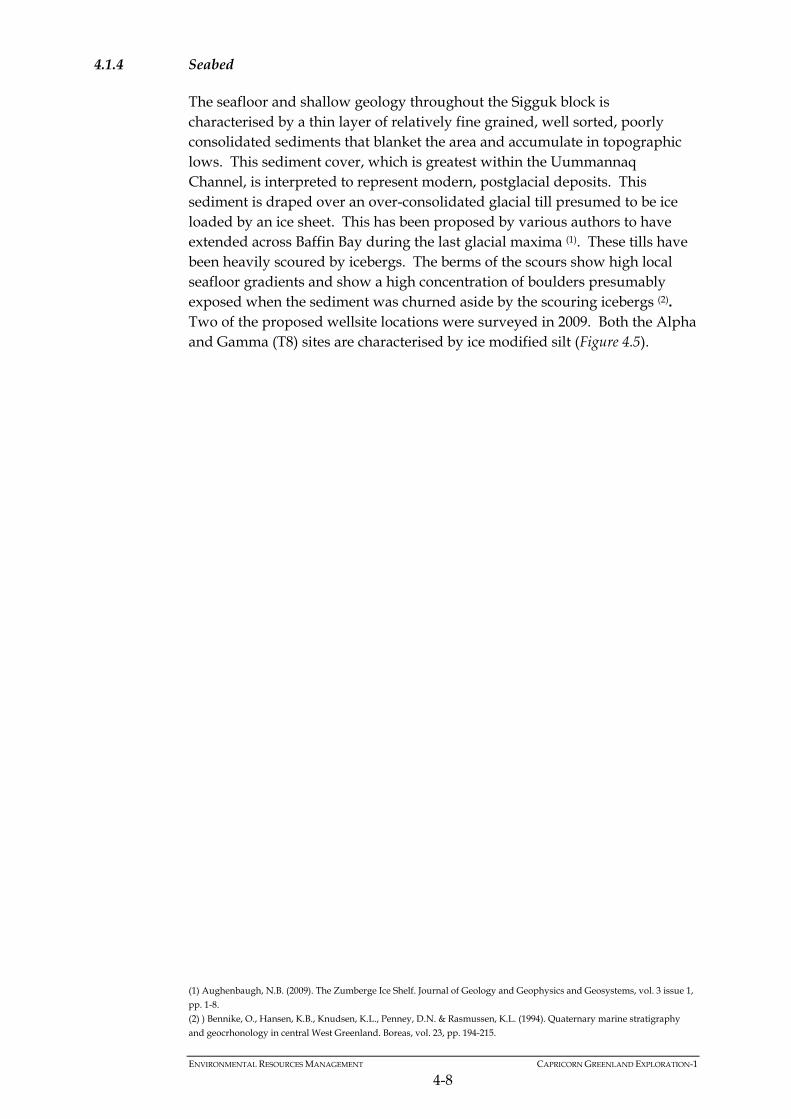
ENVIRONMENTAL RESOURCES MANAGEMENT CAPRICORN GREENLAND EXPLORATION-1
4-8
4.1.4 Seabed
The seafloor and shallow geology throughout the Sigguk block is characterised by a thin layer of relatively fine grained, well sorted, poorly consolidated sediments that blanket the area and accumulate in topographic lows. This sediment cover, which is greatest within the Uummannaq Channel, is interpreted to represent modern, postglacial deposits. This sediment is draped over an over-consolidated glacial till presumed to be ice loaded by an ice sheet. This has been proposed by various authors to have extended across Baffin Bay during the last glacial maxima (1). These tills have been heavily scoured by icebergs. The berms of the scours show high local seafloor gradients and show a high concentration of boulders presumably exposed when the sediment was churned aside by the scouring icebergs (2). Two of the proposed wellsite locations were surveyed in 2009. Both the Alpha and Gamma (T8) sites are characterised by ice modified silt (Figure 4.5).
(1) Aughenbaugh, N.B. (2009). The Zumberge Ice Shelf. Journal of Geology and Geophysics and Geosystems, vol. 3 issue 1,
pp. 1-8. (2) ) Bennike, O., Hansen, K.B., Knudsen, K.L., Penney, D.N. & Rasmussen, K.L. (1994). Quaternary marine stratigraphy
and geocrhonology in central West Greenland. Boreas, vol. 23, pp. 194-215.
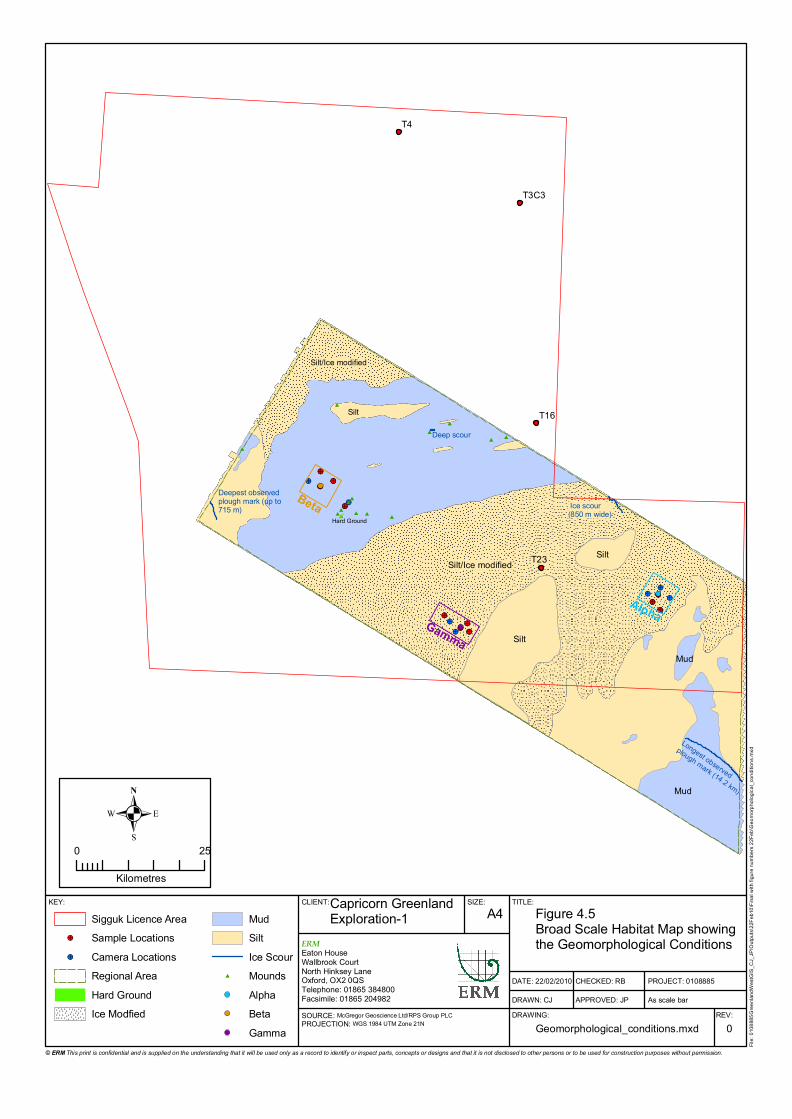
!>!>
!>
!>!>
!>
!>
!>
!>
!>
!>!>
!>
!>!>
!>
!>!>##
#
#
#
##
#
#
#
#
#
## #
!>
!>
!>!>
!>
!>
!>
!>
!>
!>
!>
Silt
Silt/Ice modified
Longest observed
plough mark (14.2 km)
Ice scour (850 m wide)
Deep scour
Deepest observed plough mark (up to 715 m)
Beta
AlphaGamma
Hard Ground
Silt
Silt
Mud
Mud
Silt/Ice modified
T4
T23
T16
T3C3
CLIENT: SIZE: TITLE:
DATE: 22/02/2010
DRAWN: CJ
CHECKED: RB
APPROVED: JP
PROJECT: 0108885
As scale barDRAWING: REV:
KEY: Capricorn Greenland Exploration-1 A4 Figure 4.5
Broad Scale Habitat Map showing the Geomorphological Conditions
Geomorphological_conditions.mxd 0
Sigguk Licence Area!> Sample Locations!> Camera Locations
Regional AreaHard GroundIce Modfied
MudSiltIce Scour
# MoundsAlphaBetaGamma
.0 25
Kilometres
SOURCE: McGregor Geoscience Ltd/RPS Group PLCPROJECTION: WGS 1984 UTM Zone 21N
File:
0108
885G
reenla
ndW
estG
IS_C
J_JP
\Outp
uts\22
Feb1
0\Fina
l with
figure
numb
ers 22
Feb\G
eomo
rpholo
gical_
cond
itions
.mxd
ERMEaton HouseWallbrook CourtNorth Hinksey LaneOxford, OX2 0QSTelephone: 01865 384800Facsimile: 01865 204982
© ERM This print is confidential and is supplied on the understanding that it will be used only as a record to identify or inspect parts, concepts or designs and that it is not disclosed to other persons or to be used for construction purposes without permission.
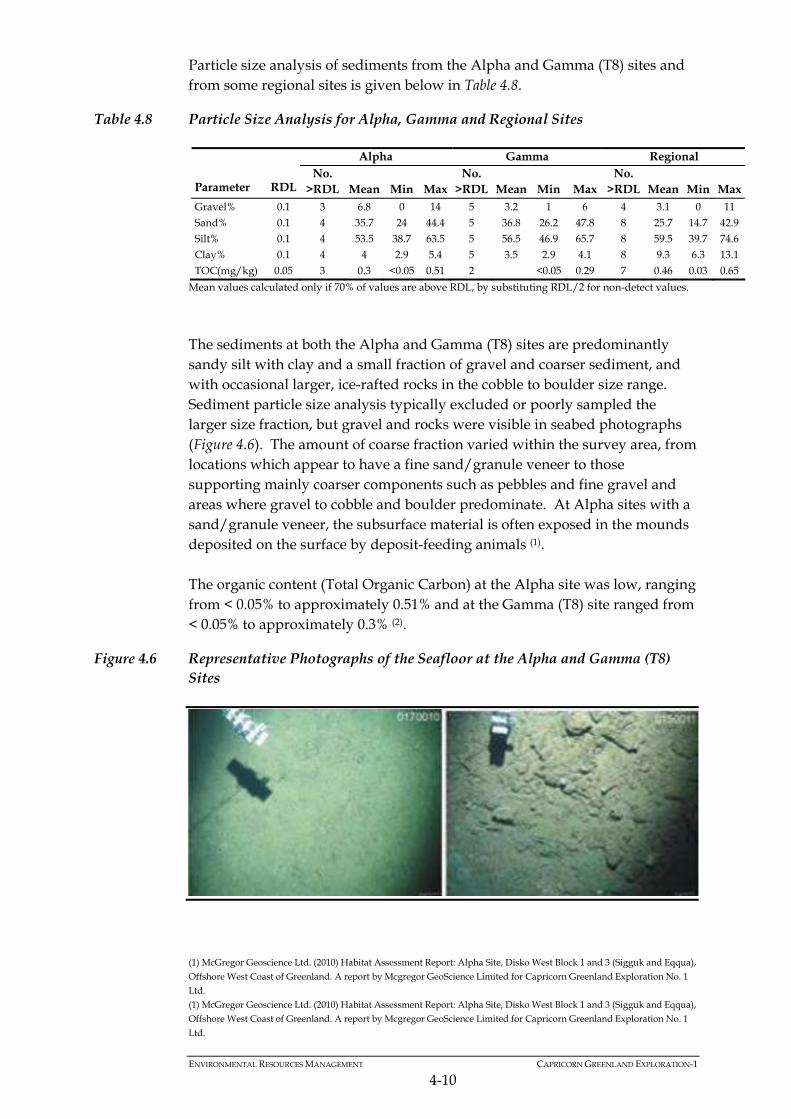
ENVIRONMENTAL RESOURCES MANAGEMENT CAPRICORN GREENLAND EXPLORATION-1
4-10
Particle size analysis of sediments from the Alpha and Gamma (T8) sites and from some regional sites is given below in Table 4.8.
Table 4.8 Particle Size Analysis for Alpha, Gamma and Regional Sites
Alpha Gamma Regional Parameter
RDL
No. >RDL Mean Min Max
No. >RDL Mean Min Max
No. >RDL Mean Min Max
Gravel% 0.1 3 6.8 0 14 5 3.2 1 6 4 3.1 0 11 Sand% 0.1 4 35.7 24 44.4 5 36.8 26.2 47.8 8 25.7 14.7 42.9 Silt% 0.1 4 53.5 38.7 63.5 5 56.5 46.9 65.7 8 59.5 39.7 74.6 Clay% 0.1 4 4 2.9 5.4 5 3.5 2.9 4.1 8 9.3 6.3 13.1 TOC(mg/kg) 0.05 3 0.3 <0.05 0.51 2 <0.05 0.29 7 0.46 0.03 0.65
Mean values calculated only if 70% of values are above RDL, by substituting RDL/2 for non-detect values.
The sediments at both the Alpha and Gamma (T8) sites are predominantly sandy silt with clay and a small fraction of gravel and coarser sediment, and with occasional larger, ice-rafted rocks in the cobble to boulder size range. Sediment particle size analysis typically excluded or poorly sampled the larger size fraction, but gravel and rocks were visible in seabed photographs (Figure 4.6). The amount of coarse fraction varied within the survey area, from locations which appear to have a fine sand/granule veneer to those supporting mainly coarser components such as pebbles and fine gravel and areas where gravel to cobble and boulder predominate. At Alpha sites with a sand/granule veneer, the subsurface material is often exposed in the mounds deposited on the surface by deposit-feeding animals (1).
The organic content (Total Organic Carbon) at the Alpha site was low, ranging from < 0.05% to approximately 0.51% and at the Gamma (T8) site ranged from < 0.05% to approximately 0.3% (2).
Figure 4.6 Representative Photographs of the Seafloor at the Alpha and Gamma (T8) Sites
(1) McGregor Geoscience Ltd. (2010) Habitat Assessment Report: Alpha Site, Disko West Block 1 and 3 (Sigguk and Eqqua),
Offshore West Coast of Greenland. A report by Mcgregor GeoScience Limited for Capricorn Greenland Exploration No. 1 Ltd.
(1) McGregor Geoscience Ltd. (2010) Habitat Assessment Report: Alpha Site, Disko West Block 1 and 3 (Sigguk and Eqqua), Offshore West Coast of Greenland. A report by Mcgregor GeoScience Limited for Capricorn Greenland Exploration No. 1
Ltd.
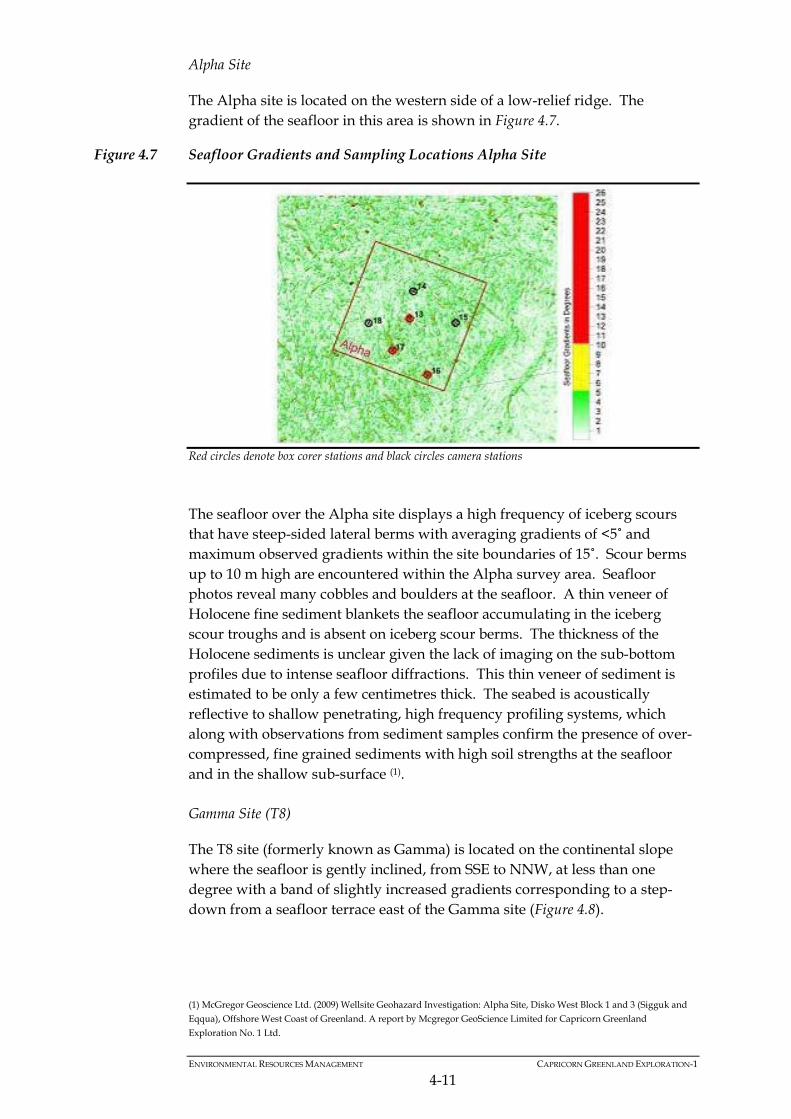
ENVIRONMENTAL RESOURCES MANAGEMENT CAPRICORN GREENLAND EXPLORATION-1
4-11
Alpha Site
The Alpha site is located on the western side of a low-relief ridge. The gradient of the seafloor in this area is shown in Figure 4.7.
Figure 4.7 Seafloor Gradients and Sampling Locations Alpha Site
Red circles denote box corer stations and black circles camera stations
The seafloor over the Alpha site displays a high frequency of iceberg scours that have steep-sided lateral berms with averaging gradients of <5˚ and maximum observed gradients within the site boundaries of 15˚. Scour berms up to 10 m high are encountered within the Alpha survey area. Seafloor photos reveal many cobbles and boulders at the seafloor. A thin veneer of Holocene fine sediment blankets the seafloor accumulating in the iceberg scour troughs and is absent on iceberg scour berms. The thickness of the Holocene sediments is unclear given the lack of imaging on the sub-bottom profiles due to intense seafloor diffractions. This thin veneer of sediment is estimated to be only a few centimetres thick. The seabed is acoustically reflective to shallow penetrating, high frequency profiling systems, which along with observations from sediment samples confirm the presence of over-compressed, fine grained sediments with high soil strengths at the seafloor and in the shallow sub-surface (1). Gamma Site (T8)
The T8 site (formerly known as Gamma) is located on the continental slope where the seafloor is gently inclined, from SSE to NNW, at less than one degree with a band of slightly increased gradients corresponding to a step-down from a seafloor terrace east of the Gamma site (Figure 4.8).
(1) McGregor Geoscience Ltd. (2009) Wellsite Geohazard Investigation: Alpha Site, Disko West Block 1 and 3 (Sigguk and Eqqua), Offshore West Coast of Greenland. A report by Mcgregor GeoScience Limited for Capricorn Greenland
Exploration No. 1 Ltd.
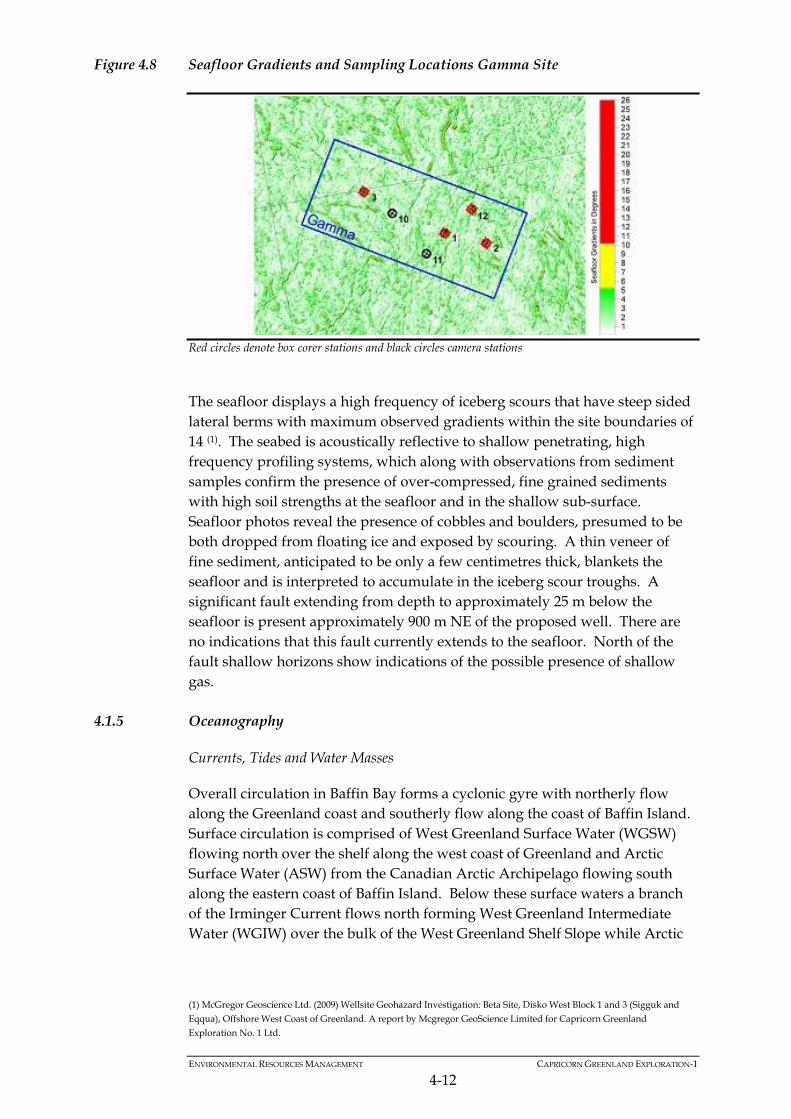
ENVIRONMENTAL RESOURCES MANAGEMENT CAPRICORN GREENLAND EXPLORATION-1
4-12
Figure 4.8 Seafloor Gradients and Sampling Locations Gamma Site
Red circles denote box corer stations and black circles camera stations
The seafloor displays a high frequency of iceberg scours that have steep sided lateral berms with maximum observed gradients within the site boundaries of 14 (1). The seabed is acoustically reflective to shallow penetrating, high frequency profiling systems, which along with observations from sediment samples confirm the presence of over-compressed, fine grained sediments with high soil strengths at the seafloor and in the shallow sub-surface. Seafloor photos reveal the presence of cobbles and boulders, presumed to be both dropped from floating ice and exposed by scouring. A thin veneer of fine sediment, anticipated to be only a few centimetres thick, blankets the seafloor and is interpreted to accumulate in the iceberg scour troughs. A significant fault extending from depth to approximately 25 m below the seafloor is present approximately 900 m NE of the proposed well. There are no indications that this fault currently extends to the seafloor. North of the fault shallow horizons show indications of the possible presence of shallow gas.
4.1.5 Oceanography
Currents, Tides and Water Masses
Overall circulation in Baffin Bay forms a cyclonic gyre with northerly flow along the Greenland coast and southerly flow along the coast of Baffin Island. Surface circulation is comprised of West Greenland Surface Water (WGSW) flowing north over the shelf along the west coast of Greenland and Arctic Surface Water (ASW) from the Canadian Arctic Archipelago flowing south along the eastern coast of Baffin Island. Below these surface waters a branch of the Irminger Current flows north forming West Greenland Intermediate Water (WGIW) over the bulk of the West Greenland Shelf Slope while Arctic
(1) McGregor Geoscience Ltd. (2009) Wellsite Geohazard Investigation: Beta Site, Disko West Block 1 and 3 (Sigguk and Eqqua), Offshore West Coast of Greenland. A report by Mcgregor GeoScience Limited for Capricorn Greenland
Exploration No. 1 Ltd.
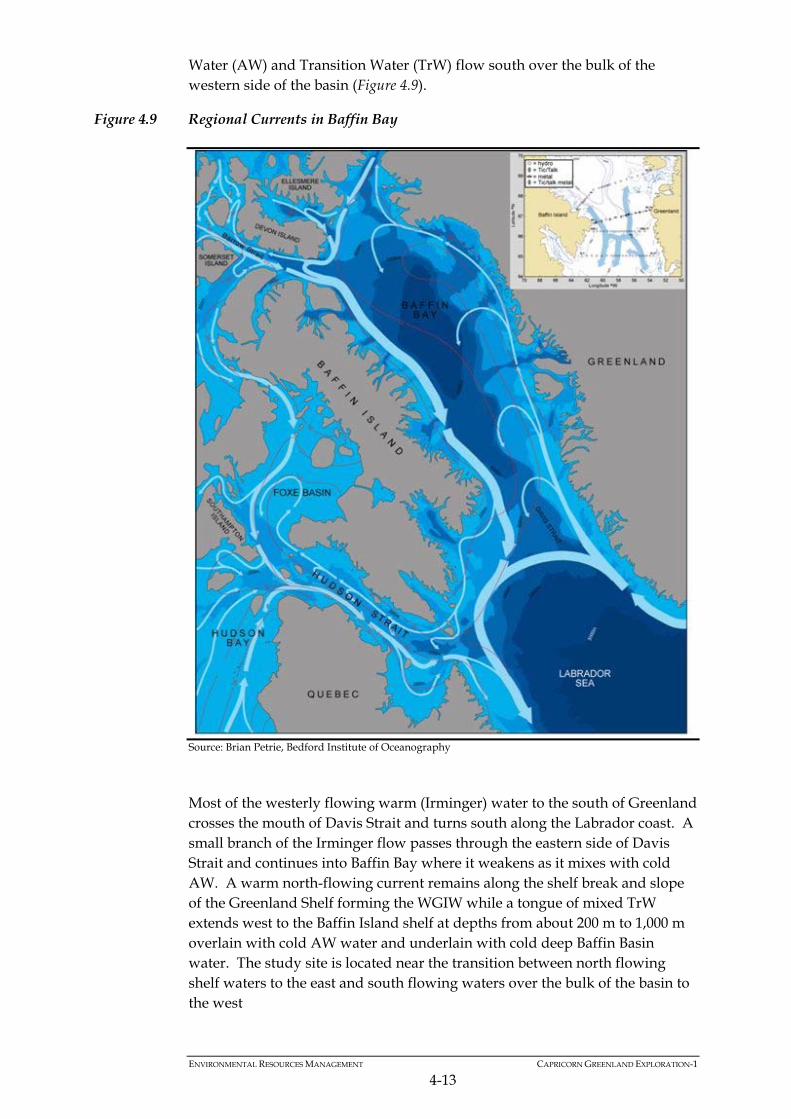
ENVIRONMENTAL RESOURCES MANAGEMENT CAPRICORN GREENLAND EXPLORATION-1
4-13
Water (AW) and Transition Water (TrW) flow south over the bulk of the western side of the basin (Figure 4.9).
Figure 4.9 Regional Currents in Baffin Bay
Source: Brian Petrie, Bedford Institute of Oceanography
Most of the westerly flowing warm (Irminger) water to the south of Greenland crosses the mouth of Davis Strait and turns south along the Labrador coast. A small branch of the Irminger flow passes through the eastern side of Davis Strait and continues into Baffin Bay where it weakens as it mixes with cold AW. A warm north-flowing current remains along the shelf break and slope of the Greenland Shelf forming the WGIW while a tongue of mixed TrW extends west to the Baffin Island shelf at depths from about 200 m to 1,000 m overlain with cold AW water and underlain with cold deep Baffin Basin water. The study site is located near the transition between north flowing shelf waters to the east and south flowing waters over the bulk of the basin to the west
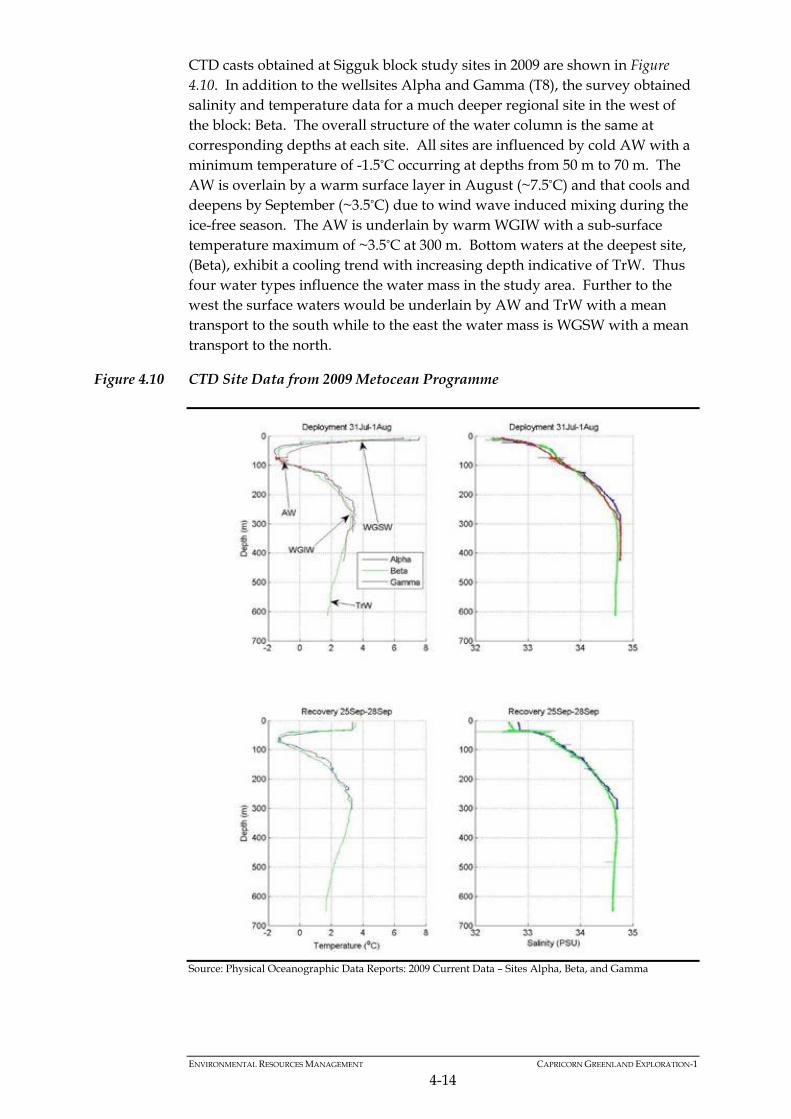
ENVIRONMENTAL RESOURCES MANAGEMENT CAPRICORN GREENLAND EXPLORATION-1
4-14
CTD casts obtained at Sigguk block study sites in 2009 are shown in Figure 4.10. In addition to the wellsites Alpha and Gamma (T8), the survey obtained salinity and temperature data for a much deeper regional site in the west of the block: Beta. The overall structure of the water column is the same at corresponding depths at each site. All sites are influenced by cold AW with a minimum temperature of -1.5°C occurring at depths from 50 m to 70 m. The AW is overlain by a warm surface layer in August (~7.5°C) and that cools and deepens by September (~3.5°C) due to wind wave induced mixing during the ice-free season. The AW is underlain by warm WGIW with a sub-surface temperature maximum of ~3.5°C at 300 m. Bottom waters at the deepest site, (Beta), exhibit a cooling trend with increasing depth indicative of TrW. Thus four water types influence the water mass in the study area. Further to the west the surface waters would be underlain by AW and TrW with a mean transport to the south while to the east the water mass is WGSW with a mean transport to the north.
Figure 4.10 CTD Site Data from 2009 Metocean Programme
Source: Physical Oceanographic Data Reports: 2009 Current Data – Sites Alpha, Beta, and Gamma
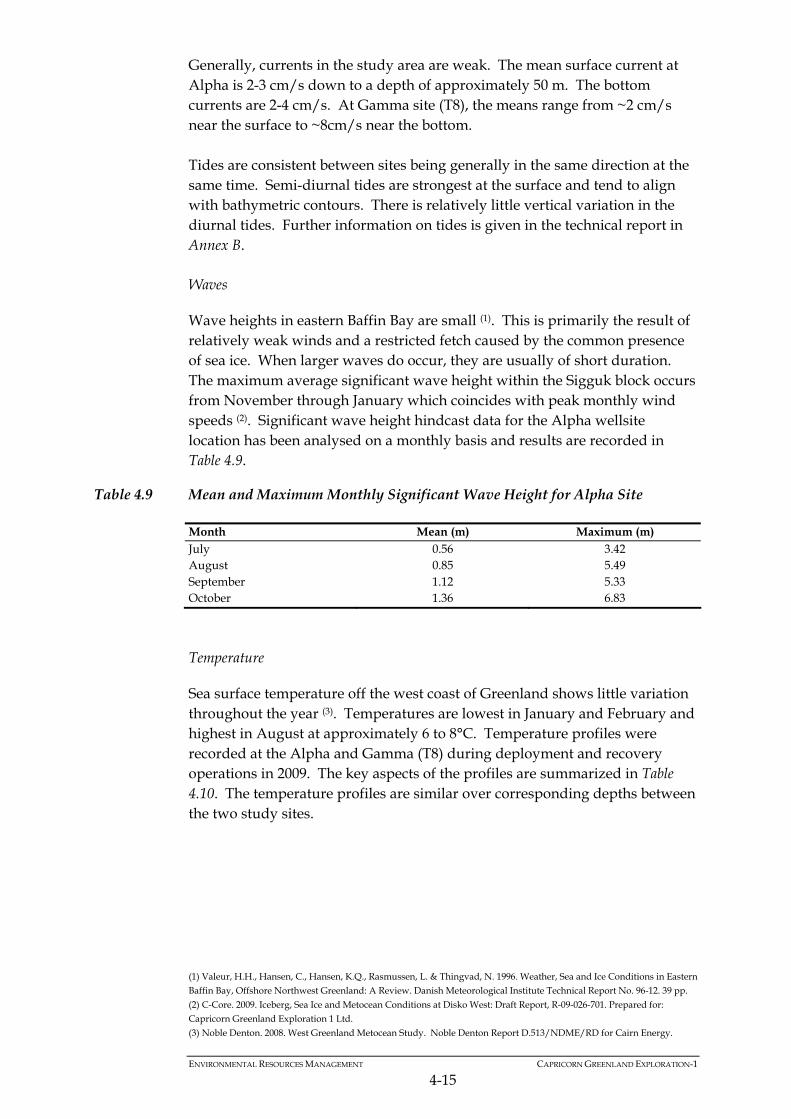
ENVIRONMENTAL RESOURCES MANAGEMENT CAPRICORN GREENLAND EXPLORATION-1
4-15
Generally, currents in the study area are weak. The mean surface current at Alpha is 2-3 cm/s down to a depth of approximately 50 m. The bottom currents are 2-4 cm/s. At Gamma site (T8), the means range from ~2 cm/s near the surface to ~8cm/s near the bottom. Tides are consistent between sites being generally in the same direction at the same time. Semi-diurnal tides are strongest at the surface and tend to align with bathymetric contours. There is relatively little vertical variation in the diurnal tides. Further information on tides is given in the technical report in Annex B. Waves
Wave heights in eastern Baffin Bay are small (1). This is primarily the result of relatively weak winds and a restricted fetch caused by the common presence of sea ice. When larger waves do occur, they are usually of short duration. The maximum average significant wave height within the Sigguk block occurs from November through January which coincides with peak monthly wind speeds (2). Significant wave height hindcast data for the Alpha wellsite location has been analysed on a monthly basis and results are recorded in Table 4.9.
Table 4.9 Mean and Maximum Monthly Significant Wave Height for Alpha Site
Month Mean (m) Maximum (m) July 0.56 3.42 August 0.85 5.49 September 1.12 5.33 October 1.36 6.83
Temperature
Sea surface temperature off the west coast of Greenland shows little variation throughout the year (3). Temperatures are lowest in January and February and highest in August at approximately 6 to 8°C. Temperature profiles were recorded at the Alpha and Gamma (T8) during deployment and recovery operations in 2009. The key aspects of the profiles are summarized in Table 4.10. The temperature profiles are similar over corresponding depths between the two study sites.
(1) Valeur, H.H., Hansen, C., Hansen, K.Q., Rasmussen, L. & Thingvad, N. 1996. Weather, Sea and Ice Conditions in Eastern Baffin Bay, Offshore Northwest Greenland: A Review. Danish Meteorological Institute Technical Report No. 96-12. 39 pp. (2) C-Core. 2009. Iceberg, Sea Ice and Metocean Conditions at Disko West: Draft Report, R-09-026-701. Prepared for: Capricorn Greenland Exploration 1 Ltd.
(3) Noble Denton. 2008. West Greenland Metocean Study. Noble Denton Report D.513/NDME/RD for Cairn Energy.
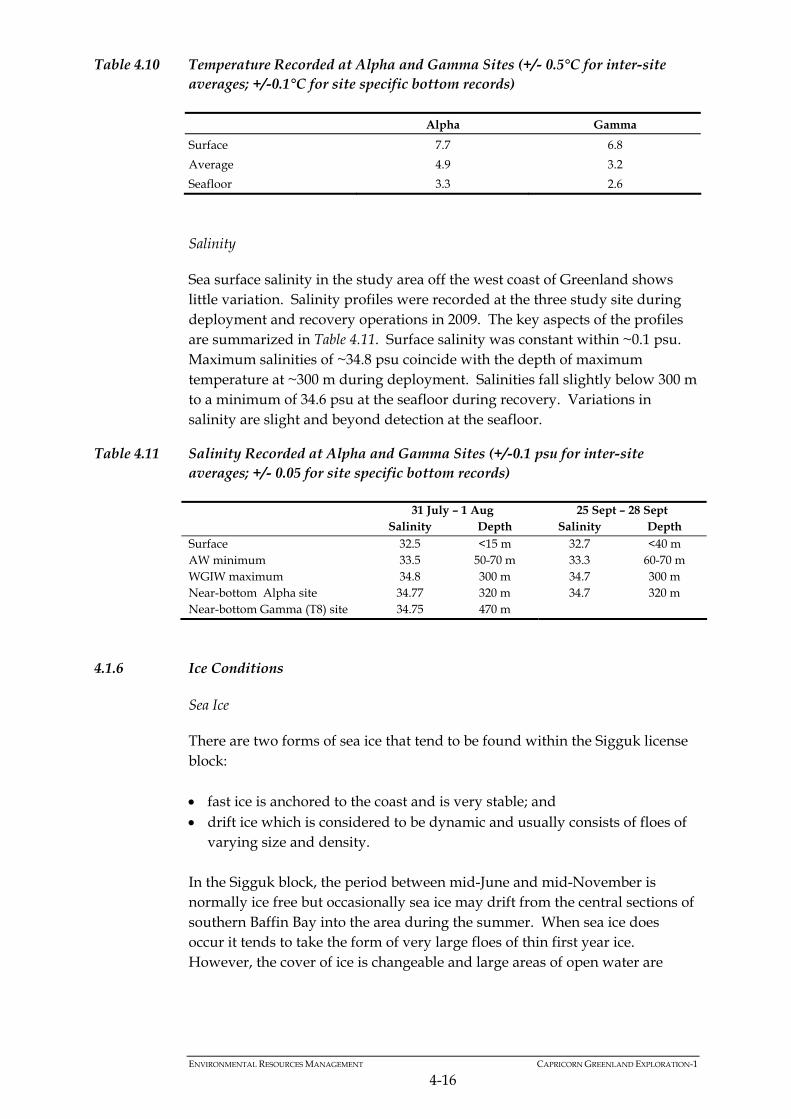
ENVIRONMENTAL RESOURCES MANAGEMENT CAPRICORN GREENLAND EXPLORATION-1
4-16
Table 4.10 Temperature Recorded at Alpha and Gamma Sites (+/- 0.5°C for inter-site averages; +/-0.1°C for site specific bottom records)
Alpha Gamma
Surface 7.7 6.8
Average 4.9 3.2
Seafloor 3.3 2.6
Salinity
Sea surface salinity in the study area off the west coast of Greenland shows little variation. Salinity profiles were recorded at the three study site during deployment and recovery operations in 2009. The key aspects of the profiles are summarized in Table 4.11. Surface salinity was constant within ~0.1 psu. Maximum salinities of ~34.8 psu coincide with the depth of maximum temperature at ~300 m during deployment. Salinities fall slightly below 300 m to a minimum of 34.6 psu at the seafloor during recovery. Variations in salinity are slight and beyond detection at the seafloor.
Table 4.11 Salinity Recorded at Alpha and Gamma Sites (+/-0.1 psu for inter-site averages; +/- 0.05 for site specific bottom records)
31 July – 1 Aug 25 Sept – 28 Sept Salinity Depth Salinity Depth Surface 32.5 <15 m 32.7 <40 m AW minimum 33.5 50-70 m 33.3 60-70 m WGIW maximum 34.8 300 m 34.7 300 m Near-bottom Alpha site 34.77 320 m 34.7 320 m Near-bottom Gamma (T8) site 34.75 470 m
4.1.6 Ice Conditions
Sea Ice
There are two forms of sea ice that tend to be found within the Sigguk license block: fast ice is anchored to the coast and is very stable; and drift ice which is considered to be dynamic and usually consists of floes of
varying size and density. In the Sigguk block, the period between mid-June and mid-November is normally ice free but occasionally sea ice may drift from the central sections of southern Baffin Bay into the area during the summer. When sea ice does occur it tends to take the form of very large floes of thin first year ice. However, the cover of ice is changeable and large areas of open water are
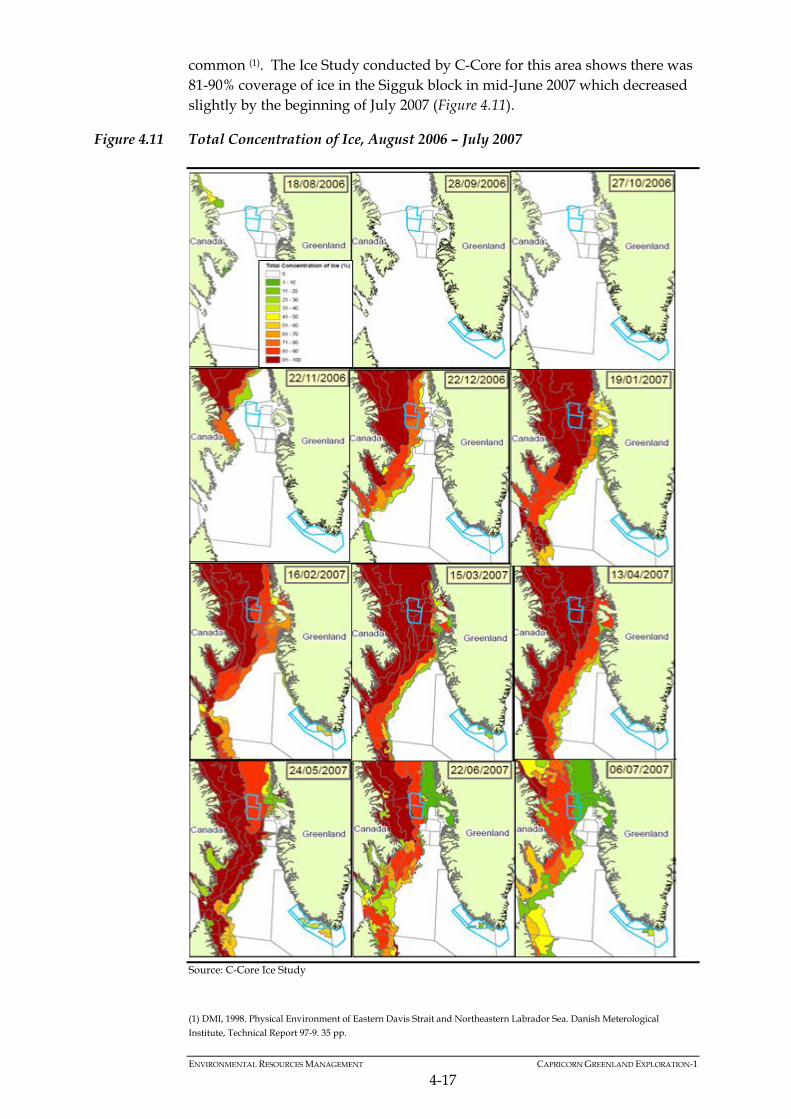
ENVIRONMENTAL RESOURCES MANAGEMENT CAPRICORN GREENLAND EXPLORATION-1
4-17
common (1). The Ice Study conducted by C-Core for this area shows there was 81-90% coverage of ice in the Sigguk block in mid-June 2007 which decreased slightly by the beginning of July 2007 (Figure 4.11).
Figure 4.11 Total Concentration of Ice, August 2006 – July 2007
Source: C-Core Ice Study
(1) DMI, 1998. Physical Environment of Eastern Davis Strait and Northeastern Labrador Sea. Danish Meterological
Institute, Technical Report 97-9. 35 pp.
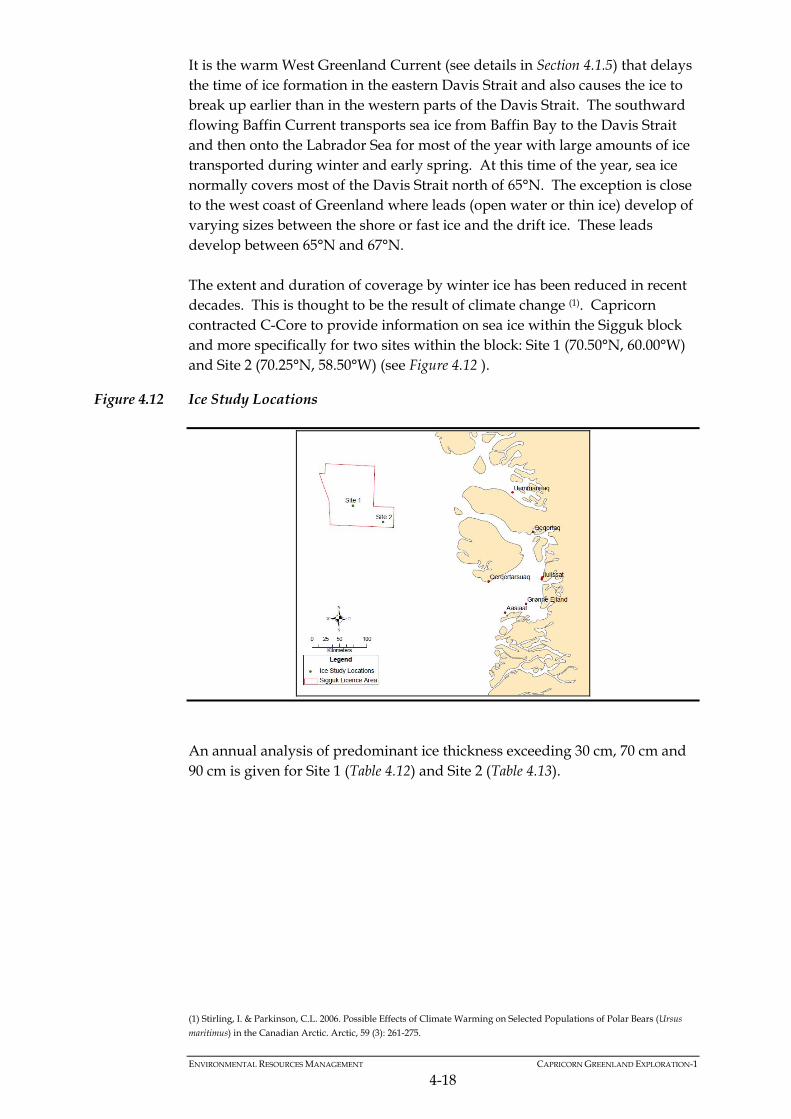
ENVIRONMENTAL RESOURCES MANAGEMENT CAPRICORN GREENLAND EXPLORATION-1
4-18
It is the warm West Greenland Current (see details in Section 4.1.5) that delays the time of ice formation in the eastern Davis Strait and also causes the ice to break up earlier than in the western parts of the Davis Strait. The southward flowing Baffin Current transports sea ice from Baffin Bay to the Davis Strait and then onto the Labrador Sea for most of the year with large amounts of ice transported during winter and early spring. At this time of the year, sea ice normally covers most of the Davis Strait north of 65°N. The exception is close to the west coast of Greenland where leads (open water or thin ice) develop of varying sizes between the shore or fast ice and the drift ice. These leads develop between 65°N and 67°N. The extent and duration of coverage by winter ice has been reduced in recent decades. This is thought to be the result of climate change (1). Capricorn contracted C-Core to provide information on sea ice within the Sigguk block and more specifically for two sites within the block: Site 1 (70.50°N, 60.00°W) and Site 2 (70.25°N, 58.50°W) (see Figure 4.12 ).
Figure 4.12 Ice Study Locations
An annual analysis of predominant ice thickness exceeding 30 cm, 70 cm and 90 cm is given for Site 1 (Table 4.12) and Site 2 (Table 4.13).
(1) Stirling, I. & Parkinson, C.L. 2006. Possible Effects of Climate Warming on Selected Populations of Polar Bears (Ursus
maritimus) in the Canadian Arctic. Arctic, 59 (3): 261-275.
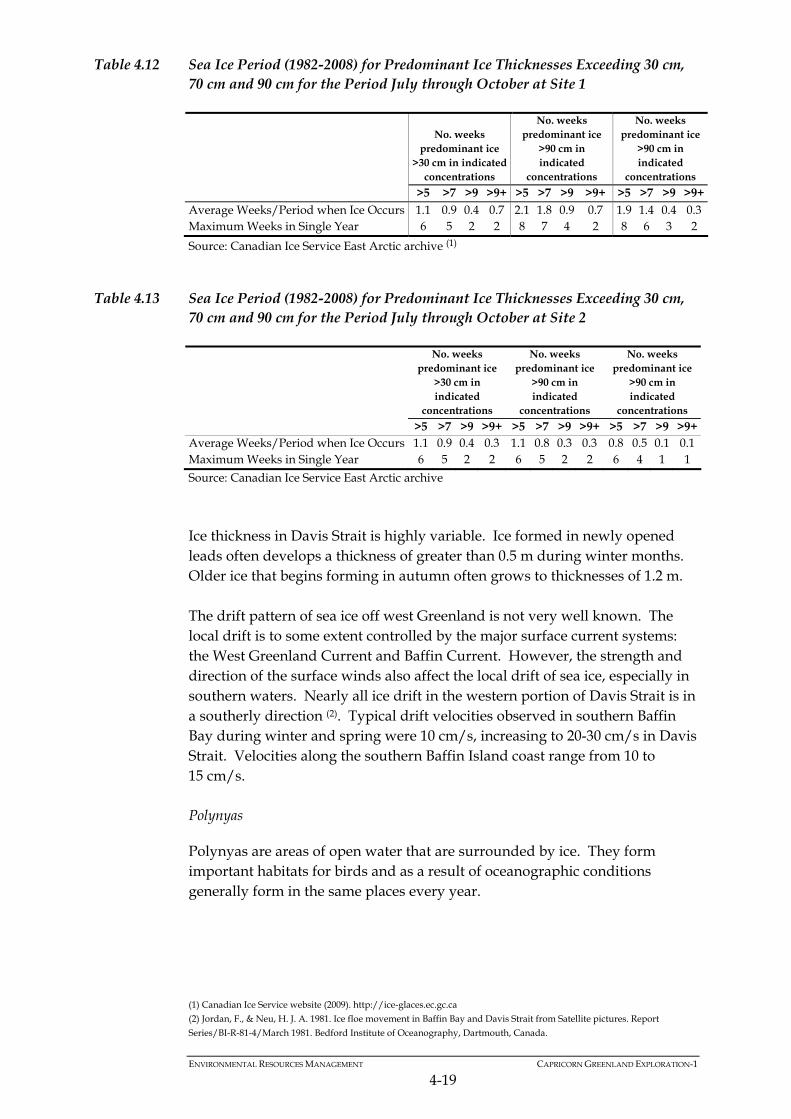
ENVIRONMENTAL RESOURCES MANAGEMENT CAPRICORN GREENLAND EXPLORATION-1
4-19
Table 4.12 Sea Ice Period (1982-2008) for Predominant Ice Thicknesses Exceeding 30 cm, 70 cm and 90 cm for the Period July through October at Site 1
No. weeks predominant ice
>30 cm in indicated concentrations
No. weeks predominant ice
>90 cm in indicated
concentrations
No. weeks predominant ice
>90 cm in indicated
concentrations >5 >7 >9 >9+ >5 >7 >9 >9+ >5 >7 >9 >9+ Average Weeks/Period when Ice Occurs 1.1 0.9 0.4 0.7 2.1 1.8 0.9 0.7 1.9 1.4 0.4 0.3 Maximum Weeks in Single Year 6 5 2 2 8 7 4 2 8 6 3 2
Source: Canadian Ice Service East Arctic archive (1)
Table 4.13 Sea Ice Period (1982-2008) for Predominant Ice Thicknesses Exceeding 30 cm, 70 cm and 90 cm for the Period July through October at Site 2
No. weeks predominant ice
>30 cm in indicated
concentrations
No. weeks predominant ice
>90 cm in indicated
concentrations
No. weeks predominant ice
>90 cm in indicated
concentrations >5 >7 >9 >9+ >5 >7 >9 >9+ >5 >7 >9 >9+ Average Weeks/Period when Ice Occurs 1.1 0.9 0.4 0.3 1.1 0.8 0.3 0.3 0.8 0.5 0.1 0.1 Maximum Weeks in Single Year 6 5 2 2 6 5 2 2 6 4 1 1
Source: Canadian Ice Service East Arctic archive
Ice thickness in Davis Strait is highly variable. Ice formed in newly opened leads often develops a thickness of greater than 0.5 m during winter months. Older ice that begins forming in autumn often grows to thicknesses of 1.2 m. The drift pattern of sea ice off west Greenland is not very well known. The local drift is to some extent controlled by the major surface current systems: the West Greenland Current and Baffin Current. However, the strength and direction of the surface winds also affect the local drift of sea ice, especially in southern waters. Nearly all ice drift in the western portion of Davis Strait is in a southerly direction (2). Typical drift velocities observed in southern Baffin Bay during winter and spring were 10 cm/s, increasing to 20-30 cm/s in Davis Strait. Velocities along the southern Baffin Island coast range from 10 to 15 cm/s. Polynyas
Polynyas are areas of open water that are surrounded by ice. They form important habitats for birds and as a result of oceanographic conditions generally form in the same places every year.
(1) Canadian Ice Service website (2009). http://ice-glaces.ec.gc.ca (2) Jordan, F., & Neu, H. J. A. 1981. Ice floe movement in Baffin Bay and Davis Strait from Satellite pictures. Report
Series/BI-R-81-4/March 1981. Bedford Institute of Oceanography, Dartmouth, Canada.
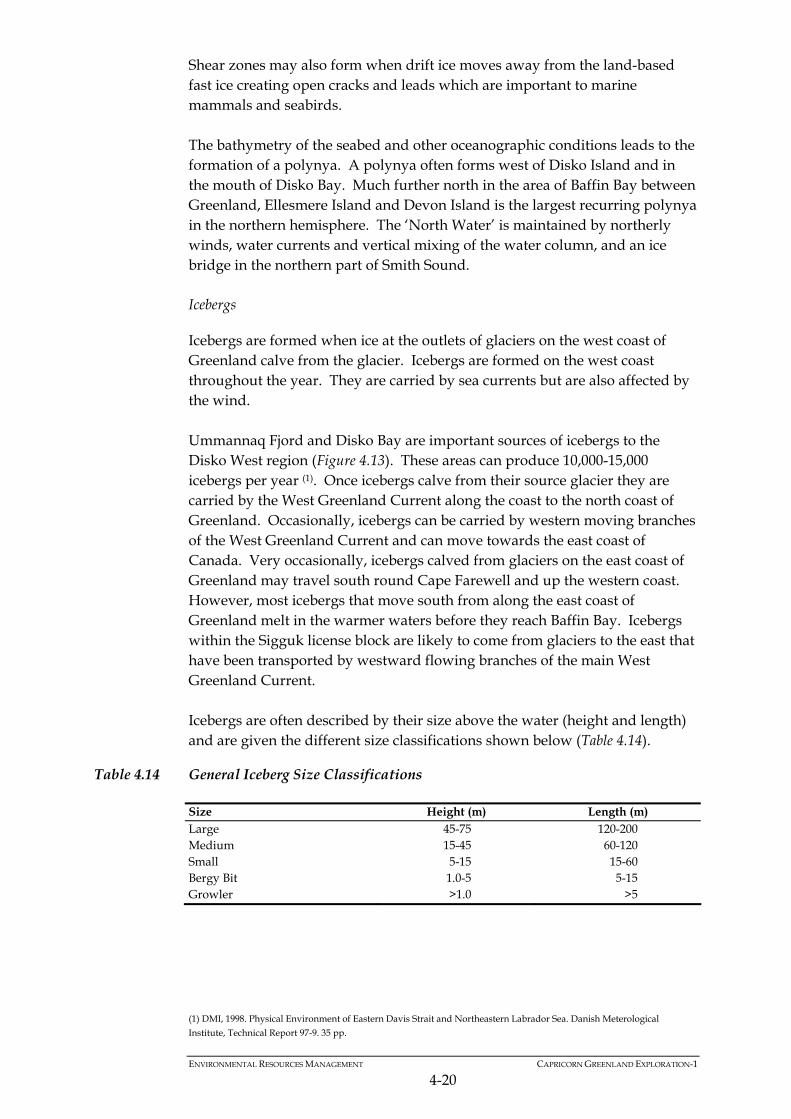
ENVIRONMENTAL RESOURCES MANAGEMENT CAPRICORN GREENLAND EXPLORATION-1
4-20
Shear zones may also form when drift ice moves away from the land-based fast ice creating open cracks and leads which are important to marine mammals and seabirds. The bathymetry of the seabed and other oceanographic conditions leads to the formation of a polynya. A polynya often forms west of Disko Island and in the mouth of Disko Bay. Much further north in the area of Baffin Bay between Greenland, Ellesmere Island and Devon Island is the largest recurring polynya in the northern hemisphere. The ‘North Water’ is maintained by northerly winds, water currents and vertical mixing of the water column, and an ice bridge in the northern part of Smith Sound. Icebergs
Icebergs are formed when ice at the outlets of glaciers on the west coast of Greenland calve from the glacier. Icebergs are formed on the west coast throughout the year. They are carried by sea currents but are also affected by the wind. Ummannaq Fjord and Disko Bay are important sources of icebergs to the Disko West region (Figure 4.13). These areas can produce 10,000-15,000 icebergs per year (1). Once icebergs calve from their source glacier they are carried by the West Greenland Current along the coast to the north coast of Greenland. Occasionally, icebergs can be carried by western moving branches of the West Greenland Current and can move towards the east coast of Canada. Very occasionally, icebergs calved from glaciers on the east coast of Greenland may travel south round Cape Farewell and up the western coast. However, most icebergs that move south from along the east coast of Greenland melt in the warmer waters before they reach Baffin Bay. Icebergs within the Sigguk license block are likely to come from glaciers to the east that have been transported by westward flowing branches of the main West Greenland Current. Icebergs are often described by their size above the water (height and length) and are given the different size classifications shown below (Table 4.14).
Table 4.14 General Iceberg Size Classifications
Size Height (m) Length (m) Large 45-75 120-200 Medium 15-45 60-120 Small 5-15 15-60 Bergy Bit 1.0-5 5-15 Growler >1.0 >5
(1) DMI, 1998. Physical Environment of Eastern Davis Strait and Northeastern Labrador Sea. Danish Meterological
Institute, Technical Report 97-9. 35 pp.
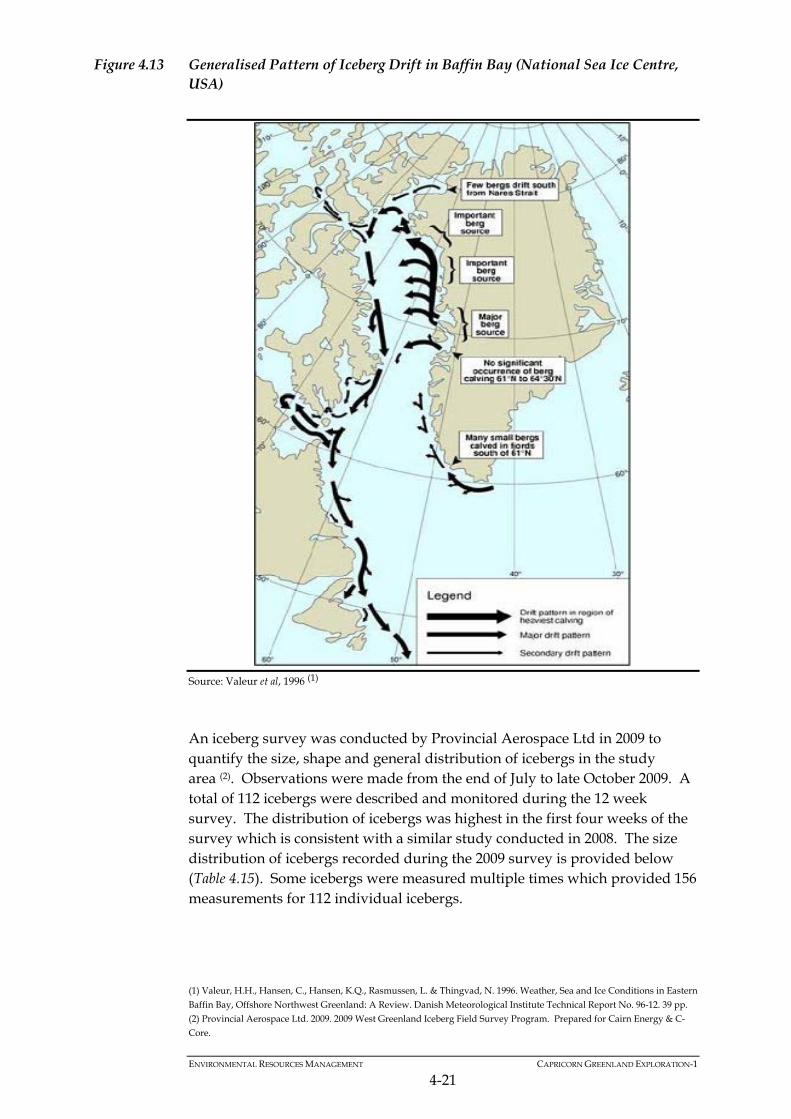
ENVIRONMENTAL RESOURCES MANAGEMENT CAPRICORN GREENLAND EXPLORATION-1
4-21
Figure 4.13 Generalised Pattern of Iceberg Drift in Baffin Bay (National Sea Ice Centre, USA)
Source: Valeur et al, 1996 (1) An iceberg survey was conducted by Provincial Aerospace Ltd in 2009 to quantify the size, shape and general distribution of icebergs in the study area (2). Observations were made from the end of July to late October 2009. A total of 112 icebergs were described and monitored during the 12 week survey. The distribution of icebergs was highest in the first four weeks of the survey which is consistent with a similar study conducted in 2008. The size distribution of icebergs recorded during the 2009 survey is provided below (Table 4.15). Some icebergs were measured multiple times which provided 156 measurements for 112 individual icebergs.
(1) Valeur, H.H., Hansen, C., Hansen, K.Q., Rasmussen, L. & Thingvad, N. 1996. Weather, Sea and Ice Conditions in Eastern
Baffin Bay, Offshore Northwest Greenland: A Review. Danish Meteorological Institute Technical Report No. 96-12. 39 pp. (2) Provincial Aerospace Ltd. 2009. 2009 West Greenland Iceberg Field Survey Program. Prepared for Cairn Energy & C-
Core.
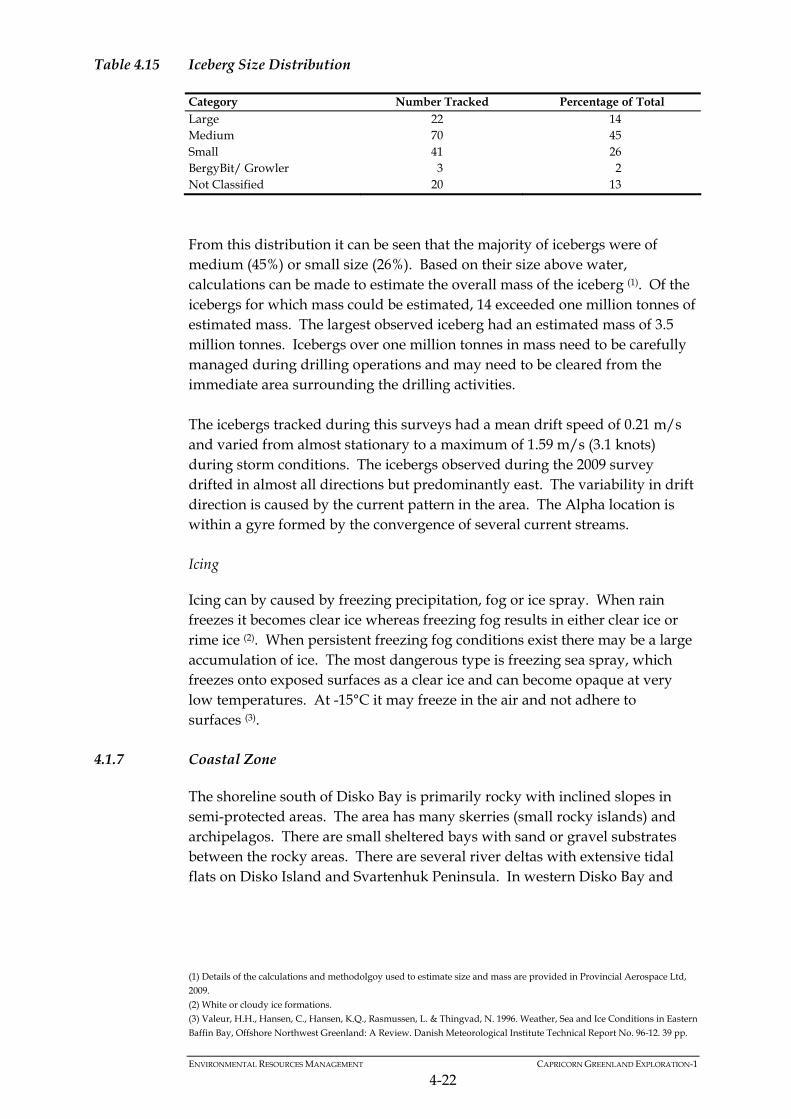
ENVIRONMENTAL RESOURCES MANAGEMENT CAPRICORN GREENLAND EXPLORATION-1
4-22
Table 4.15 Iceberg Size Distribution
Category Number Tracked Percentage of Total Large 22 14 Medium 70 45 Small 41 26 BergyBit/ Growler 3 2 Not Classified 20 13
From this distribution it can be seen that the majority of icebergs were of medium (45%) or small size (26%). Based on their size above water, calculations can be made to estimate the overall mass of the iceberg (1). Of the icebergs for which mass could be estimated, 14 exceeded one million tonnes of estimated mass. The largest observed iceberg had an estimated mass of 3.5 million tonnes. Icebergs over one million tonnes in mass need to be carefully managed during drilling operations and may need to be cleared from the immediate area surrounding the drilling activities. The icebergs tracked during this surveys had a mean drift speed of 0.21 m/s and varied from almost stationary to a maximum of 1.59 m/s (3.1 knots) during storm conditions. The icebergs observed during the 2009 survey drifted in almost all directions but predominantly east. The variability in drift direction is caused by the current pattern in the area. The Alpha location is within a gyre formed by the convergence of several current streams. Icing
Icing can by caused by freezing precipitation, fog or ice spray. When rain freezes it becomes clear ice whereas freezing fog results in either clear ice or rime ice (2). When persistent freezing fog conditions exist there may be a large accumulation of ice. The most dangerous type is freezing sea spray, which freezes onto exposed surfaces as a clear ice and can become opaque at very low temperatures. At -15°C it may freeze in the air and not adhere to surfaces (3).
4.1.7 Coastal Zone
The shoreline south of Disko Bay is primarily rocky with inclined slopes in semi-protected areas. The area has many skerries (small rocky islands) and archipelagos. There are small sheltered bays with sand or gravel substrates between the rocky areas. There are several river deltas with extensive tidal flats on Disko Island and Svartenhuk Peninsula. In western Disko Bay and
(1) Details of the calculations and methodolgoy used to estimate size and mass are provided in Provincial Aerospace Ltd, 2009. (2) White or cloudy ice formations. (3) Valeur, H.H., Hansen, C., Hansen, K.Q., Rasmussen, L. & Thingvad, N. 1996. Weather, Sea and Ice Conditions in Eastern
Baffin Bay, Offshore Northwest Greenland: A Review. Danish Meteorological Institute Technical Report No. 96-12. 39 pp.
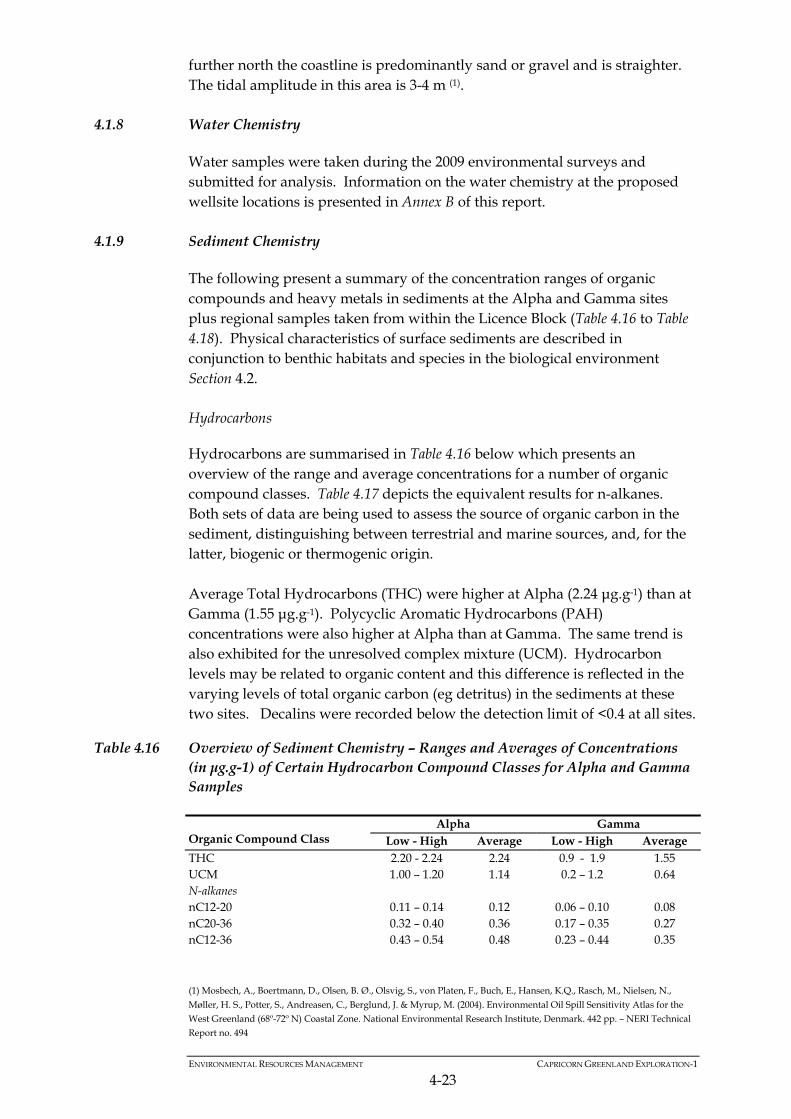
ENVIRONMENTAL RESOURCES MANAGEMENT CAPRICORN GREENLAND EXPLORATION-1
4-23
further north the coastline is predominantly sand or gravel and is straighter. The tidal amplitude in this area is 3-4 m (1).
4.1.8 Water Chemistry
Water samples were taken during the 2009 environmental surveys and submitted for analysis. Information on the water chemistry at the proposed wellsite locations is presented in Annex B of this report.
4.1.9 Sediment Chemistry
The following present a summary of the concentration ranges of organic compounds and heavy metals in sediments at the Alpha and Gamma sites plus regional samples taken from within the Licence Block (Table 4.16 to Table 4.18). Physical characteristics of surface sediments are described in conjunction to benthic habitats and species in the biological environment Section 4.2. Hydrocarbons
Hydrocarbons are summarised in Table 4.16 below which presents an overview of the range and average concentrations for a number of organic compound classes. Table 4.17 depicts the equivalent results for n-alkanes. Both sets of data are being used to assess the source of organic carbon in the sediment, distinguishing between terrestrial and marine sources, and, for the latter, biogenic or thermogenic origin. Average Total Hydrocarbons (THC) were higher at Alpha (2.24 μg.g-1) than at Gamma (1.55 μg.g-1). Polycyclic Aromatic Hydrocarbons (PAH) concentrations were also higher at Alpha than at Gamma. The same trend is also exhibited for the unresolved complex mixture (UCM). Hydrocarbon levels may be related to organic content and this difference is reflected in the varying levels of total organic carbon (eg detritus) in the sediments at these two sites. Decalins were recorded below the detection limit of <0.4 at all sites.
Table 4.16 Overview of Sediment Chemistry – Ranges and Averages of Concentrations (in μg.g-1) of Certain Hydrocarbon Compound Classes for Alpha and Gamma Samples
Alpha Gamma Organic Compound Class Low - High Average Low - High Average THC 2.20 - 2.24 2.24 0.9 - 1.9 1.55 UCM 1.00 – 1.20 1.14 0.2 – 1.2 0.64 N-alkanes nC12-20 0.11 – 0.14 0.12 0.06 – 0.10 0.08 nC20-36 0.32 – 0.40 0.36 0.17 – 0.35 0.27 nC12-36 0.43 – 0.54 0.48 0.23 – 0.44 0.35
(1) Mosbech, A., Boertmann, D., Olsen, B. Ø., Olsvig, S., von Platen, F., Buch, E., Hansen, K.Q., Rasch, M., Nielsen, N.,
Møller, H. S., Potter, S., Andreasen, C., Berglund, J. & Myrup, M. (2004). Environmental Oil Spill Sensitivity Atlas for the West Greenland (68º-72º N) Coastal Zone. National Environmental Research Institute, Denmark. 442 pp. – NERI Technical
Report no. 494
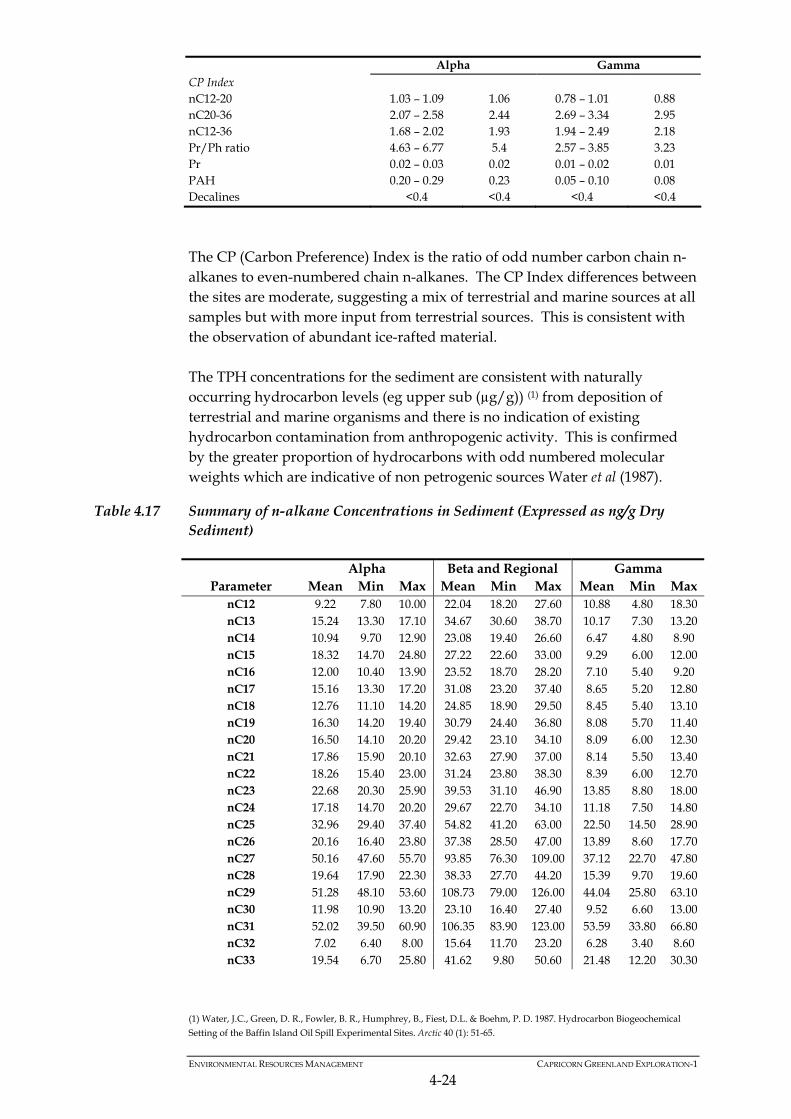
ENVIRONMENTAL RESOURCES MANAGEMENT CAPRICORN GREENLAND EXPLORATION-1
4-24
Alpha Gamma CP Index nC12-20 1.03 – 1.09 1.06 0.78 – 1.01 0.88 nC20-36 2.07 – 2.58 2.44 2.69 – 3.34 2.95 nC12-36 1.68 – 2.02 1.93 1.94 – 2.49 2.18 Pr/Ph ratio 4.63 – 6.77 5.4 2.57 – 3.85 3.23 Pr 0.02 – 0.03 0.02 0.01 – 0.02 0.01 PAH 0.20 – 0.29 0.23 0.05 – 0.10 0.08 Decalines <0.4 <0.4 <0.4 <0.4
The CP (Carbon Preference) Index is the ratio of odd number carbon chain n-alkanes to even-numbered chain n-alkanes. The CP Index differences between the sites are moderate, suggesting a mix of terrestrial and marine sources at all samples but with more input from terrestrial sources. This is consistent with the observation of abundant ice-rafted material. The TPH concentrations for the sediment are consistent with naturally occurring hydrocarbon levels (eg upper sub (µg/g)) (1) from deposition of terrestrial and marine organisms and there is no indication of existing hydrocarbon contamination from anthropogenic activity. This is confirmed by the greater proportion of hydrocarbons with odd numbered molecular weights which are indicative of non petrogenic sources Water et al (1987).
Table 4.17 Summary of n-alkane Concentrations in Sediment (Expressed as ng/g Dry Sediment)
Alpha Beta and Regional Gamma Parameter Mean Min Max Mean Min Max Mean Min Max
nC12 9.22 7.80 10.00 22.04 18.20 27.60 10.88 4.80 18.30 nC13 15.24 13.30 17.10 34.67 30.60 38.70 10.17 7.30 13.20 nC14 10.94 9.70 12.90 23.08 19.40 26.60 6.47 4.80 8.90 nC15 18.32 14.70 24.80 27.22 22.60 33.00 9.29 6.00 12.00 nC16 12.00 10.40 13.90 23.52 18.70 28.20 7.10 5.40 9.20 nC17 15.16 13.30 17.20 31.08 23.20 37.40 8.65 5.20 12.80 nC18 12.76 11.10 14.20 24.85 18.90 29.50 8.45 5.40 13.10 nC19 16.30 14.20 19.40 30.79 24.40 36.80 8.08 5.70 11.40 nC20 16.50 14.10 20.20 29.42 23.10 34.10 8.09 6.00 12.30 nC21 17.86 15.90 20.10 32.63 27.90 37.00 8.14 5.50 13.40 nC22 18.26 15.40 23.00 31.24 23.80 38.30 8.39 6.00 12.70 nC23 22.68 20.30 25.90 39.53 31.10 46.90 13.85 8.80 18.00 nC24 17.18 14.70 20.20 29.67 22.70 34.10 11.18 7.50 14.80 nC25 32.96 29.40 37.40 54.82 41.20 63.00 22.50 14.50 28.90 nC26 20.16 16.40 23.80 37.38 28.50 47.00 13.89 8.60 17.70 nC27 50.16 47.60 55.70 93.85 76.30 109.00 37.12 22.70 47.80 nC28 19.64 17.90 22.30 38.33 27.70 44.20 15.39 9.70 19.60 nC29 51.28 48.10 53.60 108.73 79.00 126.00 44.04 25.80 63.10 nC30 11.98 10.90 13.20 23.10 16.40 27.40 9.52 6.60 13.00 nC31 52.02 39.50 60.90 106.35 83.90 123.00 53.59 33.80 66.80 nC32 7.02 6.40 8.00 15.64 11.70 23.20 6.28 3.40 8.60 nC33 19.54 6.70 25.80 41.62 9.80 50.60 21.48 12.20 30.30
(1) Water, J.C., Green, D. R., Fowler, B. R., Humphrey, B., Fiest, D.L. & Boehm, P. D. 1987. Hydrocarbon Biogeochemical
Setting of the Baffin Island Oil Spill Experimental Sites. Arctic 40 (1): 51-65.
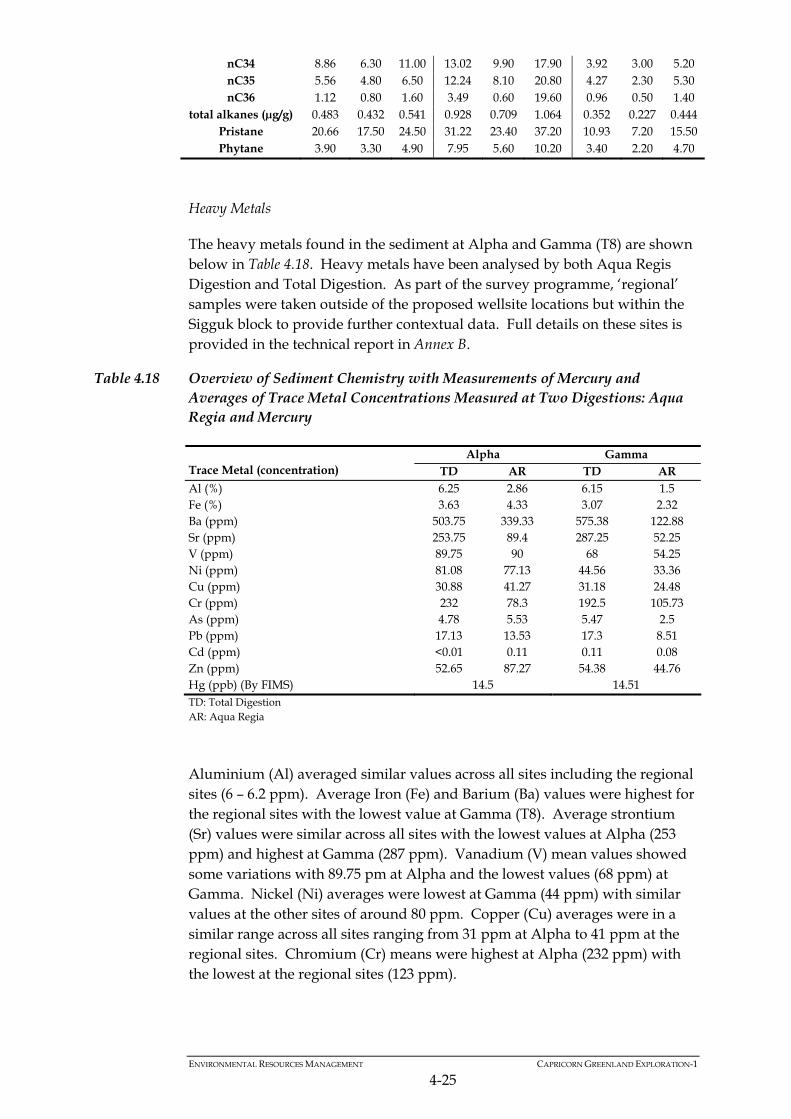
ENVIRONMENTAL RESOURCES MANAGEMENT CAPRICORN GREENLAND EXPLORATION-1
4-25
nC34 8.86 6.30 11.00 13.02 9.90 17.90 3.92 3.00 5.20 nC35 5.56 4.80 6.50 12.24 8.10 20.80 4.27 2.30 5.30 nC36 1.12 0.80 1.60 3.49 0.60 19.60 0.96 0.50 1.40
total alkanes (µg/g) 0.483 0.432 0.541 0.928 0.709 1.064 0.352 0.227 0.444 Pristane 20.66 17.50 24.50 31.22 23.40 37.20 10.93 7.20 15.50 Phytane 3.90 3.30 4.90 7.95 5.60 10.20 3.40 2.20 4.70
Heavy Metals
The heavy metals found in the sediment at Alpha and Gamma (T8) are shown below in Table 4.18. Heavy metals have been analysed by both Aqua Regis Digestion and Total Digestion. As part of the survey programme, ‘regional’ samples were taken outside of the proposed wellsite locations but within the Sigguk block to provide further contextual data. Full details on these sites is provided in the technical report in Annex B.
Table 4.18 Overview of Sediment Chemistry with Measurements of Mercury and Averages of Trace Metal Concentrations Measured at Two Digestions: Aqua Regia and Mercury
Alpha Gamma Trace Metal (concentration) TD AR TD AR Al (%) 6.25 2.86 6.15 1.5 Fe (%) 3.63 4.33 3.07 2.32 Ba (ppm) 503.75 339.33 575.38 122.88 Sr (ppm) 253.75 89.4 287.25 52.25 V (ppm) 89.75 90 68 54.25 Ni (ppm) 81.08 77.13 44.56 33.36 Cu (ppm) 30.88 41.27 31.18 24.48 Cr (ppm) 232 78.3 192.5 105.73 As (ppm) 4.78 5.53 5.47 2.5 Pb (ppm) 17.13 13.53 17.3 8.51 Cd (ppm) <0.01 0.11 0.11 0.08 Zn (ppm) 52.65 87.27 54.38 44.76 Hg (ppb) (By FIMS) 14.5 14.51 TD: Total Digestion AR: Aqua Regia
Aluminium (Al) averaged similar values across all sites including the regional sites (6 – 6.2 ppm). Average Iron (Fe) and Barium (Ba) values were highest for the regional sites with the lowest value at Gamma (T8). Average strontium (Sr) values were similar across all sites with the lowest values at Alpha (253 ppm) and highest at Gamma (287 ppm). Vanadium (V) mean values showed some variations with 89.75 pm at Alpha and the lowest values (68 ppm) at Gamma. Nickel (Ni) averages were lowest at Gamma (44 ppm) with similar values at the other sites of around 80 ppm. Copper (Cu) averages were in a similar range across all sites ranging from 31 ppm at Alpha to 41 ppm at the regional sites. Chromium (Cr) means were highest at Alpha (232 ppm) with the lowest at the regional sites (123 ppm).
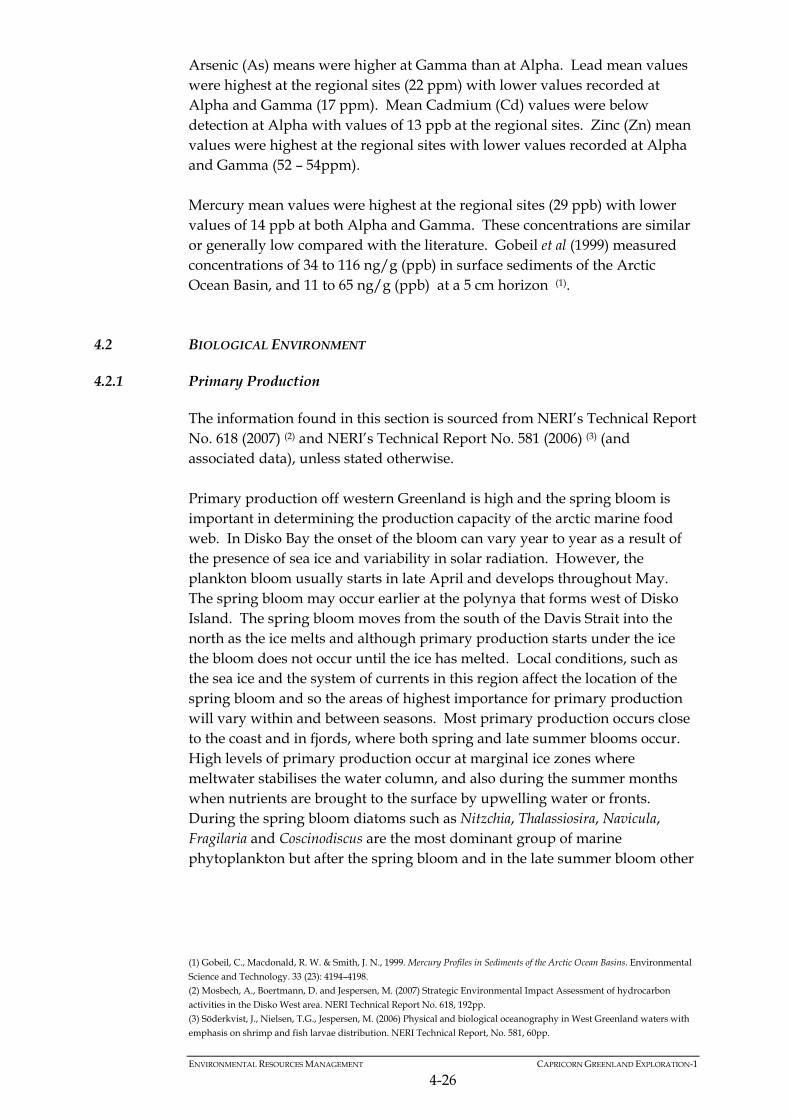
ENVIRONMENTAL RESOURCES MANAGEMENT CAPRICORN GREENLAND EXPLORATION-1
4-26
Arsenic (As) means were higher at Gamma than at Alpha. Lead mean values were highest at the regional sites (22 ppm) with lower values recorded at Alpha and Gamma (17 ppm). Mean Cadmium (Cd) values were below detection at Alpha with values of 13 ppb at the regional sites. Zinc (Zn) mean values were highest at the regional sites with lower values recorded at Alpha and Gamma (52 – 54ppm). Mercury mean values were highest at the regional sites (29 ppb) with lower values of 14 ppb at both Alpha and Gamma. These concentrations are similar or generally low compared with the literature. Gobeil et al (1999) measured concentrations of 34 to 116 ng/g (ppb) in surface sediments of the Arctic Ocean Basin, and 11 to 65 ng/g (ppb) at a 5 cm horizon (1).
4.2 BIOLOGICAL ENVIRONMENT
4.2.1 Primary Production
The information found in this section is sourced from NERI’s Technical Report No. 618 (2007) (2) and NERI’s Technical Report No. 581 (2006) (3) (and associated data), unless stated otherwise. Primary production off western Greenland is high and the spring bloom is important in determining the production capacity of the arctic marine food web. In Disko Bay the onset of the bloom can vary year to year as a result of the presence of sea ice and variability in solar radiation. However, the plankton bloom usually starts in late April and develops throughout May. The spring bloom may occur earlier at the polynya that forms west of Disko Island. The spring bloom moves from the south of the Davis Strait into the north as the ice melts and although primary production starts under the ice the bloom does not occur until the ice has melted. Local conditions, such as the sea ice and the system of currents in this region affect the location of the spring bloom and so the areas of highest importance for primary production will vary within and between seasons. Most primary production occurs close to the coast and in fjords, where both spring and late summer blooms occur. High levels of primary production occur at marginal ice zones where meltwater stabilises the water column, and also during the summer months when nutrients are brought to the surface by upwelling water or fronts. During the spring bloom diatoms such as Nitzchia, Thalassiosira, Navicula, Fragilaria and Coscinodiscus are the most dominant group of marine phytoplankton but after the spring bloom and in the late summer bloom other
(1) Gobeil, C., Macdonald, R. W. & Smith, J. N., 1999. Mercury Profiles in Sediments of the Arctic Ocean Basins. Environmental
Science and Technology. 33 (23): 4194–4198. (2) Mosbech, A., Boertmann, D. and Jespersen, M. (2007) Strategic Environmental Impact Assessment of hydrocarbon
activities in the Disko West area. NERI Technical Report No. 618, 192pp. (3) Söderkvist, J., Nielsen, T.G., Jespersen, M. (2006) Physical and biological oceanography in West Greenland waters with
emphasis on shrimp and fish larvae distribution. NERI Technical Report, No. 581, 60pp.
ENVIRONMENTAL RESOURCES MANAGEMENT CAPRICORN GREENLAND EXPLORATION-1
4-27
smaller species dominate, such as those of the genera Phaeocystis and Chaeothocerus as well as some dinoflagellates and flagellates (1). Other sources of primary production in the Disko Bay area are attached marine algae and ice algae. A band of green algae and a band of brown algae characterises the littoral zone around the coast of Greenland (2). Bladderwrack (Fucus vesiculosus) is found at and below the low tide line. Attached marine algae forests are found at the lower part of the littoral zone (to depths of 30-50 m) and is primarily composed of sea colander (Agarum cribrosum) and kelp (Laminaria longicruris). Seaweed forests are not only spawning grounds for species such as capelin and lumpfish but are also important nurseries for several fish larvae and young lumpfish. Ice algae, which grow on the underside of the sea ice, at the marginal ice zone can be extremely productive. First year ice generally has less ice algae than multi year ice, however, the relative importance of the marginal ice zone is not fully understood.
4.2.2 Zooplankton
Western Greenland is dominated by holoplankton (3) with the most important being crustaceans, which constitute 86% of the zooplankton biomass (4). Crustaceans, specifically the genus Calanus (including their larval stages), are the most dominant and form the staple diet for many fish, larvae, whales and seabirds, which with 84% of the crustacean biomass is thought to be one of the most important animal groups in northern marine regions. Calanus finmarchicus is the most common species found in the waters surrounding Greenland and in addition C. glacialis and C. hyperboreus are found in Arctic waters. These copepods live in the top 100 m of the water column in spring and summer and feed exclusively on algae. During autumn and winter they sink to deeper water where they metabolise their energy reserves. Other copepods found in western Greenland include Metridia longa and species of the genera Paracalanus, Pseudocalanus, Oncaea, Oithona and Microstella. High numbers of Calanus have been recorded in Disko Bay, over the fishing banks and further west in deep waters, which are also important sites for fish larvae development. Shrimp larvae are generally found in water less than 200 m deep, over the fishing banks and where their prey is located. The appearance of the Calanus populations in early summer coincides with the peak abundance of shrimp and fish larvae, which prey on Calanus spp. The western Greenland zooplankton biomass is also composed of meroplankton (5), which are mainly found in areas of high productivity along the coasts and in fjords and is dominated by crustacean larvae, such as barnacles, crabs and shrimp. The larvae of fish, echinoderms, bivalves, snails and polychaetes are also present in Disko Bay.
(1) Greenland Institute of Natural Resources (2003) Biodiversity of Greenland - a country study. Technical Report No. 55,
Pinngortitaleriffik, Grønlands Naturinstitut, 165 pp. (2) Greenland Institute of Natural Resources (2003) Biodiversity of Greenland - a country study. Technical Report No. 55,
Pinngortitaleriffik, Grønlands Naturinstitut, 165 pp. (3) Organisms that are pelagic throughout their life. (4) Greenland Institute of Natural Resources. 2003. Biodiversity of Greenland - a country study. Technical Report No. 55, Pinngortitaleriffik, Grønlands Naturinstitut, 165 pp. (5) Species that are only pelagic for part of their life cycle.
ENVIRONMENTAL RESOURCES MANAGEMENT CAPRICORN GREENLAND EXPLORATION-1
4-28
4.2.3 Invertebrates
Benthic communities are an important ecosystem component on the West Greenland continental shelf in Baffin Bay. Communities provide a food source for fish and other invertebrates and in some cases serve as the basis for fisheries for species such as scallops and shrimp. In general benthic communities are determined by temperature, the influence of different water masses, the type of sediment and the food supply to the benthos (eg Eleftheriou and Basford, (1989) (1) and Stewart et al (1985)). Longhurst (2007) (2) identifies benthic community types typical of arctic regions. Below the ice scoured intertidal and shallow sublittoral zone, down to about 50 m (ie in the influence of the surface water mass) the benthos is typified by modifications of the Macoma and Astarte (both bivalve molluscs) communities with variants depending on sediment type. These communities tend to have high biomass. The slope areas and deeper locations are frequently also dominated by Asarte but with Bathyarca, another bivalve, as a co-dominant species. This is the Astarte- Bathyarca community which often has aggregations of tube building amphipods (shrimp like crustacea) eg Haploops tubicola. Other amphipods particularly ampelescids are commonly associated. In deeper areas foraminifera are typical in communities of relatively low biomass in comparison with shallower areas. In areas affected by ice scour benthic habitats will be disturbed and there is evidence from shallow arctic waters that communities inside and outside ice scoured areas are markedly different, ice scour eliminated or damaged large delicate species and smaller polychaetes and bivalves predominated (Conlan et al 1998) (3). Scavenging and predatory polychaetes (bristle-worms) and amphipods were tended to congregate in the ice scoured areas to feed of damaged and exposed fauna. It is likely that ice scoured sediment in which the benthos has been eliminated or is dredged from subsurface layers will be colonised by opportunist species which are able to colonise areas rapidly. Ice scour will also tend to alter the sediment by exposing subsurface substrata and depositing ice rafted material in this way increasing habitat diversity and therefore the range of community types. The infaunal survey results have been analysed by multivariate statistics (4). The results indicate that the benthic communities sampled are variable within each site. For both Alpha and Gamma most replicates are clustered together at the 40% similarity level. This is most likely due to the variable sedimentary conditions as indicated by the particle size analysis and under water-video and the effects of ice scour. Both these factors will tend to increase the diversity of habitats and therefore associated species composition.
(1) Eleftheriou, A. and Basford, D. J. 1989. Journal of the Marine Biological Association of the UK, 69: 123–143. (2) Longhurst A. Ecological Geography of the Seas, 2nd Edition 2007. Pubs Elsevier Press (3) Conlan, K. E, Lenithan, H. S., Kvitek R. G. & Oliver J.S. 1998. Ice scour disturbance to benthic communities in the
Canadian High Arctic. Marine Ecology Progress Series 166: 1-16. (4) The multivariate statistics used to examine these data were MDS ordination and cluster analysis using PRIMER
software.
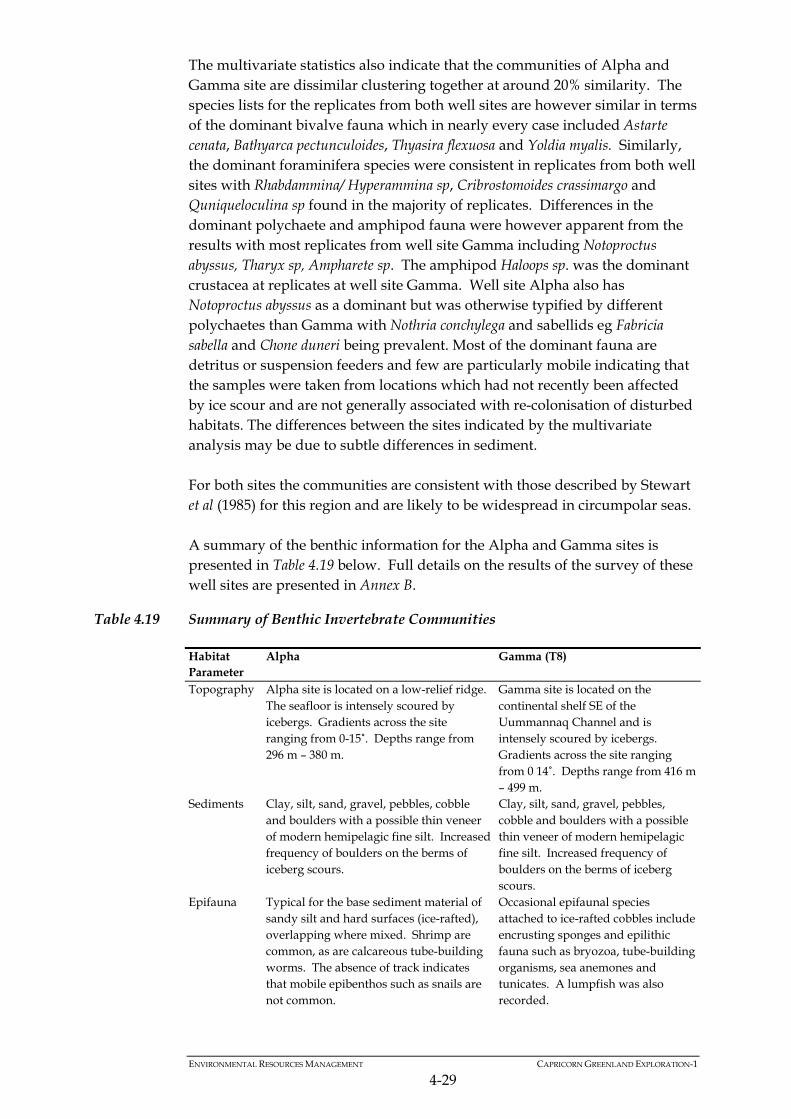
ENVIRONMENTAL RESOURCES MANAGEMENT CAPRICORN GREENLAND EXPLORATION-1
4-29
The multivariate statistics also indicate that the communities of Alpha and Gamma site are dissimilar clustering together at around 20% similarity. The species lists for the replicates from both well sites are however similar in terms of the dominant bivalve fauna which in nearly every case included Astarte cenata, Bathyarca pectunculoides, Thyasira flexuosa and Yoldia myalis. Similarly, the dominant foraminifera species were consistent in replicates from both well sites with Rhabdammina/ Hyperammina sp, Cribrostomoides crassimargo and Quniqueloculina sp found in the majority of replicates. Differences in the dominant polychaete and amphipod fauna were however apparent from the results with most replicates from well site Gamma including Notoproctus abyssus, Tharyx sp, Ampharete sp. The amphipod Haloops sp. was the dominant crustacea at replicates at well site Gamma. Well site Alpha also has Notoproctus abyssus as a dominant but was otherwise typified by different polychaetes than Gamma with Nothria conchylega and sabellids eg Fabricia sabella and Chone duneri being prevalent. Most of the dominant fauna are detritus or suspension feeders and few are particularly mobile indicating that the samples were taken from locations which had not recently been affected by ice scour and are not generally associated with re-colonisation of disturbed habitats. The differences between the sites indicated by the multivariate analysis may be due to subtle differences in sediment. For both sites the communities are consistent with those described by Stewart et al (1985) for this region and are likely to be widespread in circumpolar seas. A summary of the benthic information for the Alpha and Gamma sites is presented in Table 4.19 below. Full details on the results of the survey of these well sites are presented in Annex B.
Table 4.19 Summary of Benthic Invertebrate Communities
Habitat Parameter
Alpha Gamma (T8)
Topography Alpha site is located on a low-relief ridge. The seafloor is intensely scoured by icebergs. Gradients across the site ranging from 0-15˚. Depths range from 296 m – 380 m.
Gamma site is located on the continental shelf SE of the Uummannaq Channel and is intensely scoured by icebergs. Gradients across the site ranging from 0 14˚. Depths range from 416 m – 499 m.
Sediments Clay, silt, sand, gravel, pebbles, cobble and boulders with a possible thin veneer of modern hemipelagic fine silt. Increased frequency of boulders on the berms of iceberg scours.
Clay, silt, sand, gravel, pebbles, cobble and boulders with a possible thin veneer of modern hemipelagic fine silt. Increased frequency of boulders on the berms of iceberg scours.
Epifauna Typical for the base sediment material of sandy silt and hard surfaces (ice-rafted), overlapping where mixed. Shrimp are common, as are calcareous tube-building worms. The absence of track indicates that mobile epibenthos such as snails are not common.
Occasional epifaunal species attached to ice-rafted cobbles include encrusting sponges and epilithic fauna such as bryozoa, tube-building organisms, sea anemones and tunicates. A lumpfish was also recorded.
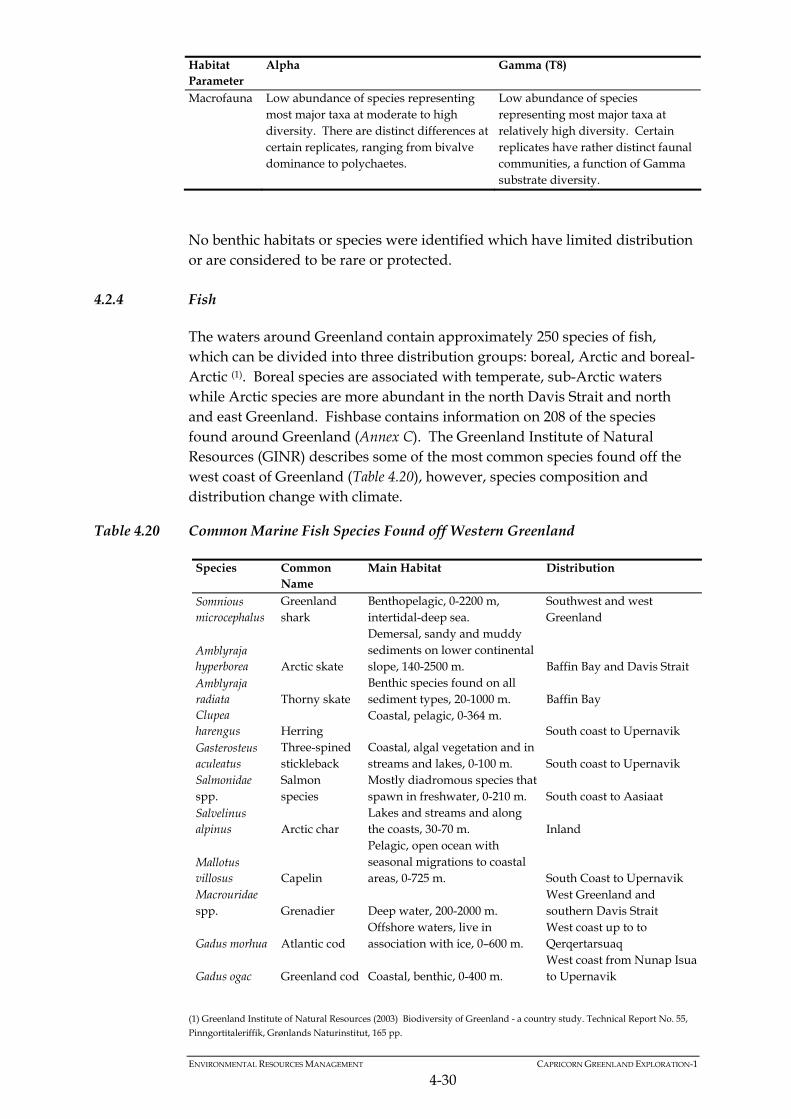
ENVIRONMENTAL RESOURCES MANAGEMENT CAPRICORN GREENLAND EXPLORATION-1
4-30
Habitat Parameter
Alpha Gamma (T8)
Macrofauna Low abundance of species representing most major taxa at moderate to high diversity. There are distinct differences at certain replicates, ranging from bivalve dominance to polychaetes.
Low abundance of species representing most major taxa at relatively high diversity. Certain replicates have rather distinct faunal communities, a function of Gamma substrate diversity.
No benthic habitats or species were identified which have limited distribution or are considered to be rare or protected.
4.2.4 Fish
The waters around Greenland contain approximately 250 species of fish, which can be divided into three distribution groups: boreal, Arctic and boreal-Arctic (1). Boreal species are associated with temperate, sub-Arctic waters while Arctic species are more abundant in the north Davis Strait and north and east Greenland. Fishbase contains information on 208 of the species found around Greenland (Annex C). The Greenland Institute of Natural Resources (GINR) describes some of the most common species found off the west coast of Greenland (Table 4.20), however, species composition and distribution change with climate.
Table 4.20 Common Marine Fish Species Found off Western Greenland
Species Common Name
Main Habitat Distribution
Somnious microcephalus
Greenland shark
Benthopelagic, 0-2200 m, intertidal-deep sea.
Southwest and west Greenland
Amblyraja hyperborea Arctic skate
Demersal, sandy and muddy sediments on lower continental slope, 140-2500 m. Baffin Bay and Davis Strait
Amblyraja radiata Thorny skate
Benthic species found on all sediment types, 20-1000 m. Baffin Bay
Clupea harengus Herring
Coastal, pelagic, 0-364 m. South coast to Upernavik
Gasterosteus aculeatus
Three-spined stickleback
Coastal, algal vegetation and in streams and lakes, 0-100 m. South coast to Upernavik
Salmonidae spp.
Salmon species
Mostly diadromous species that spawn in freshwater, 0-210 m. South coast to Aasiaat
Salvelinus alpinus Arctic char
Lakes and streams and along the coasts, 30-70 m. Inland
Mallotus villosus Capelin
Pelagic, open ocean with seasonal migrations to coastal areas, 0-725 m. South Coast to Upernavik
Macrouridae spp. Grenadier Deep water, 200-2000 m.
West Greenland and southern Davis Strait
Gadus morhua Atlantic cod Offshore waters, live in association with ice, 0–600 m.
West coast up to to Qerqertarsuaq
Gadus ogac Greenland cod Coastal, benthic, 0-400 m. West coast from Nunap Isua to Upernavik
(1) Greenland Institute of Natural Resources (2003) Biodiversity of Greenland - a country study. Technical Report No. 55,
Pinngortitaleriffik, Grønlands Naturinstitut, 165 pp.
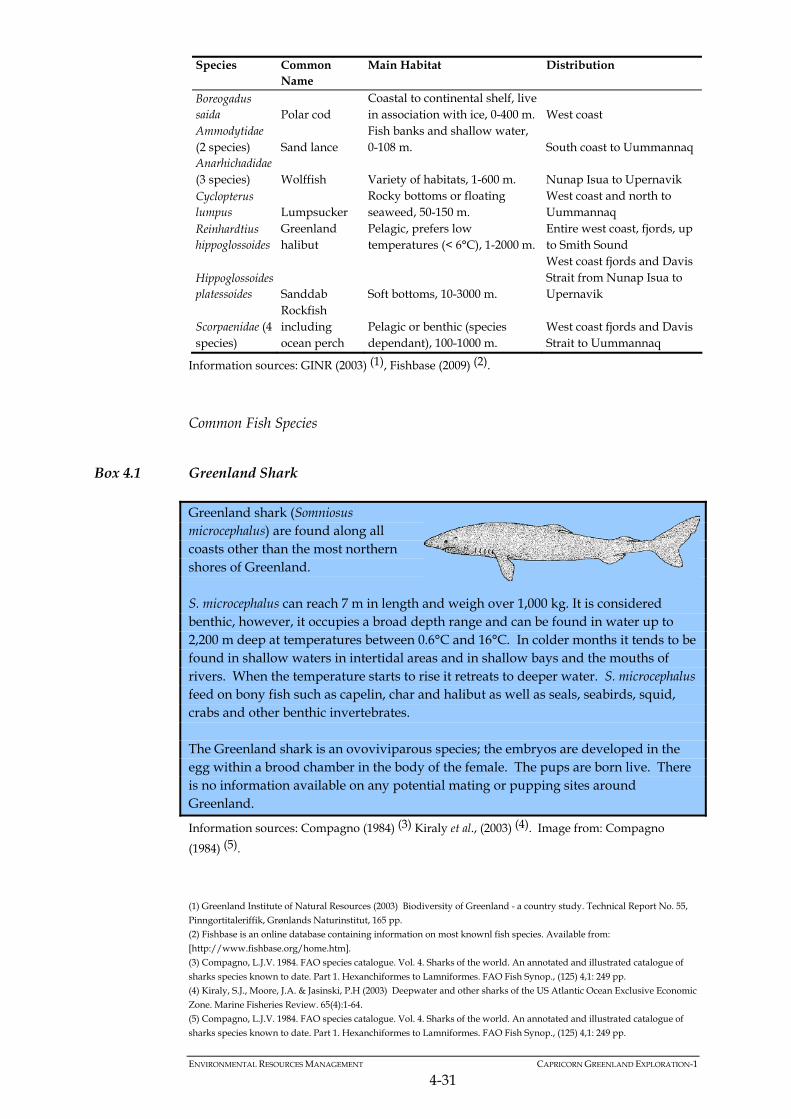
ENVIRONMENTAL RESOURCES MANAGEMENT CAPRICORN GREENLAND EXPLORATION-1
4-31
Species Common Name
Main Habitat Distribution
Boreogadus saida Polar cod
Coastal to continental shelf, live in association with ice, 0-400 m. West coast
Ammodytidae (2 species) Sand lance
Fish banks and shallow water, 0-108 m. South coast to Uummannaq
Anarhichadidae (3 species) Wolffish Variety of habitats, 1-600 m. Nunap Isua to Upernavik Cyclopterus lumpus Lumpsucker
Rocky bottoms or floating seaweed, 50-150 m.
West coast and north to Uummannaq
Reinhardtius hippoglossoides
Greenland halibut
Pelagic, prefers low temperatures (< 6°C), 1-2000 m.
Entire west coast, fjords, up to Smith Sound
Hippoglossoides platessoides Sanddab Soft bottoms, 10-3000 m.
West coast fjords and Davis Strait from Nunap Isua to Upernavik
Scorpaenidae (4 species)
Rockfish including ocean perch
Pelagic or benthic (species dependant), 100-1000 m.
West coast fjords and Davis Strait to Uummannaq
Information sources: GINR (2003) (1), Fishbase (2009) (2).
Common Fish Species
Box 4.1 Greenland Shark
Greenland shark (Somniosus microcephalus) are found along all coasts other than the most northern shores of Greenland. S. microcephalus can reach 7 m in length and weigh over 1,000 kg. It is considered benthic, however, it occupies a broad depth range and can be found in water up to 2,200 m deep at temperatures between 0.6°C and 16°C. In colder months it tends to be found in shallow waters in intertidal areas and in shallow bays and the mouths of rivers. When the temperature starts to rise it retreats to deeper water. S. microcephalus feed on bony fish such as capelin, char and halibut as well as seals, seabirds, squid, crabs and other benthic invertebrates. The Greenland shark is an ovoviviparous species; the embryos are developed in the egg within a brood chamber in the body of the female. The pups are born live. There is no information available on any potential mating or pupping sites around Greenland.
Information sources: Compagno (1984) (3) Kiraly et al., (2003) (4). Image from: Compagno
(1984) (5).
(1) Greenland Institute of Natural Resources (2003) Biodiversity of Greenland - a country study. Technical Report No. 55,
Pinngortitaleriffik, Grønlands Naturinstitut, 165 pp. (2) Fishbase is an online database containing information on most knownl fish species. Available from:
[http://www.fishbase.org/home.htm]. (3) Compagno, L.J.V. 1984. FAO species catalogue. Vol. 4. Sharks of the world. An annotated and illustrated catalogue of
sharks species known to date. Part 1. Hexanchiformes to Lamniformes. FAO Fish Synop., (125) 4,1: 249 pp. (4) Kiraly, S.J., Moore, J.A. & Jasinski, P.H (2003) Deepwater and other sharks of the US Atlantic Ocean Exclusive Economic
Zone. Marine Fisheries Review. 65(4):1-64. (5) Compagno, L.J.V. 1984. FAO species catalogue. Vol. 4. Sharks of the world. An annotated and illustrated catalogue of
sharks species known to date. Part 1. Hexanchiformes to Lamniformes. FAO Fish Synop., (125) 4,1: 249 pp.
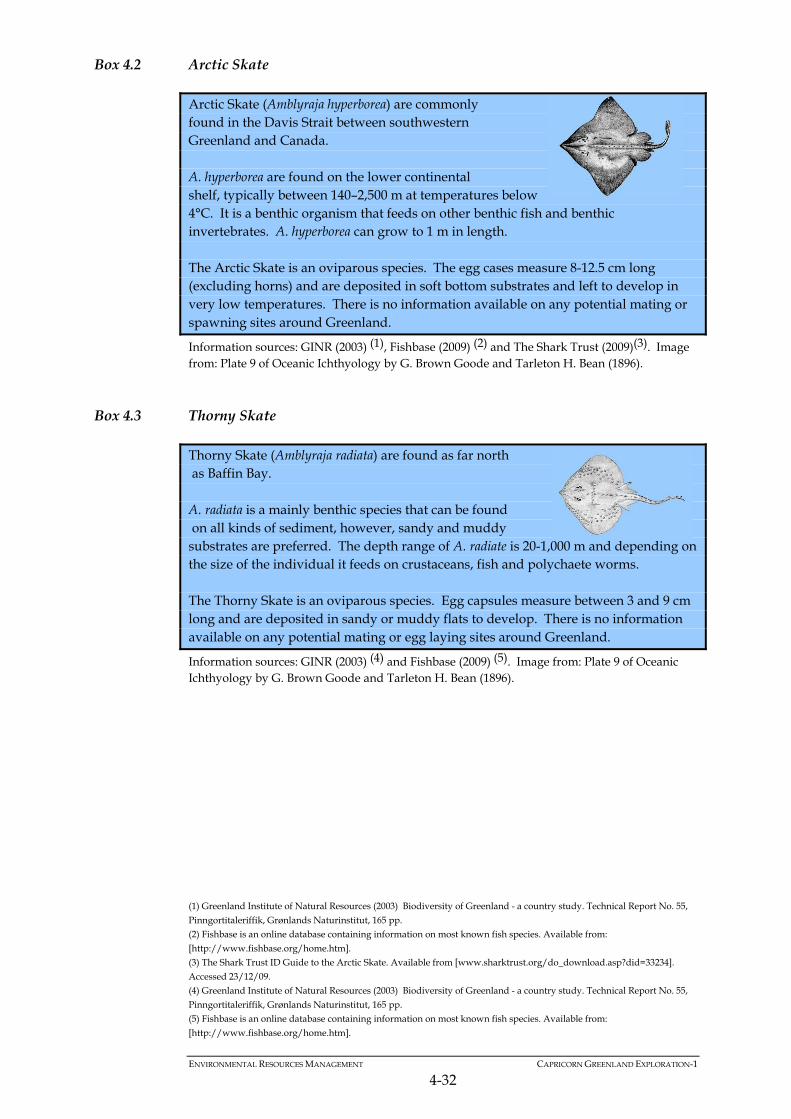
ENVIRONMENTAL RESOURCES MANAGEMENT CAPRICORN GREENLAND EXPLORATION-1
4-32
Box 4.2 Arctic Skate
Arctic Skate (Amblyraja hyperborea) are commonly found in the Davis Strait between southwestern Greenland and Canada. A. hyperborea are found on the lower continental shelf, typically between 140–2,500 m at temperatures below 4°C. It is a benthic organism that feeds on other benthic fish and benthic invertebrates. A. hyperborea can grow to 1 m in length. The Arctic Skate is an oviparous species. The egg cases measure 8-12.5 cm long (excluding horns) and are deposited in soft bottom substrates and left to develop in very low temperatures. There is no information available on any potential mating or spawning sites around Greenland.
Information sources: GINR (2003) (1), Fishbase (2009) (2) and The Shark Trust (2009)(3). Image from: Plate 9 of Oceanic Ichthyology by G. Brown Goode and Tarleton H. Bean (1896).
Box 4.3 Thorny Skate
Thorny Skate (Amblyraja radiata) are found as far north as Baffin Bay. A. radiata is a mainly benthic species that can be found on all kinds of sediment, however, sandy and muddy substrates are preferred. The depth range of A. radiate is 20-1,000 m and depending on the size of the individual it feeds on crustaceans, fish and polychaete worms. The Thorny Skate is an oviparous species. Egg capsules measure between 3 and 9 cm long and are deposited in sandy or muddy flats to develop. There is no information available on any potential mating or egg laying sites around Greenland.
Information sources: GINR (2003) (4) and Fishbase (2009) (5). Image from: Plate 9 of Oceanic Ichthyology by G. Brown Goode and Tarleton H. Bean (1896).
(1) Greenland Institute of Natural Resources (2003) Biodiversity of Greenland - a country study. Technical Report No. 55,
Pinngortitaleriffik, Grønlands Naturinstitut, 165 pp. (2) Fishbase is an online database containing information on most known fish species. Available from:
[http://www.fishbase.org/home.htm]. (3) The Shark Trust ID Guide to the Arctic Skate. Available from [www.sharktrust.org/do_download.asp?did=33234].
Accessed 23/12/09. (4) Greenland Institute of Natural Resources (2003) Biodiversity of Greenland - a country study. Technical Report No. 55,
Pinngortitaleriffik, Grønlands Naturinstitut, 165 pp. (5) Fishbase is an online database containing information on most known fish species. Available from:
[http://www.fishbase.org/home.htm].
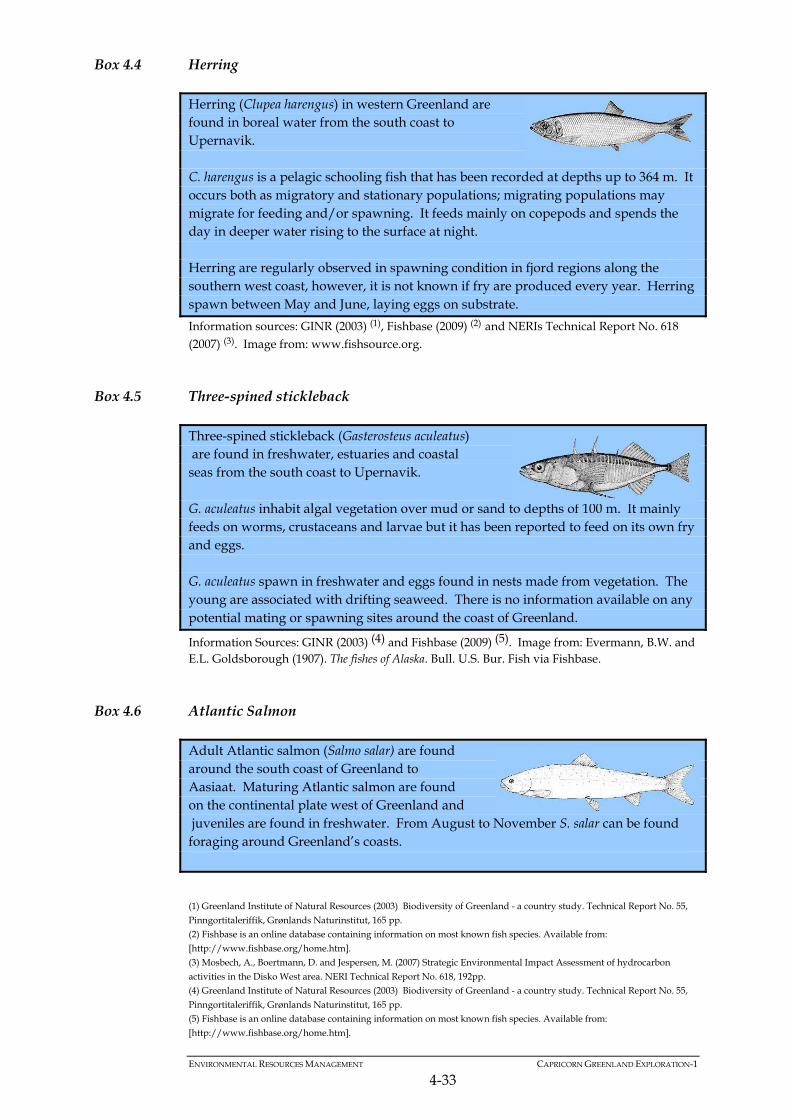
ENVIRONMENTAL RESOURCES MANAGEMENT CAPRICORN GREENLAND EXPLORATION-1
4-33
Box 4.4 Herring
Herring (Clupea harengus) in western Greenland are found in boreal water from the south coast to Upernavik. C. harengus is a pelagic schooling fish that has been recorded at depths up to 364 m. It occurs both as migratory and stationary populations; migrating populations may migrate for feeding and/or spawning. It feeds mainly on copepods and spends the day in deeper water rising to the surface at night. Herring are regularly observed in spawning condition in fjord regions along the southern west coast, however, it is not known if fry are produced every year. Herring spawn between May and June, laying eggs on substrate.
Information sources: GINR (2003) (1), Fishbase (2009) (2) and NERIs Technical Report No. 618 (2007) (3). Image from: www.fishsource.org.
Box 4.5 Three-spined stickleback
Three-spined stickleback (Gasterosteus aculeatus) are found in freshwater, estuaries and coastal seas from the south coast to Upernavik. G. aculeatus inhabit algal vegetation over mud or sand to depths of 100 m. It mainly feeds on worms, crustaceans and larvae but it has been reported to feed on its own fry and eggs. G. aculeatus spawn in freshwater and eggs found in nests made from vegetation. The young are associated with drifting seaweed. There is no information available on any potential mating or spawning sites around the coast of Greenland.
Information Sources: GINR (2003) (4) and Fishbase (2009) (5). Image from: Evermann, B.W. and E.L. Goldsborough (1907). The fishes of Alaska. Bull. U.S. Bur. Fish via Fishbase.
Box 4.6 Atlantic Salmon
Adult Atlantic salmon (Salmo salar) are found around the south coast of Greenland to Aasiaat. Maturing Atlantic salmon are found on the continental plate west of Greenland and juveniles are found in freshwater. From August to November S. salar can be found foraging around Greenland’s coasts.
(1) Greenland Institute of Natural Resources (2003) Biodiversity of Greenland - a country study. Technical Report No. 55,
Pinngortitaleriffik, Grønlands Naturinstitut, 165 pp. (2) Fishbase is an online database containing information on most known fish species. Available from:
[http://www.fishbase.org/home.htm]. (3) Mosbech, A., Boertmann, D. and Jespersen, M. (2007) Strategic Environmental Impact Assessment of hydrocarbon
activities in the Disko West area. NERI Technical Report No. 618, 192pp. (4) Greenland Institute of Natural Resources (2003) Biodiversity of Greenland - a country study. Technical Report No. 55,
Pinngortitaleriffik, Grønlands Naturinstitut, 165 pp. (5) Fishbase is an online database containing information on most known fish species. Available from:
[http://www.fishbase.org/home.htm].
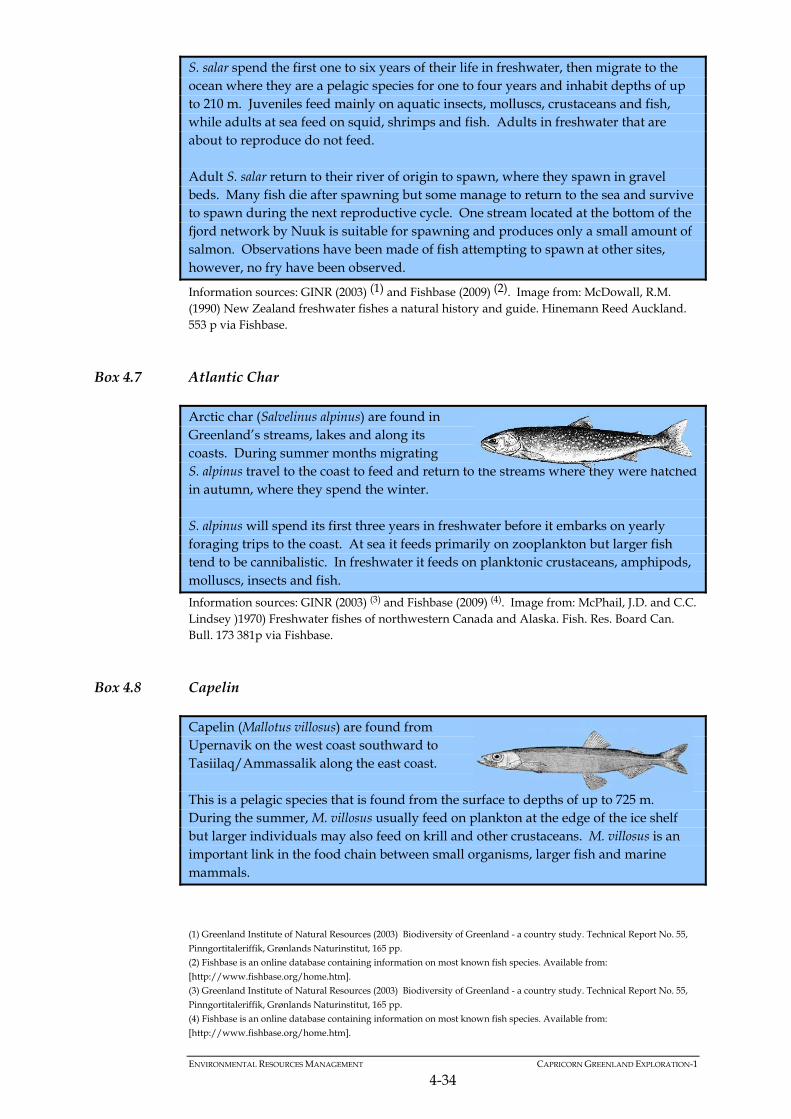
ENVIRONMENTAL RESOURCES MANAGEMENT CAPRICORN GREENLAND EXPLORATION-1
4-34
S. salar spend the first one to six years of their life in freshwater, then migrate to the ocean where they are a pelagic species for one to four years and inhabit depths of up to 210 m. Juveniles feed mainly on aquatic insects, molluscs, crustaceans and fish, while adults at sea feed on squid, shrimps and fish. Adults in freshwater that are about to reproduce do not feed. Adult S. salar return to their river of origin to spawn, where they spawn in gravel beds. Many fish die after spawning but some manage to return to the sea and survive to spawn during the next reproductive cycle. One stream located at the bottom of the fjord network by Nuuk is suitable for spawning and produces only a small amount of salmon. Observations have been made of fish attempting to spawn at other sites, however, no fry have been observed.
Information sources: GINR (2003) (1) and Fishbase (2009) (2). Image from: McDowall, R.M. (1990) New Zealand freshwater fishes a natural history and guide. Hinemann Reed Auckland. 553 p via Fishbase.
Box 4.7 Atlantic Char
Arctic char (Salvelinus alpinus) are found in Greenland’s streams, lakes and along its coasts. During summer months migrating S. alpinus travel to the coast to feed and return to the streams where they were hatched in autumn, where they spend the winter. S. alpinus will spend its first three years in freshwater before it embarks on yearly foraging trips to the coast. At sea it feeds primarily on zooplankton but larger fish tend to be cannibalistic. In freshwater it feeds on planktonic crustaceans, amphipods, molluscs, insects and fish.
Information sources: GINR (2003) (3) and Fishbase (2009) (4). Image from: McPhail, J.D. and C.C. Lindsey )1970) Freshwater fishes of northwestern Canada and Alaska. Fish. Res. Board Can. Bull. 173 381p via Fishbase.
Box 4.8 Capelin
Capelin (Mallotus villosus) are found from Upernavik on the west coast southward to Tasiilaq/Ammassalik along the east coast. This is a pelagic species that is found from the surface to depths of up to 725 m. During the summer, M. villosus usually feed on plankton at the edge of the ice shelf but larger individuals may also feed on krill and other crustaceans. M. villosus is an important link in the food chain between small organisms, larger fish and marine mammals.
(1) Greenland Institute of Natural Resources (2003) Biodiversity of Greenland - a country study. Technical Report No. 55,
Pinngortitaleriffik, Grønlands Naturinstitut, 165 pp. (2) Fishbase is an online database containing information on most known fish species. Available from:
[http://www.fishbase.org/home.htm]. (3) Greenland Institute of Natural Resources (2003) Biodiversity of Greenland - a country study. Technical Report No. 55,
Pinngortitaleriffik, Grønlands Naturinstitut, 165 pp. (4) Fishbase is an online database containing information on most known fish species. Available from:
[http://www.fishbase.org/home.htm].
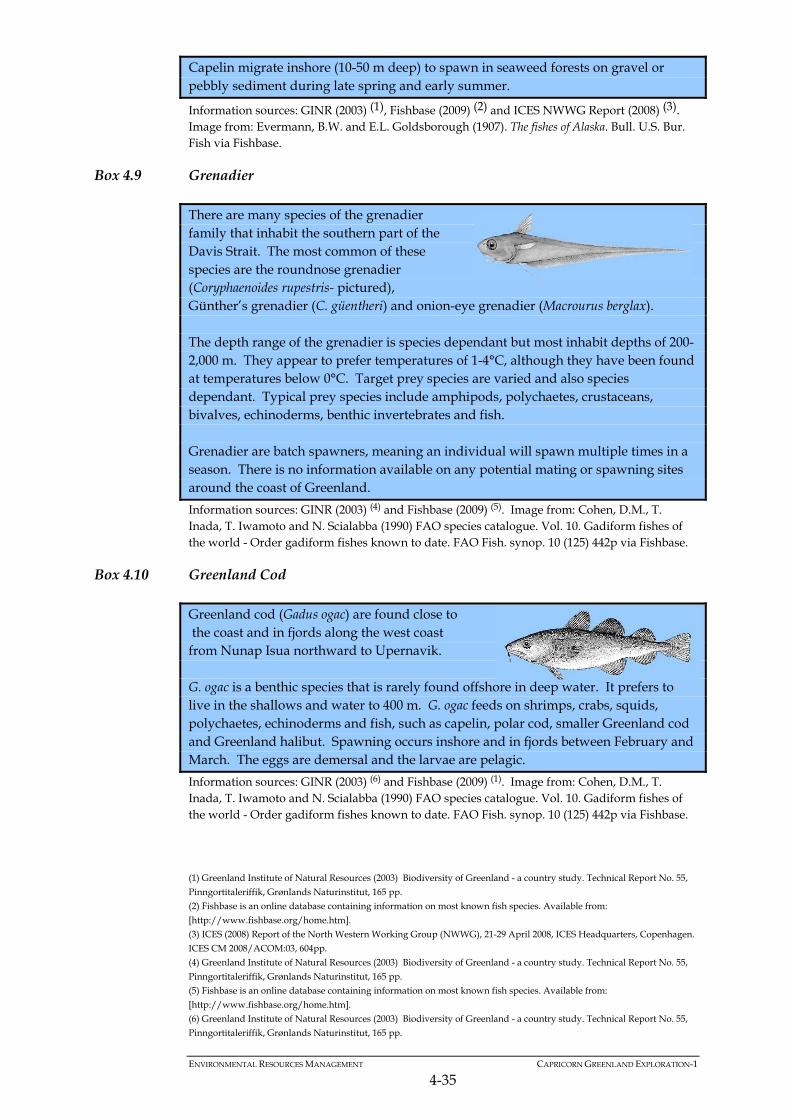
ENVIRONMENTAL RESOURCES MANAGEMENT CAPRICORN GREENLAND EXPLORATION-1
4-35
Capelin migrate inshore (10-50 m deep) to spawn in seaweed forests on gravel or pebbly sediment during late spring and early summer.
Information sources: GINR (2003) (1), Fishbase (2009) (2) and ICES NWWG Report (2008) (3). Image from: Evermann, B.W. and E.L. Goldsborough (1907). The fishes of Alaska. Bull. U.S. Bur. Fish via Fishbase.
Box 4.9 Grenadier
There are many species of the grenadier family that inhabit the southern part of the Davis Strait. The most common of these species are the roundnose grenadier (Coryphaenoides rupestris- pictured), Günther’s grenadier (C. güentheri) and onion-eye grenadier (Macrourus berglax). The depth range of the grenadier is species dependant but most inhabit depths of 200-2,000 m. They appear to prefer temperatures of 1-4°C, although they have been found at temperatures below 0°C. Target prey species are varied and also species dependant. Typical prey species include amphipods, polychaetes, crustaceans, bivalves, echinoderms, benthic invertebrates and fish. Grenadier are batch spawners, meaning an individual will spawn multiple times in a season. There is no information available on any potential mating or spawning sites around the coast of Greenland.
Information sources: GINR (2003) (4) and Fishbase (2009) (5). Image from: Cohen, D.M., T. Inada, T. Iwamoto and N. Scialabba (1990) FAO species catalogue. Vol. 10. Gadiform fishes of the world - Order gadiform fishes known to date. FAO Fish. synop. 10 (125) 442p via Fishbase.
Box 4.10 Greenland Cod
Greenland cod (Gadus ogac) are found close to the coast and in fjords along the west coast from Nunap Isua northward to Upernavik. G. ogac is a benthic species that is rarely found offshore in deep water. It prefers to live in the shallows and water to 400 m. G. ogac feeds on shrimps, crabs, squids, polychaetes, echinoderms and fish, such as capelin, polar cod, smaller Greenland cod and Greenland halibut. Spawning occurs inshore and in fjords between February and March. The eggs are demersal and the larvae are pelagic.
Information sources: GINR (2003) (6) and Fishbase (2009) (1). Image from: Cohen, D.M., T. Inada, T. Iwamoto and N. Scialabba (1990) FAO species catalogue. Vol. 10. Gadiform fishes of the world - Order gadiform fishes known to date. FAO Fish. synop. 10 (125) 442p via Fishbase.
(1) Greenland Institute of Natural Resources (2003) Biodiversity of Greenland - a country study. Technical Report No. 55,
Pinngortitaleriffik, Grønlands Naturinstitut, 165 pp. (2) Fishbase is an online database containing information on most known fish species. Available from:
[http://www.fishbase.org/home.htm]. (3) ICES (2008) Report of the North Western Working Group (NWWG), 21-29 April 2008, ICES Headquarters, Copenhagen.
ICES CM 2008/ACOM:03, 604pp. (4) Greenland Institute of Natural Resources (2003) Biodiversity of Greenland - a country study. Technical Report No. 55,
Pinngortitaleriffik, Grønlands Naturinstitut, 165 pp. (5) Fishbase is an online database containing information on most known fish species. Available from:
[http://www.fishbase.org/home.htm]. (6) Greenland Institute of Natural Resources (2003) Biodiversity of Greenland - a country study. Technical Report No. 55,
Pinngortitaleriffik, Grønlands Naturinstitut, 165 pp.
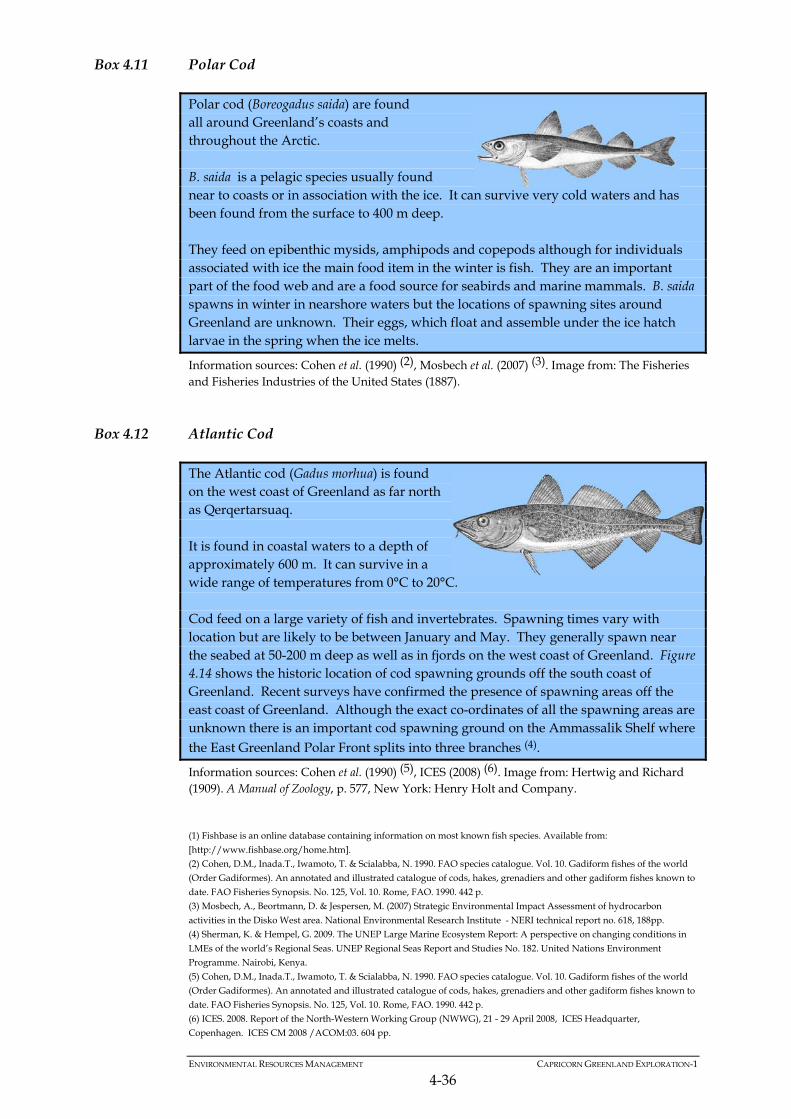
ENVIRONMENTAL RESOURCES MANAGEMENT CAPRICORN GREENLAND EXPLORATION-1
4-36
Box 4.11 Polar Cod
Polar cod (Boreogadus saida) are found all around Greenland’s coasts and throughout the Arctic. B. saida is a pelagic species usually found near to coasts or in association with the ice. It can survive very cold waters and has been found from the surface to 400 m deep. They feed on epibenthic mysids, amphipods and copepods although for individuals associated with ice the main food item in the winter is fish. They are an important part of the food web and are a food source for seabirds and marine mammals. B. saida spawns in winter in nearshore waters but the locations of spawning sites around Greenland are unknown. Their eggs, which float and assemble under the ice hatch larvae in the spring when the ice melts.
Information sources: Cohen et al. (1990) (2), Mosbech et al. (2007) (3). Image from: The Fisheries and Fisheries Industries of the United States (1887).
Box 4.12 Atlantic Cod
The Atlantic cod (Gadus morhua) is found on the west coast of Greenland as far north as Qerqertarsuaq. It is found in coastal waters to a depth of approximately 600 m. It can survive in a wide range of temperatures from 0°C to 20°C. Cod feed on a large variety of fish and invertebrates. Spawning times vary with location but are likely to be between January and May. They generally spawn near the seabed at 50-200 m deep as well as in fjords on the west coast of Greenland. Figure 4.14 shows the historic location of cod spawning grounds off the south coast of Greenland. Recent surveys have confirmed the presence of spawning areas off the east coast of Greenland. Although the exact co-ordinates of all the spawning areas are unknown there is an important cod spawning ground on the Ammassalik Shelf where the East Greenland Polar Front splits into three branches (4).
Information sources: Cohen et al. (1990) (5), ICES (2008) (6). Image from: Hertwig and Richard (1909). A Manual of Zoology, p. 577, New York: Henry Holt and Company.
(1) Fishbase is an online database containing information on most known fish species. Available from:
[http://www.fishbase.org/home.htm]. (2) Cohen, D.M., Inada.T., Iwamoto, T. & Scialabba, N. 1990. FAO species catalogue. Vol. 10. Gadiform fishes of the world
(Order Gadiformes). An annotated and illustrated catalogue of cods, hakes, grenadiers and other gadiform fishes known to
date. FAO Fisheries Synopsis. No. 125, Vol. 10. Rome, FAO. 1990. 442 p. (3) Mosbech, A., Beortmann, D. & Jespersen, M. (2007) Strategic Environmental Impact Assessment of hydrocarbon
activities in the Disko West area. National Environmental Research Institute - NERI technical report no. 618, 188pp. (4) Sherman, K. & Hempel, G. 2009. The UNEP Large Marine Ecosystem Report: A perspective on changing conditions in
LMEs of the world’s Regional Seas. UNEP Regional Seas Report and Studies No. 182. United Nations Environment Programme. Nairobi, Kenya.
(5) Cohen, D.M., Inada.T., Iwamoto, T. & Scialabba, N. 1990. FAO species catalogue. Vol. 10. Gadiform fishes of the world (Order Gadiformes). An annotated and illustrated catalogue of cods, hakes, grenadiers and other gadiform fishes known to
date. FAO Fisheries Synopsis. No. 125, Vol. 10. Rome, FAO. 1990. 442 p. (6) ICES. 2008. Report of the North-Western Working Group (NWWG), 21 - 29 April 2008, ICES Headquarter,
Copenhagen. ICES CM 2008 /ACOM:03. 604 pp.
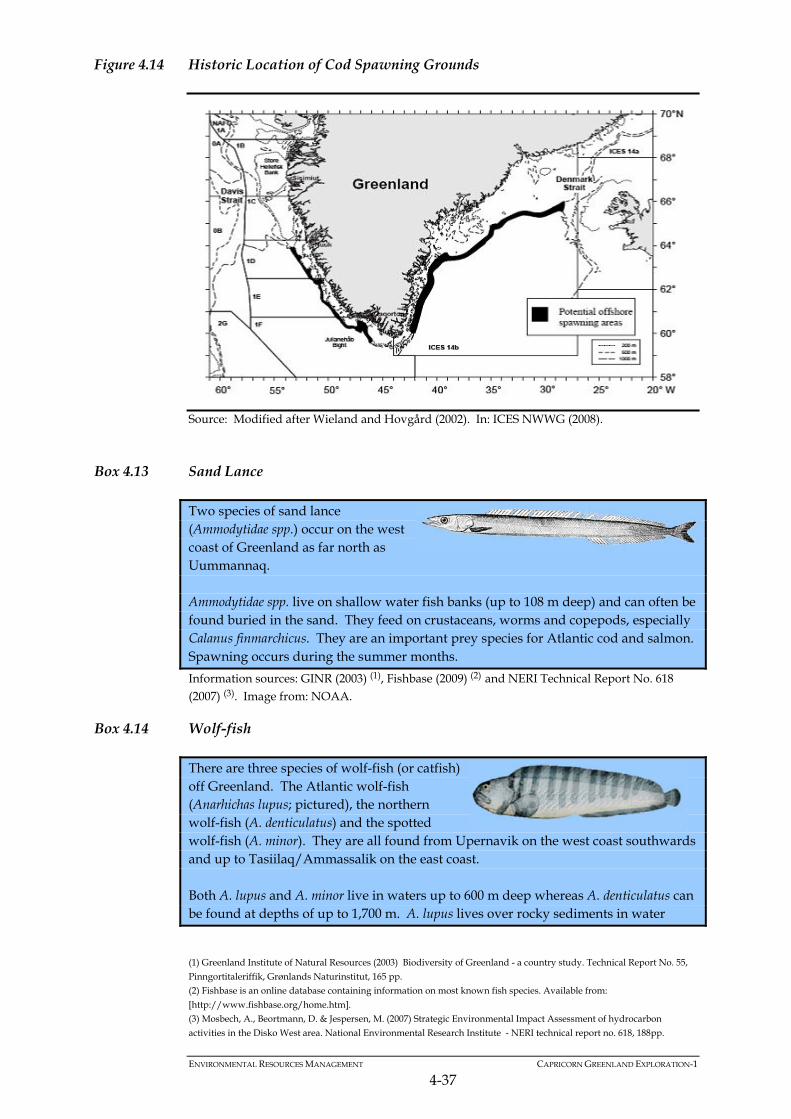
ENVIRONMENTAL RESOURCES MANAGEMENT CAPRICORN GREENLAND EXPLORATION-1
4-37
Figure 4.14 Historic Location of Cod Spawning Grounds
Source: Modified after Wieland and Hovgård (2002). In: ICES NWWG (2008).
Box 4.13 Sand Lance
Two species of sand lance (Ammodytidae spp.) occur on the west coast of Greenland as far north as Uummannaq. Ammodytidae spp. live on shallow water fish banks (up to 108 m deep) and can often be found buried in the sand. They feed on crustaceans, worms and copepods, especially Calanus finmarchicus. They are an important prey species for Atlantic cod and salmon. Spawning occurs during the summer months.
Information sources: GINR (2003) (1), Fishbase (2009) (2) and NERI Technical Report No. 618 (2007) (3). Image from: NOAA.
Box 4.14 Wolf-fish
There are three species of wolf-fish (or catfish) off Greenland. The Atlantic wolf-fish (Anarhichas lupus; pictured), the northern wolf-fish (A. denticulatus) and the spotted wolf-fish (A. minor). They are all found from Upernavik on the west coast southwards and up to Tasiilaq/Ammassalik on the east coast. Both A. lupus and A. minor live in waters up to 600 m deep whereas A. denticulatus can be found at depths of up to 1,700 m. A. lupus lives over rocky sediments in water
(1) Greenland Institute of Natural Resources (2003) Biodiversity of Greenland - a country study. Technical Report No. 55,
Pinngortitaleriffik, Grønlands Naturinstitut, 165 pp. (2) Fishbase is an online database containing information on most known fish species. Available from:
[http://www.fishbase.org/home.htm]. (3) Mosbech, A., Beortmann, D. & Jespersen, M. (2007) Strategic Environmental Impact Assessment of hydrocarbon
activities in the Disko West area. National Environmental Research Institute - NERI technical report no. 618, 188pp.
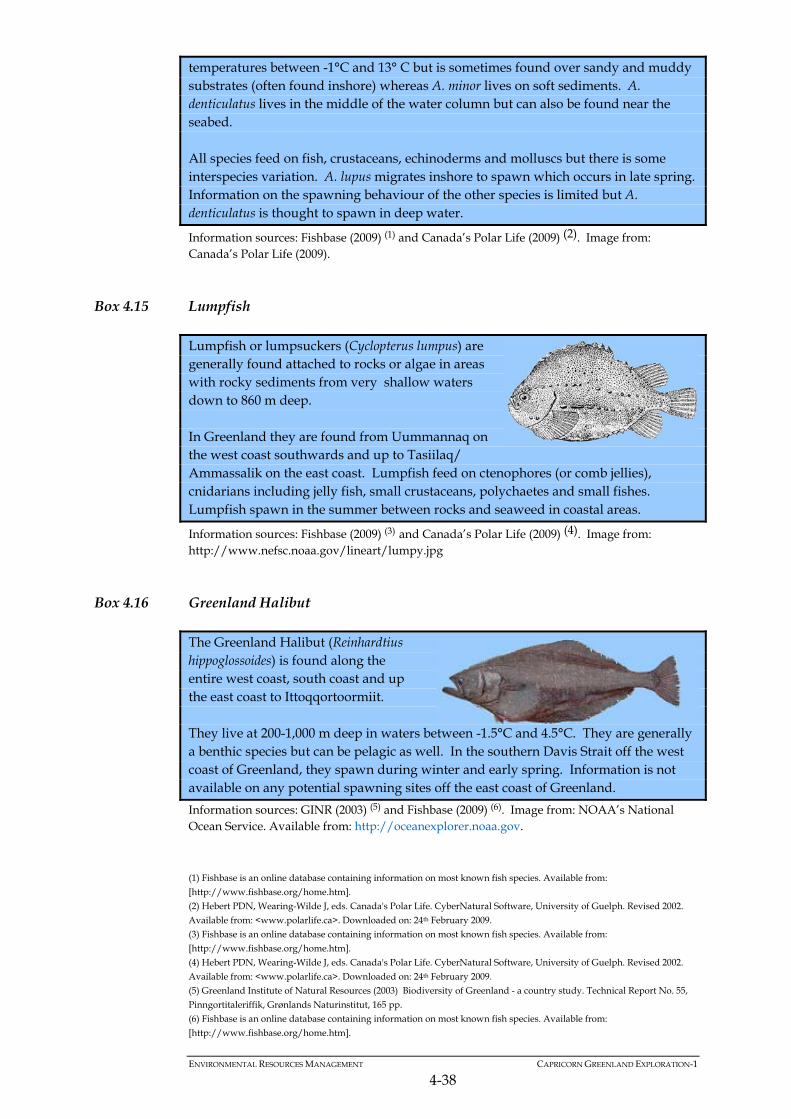
ENVIRONMENTAL RESOURCES MANAGEMENT CAPRICORN GREENLAND EXPLORATION-1
4-38
temperatures between -1°C and 13° C but is sometimes found over sandy and muddy substrates (often found inshore) whereas A. minor lives on soft sediments. A. denticulatus lives in the middle of the water column but can also be found near the seabed. All species feed on fish, crustaceans, echinoderms and molluscs but there is some interspecies variation. A. lupus migrates inshore to spawn which occurs in late spring. Information on the spawning behaviour of the other species is limited but A. denticulatus is thought to spawn in deep water.
Information sources: Fishbase (2009) (1) and Canada’s Polar Life (2009) (2). Image from: Canada’s Polar Life (2009).
Box 4.15 Lumpfish
Lumpfish or lumpsuckers (Cyclopterus lumpus) are generally found attached to rocks or algae in areas with rocky sediments from very shallow waters down to 860 m deep. In Greenland they are found from Uummannaq on the west coast southwards and up to Tasiilaq/ Ammassalik on the east coast. Lumpfish feed on ctenophores (or comb jellies), cnidarians including jelly fish, small crustaceans, polychaetes and small fishes. Lumpfish spawn in the summer between rocks and seaweed in coastal areas.
Information sources: Fishbase (2009) (3) and Canada’s Polar Life (2009) (4). Image from: http://www.nefsc.noaa.gov/lineart/lumpy.jpg
Box 4.16 Greenland Halibut
The Greenland Halibut (Reinhardtius hippoglossoides) is found along the entire west coast, south coast and up the east coast to Ittoqqortoormiit. They live at 200-1,000 m deep in waters between -1.5°C and 4.5°C. They are generally a benthic species but can be pelagic as well. In the southern Davis Strait off the west coast of Greenland, they spawn during winter and early spring. Information is not available on any potential spawning sites off the east coast of Greenland.
Information sources: GINR (2003) (5) and Fishbase (2009) (6). Image from: NOAA’s National Ocean Service. Available from: http://oceanexplorer.noaa.gov.
(1) Fishbase is an online database containing information on most known fish species. Available from:
[http://www.fishbase.org/home.htm]. (2) Hebert PDN, Wearing-Wilde J, eds. Canada's Polar Life. CyberNatural Software, University of Guelph. Revised 2002.
Available from: <www.polarlife.ca>. Downloaded on: 24th February 2009. (3) Fishbase is an online database containing information on most known fish species. Available from:
[http://www.fishbase.org/home.htm]. (4) Hebert PDN, Wearing-Wilde J, eds. Canada's Polar Life. CyberNatural Software, University of Guelph. Revised 2002.
Available from: <www.polarlife.ca>. Downloaded on: 24th February 2009. (5) Greenland Institute of Natural Resources (2003) Biodiversity of Greenland - a country study. Technical Report No. 55,
Pinngortitaleriffik, Grønlands Naturinstitut, 165 pp. (6) Fishbase is an online database containing information on most known fish species. Available from:
[http://www.fishbase.org/home.htm].
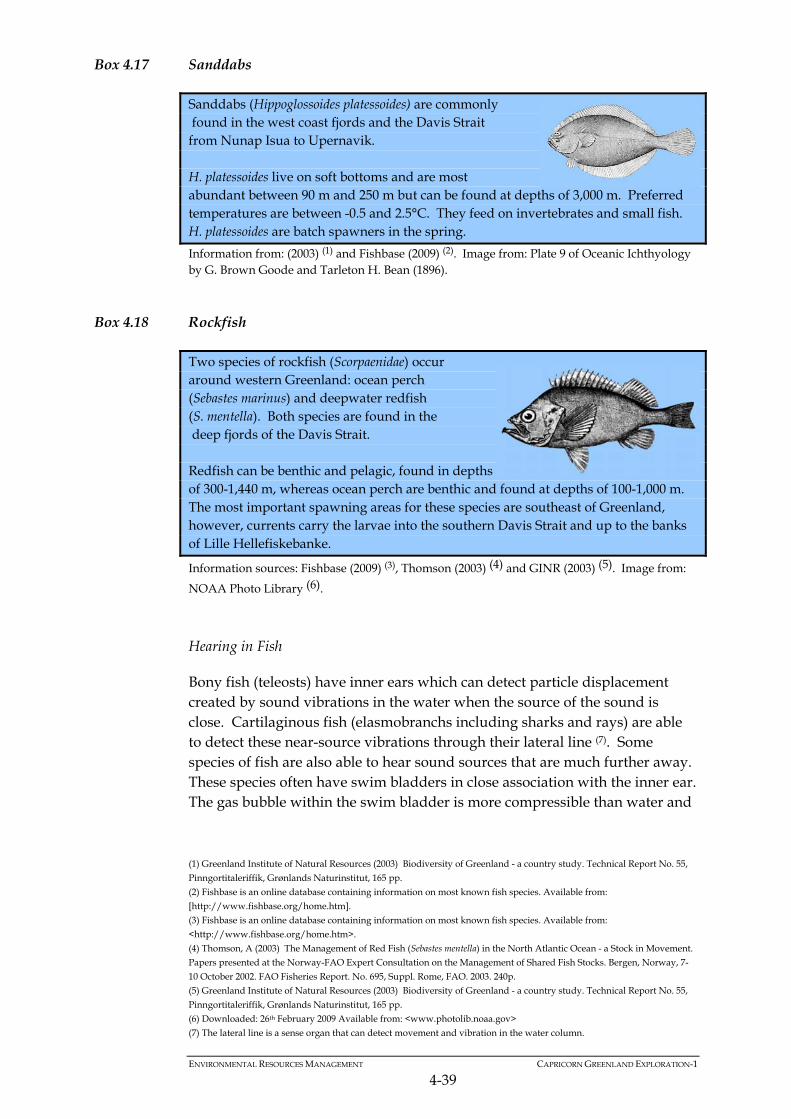
ENVIRONMENTAL RESOURCES MANAGEMENT CAPRICORN GREENLAND EXPLORATION-1
4-39
Box 4.17 Sanddabs
Sanddabs (Hippoglossoides platessoides) are commonly found in the west coast fjords and the Davis Strait from Nunap Isua to Upernavik. H. platessoides live on soft bottoms and are most abundant between 90 m and 250 m but can be found at depths of 3,000 m. Preferred temperatures are between -0.5 and 2.5°C. They feed on invertebrates and small fish. H. platessoides are batch spawners in the spring.
Information from: (2003) (1) and Fishbase (2009) (2). Image from: Plate 9 of Oceanic Ichthyology by G. Brown Goode and Tarleton H. Bean (1896).
Box 4.18 Rockfish
Two species of rockfish (Scorpaenidae) occur around western Greenland: ocean perch (Sebastes marinus) and deepwater redfish (S. mentella). Both species are found in the deep fjords of the Davis Strait. Redfish can be benthic and pelagic, found in depths of 300-1,440 m, whereas ocean perch are benthic and found at depths of 100-1,000 m. The most important spawning areas for these species are southeast of Greenland, however, currents carry the larvae into the southern Davis Strait and up to the banks of Lille Hellefiskebanke.
Information sources: Fishbase (2009) (3), Thomson (2003) (4) and GINR (2003) (5). Image from:
NOAA Photo Library (6).
Hearing in Fish
Bony fish (teleosts) have inner ears which can detect particle displacement created by sound vibrations in the water when the source of the sound is close. Cartilaginous fish (elasmobranchs including sharks and rays) are able to detect these near-source vibrations through their lateral line (7). Some species of fish are also able to hear sound sources that are much further away. These species often have swim bladders in close association with the inner ear. The gas bubble within the swim bladder is more compressible than water and
(1) Greenland Institute of Natural Resources (2003) Biodiversity of Greenland - a country study. Technical Report No. 55,
Pinngortitaleriffik, Grønlands Naturinstitut, 165 pp. (2) Fishbase is an online database containing information on most known fish species. Available from: [http://www.fishbase.org/home.htm]. (3) Fishbase is an online database containing information on most known fish species. Available from: <http://www.fishbase.org/home.htm>. (4) Thomson, A (2003) The Management of Red Fish (Sebastes mentella) in the North Atlantic Ocean - a Stock in Movement. Papers presented at the Norway-FAO Expert Consultation on the Management of Shared Fish Stocks. Bergen, Norway, 7-
10 October 2002. FAO Fisheries Report. No. 695, Suppl. Rome, FAO. 2003. 240p. (5) Greenland Institute of Natural Resources (2003) Biodiversity of Greenland - a country study. Technical Report No. 55,
Pinngortitaleriffik, Grønlands Naturinstitut, 165 pp. (6) Downloaded: 26th February 2009 Available from: <www.photolib.noaa.gov> (7) The lateral line is a sense organ that can detect movement and vibration in the water column.
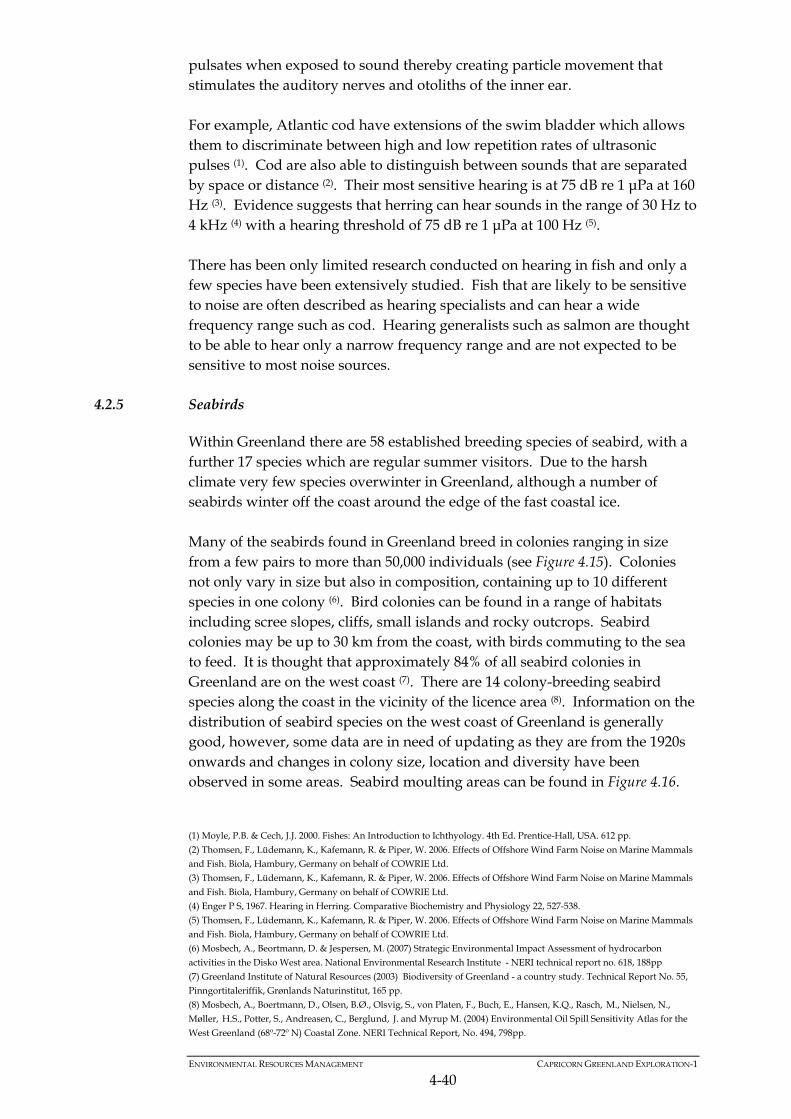
ENVIRONMENTAL RESOURCES MANAGEMENT CAPRICORN GREENLAND EXPLORATION-1
4-40
pulsates when exposed to sound thereby creating particle movement that stimulates the auditory nerves and otoliths of the inner ear. For example, Atlantic cod have extensions of the swim bladder which allows them to discriminate between high and low repetition rates of ultrasonic pulses (1). Cod are also able to distinguish between sounds that are separated by space or distance (2). Their most sensitive hearing is at 75 dB re 1 μPa at 160 Hz (3). Evidence suggests that herring can hear sounds in the range of 30 Hz to 4 kHz (4) with a hearing threshold of 75 dB re 1 μPa at 100 Hz (5). There has been only limited research conducted on hearing in fish and only a few species have been extensively studied. Fish that are likely to be sensitive to noise are often described as hearing specialists and can hear a wide frequency range such as cod. Hearing generalists such as salmon are thought to be able to hear only a narrow frequency range and are not expected to be sensitive to most noise sources.
4.2.5 Seabirds
Within Greenland there are 58 established breeding species of seabird, with a further 17 species which are regular summer visitors. Due to the harsh climate very few species overwinter in Greenland, although a number of seabirds winter off the coast around the edge of the fast coastal ice. Many of the seabirds found in Greenland breed in colonies ranging in size from a few pairs to more than 50,000 individuals (see Figure 4.15). Colonies not only vary in size but also in composition, containing up to 10 different species in one colony (6). Bird colonies can be found in a range of habitats including scree slopes, cliffs, small islands and rocky outcrops. Seabird colonies may be up to 30 km from the coast, with birds commuting to the sea to feed. It is thought that approximately 84% of all seabird colonies in Greenland are on the west coast (7). There are 14 colony-breeding seabird species along the coast in the vicinity of the licence area (8). Information on the distribution of seabird species on the west coast of Greenland is generally good, however, some data are in need of updating as they are from the 1920s onwards and changes in colony size, location and diversity have been observed in some areas. Seabird moulting areas can be found in Figure 4.16.
(1) Moyle, P.B. & Cech, J.J. 2000. Fishes: An Introduction to Ichthyology. 4th Ed. Prentice-Hall, USA. 612 pp. (2) Thomsen, F., Lüdemann, K., Kafemann, R. & Piper, W. 2006. Effects of Offshore Wind Farm Noise on Marine Mammals and Fish. Biola, Hambury, Germany on behalf of COWRIE Ltd. (3) Thomsen, F., Lüdemann, K., Kafemann, R. & Piper, W. 2006. Effects of Offshore Wind Farm Noise on Marine Mammals
and Fish. Biola, Hambury, Germany on behalf of COWRIE Ltd. (4) Enger P S, 1967. Hearing in Herring. Comparative Biochemistry and Physiology 22, 527-538. (5) Thomsen, F., Lüdemann, K., Kafemann, R. & Piper, W. 2006. Effects of Offshore Wind Farm Noise on Marine Mammals and Fish. Biola, Hambury, Germany on behalf of COWRIE Ltd. (6) Mosbech, A., Beortmann, D. & Jespersen, M. (2007) Strategic Environmental Impact Assessment of hydrocarbon activities in the Disko West area. National Environmental Research Institute - NERI technical report no. 618, 188pp (7) Greenland Institute of Natural Resources (2003) Biodiversity of Greenland - a country study. Technical Report No. 55, Pinngortitaleriffik, Grønlands Naturinstitut, 165 pp. (8) Mosbech, A., Boertmann, D., Olsen, B.Ø., Olsvig, S., von Platen, F., Buch, E., Hansen, K.Q., Rasch, M., Nielsen, N., Møller, H.S., Potter, S., Andreasen, C., Berglund, J. and Myrup M. (2004) Environmental Oil Spill Sensitivity Atlas for the
West Greenland (68º-72º N) Coastal Zone. NERI Technical Report, No. 494, 798pp.
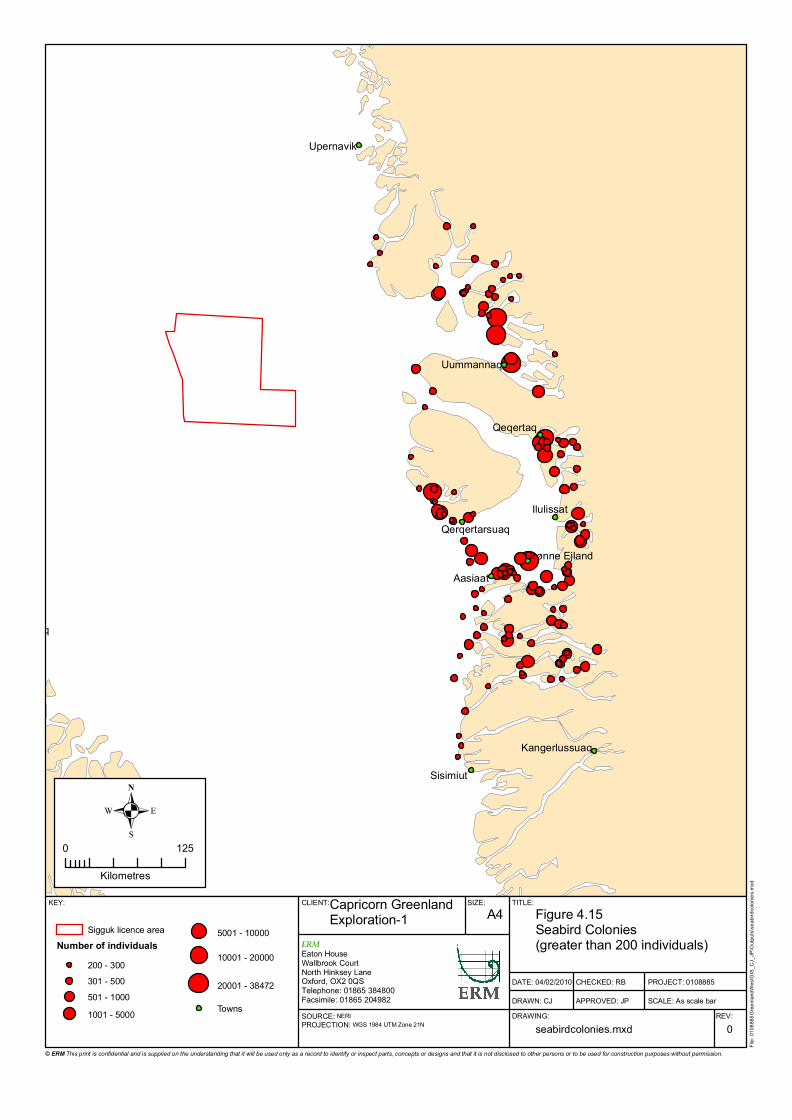
Aasiaat
Qeqertaq
Sisimiut
Nunatsiaq
Upernavik
Uummannaq
Ilulissat
Kangerlussuaq
Grønne Ejland
Qerqertarsuaq
Maniitsoq (Sukkertoppen)CLIENT: SIZE: TITLE:
DATE: 04/02/2010
DRAWN: CJ
CHECKED: RB
APPROVED: JP
PROJECT: 0108885
SCALE: As scale barDRAWING: REV:
KEY: Capricorn Greenland Exploration-1 A4 Figure 4.15
Seabird Colonies (greater than 200 individuals)
seabirdcolonies.mxd 0
Sigguk licence areaNumber of individuals
200 - 300301 - 500501 - 10001001 - 5000
5001 - 10000
10001 - 20000
20001 - 38472
Towns
.0 125
Kilometres
SOURCE: NERIPROJECTION: WGS 1984 UTM Zone 21N
File:
0108
885G
reenla
ndW
estG
IS_C
J_JP
\Outp
uts\se
abird
colon
ies.m
xd
ERMEaton HouseWallbrook CourtNorth Hinksey LaneOxford, OX2 0QSTelephone: 01865 384800Facsimile: 01865 204982
© ERM This print is confidential and is supplied on the understanding that it will be used only as a record to identify or inspect parts, concepts or designs and that it is not disclosed to other persons or to be used for construction purposes without permission.
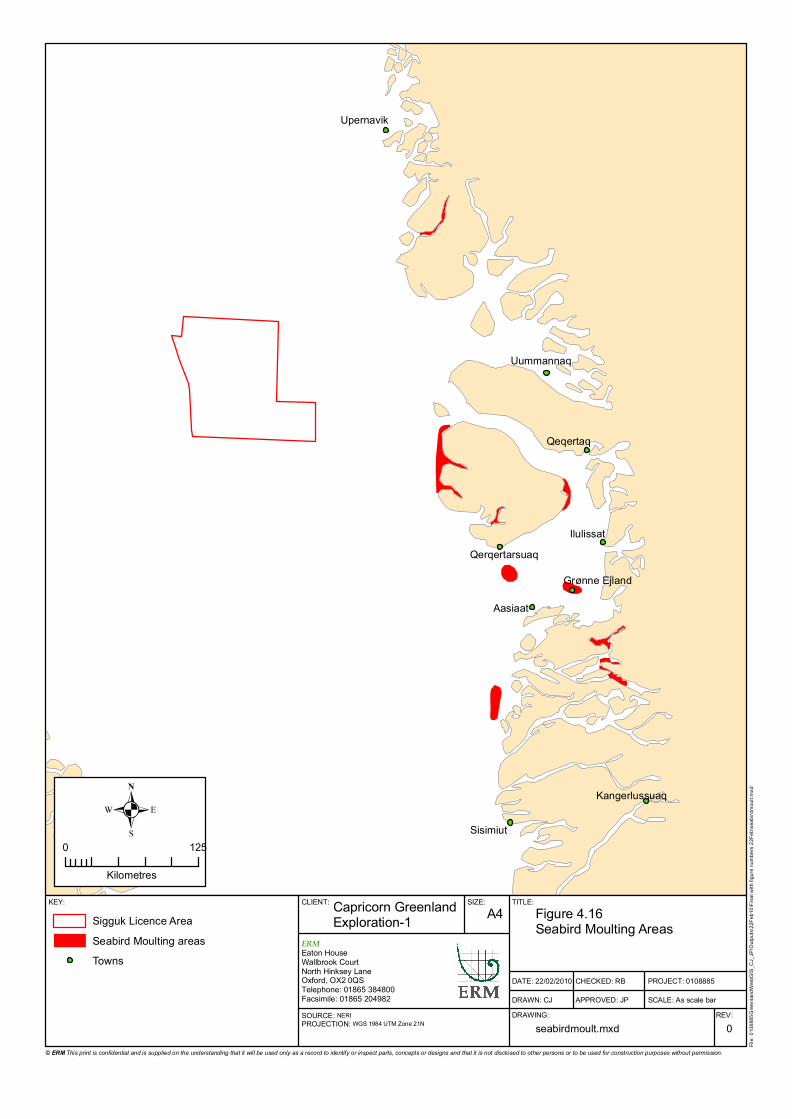
Aasiaat
Qeqertaq
Sisimiut
Nunatsiaq
Upernavik
Uummannaq
Ilulissat
Kangerlussuaq
Grønne Ejland
Qerqertarsuaq
CLIENT: SIZE: TITLE:
DATE: 22/02/2010
DRAWN: CJ
CHECKED: RB
APPROVED: JP
PROJECT: 0108885
SCALE: As scale barDRAWING: REV:
KEY: Capricorn Greenland Exploration-1 A4 Figure 4.16
Seabird Moulting Areas
seabirdmoult.mxd 0
Sigguk Licence AreaSeabird Moulting areasTowns
.0 125
Kilometres
SOURCE: NERIPROJECTION: WGS 1984 UTM Zone 21N
File:
0108
885G
reenla
ndW
estG
IS_C
J_JP
\Outp
uts\22
Feb1
0\Fina
l with
figure
numb
ers 22
Feb\s
eabir
dmou
lt.mxd
ERMEaton HouseWallbrook CourtNorth Hinksey LaneOxford, OX2 0QSTelephone: 01865 384800Facsimile: 01865 204982
© ERM This print is confidential and is supplied on the understanding that it will be used only as a record to identify or inspect parts, concepts or designs and that it is not disclosed to other persons or to be used for construction purposes without permission.
ENVIRONMENTAL RESOURCES MANAGEMENT CAPRICORN GREENLAND EXPLORATION-1
4-43
Northern Fulmar (Fulmarus glacialis)
The Greenland breeding population of northern fulmar was estimated at between 120,000 and 200,000 in 2004 (1). The northern fulmar is common along the western coast of Greenland. The largest colony is found on a 10 km south facing cliff on Qeqertaq Island and has an estimated 66,000 to 84,000 individuals. Also, in the Uummannaq region there are 4 large breeding colonies, each with at least 10,000 individuals. Fulmar colonies are formed on steep cliffs with pairs laying a single egg on a cliff ledge. Birds are present from April to early October. Fulmars will forage over a wide area and feed on a range of food items including fish and crustaceans, feeding from the sea surface. Outside of the breeding season northern fulmar are largely pelagic, foraging widely at low densities (2). Common Eider (Somateria mollissima)
There were estimated to be 15,000-25,000 breeding pairs of common eider in Greenland in 2004 (3). Eiders are a widespread species which are present on most of the west Greenland coastline. Particularly large numbers of breeding eider are found at the Afersiorfik fjord, Tasiussarsuaq with more than 1,000 pairs having been recorded at that site (4). The common eider breeding population is thought to moult and winter in the open water area off West Greenland. They arrive at coastal areas of open water such as polynyas from their wintering areas in April or May from where they disperse to breeding sites all along the coast (5). During the summer flightless moulting flocks of males and non-breeding females congregate in fjords and sounds. Eider are diving ducks, which feed on benthic molluscs, crustaceans and echinoderms in coastal waters. King Eider (Somateria spectabilis)
The Greenland breeding population of king eider was estimated to be 2,000-5,000 pairs in 2004 (6). The species usually breeds singly or in loose colonies, on dry tundra near freshwater. Post breeding, male birds congregate in large flocks in sheltered inshore waters to moult before all birds move to wintering areas further offshore. Up to 300,000 king eider winter in western Greenland around Store Hellefiskebanke and the adjacent coast, making this area important for king eider (7).
(1) Birds in Europe: population estimates, trends and conservation status (BirdLife International 2004) (2) Boertmann D, Mosbech A and Johansen K (2008) Preliminary Strategic Environmental Impact Assessment of
hydrocarbon activities in the KANUMAS East Assessment area. (3) Birds in Europe: population estimates, trends and conservation status (BirdLife International 2004)
(4) Greenland Institute of Natural Resources (2003) Biodiversity of Greenland - a country study. Technical Report No. 55, Pinngortitaleriffik, Grønlands Naturinstitut, 165 pp. (5) Greenland Institute of Natural Resources (2003) Biodiversity of Greenland - a country study. Technical Report No. 55, Pinngortitaleriffik, Grønlands Naturinstitut, 165 pp. (6) Birds in Europe: population estimates, trends and conservation status (BirdLife International 2004) (7) Mosbech, A., Boertmann, D. and Jespersen, M. (2007) Strategic Environmental Impact Assessment of hydrocarbon
activities in the Disko West area. NERI Technical Report No. 618, 192pp.
ENVIRONMENTAL RESOURCES MANAGEMENT CAPRICORN GREENLAND EXPLORATION-1
4-44
Black-legged kittiwake (Rissa tridactyla)
The Greenland breeding population of black-legged kittiwake was estimated to be 150,000-300,000 pairs in 2004 (1). High densities occur near the large breeding colonies in northern Baffin Bay and Upernavik (2). Kittiwake nest colonially on cliffs, with colony sizes ranging from a few birds to tens of thousands. Within the vicinity of the licence area there are a number of colonies. The highest concentrations of breeding kittiwakes are found in the Torsukattak area. Outside the breeding season, kittiwakes are largely pelagic surface feeders, feeding on small fish and crustaceans (3). After breeding they tend to concentrate in coastal waters off southwest Greenland then during autumn or winter most birds leave Greenland waters. Glaucous gull (Larus hyperboreus)
Greenland represents the European stronghold of the glaucous gull, with an estimated 30,000-100,000 pairs in 2004 (4). The glaucous gull has been observed in many small colonies throughout the Upernavik area of western Greenland. They often nest in association with other seabird or geese colonies (5). They are present at the breeding colonies from April-May until the autumn. Away from the breeding colonies, non-breeding birds are widely dispersed, more commonly in coastal areas than far offshore. They are omnivorous taking fish and crustaceans, young chicks and eggs of other birds and scavenging from boats and settlements (6). Arctic tern (Sterna paradisaea)
The breeding population of arctic tern in Greenland was estimated at 30,000-100,000 pairs in 2004 (7). They are widespread breeders in coastal areas, with numerous colonies recorded on the west coast. The most numerous colony of Arctic terns is found at Grønne Ejland in the Southern Disko Bay area with an estimated 25,000 breeding birds (8). Favoured coastal breeding areas are around polynyas and other areas where ice breaks up early allowing birds to feed, such as mouths of fjords and sounds. Birds return to breeding areas in early and mid June and depart once young are fledged in late August and early September. Arctic tern feed on small fish and crustaceans near the
(1) Birds in Europe: population estimates, trends and conservation status (BirdLife International 2004) (2) NERI (2010) Seabird densities offshore West Greenland. A data report with offshore maps presenting seasonal densities
of important seabird species based on a preliminary analysis of available ship-based surveys and airplane surveys,
including the September 2009 surveys. (3) Greenland Institute of Natural Resources (2003) Biodiversity of Greenland - a country study. Technical Report No. 55,
Pinngortitaleriffik, Grønlands Naturinstitut, 165 pp. (4) Birds in Europe: population estimates, trends and conservation status (BirdLife International 2004)
(5) BirdLife International (2008) Species factsheet: Larus hyperboreus. Downloaded from http://www.birdlife.org on 27/2/2009 (6) Greenland Institute of Natural Resources (2003) Biodiversity of Greenland - a country study. Technical Report No. 55, Pinngortitaleriffik, Grønlands Naturinstitut, 165 pp. (7) Birds in Europe: population estimates, trends and conservation status (BirdLife International 2004). (8) Greenland Institute of Natural Resources (2003) Biodiversity of Greenland - a country study. Technical Report No. 55,
Pinngortitaleriffik, Grønlands Naturinstitut, 165 pp.
ENVIRONMENTAL RESOURCES MANAGEMENT CAPRICORN GREENLAND EXPLORATION-1
4-45
surface by plunge diving (1). During the breeding season they generally forage near to the shore, within 3 km of the colony but exceptionally up to 50 km (2). Brünnich’s guillemot (Thick-billed murre) (Uria lomvia)
The Greenland breeding population of Brünnich’s guillemot was estimated at 350,000 – 400,000 pairs in 2004 (3). High densities of birds have been observed near the large breeding colonies in northern Baffin Bay and Upernavik. The large number of birds observed in the Davis Strait may be a concentration of foraging birds from the large colonies on eastern Baffin Island combined with non-breeding birds (4). Pairs nest on steep coastal cliffs near to areas that become ice free early in the year. Birds arrive at breeding sites in early summer and hatch a single chick. Chicks jump from nesting ledges to the sea after three weeks when still unfledged. They then undertake a swimming migration to southwest Greenland, accompanied by the flightless males undergoing their post breeding moult. Black guillemot (Cepphus grylle)
The Greenland breeding population of black guillemot was estimated at 25,000-100,000 in 2004 (5). The species is a relatively widespread breeder, nesting near to the shore in areas inaccessible to predators either on cliffs or close to the sea in rock crevices. Colonies range in size from single pairs to a few hundred pairs. Black guillemot colonies south of Disko Bay are generally small in size but colony size north of Disko Bay frequently reaches 400 pairs. Black guillemots tend to forage much closer to their breeding colonies than other auks, generally in waters <50 m deep, on small fish and crustaceans. Little auk (Alle alle)
The Greenland breeding population of little auk was estimated at 10,000,000-40,000,000 pairs in 2004 (6). The majority of Greenland’s little auk population breed along the east coast, however, it is found along the west coast from Disko Bay north to Upernavik. Large flocks can be found west and southwest of Disko island (7). The species nests in large colonies on scree or talus rocks below steep cliffs. Little auk can forage at high densities up to approximately 100 km from colonies, feeding largely on pelagic crustaceans. Breeding adults arrive at breeding colonies in June and fledged young and adults leave the colonies in August-September. In autumn they migrate through Baffin Bay
(1) Boertmann D, Mosbech A and Johansen K (2008) Preliminary Strategic Environmental Impact Assessment of
hydrocarbon activities in the KANUMAS East Assessment area. (2) BirdLife International (2008) Species factsheet: Sterna paradisaea. Downloaded from http://www.birdlife.org on 2/3/2009 (3) Birds in Europe: population estimates, trends and conservation status (BirdLife International 2004). (4) NERI (2010) Seabird densities offshore West Greenland. A data report with offshore maps presenting seasonal densities
of important seabird species based on a preliminary analysis of available ship-based surveys and airplane surveys, including the September 2009 surveys.
(5) Birds in Europe: population estimates, trends and conservation status (BirdLife International 2004). (6) Birds in Europe: population estimates, trends and conservation status (BirdLife International 2004). (7) NERI (2010) Seabird densities offshore West Greenland. A data report with offshore maps presenting seasonal densities of important seabird species based on a preliminary analysis of available ship-based surveys and airplane surveys,
including the September 2009 surveys.
ENVIRONMENTAL RESOURCES MANAGEMENT CAPRICORN GREENLAND EXPLORATION-1
4-46
and the northern Davis Strait to winter in the Davis Strait or further south. Adults moult their flight feathers after breeding, becoming flightless and forming large rafts in coastal areas (1). Great cormorant (Phalacrocorax carbo)
The Greenland breeding population of great cormorants was estimated to be between 2,000 and 3,000 in 1996 and is likely to be isolated from other great cormorant populations (2). They are found along the coast from Maniitsoq to Upernavik in colonies rarely exceeding 50 pairs. The western Greenland population represents 4-6% of the total North Atlantic population. Breeding peaks between April and June and takes place in a variety of nesting sites, such as depressions or platforms of sticks on cliffs or in amongst boulders (3). Its diet consists predominantly of bottom dwelling fish but it will also eat shoaling fish from deeper water and crustaceans. Atlantic puffin (Fractercula arctica)
The western Greenland breeding population of Atlantic puffins was estimated at between 4,000 and 8,000 pairs in 1996 (4). It breeds in scattered colonies from the south to Avenersuaq and the largest colony of approximately 1,000 pairs is found on Nunatsiaq/Rotten in Disko Bay. The Atlantic puffin nests in concealed sites such as crevices and burrows, which they return to each year with the same mate to lay a single egg (5). Small fish are the main food source, which can be stored in a neat row in their specially adapted bills making fishing trips very productive. Fish are caught by diving into and swimming through the water for 20-40 seconds at a time. Iceland gull (Larus glaucoides)
Greenland’s breeding population of Iceland gull was estimated at between 20,000 and 100,000 pairs in 1996 (6). The Iceland gull breeds all along the central western Greenland coast with the largest colonies of up to 1,500 pairs found just south of Baffin Island. The Iceland gull lives on steep cliffs along rocky coasts and fjords where it constructs its nests out of dry grass, seaweed and moss (7). After breeding, Greenland’s population of Iceland gull disperse locally along the coast to feed. It forages along the intertidal zone feeding on small fish and invertebrates as well as bird eggs and chicks.
(1) Boertmann D, Mosbech A and Johansen K (2008) Preliminary Strategic Environmental Impact Assessment of
hydrocarbon activities in the KANUMAS East Assessment area. (2) Boertman, D., Mosbech, A., Falk, K., Kampp, K. et al (1996) Seabird colonies in western Greenland. National Environmental Research Institute - NERI Technical Report No. 170, 149pp. (3) BirdLife International (2009) Species factsheet: Phalacrocorax carbo. Downloaded from http://www.birdlife.org on 4/1/2010. (4) Boertman, D., Mosbech, A., Falk, K., Kampp, K. et al (1996) Seabird colonies in western Greenland. National Environmental Research Institute - NERI Technical Report No. 170, 149pp. (5) Wildlife Britain Atlantic puffin factsheet. Downloaded from http://www.wildlifebritain.com/puffins.php on 4/1/2010. (6) Boertman, D., Mosbech, A., Falk, K., Kampp, K. et al (1996) Seabird colonies in western Greenland. National
Environmental Research Institute - NERI Technical Report No. 170, 149pp. (7) BirdLife International (2009) Species factsheet: Larus glaucoides. Downloaded from http://www.birdlife.org on
4/1/2010.
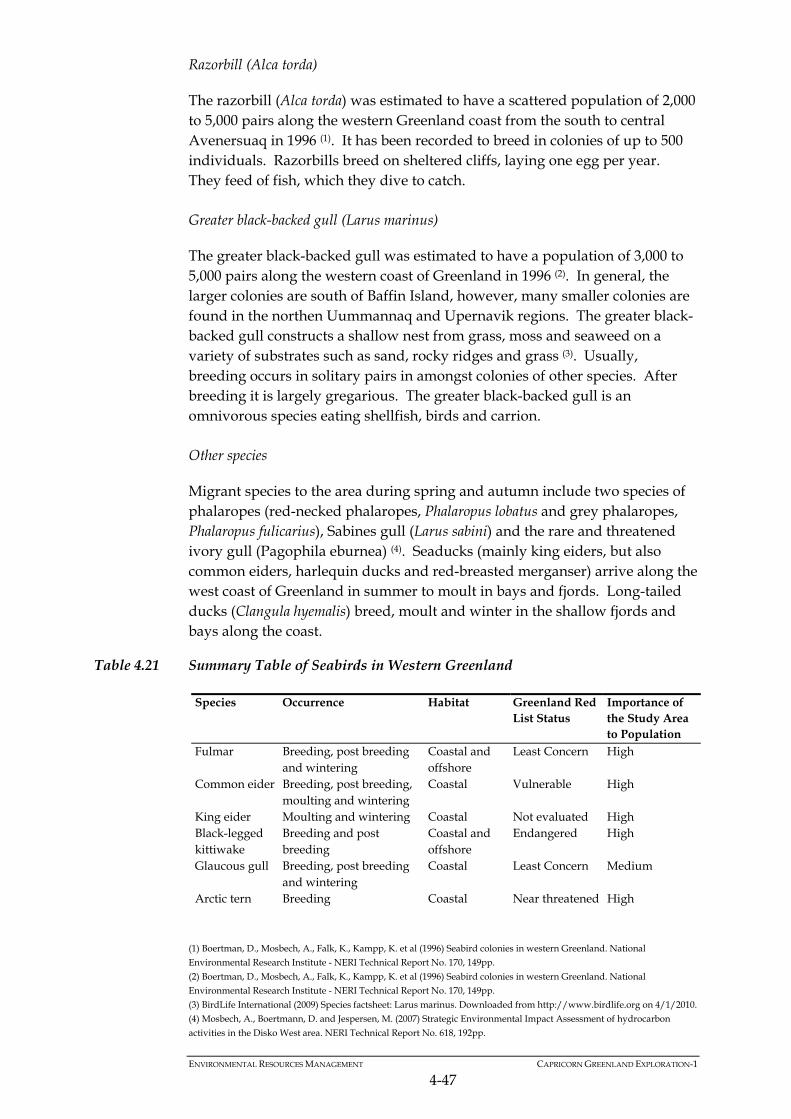
ENVIRONMENTAL RESOURCES MANAGEMENT CAPRICORN GREENLAND EXPLORATION-1
4-47
Razorbill (Alca torda)
The razorbill (Alca torda) was estimated to have a scattered population of 2,000 to 5,000 pairs along the western Greenland coast from the south to central Avenersuaq in 1996 (1). It has been recorded to breed in colonies of up to 500 individuals. Razorbills breed on sheltered cliffs, laying one egg per year. They feed of fish, which they dive to catch. Greater black-backed gull (Larus marinus)
The greater black-backed gull was estimated to have a population of 3,000 to 5,000 pairs along the western coast of Greenland in 1996 (2). In general, the larger colonies are south of Baffin Island, however, many smaller colonies are found in the northen Uummannaq and Upernavik regions. The greater black-backed gull constructs a shallow nest from grass, moss and seaweed on a variety of substrates such as sand, rocky ridges and grass (3). Usually, breeding occurs in solitary pairs in amongst colonies of other species. After breeding it is largely gregarious. The greater black-backed gull is an omnivorous species eating shellfish, birds and carrion. Other species
Migrant species to the area during spring and autumn include two species of phalaropes (red-necked phalaropes, Phalaropus lobatus and grey phalaropes, Phalaropus fulicarius), Sabines gull (Larus sabini) and the rare and threatened ivory gull (Pagophila eburnea) (4). Seaducks (mainly king eiders, but also common eiders, harlequin ducks and red-breasted merganser) arrive along the west coast of Greenland in summer to moult in bays and fjords. Long-tailed ducks (Clangula hyemalis) breed, moult and winter in the shallow fjords and bays along the coast.
Table 4.21 Summary Table of Seabirds in Western Greenland
Species Occurrence Habitat Greenland Red List Status
Importance of the Study Area to Population
Fulmar Breeding, post breeding and wintering
Coastal and offshore
Least Concern High
Common eider Breeding, post breeding, moulting and wintering
Coastal Vulnerable High
King eider Moulting and wintering Coastal Not evaluated High Black-legged kittiwake
Breeding and post breeding
Coastal and offshore
Endangered High
Glaucous gull Breeding, post breeding and wintering
Coastal Least Concern Medium
Arctic tern Breeding Coastal Near threatened High
(1) Boertman, D., Mosbech, A., Falk, K., Kampp, K. et al (1996) Seabird colonies in western Greenland. National Environmental Research Institute - NERI Technical Report No. 170, 149pp. (2) Boertman, D., Mosbech, A., Falk, K., Kampp, K. et al (1996) Seabird colonies in western Greenland. National Environmental Research Institute - NERI Technical Report No. 170, 149pp. (3) BirdLife International (2009) Species factsheet: Larus marinus. Downloaded from http://www.birdlife.org on 4/1/2010. (4) Mosbech, A., Boertmann, D. and Jespersen, M. (2007) Strategic Environmental Impact Assessment of hydrocarbon
activities in the Disko West area. NERI Technical Report No. 618, 192pp.
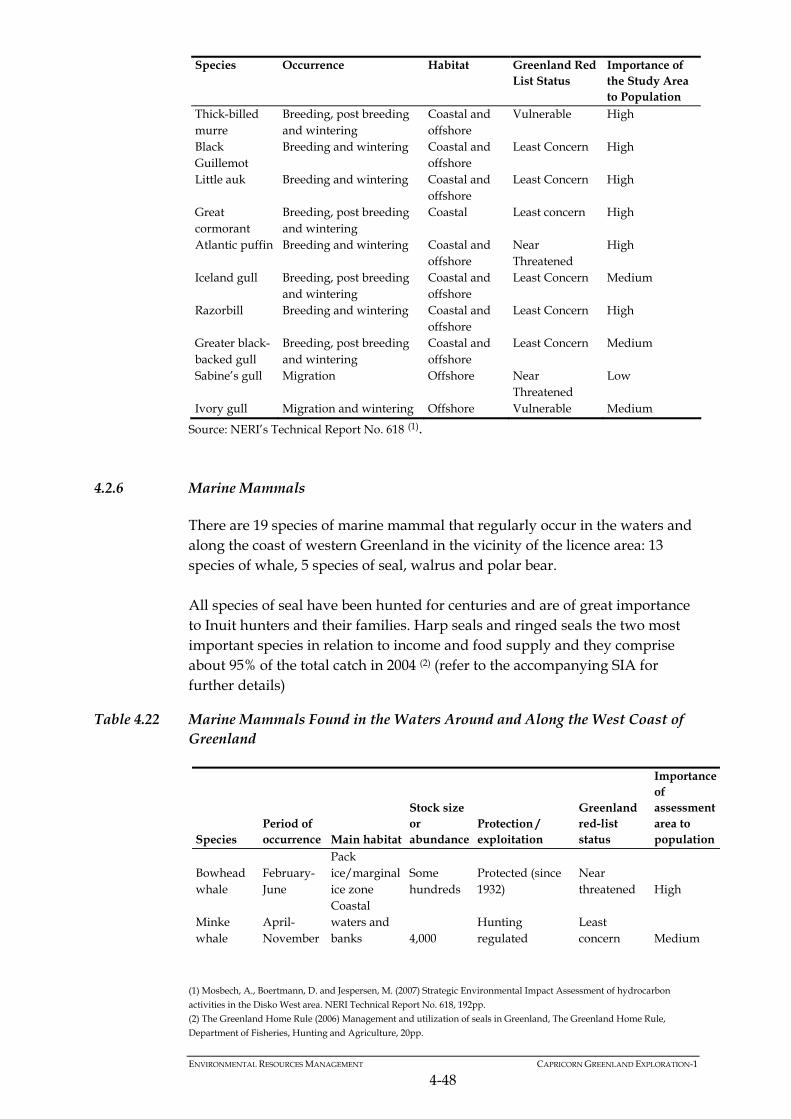
ENVIRONMENTAL RESOURCES MANAGEMENT CAPRICORN GREENLAND EXPLORATION-1
4-48
Species Occurrence Habitat Greenland Red List Status
Importance of the Study Area to Population
Thick-billed murre
Breeding, post breeding and wintering
Coastal and offshore
Vulnerable High
Black Guillemot
Breeding and wintering Coastal and offshore
Least Concern High
Little auk Breeding and wintering Coastal and offshore
Least Concern High
Great cormorant
Breeding, post breeding and wintering
Coastal Least concern High
Atlantic puffin Breeding and wintering Coastal and offshore
Near Threatened
High
Iceland gull Breeding, post breeding and wintering
Coastal and offshore
Least Concern Medium
Razorbill Breeding and wintering Coastal and offshore
Least Concern High
Greater black-backed gull
Breeding, post breeding and wintering
Coastal and offshore
Least Concern Medium
Sabine’s gull Migration Offshore Near Threatened
Low
Ivory gull Migration and wintering Offshore Vulnerable Medium
Source: NERI’s Technical Report No. 618 (1).
4.2.6 Marine Mammals
There are 19 species of marine mammal that regularly occur in the waters and along the coast of western Greenland in the vicinity of the licence area: 13 species of whale, 5 species of seal, walrus and polar bear. All species of seal have been hunted for centuries and are of great importance to Inuit hunters and their families. Harp seals and ringed seals the two most important species in relation to income and food supply and they comprise about 95% of the total catch in 2004 (2) (refer to the accompanying SIA for further details)
Table 4.22 Marine Mammals Found in the Waters Around and Along the West Coast of Greenland
Species Period of occurrence Main habitat
Stock size or abundance
Protection / exploitation
Greenland red-list status
Importance of assessment area to population
Bowhead whale
February-June
Pack ice/marginal ice zone
Some hundreds
Protected (since 1932)
Near threatened High
Minke whale
April-November
Coastal waters and banks 4,000
Hunting regulated
Least concern Medium
(1) Mosbech, A., Boertmann, D. and Jespersen, M. (2007) Strategic Environmental Impact Assessment of hydrocarbon
activities in the Disko West area. NERI Technical Report No. 618, 192pp. (2) The Greenland Home Rule (2006) Management and utilization of seals in Greenland, The Greenland Home Rule,
Department of Fisheries, Hunting and Agriculture, 20pp.
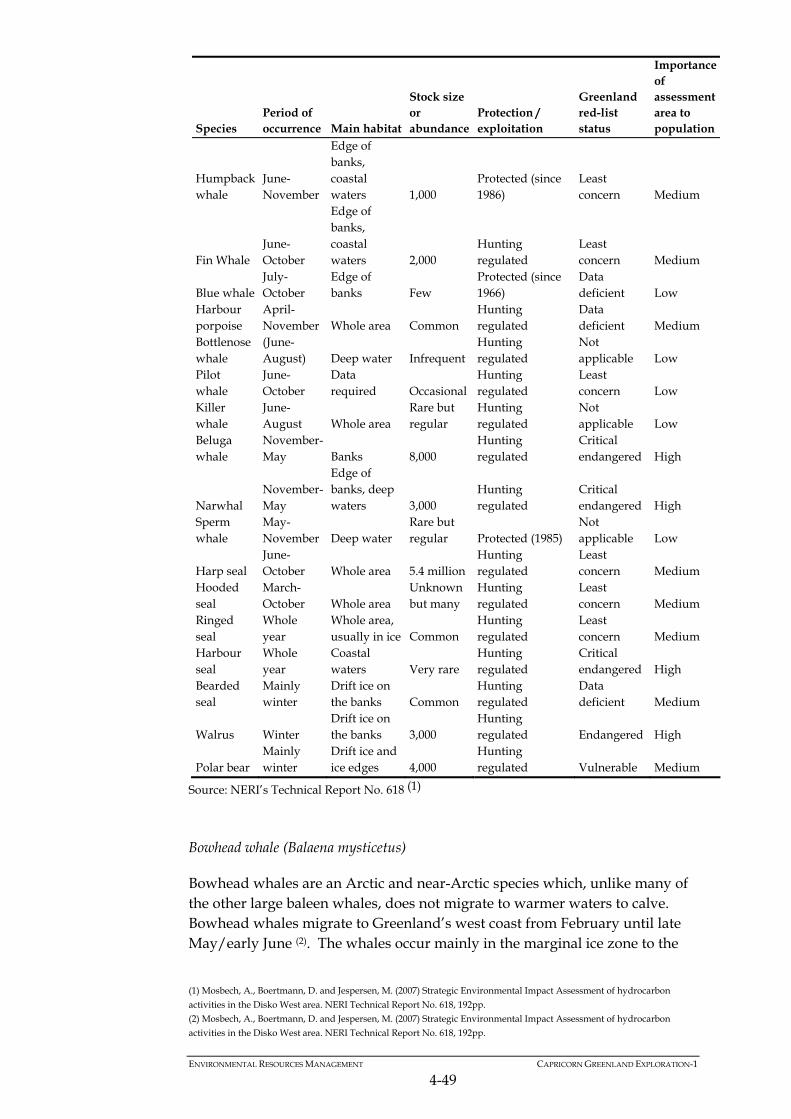
ENVIRONMENTAL RESOURCES MANAGEMENT CAPRICORN GREENLAND EXPLORATION-1
4-49
Species Period of occurrence Main habitat
Stock size or abundance
Protection / exploitation
Greenland red-list status
Importance of assessment area to population
Humpback whale
June-November
Edge of banks, coastal waters 1,000
Protected (since 1986)
Least concern Medium
Fin Whale June-October
Edge of banks, coastal waters 2,000
Hunting regulated
Least concern Medium
Blue whale July-October
Edge of banks Few
Protected (since 1966)
Data deficient Low
Harbour porpoise
April-November Whole area Common
Hunting regulated
Data deficient Medium
Bottlenose whale
(June-August) Deep water Infrequent
Hunting regulated
Not applicable Low
Pilot whale
June-October
Data required Occasional
Hunting regulated
Least concern Low
Killer whale
June-August Whole area
Rare but regular
Hunting regulated
Not applicable Low
Beluga whale
November-May Banks 8,000
Hunting regulated
Critical endangered High
Narwhal November-May
Edge of banks, deep waters 3,000
Hunting regulated
Critical endangered High
Sperm whale
May-November Deep water
Rare but regular Protected (1985)
Not applicable Low
Harp seal June-October Whole area 5.4 million
Hunting regulated
Least concern Medium
Hooded seal
March-October Whole area
Unknown but many
Hunting regulated
Least concern Medium
Ringed seal
Whole year
Whole area, usually in ice Common
Hunting regulated
Least concern Medium
Harbour seal
Whole year
Coastal waters Very rare
Hunting regulated
Critical endangered High
Bearded seal
Mainly winter
Drift ice on the banks Common
Hunting regulated
Data deficient Medium
Walrus Winter Drift ice on the banks 3,000
Hunting regulated Endangered High
Polar bear Mainly winter
Drift ice and ice edges 4,000
Hunting regulated Vulnerable Medium
Source: NERI’s Technical Report No. 618 (1)
Bowhead whale (Balaena mysticetus)
Bowhead whales are an Arctic and near-Arctic species which, unlike many of the other large baleen whales, does not migrate to warmer waters to calve. Bowhead whales migrate to Greenland’s west coast from February until late May/early June (2). The whales occur mainly in the marginal ice zone to the
(1) Mosbech, A., Boertmann, D. and Jespersen, M. (2007) Strategic Environmental Impact Assessment of hydrocarbon
activities in the Disko West area. NERI Technical Report No. 618, 192pp. (2) Mosbech, A., Boertmann, D. and Jespersen, M. (2007) Strategic Environmental Impact Assessment of hydrocarbon
activities in the Disko West area. NERI Technical Report No. 618, 192pp.
ENVIRONMENTAL RESOURCES MANAGEMENT CAPRICORN GREENLAND EXPLORATION-1
4-50
west and south of Disko Island, where they move north-west across Baffin Bay to the waters of the high Arctic Canadian archipelago. Due to previous heavy exploitation and slow recovery the stock in Greenland’s waters is believed to be about 1,000 individuals. Bowhead whales are specialised copepod feeders that exploit the high concentrations of Calanus sp. in the west coast waters. It is suspected that Greenland’s west coast waters are an important foraging ground for pregnant or resting female bowhead whales from the whole Canada-Greenland population. They are listed within CITES Appendix I (1). Minke whale (Balaenoptera acutorostrata)
Minke whales are a baleen species that occur along Greenland’s entire west coast during the summer and autumn, however, they are most abundant in the southwest (2). An estimated 4,000 minke whales migrate to Greenland’s west coast during the summer (3). They are found in both coastal waters and along the banks to the south and west of Disko Island. They winter in warmer more southern waters. Minke whales feed on a wide range of prey species including krill and small schooling fish. Minke whale hunting in Greenland is regulated by quota and is considered an aboriginal/subsistence catch. They are listed in CITES Appendix II. Humpback whale (Megaptera novaeangliae)
Humpback whales are large baleen whales that occur around banks and along the coast in western Greenland between Paamiut and Sisimiut from June to November (4). There are an estimated 1,000 humpback whales in western Greenland. They are a migratory species, spending the winter in temperate and tropical waters where they give birth and mate, returning to mid and high latitude feeding grounds in the summer. Humpback whales feed on a range of small schooling fish and krill. They are listed in CITES Appendix I. Fin Whale (Balaenoptera physalus)
Fin whales are found from Nunap Isua to Upernavik on both banks and in coastal regions (5). The fin whale is a large baleen whale with a worldwide distribution. They are a migratory species, spending the winter at lower latitudes where they breed and mate and spend the summer months feeding in polar waters. Non breeding animals may spend the winter at higher latitudes rather than migrating to warmer waters. Fin whales feed primarily on krill in polar waters, but will also take small schooling fish such as herring.
(1) Convention on International Trade in Endangered Species of Wild Fauna and Flora (1973) Full text and appendices
available from http://www.cites.org/. (2) Greenland Institute of Natural Resources (2003) Biodiversity of Greenland - a country study. Technical Report No. 55,
Pinngortitaleriffik, Grønlands Naturinstitut, 165 pp. (3) Mosbech, A., Boertmann, D. and Jespersen, M. (2007) Strategic Environmental Impact Assessment of hydrocarbon
activities in the Disko West area. NERI Technical Report No. 618, 192pp. (4) Greenland Institute of Natural Resources (2003) Biodiversity of Greenland - a country study. Technical Report No. 55,
Pinngortitaleriffik, Grønlands Naturinstitut, 165 pp. (5) Greenland Institute of Natural Resources (2003) Biodiversity of Greenland - a country study. Technical Report No. 55,
Pinngortitaleriffik, Grønlands Naturinstitut, 165 pp.
ENVIRONMENTAL RESOURCES MANAGEMENT CAPRICORN GREENLAND EXPLORATION-1
4-51
Fin whale hunting in Greenland is regulated by quota and is considered to be an aboriginal/subsistence catch. They are listed in CITES Appendix I. Blue whale (Balaenoptera musculus)
Blue whales are the largest whale in the world. They are rare but regular visitors to western Greenland as far north as Uummannaq (1). They are a migratory species, wintering and calving at low latitudes and spending the summer in polar feeding grounds. They feed exclusively on crustaceans and other planktonic organisms with krill constituting the largest part of their diet. Blue whales are listed on CITES Appendix I. Harbour porpoise (Phocoena phocoena)
Harbour porpoise are common along the whole west coast of Greenland from April to November (2). They inhabit the more open water areas of the Baffin Strait as well as coastal areas and around Disko Bay. During the winter they migrate to more southern waters (3). Harbour porpoise feed on fish in the upper water column. Bottlenose whale (Hyperoodon ampullatus)
The bottlenose whale is an infrequent visitor to western Greenland between June and August (4). Winters are spent in warmer more southern water. They are a deep water species, often seaward of the continental shelf near to deep submarine features such as subsea canyons or seamounts. They develop family groups of 4-20 animals, which may be formed depending on sex or age. Bottlenose whales are toothed whales that feed primarily on squid, but prey may also include fish and invertebrates. The species is capable of deep dives to around 800 m. Long-finned pilot whale (Globicephalus melas)
Long-finned pilot whales are occasional visitors along Greenland’s west coast from June to October (5). The occurrence of this species in western Greenland fluctuates but is thought to be correlated with influxes of relatively warm Atlantic water to the Davis Strait and Baffin Bay (6). 2009 was a good year for this species in western Greenland as a flock of 40 individuals were observed. Previously they have been sited as far north as Qeqertarsuaq. Long-finned pilot whales are medium sized toothed whales. They are generally a species found on the continental shelf. They tend to avoid ice covered waters,
(1) Greenland Institute of Natural Resources (2003) Biodiversity of Greenland - a country study. Technical Report No. 55, Pinngortitaleriffik, Grønlands Naturinstitut, 165 pp. (2) Mosbech, A., Boertmann, D. and Jespersen, M. (2007) Strategic Environmental Impact Assessment of hydrocarbon activities in the Disko West area. NERI Technical Report No. 618, 192pp. (3) Møller, H. S., Potter, S., Andreasen, C., Berglund, J. & Myrup, M. (2004). Environmental Oil Spill Sensitivity Atlas for the West Greenland (68º-72º N) Coastal Zone. NERI Technical Report no. 494, 442 pp. (4) Mosbech, A., Boertmann, D. and Jespersen, M. (2007) Strategic Environmental Impact Assessment of hydrocarbon activities in the Disko West area. NERI Technical Report No. 618, 192pp. (5) Mosbech, A., Boertmann, D. and Jespersen, M. (2007) Strategic Environmental Impact Assessment of hydrocarbon activities in the Disko West area. NERI Technical Report No. 618, 192pp. (6)NERI (2010) Marine Mammals in the Disko West Area. A Knowledge Update Report for Capricorn Exploration-1.
ENVIRONMENTAL RESOURCES MANAGEMENT CAPRICORN GREENLAND EXPLORATION-1
4-52
although will come in closer to land during the summer. Their main food source is cephalopods. Killer whale (Orcinus orca)
Killer whales are rare but regular visitors to western Greenland as far north as Qaanaq (1). They occur in open and coastal waters in the area from June to August. Killer whales are apex predators which are widespread across all oceans of the world. Killer whales feed mostly on fish and cephalopods but also take birds and marine mammals, including other whale species (2). Beluga whale (white whale) (Delphinapterus laucas)
Beluga whales are abundant on the banks of western Greenland from November until May (3). They number at about 8,000 individuals. Although information on beluga whale migration patterns in West Greenland is limited, it is known that in the spring beluga whales begin their migration away from Greenland, crossing the Baffin Bay and arriving in northern Canada (4). They can be found along the ice edge in western Greenland in spring and in the open water until autumn, when they arrive in Canada. During the winter when the beluga whales are located in western Greenland, they can be found in shallow water and coastal areas (see Figure 4.17). Beluga whales are expected to obtain the major part of their annual food intake in West Greenland in winter, feeding on fish, such as cod, ocean perch and Greenland halibut. They are listed on CITES Appendix II.
(1) Mosbech, A., Boertmann, D. and Jespersen, M. (2007) Strategic Environmental Impact Assessment of hydrocarbon
activities in the Disko West area. NERI Technical Report No. 618, 192pp. (2) Greenland Institute of Natural Resources (2003) Biodiversity of Greenland - a country study. Technical Report No. 55,
Pinngortitaleriffik, Grønlands Naturinstitut, 165 pp. (3) Mosbech, A., Boertmann, D. and Jespersen, M. (2007) Strategic Environmental Impact Assessment of hydrocarbon
activities in the Disko West area. NERI Technical Report No. 618, 192pp. (4) Greenland Institute of Natural Resources (2003) Biodiversity of Greenland - a country study. Technical Report No. 55,
Pinngortitaleriffik, Grønlands Naturinstitut, 165 pp.

Aasiaat
Qeqertaq
Sisimiut
Nunatsiaq
Upernavik
Uummannaq
Ilulissat
Kangerlussuaq
Grønne Ejland
Qerqertarsuaq
Maniitsoq (Sukkertoppen)
CLIENT: SIZE: TITLE:
DATE: 22/02/2010
DRAWN: CJ
CHECKED: RB
APPROVED: JP
PROJECT: 0108885
SCALE: As scale barDRAWING: REV:
KEY: Capricorn Greenland Exploration-1 A4 Figure 4.17
Beluga Wintering Ground
Beluga_wintering_ground.mxd 0
Sigguk Licence AreaBeluga Wintering Ground
.0 125
Kilometres
SOURCE: NERIPROJECTION: WGS 1984 UTM Zone 21N
File:
0108
885G
reenla
ndW
estG
IS_C
J_JP
\Outp
uts\22
Feb1
0\Fina
l with
figure
numb
ers 22
Feb\B
eluga
_wint
ering
_grou
nd.m
xd
ERMEaton HouseWallbrook CourtNorth Hinksey LaneOxford, OX2 0QSTelephone: 01865 384800Facsimile: 01865 204982
© ERM This print is confidential and is supplied on the understanding that it will be used only as a record to identify or inspect parts, concepts or designs and that it is not disclosed to other persons or to be used for construction purposes without permission.
ENVIRONMENTAL RESOURCES MANAGEMENT CAPRICORN GREENLAND EXPLORATION-1
4-54
Narwhal (Monodon monoceros)
Narwhals, which reach 3,000 in number, are present in western Greenland from November until May (1). They conduct yearly migrations and in winter can be found under dense pack ice in the central Davis Strait and southern Baffin Bay (2). During the spring they occur along the coast of West Greenland and can be found in the shallow coastal waters around Inglefield Bredning in Avanersuaq and Melleville Bay in the summer. In the autumn narwhals can be found as far north as Upernavik and Uummannaq. They are toothed whales that feed primarily on Greenland halibut and occasionally on other fish, shrimp and squid. The majority of young appear to be born in the July in deep bays and inlets. The narwhal is listed in CITES Appendix II. Sperm whale (Physeter macrocephalus)
Sperm whales are rare but regular visitors to the deep water along Greenland’s west coast between May and November (3). They are generally restricted to deep waters, seaward of continental shelves and often near to deep water canyons. Females and young remain further south in the North Atlantic, whilst males tend to migrate to higher latitudes once they reach puberty (4). Males then tend to stay at these higher latitudes, feeding and increasing in size until they are sufficiently large to migrate back to lower latitudes to attempt to breed. The sperm whale is the largest toothed whale and predominantly feeds on squid. They are listed in CITES Appendix I. Harp seals (Phoca groenlandica)
Harp seals are the most numerous marine mammal found in western Greenland with an estimated 5.4 million individuals (5). Harp seals are migrant seals that occur between June and October in ice free water to feed on fish such as herring, cod and capelin, as well as crabs and other invertebrates. They breed on pack ice along the west and east coasts of Greenland then migrate north along the coast. Harp seals give birth on pack ice around Jan Mayen in the Greenland Sea between March and April (6). Moulting occurs in late April in the same region as pupping and once finished the seals disperse along the coasts northward to Qaanaaq in western Greenland. In late October harp seals leave the northern regions and return to breeding sites.
(1) Mosbech, A., Boertmann, D. and Jespersen, M. (2007) Strategic Environmental Impact Assessment of hydrocarbon
activities in the Disko West area. NERI Technical Report No. 618, 192pp. (2) Greenland Institute of Natural Resources (2003) Biodiversity of Greenland - a country study. Technical Report No. 55,
Pinngortitaleriffik, Grønlands Naturinstitut, 165 pp. (3) Mosbech, A., Boertmann, D. and Jespersen, M. (2007) Strategic Environmental Impact Assessment of hydrocarbon
activities in the Disko West area. NERI Technical Report No. 618, 192pp. (4) Greenland Institute of Natural Resources (2003) Biodiversity of Greenland - a country study. Technical Report No. 55,
Pinngortitaleriffik, Grønlands Naturinstitut, 165 pp. (5) Mosbech, A., Boertmann, D. and Jespersen, M. (2007) Strategic Environmental Impact Assessment of hydrocarbon
activities in the Disko West area. NERI Technical Report No. 618, 192pp. (6) Greenland Institute of Natural Resources (2003) Biodiversity of Greenland - a country study. Technical Report No. 55,
Pinngortitaleriffik, Grønlands Naturinstitut, 165 pp.
ENVIRONMENTAL RESOURCES MANAGEMENT CAPRICORN GREENLAND EXPLORATION-1
4-55
Hooded seals (Cystophora cristata)
Like the harp seal, the hooded seal is a migrant species that breeds on pack ice on the west and east coasts of Greenland then migrates northwards to feed (1). They are a numerous species in western Greenland, although no estimates to population size have recently been made. Whelping takes place in the middle of the Davis Strait in late March to early April when the seals from the Davis Strait population disperse into the open waters and ice drift in West Greenland and Arctic Canada (2). Moulting occurs on pack ice from June to July in either Jan Mayen or the Denmark Strait after which they can be found across large parts of the northern Atlantic. Adults usually feed on large fish such as Greenland halibut, while the young eat smaller fish species such as capelin and polar cod. Ringed seals (Phoca hispida)
The ringed seal is a common species along all of Greenland’s coasts throughout the whole year (3). They are usually found in association with sea ice and are the only species that stays on the ice all year round (but may haul out on land if ice is not available). Although landfast ice is preferred breeding occurs successfully on stable pack ice in Baffin Bay and the Greenland Sea. They maintain breathing holes in winter ice over two metres deep using their foreclaws and teeth (4). The seals form lairs in snowdrifts over their breathing holes and give birth there in late March or April. The lair forms a warm environment for the pups to reduce its energy requirements to keep warm. Breeding takes place in April to May. The adults feed on pelagic fish species such as polar cod or capelin and invertebrates. Harbour Seals (Phoca vitulina)
Harbour seals are rare in Greenland waters but can be found in western Greenland year round near the coast south of Avanersuaq (5). Regular sightings of harbour seal occur in south western Greenland in the Kangerlussuaq fjord (6). Harbour seals use coastal haul-out sites during the summer (late May to August) to give birth, nurse their pups and moult. During this time, they are vulnerable to hunters. Harbour seals feed on a broad range of pelagic prey.
(1) Greenland Institute of Natural Resources (2003) Biodiversity of Greenland - a country study. Technical Report No. 55,
Pinngortitaleriffik, Grønlands Naturinstitut, 165 pp. (2) Greenland Institute of Natural Resources (2003) Biodiversity of Greenland - a country study. Technical Report No. 55,
Pinngortitaleriffik, Grønlands Naturinstitut, 165 pp. (3) Greenland Institute of Natural Resources (2003) Biodiversity of Greenland - a country study. Technical Report No. 55,
Pinngortitaleriffik, Grønlands Naturinstitut, 165 pp. (4) NAMMCO, 2002. The Ringed Seal. Status of Marine Mammals in the North Atlantic. North Atlantic Marine Mammal
Commission. 35 pp. (5) Greenland Institute of Natural Resources (2003) Biodiversity of Greenland - a country study. Technical Report No. 55,
Pinngortitaleriffik, Grønlands Naturinstitut, 165 pp. (6) Mosbech, A., Boertmann, D. and Jespersen, M. (2007) Strategic Environmental Impact Assessment of hydrocarbon
activities in the Disko West area. NERI Technical Report No. 618, 192pp.
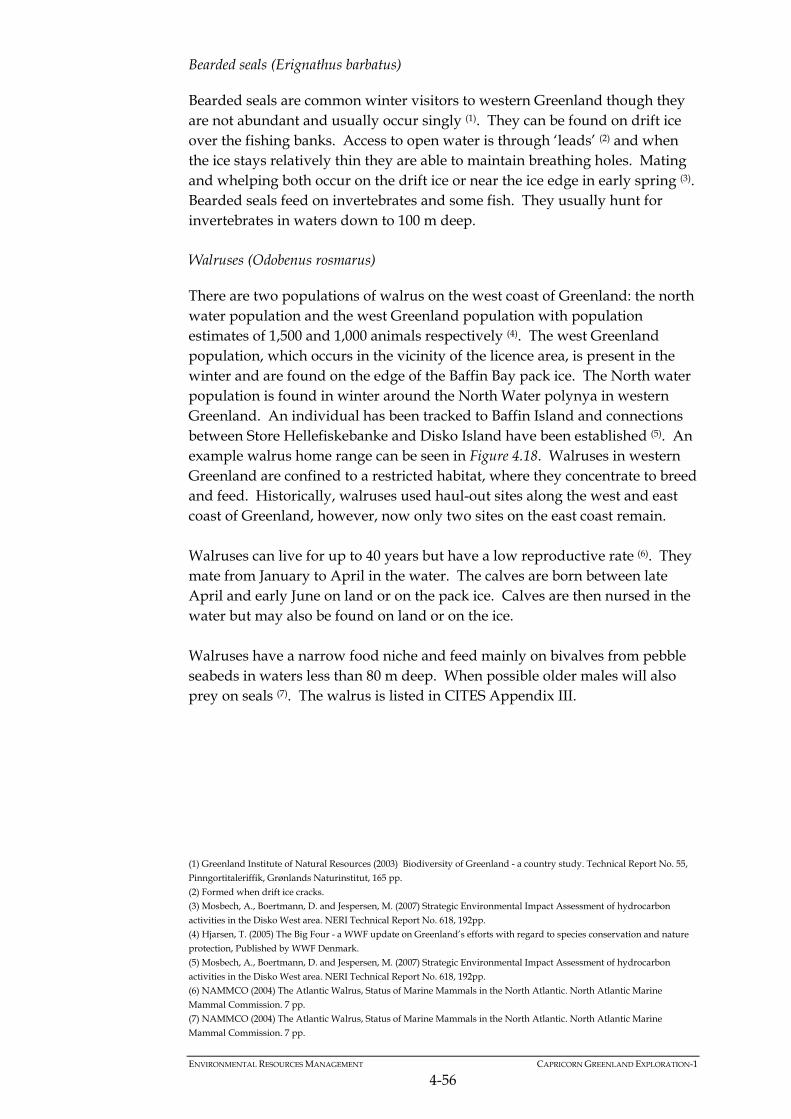
ENVIRONMENTAL RESOURCES MANAGEMENT CAPRICORN GREENLAND EXPLORATION-1
4-56
Bearded seals (Erignathus barbatus)
Bearded seals are common winter visitors to western Greenland though they are not abundant and usually occur singly (1). They can be found on drift ice over the fishing banks. Access to open water is through ‘leads’ (2) and when the ice stays relatively thin they are able to maintain breathing holes. Mating and whelping both occur on the drift ice or near the ice edge in early spring (3). Bearded seals feed on invertebrates and some fish. They usually hunt for invertebrates in waters down to 100 m deep. Walruses (Odobenus rosmarus)
There are two populations of walrus on the west coast of Greenland: the north water population and the west Greenland population with population estimates of 1,500 and 1,000 animals respectively (4). The west Greenland population, which occurs in the vicinity of the licence area, is present in the winter and are found on the edge of the Baffin Bay pack ice. The North water population is found in winter around the North Water polynya in western Greenland. An individual has been tracked to Baffin Island and connections between Store Hellefiskebanke and Disko Island have been established (5). An example walrus home range can be seen in Figure 4.18. Walruses in western Greenland are confined to a restricted habitat, where they concentrate to breed and feed. Historically, walruses used haul-out sites along the west and east coast of Greenland, however, now only two sites on the east coast remain. Walruses can live for up to 40 years but have a low reproductive rate (6). They mate from January to April in the water. The calves are born between late April and early June on land or on the pack ice. Calves are then nursed in the water but may also be found on land or on the ice. Walruses have a narrow food niche and feed mainly on bivalves from pebble seabeds in waters less than 80 m deep. When possible older males will also prey on seals (7). The walrus is listed in CITES Appendix III.
(1) Greenland Institute of Natural Resources (2003) Biodiversity of Greenland - a country study. Technical Report No. 55,
Pinngortitaleriffik, Grønlands Naturinstitut, 165 pp. (2) Formed when drift ice cracks. (3) Mosbech, A., Boertmann, D. and Jespersen, M. (2007) Strategic Environmental Impact Assessment of hydrocarbon
activities in the Disko West area. NERI Technical Report No. 618, 192pp. (4) Hjarsen, T. (2005) The Big Four - a WWF update on Greenland’s efforts with regard to species conservation and nature
protection, Published by WWF Denmark. (5) Mosbech, A., Boertmann, D. and Jespersen, M. (2007) Strategic Environmental Impact Assessment of hydrocarbon
activities in the Disko West area. NERI Technical Report No. 618, 192pp. (6) NAMMCO (2004) The Atlantic Walrus, Status of Marine Mammals in the North Atlantic. North Atlantic Marine
Mammal Commission. 7 pp. (7) NAMMCO (2004) The Atlantic Walrus, Status of Marine Mammals in the North Atlantic. North Atlantic Marine
Mammal Commission. 7 pp.
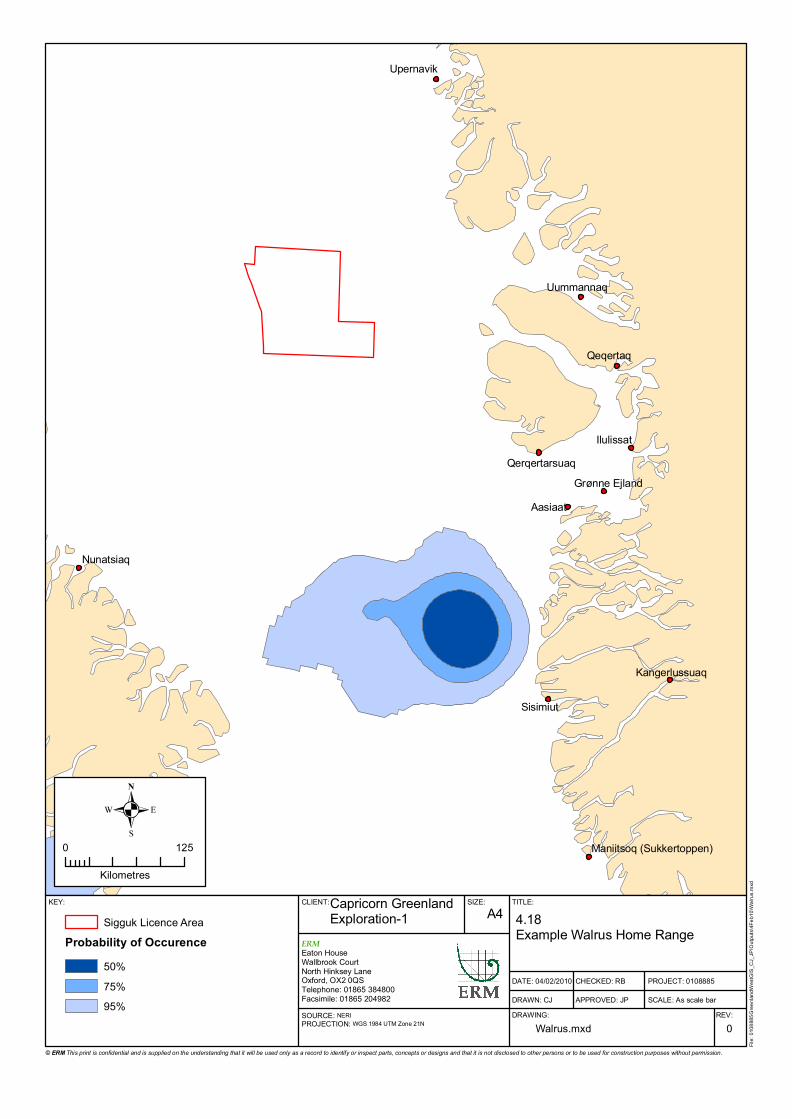
Aasiaat
Qeqertaq
Sisimiut
Nunatsiaq
Upernavik
Uummannaq
Ilulissat
Kangerlussuaq
Grønne EjlandQerqertarsuaq
Maniitsoq (Sukkertoppen)
CLIENT: SIZE: TITLE:
DATE: 04/02/2010
DRAWN: CJ
CHECKED: RB
APPROVED: JP
PROJECT: 0108885
SCALE: As scale barDRAWING: REV:
KEY: Capricorn Greenland Exploration-1 A4 4.18
Example Walrus Home Range
Walrus.mxd 0
Sigguk Licence AreaProbability of Occurence
50%75%95%
.0 125
Kilometres
SOURCE: NERIPROJECTION: WGS 1984 UTM Zone 21N
File:
0108
885G
reenla
ndW
estG
IS_C
J_JP
\Outp
uts\4F
eb10
\Walr
us.m
xd
ERMEaton HouseWallbrook CourtNorth Hinksey LaneOxford, OX2 0QSTelephone: 01865 384800Facsimile: 01865 204982
© ERM This print is confidential and is supplied on the understanding that it will be used only as a record to identify or inspect parts, concepts or designs and that it is not disclosed to other persons or to be used for construction purposes without permission.
ENVIRONMENTAL RESOURCES MANAGEMENT CAPRICORN GREENLAND EXPLORATION-1
4-58
Polar Bears (Ursus maritimus)
There are three polar bear populations located in western Greenland, but only the range of the Baffin Bay population is within the vicinity of the licence area, however, their exact distribution is largely determined by the distribution of pack ice (1). Polar bears are mainly observed in western Greenland in winter when sea ice is present although bears that follow the movement of the ice may be present from autumn to spring; they occur along the ice edge and on drift ice (2). The Baffin Bay population is estimated to contain approximately 2,000 bears (3). Figure 4.19 shows the migration of polar bears as they follow the movement of ice. Compared to the surround area, the Sigguk block contains a relatively low home range percent of polar bears in all seasons. In April and May polar bears congregate on pack ice in order to mate. The fertilised egg in the pregnant female then remains dormant for four months while the female gains a large volume of weight, often doubling in size. In autumn and early winter the pregnant female digs a breeding den and cubs are born in the winter, usually between November and February. The mother and cubs remain in the den until mid-February to mid-April. In the summer polar bears moult their fur which can take several weeks. Polar bears feed primarily on ringed and bearded seals but will occasionally hunt harp seals, hooded seals, walrus pups, beluga and narwhal (4). They also take marine birds and scavenge on the occasional whale carcass (5). Polar bears are listed on CITES Appendix II.
(1) Jensen, DB (Translated by Darden, SK) (2003) The Biodiversity if Greenland - a country study, Technical Report No. 55, Published by Pinngortitaleriffik, Gronlands Naturinstitut. (2) Mosbech, A., Boertmann, D. and Jespersen, M. (2007) Strategic Environmental Impact Assessment of hydrocarbon activities in the Disko West area. NERI Technical Report No. 618, 192pp. (3) Hjarsen, T. (2005) The Big Four - a WWF update on Greenland’s efforts with regard to species conservation and nature protection, Published by WWF Denmark. (4) IUCN/SSC Polar Bear Specialist Group. Accessed 2009. Available from http://pbsg.npolar.no/ (5) Hjarsen, T. (2005) The Big Four - a WWF update on Greenland’s efforts with regard to species conservation and nature
protection, Published by WWF Denmark.
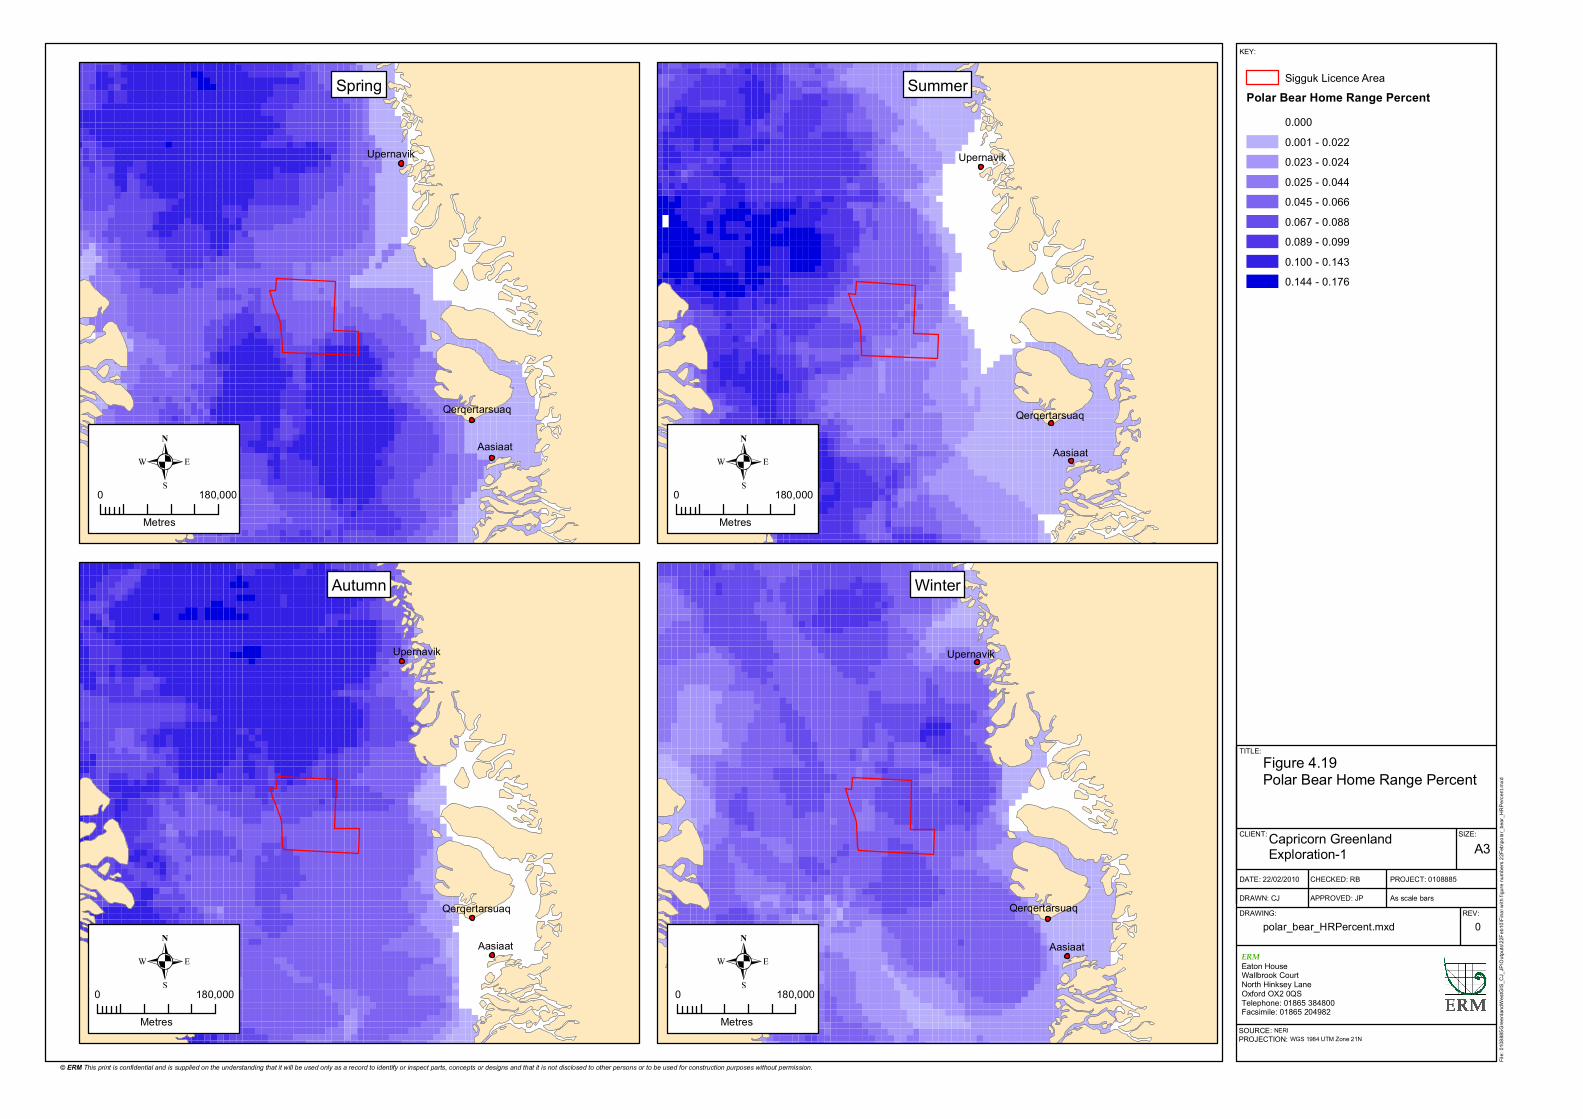
SIZE:
TITLE:
DATE: 22/02/2010
DRAWN: CJ
CHECKED: RB
APPROVED: JP
PROJECT: 0108885
As scale barsDRAWING: REV:
KEY:
A3
Figure 4.19Polar Bear Home Range Percent
polar_bear_HRPercent.mxd 0
Sigguk Licence AreaPolar Bear Home Range Percent
0.0000.001 - 0.0220.023 - 0.0240.025 - 0.0440.045 - 0.0660.067 - 0.0880.089 - 0.0990.100 - 0.1430.144 - 0.176
CLIENT: Capricorn Greenland Exploration-1
Aasiaat
Upernavik
Qerqertarsuaq
.0 180,000
Metres
Aasiaat
Upernavik
Qerqertarsuaq
Aasiaat
Upernavik
Qerqertarsuaq
.0 180,000
Metres
Aasiaat
Upernavik
Qerqertarsuaq
.0 180,000
Metres
Winter
Summer
Autumn
Spring
File:
0108
885G
reenla
ndW
estG
IS_C
J_JP
\Outp
uts\22
Feb1
0\Fina
l with
figure
numb
ers 22
Feb\p
olar_b
ear_H
RPerc
ent.m
xd
ERMEaton HouseWallbrook CourtNorth Hinksey LaneOxford OX2 0QSTelephone: 01865 384800Facsimile: 01865 204982
© ERM This print is confidential and is supplied on the understanding that it will be used only as a record to identify or inspect parts, concepts or designs and that it is not disclosed to other persons or to be used for construction purposes without permission.
SOURCE: NERIPROJECTION: WGS 1984 UTM Zone 21N
.0 180,000
Metres
ENVIRONMENTAL RESOURCES MANAGEMENT CAPRICORN GREENLAND EXPLORATION-1
4-60
4.2.7 Important Habitats
Important Habitats for Benthic Invertebrates
The benthic communities found at the two well locations were very similar. No protected or particularly sensitive habitats were found (eg coral reefs). Species abundance was comparable or higher than other studies in western Baffin Bay or southern Davis Strait but was lower for comparable depth ranges and had similar abundances to those studies conducted in deeper waters. The diversity of benthic animals was also lower than the southern Davis Strait. No specific important habitats for benthic invertebrates were therefore identified from the environmental survey results. Important Habitats for Birds
Within the assessment area there are particular habitats which play an important role in supporting bird species. As the majority of birds are only present during the breeding season, these habitats are generally areas which support breeding birds. Polynyas that do not freeze over are especially important as these areas are capable of supporting some species all year round. Polynyas are important during the breeding season as they are able to support some of the first birds returning to breeding areas, providing valuable foraging areas. Leads that form as the ice breaks up provide valuable foraging habitat, enabling birds to forage nearer to breeding colonies. The marginal ice zone where the leads form is likely to be an important habitat for migrating seabirds in the spring. Some species undertake a swimming migration after breeding, spending a relatively long time in coastal waters (such as Brünnich’s guillemot), whilst other species rapidly fly through the assessment area. Fjords and sounds are important as they often provide important nesting habitats close to the coast where large breeding colonies can form. Islands also often provide important habitat for breeding colonies (1). Birds at nesting colonies can be extremely sensitive to disturbance by humans. Birds within cliff colonies usually respond by deserting their eggs, even if only slightly agitated (2). It is illegal to shoot or generate noise within five kilometres of cliff-dwelling bird colonies of murres (Uria aalge), little auks (Alle alle), kittiwakes (Rissa tridactyla), northern fulmar (Fulmarus glacialis) or great cormorants (Phalacrocorax carbo) (3). This rule also applies to small islands occupied by common eiders (Somateria mollissima), king eiders (Somateria
(1) Boertmann D, Mosbech A and Johansen K (2008) Preliminary Strategic Environmental Impact Assessment of hydrocarbon activities in the KANUMAS East Assessment area. (2) Greenland Institute of Natural Resources (2003) Biodiversity of Greenland - a country study. Technical Report No. 55, Pinngortitaleriffik, Grønlands Naturinstitut, 165 pp. (3) Greenland Institute of Natural Resources (2003) Biodiversity of Greenland - a country study. Technical Report No. 55, Pinngortitaleriffik, Grønlands Naturinstitut, 165 pp.
(3) Birds in Europe: population estimates, trends and conservation status (BirdLife International 2004)
ENVIRONMENTAL RESOURCES MANAGEMENT CAPRICORN GREENLAND EXPLORATION-1
4-61
spectabilis), black guillemots (Cepphus grylle), terns or gulls other than kittiwakes but within a distance of 200 m (1). Some birds are vulnerable during the moulting season when they are unable to fly for 3-4 weeks (2). Birds such as the common and king eiders gather in fjords and bays to moult. These areas give the birds some protection from predators and provide good foraging areas. There are also a number of important bird areas (IBAs) (see Figure 4.21) in western Greenland, which are important habitats for birds. Important Habitats for Fish
The marine environment near the coast is an important habitat for fish. Coastal area and fjords provide shelter for spawning and maturation for species such as capelin and lumpfish. Arctic char also stay close to the coast during their migration out to sea. The ice edge is an important area for capelin (3). Capelin follow the retreat of the ice edge to exploit the abundance of zooplankton that follows the phytoplankton bloom that occurs there. Larger fish, whales and seals are known to follow the capelin to the ice edge. Important Habitats for Mammals
The main habitats for marine mammals in western Greenland can be found in Table 4.22. Areas where the assessment area is of high importance to a marine mammal could be considered an important habitat, especially if the species is threatened, endangered or protected. For example, the marginal ice zone is an important habitat for the bowhead whale between February and June and coastal areas are important for harbour seals to haul out in summer, give birth, nurse their young and shed their fur (4). Migration routes can also be considered important areas for marine mammals.
4.2.8 Valued Ecosystem Components
A valued ecosystem component is a resource or environmental feature that is important to a local human population both economically and scientifically, has a national or international profile or is important for the evaluation of environmental impacts. Western Greenland has several valued ecosystem components, which have been covered by sections in either the EIA or SIA. A summary table of VECs in Western Greenland together with where they have been covered can be found in Table 4.23.
(1) Greenland Institute of Natural Resources (2003) Biodiversity of Greenland - a country study. Technical Report No. 55,
Pinngortitaleriffik, Grønlands Naturinstitut, 165 pp. (2) Greenland Institute of Natural Resources (2003) Biodiversity of Greenland - a country study. Technical Report No. 55,
Pinngortitaleriffik, Grønlands Naturinstitut, 165 pp. (3) Greenland Institute of Natural Resources (2003) Biodiversity of Greenland - a country study. Technical Report No. 55,
Pinngortitaleriffik, Grønlands Naturinstitut, 165 pp. (4) Greenland Institute of Natural Resources (2003) Biodiversity of Greenland - a country study. Technical Report No. 55,
Pinngortitaleriffik, Grønlands Naturinstitut, 165 pp.
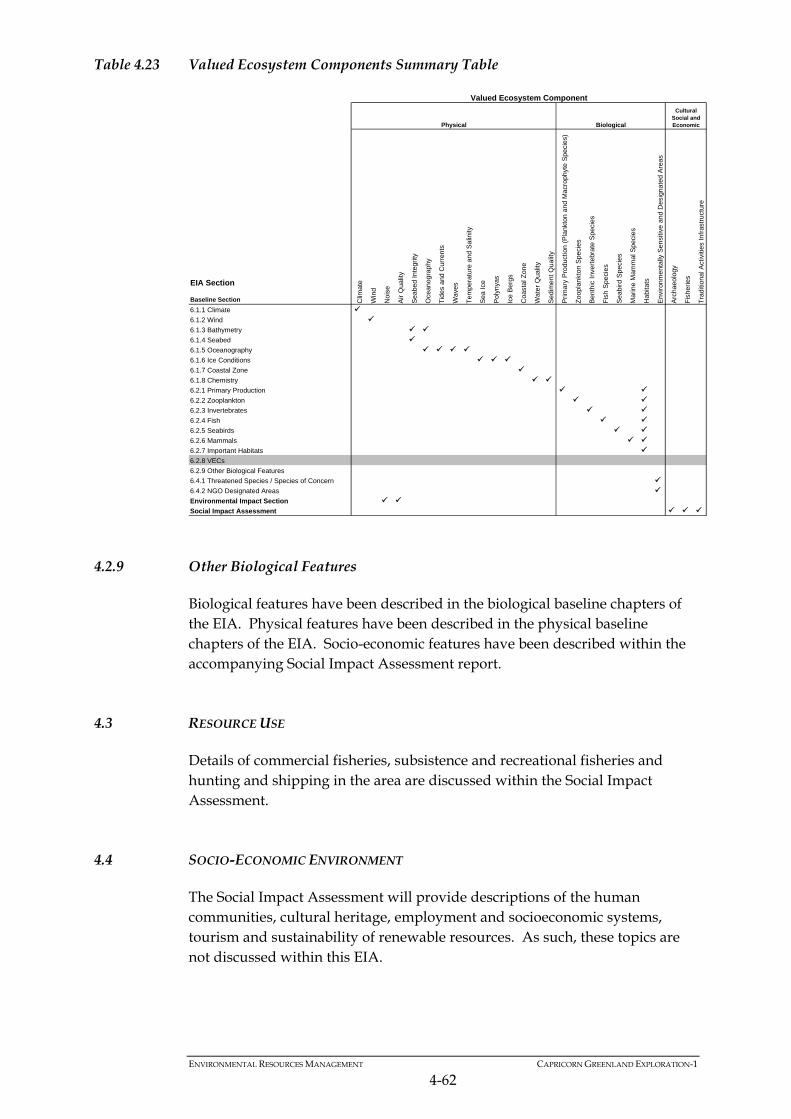
ENVIRONMENTAL RESOURCES MANAGEMENT CAPRICORN GREENLAND EXPLORATION-1
4-62
Table 4.23 Valued Ecosystem Components Summary Table
EIA Section
Baseline Section Clim
ate
Win
d
Noi
se
Air
Qua
lity
Sea
bed
Inte
grity
Oce
anog
raph
y
Tid
es a
nd C
urre
nts
Wav
es
Tem
pera
ture
and
Sal
inity
Sea
Ice
Pol
ynya
s
Ice
Ber
gs
Coa
stal
Zon
e
Wat
er Q
ualit
y
Sed
imen
t Q
ualit
y
Pri
mar
y P
rodu
ctio
n (P
lank
ton
and
Mac
roph
yte
Spe
cies
)
Zoo
plan
kton
Spe
cies
Ben
thic
Inv
erte
brat
e S
peci
es
Fis
h S
peci
es
Sea
bird
Spe
cies
Mar
ine
Mam
ma
l Spe
cies
Hab
itats
Env
ironm
enta
lly S
ensi
tive
and
Des
igna
ted
Are
as
Arc
haeo
logy
Fis
herie
s
Tra
ditio
nal A
ctiv
ities
Inf
rast
ruct
ure
6.1.1 Climate 6.1.2 Wind 6.1.3 Bathymetry 6.1.4 Seabed 6.1.5 Oceanography 6.1.6 Ice Conditions 6.1.7 Coastal Zone 6.1.8 Chemistry 6.2.1 Primary Production 6.2.2 Zooplankton 6.2.3 Invertebrates 6.2.4 Fish 6.2.5 Seabirds 6.2.6 Mammals 6.2.7 Important Habitats 6.2.8 VECs
6.2.9 Other Biological Features
6.4.1 Threatened Species / Species of Concern 6.4.2 NGO Designated Areas Environmental Impact Section Social Impact Assessment
Cultural Social and Economic
Valued Ecosystem Component
BiologicalPhysical
4.2.9 Other Biological Features
Biological features have been described in the biological baseline chapters of the EIA. Physical features have been described in the physical baseline chapters of the EIA. Socio-economic features have been described within the accompanying Social Impact Assessment report.
4.3 RESOURCE USE
Details of commercial fisheries, subsistence and recreational fisheries and hunting and shipping in the area are discussed within the Social Impact Assessment.
4.4 SOCIO-ECONOMIC ENVIRONMENT
The Social Impact Assessment will provide descriptions of the human communities, cultural heritage, employment and socioeconomic systems, tourism and sustainability of renewable resources. As such, these topics are not discussed within this EIA.
ENVIRONMENTAL RESOURCES MANAGEMENT CAPRICORN GREENLAND EXPLORATION-1
4-63
4.5 PROTECTED AREAS AND THREATENED SPECIES
4.5.1 Threatened Species and Species of Concern
Threatened Species
There are three species of fish that occur in western Greenland that appear as ‘Vulnerable’ or ‘Near Threatened’ on the IUCN red list; Atlantic cod and Thorny skate are listed as ‘Vulnerable’ and the Greenland shark is listed as ‘Near Threatened’. A number of other species are placed in the category of ’Least Concern’; these are Arctic skate, three-spined stickleback, Atlantic salmon, Arctic char and common grenadier. All bird species discussed in Section 4.2.5 are listed as of Least Concern on the IUCN red list, except for the ivory gull which is listed as Near Threatened. However, Greenland’s red list places a number of these species in a higher category. On Greenland’s red list, the common eider, thick-billed murre and ivory gull are listed as Vulnerable; the arctic tern, Atlantic puffin and Sabine’s gull are listed as Near Threatened; and the black-legged kittiwake is listed as Endangered. The king eider has not been evaluated. Some of western Greenland’s marine mammals appear on the IUCN red list, Greenland’s red list and on the CITES Appendices. A summary of this can be found in Table 4.24. CITES Appendix I lists species that are the most endangered among CITES-listed animals (1). Appendix II lists species that are not necessarily now threatened with extinction but that may become so unless trade is closely controlled. Appendix III is a list of species included at the request of a Party that already regulates trade in the species and that needs the cooperation of other countries to prevent unsustainable or illegal exploitation.
Table 4.24 Protected Species of Marine Mammal in Western Greenland
Species CITES Appendix IUCN Red List Greenland Red List I II III Bowhead whale Least Concern Near threatened Minke whale Least Concern Least concern Humpback whale Least Concern Least concern Fin Whale Endangered Least concern Blue whale Endangered Data deficient Harbour porpoise Least Concern Data deficient Bottlenose whale Data deficient Not evaluated Pilot whale Data deficient Least concern Killer whale Data deficient Not evaluated Beluga whale Near Threatened Critical endangered Narwhal Near Threatened Critical endangered Sperm whale Vulnerable Not evaluated Harp seal Least Concern Least concern Hooded seal Vulnerable Least concern Ringed seal Least Concern Least concern Harbour seal Least Concern Critical endangered Bearded seal Least Concern Data deficient
(1) <http://www.cites.org/eng/app/index.shtml> Accessed 22/01/2010.
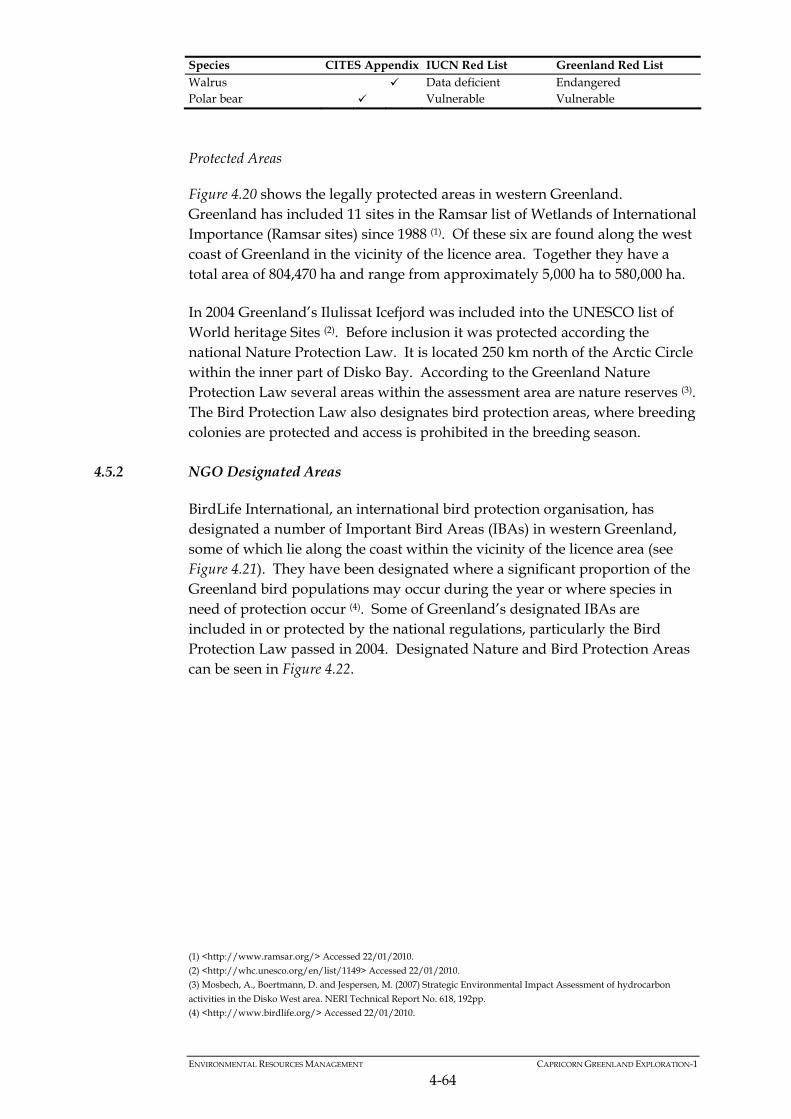
ENVIRONMENTAL RESOURCES MANAGEMENT CAPRICORN GREENLAND EXPLORATION-1
4-64
Species CITES Appendix IUCN Red List Greenland Red List Walrus Data deficient Endangered Polar bear Vulnerable Vulnerable
Protected Areas
Figure 4.20 shows the legally protected areas in western Greenland. Greenland has included 11 sites in the Ramsar list of Wetlands of International Importance (Ramsar sites) since 1988 (1). Of these six are found along the west coast of Greenland in the vicinity of the licence area. Together they have a total area of 804,470 ha and range from approximately 5,000 ha to 580,000 ha. In 2004 Greenland’s Ilulissat Icefjord was included into the UNESCO list of World heritage Sites (2). Before inclusion it was protected according the national Nature Protection Law. It is located 250 km north of the Arctic Circle within the inner part of Disko Bay. According to the Greenland Nature Protection Law several areas within the assessment area are nature reserves (3). The Bird Protection Law also designates bird protection areas, where breeding colonies are protected and access is prohibited in the breeding season.
4.5.2 NGO Designated Areas
BirdLife International, an international bird protection organisation, has designated a number of Important Bird Areas (IBAs) in western Greenland, some of which lie along the coast within the vicinity of the licence area (see Figure 4.21). They have been designated where a significant proportion of the Greenland bird populations may occur during the year or where species in need of protection occur (4). Some of Greenland’s designated IBAs are included in or protected by the national regulations, particularly the Bird Protection Law passed in 2004. Designated Nature and Bird Protection Areas can be seen in Figure 4.22.
(1) <http://www.ramsar.org/> Accessed 22/01/2010. (2) <http://whc.unesco.org/en/list/1149> Accessed 22/01/2010. (3) Mosbech, A., Boertmann, D. and Jespersen, M. (2007) Strategic Environmental Impact Assessment of hydrocarbon
activities in the Disko West area. NERI Technical Report No. 618, 192pp. (4) <http://www.birdlife.org/> Accessed 22/01/2010.
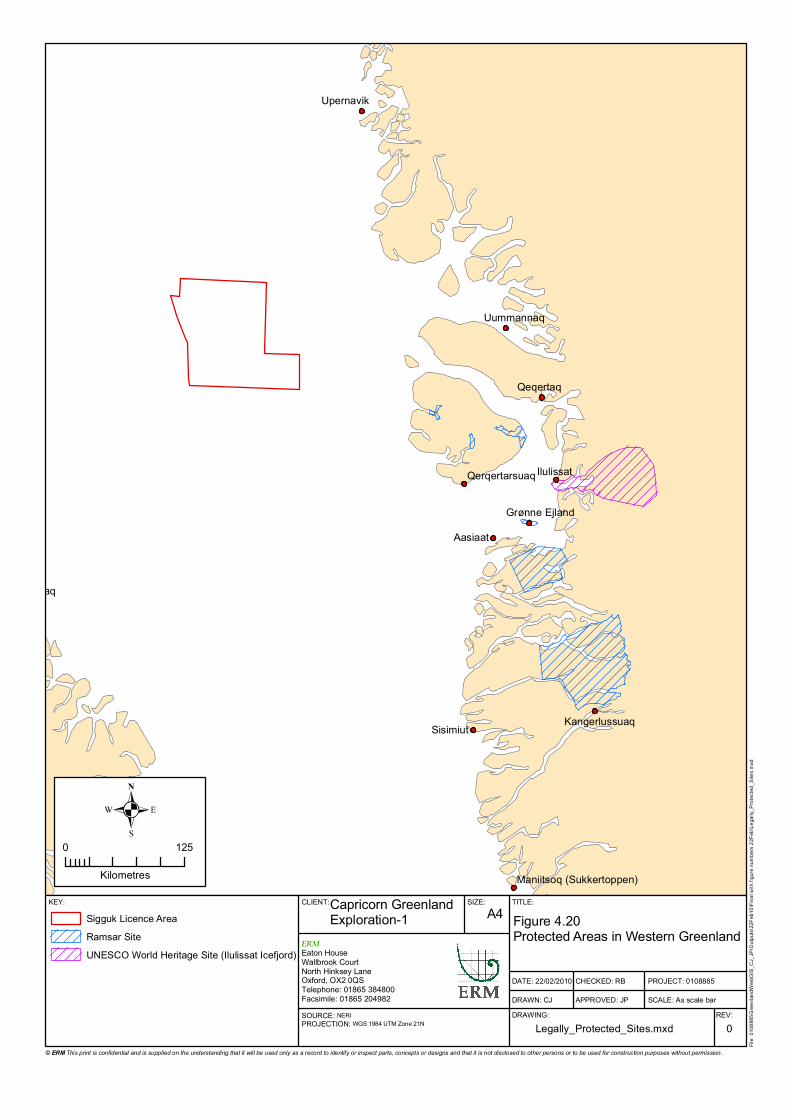
Aasiaat
Qeqertaq
Sisimiut
Nunatsiaq
Upernavik
Uummannaq
Ilulissat
Kangerlussuaq
Grønne Ejland
Qerqertarsuaq
Maniitsoq (Sukkertoppen)CLIENT: SIZE: TITLE:
DATE: 22/02/2010
DRAWN: CJ
CHECKED: RB
APPROVED: JP
PROJECT: 0108885
SCALE: As scale barDRAWING: REV:
KEY: Capricorn Greenland Exploration-1 A4 Figure 4.20
Protected Areas in Western Greenland
Legally_Protected_Sites.mxd 0
Sigguk Licence AreaRamsar SiteUNESCO World Heritage Site (Ilulissat Icefjord)
.0 125
Kilometres
SOURCE: NERIPROJECTION: WGS 1984 UTM Zone 21N
File:
0108
885G
reenla
ndW
estG
IS_C
J_JP
\Outp
uts\22
Feb1
0\Fina
l with
figure
numb
ers 22
Feb\L
egall
y_Pr
otecte
d_Sit
es.m
xd
ERMEaton HouseWallbrook CourtNorth Hinksey LaneOxford, OX2 0QSTelephone: 01865 384800Facsimile: 01865 204982
© ERM This print is confidential and is supplied on the understanding that it will be used only as a record to identify or inspect parts, concepts or designs and that it is not disclosed to other persons or to be used for construction purposes without permission.
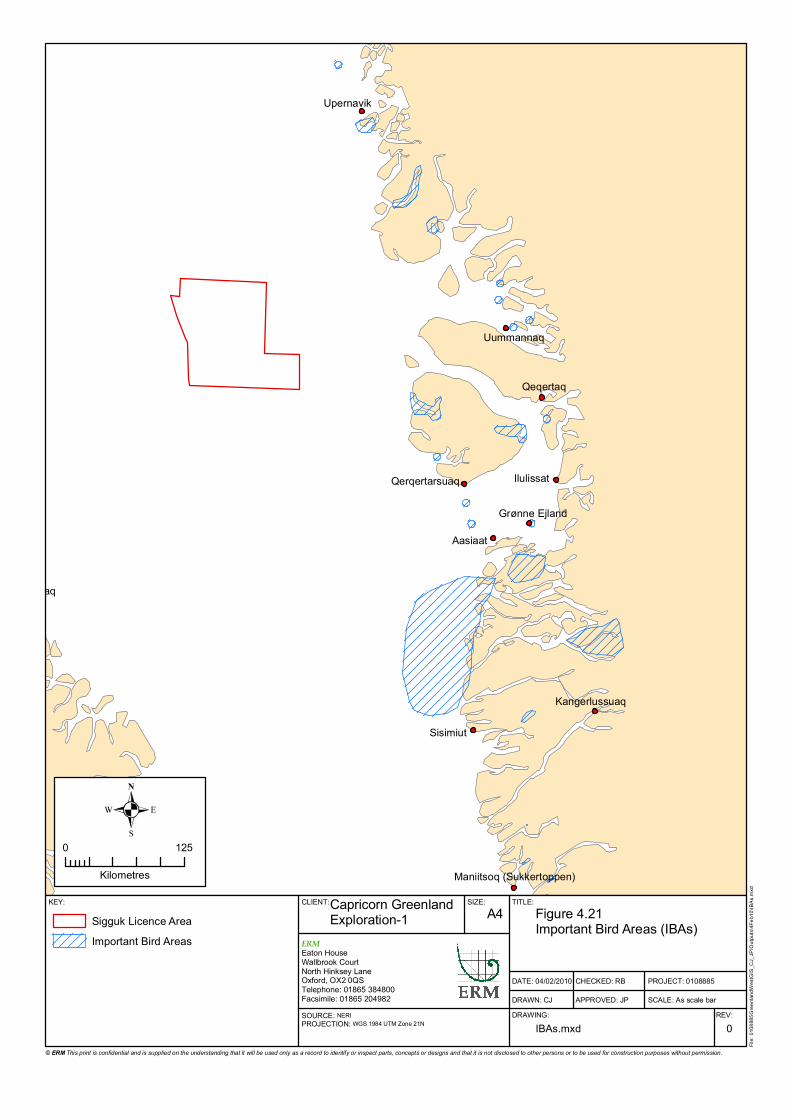
Aasiaat
Qeqertaq
Sisimiut
Nunatsiaq
Upernavik
Uummannaq
Ilulissat
Kangerlussuaq
Grønne Ejland
Qerqertarsuaq
Maniitsoq (Sukkertoppen)CLIENT: SIZE: TITLE:
DATE: 04/02/2010
DRAWN: CJ
CHECKED: RB
APPROVED: JP
PROJECT: 0108885
SCALE: As scale barDRAWING: REV:
KEY: Capricorn Greenland Exploration-1 A4 Figure 4.21
Important Bird Areas (IBAs)
IBAs.mxd 0
Sigguk Licence AreaImportant Bird Areas
.0 125
Kilometres
SOURCE: NERIPROJECTION: WGS 1984 UTM Zone 21N
File:
0108
885G
reenla
ndW
estG
IS_C
J_JP
\Outp
uts\4F
eb10
\IBAs
.mxd
ERMEaton HouseWallbrook CourtNorth Hinksey LaneOxford, OX2 0QSTelephone: 01865 384800Facsimile: 01865 204982
© ERM This print is confidential and is supplied on the understanding that it will be used only as a record to identify or inspect parts, concepts or designs and that it is not disclosed to other persons or to be used for construction purposes without permission.
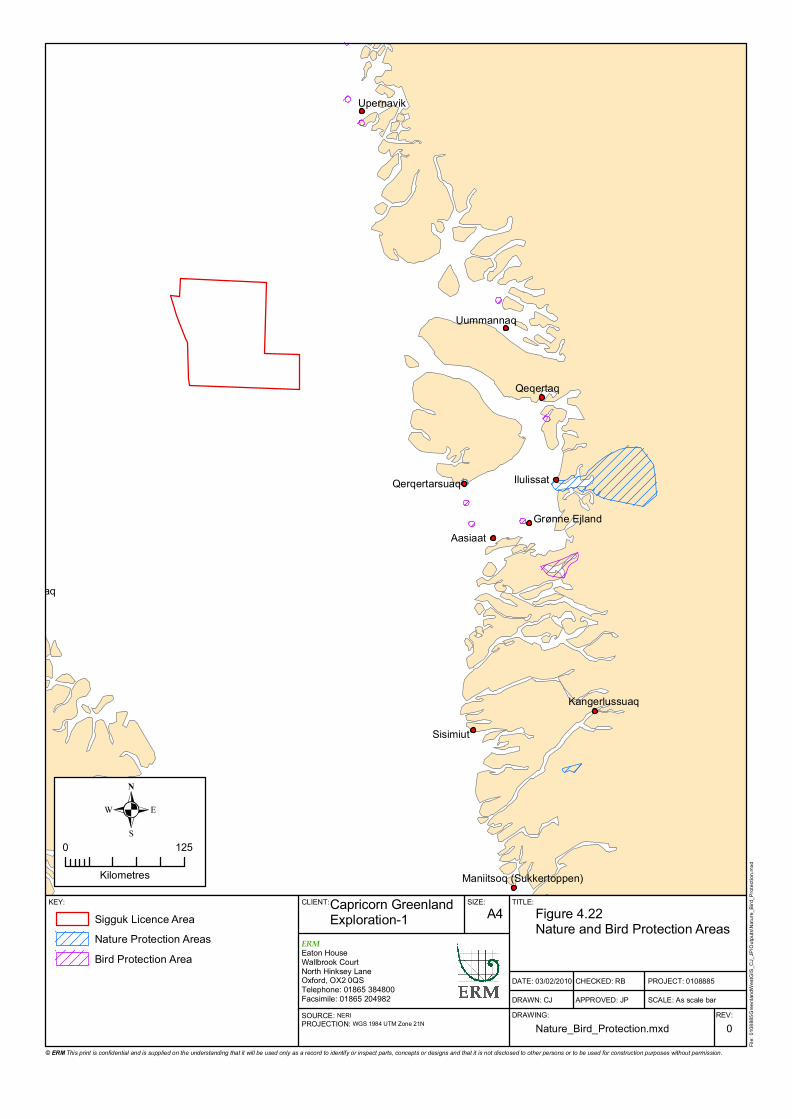
Aasiaat
Qeqertaq
Sisimiut
Nunatsiaq
Upernavik
Uummannaq
Ilulissat
Kangerlussuaq
Grønne Ejland
Qerqertarsuaq
Maniitsoq (Sukkertoppen)CLIENT: SIZE: TITLE:
DATE: 03/02/2010
DRAWN: CJ
CHECKED: RB
APPROVED: JP
PROJECT: 0108885
SCALE: As scale barDRAWING: REV:
KEY: Capricorn Greenland Exploration-1 A4 Figure 4.22
Nature and Bird Protection Areas
Nature_Bird_Protection.mxd 0
Sigguk Licence AreaNature Protection AreasBird Protection Area
.0 125
Kilometres
SOURCE: NERIPROJECTION: WGS 1984 UTM Zone 21N
File:
0108
885G
reenla
ndW
estG
IS_C
J_JP
\Outp
uts\N
ature_
Bird_
Prote
ction
.mxd
ERMEaton HouseWallbrook CourtNorth Hinksey LaneOxford, OX2 0QSTelephone: 01865 384800Facsimile: 01865 204982
© ERM This print is confidential and is supplied on the understanding that it will be used only as a record to identify or inspect parts, concepts or designs and that it is not disclosed to other persons or to be used for construction purposes without permission.
ENVIRONMENTAL RESOURCES MANAGEMENT CAPRICORN GREENLAND EXPLORATION 1
5-1
5 PROJECT DESCRIPTION
5.1 PROJECT OVERVIEW
Capricorn Greenland Exploration 1 (“Capricorn”), a subsidiary of Cairn Energy (“Cairn”), is planning to undertake an exploration drilling programme in the Sigguk exclusive licence 2008/10 (Sigguk Block), Disko West Area offshore West Greenland in the summer of 2010 (see Figure 5.1). This follows a 2D Seismic programme undertaken in 2008 and further geophysical survey and environmental monitoring programmes completed in 2009. The Disko West Area includes the north-eastern part of the Davis Strait and the south-eastern part of Baffin Bay, with Disko Island as the most prominent landscape on the Greenland coast. This area is a part of the Arctic Region, known for harsh weather conditions and drift ice. The Sigguk Block is located over 100 km from the closest point of the west Greenland coast in water depths ranging from approximately 250 to 1,800 m. The block, in which Capricorn holds a 77.5% working interest, comprises the northern part of Capricorn’s Disko West License, which also includes a 77.5% working interest in the Eqqua Block (Block 3) located immediately to the south of Sigguk. Cairn Energy, through its exploration subsidiary Capricorn, has secured a working interest in a total of eight exploration licences off the south and west coasts of Greenland, although the current drilling programme and the remit of this EIA is concerned solely with the planned exploration programme in Block 1, Sigguk. The drilling programme is planned to take place between June and October 2010, with a two month contingency period built into the schedule over November and December for relief well drilling if required. If the operations proceed according to plan, the first drill unit will mobilise to Greenlandic waters in June and will demobilise following completion of all operations before the end of October the same year. The drilling programme itself will employ a range of cutting-edge technology and operating standards to meet the challenges of drilling in the offshore arctic environment. Two mobile offshore drill units (MODUs) will be employed in order to provide a high degree of operational and safety contingency. A range of vessels will be employed to provide support and emergency cover for the operations, including supply boats, support vessels and ice breakers. Ongoing consultation with the public and stakeholders will also be carried out to ensure the local population remains fully informed and has the opportunity to engage during the planning process.

Figure 5.1 Project Location
Hydrocarbon Licence Blocks Offshore Greenland (BMP, 2010)
Block 1 “Sigguk” shown shaded in blue (BMP, 2010)
ENVIRONMENTAL RESOURCES MANAGEMENT CAPRICORN GREENLAND EXPLORATION 1
5-2
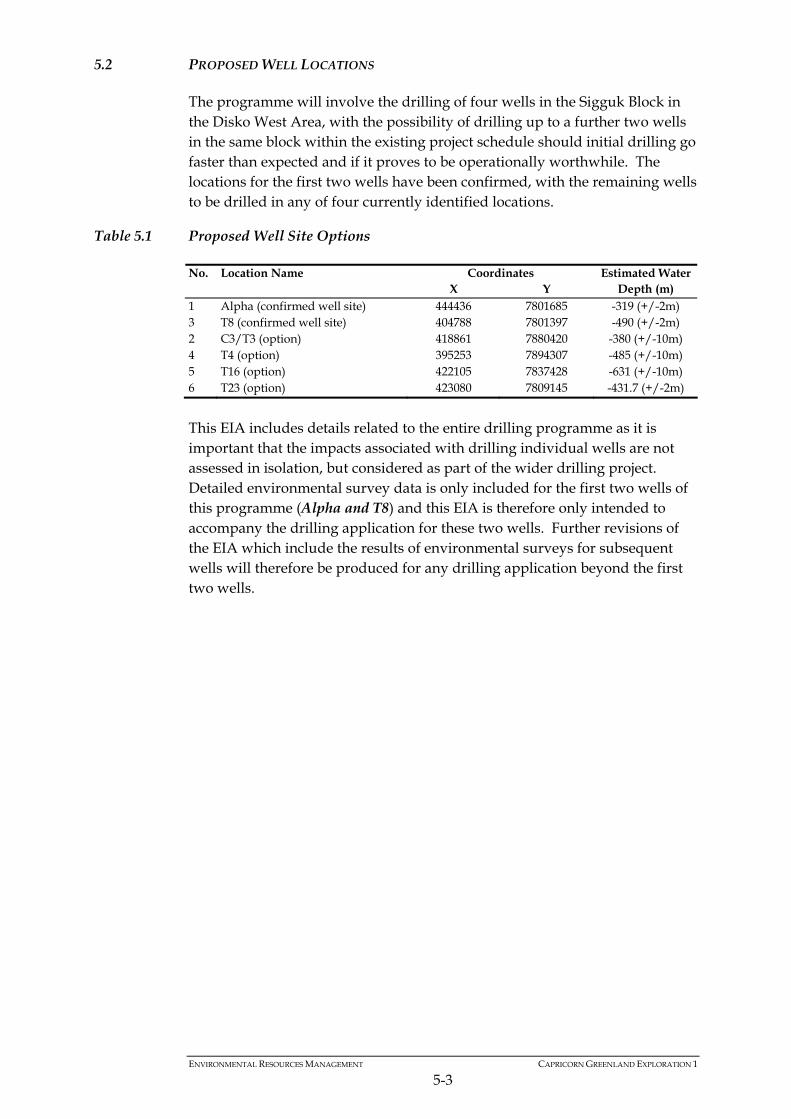
ENVIRONMENTAL RESOURCES MANAGEMENT CAPRICORN GREENLAND EXPLORATION 1
5-3
5.2 PROPOSED WELL LOCATIONS
The programme will involve the drilling of four wells in the Sigguk Block in the Disko West Area, with the possibility of drilling up to a further two wells in the same block within the existing project schedule should initial drilling go faster than expected and if it proves to be operationally worthwhile. The locations for the first two wells have been confirmed, with the remaining wells to be drilled in any of four currently identified locations.
Table 5.1 Proposed Well Site Options
Coordinates No. Location Name X Y
Estimated Water Depth (m)
1 Alpha (confirmed well site) 444436 7801685 -319 (+/-2m) 3 T8 (confirmed well site) 404788 7801397 -490 (+/-2m) 2 C3/T3 (option) 418861 7880420 -380 (+/-10m) 4 T4 (option) 395253 7894307 -485 (+/-10m) 5 T16 (option) 422105 7837428 -631 (+/-10m) 6 T23 (option) 423080 7809145 -431.7 (+/-2m)
This EIA includes details related to the entire drilling programme as it is important that the impacts associated with drilling individual wells are not assessed in isolation, but considered as part of the wider drilling project. Detailed environmental survey data is only included for the first two wells of this programme (Alpha and T8) and this EIA is therefore only intended to accompany the drilling application for these two wells. Further revisions of the EIA which include the results of environmental surveys for subsequent wells will therefore be produced for any drilling application beyond the first two wells.
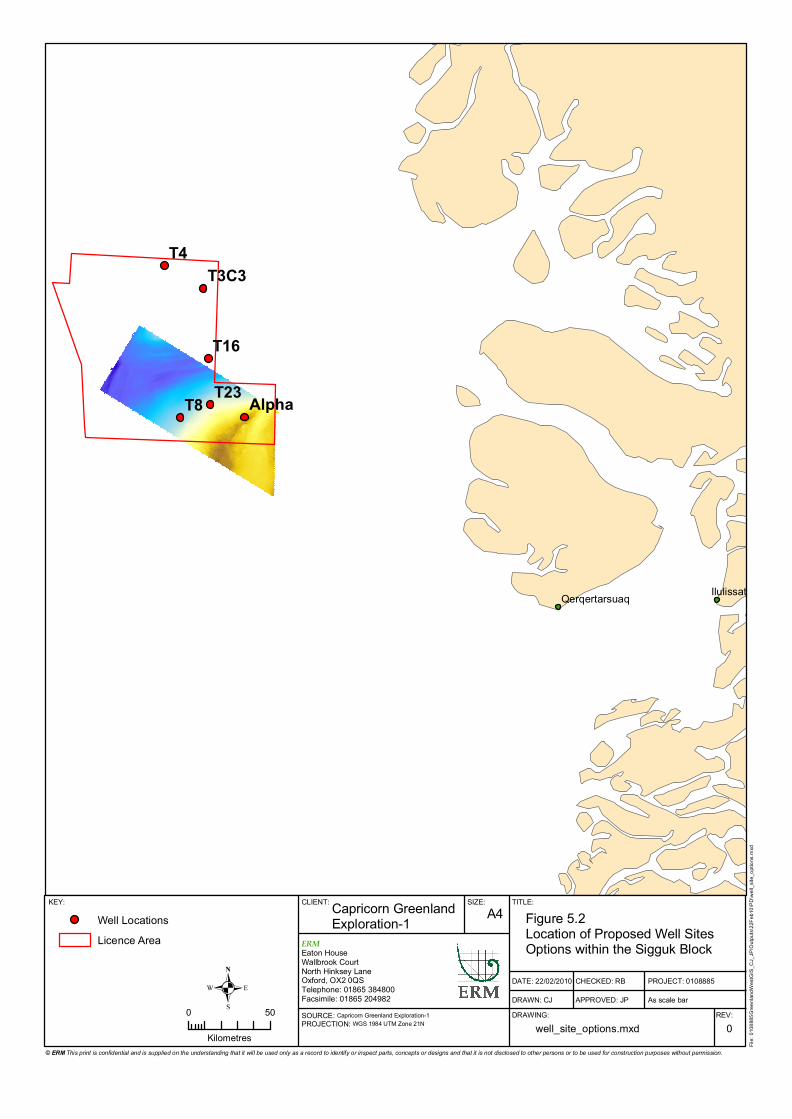
T4
T8 T23
T16
T3C3
Alpha
IlulissatQerqertarsuaq
CLIENT: SIZE: TITLE:
DATE: 22/02/2010
DRAWN: CJ
CHECKED: RB
APPROVED: JP
PROJECT: 0108885
As scale barDRAWING: REV:
KEY: Capricorn Greenland Exploration-1 A4 Figure 5.2
Location of Proposed Well Sites Options within the Sigguk Block
well_site_options.mxd 0
Well LocationsLicence Area
SOURCE: Capricorn Greenland Exploration-1PROJECTION: WGS 1984 UTM Zone 21N
File:
0108
885G
reenla
ndW
estG
IS_C
J_JP
\Outp
uts\22
Feb1
0\PD\
well_
site_
optio
ns.m
xd
ERMEaton HouseWallbrook CourtNorth Hinksey LaneOxford, OX2 0QSTelephone: 01865 384800Facsimile: 01865 204982.0 50
Kilometres© ERM This print is confidential and is supplied on the understanding that it will be used only as a record to identify or inspect parts, concepts or designs and that it is not disclosed to other persons or to be used for construction purposes without permission.
ENVIRONMENTAL RESOURCES MANAGEMENT CAPRICORN GREENLAND EXPLORATION 1
5-5
5.3 PROPOSED PROJECT SCHEDULE
The proposed drilling programme will utilise a two rig strategy, whereby two separate MODUs are utilised to drill the proposed wells during the overall project window. The first drill unit will mobilise and begin operations ahead of the second unit, with both units expected to be operating in parallel within the project area for around three months. The first MODU will be a drillship (the “Stena Forth”), which is planned to mobilise to the region in June 2010 to commence drilling operations. The second MODU will be a semi-submersible drill rig (the “Stena Don”), which will be mobilised to the region to commence drilling in July 2010. Drilling is anticipated to be completed by the end of October 2010, with a 50 day relief well window as a contingency. A broad outline of the proposed schedule is presented in Figure 5.3 below.
Figure 5.3 Outline Drilling Schedule
2010 May June July August Sept Oct Nov Dec
Mobilisation
Drilling (4 wells)
Relief Well
5.4 PROPOSED DRILL UNITS
5.4.1 Drillship (Stena Forth)
The drillship to be utilised is the Stena Forth which is designed to work in broken ice and is illustrated in Figure 5.4 below. The drillship is a maritime vessel which includes two drilling well centres and the latest station-keeping equipment. The vessel is capable of operating in deep water. The Stena Forth will mobilise from its previous operating location in the Gulf of Mexico to either Invergordon on the north east coast of Scotland or St Johns on the east coast of Newfoundland where it will be resupplied and loaded with materials for the drilling campaign, before mobilising under its own power to Greenlandic waters.
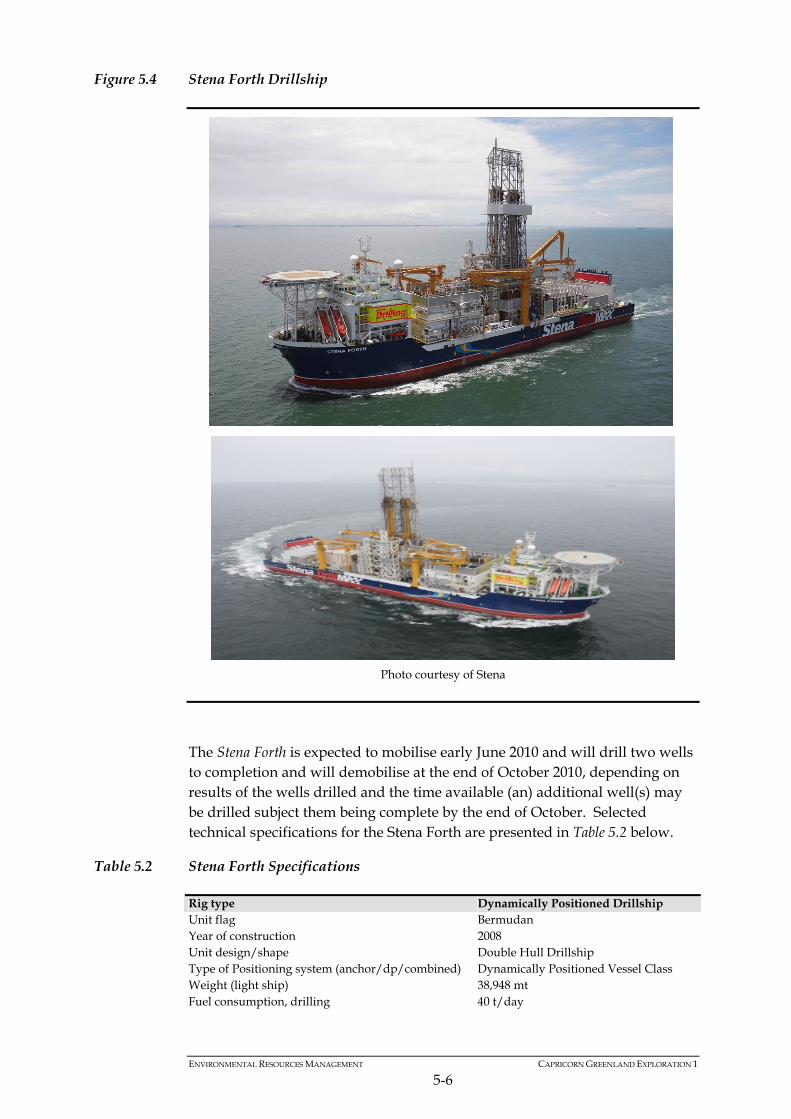
Figure 5.4 Stena Forth Drillship
Photo courtesy of Stena
The Stena Forth is expected to mobilise early June 2010 and will drill two wells to completion and will demobilise at the end of October 2010, depending on results of the wells drilled and the time available (an) additional well(s) may be drilled subject them being complete by the end of October. Selected technical specifications for the Stena Forth are presented in Table 5.2 below.
Table 5.2 Stena Forth Specifications
Rig type Dynamically Positioned Drillship Unit flag Bermudan Year of construction 2008 Unit design/shape Double Hull Drillship Type of Positioning system (anchor/dp/combined) Dynamically Positioned Vessel Class Weight (light ship) 38,948 mt Fuel consumption, drilling 40 t/day
ENVIRONMENTAL RESOURCES MANAGEMENT CAPRICORN GREENLAND EXPLORATION 1
5-6
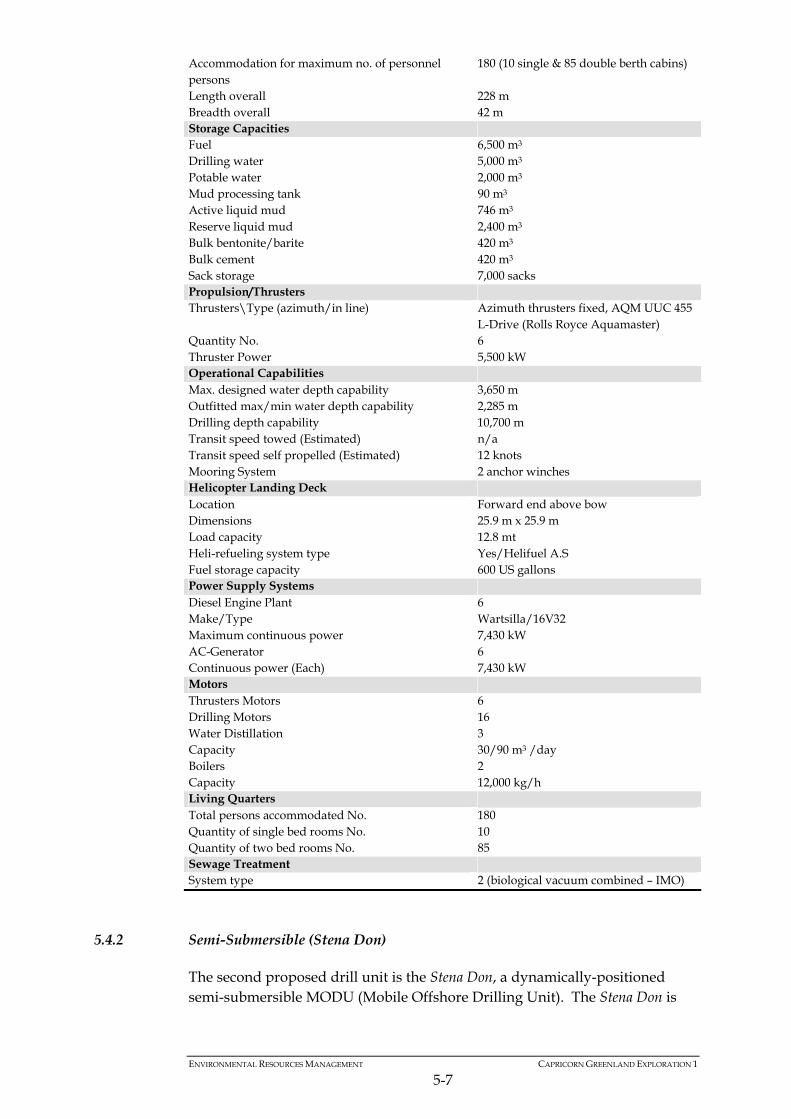
ENVIRONMENTAL RESOURCES MANAGEMENT CAPRICORN GREENLAND EXPLORATION 1
5-7
Accommodation for maximum no. of personnel persons
180 (10 single & 85 double berth cabins)
Length overall 228 m Breadth overall 42 m Storage Capacities Fuel 6,500 m3 Drilling water 5,000 m3 Potable water 2,000 m3 Mud processing tank 90 m3 Active liquid mud 746 m3 Reserve liquid mud 2,400 m3 Bulk bentonite/barite 420 m3 Bulk cement 420 m3 Sack storage 7,000 sacks Propulsion/Thrusters Thrusters\Type (azimuth/in line) Azimuth thrusters fixed, AQM UUC 455
L-Drive (Rolls Royce Aquamaster) Quantity No. 6 Thruster Power 5,500 kW Operational Capabilities Max. designed water depth capability 3,650 m Outfitted max/min water depth capability 2,285 m Drilling depth capability 10,700 m Transit speed towed (Estimated) n/a Transit speed self propelled (Estimated) 12 knots Mooring System 2 anchor winches Helicopter Landing Deck Location Forward end above bow Dimensions 25.9 m x 25.9 m Load capacity 12.8 mt Heli-refueling system type Yes/Helifuel A.S Fuel storage capacity 600 US gallons Power Supply Systems Diesel Engine Plant 6 Make/Type Wartsilla/16V32 Maximum continuous power 7,430 kW AC-Generator 6 Continuous power (Each) 7,430 kW Motors Thrusters Motors 6 Drilling Motors 16 Water Distillation 3 Capacity 30/90 m3 /day Boilers 2 Capacity 12,000 kg/h Living Quarters Total persons accommodated No. 180 Quantity of single bed rooms No. 10 Quantity of two bed rooms No. 85 Sewage Treatment System type 2 (biological vacuum combined – IMO)
5.4.2 Semi-Submersible (Stena Don)
The second proposed drill unit is the Stena Don, a dynamically-positioned semi-submersible MODU (Mobile Offshore Drilling Unit). The Stena Don is
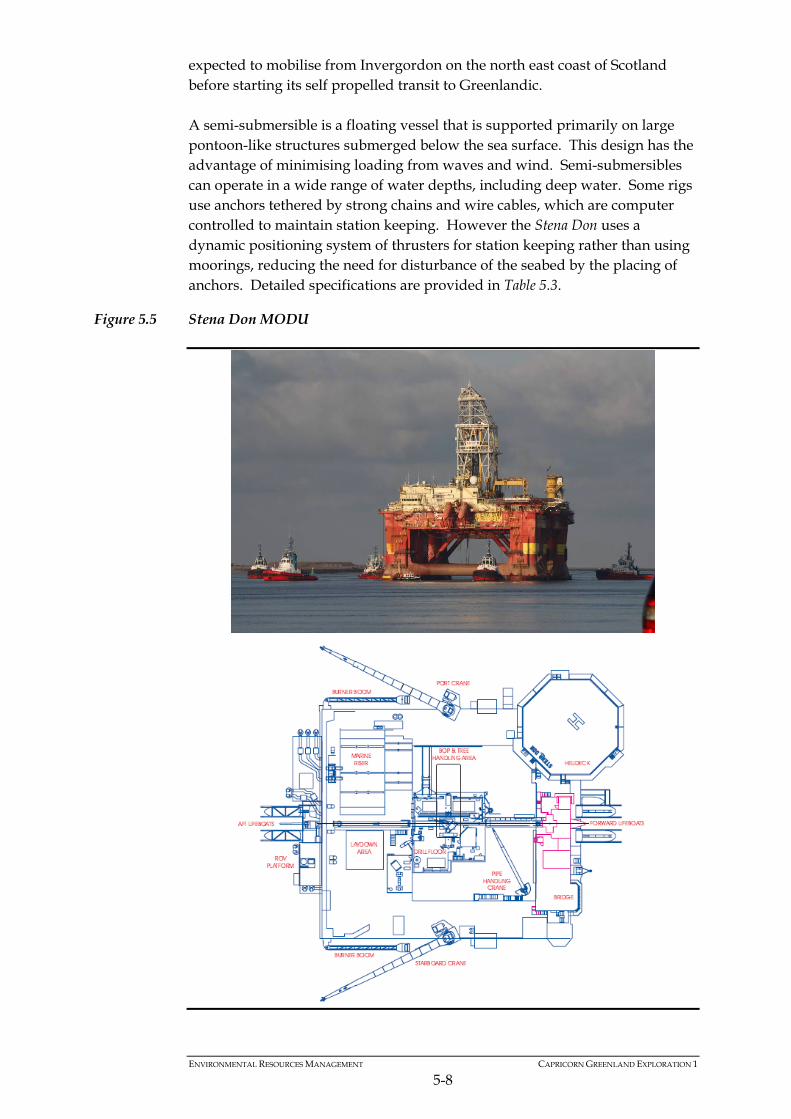
expected to mobilise from Invergordon on the north east coast of Scotland before starting its self propelled transit to Greenlandic. A semi-submersible is a floating vessel that is supported primarily on large pontoon-like structures submerged below the sea surface. This design has the advantage of minimising loading from waves and wind. Semi-submersibles can operate in a wide range of water depths, including deep water. Some rigs use anchors tethered by strong chains and wire cables, which are computer controlled to maintain station keeping. However the Stena Don uses a dynamic positioning system of thrusters for station keeping rather than using moorings, reducing the need for disturbance of the seabed by the placing of anchors. Detailed specifications are provided in Table 5.3.
Figure 5.5 Stena Don MODU
ENVIRONMENTAL RESOURCES MANAGEMENT CAPRICORN GREENLAND EXPLORATION 1
5-8
ENVIRONMENTAL RESOURCES MANAGEMENT CAPRICORN GREENLAND EXPLORATION 1
5-9
Table 5.3 Stena Don MODU Specifications
Rig type Semisubmersible Unit flag Marshall Island Year of construction 2001 Unit design/shape Twin Pontoon, 6 Columns (4 large, 2 small) CS30 Type of Positioning system (anchor/dp/combined) Dynamic Positioned SDP 21/SDP11, Kongsberg, Class 3 Weight (light ship) 17315 - 17,525t Fuel consumption, drilling t/day 40t/day Accommodation for maximum no. of personnel persons
120 + 8 Offices
Length overall 95.5m Breadth overall 69m incl. helideck Storage Capacities Fuel 2611.2 m3 Drilling water 903.5 m3 Potable water 519.2 m3 Mud processing tank 396.6 m3 Active liquid mud 567.0 m3 Reserve liquid mud 396.0 m3 Bulk bentonite/barite 236.5 m3 (4 tanks) Bulk cement 236.5 m3 (4 tanks) Sack storage 2000 sacks Propulsion/Thrusters Thrusters\Type (azimuth/in line) Kamewa Aqua Master Quantity No. 6 Thruster Power 3.200 kW Operational Capabilities Max. designed water depth capability 500 m Outfitted max/min water depth capability 130 m – 500 m Drilling depth capability 27800 ft Transit speed towed (Estimated) 8 knots Transit speed self propelled (Estimated) 6 knots Mooring system N/A - Emergency Anchors only (2) Helicopter Landing Deck Location Port Fwd Corner Dimensions 22.80 m Load capacity Mt 15t Heli-refueling system type Carter Mod. 64200, delivered by Helifuel A/S Fuel storage capacity M3 2 x transportable tanks 720 USG each Power Supply Systems Diesel Engine Plant 9 Make/Type Wartsila type 16v25-3500kW NOx upgraded Maximum continuous power: 3.5 MW AC-Generator 9 Continuous power (Each) kw: 3500 kw Motors Thrusters Motors 6 x 3300 kW Drilling Motors 2 x 740 kW Water Distillation 2 Capacity M3/day: 3 x 30 m3/day Boilers 2 Capacity MW: 2.7 MW Living Quarters Total persons accommodated No. 120 persons Quantity of single bed rooms No. 2 Quantity of two bed rooms No. 50 Sewage Treatment System type Hamworthy, Vacuum
ENVIRONMENTAL RESOURCES MANAGEMENT CAPRICORN GREENLAND EXPLORATION 1
5-10
Since the Stena Don is a dynamically-positioned rig, there is not a requirement for a dedicated anchor handling vessels to moor the rig. Operations support will be provided by a support vessel depending on the available SAR (Search and Rescue) cover on the voyage route.
5.5 RESERVOIR RESOURCES
In the Disko West area offshore western Greenland, a number of leads at both Cretaceous and Tertiary levels have been identified. Additional 2D seismic data was acquired in 2008 to mature the leads to prospect status. The main prospects are identified in the Cretaceous section in Block 1 (Sigguk). A series of large Tertiary fans of probable Miocene age have been identified, and are located in both Blocks 1 and 3. The interpreted Stratigraphy and petroleum systems of the West Greenland Shelf, showing the previous six wells drilled offshore Greenland (in blue) and penetration by onshore wells (in red) is provided in Figure 5.6 below.
5.5.1 Extract of Geological Overview from Geological Survey of Denmark and Greenland (GEUS): www.GEUS.dk.
The margin of West Greenland was formed by extensional opening of the Labrador Sea in late Mesozoic – early Cenozoic time. A complex of linked rift basins stretch from the Labrador Sea to northern Baffin Bay (1). Sedimentary basins, containing up to 8–10 km of sediments, are found primarily between 63°N and 68°N. The oldest sediments in the basins may be of Early Cretaceous age (2), and seismic data indicates at least two rifting events, the first in the Early Cretaceous and the second in the Campanian–Paleocene which was probably associated with the start of sea-floor spreading in the Labrador Sea. Sea-floor spreading in the Labrador Sea was transferred to Baffin Bay to the north along a complex strike-slip fault system, the Ungava Fault Zone. Initial opening of the Labrador Sea was accompanied by voluminous volcanism, probably associated with the impact of the Iceland plume. The largest area of volcanic rocks is found north of 68°N and it extends onshore into the Nuussuaq Basin. Other areas of volcanism are found farther south on the Nukik Platform and on the Hecla and Maniitsoq Rises. Thermal subsidence of the basin continued after cessation of sea-floor spreading in the Labrador Sea, probably in Middle or Late Eocene time, but there appears to have been an episode of uplift of the basin margin in the Neogene. The northeastern part of the Sisimiut Basin is especially affected by this uplift, and the onshore Nuussuaq Basin probably owes its present-day exposure to it.
(1) 1 Chalmers, J.A. & Laursen, K.H. 1995. Labrador Sea: the extent of continental crust and the timing of the start of sea-floor spreading. Marine and Petroleum Geology, 12, 205–217
(2) 2 Chalmers, J.A., Dahl-Jensen, T., Bate, K.J. & Whittaker, R.C. 1995. Geology and petroleum prospectivity of the region offshore southern West Greenland - a summary. Rapport Grønlands Geologiske Undersøgelse, 165, 13–21.
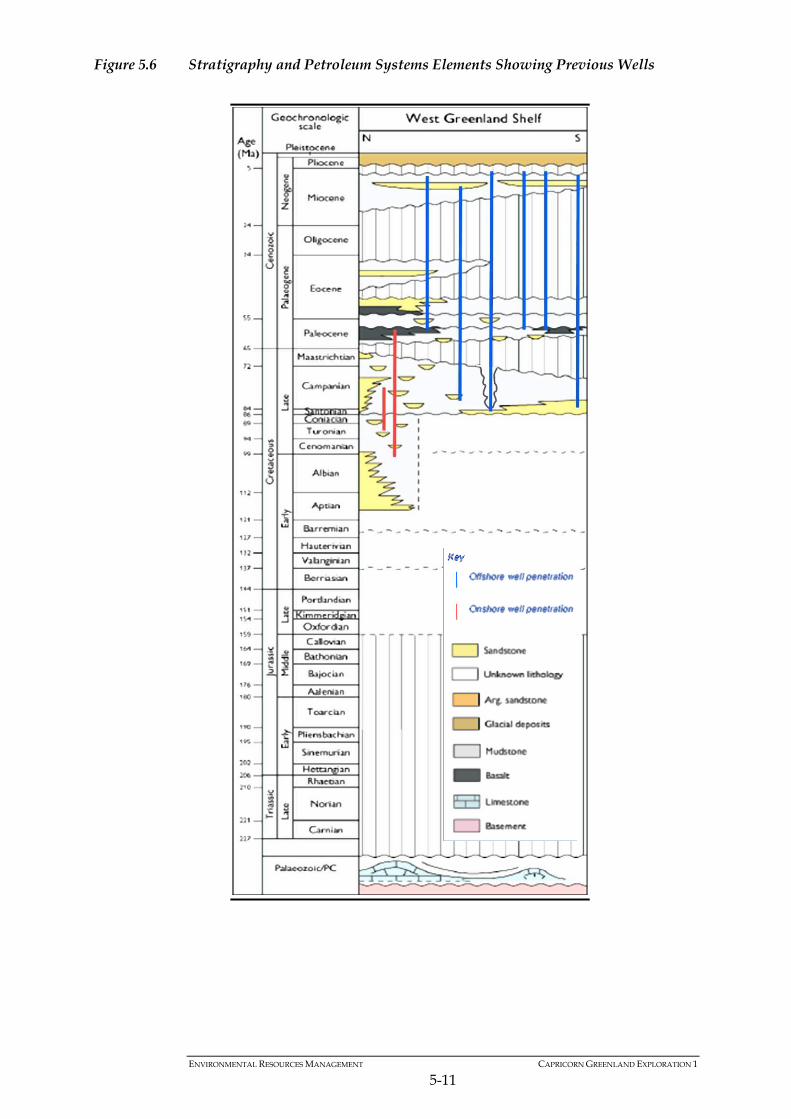
Figure 5.6 Stratigraphy and Petroleum Systems Elements Showing Previous Wells
ENVIRONMENTAL RESOURCES MANAGEMENT CAPRICORN GREENLAND EXPLORATION 1
5-11
ENVIRONMENTAL RESOURCES MANAGEMENT CAPRICORN GREENLAND EXPLORATION 1
5-12
5.6 RIG MOBILISATION
The drillship will be mobilised in June 2010. Icebreaker vessels will be utilised to permit entry of the drillship onto location offshore west Greenland to drill two wells to completion. The semisubmersible rig will be mobilised at the end of June and is expected to start drilling the first of two wells by the first week in July. All four of the wells to be drilled are expected to be completed by the third week in October.
5.7 DRILLING AND WELL CONSTRUCTION
It is planned to drill four wells to approximately 3,000 – 4,000 m based on either a Tertiary or a Cretaceous target lead (with the possibility of a further two wells in the same area and based on the same models should time allow). Figure 5.7 illustrates the likely casing configuration and depth of both Tertiary and Cretaceous Wells.
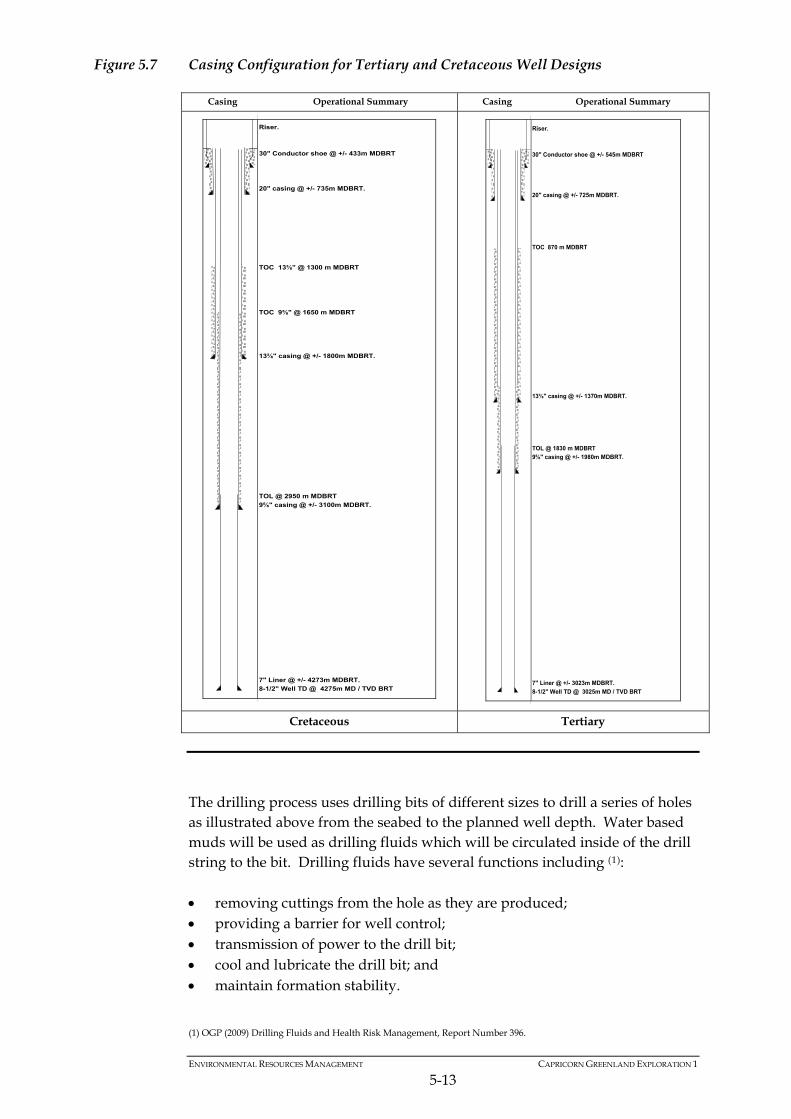
Figure 5.7 Casing Configuration for Tertiary and Cretaceous Well Designs
Casing Operational Summary Casing Operational Summary
Riser.
30" Conductor shoe @ +/- 433m MDBRT
20" casing @ +/- 735m MDBRT.
TOC 13⅜" @ 1300 m MDBRT
TOC 9⅝" @ 1650 m MDBRT
13⅜" casing @ +/- 1800m MDBRT.
TOL @ 2950 m MDBRT
9⅝" casing @ +/- 3100m MDBRT.
7" Liner @ +/- 4273m MDBRT.
8-1/2" Well TD @ 4275m MD / TVD BRT
Riser.
30" Conductor shoe @ +/- 545m MDBRT
20" casing @ +/- 725m MDBRT.
TOC 870 m MDBRT
13⅜" casing @ +/- 1370m MDBRT.
TOL @ 1830 m MDBRT
9⅝" casing @ +/- 1980m MDBRT.
7" Liner @ +/- 3023m MDBRT.
8-1/2" Well TD @ 3025m MD / TVD BRT
Cretaceous Tertiary
The drilling process uses drilling bits of different sizes to drill a series of holes as illustrated above from the seabed to the planned well depth. Water based muds will be used as drilling fluids which will be circulated inside of the drill string to the bit. Drilling fluids have several functions including (1): removing cuttings from the hole as they are produced; providing a barrier for well control; transmission of power to the drill bit; cool and lubricate the drill bit; and maintain formation stability.
ENVIRONMENTAL RESOURCES MANAGEMENT CAPRICORN GREENLAND EXPLORATION 1
5-13
(1) OGP (2009) Drilling Fluids and Health Risk Management, Report Number 396.
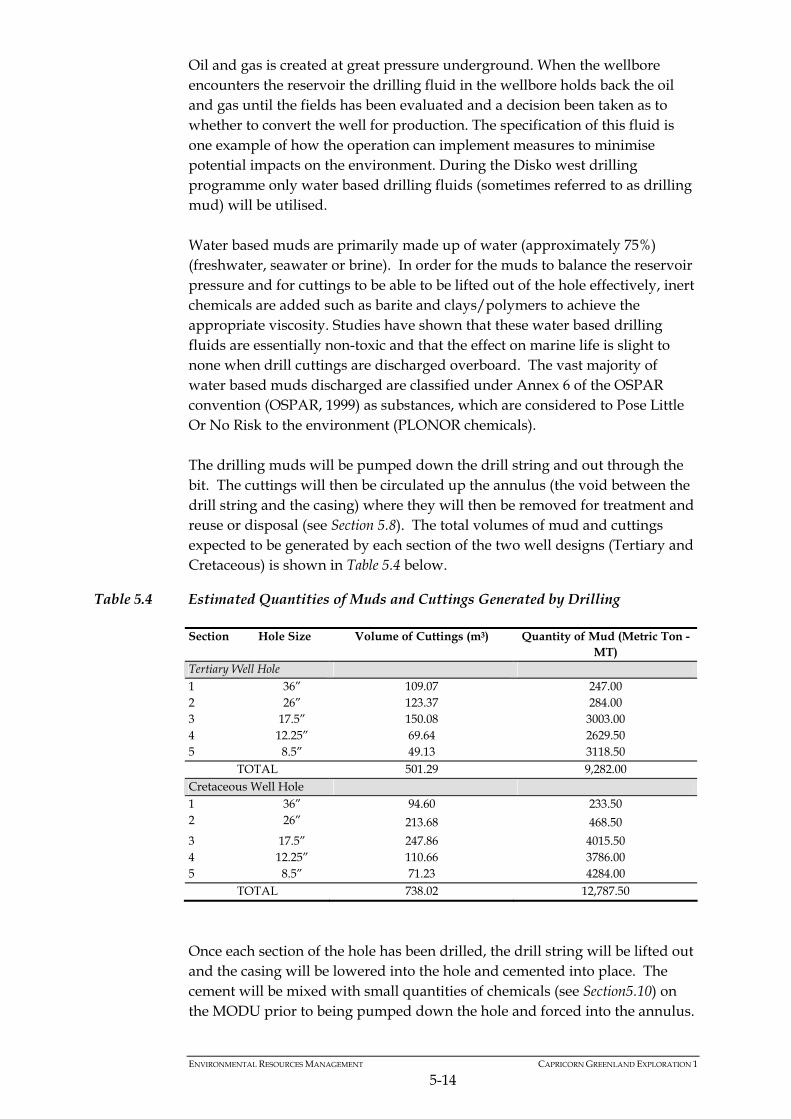
ENVIRONMENTAL RESOURCES MANAGEMENT CAPRICORN GREENLAND EXPLORATION 1
5-14
Oil and gas is created at great pressure underground. When the wellbore encounters the reservoir the drilling fluid in the wellbore holds back the oil and gas until the fields has been evaluated and a decision been taken as to whether to convert the well for production. The specification of this fluid is one example of how the operation can implement measures to minimise potential impacts on the environment. During the Disko west drilling programme only water based drilling fluids (sometimes referred to as drilling mud) will be utilised. Water based muds are primarily made up of water (approximately 75%) (freshwater, seawater or brine). In order for the muds to balance the reservoir pressure and for cuttings to be able to be lifted out of the hole effectively, inert chemicals are added such as barite and clays/polymers to achieve the appropriate viscosity. Studies have shown that these water based drilling fluids are essentially non-toxic and that the effect on marine life is slight to none when drill cuttings are discharged overboard. The vast majority of water based muds discharged are classified under Annex 6 of the OSPAR convention (OSPAR, 1999) as substances, which are considered to Pose Little Or No Risk to the environment (PLONOR chemicals). The drilling muds will be pumped down the drill string and out through the bit. The cuttings will then be circulated up the annulus (the void between the drill string and the casing) where they will then be removed for treatment and reuse or disposal (see Section 5.8). The total volumes of mud and cuttings expected to be generated by each section of the two well designs (Tertiary and Cretaceous) is shown in Table 5.4 below.
Table 5.4 Estimated Quantities of Muds and Cuttings Generated by Drilling
Section Hole Size Volume of Cuttings (m3) Quantity of Mud (Metric Ton - MT)
Tertiary Well Hole 1 36” 109.07 247.00 2 26” 123.37 284.00 3 17.5” 150.08 3003.00 4 12.25” 69.64 2629.50 5 8.5” 49.13 3118.50
TOTAL 501.29 9,282.00 Cretaceous Well Hole 1 36” 94.60 233.50 2 26” 213.68 468.50
3 17.5” 247.86 4015.50 4 12.25” 110.66 3786.00 5 8.5” 71.23 4284.00
TOTAL 738.02 12,787.50
Once each section of the hole has been drilled, the drill string will be lifted out and the casing will be lowered into the hole and cemented into place. The cement will be mixed with small quantities of chemicals (see Section5.10) on the MODU prior to being pumped down the hole and forced into the annulus.
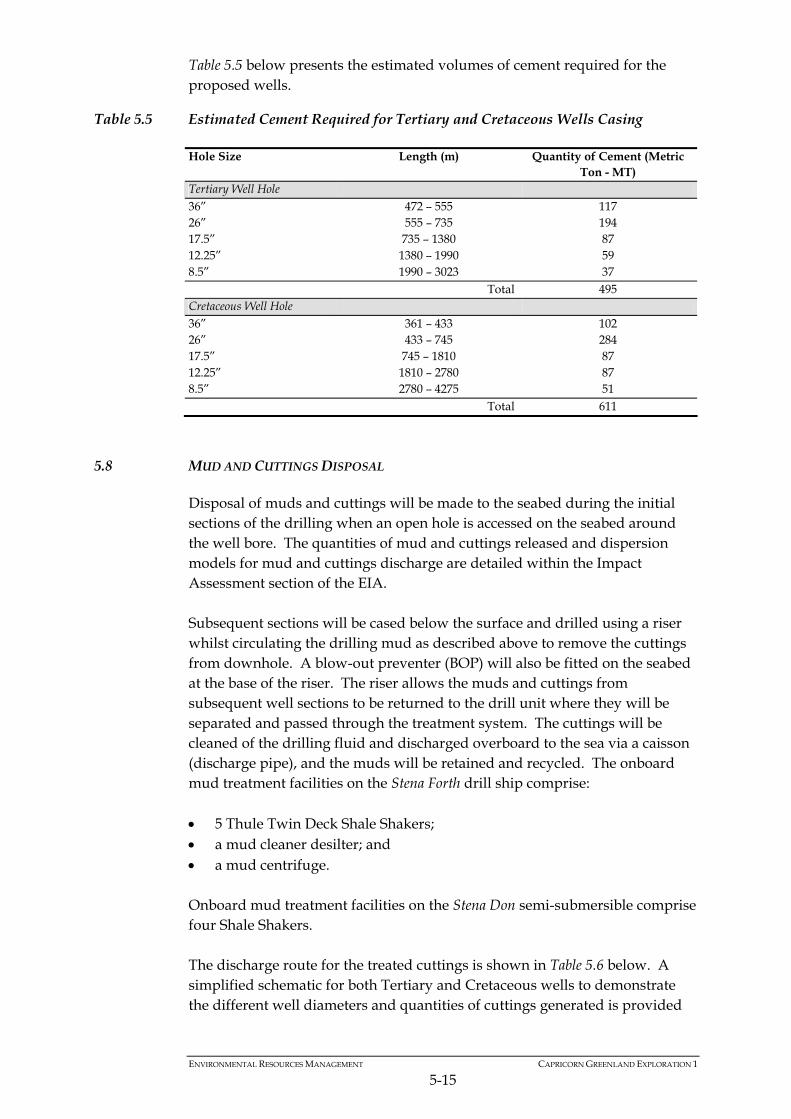
ENVIRONMENTAL RESOURCES MANAGEMENT CAPRICORN GREENLAND EXPLORATION 1
5-15
Table 5.5 below presents the estimated volumes of cement required for the proposed wells.
Table 5.5 Estimated Cement Required for Tertiary and Cretaceous Wells Casing
Hole Size Length (m) Quantity of Cement (Metric Ton - MT)
Tertiary Well Hole 36” 472 – 555 117 26” 555 – 735 194 17.5” 735 – 1380 87 12.25” 1380 – 1990 59 8.5” 1990 – 3023 37 Total 495 Cretaceous Well Hole 36” 361 – 433 102 26” 433 – 745 284 17.5” 745 – 1810 87 12.25” 1810 – 2780 87 8.5” 2780 – 4275 51 Total 611
5.8 MUD AND CUTTINGS DISPOSAL
Disposal of muds and cuttings will be made to the seabed during the initial sections of the drilling when an open hole is accessed on the seabed around the well bore. The quantities of mud and cuttings released and dispersion models for mud and cuttings discharge are detailed within the Impact Assessment section of the EIA. Subsequent sections will be cased below the surface and drilled using a riser whilst circulating the drilling mud as described above to remove the cuttings from downhole. A blow-out preventer (BOP) will also be fitted on the seabed at the base of the riser. The riser allows the muds and cuttings from subsequent well sections to be returned to the drill unit where they will be separated and passed through the treatment system. The cuttings will be cleaned of the drilling fluid and discharged overboard to the sea via a caisson (discharge pipe), and the muds will be retained and recycled. The onboard mud treatment facilities on the Stena Forth drill ship comprise: 5 Thule Twin Deck Shale Shakers; a mud cleaner desilter; and a mud centrifuge. Onboard mud treatment facilities on the Stena Don semi-submersible comprise four Shale Shakers. The discharge route for the treated cuttings is shown in Table 5.6 below. A simplified schematic for both Tertiary and Cretaceous wells to demonstrate the different well diameters and quantities of cuttings generated is provided
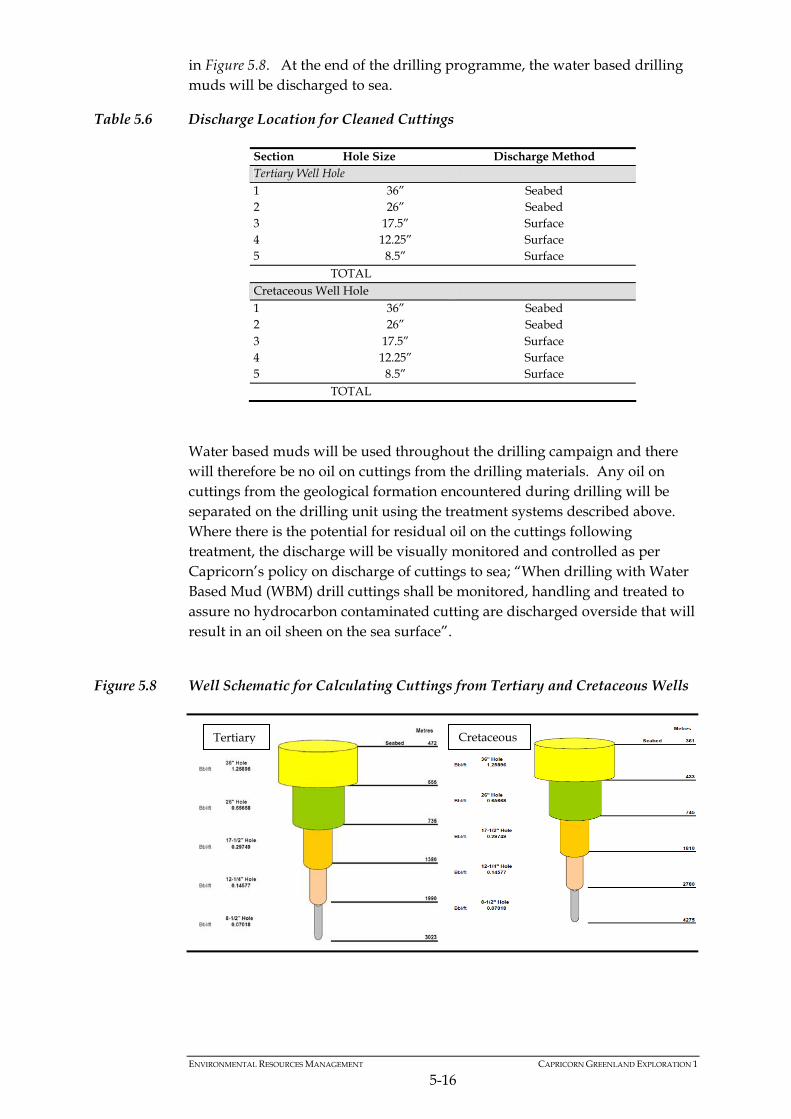
in Figure 5.8. At the end of the drilling programme, the water based drilling muds will be discharged to sea.
Table 5.6 Discharge Location for Cleaned Cuttings
Section Hole Size Discharge Method Tertiary Well Hole 1 36” Seabed 2 26” Seabed 3 17.5” Surface 4 12.25” Surface 5 8.5” Surface
TOTAL Cretaceous Well Hole 1 36” Seabed 2 26” Seabed 3 17.5” Surface 4 12.25” Surface 5 8.5” Surface
TOTAL
Water based muds will be used throughout the drilling campaign and there will therefore be no oil on cuttings from the drilling materials. Any oil on cuttings from the geological formation encountered during drilling will be separated on the drilling unit using the treatment systems described above. Where there is the potential for residual oil on the cuttings following treatment, the discharge will be visually monitored and controlled as per Capricorn’s policy on discharge of cuttings to sea; “When drilling with Water Based Mud (WBM) drill cuttings shall be monitored, handling and treated to assure no hydrocarbon contaminated cutting are discharged overside that will result in an oil sheen on the sea surface”.
Figure 5.8 Well Schematic for Calculating Cuttings from Tertiary and Cretaceous Wells
Cretaceous Tertiary
ENVIRONMENTAL RESOURCES MANAGEMENT CAPRICORN GREENLAND EXPLORATION 1
5-16
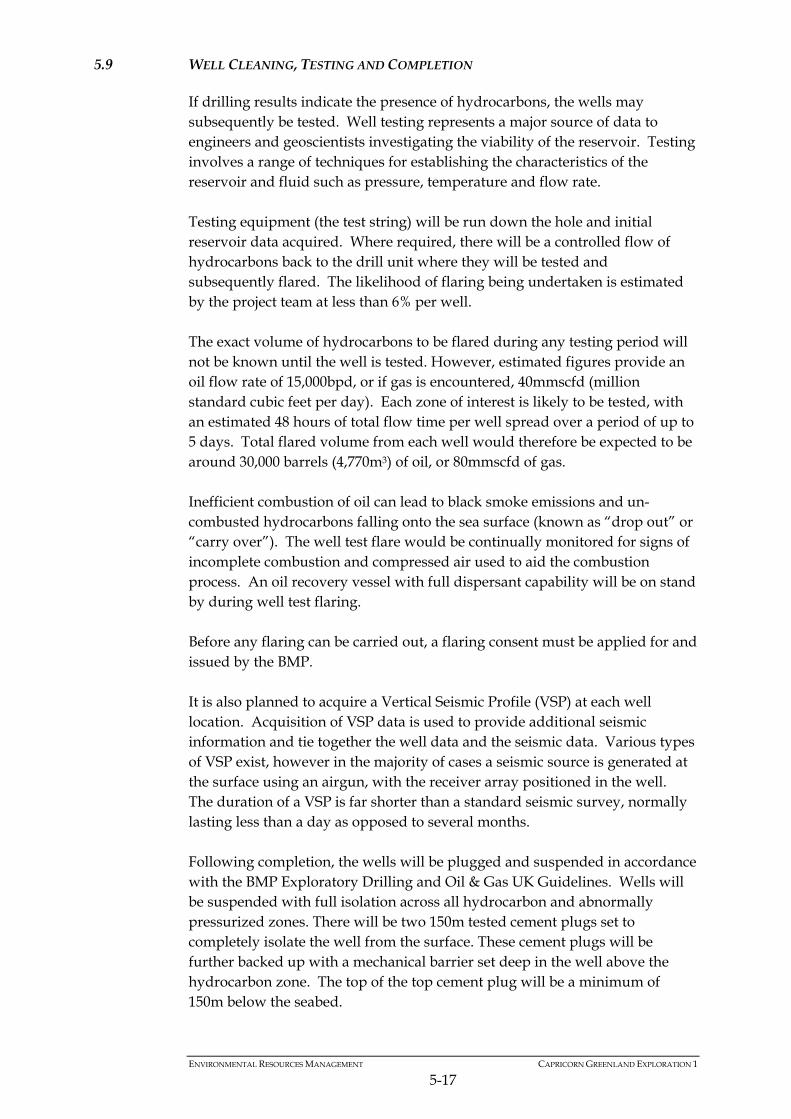
ENVIRONMENTAL RESOURCES MANAGEMENT CAPRICORN GREENLAND EXPLORATION 1
5-17
5.9 WELL CLEANING, TESTING AND COMPLETION
If drilling results indicate the presence of hydrocarbons, the wells may subsequently be tested. Well testing represents a major source of data to engineers and geoscientists investigating the viability of the reservoir. Testing involves a range of techniques for establishing the characteristics of the reservoir and fluid such as pressure, temperature and flow rate. Testing equipment (the test string) will be run down the hole and initial reservoir data acquired. Where required, there will be a controlled flow of hydrocarbons back to the drill unit where they will be tested and subsequently flared. The likelihood of flaring being undertaken is estimated by the project team at less than 6% per well. The exact volume of hydrocarbons to be flared during any testing period will not be known until the well is tested. However, estimated figures provide an oil flow rate of 15,000bpd, or if gas is encountered, 40mmscfd (million standard cubic feet per day). Each zone of interest is likely to be tested, with an estimated 48 hours of total flow time per well spread over a period of up to 5 days. Total flared volume from each well would therefore be expected to be around 30,000 barrels (4,770m3) of oil, or 80mmscfd of gas. Inefficient combustion of oil can lead to black smoke emissions and un-combusted hydrocarbons falling onto the sea surface (known as “drop out” or “carry over”). The well test flare would be continually monitored for signs of incomplete combustion and compressed air used to aid the combustion process. An oil recovery vessel with full dispersant capability will be on stand by during well test flaring. Before any flaring can be carried out, a flaring consent must be applied for and issued by the BMP. It is also planned to acquire a Vertical Seismic Profile (VSP) at each well location. Acquisition of VSP data is used to provide additional seismic information and tie together the well data and the seismic data. Various types of VSP exist, however in the majority of cases a seismic source is generated at the surface using an airgun, with the receiver array positioned in the well. The duration of a VSP is far shorter than a standard seismic survey, normally lasting less than a day as opposed to several months. Following completion, the wells will be plugged and suspended in accordance with the BMP Exploratory Drilling and Oil & Gas UK Guidelines. Wells will be suspended with full isolation across all hydrocarbon and abnormally pressurized zones. There will be two 150m tested cement plugs set to completely isolate the well from the surface. These cement plugs will be further backed up with a mechanical barrier set deep in the well above the hydrocarbon zone. The top of the top cement plug will be a minimum of 150m below the seabed.
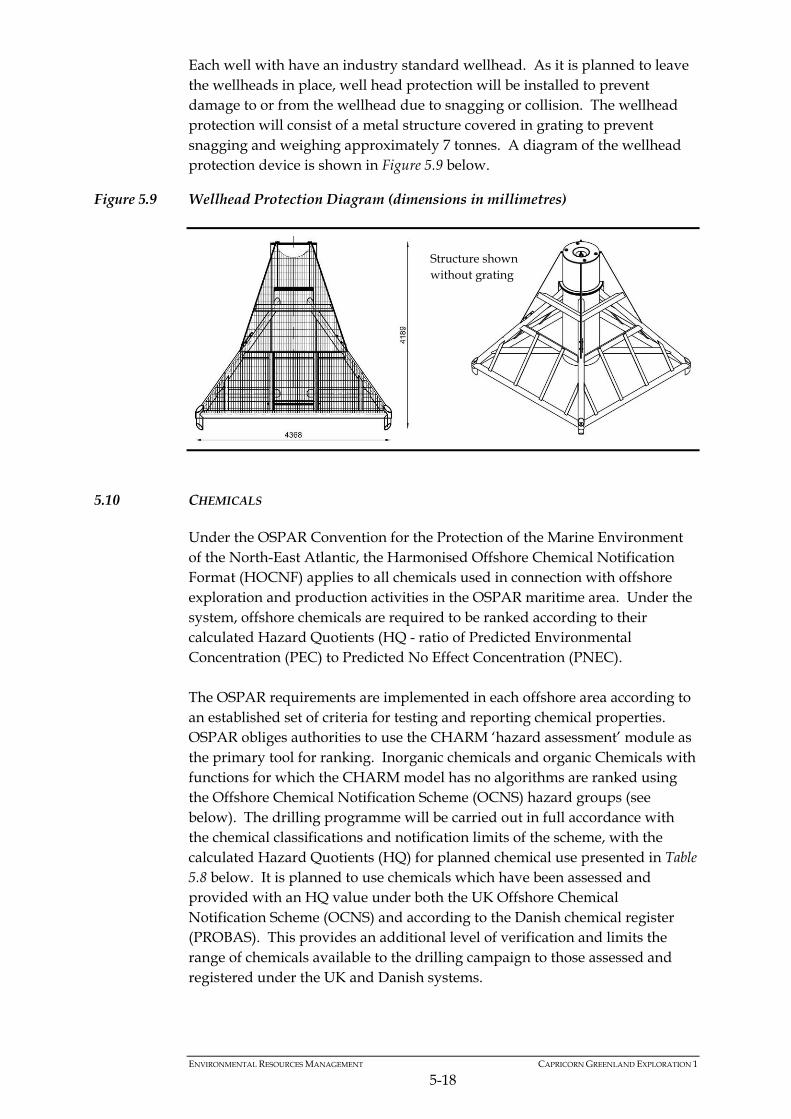
Each well with have an industry standard wellhead. As it is planned to leave the wellheads in place, well head protection will be installed to prevent damage to or from the wellhead due to snagging or collision. The wellhead protection will consist of a metal structure covered in grating to prevent snagging and weighing approximately 7 tonnes. A diagram of the wellhead protection device is shown in Figure 5.9 below.
Figure 5.9 Wellhead Protection Diagram (dimensions in millimetres)
Structure shown without grating
5.10 CHEMICALS
Under the OSPAR Convention for the Protection of the Marine Environment of the North-East Atlantic, the Harmonised Offshore Chemical Notification Format (HOCNF) applies to all chemicals used in connection with offshore exploration and production activities in the OSPAR maritime area. Under the system, offshore chemicals are required to be ranked according to their calculated Hazard Quotients (HQ - ratio of Predicted Environmental Concentration (PEC) to Predicted No Effect Concentration (PNEC). The OSPAR requirements are implemented in each offshore area according to an established set of criteria for testing and reporting chemical properties. OSPAR obliges authorities to use the CHARM ‘hazard assessment’ module as the primary tool for ranking. Inorganic chemicals and organic Chemicals with functions for which the CHARM model has no algorithms are ranked using the Offshore Chemical Notification Scheme (OCNS) hazard groups (see below). The drilling programme will be carried out in full accordance with the chemical classifications and notification limits of the scheme, with the calculated Hazard Quotients (HQ) for planned chemical use presented in Table 5.8 below. It is planned to use chemicals which have been assessed and provided with an HQ value under both the UK Offshore Chemical Notification Scheme (OCNS) and according to the Danish chemical register (PROBAS). This provides an additional level of verification and limits the range of chemicals available to the drilling campaign to those assessed and registered under the UK and Danish systems.
ENVIRONMENTAL RESOURCES MANAGEMENT CAPRICORN GREENLAND EXPLORATION 1
5-18
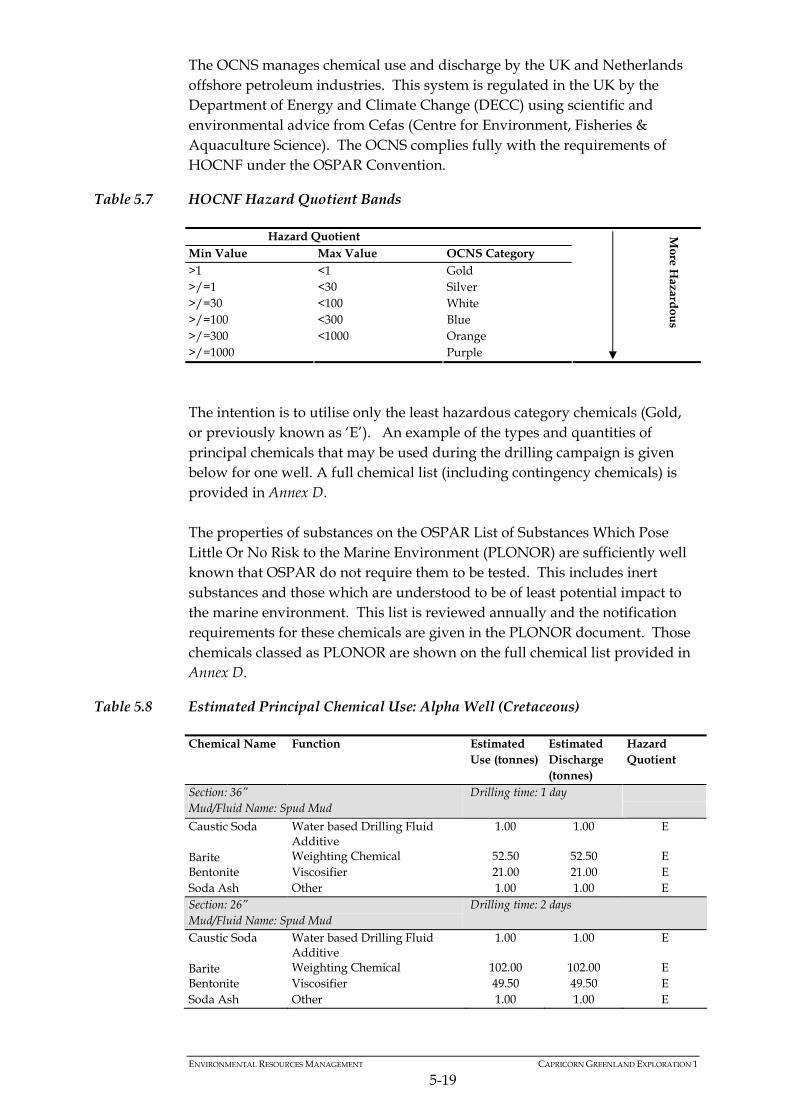
The OCNS manages chemical use and discharge by the UK and Netherlands offshore petroleum industries. This system is regulated in the UK by the Department of Energy and Climate Change (DECC) using scientific and environmental advice from Cefas (Centre for Environment, Fisheries & Aquaculture Science). The OCNS complies fully with the requirements of HOCNF under the OSPAR Convention.
Table 5.7 HOCNF Hazard Quotient Bands
Hazard Quotient Min Value Max Value OCNS Category >1 <1 Gold >/=1 <30 Silver >/=30 <100 White >/=100 <300 Blue >/=300 <1000 Orange >/=1000 Purple
More H
azardou
s
The intention is to utilise only the least hazardous category chemicals (Gold, or previously known as ‘E’). An example of the types and quantities of principal chemicals that may be used during the drilling campaign is given below for one well. A full chemical list (including contingency chemicals) is provided in Annex D. The properties of substances on the OSPAR List of Substances Which Pose Little Or No Risk to the Marine Environment (PLONOR) are sufficiently well known that OSPAR do not require them to be tested. This includes inert substances and those which are understood to be of least potential impact to the marine environment. This list is reviewed annually and the notification requirements for these chemicals are given in the PLONOR document. Those chemicals classed as PLONOR are shown on the full chemical list provided in Annex D.
Table 5.8 Estimated Principal Chemical Use: Alpha Well (Cretaceous)
Chemical Name Function Estimated Use (tonnes)
Estimated Discharge (tonnes)
Hazard Quotient
Section: 36” Mud/Fluid Name: Spud Mud
Drilling time: 1 day
Caustic Soda Water based Drilling Fluid Additive
1.00 1.00 E
Barite Weighting Chemical 52.50 52.50 E Bentonite Viscosifier 21.00 21.00 E Soda Ash Other 1.00 1.00 E Section: 26” Mud/Fluid Name: Spud Mud
Drilling time: 2 days
Caustic Soda Water based Drilling Fluid Additive
1.00 1.00 E
Barite Weighting Chemical 102.00 102.00 E Bentonite Viscosifier 49.50 49.50 E Soda Ash Other 1.00 1.00 E
ENVIRONMENTAL RESOURCES MANAGEMENT CAPRICORN GREENLAND EXPLORATION 1
5-19
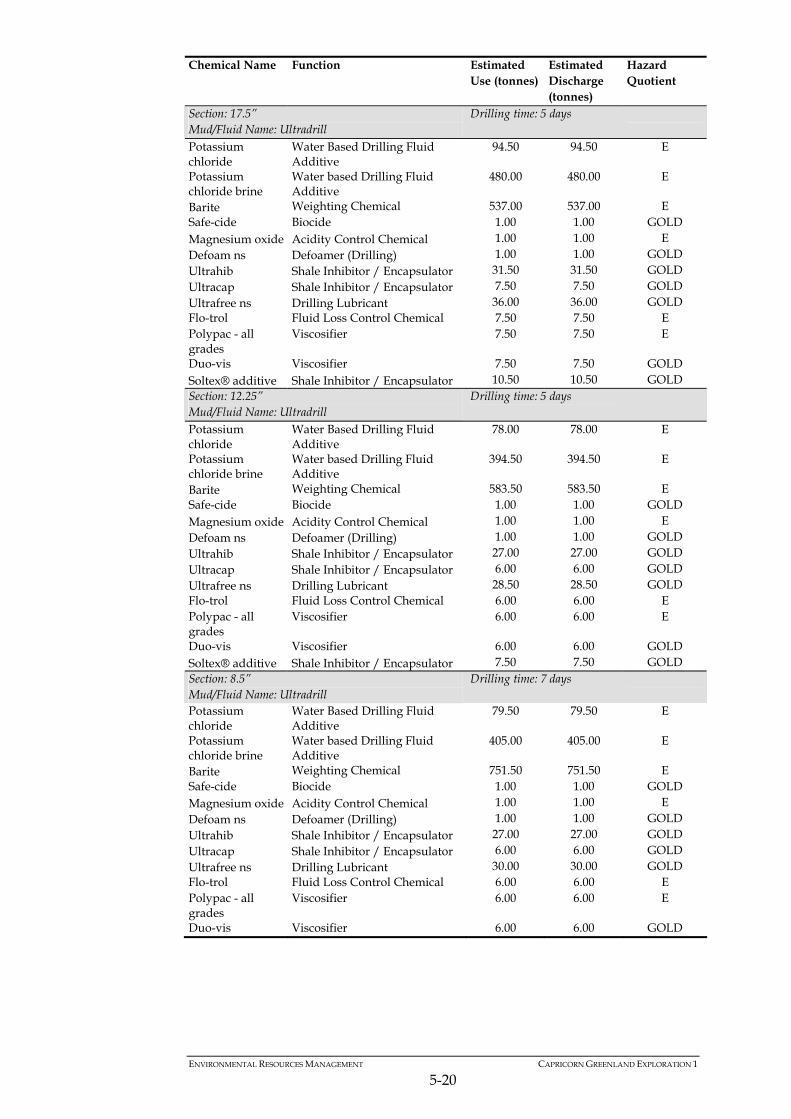
ENVIRONMENTAL RESOURCES MANAGEMENT CAPRICORN GREENLAND EXPLORATION 1
5-20
Chemical Name Function Estimated Use (tonnes)
Estimated Discharge (tonnes)
Hazard Quotient
Section: 17.5” Mud/Fluid Name: Ultradrill
Drilling time: 5 days
Potassium chloride
Water Based Drilling Fluid Additive
94.50 94.50 E
Potassium chloride brine
Water based Drilling Fluid Additive
480.00 480.00 E
Barite Weighting Chemical 537.00 537.00 E Safe-cide Biocide 1.00 1.00 GOLD Magnesium oxide Acidity Control Chemical 1.00 1.00 E Defoam ns Defoamer (Drilling) 1.00 1.00 GOLD Ultrahib Shale Inhibitor / Encapsulator 31.50 31.50 GOLD Ultracap Shale Inhibitor / Encapsulator 7.50 7.50 GOLD Ultrafree ns Drilling Lubricant 36.00 36.00 GOLD Flo-trol Fluid Loss Control Chemical 7.50 7.50 E Polypac - all grades
Viscosifier 7.50 7.50 E
Duo-vis Viscosifier 7.50 7.50 GOLD Soltex® additive Shale Inhibitor / Encapsulator 10.50 10.50 GOLD Section: 12.25” Mud/Fluid Name: Ultradrill
Drilling time: 5 days
Potassium chloride
Water Based Drilling Fluid Additive
78.00 78.00 E
Potassium chloride brine
Water based Drilling Fluid Additive
394.50 394.50 E
Barite Weighting Chemical 583.50 583.50 E Safe-cide Biocide 1.00 1.00 GOLD Magnesium oxide Acidity Control Chemical 1.00 1.00 E Defoam ns Defoamer (Drilling) 1.00 1.00 GOLD Ultrahib Shale Inhibitor / Encapsulator 27.00 27.00 GOLD Ultracap Shale Inhibitor / Encapsulator 6.00 6.00 GOLD Ultrafree ns Drilling Lubricant 28.50 28.50 GOLD Flo-trol Fluid Loss Control Chemical 6.00 6.00 E Polypac - all grades
Viscosifier 6.00 6.00 E
Duo-vis Viscosifier 6.00 6.00 GOLD Soltex® additive Shale Inhibitor / Encapsulator 7.50 7.50 GOLD Section: 8.5” Mud/Fluid Name: Ultradrill
Drilling time: 7 days
Potassium chloride
Water Based Drilling Fluid Additive
79.50 79.50 E
Potassium chloride brine
Water based Drilling Fluid Additive
405.00 405.00 E
Barite Weighting Chemical 751.50 751.50 E Safe-cide Biocide 1.00 1.00 GOLD Magnesium oxide Acidity Control Chemical 1.00 1.00 E Defoam ns Defoamer (Drilling) 1.00 1.00 GOLD Ultrahib Shale Inhibitor / Encapsulator 27.00 27.00 GOLD Ultracap Shale Inhibitor / Encapsulator 6.00 6.00 GOLD Ultrafree ns Drilling Lubricant 30.00 30.00 GOLD Flo-trol Fluid Loss Control Chemical 6.00 6.00 E Polypac - all grades
Viscosifier 6.00 6.00 E
Duo-vis Viscosifier 6.00 6.00 GOLD
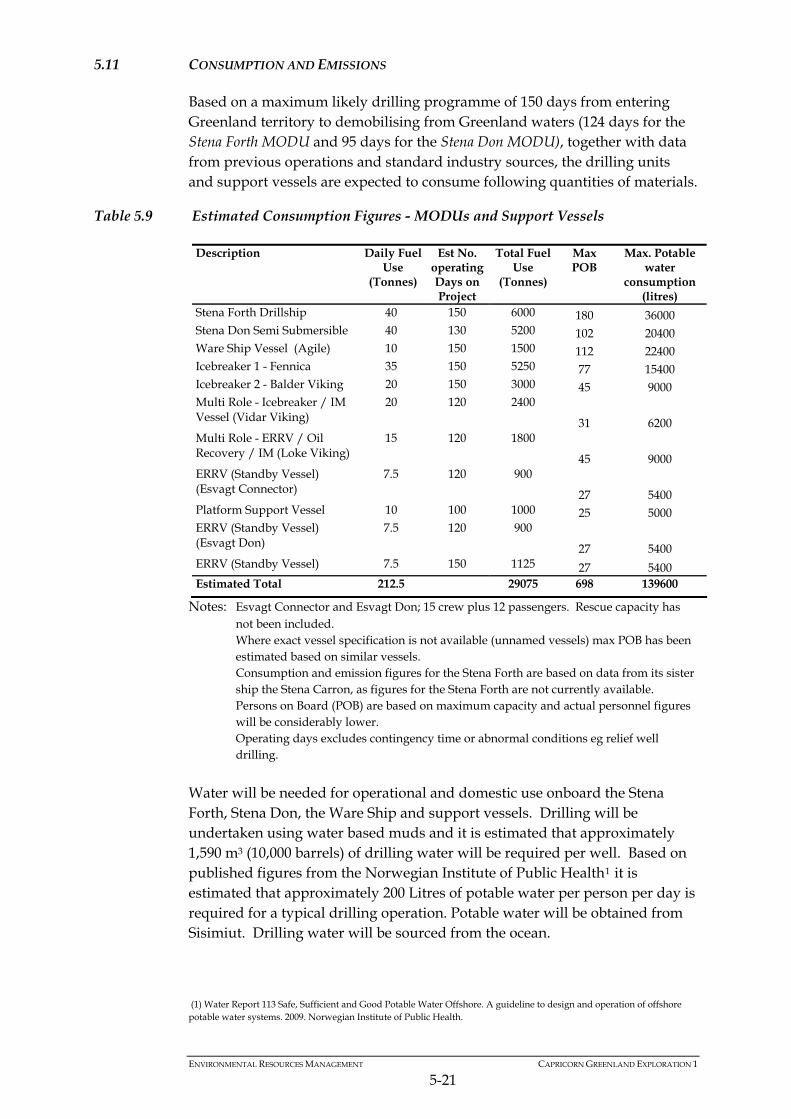
ENVIRONMENTAL RESOURCES MANAGEMENT CAPRICORN GREENLAND EXPLORATION 1
5-21
5.11 CONSUMPTION AND EMISSIONS
Based on a maximum likely drilling programme of 150 days from entering Greenland territory to demobilising from Greenland waters (124 days for the Stena Forth MODU and 95 days for the Stena Don MODU), together with data from previous operations and standard industry sources, the drilling units and support vessels are expected to consume following quantities of materials.
Table 5.9 Estimated Consumption Figures - MODUs and Support Vessels
Description Daily Fuel Use
(Tonnes)
Est No. operating Days on Project
Total Fuel Use
(Tonnes)
Max POB
Max. Potable water
consumption (litres)
Stena Forth Drillship 40 150 6000 180 36000 Stena Don Semi Submersible 40 130 5200 102 20400 Ware Ship Vessel (Agile) 10 150 1500 112 22400 Icebreaker 1 - Fennica 35 150 5250 77 15400 Icebreaker 2 - Balder Viking 20 150 3000 45 9000 Multi Role - Icebreaker / IM Vessel (Vidar Viking)
20 120 2400
31 6200 Multi Role - ERRV / Oil Recovery / IM (Loke Viking)
15 120 1800
45 9000 ERRV (Standby Vessel) (Esvagt Connector)
7.5 120 900
27 5400 Platform Support Vessel 10 100 1000 25 5000 ERRV (Standby Vessel) (Esvagt Don)
7.5 120 900
27 5400 ERRV (Standby Vessel) 7.5 150 1125 27 5400 Estimated Total 212.5 29075 698 139600
Notes: Esvagt Connector and Esvagt Don; 15 crew plus 12 passengers. Rescue capacity has not been included.
Where exact vessel specification is not available (unnamed vessels) max POB has been estimated based on similar vessels.
Consumption and emission figures for the Stena Forth are based on data from its sister ship the Stena Carron, as figures for the Stena Forth are not currently available.
Persons on Board (POB) are based on maximum capacity and actual personnel figures will be considerably lower.
Operating days excludes contingency time or abnormal conditions eg relief well drilling.
Water will be needed for operational and domestic use onboard the Stena Forth, Stena Don, the Ware Ship and support vessels. Drilling will be undertaken using water based muds and it is estimated that approximately 1,590 m3 (10,000 barrels) of drilling water will be required per well. Based on published figures from the Norwegian Institute of Public Health1 it is estimated that approximately 200 Litres of potable water per person per day is required for a typical drilling operation. Potable water will be obtained from Sisimiut. Drilling water will be sourced from the ocean.
(1) Water Report 113 Safe, Sufficient and Good Potable Water Offshore. A guideline to design and operation of offshore potable water systems. 2009. Norwegian Institute of Public Health.
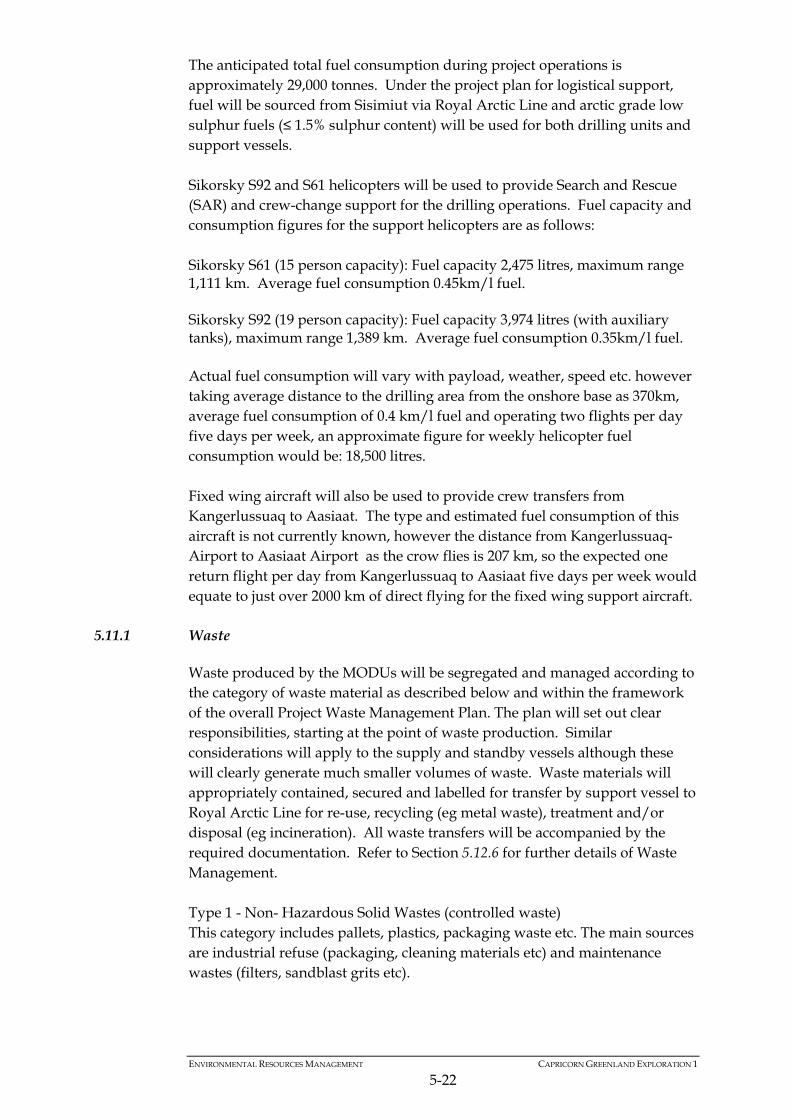
ENVIRONMENTAL RESOURCES MANAGEMENT CAPRICORN GREENLAND EXPLORATION 1
5-22
The anticipated total fuel consumption during project operations is approximately 29,000 tonnes. Under the project plan for logistical support, fuel will be sourced from Sisimiut via Royal Arctic Line and arctic grade low sulphur fuels (≤ 1.5% sulphur content) will be used for both drilling units and support vessels. Sikorsky S92 and S61 helicopters will be used to provide Search and Rescue (SAR) and crew-change support for the drilling operations. Fuel capacity and consumption figures for the support helicopters are as follows: Sikorsky S61 (15 person capacity): Fuel capacity 2,475 litres, maximum range 1,111 km. Average fuel consumption 0.45km/l fuel. Sikorsky S92 (19 person capacity): Fuel capacity 3,974 litres (with auxiliary tanks), maximum range 1,389 km. Average fuel consumption 0.35km/l fuel. Actual fuel consumption will vary with payload, weather, speed etc. however taking average distance to the drilling area from the onshore base as 370km, average fuel consumption of 0.4 km/l fuel and operating two flights per day five days per week, an approximate figure for weekly helicopter fuel consumption would be: 18,500 litres. Fixed wing aircraft will also be used to provide crew transfers from Kangerlussuaq to Aasiaat. The type and estimated fuel consumption of this aircraft is not currently known, however the distance from Kangerlussuaq- Airport to Aasiaat Airport as the crow flies is 207 km, so the expected one return flight per day from Kangerlussuaq to Aasiaat five days per week would equate to just over 2000 km of direct flying for the fixed wing support aircraft.
5.11.1 Waste
Waste produced by the MODUs will be segregated and managed according to the category of waste material as described below and within the framework of the overall Project Waste Management Plan. The plan will set out clear responsibilities, starting at the point of waste production. Similar considerations will apply to the supply and standby vessels although these will clearly generate much smaller volumes of waste. Waste materials will appropriately contained, secured and labelled for transfer by support vessel to Royal Arctic Line for re-use, recycling (eg metal waste), treatment and/or disposal (eg incineration). All waste transfers will be accompanied by the required documentation. Refer to Section 5.12.6 for further details of Waste Management. Type 1 - Non- Hazardous Solid Wastes (controlled waste) This category includes pallets, plastics, packaging waste etc. The main sources are industrial refuse (packaging, cleaning materials etc) and maintenance wastes (filters, sandblast grits etc).
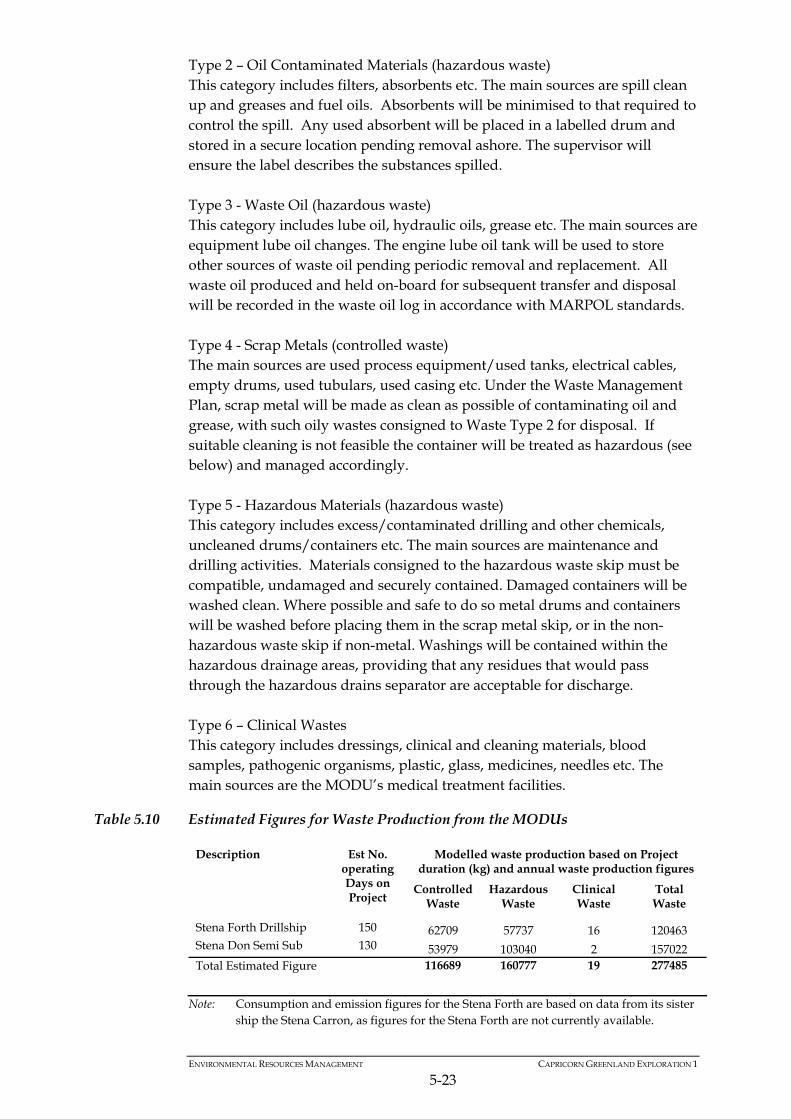
ENVIRONMENTAL RESOURCES MANAGEMENT CAPRICORN GREENLAND EXPLORATION 1
5-23
Type 2 – Oil Contaminated Materials (hazardous waste) This category includes filters, absorbents etc. The main sources are spill clean up and greases and fuel oils. Absorbents will be minimised to that required to control the spill. Any used absorbent will be placed in a labelled drum and stored in a secure location pending removal ashore. The supervisor will ensure the label describes the substances spilled. Type 3 - Waste Oil (hazardous waste) This category includes lube oil, hydraulic oils, grease etc. The main sources are equipment lube oil changes. The engine lube oil tank will be used to store other sources of waste oil pending periodic removal and replacement. All waste oil produced and held on-board for subsequent transfer and disposal will be recorded in the waste oil log in accordance with MARPOL standards. Type 4 - Scrap Metals (controlled waste) The main sources are used process equipment/used tanks, electrical cables, empty drums, used tubulars, used casing etc. Under the Waste Management Plan, scrap metal will be made as clean as possible of contaminating oil and grease, with such oily wastes consigned to Waste Type 2 for disposal. If suitable cleaning is not feasible the container will be treated as hazardous (see below) and managed accordingly. Type 5 - Hazardous Materials (hazardous waste) This category includes excess/contaminated drilling and other chemicals, uncleaned drums/containers etc. The main sources are maintenance and drilling activities. Materials consigned to the hazardous waste skip must be compatible, undamaged and securely contained. Damaged containers will be washed clean. Where possible and safe to do so metal drums and containers will be washed before placing them in the scrap metal skip, or in the non-hazardous waste skip if non-metal. Washings will be contained within the hazardous drainage areas, providing that any residues that would pass through the hazardous drains separator are acceptable for discharge. Type 6 – Clinical Wastes This category includes dressings, clinical and cleaning materials, blood samples, pathogenic organisms, plastic, glass, medicines, needles etc. The main sources are the MODU’s medical treatment facilities.
Table 5.10 Estimated Figures for Waste Production from the MODUs
Modelled waste production based on Project duration (kg) and annual waste production figures
Description Est No. operating Days on Project
Controlled Waste
Hazardous Waste
Clinical Waste
Total Waste
Stena Forth Drillship 150 62709 57737 16 120463 Stena Don Semi Sub 130 53979 103040 2 157022 Total Estimated Figure 116689 160777 19 277485
Note: Consumption and emission figures for the Stena Forth are based on data from its sister ship the Stena Carron, as figures for the Stena Forth are not currently available.
ENVIRONMENTAL RESOURCES MANAGEMENT CAPRICORN GREENLAND EXPLORATION 1
5-24
5.12 SUPPORT OPERATIONS
5.12.1 Personnel
A breakdown of the maximum Persons on Board (POB) for the various vessels and MODUs has been provided in Table 5.9 above. This is based on the maximum number of persons each vessel or rig can accommodate (excluding emergencies) and the actual number of personnel working offshore will be considerably less. Logistics provision is being made for an estimated 400 persons per month to crew change on and off the operations. Crew on the drill units will work on a rotation basis of 28 days on, 28 days off. All personnel working offshore will be in possession of appropriate emergency training and medical certification. The marine crew of 18 for transit and an additional 10 - 12 catering staff onboard the Ware Ship are likely to be employed locally.
5.12.2 Support Vessel Characteristics
Introduction
Approximately nine vessels in total, in addition to the two MODUs will be selected to provide for requirements and flexibility, including support of the operation and to provide cover for emergency stand-by, ice management / anchor handling, oil spill response, ice breaking and re-supply. This will include the following: 1 x accommodation vessel / warship; 2x icebreaker vessels; 1 multi role icebreaker and Ice Management (IM) vessel; 1 multi role Emergency Response and Rescue Vessel (ERRV), Oil Recovery
and Ice Management Vessel; 2 x ERRV Standby vessels; 1 x Platform Supply Vessel (PSV); and 1 x Anchor Handling / ice breaker / ice management. The drilling operations are therefore supported by a range of vessels designed not just to provide day-to-day platform support and resupply, but also equipped to act as icebreakers, ice management vessels, emergency response and rescue, oil recovery and tugs. The vessels will be equipped with sufficient primary oil spill contingency equipment to deal with spills as outlined in the site specific oil spill contingency plan. Drilling support vessels work on a worldwide basis and as such the crew is internationally based. The exact nationality of the crew is as yet undetermined, however it is unlikely that personnel on the vessels will be sourced short term from Greenland due to the term of the project and the specialist skills required.
ENVIRONMENTAL RESOURCES MANAGEMENT CAPRICORN GREENLAND EXPLORATION 1
5-25
Ware Ship (MV Agile)
The preferred supply method is to mobilise a ‘Wareship’ (the MV Agile) to carry all the supplies and contingency equipment for the drilling campaign (see Figure 5.10). The MV Agile is a subsea construction support vessel with a capacity for 15 flexible reels using a double deck storage system. This ship has a lower deck area of 1,200 m2 and a 1,000 m2 upper deck area for flowlines, umbilicals and subsea equipment. The ship is equipped with a 30t crane on the starboard quarter and a 50t crane on the upper deck. The ship will also provide a standby flotel facility with accommodation capacity for 112 personnel for delayed crew changes to avoid any potentially disruptive onshore interactions, workshop facilities for repair and maintenance requirements, a mid ocean helicopter divert station (suitable for S-92), an emergency response staging post and equipment and contingency supplies. It is anticipated that during the project there will be a full marine crew of 18 for transit with an additional 10 - 12 catering staff for catering (30 total). Up to 60 persons are anticipated to be temporarily housed during crew changes. It is anticipated that personnel will access the ship either via helicopter or crew change tender. There will be no free access between the Ware Ship and shore which will minimise the interaction between foreign workers and local communities and businesses. The ship has a capacity to carry up to 2,950 m3 of fuel, and estimated consumption in the various modes of operation is as follows: 2-3 m3 per day while anchored (2 bow anchors); 20 m3 per day when dynamically positioned (using thrusters to maintain
position); 18 m3 per day while transiting; and 12 m3 per day when combined anchor and DP (i.e. in Aasiaat harbour). Organic waste from the Ware Ship will be macerated and treated before discharge and non organic waste will be compacted and shipped to Royal Arctic Line (RAL) reception facilities in Aasiaat (onshore) for disposal (see Section 5.11.1). The Ware Ship is anticipated to arrive in June 2010 and depart at the end of October 2010.
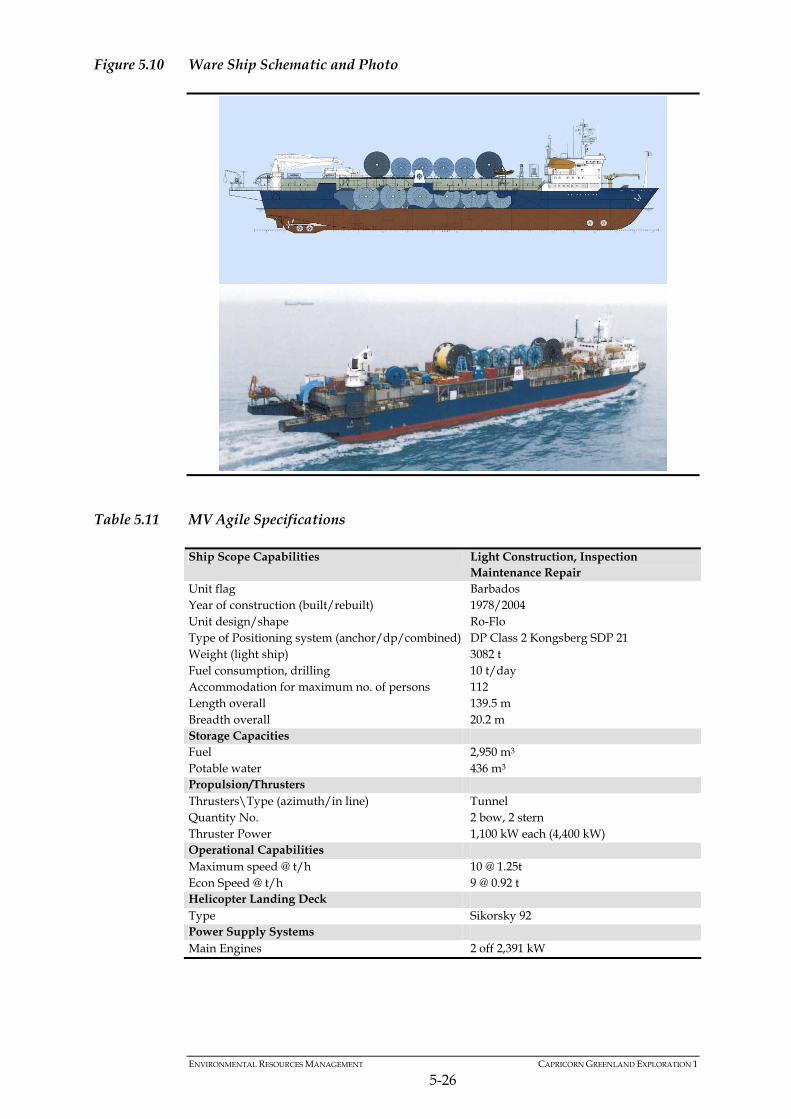
Figure 5.10 Ware Ship Schematic and Photo
Table 5.11 MV Agile Specifications
Ship Scope Capabilities Light Construction, Inspection Maintenance Repair
Unit flag Barbados Year of construction (built/rebuilt) 1978/2004 Unit design/shape Ro-Flo Type of Positioning system (anchor/dp/combined) DP Class 2 Kongsberg SDP 21 Weight (light ship) 3082 t Fuel consumption, drilling 10 t/day Accommodation for maximum no. of persons 112 Length overall 139.5 m Breadth overall 20.2 m Storage Capacities Fuel 2,950 m3 Potable water 436 m3 Propulsion/Thrusters Thrusters\Type (azimuth/in line) Tunnel Quantity No. 2 bow, 2 stern Thruster Power 1,100 kW each (4,400 kW) Operational Capabilities Maximum speed @ t/h 10 @ 1.25t Econ Speed @ t/h 9 @ 0.92 t Helicopter Landing Deck Type Sikorsky 92 Power Supply Systems Main Engines 2 off 2,391 kW
ENVIRONMENTAL RESOURCES MANAGEMENT CAPRICORN GREENLAND EXPLORATION 1
5-26
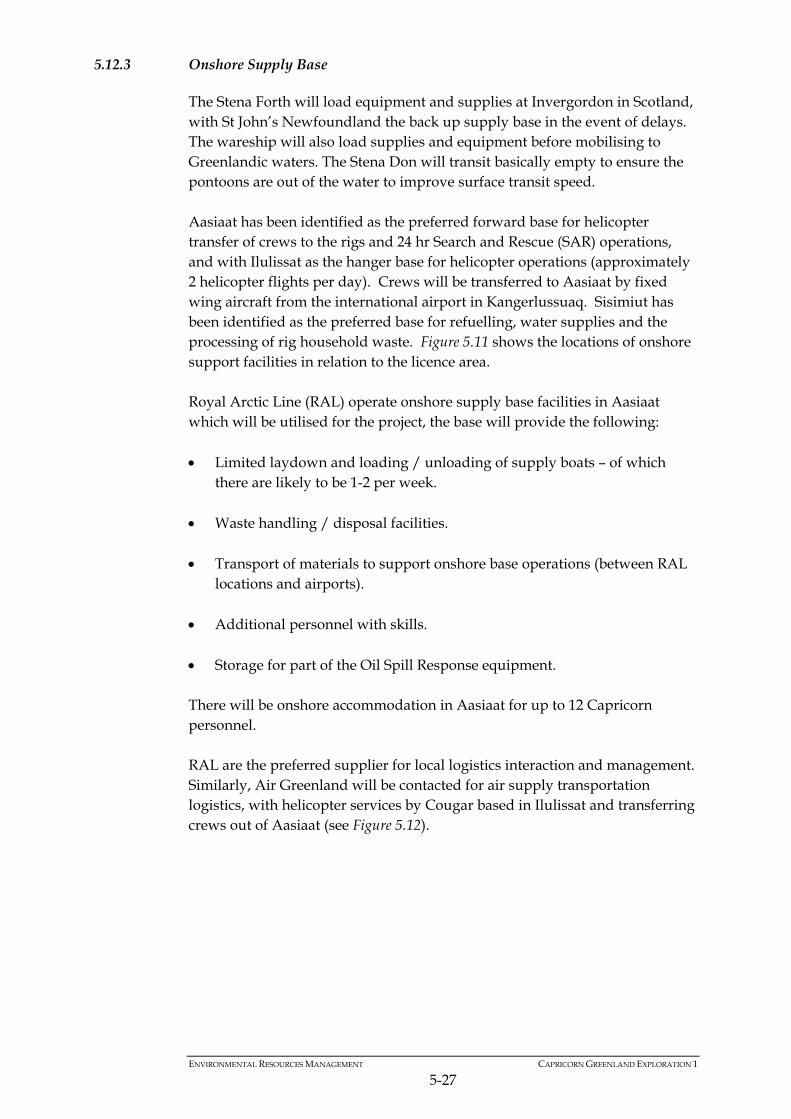
ENVIRONMENTAL RESOURCES MANAGEMENT CAPRICORN GREENLAND EXPLORATION 1
5-27
5.12.3 Onshore Supply Base
The Stena Forth will load equipment and supplies at Invergordon in Scotland, with St John’s Newfoundland the back up supply base in the event of delays. The wareship will also load supplies and equipment before mobilising to Greenlandic waters. The Stena Don will transit basically empty to ensure the pontoons are out of the water to improve surface transit speed. Aasiaat has been identified as the preferred forward base for helicopter transfer of crews to the rigs and 24 hr Search and Rescue (SAR) operations, and with Ilulissat as the hanger base for helicopter operations (approximately 2 helicopter flights per day). Crews will be transferred to Aasiaat by fixed wing aircraft from the international airport in Kangerlussuaq. Sisimiut has been identified as the preferred base for refuelling, water supplies and the processing of rig household waste. Figure 5.11 shows the locations of onshore support facilities in relation to the licence area. Royal Arctic Line (RAL) operate onshore supply base facilities in Aasiaat which will be utilised for the project, the base will provide the following: Limited laydown and loading / unloading of supply boats – of which
there are likely to be 1-2 per week. Waste handling / disposal facilities. Transport of materials to support onshore base operations (between RAL
locations and airports). Additional personnel with skills. Storage for part of the Oil Spill Response equipment. There will be onshore accommodation in Aasiaat for up to 12 Capricorn personnel. RAL are the preferred supplier for local logistics interaction and management. Similarly, Air Greenland will be contacted for air supply transportation logistics, with helicopter services by Cougar based in Ilulissat and transferring crews out of Aasiaat (see Figure 5.12).
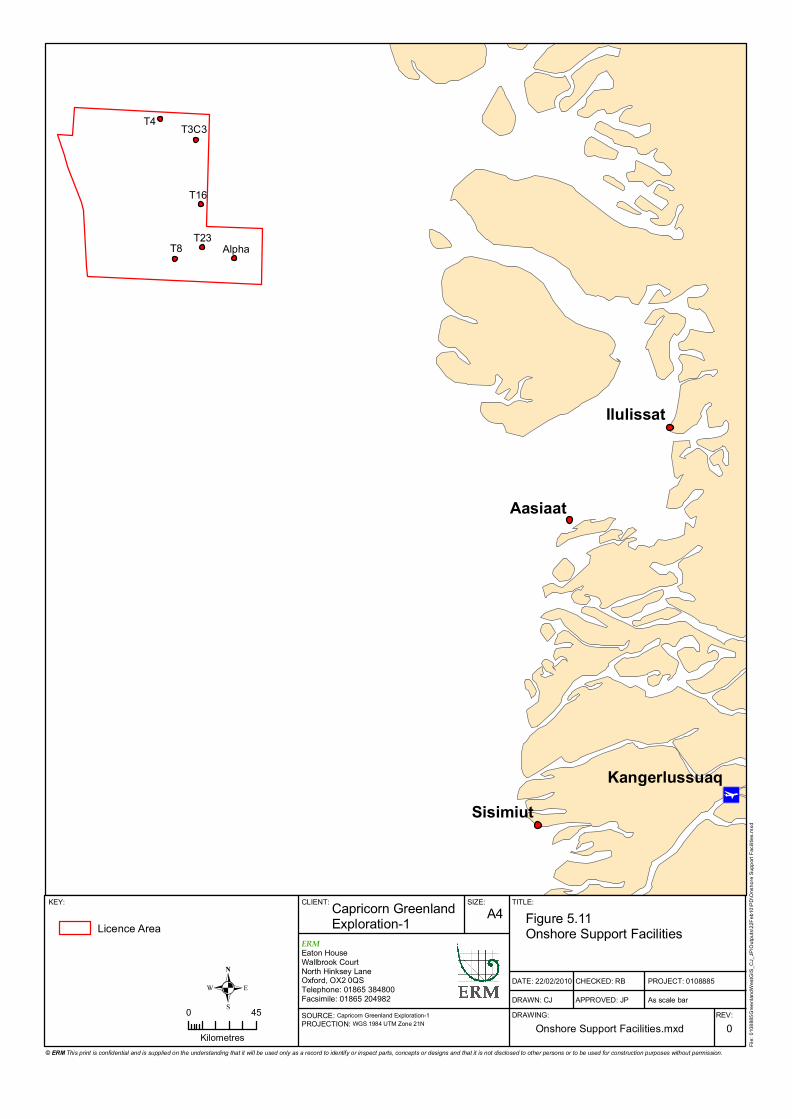
®q
T4
T8T23
T16
T3C3
Alpha
Aasiaat
Sisimiut
Ilulissat
Kangerlussuaq
CLIENT: SIZE: TITLE:
DATE: 22/02/2010
DRAWN: CJ
CHECKED: RB
APPROVED: JP
PROJECT: 0108885
As scale barDRAWING: REV:
KEY: Capricorn Greenland Exploration-1 A4 Figure 5.11
Onshore Support Facilities
Onshore Support Facilities.mxd 0
Licence Area
SOURCE: Capricorn Greenland Exploration-1PROJECTION: WGS 1984 UTM Zone 21N
File:
0108
885G
reenla
ndW
estG
IS_C
J_JP
\Outp
uts\22
Feb1
0\PD\
Onsh
ore S
uppo
rt Fac
ilities
.mxd
ERMEaton HouseWallbrook CourtNorth Hinksey LaneOxford, OX2 0QSTelephone: 01865 384800Facsimile: 01865 204982.0 45
Kilometres© ERM This print is confidential and is supplied on the understanding that it will be used only as a record to identify or inspect parts, concepts or designs and that it is not disclosed to other persons or to be used for construction purposes without permission.
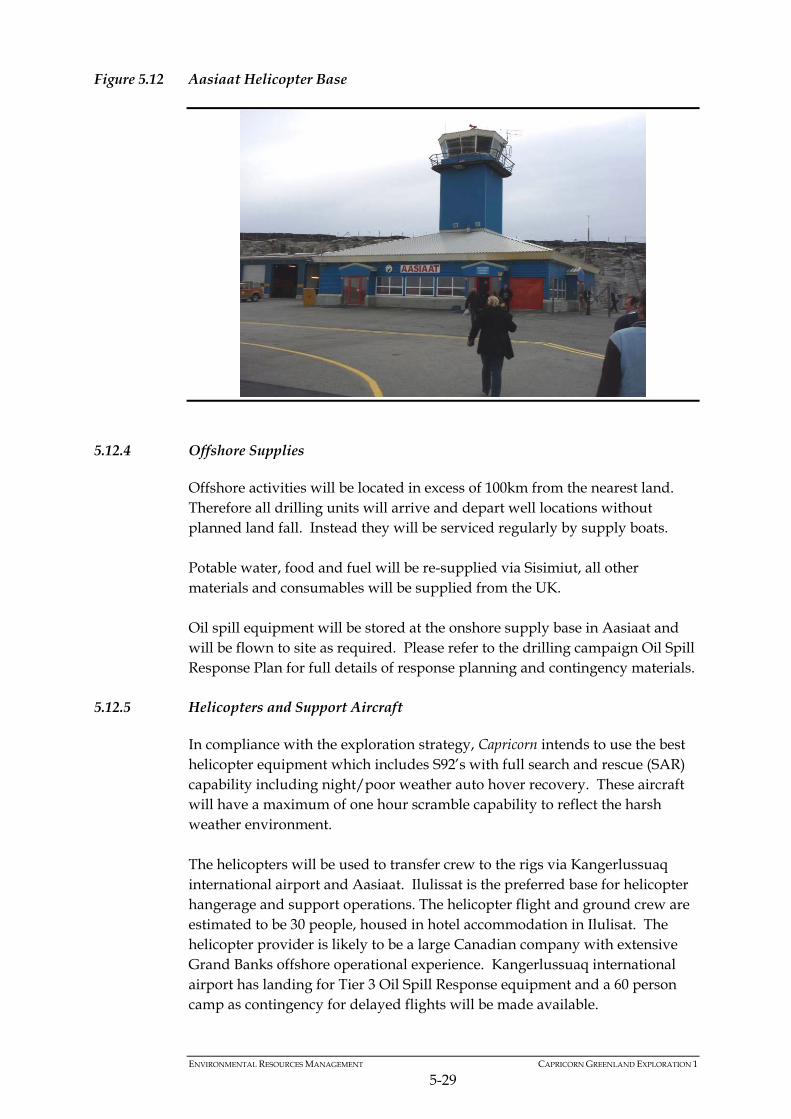
Figure 5.12 Aasiaat Helicopter Base
5.12.4 Offshore Supplies
Offshore activities will be located in excess of 100km from the nearest land. Therefore all drilling units will arrive and depart well locations without planned land fall. Instead they will be serviced regularly by supply boats. Potable water, food and fuel will be re-supplied via Sisimiut, all other materials and consumables will be supplied from the UK. Oil spill equipment will be stored at the onshore supply base in Aasiaat and will be flown to site as required. Please refer to the drilling campaign Oil Spill Response Plan for full details of response planning and contingency materials.
5.12.5 Helicopters and Support Aircraft
In compliance with the exploration strategy, Capricorn intends to use the best helicopter equipment which includes S92’s with full search and rescue (SAR) capability including night/poor weather auto hover recovery. These aircraft will have a maximum of one hour scramble capability to reflect the harsh weather environment. The helicopters will be used to transfer crew to the rigs via Kangerlussuaq international airport and Aasiaat. Ilulissat is the preferred base for helicopter hangerage and support operations. The helicopter flight and ground crew are estimated to be 30 people, housed in hotel accommodation in Ilulisat. The helicopter provider is likely to be a large Canadian company with extensive Grand Banks offshore operational experience. Kangerlussuaq international airport has landing for Tier 3 Oil Spill Response equipment and a 60 person camp as contingency for delayed flights will be made available.
ENVIRONMENTAL RESOURCES MANAGEMENT CAPRICORN GREENLAND EXPLORATION 1
5-29
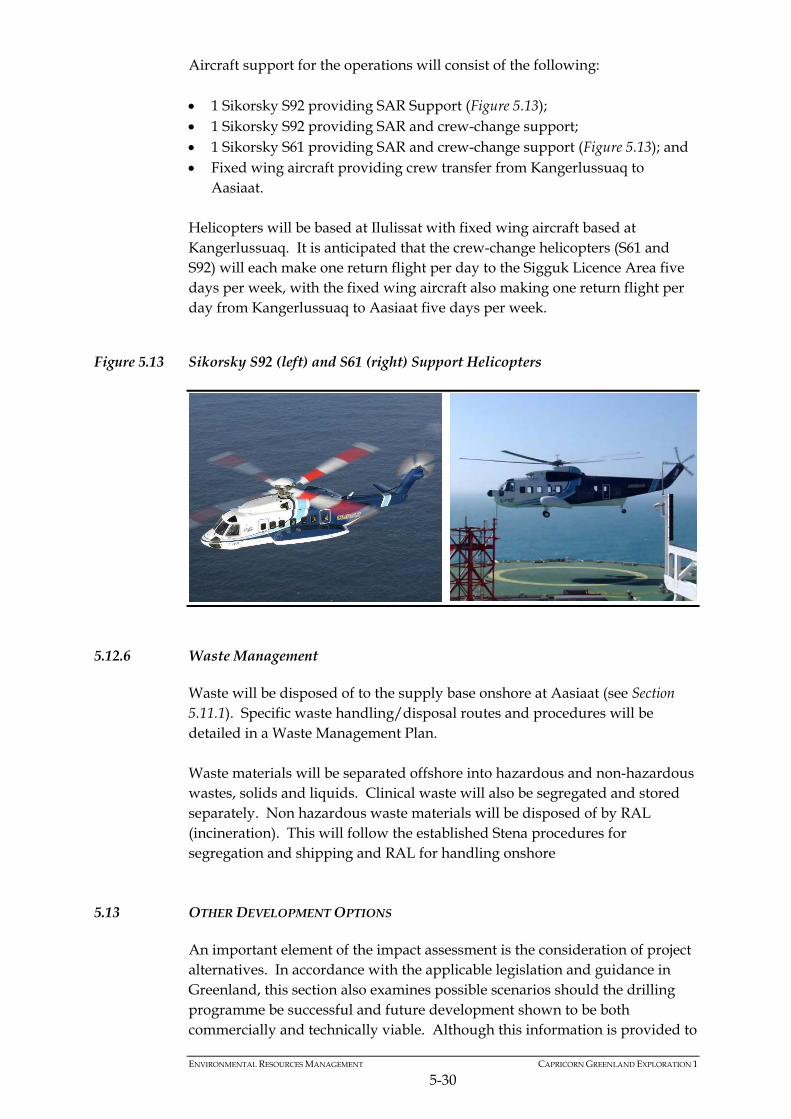
Aircraft support for the operations will consist of the following: 1 Sikorsky S92 providing SAR Support (Figure 5.13); 1 Sikorsky S92 providing SAR and crew-change support; 1 Sikorsky S61 providing SAR and crew-change support (Figure 5.13); and Fixed wing aircraft providing crew transfer from Kangerlussuaq to
Aasiaat. Helicopters will be based at Ilulissat with fixed wing aircraft based at Kangerlussuaq. It is anticipated that the crew-change helicopters (S61 and S92) will each make one return flight per day to the Sigguk Licence Area five days per week, with the fixed wing aircraft also making one return flight per day from Kangerlussuaq to Aasiaat five days per week.
Figure 5.13 Sikorsky S92 (left) and S61 (right) Support Helicopters
5.12.6 Waste Management
Waste will be disposed of to the supply base onshore at Aasiaat (see Section 5.11.1). Specific waste handling/disposal routes and procedures will be detailed in a Waste Management Plan. Waste materials will be separated offshore into hazardous and non-hazardous wastes, solids and liquids. Clinical waste will also be segregated and stored separately. Non hazardous waste materials will be disposed of by RAL (incineration). This will follow the established Stena procedures for segregation and shipping and RAL for handling onshore
5.13 OTHER DEVELOPMENT OPTIONS
An important element of the impact assessment is the consideration of project alternatives. In accordance with the applicable legislation and guidance in Greenland, this section also examines possible scenarios should the drilling programme be successful and future development shown to be both commercially and technically viable. Although this information is provided to
ENVIRONMENTAL RESOURCES MANAGEMENT CAPRICORN GREENLAND EXPLORATION 1
5-30
ENVIRONMENTAL RESOURCES MANAGEMENT CAPRICORN GREENLAND EXPLORATION 1
5-31
give an example of the future possibilities, the scope of both the environmental and social impact assessment remains limited to the actual 2010 exploration drilling programme.
5.13.1 Alternatives
The selection and alternatives for drilling locations, drill units and mud selection are described below. One alternative to be considered is the No Development Option, or what will the implications be (both positive and negative) should exploration drilling not proceed. The baseline will not remain static and likely future trends in the environmental and socio-economic baseline are accounted for in the impact assessment process (see Chapter 3 of the EIA for the Assessment Methodology and Chapter 6 for the Impact Assessment). In the No Development Option the potential impacts of offshore drilling identified within the EIA and SIA will not occur, however it should be recognised that the baseline will continue to be impacted by, for example, fishing and hunting, vessel activity, natural impacts such as iceberg movement or sedimentation, waste materials, sewage and polluted run-off, fall out of atmospheric pollutants or accidental releases and spills. In the case of No Development, the exploration for and possible realisation of hydrocarbon resources will not take place. Potential revenue and employment from any future development will not be realised and the potential benefits to local businesses and communities from oil and gas activity will not take place. No Development will therefore inhibit offshore exploration activity and the potential future development of hydrocarbon resources, together with the possible benefits it may bring to the country; however it will also prevent the identified potential impacts of drilling activity from occurring, although the baseline environment will continue to be altered by other factors. Drilling Locations
The drilling locations for the 2010 Disko West drilling campaign by Capricorn have been selected based on extensive geophysical; data acquisition and interpretation. Seismic exploration, electro-magnetic surveys, site surveys and environmental surveys have all been undertaken to provide information on the water column, seabed and particularly on the subsurface. A summary of the petroleum geology is provided in Section 5.5. The presence of commercially viable hydrocarbon reserves is a complex interaction of many factors including time, pressures, source rock, reservoir rock, migration pathways and impermeable traps all of which need to be accounted for in interpreting the geophysical data and deciding whether, and where, to drill. The identified drilling locations are therefore based on extensive geological and geophysical studies. Although these remote studies can provide petroleum geologists with a good idea of the subsurface and an indication of
ENVIRONMENTAL RESOURCES MANAGEMENT CAPRICORN GREENLAND EXPLORATION 1
5-32
where to drill, it is only through exploration drilling that the interpretation can be verified and actual subsurface data acquired. Rig Selection
Both of the drilling units selected for this work are modern rigs designed for work in harsh environments at the water depths encountered in the Disko West area. Both units are operated by Stena Drilling Limited (Stena). Further technical details are provided in Section 5.4. The Stena Forth is a state-of-the-art (sixth generation) dynamically
positioned drillship designed for year-round operations in deep waters and harsh environments (operating at temperatures down to -20degC).
The Stena Don is a dynamically positioned (class 3), harsh environment
semisubmersible drilling vessel designed for worldwide operations. The drilling units have been selected based on their technical suitability for the water depths, drilling depths and environmental conditions of the Disko West area, and availability to conduct the operations. Mud and Chemical Selection
During drilling, muds are used for several purposes (as weighting agents to control down-hole pressure, to lubricate and cool the drill bit and to carry the cuttings to the surface for disposal). The drilling muds are formulated according to the well design and geological conditions expected. They comprise a base fluid, weighting agents and chemicals that are used to give the mud the exact properties it needs to make it as easy and safe as possible to drill. In addition to the operational characteristics, the muds are selected on the basis of ecological toxicity and bio-degradation rates. Water based mud systems have been selected for the exploration wells (as opposed to more harmful oil based systems) along with low-toxicity and inert chemicals as described in more detail with the Project Description.
5.13.2 Lifecycle of Activities
The current impact assessments (social and environmental) encompass short term exploration drilling activities and the associated support operations. Should exploration drilling be successful and sufficient reserves of hydrocarbons found, a number of development options exist which will be the subject of future environmental studies at the appropriate time. Previous operational studies have been carried out looking at the possible development options for hydrocarbon resources in this area, by a number of organisations, including: APA Petroleum Engineering (2003);
ENVIRONMENTAL RESOURCES MANAGEMENT CAPRICORN GREENLAND EXPLORATION 1
5-33
Aker Engineering & Technology (2005 and 2008); US Geological Survey (USGS) (2008); and Genesis Oil and Gas (2009). These studies have examined a number of options for oil field and gas field developments off the Greenland coast. For the Disko West area, assuming the most likely scenario that oil rather than gas is discovered, the options include: A Floating Production Unit (FPU) or a Floating Production, Storage and
Offloading vessel (FPSO) located at the field. This would allow export of the product directly from the field to reception terminals elsewhere, without the requirement for onshore processing / receiving facilities.
Subsea development offshore and a tieback (pipeline) to an onshore plant,
with oil transportation from the plant to market via ice-breaking tankers delivering the crude to an existing transhipment terminal.
Options for a semisubmersible, a traditional Tension Leg Platform (TLP), a
deepwater gravity based structure or a spread moored barge were examined in one of the studies but discounted.
Any future development of hydrocarbon resources in this area will likely require considerable support from onshore Greenland. The nature and extent of onshore support services, infrastructure, personnel and facilities will vary widely with the nature and size of any development. It should be noted that offshore field development is a long process, taking a number of years from successful drilling to first output (10 years or more in many instances) and that many more studies into these options will be undertaken over this period should viable reserves be discovered. A current assessment of the development studies by Capricorn concludes: Greenland field developments are likely to be in deep water in remote
iceberg prone Arctic areas, requiring leading edge technology, high expenditure and long schedules.
At present rock properties, fluid properties, well rates and field sizes are
all unknown. FPSO development scenarios are technically feasible and are the base case
for Greenland oil field developments. The subsea to shore development scenario merits further study. At this stage there is insufficient information to justify any particular
development option as the selected option.
ENVIRONMENTAL RESOURCES MANAGEMENT CAPRICORN GREENLAND EXPLORATION 1
5-34
Several options are therefore technically feasible and potentially economically viable, depending on the outcomes of exploration drilling and further studies. The feasibility of the options depends on specific site conditions and ice management. Some of the challenges with development in this area include: iceberg frequency and size; extent and properties of sea ice; and site conditions at field;
ENVIRONMENTAL RESOURCES MANAGEMENT CAPRICORN GREENLAND EXPLORATION-1
6-1
6 IMPACT ANALYSIS AND MITIGATION
6.1 INTRODUCTION
The discussion of project impacts, their mitigation and significance is a key factor in producing an EIA report that is both usable in the ongoing environmental management of the project and meaningful to stakeholders. This chapter addresses these requirements as follows. An ‘impact’ matrix (Figure 6.1) summarises scoping by identifying the
main interactions between project activities and environmental resources and receptors.
Based on the identified interactions, the impacts, their mitigation and
significance are summarised in Table 6.9. Key issues for the EIA are expanded upon at greater length in subsequent
sections of this Chapter. Key interactions and issues have been determined through ongoing scoping according to one or more of the following considerations: past experience in the context of offshore exploratory drilling; regulator and stakeholder concern; legislative requirement; professional judgment in regards to resources / receptors deemed as
sensitive to effects of the Project; and being exposed to impacts from large scale or multiple activities. In summary, the drilling programme will involve the mobilisation of drilling units and support vessels into Greenlandic waters. The vessels will use computer controlled thrusters to remain on station at pre-selected sites between 100 km and 200 km offshore in water depths of between 300 m and 600 m to drill exploration wells to various depths below the seabed. The drilling programme will last for around 4 months. There will be a movement of personnel and materials (eg fuel, water, waste) between the drilling area and west Greenland via support vessels and helicopters. Logistical support will be provided primarily by Royal Arctic Line. Once drilling has finished, the drilling units and support vessels will move away, leaving protected wellheads in place on the seafloor. The water depths in which the operations will take place are not considered particularly deep, although the Project is taking place in a fairly extreme operating environment requiring specialist equipment and procedures. Offshore drilling is a common activity which has been extensively studied and is well understood. The emissions and operating aspects of these activities are well documented, although the potential impacts will vary with the particular nature of the operating environment. A number of mitigation measures have
ENVIRONMENTAL RESOURCES MANAGEMENT CAPRICORN GREENLAND EXPLORATION-1
6-2
been incorporated into Project planning to address potential impacts and these are described in the following Chapter.
6.2 IMPACT IDENTIFICATION
The exploration drilling activities have the potential to affect the environment in a number of different ways. These will include physical disturbance, emissions and discharges and waste generation. Potential impacts are identified according to the process described in Chapter 3. The first step in impact identification has been to identify the various types of activity associated with the exploratory drilling, together with their associated emissions and discharges where appropriate. At a high level, the main sources of impact of the project can be divided into: planned events: physical disturbance, emissions, discharges and wastes; and unplanned events: unintentional releases, emergencies, accidents. The activities / sources of potential impact due to the project and the components of the receiving environment that could potentially be affected are identified in Figure 6.1 in the form of a matrix checklist. Since SIA is separate activity the main resource/receptors that can be potentially impacted are: offshore marine natural populations for planned project activities; and offshore and coastal populations for potential accidental events.
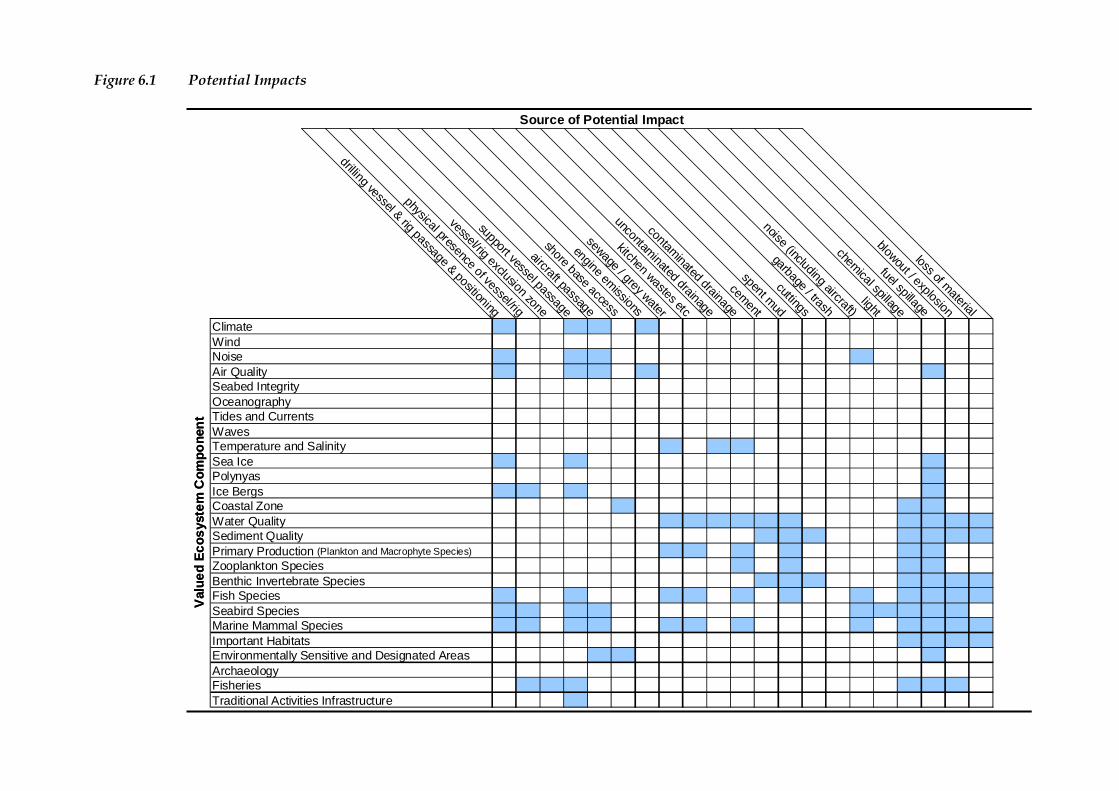
Figure 6.1 Potential Impacts
Source of Potential Impact
drilling vessel & rig passage & positioning
physical presence of vessel/rig
vessel/rig exclusion zone
support vessel passage
aircraft passage
shore base access
engine emissions
sewage / grey water
kitchen wastes etc
uncontaminated drainage
contaminated drainage
cement
spent mud
cuttings
garbage / trash
noise (including aircraft)light
chemical spillagefuel spillage
blowout / explosion
loss of material
Val
ue
d E
co
sys
tem
Co
mp
on
ent
ClimateWindNoiseAir QualitySeabed IntegrityOceanographyTides and CurrentsWavesTemperature and SalinitySea IcePolynyasIce BergsCoastal ZoneWater QualitySediment QualityPrimary Production (Plankton and Macrophyte Species)
Zooplankton SpeciesBenthic Invertebrate SpeciesFish SpeciesSeabird SpeciesMarine Mammal SpeciesImportant HabitatsEnvironmentally Sensitive and Designated AreasArchaeologyFisheriesTraditional Activities Infrastructure
Val
ue
d E
co
sys
tem
Co
mp
on
ent
ENVIRONMENTAL RESOURCES MANAGEMENT CAPRICORN GREENLAND EXPLORATION-1
6-4
6.3 IMPACTS FROM PLANNED EVENTS
6.3.1 Introduction
For convenience in treating the subject, impacts to the environment from planned events have been divided into three main areas as summarised in Box 6.1.
Box 6.1 Main Areas of Biodiversity Impact
1. Impacts due to the drilling vessel and other surface vessel activity (noise, movement, light) during drilling operations: the main resource/receptor groups that could be susceptible to impacts comprise marine mammals and to a lesser extent fish and seabirds.
2. Impacts due to discharges to sea: the main resource/receptor groups susceptible to impact
would be plankton and fish and their predatory fauna higher in the food chain. 3. Impacts due to the seabed footprint (including facilities and cuttings piles): the main
resource/receptor groups that could be susceptible to impacts comprise benthic fauna and bottom-dwelling fish that prey on them.
Potential environmental impacts that could occur in the event of an oil spill are discussed in Section 6.4 below.
6.3.2 Potential Sources of Impact
A number of activities will be taking place at the sea surface throughout the Project that will have potential disturbance effects on the following receptors: marine mammals (whales, dolphins and seals); polar bears; pelagic fish; and seabirds. Both MODUs will mobilise into Greenlandic waters under their own power (ie not requiring towing) and will remain on station at each well site through the use of dynamic positioning thrusters. Once on station there will be vessels undertaking ice breaking and ice management activities, regular supply vessels and stand-by vessels for the MODUs, helicopter operations for transporting personnel between the drilling operations and the shore, as well as fixed wing flights for in-country transfers between Kangerlussuaq and Ilulisat. At the end of drilling operations the drill units and vessels will demobilise under their own power. All the above-mentioned activities will generate noise and have potential disturbance effects on natural populations through physical movement and possibly light.
ENVIRONMENTAL RESOURCES MANAGEMENT CAPRICORN GREENLAND EXPLORATION-1
6-5
6.3.3 Noise Impacts
Potential Sources of Impacts
Both the Stena Forth and Stena Don are Dynamically Positioned Mobile Offshore Drilling Units (MODU) that do not require anchors to keep position. There will be supply vessels visiting the drilling ship and semi-submersible vessels 1-2 times a week, helicopter flights twice a day and one fixed wing flight per day to transport personnel primarily between the MODU, Ware Ship and onshore facilities. The MODUs will require support from ice management and ice breaker vessels and stand-by vessels. These vessels generate noise and vibration which may be conducted by air or through the water. The key sound sources are expected to include vessel propellers and thrusters, with a contribution from the hull (eg originating from marine and deck machinery). This is expected to result in highly variable sound levels, being dependent on the operational mode of each vessel. The key source of aerial noise will be from vessel diesel engines and helicopters. The main sources of noise from these activities can be categorised into the following: Propeller and thrusters: When vessels are travelling at speed cavitation can
occur around the blades of the propeller which causes noise. The thrusters used by Dynamically Positioned vessels emit noise when operating under load to maintain the vessel’s position. These activities normally produce broadband noise with some low tonal peaks.
Machinery noise: When the vessel is stationary or moving at low speeds the
dominant noise often comes from machinery such as large power generation units (diesel engines or gas turbines), compressors and fluid pumps. The noise tends to be of low frequency and tonal in nature. It can be transmitted through different pathways, ie structural (machine to hull to water) and airborne (machine to air to hull to water), or a mixture of both.
Equipment in water: Equipment such as flowlines and valves can produce
noise. Noise produced will tend to be relatively low for drill casing. Ice breaking: The breaking of ice emits noise at frequencies of 20 -1,000 Hz.
Ice breaking creates short loud pulses of underwater sound. Both drill ships and drill rigs produce low frequency underwater noise but drill ships are inherently louder than semi-submersible rigs as ships have a large hull area that contains most of their machinery. Semi-submersible rigs have their machinery mounted on decks above the sea and therefore do not emit as much noise through the water. Drill ships generate underwater sounds in the range of 10 Hz to 10 kHz with average source levels of 179-191 dB re 1 μPa-m whereas anchored semi-
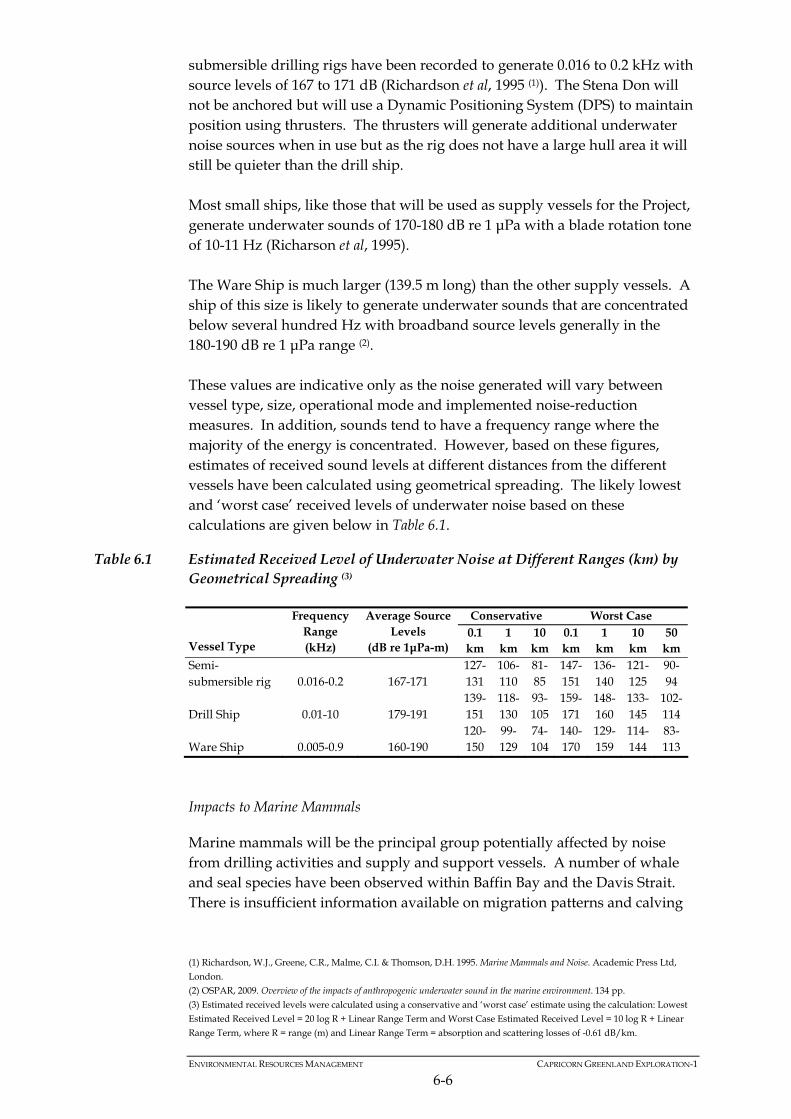
ENVIRONMENTAL RESOURCES MANAGEMENT CAPRICORN GREENLAND EXPLORATION-1
6-6
submersible drilling rigs have been recorded to generate 0.016 to 0.2 kHz with source levels of 167 to 171 dB (Richardson et al, 1995 (1)). The Stena Don will not be anchored but will use a Dynamic Positioning System (DPS) to maintain position using thrusters. The thrusters will generate additional underwater noise sources when in use but as the rig does not have a large hull area it will still be quieter than the drill ship. Most small ships, like those that will be used as supply vessels for the Project, generate underwater sounds of 170-180 dB re 1 μPa with a blade rotation tone of 10-11 Hz (Richarson et al, 1995). The Ware Ship is much larger (139.5 m long) than the other supply vessels. A ship of this size is likely to generate underwater sounds that are concentrated below several hundred Hz with broadband source levels generally in the 180-190 dB re 1 μPa range (2). These values are indicative only as the noise generated will vary between vessel type, size, operational mode and implemented noise-reduction measures. In addition, sounds tend to have a frequency range where the majority of the energy is concentrated. However, based on these figures, estimates of received sound levels at different distances from the different vessels have been calculated using geometrical spreading. The likely lowest and ‘worst case’ received levels of underwater noise based on these calculations are given below in Table 6.1.
Table 6.1 Estimated Received Level of Underwater Noise at Different Ranges (km) by Geometrical Spreading (3)
Conservative Worst Case
Vessel Type
Frequency Range (kHz)
Average Source Levels
(dB re 1μPa-m) 0.1 km
1 km
10 km
0.1 km
1 km
10 km
50 km
Semi-submersible rig 0.016-0.2 167-171
127-131
106-110
81-85
147-151
136-140
121-125
90-94
Drill Ship 0.01-10 179-191 139-151
118-130
93-105
159-171
148-160
133-145
102-114
Ware Ship 0.005-0.9 160-190 120-150
99-129
74-104
140-170
129-159
114-144
83-113
Impacts to Marine Mammals
Marine mammals will be the principal group potentially affected by noise from drilling activities and supply and support vessels. A number of whale and seal species have been observed within Baffin Bay and the Davis Strait. There is insufficient information available on migration patterns and calving
(1) Richardson, W.J., Greene, C.R., Malme, C.I. & Thomson, D.H. 1995. Marine Mammals and Noise. Academic Press Ltd,
London. (2) OSPAR, 2009. Overview of the impacts of anthropogenic underwater sound in the marine environment. 134 pp. (3) Estimated received levels were calculated using a conservative and ‘worst case’ estimate using the calculation: Lowest Estimated Received Level = 20 log R + Linear Range Term and Worst Case Estimated Received Level = 10 log R + Linear
Range Term, where R = range (m) and Linear Range Term = absorption and scattering losses of -0.61 dB/km.
ENVIRONMENTAL RESOURCES MANAGEMENT CAPRICORN GREENLAND EXPLORATION-1
6-7
areas to determine which species are likely to be found within the Sigguk block during the drilling period so a precautionary approach has been taken based on the general distribution of species throughout the year. Of the five species of baleen (or toothless) whales which can be described as low frequency hearing cetaceans, that have been recorded within western Greenland waters, four are likely to be present within the Sigguk block during the drilling period. These are: Minke whale, Balaenoptera acutorostrata; Humpback whale, Megaptera novaeangliae; Fin whale, Balaenoptera physalus; and Blue whale, Balaenoptera musculus. The toothed whales and porpoises (odontocetes) which are mid or high frequency hearing cetaceans that may be present during drilling include: Harbour porpoise, Phocoena phocoena; Bottlenose whale, Hyperoodon ampullatus; Long-finned pilot whale, Globicephalus melas; Killer whale, Orcinus orca; Beluga whale, Delphinapterus laucas; and Sperm whale, Physeter macrocephalus. Four species of seal have the potential to be found within the Sigguk block during drilling. These are: Harp seal, Phoca groenlandica; Hooded seal, Cystophora cristata; Ringed seal, Phoca hispida; and Harbour seal, Phoca vitulina.
Research into the physical damage and behavioural response in marine mammals to noise and vibration generated by drilling activities and vessels is limited and does not provide sufficient agreement between studies to be able to confidently determine which activities and sound levels elicit a response by the animal and which observed behaviours are in response to external factors. For example, studies by Richardson et al (1995) found toothed whales showed both avoidance and attraction to drilling activities. Marine mammals are unlikely to intentionally approach operations producing continuous or semi-continuous sounds that are powerful enough to lead to auditory damage. That is, marine mammals are expected to avoid continuous or semi-continuous sound sources that may cause harm, including any potentially arising from the Project. The rest of this assessment therefore focuses on potential changes in behaviour as a result of the Project. Behavioural changes can include a cessation of normal activities such as regular diving patterns and the commencement of avoidance or ‘startle’
ENVIRONMENTAL RESOURCES MANAGEMENT CAPRICORN GREENLAND EXPLORATION-1
6-8
behaviour, particularly when the noise source is intermittent. For continuous sounds, avoidance behaviour is more likely. Most toothed whales have auditory sensitivity ranges of 150 Hz to 160 kHz with greatest sensitivity around 20 kHz; they are classified as mid-frequency cetaceans. The exception to this is the harbour porpoise which is a high-frequency hearing cetacean with a sensitivity range of 200 Hz to 180 kHz. The majority of noises produced by drilling activities are continuous and of low frequency. Sound generated by the semi-submersible rig will mostly be below 200 Hz, which is outside of the greatest sensitivity range of toothed whales and pinnipeds (seals and walrus). Toothed whales are also unlikely to be impacted by noise from the supply vessels. Drill ships tend to emit higher levels of noise than semi-submersible rigs. Toothed whales and pinnipeds may be impacted by noise and vibration from the Stena Forth drill ship. Studies that played drilling sounds and other noise sources to wild beluga whales (mid-frequency hearing cetaceans) found individuals displayed strong reactions to noise levels of 110-130 dB re 1 μPa rms (1). Pinnipeds generally do not appear to show strong behavioural changes up to 140 dB but studies have not exceeded this sound level (2). Using the information in Table 6.1 above, toothed whales may display strong behavioural response to noise from the drilling ship 1-10 km away using conservative estimates or over 50 km away using worst case estimates. The same estimated received levels suggest toothed whales may display behavioural responses to the Ware Ship 100 m to 1 km away (conservatively) or 10-50 km away using the worst case estimates. Direct measurements to the hearing sensitivity of baleen whales have not been made. However, it is presumed they hear over the same approximate frequency range as the sounds they produce, which gives a hearing sensitivity range of 10 Hz to 10 kHz with the greatest sensitivity below 1 kHz (3). Both the drill ship and the semi-submersible rig will generate noises that may be detected by baleen whales. They have been observed to display avoidance reactions up to 1 km away from well locations with anchored semi-submersible drill rigs and up to 8 km away from well locations with drill ships (4). Such reactions will be limited to the duration of drilling operations. The Ware Ship will produce low frequency noises that may be heard by baleen whales. Baleen whales (low frequency hearing cetaceans) have shown
(1) Awbrey, F. T., & Stewart, B. S. (1983). Behavioral responses of wild beluga whales (Delphinapterus leucas) to noise from oil drilling. Journal of the Acoustical Society of America, 74, S54. (2) Southall, B. L., Bowles, A. E., Ellison, W. T., Finneran, J. J., Gentry, R. L., Greene Jr., C. R., Kastak, D., Ketten, D. R., Miller, J. H., Nachtigall, P. E., Richardson, W. J., Thomas, J. A. & Tyack, P. L., 2007. 4. Criteria for Behavioural Disturbance.
Marine Mammal Noise Exposure Criteria: Initial Scientific Recommendations. Aquatic Mammals, 33(4): 446-473. (3) Department of Communications, Energy and Natural Resources, 2007. Second Strategic Environmental Assessment for
Oil and Gas Activity in Ireland’s Offshore Atlantic Waters: IOSEA2 Porcupine Basin. Environmental Report. Prepared by ERT (Scotland) Ltd for Department of Communications, Energy and Natural Resources.
(4) Department of Communications, Energy and Natural Resources, 2007. Second Strategic Environmental Assessment for Oil and Gas Activity in Ireland’s Offshore Atlantic Waters: IOSEA2 Porcupine Basin. Environmental Report. Prepared by
ERT (Scotland) Ltd for Department of Communications, Energy and Natural Resources.
ENVIRONMENTAL RESOURCES MANAGEMENT CAPRICORN GREENLAND EXPLORATION-1
6-9
strong behavioural reactions to noises over approximately 120 dB rms (1) indicating they may be sensitive to noise from the Ware Ship up to 1 km away or up to 10 km away using worst case estimates. The smaller support vessels and supply boats have a blade rotation tone of around 10 – 11 Hz, which is a low to moderate frequency. The only whales that are sensitive to such sounds are baleen whales. The volume of noise produced by these smaller vessels will increase by 10-15 dB when icebreaking. Cosens and Dueck (2006) found that icebreaking vessels produced noise at a level that beluga whales and narwhals would be expected to detect up to 30 km away (2). Based on expected noise levels and the sensitivity of those species of marine mammal likely to be present in the area, noise impacts to marine mammals from drilling are considered to be of moderate significance. Most of the proposed wellsite locations are 20-50 km away from each other. There is potential when both MODUs are in operation for noise from two wellsite locations to be detected by any marine mammals between the two wellsites. However, in these cases, the noise from one source is likely to dominate the other and there will only be a marginal increase in total noise levels in comparison to the noise levels received from one source. In addition the duration of exposure would be limited. The cumulative impacts of drilling at two wellsites simultaneously are assessed to be not significant. There may be some ice coverage within the Sigguk block in July at the start of the drilling campaign. Occasional encounters with individual polar bears on the ice may be possible at this time. The impact of underwater noise on polar bears is unknown but it is presumed that they would move away from the source of loud noises and leave the water. The transmission of noise through air is far less efficient than through water and impacts to species from airborne noise that may be encountered on ice within the Project Area are assessed to be not significant. Noise impacts to polar bears from drilling are therefore considered to be not significant. Impacts to Fish
The Project drilling activities and vessel presence will not result in noise or vibration impacts that would cause physical damage to fish. Some hearing specialist fish such as herring and Atlantic cod may be able to detect noise from the drill ship and rig. The majority of fish are predicted to swim away to avoid the approaching sound source, the continuous drilling activity and the movement of vessels.
(1) Southall, B. L., Bowles, A. E., Ellison, W. T., Finneran, J. J., Gentry, R. L., Greene Jr., C. R., Kastak, D., Ketten, D. R., Miller, J. H., Nachtigall, P. E., Richardson, W. J., Thomas, J. A. & Tyack, P. L., 2007. 4. Criteria for Behavioural Disturbance.
Marine Mammal Noise Exposure Criteria: Initial Scientific Recommendations. Aquatic Mammals, 33(4): 446-473. (2) Cosens, S.E. & Dueck, L.P. 2006. Icebreaker Noise in Lancaster Sound, N.W.T., Canada: Implications for Marine
Mammal Behaviour. Marine Mammal Science, 9 (3): 285-300.
ENVIRONMENTAL RESOURCES MANAGEMENT CAPRICORN GREENLAND EXPLORATION-1
6-10
Most fish off the west coast of Greenland spawn inshore or outside of the proposed drilling period. The only fish species that may spawn within the Sigguk block during the drilling period are herring which spawn in June on seabed substrate. Herring have only been recorded to depths of 364 m so are only likely to be found in the vicinity of the Alpha wellsite (and possibly the C3/T3 site). All other potential wellsite locations are in deeper waters. Spawning herring may be displaced by the noise and vibration of drilling activities at this wellsite, although there is only expected to be a small overlap with the drilling period. Impacts to some hearing specialist fish are anticipated which will cause some small behavioural changes. Atlantic cod have been listed as Vulnerable on the IUCN Red List and have been assessed to be of medium importance. Overall, the impact is predicted to be minor. Impacts to Seabirds
The most significant potential impact from aerial noise is to sea birds. The dispersed distribution of sea birds at sea and the point source nature of the noise will mitigate any impacts to sea birds offshore. Aerial acoustic impacts to offshore sea birds are thus considered not significant. Throughout the drilling period there will be supply vessels travelling between the MODUs and the onshore supply base at Sisimiut. There are known seabird colonies on the coastline to the north of Sisimiut. These colonies will be sensitive to noise impacts from fast moving supply vessels. The preferred forward base for helicopter transfer of crew is Aasiaat. Helicopters will transport crew to the MODUs twice a day. There are several seabird colonies in the vicinity of Aasiaat that may be impacted by low flying helicopters. Thick-billed murre and eider in particular are sensitive to noise impacts during breeding periods. Disturbance impacts can result in abandonment of nests and eggs. Aerial acoustic impacts from supply vessels and helicopters to seabird colonies are considered to be minor for the majority of species and moderate for thick-billed murre and eider.
6.3.4 Presence and Movement of Vessels
Potential Sources of Impacts
Vessels that will be involved in the drilling operation comprise the drill ship and semi-submersible rig which will remain in position during drilling activities; supply vessels which will frequent the drill ship and rig several times a week; a standby vessel and the Ware Ship which will be present at all times. In addition, approximately two helicopter flights will transport crew between the drill ship/rig and the onshore base daily. Aside from the noise generated by these vessels, their physical presence and movements could have potential impacts on whales, seals and birds. The
ENVIRONMENTAL RESOURCES MANAGEMENT CAPRICORN GREENLAND EXPLORATION-1
6-11
presence and movement of vessels during drilling (exclusive of noise) is likely to have very small zones of influence, only metres or tens of metres in most cases. It is uncertain how the physical presence of vessels will impact whales but generally they are sufficiently mobile to avoid direct physical harm through collision for example. Potential behavioural modifications exhibited by whales that are close to physical structures in or near their habitat may include: movement away from the area; avoidance of the area and/or obstruction of normal movement patterns; mother/calf separation; and interrupted feeding. Behavioural reactions are usually most profound in the case of small fast moving vessels and low flying helicopters. Light emissions from the vessels during the few darkness hours in the day at this time of year may be visible at considerable distances, depending on weather and sea conditions. Lights can often attract migrating birds, especially in poor weather conditions and certain species have been identified as being more susceptible to attraction to lights than others. Little auks (Alle alle) are thought to be more susceptible to being attracted to lights, possibly as they feed partly on phosphorescent plankton (1). Common eider (Somateria mollisma) has also been recorded as being attracted to vessel lights (2). There is a possibility that these lights will attract seabirds in the area, the potential impact of vessel lighting on little auks is considered to be of moderate significance but to other seabirds is considered to be minor.
6.3.5 Noise and Presence/Movement of Vessels Combined
The most likely effect on marine mammals will be a general avoidance of the area. However, the possibility remains that some species may pass in close proximity to project activity. At such times animals would be vulnerable to disturbance, especially by icebreakers, fast moving vessels and low flying helicopters. There are two whale species (fin and blue) that may be present within the area during drilling which have been evaluated by IUCN to be Endangered and the beluga whale and harbour seal have been designated as Critically Endangered by the Greenland Red List. These species are considered to be of high importance. There are eight other species of whale, porpoise and seals that have been assessed to be of medium importance because of their evaluations on the IUCN Red List or the Greenland Red List that may be present during drilling. Mitigation measures will be in place to minimise impacts to whales, porpoises and seals as described in Box 6.2.
(1) Wiese, F.K., Montevecchi, W.A., Davoren, G.K., Huettmann, F., Diamond, A.W. & Linke, J., 2001. Seabirds at Risk
around Offshore Oil Platforms in the North-west Atlantic. Marine Pollution Bulletin. 42 (12): 1285-1290. (2) Mosbech, A., Boertmann, D. and Jespersen, M. 2007. Strategic Environmental Impact Assessment of hydrocarbon
activities in the Disko West area. NERI Technical Report No. 618, 192pp.
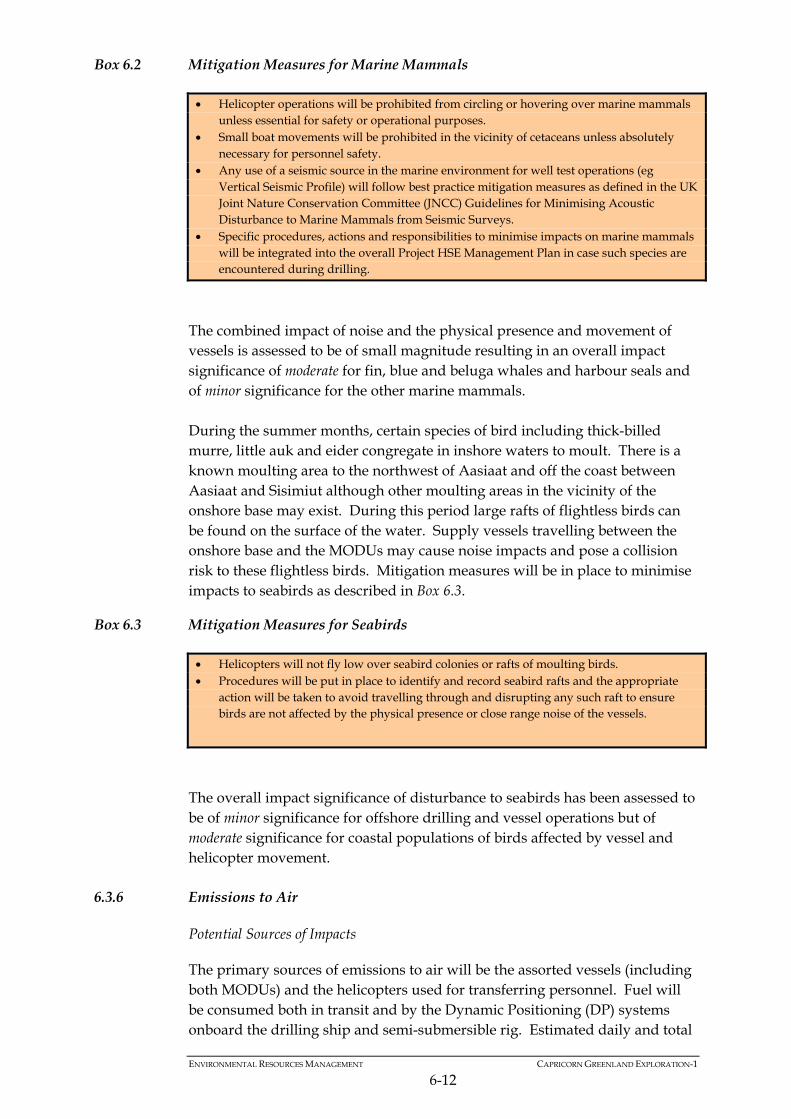
ENVIRONMENTAL RESOURCES MANAGEMENT CAPRICORN GREENLAND EXPLORATION-1
6-12
Box 6.2 Mitigation Measures for Marine Mammals
The combined impact of noise and the physical presence and movement of vessels is assessed to be of small magnitude resulting in an overall impact significance of moderate for fin, blue and beluga whales and harbour seals and of minor significance for the other marine mammals. During the summer months, certain species of bird including thick-billed murre, little auk and eider congregate in inshore waters to moult. There is a known moulting area to the northwest of Aasiaat and off the coast between Aasiaat and Sisimiut although other moulting areas in the vicinity of the onshore base may exist. During this period large rafts of flightless birds can be found on the surface of the water. Supply vessels travelling between the onshore base and the MODUs may cause noise impacts and pose a collision risk to these flightless birds. Mitigation measures will be in place to minimise impacts to seabirds as described in Box 6.3.
Box 6.3 Mitigation Measures for Seabirds
The overall impact significance of disturbance to seabirds has been assessed to be of minor significance for offshore drilling and vessel operations but of moderate significance for coastal populations of birds affected by vessel and helicopter movement.
6.3.6 Emissions to Air
Potential Sources of Impacts
The primary sources of emissions to air will be the assorted vessels (including both MODUs) and the helicopters used for transferring personnel. Fuel will be consumed both in transit and by the Dynamic Positioning (DP) systems onboard the drilling ship and semi-submersible rig. Estimated daily and total
Helicopter operations will be prohibited from circling or hovering over marine mammals unless essential for safety or operational purposes.
Small boat movements will be prohibited in the vicinity of cetaceans unless absolutely necessary for personnel safety.
Any use of a seismic source in the marine environment for well test operations (eg Vertical Seismic Profile) will follow best practice mitigation measures as defined in the UK Joint Nature Conservation Committee (JNCC) Guidelines for Minimising Acoustic Disturbance to Marine Mammals from Seismic Surveys.
Specific procedures, actions and responsibilities to minimise impacts on marine mammals will be integrated into the overall Project HSE Management Plan in case such species are encountered during drilling.
Helicopters will not fly low over seabird colonies or rafts of moulting birds. Procedures will be put in place to identify and record seabird rafts and the appropriate
action will be taken to avoid travelling through and disrupting any such raft to ensure birds are not affected by the physical presence or close range noise of the vessels.
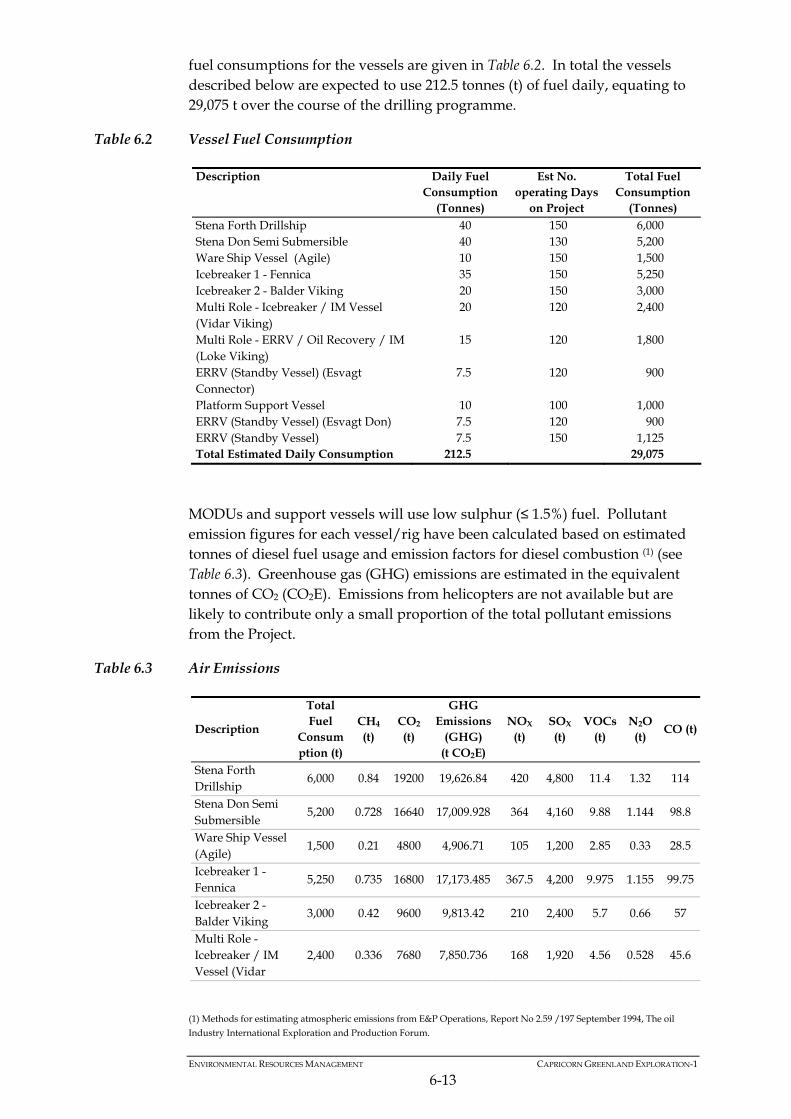
ENVIRONMENTAL RESOURCES MANAGEMENT CAPRICORN GREENLAND EXPLORATION-1
6-13
fuel consumptions for the vessels are given in Table 6.2. In total the vessels described below are expected to use 212.5 tonnes (t) of fuel daily, equating to 29,075 t over the course of the drilling programme.
Table 6.2 Vessel Fuel Consumption
Description Daily Fuel Consumption
(Tonnes)
Est No. operating Days
on Project
Total Fuel Consumption
(Tonnes) Stena Forth Drillship 40 150 6,000 Stena Don Semi Submersible 40 130 5,200 Ware Ship Vessel (Agile) 10 150 1,500 Icebreaker 1 - Fennica 35 150 5,250 Icebreaker 2 - Balder Viking 20 150 3,000 Multi Role - Icebreaker / IM Vessel (Vidar Viking)
20 120 2,400
Multi Role - ERRV / Oil Recovery / IM (Loke Viking)
15 120 1,800
ERRV (Standby Vessel) (Esvagt Connector)
7.5 120 900
Platform Support Vessel 10 100 1,000 ERRV (Standby Vessel) (Esvagt Don) 7.5 120 900 ERRV (Standby Vessel) 7.5 150 1,125 Total Estimated Daily Consumption 212.5 29,075
MODUs and support vessels will use low sulphur (≤ 1.5%) fuel. Pollutant emission figures for each vessel/rig have been calculated based on estimated tonnes of diesel fuel usage and emission factors for diesel combustion (1) (see Table 6.3). Greenhouse gas (GHG) emissions are estimated in the equivalent tonnes of CO2 (CO2E). Emissions from helicopters are not available but are likely to contribute only a small proportion of the total pollutant emissions from the Project.
Table 6.3 Air Emissions
Description
Total Fuel
Consumption (t)
CH4 (t)
CO2 (t)
GHG Emissions
(GHG) (t CO2E)
NOX (t)
SOX (t)
VOCs (t)
N2O (t)
CO (t)
Stena Forth Drillship
6,000 0.84 19200 19,626.84 420 4,800 11.4 1.32 114
Stena Don Semi Submersible
5,200 0.728 16640 17,009.928 364 4,160 9.88 1.144 98.8
Ware Ship Vessel (Agile)
1,500 0.21 4800 4,906.71 105 1,200 2.85 0.33 28.5
Icebreaker 1 - Fennica
5,250 0.735 16800 17,173.485 367.5 4,200 9.975 1.155 99.75
Icebreaker 2 - Balder Viking
3,000 0.42 9600 9,813.42 210 2,400 5.7 0.66 57
Multi Role - Icebreaker / IM Vessel (Vidar
2,400 0.336 7680 7,850.736 168 1,920 4.56 0.528 45.6
(1) Methods for estimating atmospheric emissions from E&P Operations, Report No 2.59 /197 September 1994, The oil
Industry International Exploration and Production Forum.
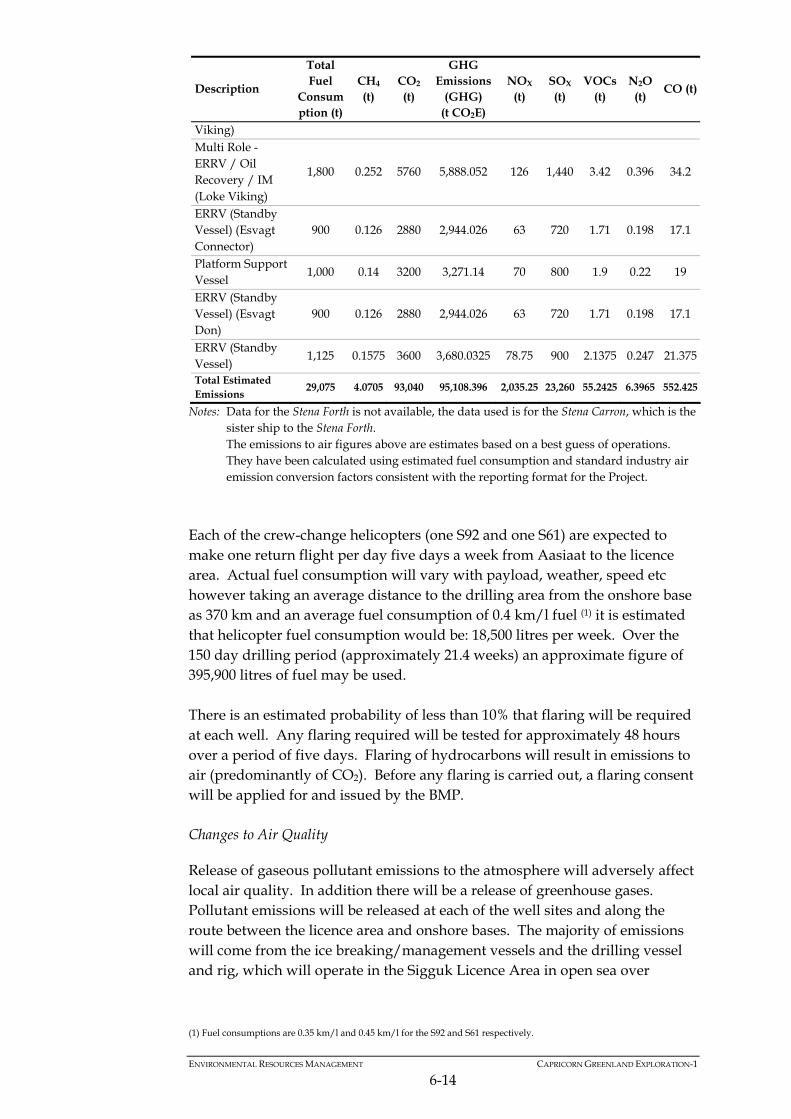
ENVIRONMENTAL RESOURCES MANAGEMENT CAPRICORN GREENLAND EXPLORATION-1
6-14
Description
Total Fuel
Consumption (t)
CH4 (t)
CO2 (t)
GHG Emissions
(GHG) (t CO2E)
NOX (t)
SOX (t)
VOCs (t)
N2O (t)
CO (t)
Viking) Multi Role - ERRV / Oil Recovery / IM (Loke Viking)
1,800 0.252 5760 5,888.052 126 1,440 3.42 0.396 34.2
ERRV (Standby Vessel) (Esvagt Connector)
900 0.126 2880 2,944.026 63 720 1.71 0.198 17.1
Platform Support Vessel
1,000 0.14 3200 3,271.14 70 800 1.9 0.22 19
ERRV (Standby Vessel) (Esvagt Don)
900 0.126 2880 2,944.026 63 720 1.71 0.198 17.1
ERRV (Standby Vessel)
1,125 0.1575 3600 3,680.0325 78.75 900 2.1375 0.247 21.375
Total Estimated Emissions
29,075 4.0705 93,040 95,108.396 2,035.25 23,260 55.2425 6.3965 552.425
Notes: Data for the Stena Forth is not available, the data used is for the Stena Carron, which is the sister ship to the Stena Forth.
The emissions to air figures above are estimates based on a best guess of operations. They have been calculated using estimated fuel consumption and standard industry air emission conversion factors consistent with the reporting format for the Project.
Each of the crew-change helicopters (one S92 and one S61) are expected to make one return flight per day five days a week from Aasiaat to the licence area. Actual fuel consumption will vary with payload, weather, speed etc however taking an average distance to the drilling area from the onshore base as 370 km and an average fuel consumption of 0.4 km/l fuel (1) it is estimated that helicopter fuel consumption would be: 18,500 litres per week. Over the 150 day drilling period (approximately 21.4 weeks) an approximate figure of 395,900 litres of fuel may be used. There is an estimated probability of less than 10% that flaring will be required at each well. Any flaring required will be tested for approximately 48 hours over a period of five days. Flaring of hydrocarbons will result in emissions to air (predominantly of CO2). Before any flaring is carried out, a flaring consent will be applied for and issued by the BMP. Changes to Air Quality
Release of gaseous pollutant emissions to the atmosphere will adversely affect local air quality. In addition there will be a release of greenhouse gases. Pollutant emissions will be released at each of the well sites and along the route between the licence area and onshore bases. The majority of emissions will come from the ice breaking/management vessels and the drilling vessel and rig, which will operate in the Sigguk Licence Area in open sea over
(1) Fuel consumptions are 0.35 km/l and 0.45 km/l for the S92 and S61 respectively.

ENVIRONMENTAL RESOURCES MANAGEMENT CAPRICORN GREENLAND EXPLORATION-1
6-15
100 km from the closest point of the west Greenland coast. The emissions will occur over an estimated period of 150 days. The overall duration of the Project is short term and the drill sites are in open sea with good conditions for the dispersion of pollutants and distant from sensitive receptors. Given the relative scale of the Project in relation to global past and current anthropogenic emissions the contribution to global warming will be inconsequential. Therefore the magnitude of the impact to air quality and to climate change are both rated as negligible to small and the overall impact of emissions to air is assessed as being not significant. If flaring is required it will emit emissions to the air, however, this activity will be of short duration and the following mitigation measures (Box 6.4) will reduce the potential impact to air quality. The residual impact to air quality from flaring after mitigation is assessed to be not significant.
Box 6.4 Mitigation Measures for Impacts to Air
6.3.7 Discharges to Sea
Potential Sources of Impacts
During the drilling period various types of waste and discharge will be produced, each requiring appropriate handling and disposal. Waste and discharges to the marine environment could locally affect water quality and consequently may have impacts to marine ecology. Effluent from the following sources will be discharged: grey water (eg showers, sinks); black water (sewage); organic kitchen waste; drainage, bilge and ballast water; and drilling muds and cuttings. All waste will be handled and disposed of in accordance with the Waste Management Plan and in full compliance with relevant legislation eg MARPOL (1) requirements. Waste materials will be separated offshore into controlled (non-hazardous) and hazardous wastes, solids and liquids. Clinical waste will also be stored separately. All solid waste and will be stored onboard before transfer to shore for disposal/recycling and will therefore not impact the marine environment. Any discharges of controlled (non-
(1) The Relevant provisions are in Annex IV (Sewage) and Annex V (Garbage) to MARPOL 73/78.
Emissions from flaring will be monitored to ensure complete combustion. Compressed air will be used to enhance combustion as required. An oil recovery vessel with full dispersant capability will be on stand by during well test
flaring.
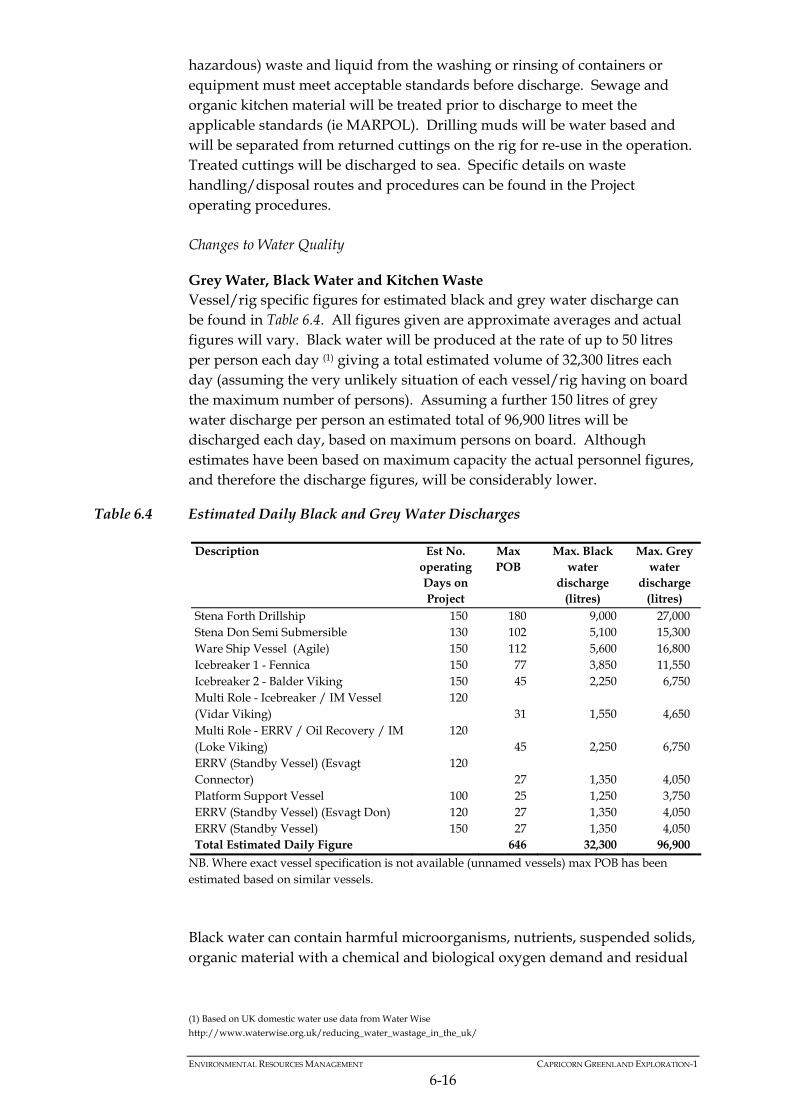
ENVIRONMENTAL RESOURCES MANAGEMENT CAPRICORN GREENLAND EXPLORATION-1
6-16
hazardous) waste and liquid from the washing or rinsing of containers or equipment must meet acceptable standards before discharge. Sewage and organic kitchen material will be treated prior to discharge to meet the applicable standards (ie MARPOL). Drilling muds will be water based and will be separated from returned cuttings on the rig for re-use in the operation. Treated cuttings will be discharged to sea. Specific details on waste handling/disposal routes and procedures can be found in the Project operating procedures. Changes to Water Quality
Grey Water, Black Water and Kitchen Waste Vessel/rig specific figures for estimated black and grey water discharge can be found in Table 6.4. All figures given are approximate averages and actual figures will vary. Black water will be produced at the rate of up to 50 litres per person each day (1) giving a total estimated volume of 32,300 litres each day (assuming the very unlikely situation of each vessel/rig having on board the maximum number of persons). Assuming a further 150 litres of grey water discharge per person an estimated total of 96,900 litres will be discharged each day, based on maximum persons on board. Although estimates have been based on maximum capacity the actual personnel figures, and therefore the discharge figures, will be considerably lower.
Table 6.4 Estimated Daily Black and Grey Water Discharges
Description Est No. operating Days on Project
Max POB
Max. Black water
discharge (litres)
Max. Grey water
discharge (litres)
Stena Forth Drillship 150 180 9,000 27,000 Stena Don Semi Submersible 130 102 5,100 15,300 Ware Ship Vessel (Agile) 150 112 5,600 16,800 Icebreaker 1 - Fennica 150 77 3,850 11,550 Icebreaker 2 - Balder Viking 150 45 2,250 6,750 Multi Role - Icebreaker / IM Vessel (Vidar Viking)
120 31 1,550 4,650
Multi Role - ERRV / Oil Recovery / IM (Loke Viking)
120 45 2,250 6,750
ERRV (Standby Vessel) (Esvagt Connector)
120 27 1,350 4,050
Platform Support Vessel 100 25 1,250 3,750 ERRV (Standby Vessel) (Esvagt Don) 120 27 1,350 4,050 ERRV (Standby Vessel) 150 27 1,350 4,050 Total Estimated Daily Figure 646 32,300 96,900
NB. Where exact vessel specification is not available (unnamed vessels) max POB has been estimated based on similar vessels.
Black water can contain harmful microorganisms, nutrients, suspended solids, organic material with a chemical and biological oxygen demand and residual
(1) Based on UK domestic water use data from Water Wise
http://www.waterwise.org.uk/reducing_water_wastage_in_the_uk/
ENVIRONMENTAL RESOURCES MANAGEMENT CAPRICORN GREENLAND EXPLORATION-1
6-17
chlorine from the sewage treatment disinfection. Onboard treatment in a certificated IMO compliant sewage treatment facility will treat sewage to IMO standards as set out in Annex IV of MARPOL. The treatment standard is 250 faecal coliforms per 100 ml, the total suspended solids must be less than 50 mg/l and the BOD less than 50 mg/l. Increased BOD directly impacts water quality by increasing the uptake of dissolved oxygen concentration by microorganisms that decompose organic material in the sewage, which in turn reduces the dissolved oxygen content of the water. Multiple drilling locations over a period of 150 days will spread the treated black water discharge over a large offshore area in relatively small volumes, which is expected to disperse and dilute quickly due to tidal currents. The magnitude of impact of the water quality due to sewage discharge is small. Adverse effects are not anticipated. Grey water discharge includes drainage from baths, showers, laundry, wash basins and dishwater. Grey water is not required to be treated before discharge by the regulations in MARPOL 73/78 as it is not considered garbage or sewage (provided it does not contain a pollutant prescribed in the Regulations or MARPOL). Therefore it may be discharged to the sea without treatment. Grey water will be discharged over a large area (mostly offshore within the Sigguk Licence Area but no closer than 100 km to the coast) over a period of 150 days and is not predicted to cause deterioration to water quality except locally to the discharge. The magnitude of this discharge is considered small. Harm to marine organisms due to grey water discharge is therefore not predicted. Organic waste discharge from galleys will introduce nutrients and organic material to the water column, which may cause a local increase in BOD. The ground (macerated) discharge will disperse and dilute quickly due to tidal currents and will be released from several vessels over a large offshore area over approximately 150 days. The magnitude of impact to water quality from organic waste discharge is rated as small. The sensitivity of the water column has been categorised as low. The overall impact of grey and black water discharges and organic kitchen waste discharge is assessed as minor. Drainage, Bilge and Ballast Water Drainage and bilge water will potentially be contaminated with oil/hydrocarbons, which would reduce water quality if discharged to the marine environment. Drainage and bilge water will be directed to the holding tank (bilges) then routed through an oil/water separator and monitored for oil concentration before discharge. The content of oil contaminated bilge water is controlled under MARPOL Annex 1 and discharge of water with greater than 100 ppm is prohibited. Discharge of such oily water is only permitted if the vessel is underway. Thus whilst drilling, discharge of oil contaminated bilge water will be prohibited. Other vessels may discharge bilge water in compliance with MARPOL
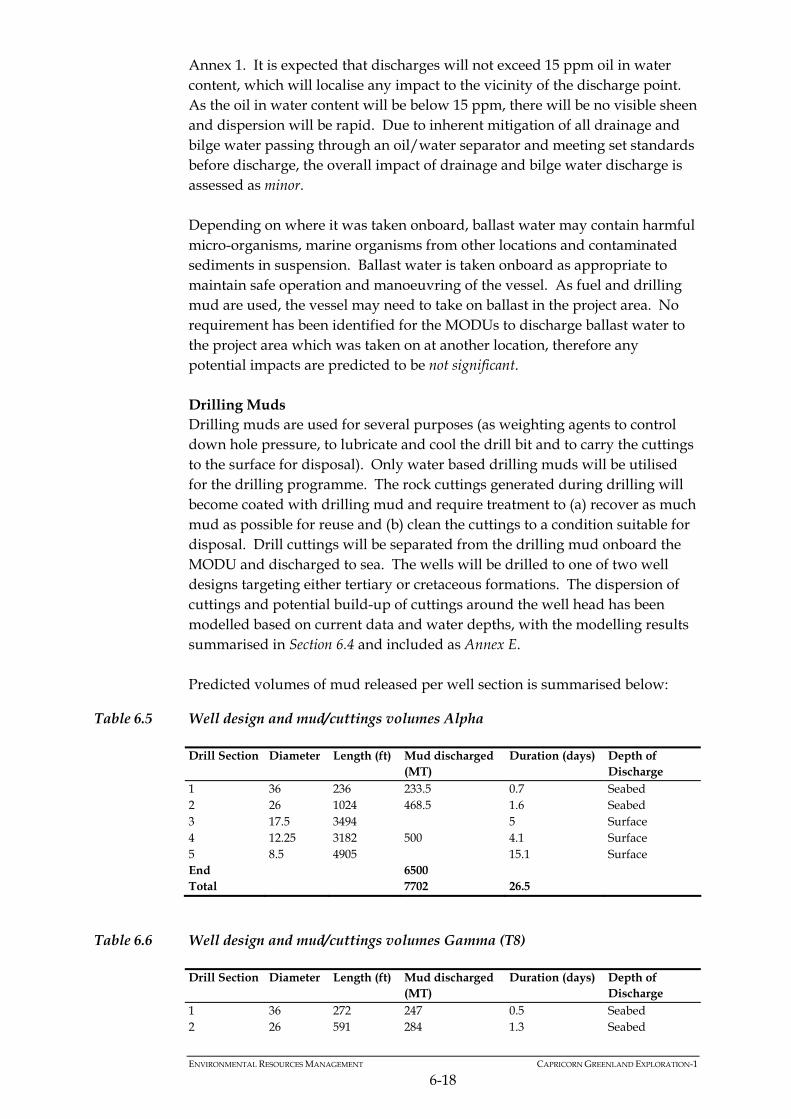
ENVIRONMENTAL RESOURCES MANAGEMENT CAPRICORN GREENLAND EXPLORATION-1
6-18
Annex 1. It is expected that discharges will not exceed 15 ppm oil in water content, which will localise any impact to the vicinity of the discharge point. As the oil in water content will be below 15 ppm, there will be no visible sheen and dispersion will be rapid. Due to inherent mitigation of all drainage and bilge water passing through an oil/water separator and meeting set standards before discharge, the overall impact of drainage and bilge water discharge is assessed as minor. Depending on where it was taken onboard, ballast water may contain harmful micro-organisms, marine organisms from other locations and contaminated sediments in suspension. Ballast water is taken onboard as appropriate to maintain safe operation and manoeuvring of the vessel. As fuel and drilling mud are used, the vessel may need to take on ballast in the project area. No requirement has been identified for the MODUs to discharge ballast water to the project area which was taken on at another location, therefore any potential impacts are predicted to be not significant. Drilling Muds Drilling muds are used for several purposes (as weighting agents to control down hole pressure, to lubricate and cool the drill bit and to carry the cuttings to the surface for disposal). Only water based drilling muds will be utilised for the drilling programme. The rock cuttings generated during drilling will become coated with drilling mud and require treatment to (a) recover as much mud as possible for reuse and (b) clean the cuttings to a condition suitable for disposal. Drill cuttings will be separated from the drilling mud onboard the MODU and discharged to sea. The wells will be drilled to one of two well designs targeting either tertiary or cretaceous formations. The dispersion of cuttings and potential build-up of cuttings around the well head has been modelled based on current data and water depths, with the modelling results summarised in Section 6.4 and included as Annex E. Predicted volumes of mud released per well section is summarised below:
Table 6.5 Well design and mud/cuttings volumes Alpha
Drill Section Diameter Length (ft) Mud discharged (MT)
Duration (days) Depth of Discharge
1 36 236 233.5 0.7 Seabed 2 26 1024 468.5 1.6 Seabed 3 17.5 3494 5 Surface 4 12.25 3182 4.1 Surface 5 8.5 4905
500 15.1 Surface
End 6500 Total 7702 26.5
Table 6.6 Well design and mud/cuttings volumes Gamma (T8)
Drill Section Diameter Length (ft) Mud discharged (MT)
Duration (days) Depth of Discharge
1 36 272 247 0.5 Seabed 2 26 591 284 1.3 Seabed
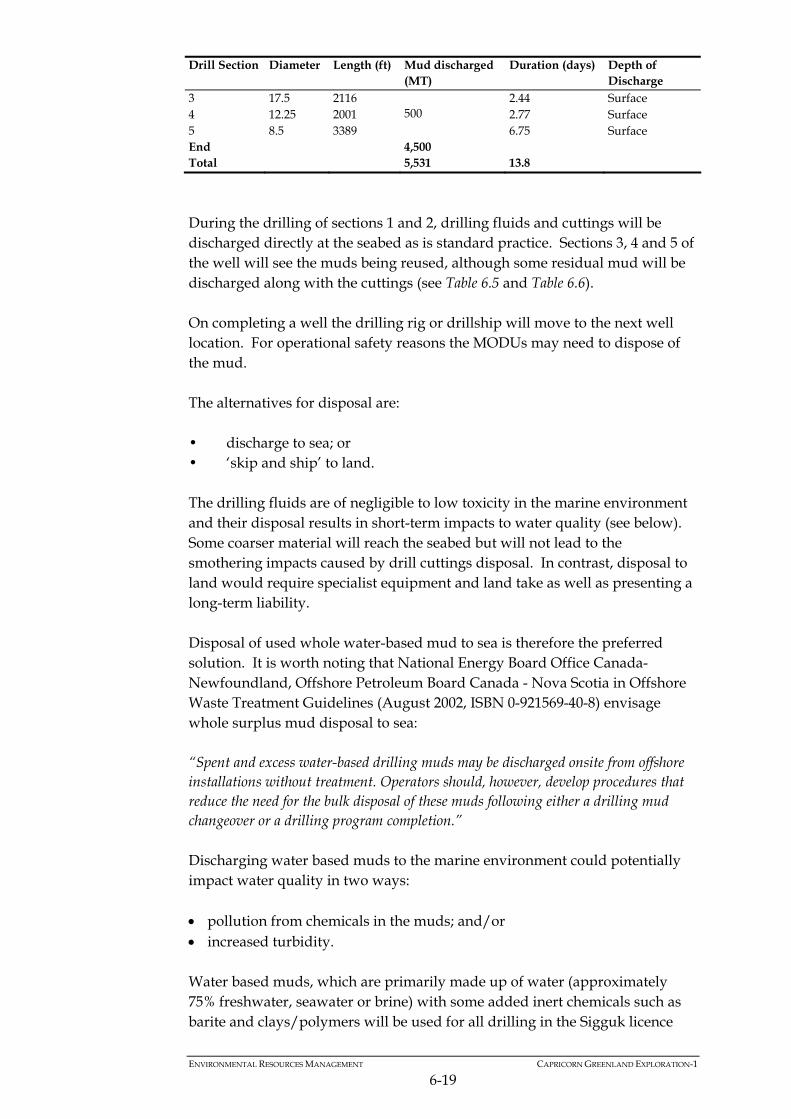
ENVIRONMENTAL RESOURCES MANAGEMENT CAPRICORN GREENLAND EXPLORATION-1
6-19
Drill Section Diameter Length (ft) Mud discharged (MT)
Duration (days) Depth of Discharge
3 17.5 2116 2.44 Surface 4 12.25 2001 2.77 Surface 5 8.5 3389
500 6.75 Surface
End 4,500 Total 5,531 13.8
During the drilling of sections 1 and 2, drilling fluids and cuttings will be discharged directly at the seabed as is standard practice. Sections 3, 4 and 5 of the well will see the muds being reused, although some residual mud will be discharged along with the cuttings (see Table 6.5 and Table 6.6). On completing a well the drilling rig or drillship will move to the next well location. For operational safety reasons the MODUs may need to dispose of the mud. The alternatives for disposal are: • discharge to sea; or • ‘skip and ship’ to land. The drilling fluids are of negligible to low toxicity in the marine environment and their disposal results in short-term impacts to water quality (see below). Some coarser material will reach the seabed but will not lead to the smothering impacts caused by drill cuttings disposal. In contrast, disposal to land would require specialist equipment and land take as well as presenting a long-term liability. Disposal of used whole water-based mud to sea is therefore the preferred solution. It is worth noting that National Energy Board Office Canada-Newfoundland, Offshore Petroleum Board Canada - Nova Scotia in Offshore Waste Treatment Guidelines (August 2002, ISBN 0-921569-40-8) envisage whole surplus mud disposal to sea: “Spent and excess water-based drilling muds may be discharged onsite from offshore installations without treatment. Operators should, however, develop procedures that reduce the need for the bulk disposal of these muds following either a drilling mud changeover or a drilling program completion.” Discharging water based muds to the marine environment could potentially impact water quality in two ways: pollution from chemicals in the muds; and/or increased turbidity. Water based muds, which are primarily made up of water (approximately 75% freshwater, seawater or brine) with some added inert chemicals such as barite and clays/polymers will be used for all drilling in the Sigguk licence
ENVIRONMENTAL RESOURCES MANAGEMENT CAPRICORN GREENLAND EXPLORATION-1
6-20
area. The drilling fluid chemicals to be utilised by the Project will conform to OSPAR HOCNF and CHARM as well as being classified as substances that Pose Little Or No Risk to the environment (PLONOR chemicals) under Annex 6 of the OSPAR convention, unless there is an overriding case for using a non-PLONOR chemical (ie there is none available for the specific task). Water based muds are considered to be essentially non-toxic and the effect on marine life is considered slight to none when drill cuttings are discharged overboard. They also do not bioaccumulate. The magnitude of impact caused by the chemical content of the water based muds on the water quality is regarded as small. Discharge of water based muds and cuttings at the sea bed will cause local increases in turbidity near to the seabed, while discharges at the sea surface will be suspended in sea water creating a discharge ‘plume’ of finer material released from the coarser cuttings that drift with prevailing currents. Rapid dilution and dispersion of the discharge ‘plume’ is expected due to tidal currents and the water depths in the Sigguk block (>300 m). Dilution of the ‘plume’ in well-mixed ocean waters, is estimated to be 100-fold within 10 m of the discharge and 1,000-fold after 10 minutes approximately 100 m from the platform (depending on the current speed) (1). The magnitude of increased turbidity in the water column due to discharged drilling muds is considered small. Whilst drilling the reservoir it is possible that hydrocarbons may be released into the cuttings discharge from oil bearing rock. The oiled cuttings will be returned to the rig for treatment prior to disposal. If on-board treatment cannot reduce the proportion of oil on cuttings to a level agreed with the Greenland authorities, they will be contained and transported for treatment or disposal at a suitable facility outside of Greenland. At the end of drilling there will be a one off discharge event of non-toxic water based muds. Any ‘plume’ created from the discharge of drilling muds to the water column will likely dilute and disperse quickly with no lasting effects. The sensitivity of the water column has been categorised as low. The magnitude of impact from both additives in the mud and increased turbidity has been judged to be small. The overall impact of drilling muds discharged to the water column will be of minor significance. Harm to pelagic species is unlikely and has not previously been demonstrated (2). The impacts of water based mud and cutting discharge are primarily physical (with potential secondary effects to seabed fauna) as they will form a footprint on the seabed and have been assessed separately in Section 6.3.8.
(1) Neff, J.M. (2005) Composition, environmental fates and biological effects of Water based drilling muds and Cuttings
discharged to the marine environment: A Synthesis and Annotated Bibliography Prepared for Petroleum Environmental Research Forum (PERF) and American Petroleum Institute.
(2) Neff, J.M. (2005) Composition, environmental fates and biological effects of Water based drilling muds and Cuttings discharged to the marine environment: A Synthesis and Annotated Bibliography Prepared for Petroleum Environmental
Research Forum (PERF) and American Petroleum Institute.
ENVIRONMENTAL RESOURCES MANAGEMENT CAPRICORN GREENLAND EXPLORATION-1
6-21
All liquid discharges will affect the salinity and potentially the temperature of the local area. However, due to tidal currents diluting and dispersing the effluent the local changes are expected to be minor and will not impact the marine environment. Secondary Impacts to Marine Fauna
Increased nutrients in the water column due to discharge of organic waste may increase the local productivity of phytoplankton (primary production), however, any changes in productivity are expected to be short lived as discharges will be rapidly diluted in the water column. Increased turbidity to the water column could potentially affect local levels of primary production through a reduction in light. However, it has been shown that given rapid dilution of water based drilling muds, phytoplankton composition or productivity is not significantly affected relative to natural variation (1). Due to high levels of natural variation, impacts to phytoplankton caused by changes in water quality are therefore not expected to be measurable. Benthic organisms may be affected by increased turbidity, which can cause irritation to the benthos and affect their growth and feeding. Some species are more sensitive to increased turbidity than others. As increased turbidity is local and temporary the magnitude of impact to the benthos is very small. Their importance is rated as low. The overall impact of changes in water quality due to discharges to benthic organisms is not significant. Impacts to benthos due to smothering caused by drilling muds discharge is assessed in Section 6.3.8. Temporary distribution changes may also be caused by opportunistic feeders being attracted to organic kitchen waste discharge as a food source. The magnitude of changes on this scale is small in comparison to the natural variability in fish distribution. Fish have been categorised as of medium importance. The overall impact to fish caused by changes in the water column is minor. A population of marine mammals is most likely to be affected if their foraging or migration is interrupted or if they are disturbed during their breeding period. Many marine mammal species utilise fish as a food source and may be impacted by changes in fish distribution. However, secondary impacts up the food chain will not occur. The impact to marine mammals due to changes in the water column is assessed to be not significant.
(1) Alldredge, AL., Eliasa, M. and Gotschalk, CC. (1986) Effects of drilling muds and mud additives on the primary production of natural assemblages of marine phytoplankton Marine Environmental Research. Volume 19, Issue 2, 157-
176pp.
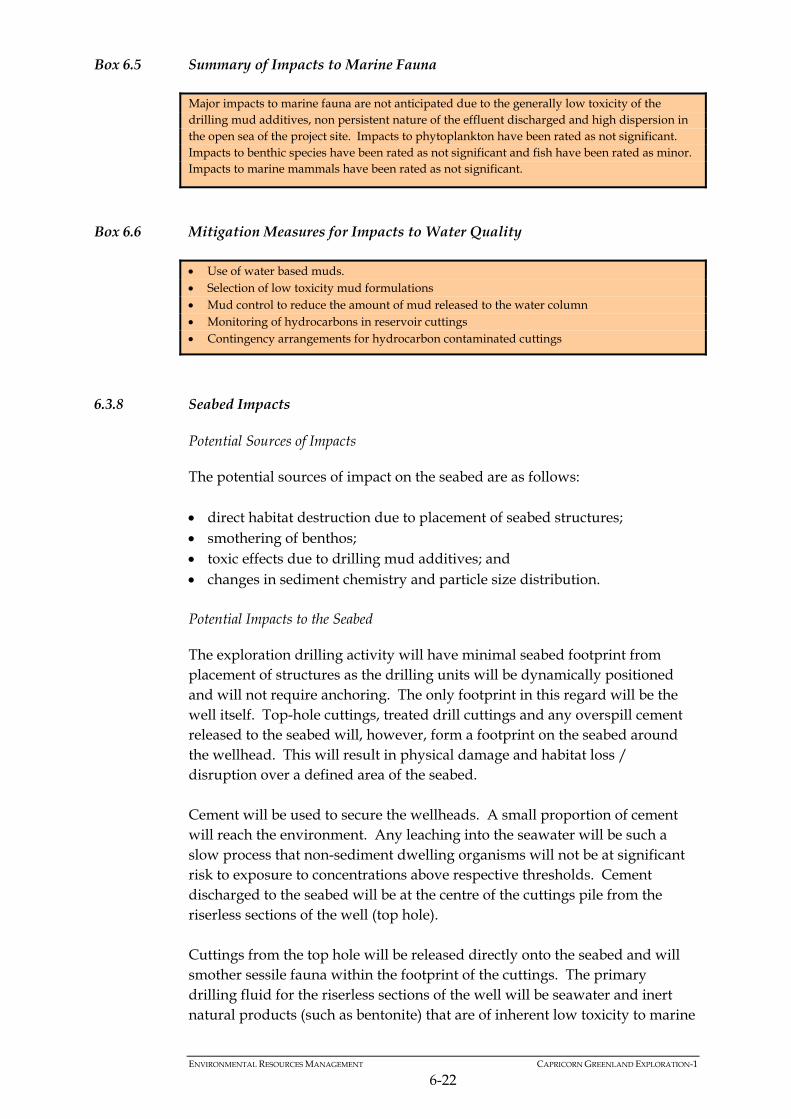
ENVIRONMENTAL RESOURCES MANAGEMENT CAPRICORN GREENLAND EXPLORATION-1
6-22
Box 6.5 Summary of Impacts to Marine Fauna
Box 6.6 Mitigation Measures for Impacts to Water Quality
6.3.8 Seabed Impacts
Potential Sources of Impacts
The potential sources of impact on the seabed are as follows: direct habitat destruction due to placement of seabed structures; smothering of benthos; toxic effects due to drilling mud additives; and changes in sediment chemistry and particle size distribution. Potential Impacts to the Seabed
The exploration drilling activity will have minimal seabed footprint from placement of structures as the drilling units will be dynamically positioned and will not require anchoring. The only footprint in this regard will be the well itself. Top-hole cuttings, treated drill cuttings and any overspill cement released to the seabed will, however, form a footprint on the seabed around the wellhead. This will result in physical damage and habitat loss / disruption over a defined area of the seabed. Cement will be used to secure the wellheads. A small proportion of cement will reach the environment. Any leaching into the seawater will be such a slow process that non-sediment dwelling organisms will not be at significant risk to exposure to concentrations above respective thresholds. Cement discharged to the seabed will be at the centre of the cuttings pile from the riserless sections of the well (top hole). Cuttings from the top hole will be released directly onto the seabed and will smother sessile fauna within the footprint of the cuttings. The primary drilling fluid for the riserless sections of the well will be seawater and inert natural products (such as bentonite) that are of inherent low toxicity to marine
Major impacts to marine fauna are not anticipated due to the generally low toxicity of the drilling mud additives, non persistent nature of the effluent discharged and high dispersion in the open sea of the project site. Impacts to phytoplankton have been rated as not significant. Impacts to benthic species have been rated as not significant and fish have been rated as minor. Impacts to marine mammals have been rated as not significant.
Use of water based muds. Selection of low toxicity mud formulations Mud control to reduce the amount of mud released to the water column Monitoring of hydrocarbons in reservoir cuttings Contingency arrangements for hydrocarbon contaminated cuttings

ENVIRONMENTAL RESOURCES MANAGEMENT CAPRICORN GREENLAND EXPLORATION-1
6-23
life. Reactivity and dissolution of chemicals into seawater will be limited. Once the riser is in place, cuttings will be returned to the drilling unit, separated from the drilling muds and discharged through a pipe near the sea surface. Cuttings dispersion modelling has been undertaken by Applied Science Associates Ltd (ASA) for four representative well locations to give a full field plot of the maximum area to be affected by cuttings to the 1 mm depth of deposition contour. Four potential well locations (including both Alpha and T8) were selected for the cuttings dispersion modelling, with modelling at two of the potential well locations considered unnecessary due to the similarities in position, depth and current profile with other nearby locations. For all locations modelled the predicted bottom deposition greater than 1 mm extends less than 200 m from the drill site in any direction, and is primarily due to the discharged cuttings which remain in the vicinity due to their faster settling rates. Deposits greater than 1 mm in thickness will cover an area of approximately 0.13 km2 at the Alpha well, 0.08 km2 at the T4 and T16 wells, and 0.09 km2 at the T8 well (Gamma). Very low levels (0.01 mm) of deposition are predicted further out from the well sites but deposition at this level is not considered environmentally relevant (see Figure 6.2).
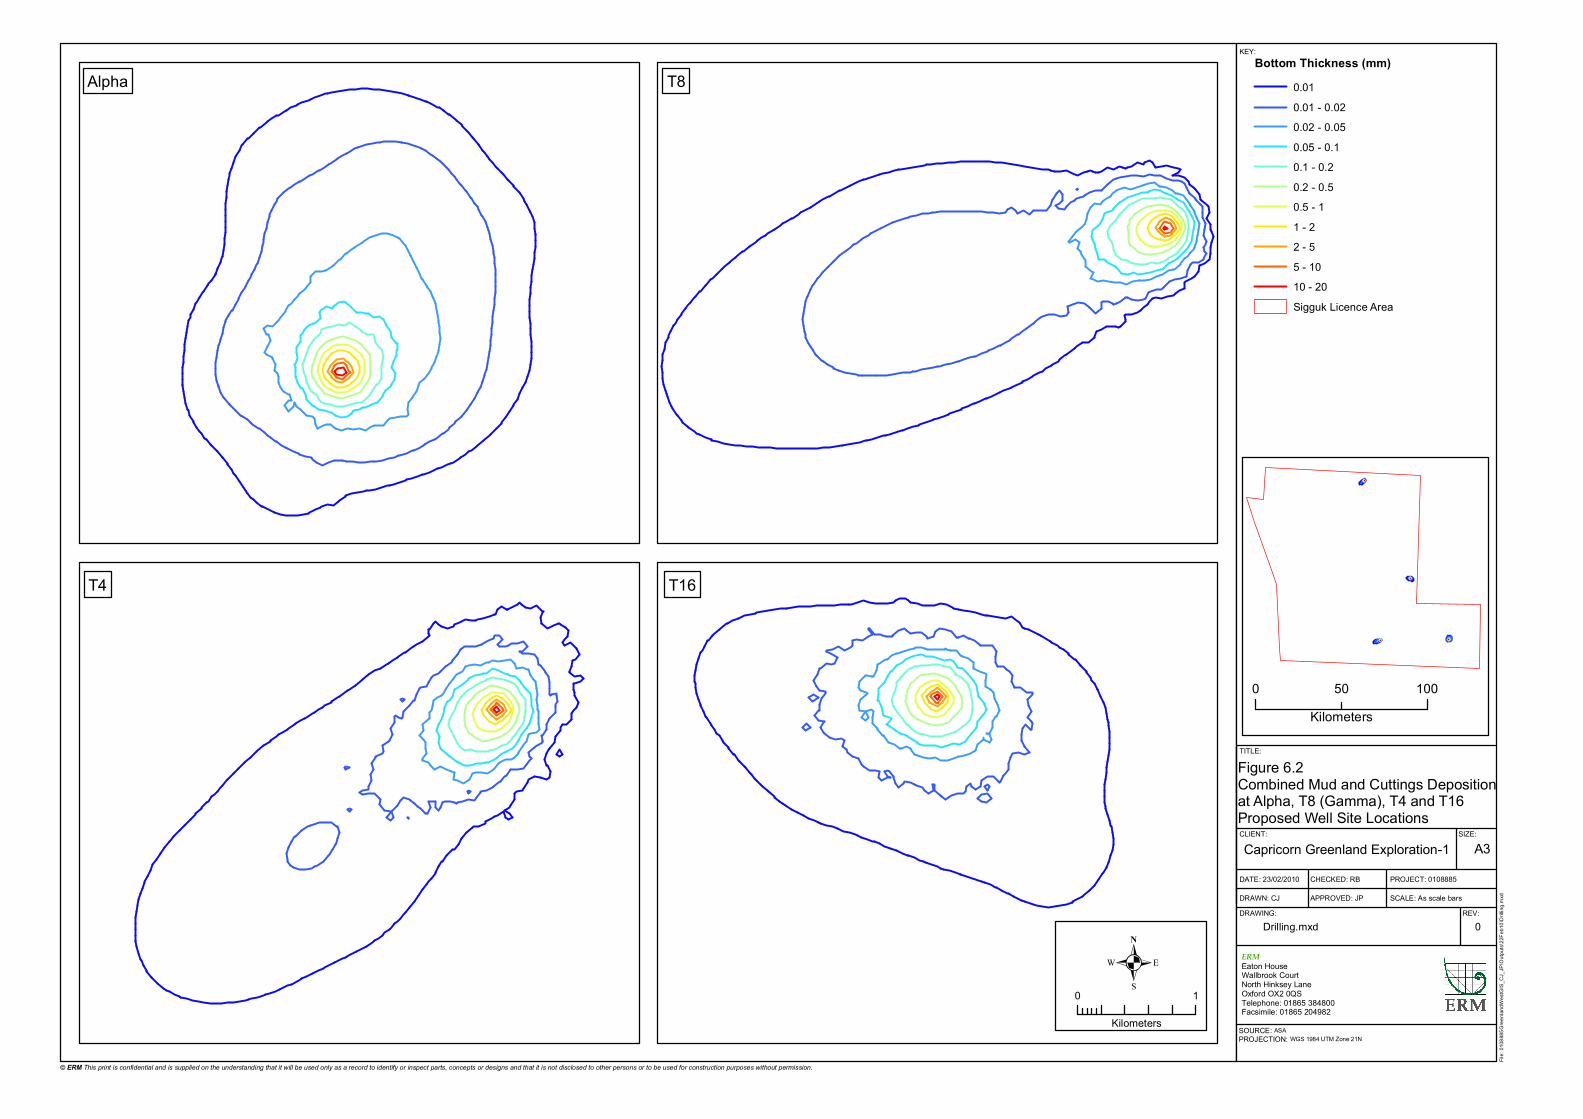
SIZE:
TITLE:
DATE: 23/02/2010
DRAWN: CJ
CHECKED: RB
APPROVED: JP
PROJECT: 0108885
SCALE: As scale barsDRAWING: REV:
KEY:
A3
Figure 6.2Combined Mud and Cuttings Deposition at Alpha, T8 (Gamma), T4 and T16 Proposed Well Site Locations
Drilling.mxd 0
Bottom Thickness (mm)0.010.01 - 0.020.02 - 0.050.05 - 0.10.1 - 0.20.2 - 0.50.5 - 11 - 22 - 55 - 1010 - 20Sigguk Licence Area
CLIENT:Capricorn Greenland Exploration-1
T16
T8
T4
Alpha
File:
0108
885G
reenla
ndW
estG
IS_C
J_JP
\Outp
uts\22
Feb1
0\Drill
ing.m
xd
ERMEaton HouseWallbrook CourtNorth Hinksey LaneOxford OX2 0QSTelephone: 01865 384800Facsimile: 01865 204982
© ERM This print is confidential and is supplied on the understanding that it will be used only as a record to identify or inspect parts, concepts or designs and that it is not disclosed to other persons or to be used for construction purposes without permission.
SOURCE: ASAPROJECTION: WGS 1984 UTM Zone 21N
.0 1
Kilometers
0 10050Kilometers
ENVIRONMENTAL RESOURCES MANAGEMENT CAPRICORN GREENLAND EXPLORATION-1
6-25
The drilling mud additives will be of generally low toxicity as discussed in Section 6.3.7. On board treatment of cuttings as described in Section 6.3.7 will reduce the proportion of the mud co-discharged with the cuttings. It is possible that small amounts of petroleum products may be associated with the cuttings drilled through the oil containing formations. If on board treatment cannot reduce the proportion of oil on cuttings to a level agreed with the Greenland authorities, they will be contained and transported for treatment or disposal at a suitable facility. A specialist waste management contactor will be used to transport any oiled cuttings and all necessary transfer notes and permits will be obtained and held. Studies on water based mud cuttings piles which have been contaminated with hydrocarbons from drilling through geological strata indicate that levels are generally below the threshold for causing effects in benthos ie 50 to 60 mg/kg (1). Studies of water based mud cuttings piles demonstrate that effects are related to the amount of cuttings discharged and the extent to which they accumulate. The mechanism of impact is by burial and a reduction in sediment reduction-oxidation (redox) potential (the amount of oxygen in the sediment) due to the oxidation and microbial degradation of biologically degradable chemicals in the mud. Unused mud will be disposed of at the surface in such a way as to encourage dispersion in the water column entraining the muds in a seawater flow at the surface. The seabed at the well sites is not subject to strong currents or wave action so erosion of the cuttings pile would be slow; however both Alpha and T8 are subject to periodic ice scour which may cause erosion of the cuttings pile and it is likely that the other potential well site locations are also subject to periodic ice scour. The benthos of the well sites is typical of circumpolar waters of this depth and reflects the relative stability of the ocean floor. In areas subject to high levels of deposition mortality of sedentary species will result as they will be unable to migrate upwards through the cuttings deposit. The cuttings pile surface will be colonised by opportunistic species able to tolerate disturbance and the reduced redox potential, which are likely to colonise the area quickly. Typically the opportunists would comprise large numbers of a few species which are small and have relatively short life spans. Once the well has been completed and deposition of cuttings stopped, larger longer-lived species will recolonise the area. This sequence would be similar to the recovery of a location affected by ice scour.
(1) Neff, J. M., 2005. Composition, environmental fates, and biological effects of water based drilling muds and cuttings discharged to the marine environment: A synthesis and annotated bibliography. Prepared for Petroleum Environmental Research Forum
(PERF) and American Petroleum Institute.
ENVIRONMENTAL RESOURCES MANAGEMENT CAPRICORN GREENLAND EXPLORATION-1
6-26
The area over which effects on fauna are anticipated is predicted to be small, less than 0.05 km2 for both wells based on the 5 mm deposition contour. Ultimately the cuttings piles would be similar to surrounding areas in terms of their benthic communities but it is likely there would be some differences due to the different physical and chemical characteristics of the sediment on the pile. Recovery to a stable community would likely take one to two seasons. In summary the effects of the cuttings deposition on the seabed will be to change the benthic communities over a small area for a short period of time. Sediment chemistry and particle size would be changed for a longer period within the footprint of the cuttings deposition. The drilling mud additives are low toxicity and will not bio-accumulate. The overall impact from drill cuttings to the seabed and associated benthic communities is assessed to be minor. Provided the dispersion of waste mud is encouraged it will not accumulate on the seabed and resultant effects will be negligible. After well suspension and abandonment, recolonisation of the area by benthic fauna will commence. The cement chemicals to be utilised by the Project will be used downhole and will conform to OSPAR HOCNF standards and Danish chemical registration systems. Any leaching of chemicals from the cement will be released at levels not toxic to the environment. The area of seabed affected will be very small and significance is predicted to have no impact.
Box 6.7 Mitigation Measures for Impacts to the Seabed
6.4 IMPACTS FROM UNPLANNED EVENTS
6.4.1 Introduction
This section addresses the potential for accidental oil spill events, chemical spills and unexpected loss of materials associated with the proposed drilling activity, their likelihood of occurrence and the potential impacts on environmental resources and receptors should they occur. The measures that will be established to prevent unplanned events and to respond to any such events that do occur are summarised in the Environmental Management and Mitigation Chapter. Full details of the procedures in place to respond to oil spills during the drilling campaign are provided in the project specific Oil Spill Response Plan.
Selection of low toxicity mud formulations. Mud control reduce amount of mud discharged to water column. Monitoring of hydrocarbons in reservoir cuttings. Contingency arrangements for hydrocarbon contaminated cuttings. Dissipative disposal of unused mud.
ENVIRONMENTAL RESOURCES MANAGEMENT CAPRICORN GREENLAND EXPLORATION-1
6-27
For the present project the main potential source of accidental impact to the environment would be in the event of an oil spill. Oil spill scenarios were considered for the development based on historical information and the project description. Scenarios where chosen for further study where they could provide insight into the potential for environmental harm to important receptors in the project area. Oil spill modelling was undertaken to inform the assessment as detailed in Section 6.4.2 with full details provided in Annex E. Various hazardous materials will be stored and used in bulk (eg in containers or systems with greater than 1 m3 capacity) during construction and operation. The most important of these are listed below: diesel; heavy fuel oil; lubricating oils; hydraulic oils; and aviation fuel. Spills of crude oil from the geological reservoir, diesel and heavy fuel oil were considered the most significant due to their presence offshore in potentially large quantities and potential effects. Data from the International Association of Oil and Gas Producers indicate that for all oil and gas operating areas of the world small spills (<10 bbl or 1.6 m3) are the most common with the size of the spill being inversely related to likelihood (1). The potential for major environmental harm is dependent on the context and location of the spill but is closely related to the size. In the context of this development most small spills could occur on vessels in areas where fuel is handled. These areas will be bunded onshore and on the MODUs and vessels and therefore spilled oil would have little probability of reaching the sea. The impacts of small spills are correspondingly of lesser potential significance, therefore this assessment concentrates on medium and larger spills, which as stated earlier are much less likely to occur. The main risk of a large spill during exploration drilling is either a vessel collision or a loss of well control in combination with encountering a hydrocarbon reservoir containing oil at pressure greater than the hydrostatic head of the overlying water column. These two scenarios have therefore been selected for further consideration to assess the likelihood of the incident occurring, modelling of oil spill fate and the vulnerability and sensitivity of the resources which may be affected.
(1) OGP, 2009. Environmental performance in the E and P Industry 2008 data. Available from:
<http://www.ogp.org.uk/pubs/429.pdf>

ENVIRONMENTAL RESOURCES MANAGEMENT CAPRICORN GREENLAND EXPLORATION-1
6-28
6.4.2 Oil Spill Modelling
The approach methods and results of the oil spill modelling are explained fully in Annex E. Assessment of Sensitivity and Vulnerability
For the purposes of this assessment, sensitivity is defined as the potential of an oil spill to cause serious harm or damage to a receptor or resource. This will depend on a number of factors such as: the tendency for the receptor to recover; the effect on the receptor of exposure to oil (eg death or serious impairment
of species); the life stage of an organism; and the season with relation to presence or absence of receptors. Vulnerability in this report refers to the tendency of the receptor to be exposed to oil which is present in the immediate vicinity. Thus there will be a physical pathway by which the oil can reach the receptor. This is a combination of proximity to contaminated seawater which is dependent on the dispersion and physical behaviour of the oil and the seasonal presence or absence of the receptor. Receptors for which there is no clear or consistent pathway by which they may be affected by an oil spill are not considered vulnerable. For example there may be very sensitive habitats which are above the high tide line and therefore not reached by beached oil. The sensitivity and vulnerability of major animal groups and habitats which are at risk from an oil spill in the project area are discussed in Annex E.
6.4.3 Scenarios Modelled
No precise information is available on the type of oil likely to be encountered during drilling. A typical medium crude with a high tendency to emulsify was therefore chosen to base the oil spill modelling on to represent a reasonable worst case. The characteristics of the oil types under consideration are summarised in Table 6.7 below.
Table 6.7 Characteristics of oil types modelled
Oil Type Density (g/cm3) Viscosity (cP) Surface Tension
(dyne/cm)
Maximum Water
Content % Medium Crude 0.8373 33.0 30.0 70 Diesel Fuel 0.8310 2.8 27.5 0 Heavy Fuel Oil 0.9275 17.0 30.2 60
At each site three potential spill scenarios were considered: a blowout of medium crude oil; a maximum release of diesel oil; and a maximum release of heavy fuel oil. All spill scenarios were simulated during the drilling period,
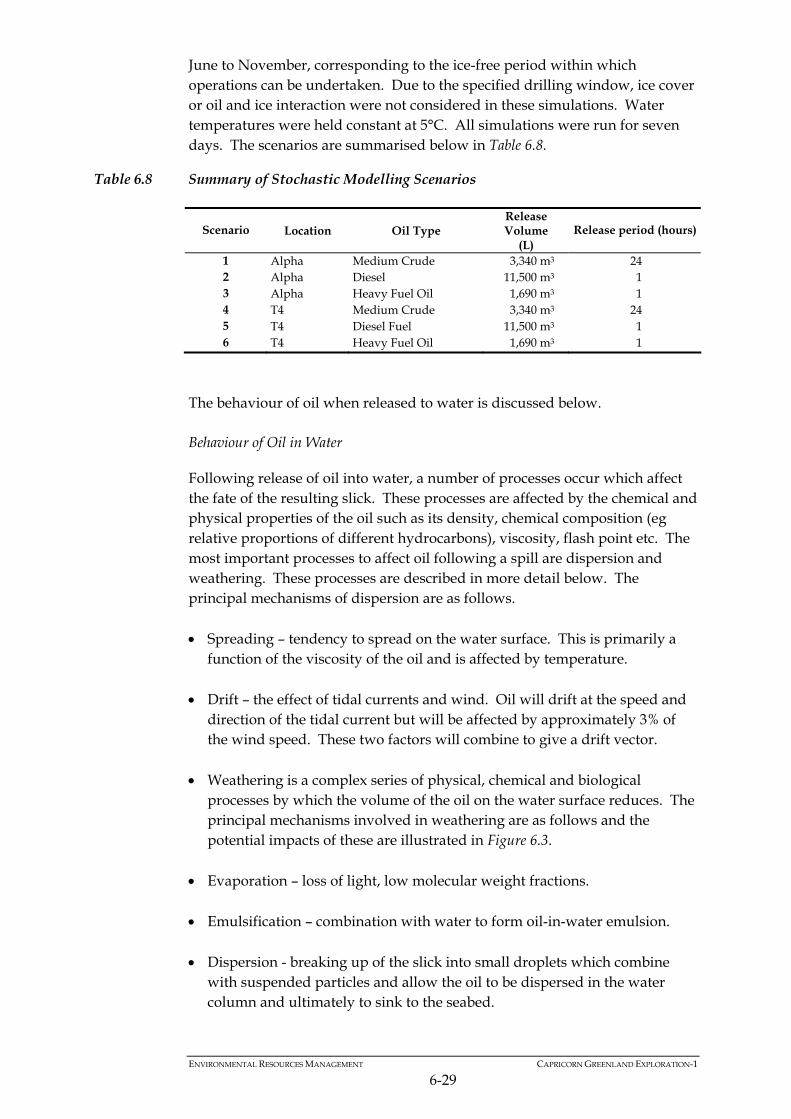
ENVIRONMENTAL RESOURCES MANAGEMENT CAPRICORN GREENLAND EXPLORATION-1
6-29
June to November, corresponding to the ice-free period within which operations can be undertaken. Due to the specified drilling window, ice cover or oil and ice interaction were not considered in these simulations. Water temperatures were held constant at 5°C. All simulations were run for seven days. The scenarios are summarised below in Table 6.8.
Table 6.8 Summary of Stochastic Modelling Scenarios
Scenario Location Oil Type Release Volume
(L) Release period (hours)
1 Alpha Medium Crude 3,340 m3 24 2 Alpha Diesel 11,500 m3 1 3 Alpha Heavy Fuel Oil 1,690 m3 1 4 T4 Medium Crude 3,340 m3 24 5 T4 Diesel Fuel 11,500 m3 1 6 T4 Heavy Fuel Oil 1,690 m3 1
The behaviour of oil when released to water is discussed below. Behaviour of Oil in Water
Following release of oil into water, a number of processes occur which affect the fate of the resulting slick. These processes are affected by the chemical and physical properties of the oil such as its density, chemical composition (eg relative proportions of different hydrocarbons), viscosity, flash point etc. The most important processes to affect oil following a spill are dispersion and weathering. These processes are described in more detail below. The principal mechanisms of dispersion are as follows. Spreading – tendency to spread on the water surface. This is primarily a
function of the viscosity of the oil and is affected by temperature. Drift – the effect of tidal currents and wind. Oil will drift at the speed and
direction of the tidal current but will be affected by approximately 3% of the wind speed. These two factors will combine to give a drift vector.
Weathering is a complex series of physical, chemical and biological
processes by which the volume of the oil on the water surface reduces. The principal mechanisms involved in weathering are as follows and the potential impacts of these are illustrated in Figure 6.3.
Evaporation – loss of light, low molecular weight fractions. Emulsification – combination with water to form oil-in-water emulsion. Dispersion - breaking up of the slick into small droplets which combine
with suspended particles and allow the oil to be dispersed in the water column and ultimately to sink to the seabed.
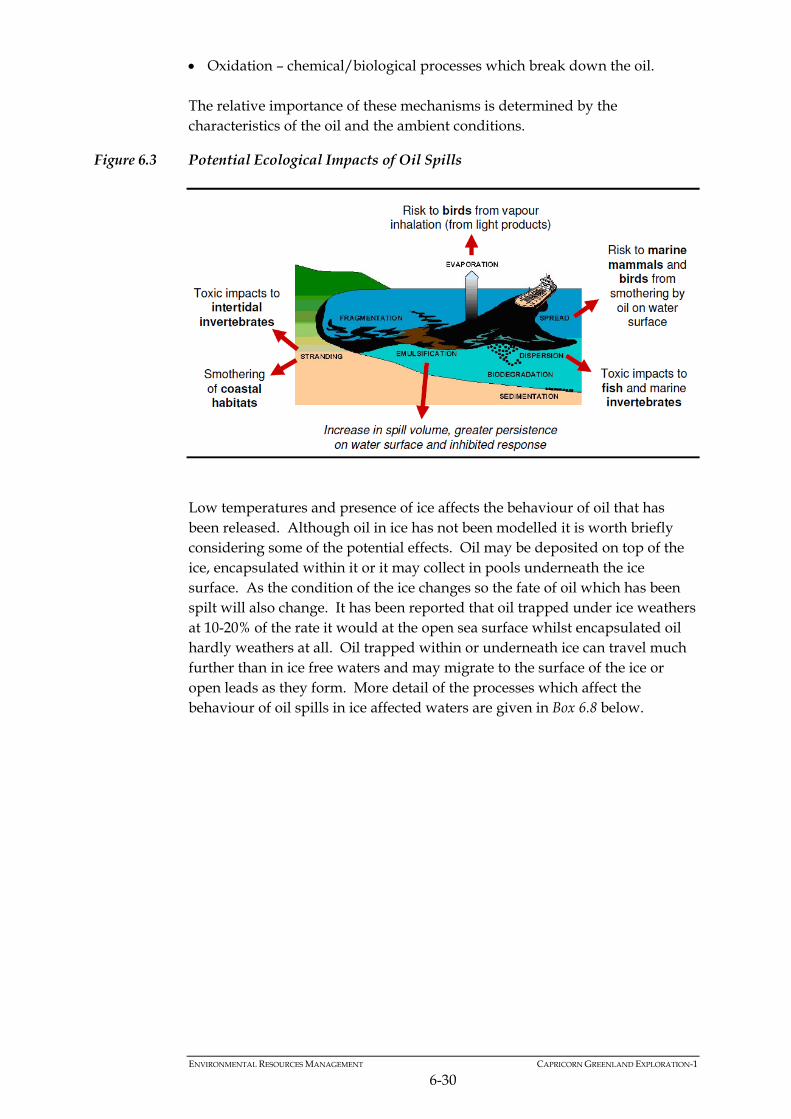
ENVIRONMENTAL RESOURCES MANAGEMENT CAPRICORN GREENLAND EXPLORATION-1
6-30
Oxidation – chemical/biological processes which break down the oil. The relative importance of these mechanisms is determined by the characteristics of the oil and the ambient conditions.
Figure 6.3 Potential Ecological Impacts of Oil Spills
Low temperatures and presence of ice affects the behaviour of oil that has been released. Although oil in ice has not been modelled it is worth briefly considering some of the potential effects. Oil may be deposited on top of the ice, encapsulated within it or it may collect in pools underneath the ice surface. As the condition of the ice changes so the fate of oil which has been spilt will also change. It has been reported that oil trapped under ice weathers at 10-20% of the rate it would at the open sea surface whilst encapsulated oil hardly weathers at all. Oil trapped within or underneath ice can travel much further than in ice free waters and may migrate to the surface of the ice or open leads as they form. More detail of the processes which affect the behaviour of oil spills in ice affected waters are given in Box 6.8 below.
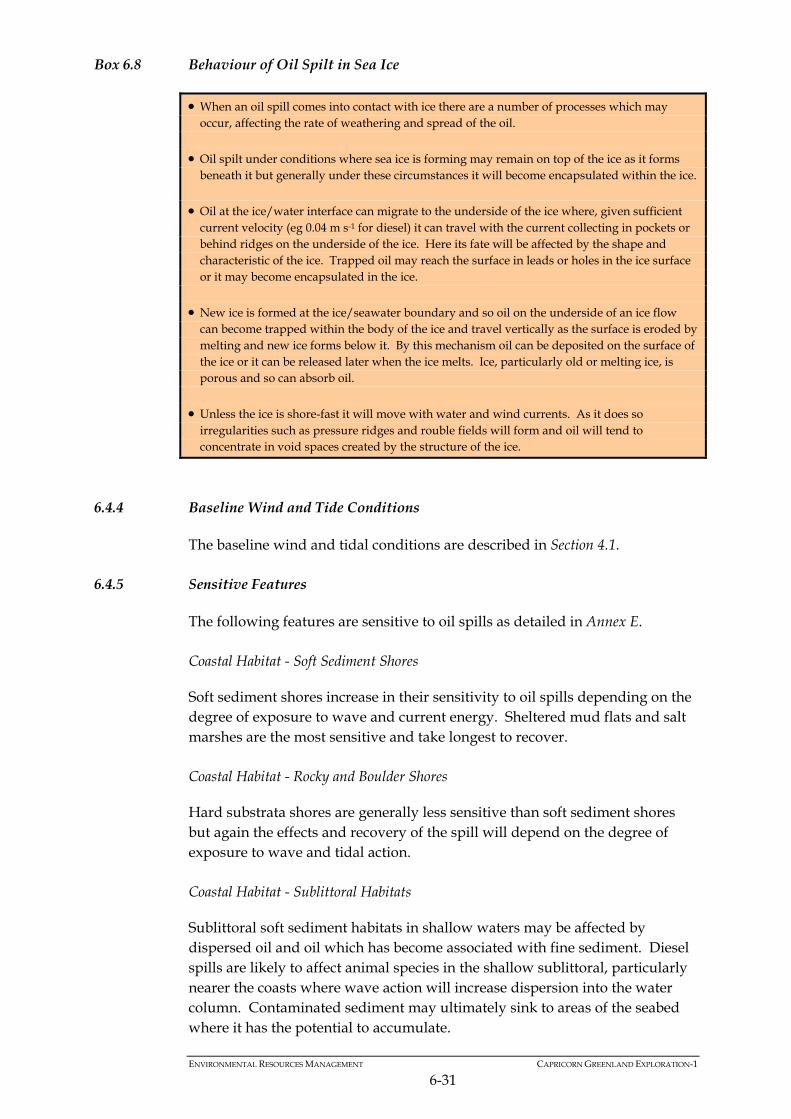
ENVIRONMENTAL RESOURCES MANAGEMENT CAPRICORN GREENLAND EXPLORATION-1
6-31
Box 6.8 Behaviour of Oil Spilt in Sea Ice
6.4.4 Baseline Wind and Tide Conditions
The baseline wind and tidal conditions are described in Section 4.1.
6.4.5 Sensitive Features
The following features are sensitive to oil spills as detailed in Annex E. Coastal Habitat - Soft Sediment Shores
Soft sediment shores increase in their sensitivity to oil spills depending on the degree of exposure to wave and current energy. Sheltered mud flats and salt marshes are the most sensitive and take longest to recover. Coastal Habitat - Rocky and Boulder Shores
Hard substrata shores are generally less sensitive than soft sediment shores but again the effects and recovery of the spill will depend on the degree of exposure to wave and tidal action. Coastal Habitat - Sublittoral Habitats
Sublittoral soft sediment habitats in shallow waters may be affected by dispersed oil and oil which has become associated with fine sediment. Diesel spills are likely to affect animal species in the shallow sublittoral, particularly nearer the coasts where wave action will increase dispersion into the water column. Contaminated sediment may ultimately sink to areas of the seabed where it has the potential to accumulate.
When an oil spill comes into contact with ice there are a number of processes which may occur, affecting the rate of weathering and spread of the oil.
Oil spilt under conditions where sea ice is forming may remain on top of the ice as it forms beneath it but generally under these circumstances it will become encapsulated within the ice.
Oil at the ice/water interface can migrate to the underside of the ice where, given sufficient current velocity (eg 0.04 m s-1 for diesel) it can travel with the current collecting in pockets or behind ridges on the underside of the ice. Here its fate will be affected by the shape and characteristic of the ice. Trapped oil may reach the surface in leads or holes in the ice surface or it may become encapsulated in the ice.
New ice is formed at the ice/seawater boundary and so oil on the underside of an ice flow can become trapped within the body of the ice and travel vertically as the surface is eroded by melting and new ice forms below it. By this mechanism oil can be deposited on the surface of the ice or it can be released later when the ice melts. Ice, particularly old or melting ice, is porous and so can absorb oil.
Unless the ice is shore-fast it will move with water and wind currents. As it does so irregularities such as pressure ridges and rouble fields will form and oil will tend to concentrate in void spaces created by the structure of the ice.
ENVIRONMENTAL RESOURCES MANAGEMENT CAPRICORN GREENLAND EXPLORATION-1
6-32
Birds
Sea birds (ie auks, gulls and water fowl) are highly sensitive to oil spills because of their potential exposure to oil on the water surface and tendency to congregate in high density aggregations during critical periods eg breeding and migration. The oil principally affects birds by removal of the natural buoyancy and thermal insulating properties of the feathers and by ingestion during feeding and grooming. Birds that forage at sea are sensitive to oil exposure. This could be particularly damaging to the population during the breeding season when parent birds are feeding unfledged young and subsequently for moulting young. The species most likely to be affected by a spill depends on the circumstances of the incident eg the time of year, location, size and type of oil and type of habitat affected. Severe events can be harmful at the population level (1). Williams et al (1995) (2) proposed a method for assessment of seabird vulnerability to surface pollutants which used the following factors to generate a vulnerability score for the UK coastal waters and the North Sea. Proportion of each species that was oiled of those found dead on the
shoreline and the proportion of the time spent on the surface of the sea by that species (based on UK survey data).
Bio-geographical population. Potential rate of recovery following a reduction in numbers. Reliance on the marine environment. This approach provides a useful insight into the potential effects of oil spills on sea birds in the study area and is used below to indicate the general vulnerability of the main types (auks, gulls and water fowl) of seabirds. Auks and divers are generally the most sensitive species due to their reliance on the open sea habitat and their low potential for recovery followed by gulls and then water fowl. More detail is provided in Annex E. Sea Mammals - Pinnipeds
The following causes of harm to seals from oil have been identified based on Engelhardt (1983) (3):
(1) Piatt, J. F., Carter, H. R. & Nettleship D. N. 1990. Effects of Oil Pollution on Marine Bird Populations. Proceedings from: the Oil Symposium Herndon, Virginia October 16-18, 1990. (2) Willians, J. M., Tasker, M. L., Carter, I. C. & Webb, A. 1995. A method of assessing seabird vulnerability to surface pollution. IBIS, 137:147-152. (3) Englehardt, F.R. 1985. Petroleum Effects on Marine Mammals. Aquatic Toxicology, 4:199-217
ENVIRONMENTAL RESOURCES MANAGEMENT CAPRICORN GREENLAND EXPLORATION-1
6-33
damage to sensitive tissue through direct contact with lungs following inhalation or eyes through direct contact;
toxic effects following ingestion; effects on thermoregulation; impairment of locomotion in viscous oil; and behavioural modifications due to avoidance. Seals are not highly sensitive to oil contamination as they do not rely on their fur for insulation, do not groom themselves and do not tend therefore to take up hydrocarbon residues. The vulnerability of pinnipeds will depend on the following factors. Habitat. Physical contact with oil will be greater where the spill affects the
coast or ice used by seals to breed or haul out. Species which spend proportionately more of their time hauled out will have a greater exposure to oil than those which spend a greater proportion at sea. Oil spilt amongst ice is likely to take longer to weather, may be encapsulated and concentrated in leads or breathing holes. Consequently seals which use ice for breeding and hauling out are more vulnerable than those which do not.
Gregariousness. Potentially a larger proportion of a population could be
affected if a spill contaminates locations where gregarious species congregate.
Feeding habit. Oil spills have the potential to affect inshore, shallow water food resources. Deeper benthic and pelagic resources are less likely to be contaminated. Seals which feed on shallow benthic infaunal prey are more likely to ingest oil and be affected by a reduction in the availability of their food.
Population status. Population size within a biogeographical area is an
important factor which affects the potential for recovery from natural or anthropogenic impacts. Larger populations are more robust against mortality and or lowered rates of breeding success.
Of the seals in the study area, walrus are the most potentially sensitive due to their gregarious nature, shallow benthic feeding habit and use of the ice and or land all year round. Other seals which congregate on the ice are moderately vulnerable. Sea Mammals - Cetaceans
A number of potentially harmful effects of oil on cetaceans have been postulated as follows (based on Geraci and Aubin, 1988 (1) and Englehardt, 1985 (1)):
(1) Geraci, J. R. & Aubin, D. J. 1988. Synthesis of effects of oil on marine mammals. MMS report. Contract No. 14-12-0001-
30283.
ENVIRONMENTAL RESOURCES MANAGEMENT CAPRICORN GREENLAND EXPLORATION-1
6-34
damage to sensitive tissue through direct contact with lungs (following inhalation) or eyes;
toxic effects following ingestion; blocking of blow hole. fouling of baleen plates; and behavioural modifications due to avoidance. There is no evidence that any of the identified potential effects of oil has resulted in death or harm to a cetacean species (2) (3) although it has been suggested that a dolphin may have died from a blocked blow hole following a spill of viscous oil (4). Circumstantial evidence also suggests that the Exxon Valdez incident was responsible for mortality in resident killer whales living in the vicinity of the spill (5). There is certainly the potential for individual animals to be harmed by exposure to oil and the most vulnerable are cetaceans that spend time amongst the ice pack where oil would be concentrated in leads and breathing holes increasing the probability of exposure. Of the species regularly present in the project area the most vulnerable species are likely to be beluga and bowhead whales (6). Polar Bear
The following causes of harm to polar bears from oil have been identified (based on Engelhardt, 1985) (7): damage to sensitive tissue through direct contact with lungs (following
inhalation) or eyes; toxic effects following ingestion; affects on thermoregulation; and behavioural modifications due to avoidance. Experimental evidence has indicated that polar bears can take up hydrocarbon residues through their skin and by inhalation but primarily by ingestion (8). Polar bears will groom contaminated fur, resulting in ingestion of oil. This has been shown to have the potential to be fatal (9). Polar bears are reliant on their fur for thermal insulation which is severely affected by the presence of oil. The metabolic rate of bears affected by oil has been shown to increase significantly to counteract the increased heat loss (10). In addition to metabolic
(1) Englelhardt F.R (1985) Petroleum Effects on Marine Mammals . Aquatic Tocicology Vol 4 p199-217 (2) Geraci, J. R. & Aubin, D. J. 1988. Synthesis of effects of oil on marine mammals. MMS report. Contract No. 14-12-0001-
30283. (3) Englelhardt F.R (1985) Petroleum Effects on Marine Mammals . Aquatic Tocicology Vol 4 p199-217 (4) Brownell, R. L., 1971. Whales, dolphins and oil pollution. In : Straughn, D. (ed.) Biological and oceanographic survey of the
Santa Barabara Channel oil spill, 1968 -1970. Vol 1, 255-276. (5) Exxon Valdez Trustees Council (2010). Killer Whale. Available from:
http://www.evostc.state.ak.us/recovery/status_orca.cfm. Downloaded: 23rd February 2010. (6) Geraci, J. R. & Aubin, D. J. 1988. Synthesis of effects of oil on marine mammals. MMS report. Contract No. 14-12-0001-
30283. (7) Englelhardt F.R (1985) Petroleum Effects on Marine Mammals . Aquatic Tocicology Vol 4 p199-217
(8) Englelhardt F.R (1985) Petroleum Effects on Marine Mammals . Aquatic Tocicology Vol 4 p199-217 (9) Englelhardt F.R (1985) Petroleum Effects on Marine Mammals . Aquatic Tocicology Vol 4 p199-217
(10) Englelhardt F.R (1985) Petroleum Effects on Marine Mammals . Aquatic Tocicology Vol 4 p199-217
ENVIRONMENTAL RESOURCES MANAGEMENT CAPRICORN GREENLAND EXPLORATION-1
6-35
effects bears have been shown to avoid oil contaminated water (1). Such avoidance is likely to result in decreased hunting efficiency. From the above it is strongly suggested that polar bears are very sensitive to oil contamination and if a spill affects the ice in which they hunt, they would also be vulnerable.
6.4.6 Mitigation of Oil Spill Impacts
Prevention
The most likely spill scenarios will involve small spills during fuel handling and storage. Key factors in reducing the likelihood and severity of such spills are listed below: equipment standards; operational control, procedures and training; planning of critical activities; navigational risk control; and meteorological risk control. Equipment Standards
Equipment standards will be maintained through the enforcement of requirements for specific design criteria. Preventive maintenance on critical fuel handling and storage components will be undertaken. Oil spill prevention measures will be incorporated in audit and inspection routines for the vessels. Operational Control, Procedures and Training
Where necessary, oil spill prevention measures will be incorporated into operational procedures. Specific controls will be adopted for vessel offloading, bunkering and refuelling. The procedures will include specific controls on the supervision and competence of critical roles. Training standards and requirements will also be specified. Specific controls will be adopted in response to circumstances which increase oil spill risk for example, low temperatures or high winds affecting vessel operations at the jetty and non routine events such as heavy lifting operations near oil storage and delivery systems. Specific procedures will be adopted to reduce risk due to operators being unfit to work. Planning
Operations which are subject to a high risk of oil spill will be planned. If necessary specific oil spill risk will be incorporated into job hazard analysis
(1) Geraci, J. R. & Aubin, D. J. 1988. Synthesis of effects of oil on marine mammals. MMS report. Contract No. 14-12-0001-
30283.
ENVIRONMENTAL RESOURCES MANAGEMENT CAPRICORN GREENLAND EXPLORATION-1
6-36
and incorporated into management of change procedures. Local conditions and escalation of bad weather will be closely monitored. Navigational Risk Control
Navigational risks will be mitigated by requirements for vessels built and equipped to international standards eg IMO (International Maritime Organisation) and SOLAS (International Convention on Safety of Life at Sea). Additional requirements for navigational equipment will be implemented for smaller project vessels. Crews will be appropriately qualified and subject to fitness for work assessments. Working procedures and manning levels will be specified, particularly for high risk operations and poor weather. Meteorological Risk Control
Weather and ice conditions will be taken into account for high risk activities such as refuelling at sea and any operations which involve close quarters operations between large vessels. A specific ice management plan will be adopted (see Chapter 7 for details). Measures will be put in place to provide accurate weather and ice forecasts for the project area. Oil Spill Response and Mitigation Plans
A detailed oil spill response and mitigation plan will be produced prior to mobilisation and periodically updated as the project progresses. The level of response will depend on the circumstances of the spill and nature of the resources which are threatened according the following general guidance. Tier 1: a small spill which can be combated using facilities available from
the contractor or local to the spill site. Tier 2: a medium spill which is estimated to be very unlikely in terms of
probability and which requires the involvement of the project emergency response resources in addition to contractor facilities and manpower.
Tier 3: a large spill which requires external resources to combat. The project oil spill plans will include provision for coordination of external oil spill response contractors, or third party equipment and national response authorities to combat Tier 3 spills. External resources will be available through Capricorn’s membership of Oil Spill Response Limited (OSRL), which is a leading global provider of spill response planning and emergency response measures. In advance of operations, emergency response exercises will be held to ensure responsibilities and lines of communication operate effectively.
ENVIRONMENTAL RESOURCES MANAGEMENT CAPRICORN GREENLAND EXPLORATION-1
6-37
The approach to tactical oil spill response will be to contain the spill, remove where possible any free oil and clean where appropriate. However clean up techniques will be managed to avoid additional impacts to sensitive environments.
6.4.7 Oil Spill Risk Assessment
The probability of a large spill due to a blow out or vessel incident is very low, due to the short duration of the drilling operation and the mitigation measures proposed. The results of oil spill modelling indicate that none of the oil spill scenarios will result in oil reaching the coast. Pelagic animals are therefore most vulnerable including auks feeding on the water surface or moulting. Swimming seals and cetaceans are not considered to be at high risk from the effects of a spill in open water. However a major spill occurring in July, August and November has a high probability of reaching the ice margin. In this case it may become entrapped in ice and there is a potential for more significant effects including potential mortality of sea mammals and polar bears if the ice leads and blow holes become contaminated. Although mitigation measures in place make a medium or large spill highly unlikely the impact of an oil spill on pelagic animals is assessed to be potentially moderate, except for those found on the ice during July-November, which are assessed to be potentially major. Impacts to the coast and swimming seals and cetaceans are assessed to be not significant. The most likely scenario of a spill affecting the water surface would be a smaller spill of diesel during refuelling which would cause localised impacts on water quality for a short period of time (eg 2 to 3 days). A small diesel spill during refuelling is assessed to be potentially minor.
6.4.8 Chemical Spills
Potential Sources of Impacts
The MODUs and supply vessels will hold chemicals including drilling mud formulation and cementing chemicals. The quantities held on each vessel will be small and any spills of these chemicals will mostly be small (less than one tonne). In addition, all chemicals used will be selected based on the least environmentally harmful available alternative and will be pre-notified to the Greenland authorities for review. Therefore there will be limited ecotoxicological impacts to the environment. Impacts to Seabed and Benthic Communities
The potential impact to the seabed and benthic communities is dependant on the chemicals involved, the size and location of the spill, the weather conditions at the time and the concentration of the chemical at the time of exposure with the receptor. Chemicals that are denser than seawater may
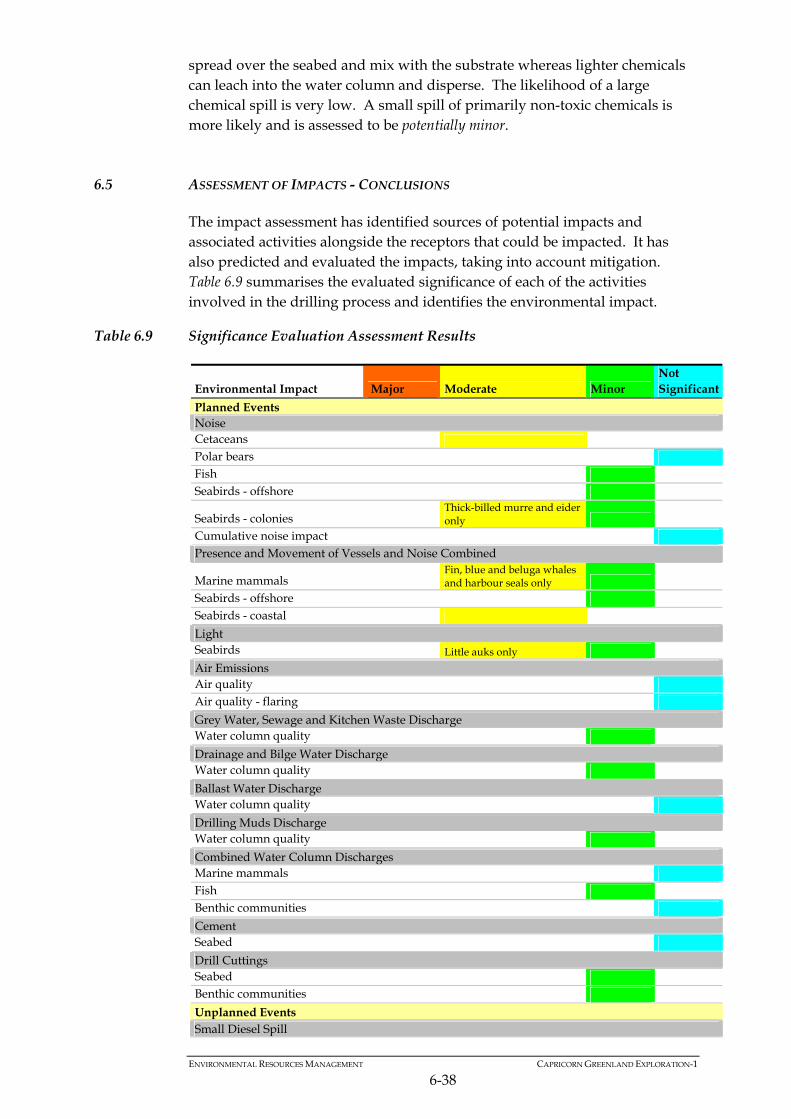
ENVIRONMENTAL RESOURCES MANAGEMENT CAPRICORN GREENLAND EXPLORATION-1
6-38
spread over the seabed and mix with the substrate whereas lighter chemicals can leach into the water column and disperse. The likelihood of a large chemical spill is very low. A small spill of primarily non-toxic chemicals is more likely and is assessed to be potentially minor.
6.5 ASSESSMENT OF IMPACTS - CONCLUSIONS
The impact assessment has identified sources of potential impacts and associated activities alongside the receptors that could be impacted. It has also predicted and evaluated the impacts, taking into account mitigation. Table 6.9 summarises the evaluated significance of each of the activities involved in the drilling process and identifies the environmental impact.
Table 6.9 Significance Evaluation Assessment Results
Environmental Impact Major Moderate Minor Not Significant
Planned Events Noise Cetaceans Polar bears Fish Seabirds - offshore
Seabirds - colonies Thick-billed murre and eider only
Cumulative noise impact Presence and Movement of Vessels and Noise Combined
Marine mammals Fin, blue and beluga whales and harbour seals only
Seabirds - offshore Seabirds - coastal Light Seabirds Little auks only Air Emissions Air quality Air quality - flaring Grey Water, Sewage and Kitchen Waste Discharge Water column quality Drainage and Bilge Water Discharge Water column quality Ballast Water Discharge Water column quality Drilling Muds Discharge Water column quality Combined Water Column Discharges Marine mammals Fish Benthic communities Cement Seabed Drill Cuttings Seabed Benthic communities Unplanned Events Small Diesel Spill
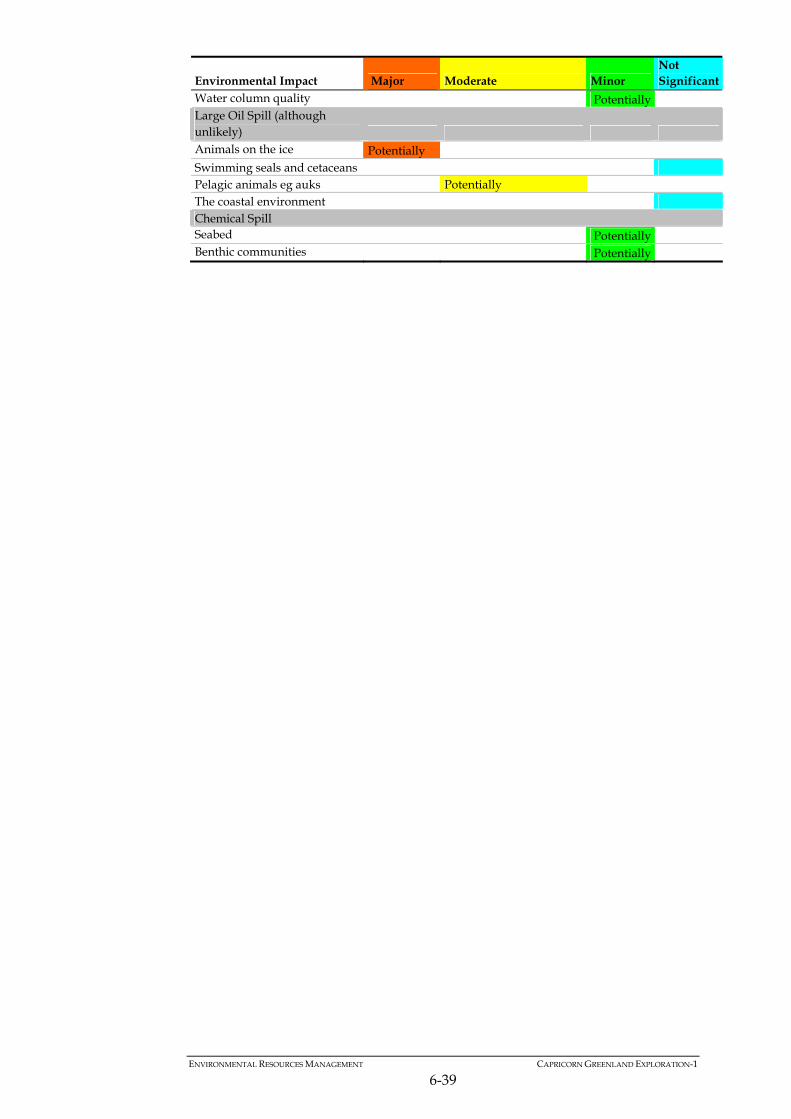
ENVIRONMENTAL RESOURCES MANAGEMENT CAPRICORN GREENLAND EXPLORATION-1
6-39
Environmental Impact Major Moderate Minor Not Significant
Water column quality Potentially Large Oil Spill (although unlikely) Animals on the ice Potentially Swimming seals and cetaceans Pelagic animals eg auks Potentially The coastal environment Chemical Spill Seabed Potentially Benthic communities Potentially
ENVIRONMENTAL RESOURCES MANAGEMENT CAPRICORN GREENLAND EXPLORATION 1
7-1
7 ENVIRONMENTAL MITIGATION AND MONITORING
7.1 INTRODUCTION
This Chapter brings together the mitigation measures described in Chapter 6 and outlines the Environmental Management Plan (EMP) framework through which Capricorn will implement these measures. Contractors will carry out most of the HSE critical activities (onshore support, drilling rig operation, vessel operation) under Capricorn supervision and Capricorn will retain the overall responsibility and accountability for managing the Project, including HSE. Capricorn will apply and work within the commitments and procedures of the parent company Cairn Energy. In order to align procedures and clarify roles and responsibilities between Capricorn and the contracted entities for this Project, interface documents will be used to link and bridge the systems. The operations will be conducted on behalf of Capricorn by Stena Drilling, a wholly owned subsidiary of Stena AB of Sweden, which is considered to be one of the world's foremost independent drilling contractors. Stena Drilling operate under dedicated HSE management systems and fit-for-purpose operational plans and procedures. The drilling units, support vessels and logistics will also be contracted from third parties, and shall operate within the overall Capricorn project management framework. This Chapter of the EIA includes the following elements: Environmental Management; bringing together the mitigation measures
described previously and the structure, roles and responsibilities under which they will be implemented. The Environmental Management Plan will ensure that the project operates in full compliance with Capricorn’s Group Corporate Responsibility (CR) Guiding Principles.
Environmental Monitoring Plan for emissions and impacts of planned and
unplanned events. Environmental Protection Plan. Recommendations for further information relevant to the EIA as part of an
Environmental Study Plan. Offshore drilling is highly regulated and technically challenging, with high standards and expectations in HSE management, consequently it employs some of the strictest auditing and monitoring practices of any industry. For this reason a large number of HSE related procedures and practices are
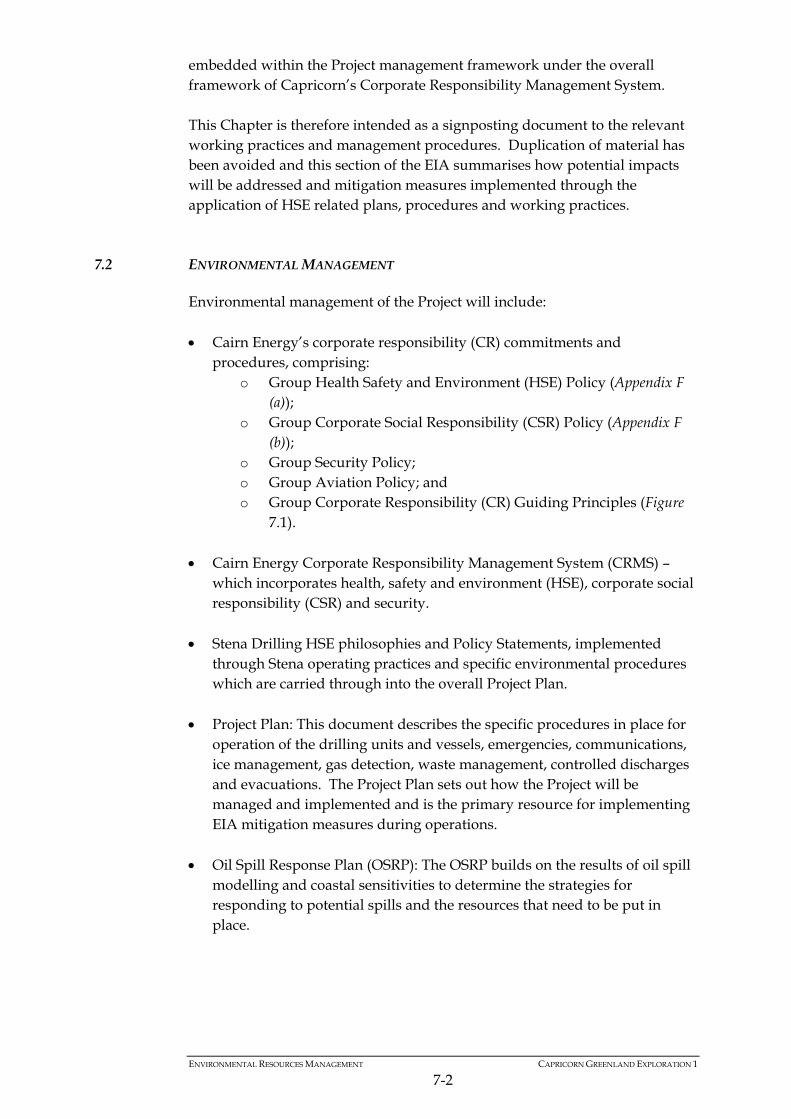
ENVIRONMENTAL RESOURCES MANAGEMENT CAPRICORN GREENLAND EXPLORATION 1
7-2
embedded within the Project management framework under the overall framework of Capricorn’s Corporate Responsibility Management System. This Chapter is therefore intended as a signposting document to the relevant working practices and management procedures. Duplication of material has been avoided and this section of the EIA summarises how potential impacts will be addressed and mitigation measures implemented through the application of HSE related plans, procedures and working practices.
7.2 ENVIRONMENTAL MANAGEMENT
Environmental management of the Project will include: Cairn Energy’s corporate responsibility (CR) commitments and
procedures, comprising: o Group Health Safety and Environment (HSE) Policy (Appendix F
(a)); o Group Corporate Social Responsibility (CSR) Policy (Appendix F
(b)); o Group Security Policy; o Group Aviation Policy; and o Group Corporate Responsibility (CR) Guiding Principles (Figure
7.1). Cairn Energy Corporate Responsibility Management System (CRMS) –
which incorporates health, safety and environment (HSE), corporate social responsibility (CSR) and security.
Stena Drilling HSE philosophies and Policy Statements, implemented
through Stena operating practices and specific environmental procedures which are carried through into the overall Project Plan.
Project Plan: This document describes the specific procedures in place for
operation of the drilling units and vessels, emergencies, communications, ice management, gas detection, waste management, controlled discharges and evacuations. The Project Plan sets out how the Project will be managed and implemented and is the primary resource for implementing EIA mitigation measures during operations.
Oil Spill Response Plan (OSRP): The OSRP builds on the results of oil spill
modelling and coastal sensitivities to determine the strategies for responding to potential spills and the resources that need to be put in place.
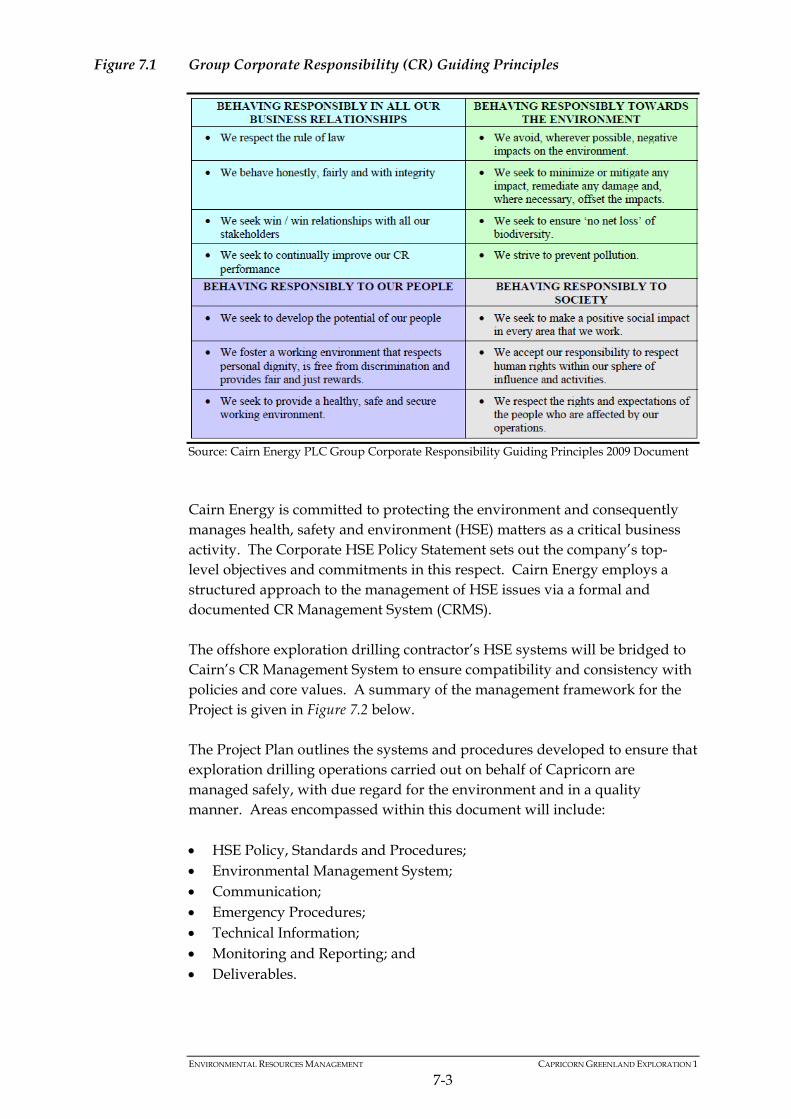
ENVIRONMENTAL RESOURCES MANAGEMENT CAPRICORN GREENLAND EXPLORATION 1
7-3
Figure 7.1 Group Corporate Responsibility (CR) Guiding Principles
Source: Cairn Energy PLC Group Corporate Responsibility Guiding Principles 2009 Document
Cairn Energy is committed to protecting the environment and consequently manages health, safety and environment (HSE) matters as a critical business activity. The Corporate HSE Policy Statement sets out the company’s top-level objectives and commitments in this respect. Cairn Energy employs a structured approach to the management of HSE issues via a formal and documented CR Management System (CRMS). The offshore exploration drilling contractor’s HSE systems will be bridged to Cairn’s CR Management System to ensure compatibility and consistency with policies and core values. A summary of the management framework for the Project is given in Figure 7.2 below. The Project Plan outlines the systems and procedures developed to ensure that exploration drilling operations carried out on behalf of Capricorn are managed safely, with due regard for the environment and in a quality manner. Areas encompassed within this document will include: HSE Policy, Standards and Procedures; Environmental Management System; Communication; Emergency Procedures; Technical Information; Monitoring and Reporting; and Deliverables.
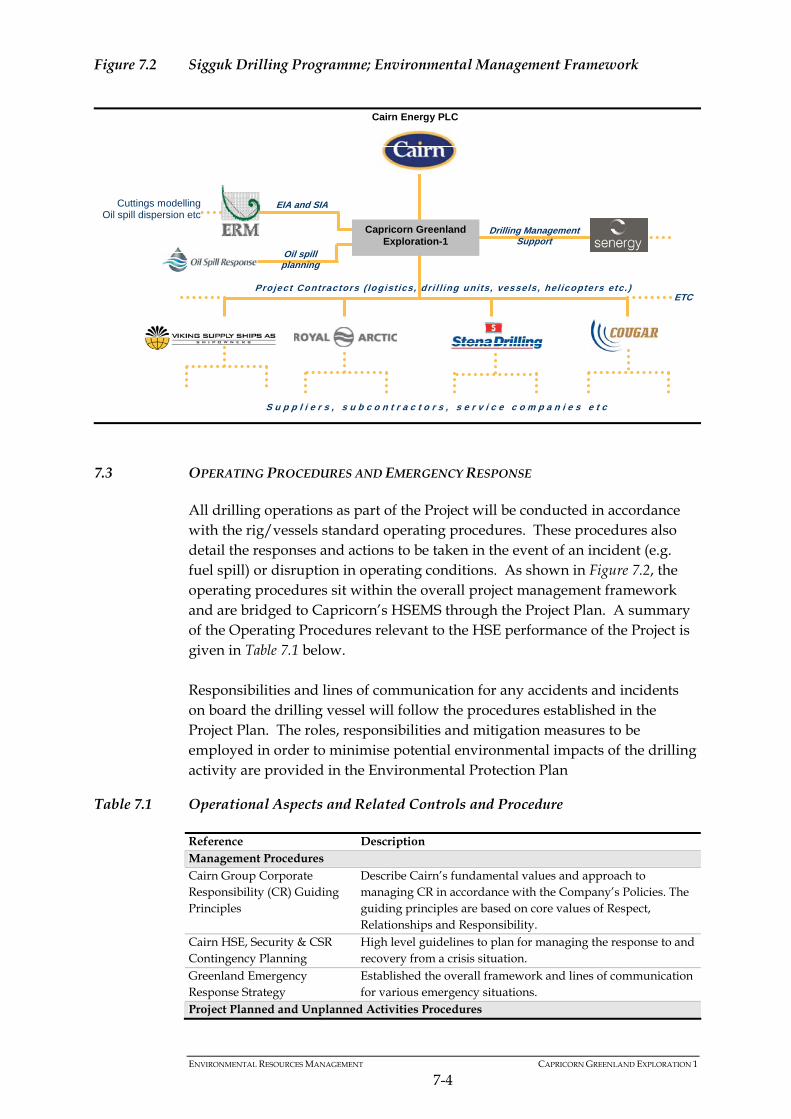
ENVIRONMENTAL RESOURCES MANAGEMENT CAPRICORN GREENLAND EXPLORATION 1
7-4
Figure 7.2 Sigguk Drilling Programme; Environmental Management Framework
7.3 OPERATING PROCEDURES AND EMERGENCY RESPONSE
All drilling operations as part of the Project will be conducted in accordance with the rig/vessels standard operating procedures. These procedures also detail the responses and actions to be taken in the event of an incident (e.g. fuel spill) or disruption in operating conditions. As shown in Figure 7.2, the operating procedures sit within the overall project management framework and are bridged to Capricorn’s HSEMS through the Project Plan. A summary of the Operating Procedures relevant to the HSE performance of the Project is given in Table 7.1 below. Responsibilities and lines of communication for any accidents and incidents on board the drilling vessel will follow the procedures established in the Project Plan. The roles, responsibilities and mitigation measures to be employed in order to minimise potential environmental impacts of the drilling activity are provided in the Environmental Protection Plan
Table 7.1 Operational Aspects and Related Controls and Procedure
Reference Description Management Procedures Cairn Group Corporate Responsibility (CR) Guiding Principles
Describe Cairn’s fundamental values and approach to managing CR in accordance with the Company’s Policies. The guiding principles are based on core values of Respect, Relationships and Responsibility.
Cairn HSE, Security & CSR Contingency Planning
High level guidelines to plan for managing the response to and recovery from a crisis situation.
Greenland Emergency Response Strategy
Established the overall framework and lines of communication for various emergency situations.
Project Planned and Unplanned Activities Procedures
Cairn Energy PLC
EIA and SIA
Drilling Management Support
Cuttings modelling Oil spill dispersion etc
Capricorn Greenland Exploration-1
Oil spill planning
Project Contractors ( logist ics, dr i l l ing uni ts , vessels , hel icopters etc .)
S u p p l i e r s , s u b c o n t r a c t o r s , s e r v i c e c o m p a n i e s e t c
ETC
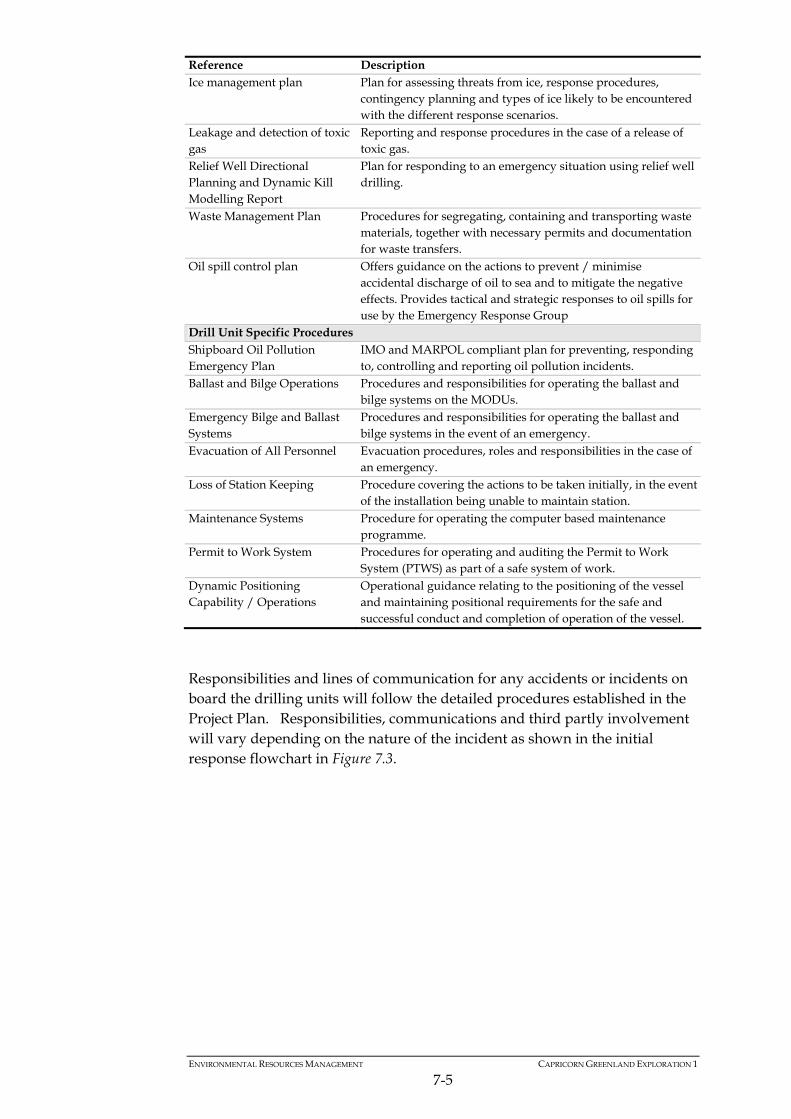
ENVIRONMENTAL RESOURCES MANAGEMENT CAPRICORN GREENLAND EXPLORATION 1
7-5
Reference Description Ice management plan Plan for assessing threats from ice, response procedures,
contingency planning and types of ice likely to be encountered with the different response scenarios.
Leakage and detection of toxic gas
Reporting and response procedures in the case of a release of toxic gas.
Relief Well Directional Planning and Dynamic Kill Modelling Report
Plan for responding to an emergency situation using relief well drilling.
Waste Management Plan Procedures for segregating, containing and transporting waste materials, together with necessary permits and documentation for waste transfers.
Oil spill control plan Offers guidance on the actions to prevent / minimise accidental discharge of oil to sea and to mitigate the negative effects. Provides tactical and strategic responses to oil spills for use by the Emergency Response Group
Drill Unit Specific Procedures Shipboard Oil Pollution Emergency Plan
IMO and MARPOL compliant plan for preventing, responding to, controlling and reporting oil pollution incidents.
Ballast and Bilge Operations Procedures and responsibilities for operating the ballast and bilge systems on the MODUs.
Emergency Bilge and Ballast Systems
Procedures and responsibilities for operating the ballast and bilge systems in the event of an emergency.
Evacuation of All Personnel Evacuation procedures, roles and responsibilities in the case of an emergency.
Loss of Station Keeping Procedure covering the actions to be taken initially, in the event of the installation being unable to maintain station.
Maintenance Systems Procedure for operating the computer based maintenance programme.
Permit to Work System Procedures for operating and auditing the Permit to Work System (PTWS) as part of a safe system of work.
Dynamic Positioning Capability / Operations
Operational guidance relating to the positioning of the vessel and maintaining positional requirements for the safe and successful conduct and completion of operation of the vessel.
Responsibilities and lines of communication for any accidents or incidents on board the drilling units will follow the detailed procedures established in the Project Plan. Responsibilities, communications and third partly involvement will vary depending on the nature of the incident as shown in the initial response flowchart in Figure 7.3.
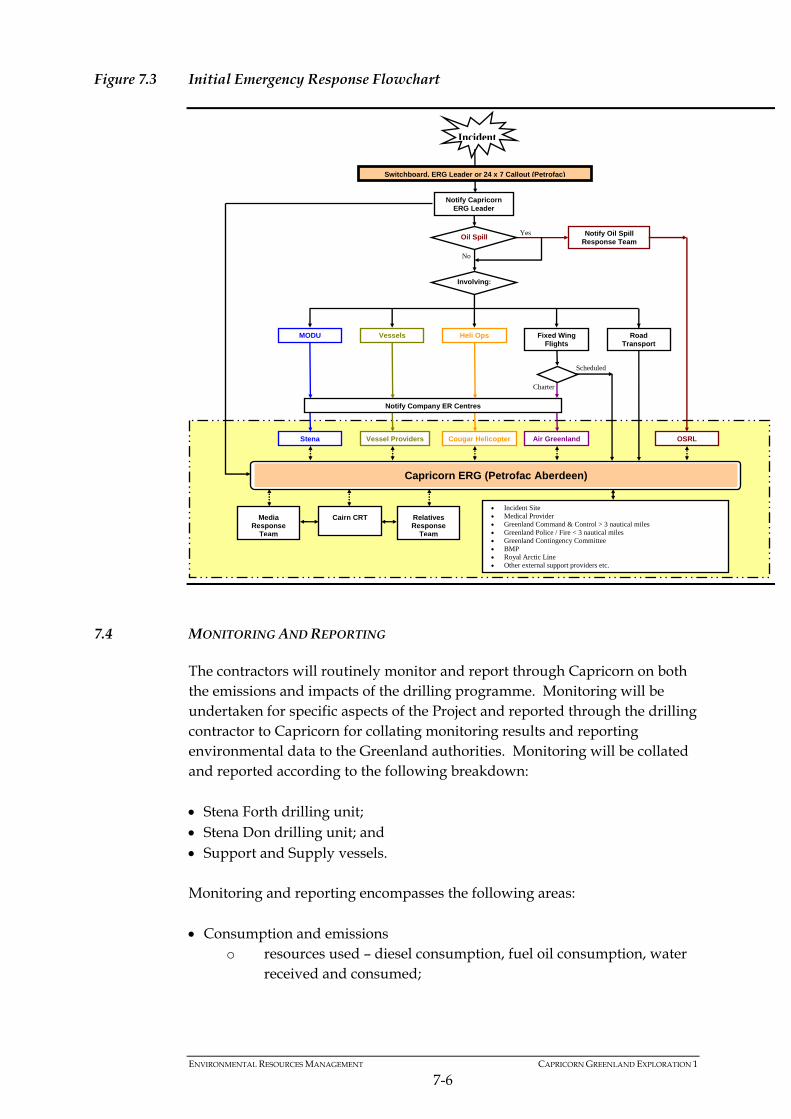
ENVIRONMENTAL RESOURCES MANAGEMENT CAPRICORN GREENLAND EXPLORATION 1
7-6
Figure 7.3 Initial Emergency Response Flowchart
7.4 MONITORING AND REPORTING
The contractors will routinely monitor and report through Capricorn on both the emissions and impacts of the drilling programme. Monitoring will be undertaken for specific aspects of the Project and reported through the drilling contractor to Capricorn for collating monitoring results and reporting environmental data to the Greenland authorities. Monitoring will be collated and reported according to the following breakdown: Stena Forth drilling unit; Stena Don drilling unit; and Support and Supply vessels. Monitoring and reporting encompasses the following areas: Consumption and emissions
o resources used – diesel consumption, fuel oil consumption, water received and consumed;
Notify Company ER Centres
Oil Spill
VesselsMODU
Yes Notify Oil Spill Response Team
No
Heli Ops
Involving:
Fixed Wing Flights
Road Transport
Notify CapricornERG Leader
Capricorn ERG (Petrofac Aberdeen)
Vessel ProvidersStena Cougar Helicopter Air Greenland
Charter
Scheduled
OSRL
Cairn CRT
Incident Site Medical Provider Greenland Command & Control > 3 nautical miles Greenland Police / Fire < 3 nautical miles Greenland Contingency Committee BMP Royal Arctic Line Other external support providers etc.
Media Response
Team
RelativesResponse
Team
Switchboard, ERG Leader or 24 x 7 Callout (Petrofac)
Incident
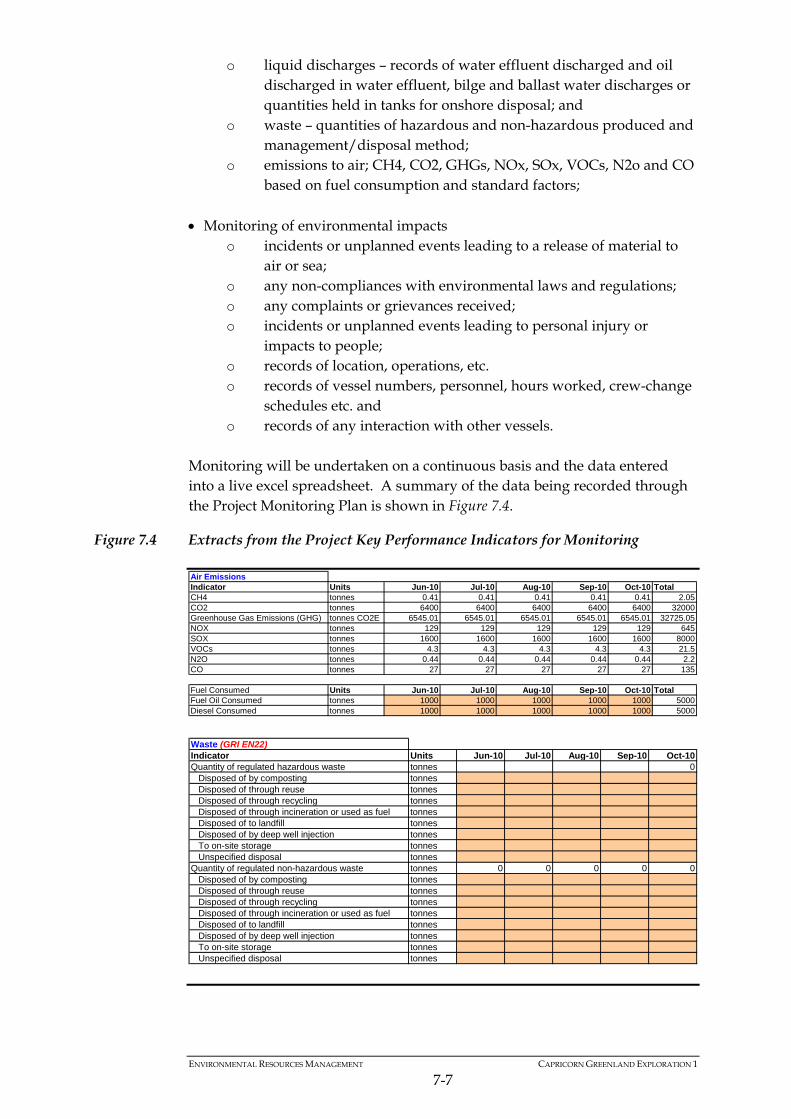
ENVIRONMENTAL RESOURCES MANAGEMENT CAPRICORN GREENLAND EXPLORATION 1
7-7
o liquid discharges – records of water effluent discharged and oil discharged in water effluent, bilge and ballast water discharges or quantities held in tanks for onshore disposal; and
o waste – quantities of hazardous and non-hazardous produced and management/disposal method;
o emissions to air; CH4, CO2, GHGs, NOx, SOx, VOCs, N2o and CO based on fuel consumption and standard factors;
Monitoring of environmental impacts
o incidents or unplanned events leading to a release of material to air or sea;
o any non-compliances with environmental laws and regulations; o any complaints or grievances received; o incidents or unplanned events leading to personal injury or
impacts to people; o records of location, operations, etc. o records of vessel numbers, personnel, hours worked, crew-change
schedules etc. and o records of any interaction with other vessels.
Monitoring will be undertaken on a continuous basis and the data entered into a live excel spreadsheet. A summary of the data being recorded through the Project Monitoring Plan is shown in Figure 7.4.
Figure 7.4 Extracts from the Project Key Performance Indicators for Monitoring
Air EmissionsIndicator Units Jun-10 Jul-10 Aug-10 Sep-10 Oct-10 TotalCH4 tonnes 0.41 0.41 0.41 0.41 0.41 2.05CO2 tonnes 6400 6400 6400 6400 6400 32000Greenhouse Gas Emissions (GHG) tonnes CO2E 6545.01 6545.01 6545.01 6545.01 6545.01 32725.05NOX tonnes 129 129 129 129 129 645SOX tonnes 1600 1600 1600 1600 1600 8000VOCs tonnes 4.3 4.3 4.3 4.3 4.3 21.5N2O tonnes 0.44 0.44 0.44 0.44 0.44 2.2CO tonnes 27 27 27 27 27 135
Fuel Consumed Units Jun-10 Jul-10 Aug-10 Sep-10 Oct-10 TotalFuel Oil Consumed tonnes 1000 1000 1000 1000 1000 5000Diesel Consumed tonnes 1000 1000 1000 1000 1000 5000 Waste (GRI EN22)Indicator Units Jun-10 Jul-10 Aug-10 Sep-10 Oct-10Quantity of regulated hazardous waste tonnes 0
Disposed of by composting tonnesDisposed of through reuse tonnesDisposed of through recycling tonnesDisposed of through incineration or used as fuel tonnesDisposed of to landfill tonnesDisposed of by deep well injection tonnesTo on-site storage tonnesUnspecified disposal tonnes
Quantity of regulated non-hazardous waste tonnes 0 0 0 0 0Disposed of by composting tonnesDisposed of through reuse tonnesDisposed of through recycling tonnesDisposed of through incineration or used as fuel tonnesDisposed of to landfill tonnesDisposed of by deep well injection tonnesTo on-site storage tonnesUnspecified disposal tonnes
ENVIRONMENTAL RESOURCES MANAGEMENT CAPRICORN GREENLAND EXPLORATION 1
7-8
7.5 ENVIRONMENTAL PROTECTION PLAN
The aim of the Environmental Protection Plan (EPP) is to set out the measures which will be used to implement and monitor the proposed mitigation measures and manage the environmental performance of relevant operations. This is done by identifying areas of potential impact, proposing measures which aim to avoid or mitigate the potential for impact, and outlining the monitoring or record keeping that will be implemented to ensure the effectiveness of the mitigation measures implemented. In this way the EPP effectively serves as a conduit between the EIA and the drilling operations. The mitigation measures are provided in Table 7.2 at the end of this Chapter. Responsibilities for implementation of environmental protection measures and controls are described below. All contractor personnel, including vessel and drilling crew, will be made aware of the standards and controls applicable to the conduct of this operation before drilling commences. Standards and Controls
Capricorn and its contractors will operate in accordance with all applicable laws, standards and conditions while in Greenland waters as outlines in Chapter 2: All equipment on board (engines, compressors, generators, mud and cutting treatment and sewage treatment plant, oily water separators and incinerators) will be regularly checked and maintained in accordance with manufacturer’s guidelines and the computer-based maintenance system in order to maximise efficiency and minimise malfunctions and unnecessary discharges to the environment of the survey area. A pre-drilling inspection will be undertaken and equipment checks will be carried out before drilling commences. Wastes will be appropriately segregated and stored onboard prior to disposal at properly equipped port reception facilities. Should such facilities not exist in Greenland, wastes will be contained and shipped to a suitable reception facility or else kept onboard until the vessel next visits a suitable port. Different waste types will be segregated, treated, stored and disposed of according to type and MARPOL grouping.
7.5.2 Key Responsibilities
Clear documented responsibilities, lines of communication and operational procedures will be established between the main drilling units and the various support and supply vessels before the start of drilling, including the ware ship, ice breakers, Emergency Response and Recovery / Oil Recovery Vessels, Production Support Vessel and Supply vessels. Following completion of drilling there will be a number of outstanding measures to be addressed. Post drilling phase measures will include ensuring
ENVIRONMENTAL RESOURCES MANAGEMENT CAPRICORN GREENLAND EXPLORATION 1
7-9
that all reporting requirements have been fulfilled, that waste segregation and management has been completed for suitable transfer to a registered waste carrier, that any outstanding conditions of the environmental authorisation have been satisfied and any complaints by local people or outstanding issues with other sea users in this area have been addressed and resolved. Capricorn
Capricorn will ensure that the project is carried out in accordance with the corporate commitments and policies of its parent company; Cairn Energy, and in accordance with all applicable legal requirements.
Capricorn will ensure that any conditions of the environmental approvals,
such as reporting requirements or follow-up activities, are satisfied. Capricorn will ensure that the Project operates within a comprehensive
Emergency Response Plan and implements an Oil Spill Response Plan in accordance with modelling studies and expert advice.
Capricorn will report to the Greenland authorities relevant monitoring
data from the drilling contractor on a regular basis, such as spills, waste, fuel consumption and estimated figures for emissions to air and water.
Capricorn will resolve any complaints, claims or disputes arising from
drilling operations with the Greenland Government and other affected government organisations and using testimony provided by independent observers, as necessary and appropriate.
Stena Drilling
Stena will ensure that the conduct of the MODUs will comply with the requirements of this EIA and appropriate national or international legislation.
The standards and guidelines (MARPOL etc.) referenced in Chapter 2 of
this EIA will be complied with throughout the drilling operations with records for oil and garbage documented and maintained as per normal operating practices.
Any spills or abnormal releases will be recorded and reported to the
appropriate authorities (for oil, chemicals, waste or process materials, released to air or water).
All health, safety and environmental accidents and incidents or contact
with other vessels in the project areas will be logged.
ENVIRONMENTAL RESOURCES MANAGEMENT CAPRICORN GREENLAND EXPLORATION 1
7-10
Following drilling Stena shall ensure that any reporting or follow up activities required by Capricorn are completed to Capricorn’s satisfaction including details of HSE accidents and incidents.
During drilling Stena shall regularly report consumption and emission
figures to Capricorn according to the requirements of the Project Plan and including waste figures, fuel consumption, personnel on board and estimated greenhouse gas (GHG) emissions.
Stena Drilling shall appropriately store all segregated waste materials and
ensure onshore transfer of waste to an appropriate and registered waste management company at a suitable reception facility.
Vessel Operators
The vessel operator will ensure that the conduct of their vessels will comply with the requirements of this EIA and of national or international legislation.
The standards and guidelines (MARPOL etc.) referenced in Chapter 2 of
this EIA will be complied with throughout the Project and records for oil and garbage will be maintained as per normal vessel operating practices.
Any spills or abnormal releases will be recorded and reported to the
appropriate authorities (for oil, chemicals, waste or process materials, released to air or water).
All health, safety and environmental accidents and incidents or contact
with other vessels in the project areas will be logged. Where there is evidence of rafts of flightless seabirds between the area of
operations and the support base, support vessels will and take appropriate action to avoid any such rafts so long as this does not impact on safety.
7.6 SUMMARY
The proposed exploration activity will create noise, physical disturbance and atmospheric emissions, as well as producing a variety of discharges and wastes. The sources of potential impact identified in this assessment are typical of drilling activities in waters around the world. There are no unusual or unique emissions, discharges or other potential sources of environmental impact, although the operating environment is challenging with particular sensitivities and risks. The Environmental Protection Plan will apply to all aspects of the project to ensure that appropriate mitigation measures are in place to cover all eventualities. Accidental oil spills are recognised as potentially damaging to

ENVIRONMENTAL RESOURCES MANAGEMENT CAPRICORN GREENLAND EXPLORATION 1
7-11
the environment and detailed dispersion modelling has been carried out. A comprehensive contingency plan will be in place to ensure an appropriate response and minimise the impact of any such event.
7.6.1 Mitigation Plan
Mitigation measures within the EIA are summarised in table format below, along with the timing and responsibility for implementing the measure.
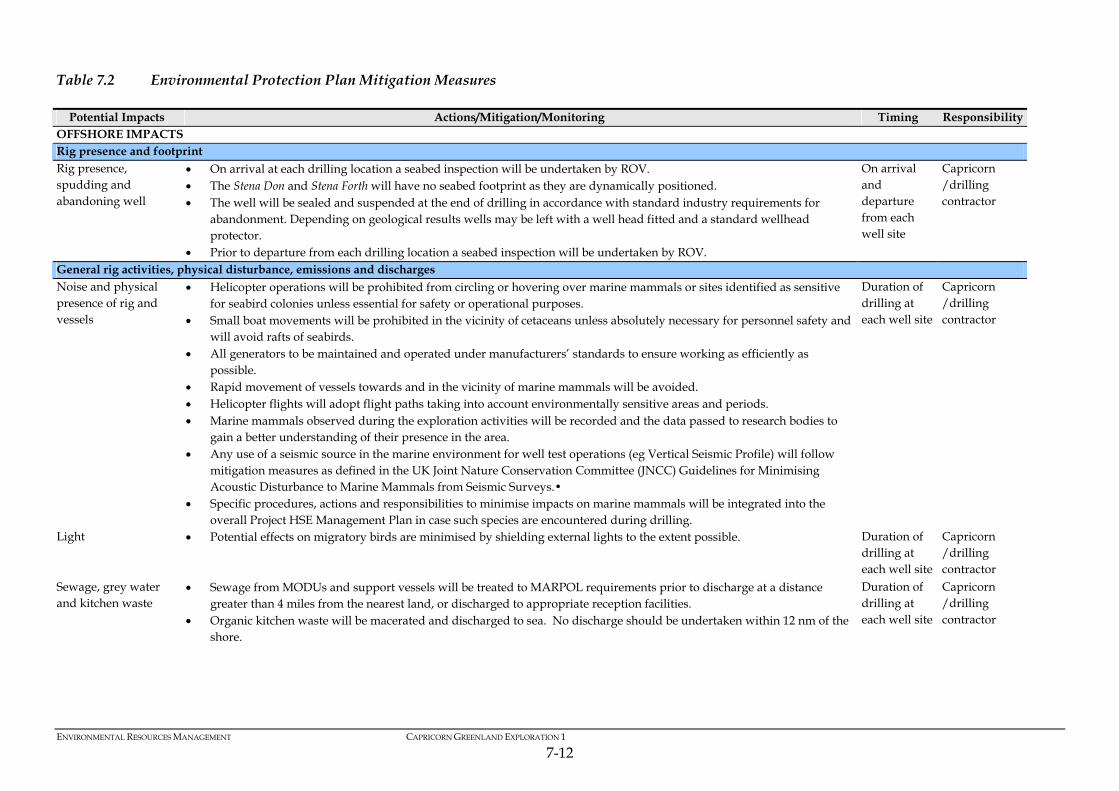
Table 7.2 Environmental Protection Plan Mitigation Measures
Potential Impacts Actions/Mitigation/Monitoring Timing Responsibility OFFSHORE IMPACTS Rig presence and footprint Rig presence, spudding and abandoning well
On arrival at each drilling location a seabed inspection will be undertaken by ROV. The Stena Don and Stena Forth will have no seabed footprint as they are dynamically positioned. The well will be sealed and suspended at the end of drilling in accordance with standard industry requirements for
abandonment. Depending on geological results wells may be left with a well head fitted and a standard wellhead protector.
Prior to departure from each drilling location a seabed inspection will be undertaken by ROV.
On arrival and departure from each well site
Capricorn /drilling contractor
General rig activities, physical disturbance, emissions and discharges Noise and physical presence of rig and vessels
Helicopter operations will be prohibited from circling or hovering over marine mammals or sites identified as sensitive for seabird colonies unless essential for safety or operational purposes.
Small boat movements will be prohibited in the vicinity of cetaceans unless absolutely necessary for personnel safety and will avoid rafts of seabirds.
All generators to be maintained and operated under manufacturers’ standards to ensure working as efficiently as possible.
Rapid movement of vessels towards and in the vicinity of marine mammals will be avoided. Helicopter flights will adopt flight paths taking into account environmentally sensitive areas and periods. Marine mammals observed during the exploration activities will be recorded and the data passed to research bodies to
gain a better understanding of their presence in the area. Any use of a seismic source in the marine environment for well test operations (eg Vertical Seismic Profile) will follow
mitigation measures as defined in the UK Joint Nature Conservation Committee (JNCC) Guidelines for Minimising Acoustic Disturbance to Marine Mammals from Seismic Surveys.•
Specific procedures, actions and responsibilities to minimise impacts on marine mammals will be integrated into the overall Project HSE Management Plan in case such species are encountered during drilling.
Duration of drilling at each well site
Capricorn /drilling contractor
Light Potential effects on migratory birds are minimised by shielding external lights to the extent possible. Duration of drilling at each well site
Capricorn /drilling contractor
Sewage, grey water and kitchen waste
Sewage from MODUs and support vessels will be treated to MARPOL requirements prior to discharge at a distance greater than 4 miles from the nearest land, or discharged to appropriate reception facilities.
Organic kitchen waste will be macerated and discharged to sea. No discharge should be undertaken within 12 nm of the shore.
Duration of drilling at each well site
Capricorn /drilling contractor
ENVIRONMENTAL RESOURCES MANAGEMENT CAPRICORN GREENLAND EXPLORATION 1
7-12
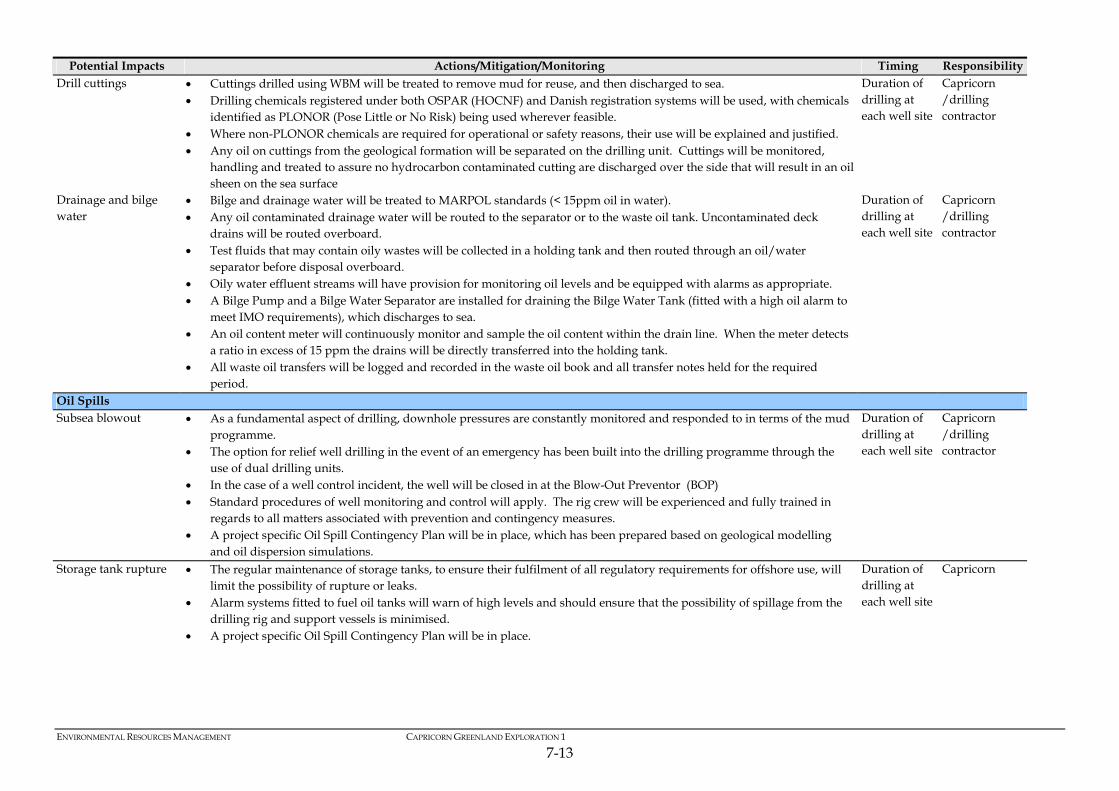
ENVIRONMENTAL RESOURCES MANAGEMENT CAPRICORN GREENLAND EXPLORATION 1
7-13
Potential Impacts Actions/Mitigation/Monitoring Timing Responsibility Drill cuttings Cuttings drilled using WBM will be treated to remove mud for reuse, and then discharged to sea.
Drilling chemicals registered under both OSPAR (HOCNF) and Danish registration systems will be used, with chemicals identified as PLONOR (Pose Little or No Risk) being used wherever feasible.
Where non-PLONOR chemicals are required for operational or safety reasons, their use will be explained and justified. Any oil on cuttings from the geological formation will be separated on the drilling unit. Cuttings will be monitored,
handling and treated to assure no hydrocarbon contaminated cutting are discharged over the side that will result in an oil sheen on the sea surface
Duration of drilling at each well site
Capricorn /drilling contractor
Drainage and bilge water
Bilge and drainage water will be treated to MARPOL standards (< 15ppm oil in water). Any oil contaminated drainage water will be routed to the separator or to the waste oil tank. Uncontaminated deck
drains will be routed overboard. Test fluids that may contain oily wastes will be collected in a holding tank and then routed through an oil/water
separator before disposal overboard. Oily water effluent streams will have provision for monitoring oil levels and be equipped with alarms as appropriate. A Bilge Pump and a Bilge Water Separator are installed for draining the Bilge Water Tank (fitted with a high oil alarm to
meet IMO requirements), which discharges to sea. An oil content meter will continuously monitor and sample the oil content within the drain line. When the meter detects
a ratio in excess of 15 ppm the drains will be directly transferred into the holding tank. All waste oil transfers will be logged and recorded in the waste oil book and all transfer notes held for the required
period.
Duration of drilling at each well site
Capricorn /drilling contractor
Oil Spills Subsea blowout As a fundamental aspect of drilling, downhole pressures are constantly monitored and responded to in terms of the mud
programme. The option for relief well drilling in the event of an emergency has been built into the drilling programme through the
use of dual drilling units. In the case of a well control incident, the well will be closed in at the Blow-Out Preventor (BOP) Standard procedures of well monitoring and control will apply. The rig crew will be experienced and fully trained in
regards to all matters associated with prevention and contingency measures. A project specific Oil Spill Contingency Plan will be in place, which has been prepared based on geological modelling
and oil dispersion simulations.
Duration of drilling at each well site
Capricorn /drilling contractor
Storage tank rupture The regular maintenance of storage tanks, to ensure their fulfilment of all regulatory requirements for offshore use, will limit the possibility of rupture or leaks.
Alarm systems fitted to fuel oil tanks will warn of high levels and should ensure that the possibility of spillage from the drilling rig and support vessels is minimised.
A project specific Oil Spill Contingency Plan will be in place.
Duration of drilling at each well site
Capricorn
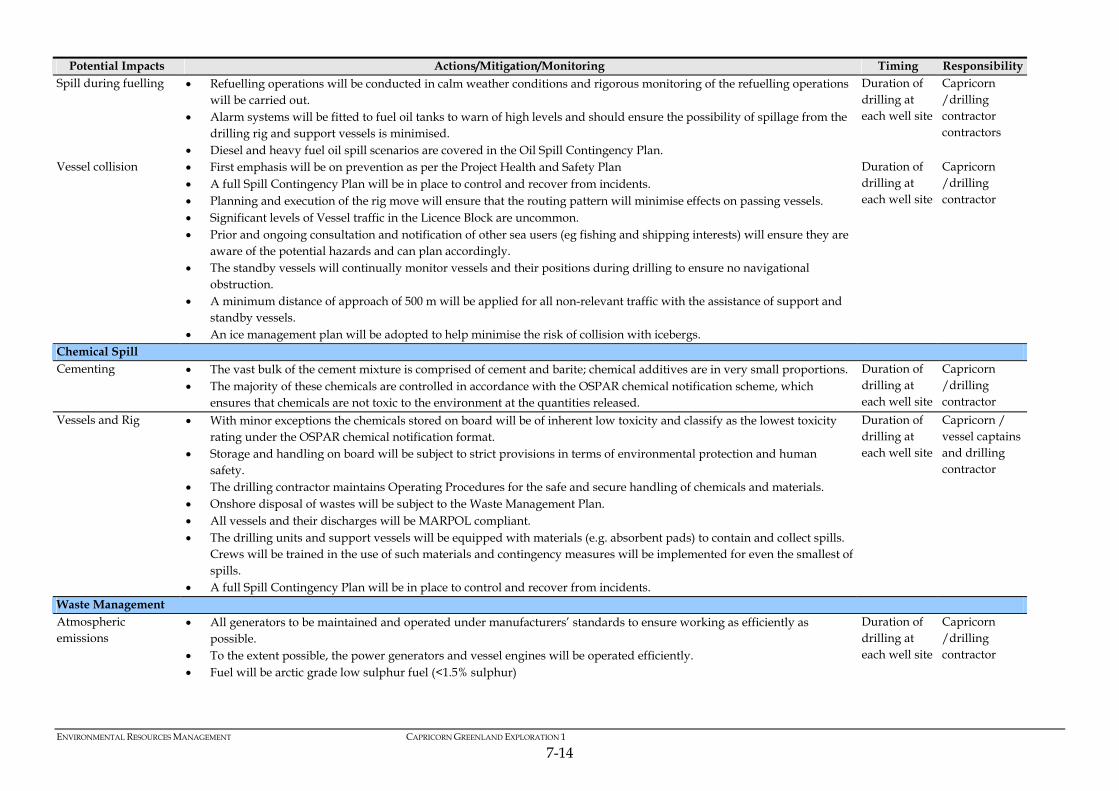
ENVIRONMENTAL RESOURCES MANAGEMENT CAPRICORN GREENLAND EXPLORATION 1
7-14
Potential Impacts Actions/Mitigation/Monitoring Timing Responsibility Spill during fuelling Refuelling operations will be conducted in calm weather conditions and rigorous monitoring of the refuelling operations
will be carried out. Alarm systems will be fitted to fuel oil tanks to warn of high levels and should ensure the possibility of spillage from the
drilling rig and support vessels is minimised. Diesel and heavy fuel oil spill scenarios are covered in the Oil Spill Contingency Plan.
Duration of drilling at each well site
Capricorn /drilling contractor contractors
Vessel collision First emphasis will be on prevention as per the Project Health and Safety Plan A full Spill Contingency Plan will be in place to control and recover from incidents. Planning and execution of the rig move will ensure that the routing pattern will minimise effects on passing vessels. Significant levels of Vessel traffic in the Licence Block are uncommon. Prior and ongoing consultation and notification of other sea users (eg fishing and shipping interests) will ensure they are
aware of the potential hazards and can plan accordingly. The standby vessels will continually monitor vessels and their positions during drilling to ensure no navigational
obstruction. A minimum distance of approach of 500 m will be applied for all non-relevant traffic with the assistance of support and
standby vessels. An ice management plan will be adopted to help minimise the risk of collision with icebergs.
Duration of drilling at each well site
Capricorn /drilling contractor
Chemical Spill Cementing The vast bulk of the cement mixture is comprised of cement and barite; chemical additives are in very small proportions.
The majority of these chemicals are controlled in accordance with the OSPAR chemical notification scheme, which ensures that chemicals are not toxic to the environment at the quantities released.
Duration of drilling at each well site
Capricorn /drilling contractor
Vessels and Rig With minor exceptions the chemicals stored on board will be of inherent low toxicity and classify as the lowest toxicity rating under the OSPAR chemical notification format.
Storage and handling on board will be subject to strict provisions in terms of environmental protection and human safety.
The drilling contractor maintains Operating Procedures for the safe and secure handling of chemicals and materials. Onshore disposal of wastes will be subject to the Waste Management Plan. All vessels and their discharges will be MARPOL compliant. The drilling units and support vessels will be equipped with materials (e.g. absorbent pads) to contain and collect spills.
Crews will be trained in the use of such materials and contingency measures will be implemented for even the smallest of spills.
A full Spill Contingency Plan will be in place to control and recover from incidents.
Duration of drilling at each well site
Capricorn / vessel captains and drilling contractor
Waste Management Atmospheric emissions
All generators to be maintained and operated under manufacturers’ standards to ensure working as efficiently as possible.
To the extent possible, the power generators and vessel engines will be operated efficiently. Fuel will be arctic grade low sulphur fuel (<1.5% sulphur)
Duration of drilling at each well site
Capricorn /drilling contractor
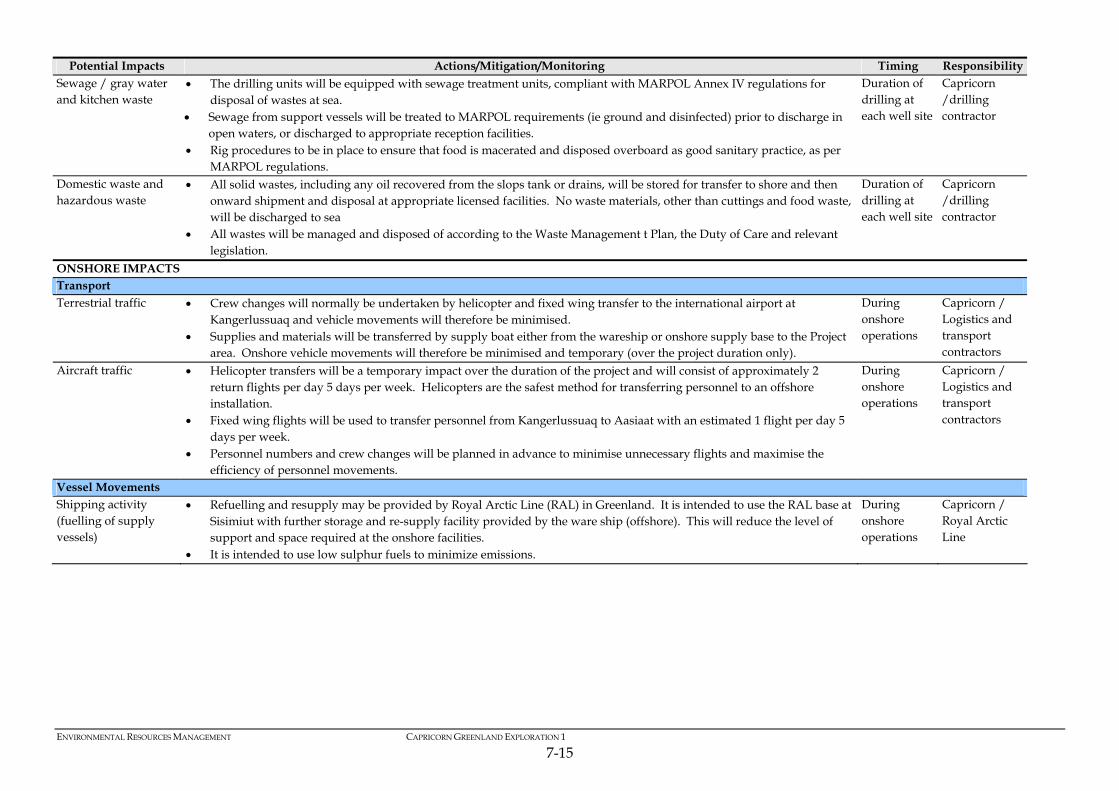
ENVIRONMENTAL RESOURCES MANAGEMENT CAPRICORN GREENLAND EXPLORATION 1
7-15
Potential Impacts Actions/Mitigation/Monitoring Timing Responsibility Sewage / gray water and kitchen waste
The drilling units will be equipped with sewage treatment units, compliant with MARPOL Annex IV regulations for disposal of wastes at sea.
Sewage from support vessels will be treated to MARPOL requirements (ie ground and disinfected) prior to discharge in open waters, or discharged to appropriate reception facilities.
Rig procedures to be in place to ensure that food is macerated and disposed overboard as good sanitary practice, as per MARPOL regulations.
Duration of drilling at each well site
Capricorn /drilling contractor
Domestic waste and hazardous waste
All solid wastes, including any oil recovered from the slops tank or drains, will be stored for transfer to shore and then onward shipment and disposal at appropriate licensed facilities. No waste materials, other than cuttings and food waste, will be discharged to sea
All wastes will be managed and disposed of according to the Waste Management t Plan, the Duty of Care and relevant legislation.
Duration of drilling at each well site
Capricorn /drilling contractor
ONSHORE IMPACTS Transport Terrestrial traffic Crew changes will normally be undertaken by helicopter and fixed wing transfer to the international airport at
Kangerlussuaq and vehicle movements will therefore be minimised. Supplies and materials will be transferred by supply boat either from the wareship or onshore supply base to the Project
area. Onshore vehicle movements will therefore be minimised and temporary (over the project duration only).
During onshore operations
Capricorn / Logistics and transport contractors
Aircraft traffic Helicopter transfers will be a temporary impact over the duration of the project and will consist of approximately 2 return flights per day 5 days per week. Helicopters are the safest method for transferring personnel to an offshore installation.
Fixed wing flights will be used to transfer personnel from Kangerlussuaq to Aasiaat with an estimated 1 flight per day 5 days per week.
Personnel numbers and crew changes will be planned in advance to minimise unnecessary flights and maximise the efficiency of personnel movements.
During onshore operations
Capricorn / Logistics and transport contractors
Vessel Movements Shipping activity (fuelling of supply vessels)
Refuelling and resupply may be provided by Royal Arctic Line (RAL) in Greenland. It is intended to use the RAL base at Sisimiut with further storage and re-supply facility provided by the ware ship (offshore). This will reduce the level of support and space required at the onshore facilities.
It is intended to use low sulphur fuels to minimize emissions.
During onshore operations
Capricorn / Royal Arctic Line
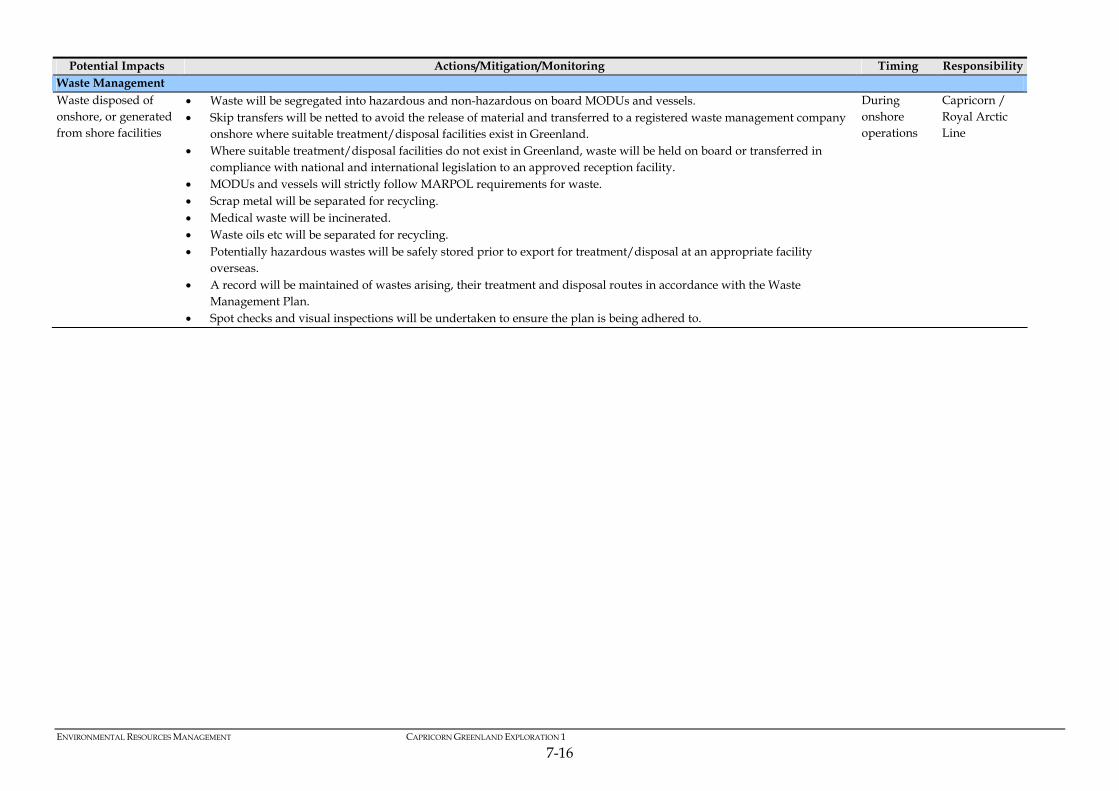
ENVIRONMENTAL RESOURCES MANAGEMENT CAPRICORN GREENLAND EXPLORATION 1
7-16
Potential Impacts Actions/Mitigation/Monitoring Timing Responsibility Waste Management Waste disposed of onshore, or generated from shore facilities
Waste will be segregated into hazardous and non-hazardous on board MODUs and vessels. Skip transfers will be netted to avoid the release of material and transferred to a registered waste management company
onshore where suitable treatment/disposal facilities exist in Greenland. Where suitable treatment/disposal facilities do not exist in Greenland, waste will be held on board or transferred in
compliance with national and international legislation to an approved reception facility. MODUs and vessels will strictly follow MARPOL requirements for waste. Scrap metal will be separated for recycling. Medical waste will be incinerated. Waste oils etc will be separated for recycling. Potentially hazardous wastes will be safely stored prior to export for treatment/disposal at an appropriate facility
overseas. A record will be maintained of wastes arising, their treatment and disposal routes in accordance with the Waste
Management Plan. Spot checks and visual inspections will be undertaken to ensure the plan is being adhered to.
During onshore operations
Capricorn / Royal Arctic Line
ENVIRONMENTAL RESOURCES MANAGEMENT CAPRICORN GREENLAND EXPLORATION 1
7-17
7.7 ENVIRONMENTAL STUDY PLAN
A considerable amount of new environmental data has been acquired for the purposes of this EIA, both by Capricorn and its contractors and by research institutes and non-governmental organisations (NGOs) in Greenland and Denmark. Environmental studies and datasets have included: Meteorological and oceanographic studies; Deployment of current meters offshore; Vessel and satellite based studies into ice presence and movements; Geological studies using seismic data; Seabed topography and detailed bathymetry from site surveys; Sediment sampling and both physical analysis (eg particle size) and
chemical analysis (eg presence of metals or hydrocarbons); Water quality analysis; Sampling and analysis of sea bottom (benthic) species and habitats; Marine mammal observations from seismic and site survey vessels; Northern extension of the oil spill sensitivity atlas by NGOs In-country stakeholder consultations and public engagement; Cuttings dispersion modelling; and Oil spill trajectory simulations; This body of data (where it is not commercially sensitive or confidential for operational reasons) will be made available to relevant Government bodies and NGOs in Greenland to further the understanding of the offshore environment. Environmental studies will continue during the Project and additional information will be released as it becomes available. Recommendations for further environmental studies include: Acquiring additional geophysical and environmental data for any future
drilling locations other than those already surveyed (the 1st two drilling locations).
Carrying out marine mammal observations in accordance with the JNCC
Guidelines where a seismic source is being used in the marine environment.
Compiling and releasing seabed visual observations from ROV surveys
where these provide information on seabed habitats or species. Despite the Project taking place during summer months outside the main
periods of ice cover, extending the oil spill study to examine potential interactions between oil releases and ice presence/movements would complement the existing work carried out and provide a valuable studies for this area going forward.
ERM consulting services worldwide www.erm.com
ERM has 145 offices across the following countries worldwide Argentina The Netherlands Australia New Zealand Belgium Panama Brazil Peru Canada Poland Chile Portugal China Puerto Rico Colombia Romania France Russia Germany Singapore Hong Kong South Africa Hungary Spain India Sweden Indonesia Taiwan Ireland Thailand Italy United Arab Emirates Japan UK Kazakhstan US Korea Venezuela Malaysia Vietnam Mexico ERM’s Oxford Office Eaton House Wallbrook Court North Hinskey Lane Oxford OX2 0QS T: +44(0)1865 384800 F: +44 (0)1865 384932 www.erm.com