Embed Size (px)
Citation preview
ISSUE BRIEF:
Capitalizing on Volunteers’ Skills: Volunteering by Occupation in America September 2008
Background Each year more than 60 million people volunteer their time and talents to nonprofit organizations across America. These volunteers work to tackle some of our nation’s most difficult challenges such as literacy, healthcare, hunger and homelessness, keeping young people in school, disaster relief and recovery and so much more. The Corporation for National and Community Service (the Corporation) creates opportunities for Americans to meet these critical needs through service, helps strengthen the capacity of communities and organizations to use volunteers effectively, and works to engage more Americans in a lifetime of volunteering and service.
While volunteers already make valuable contributions to their community and country, nonprofit organizations can greatly enhance their use of volunteers, improve volunteer retention, and gain greater benefit to their operations by taking a fresh look at their volunteer infrastructure and management. There is an opportunity for nonprofits to expand and even reinvent their concept of how volunteers can contribute to their organizations and communities in order to use them more effectively. All too often volunteers are assigned to activities that do not fully capitalize on their individual skills and talents. In order to help nonprofits more effectively gain from the potential value of volunteers’ skills and to encourage more adults to use their skills in their volunteer activities, especially in employee volunteer programs, the Corporation has launched a new initiative called A Billion + Change.
Founded by the President’s Council on Service and Civic Participation and led by the Corporation for National and Community Service, A Billion + Change is a three-year campaign to recast pro bono service— once the sole purview of law firms— as a cross-sector solution with the potential to transform the 21st century. The campaign’s goal is to generate $1 billion worth of skilled expertise to help nonprofits meet community needs while providing technical assistance and resources to participating nonprofits and companies.
In support of A Billion + Change and the Corporation’s goal to help nonprofits effectively use volunteers, this brief seeks to analyze the extent to which volunteers are already utilizing their professional and occupational skills in their volunteer service assignments and determine potential opportunities to better tap into those skills and talents.
Capitalizing on Volunteers’ Skills is based on data from the 2005, 2006, and 2007 Volunteer Supplements to the Current Population Survey (CPS). The annual surveys are administered through the Census Bureau and the Bureau of Labor Statistics through a partnership with the Corporation.
Capitalizing on Volunteers’ Skills: Volunteering by Occupation in America
2
Introduction Americans are looking for ways to use their education and personal skills to make a positive impact in their communities. Research has shown that nonprofits that provide a variety of options to potential volunteers and match them to appropriate skills-based activities are more likely to see greater returns on their investment and are more likely to keep their volunteers serving year after year.1
Many businesses and corporations have begun to forge strong partnerships with nonprofit organizations to benefit their communities and help their employees find ways to provide skills-based and pro bono service. Through these partnerships, companies also gain significant benefits including stronger reputations and increased visibility in communities, and a greater sense of fulfillment and commitment among employees.
Unfortunately, these nonprofit-corporate relationships are still in the minority, which poses a challenge as individuals seek opportunities to use their skills when they volunteer. This study reveals four key findings:
Most volunteers do not perform service activities that relate to their professional or occupational skills.
The legal profession is a leading example of a field where its professionals use their skills when performing their volunteer activities.
Many volunteers engage in fundraising, which though very important, may detract from opportunities to use their skills in other much-needed activities.
Volunteers who use their skills when they serve appear to be more likely to continue serving year to year.
Volunteer Rates
When analyzing the differences in skills-based volunteering habits among volunteers in various occupations,2 it is important to note that volunteer rates vary widely among those occupations. Though the national average volunteer rate is 27.2 percent, occupational rates vary anywhere from 50.3 percent for education, training, and library professionals to 15.8 percent for construction and extraction laborers (see Appendix Table A-1)3. Management, professional, and related occupations tend to have higher volunteer rates than others. This trend may be explained in part by disparities in income among the occupational groups as well as the differing levels of education typically acquired for each, as adults with higher income and higher education levels are generally more likely to volunteer.
1 This information is from the Corporation’s Volunteer Management Capacity Study released in partnership with the Urban Institute. See “Balancing Act: The Challenges and Benefits of Volunteers,” authored by Mark A. Hager and Jeffrey L. Brudney, at http://www.nationalservice.gov/pdf/Balancing_Act.pdf and “Volunteer Management Practices and Retention of Volunteers” by the same at http://www.nationalservice.gov/pdf/Management_Brief.pdf. 2 The 22 occupational groups used here to categorize the American labor force are defined by the Standard Occupational Classification (SOC) system, which is published by the Office of Management and Budget (OMB) and developed in consultation with agencies that produce and work with labor force data. For more details about the latest version of the SOC system, see the 1998 OMB document (http://www.whitehouse.gov/omb/fedreg/socfr5.pdf). We have placed the 22 occupational groups into broad categories that are based on the six-category grouping system recommended by OMB. The “Management, Professional, and Related” category here is equivalent to the same category in the OMB grouping system. We have combined the categories of “Service Occupations” and “Sales and Office Occupations” used in the OMB six-category grouping system into one category called “Service, Sales and Office.” We also combined the categories “Natural Resources, Construction, and Maintenance Occupations” and “Production, Transportation, and Material-Moving Occupations” used in the OMB six-category grouping system into one category called “Labor.” 3 The national average volunteer rate uses pooled data from 2005-2007 and includes individuals who are not in the labor force.
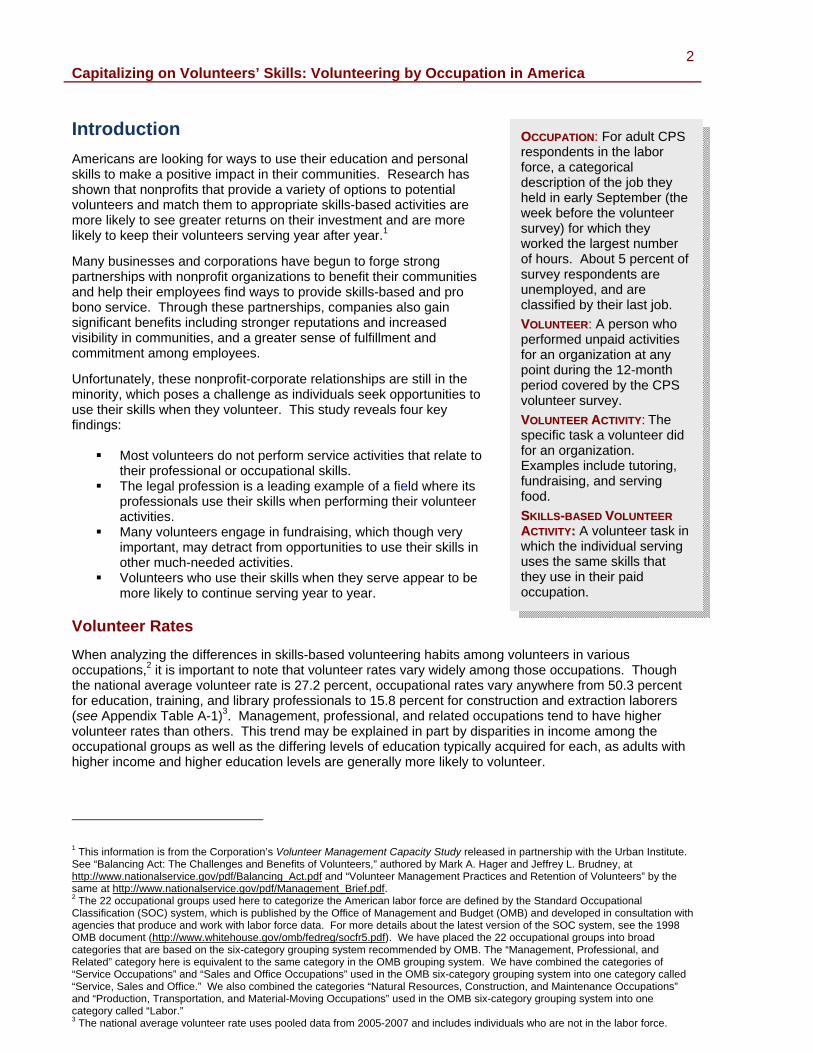
OOCCCCUUPPAATTIIOONN:: For adult CPS respondents in the labor force, a categorical description of the job they held in early September (the week before the volunteer survey) for which they worked the largest number of hours. About 5 percent of survey respondents are unemployed, and are classified by their last job. VVOOLLUUNNTTEEEERR:: A person who performed unpaid activities for an organization at any point during the 12-month period covered by the CPS volunteer survey. VVOOLLUUNNTTEEEERR AACCTTIIVVIITTYY:: The specific task a volunteer did for an organization. Examples include tutoring, fundraising, and serving food. SSKKIILLLLSS--BBAASSEEDD VVOOLLUUNNTTEEEERR AACCTTIIVVIITTYY:: A volunteer task in which the individual serving uses the same skills that they use in their paid occupation.
Capitalizing on Volunteers’ Skills: Volunteering by Occupation in America
3
Key Findings Most volunteers do not perform service activities that relate to their professional or occupational skills. Of the 22 occupational groups included in this study, each has a number of volunteers performing every one of the activities identified in the survey. It is not surprising to see that some medical professionals coach youth sports for their volunteer activity, or that an artist might serve food at a soup kitchen, since volunteers have a variety of skills, interests and goals in addition to the ones they use for their paid work. The CPS data show how often volunteers participate in each activity, including those activities that relate to their occupational skills.
Most volunteers in every occupational group do not perform volunteer service activities that are directly related to their professional skills and abilities (see Tables A-2 and A-3 in the Appendix). If most volunteers tended to use their professional skills while volunteering, we would expect to see many, or most, volunteers within each occupational group performing particular activities that they also use while working for pay. On the contrary, there is considerable variety within each occupational group in the types of activities volunteers perform. Table A-2 shows that across all occupational groups, a majority of volunteers do not perform any single particular activity. Furthermore, the most common activities for volunteers in general also tend to be the most common activities for volunteers within each occupational group. Finally, as Table A-3 shows, volunteers within each occupational category specialize in a variety of volunteer activities; in none of the occupations do we see more than a quarter of volunteers specializing in the same main activity.
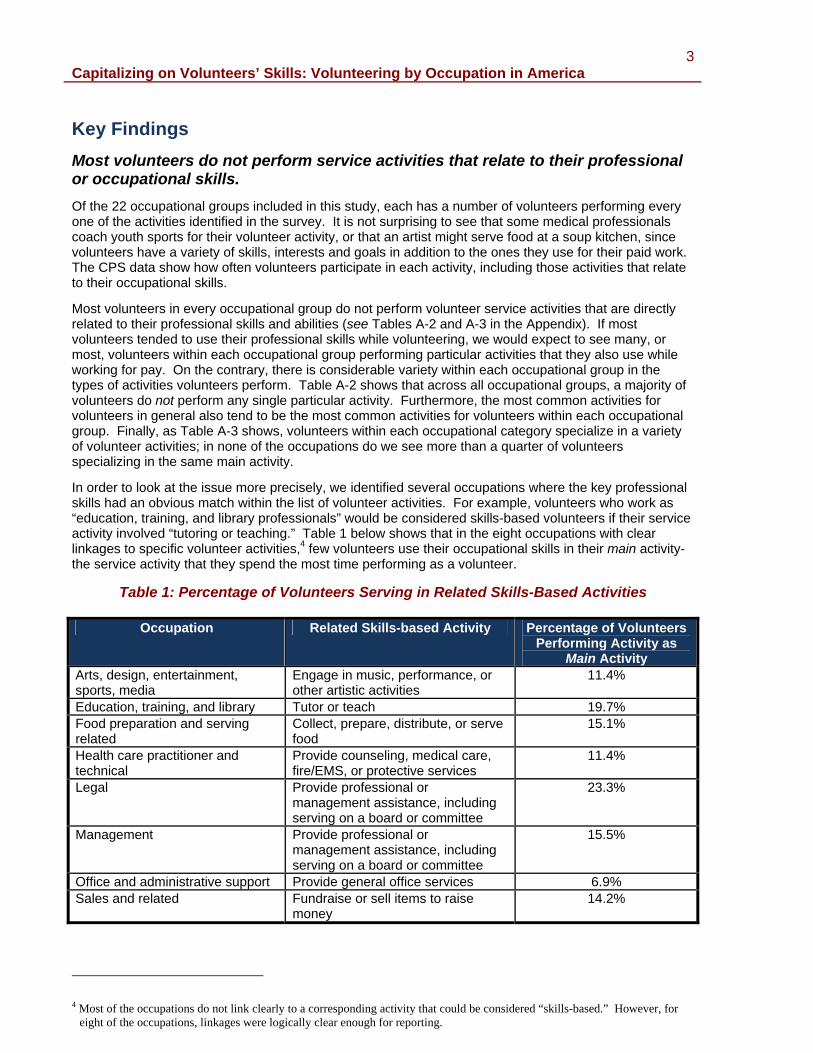
In order to look at the issue more precisely, we identified several occupations where the key professional skills had an obvious match within the list of volunteer activities. For example, volunteers who work as “education, training, and library professionals” would be considered skills-based volunteers if their service activity involved “tutoring or teaching.” Table 1 below shows that in the eight occupations with clear linkages to specific volunteer activities,4 few volunteers use their occupational skills in their main activity-the service activity that they spend the most time performing as a volunteer.
Table 1: Percentage of Volunteers Serving in Related Skills-Based Activities
4 Most of the occupations do not link clearly to a corresponding activity that could be considered “skills-based.” However, for
eight of the occupations, linkages were logically clear enough for reporting.
Occupation Related Skills-based Activity Percentage of Volunteers Performing Activity as
Main Activity Arts, design, entertainment, sports, media
Engage in music, performance, or other artistic activities
11.4%
Education, training, and library Tutor or teach 19.7% Food preparation and serving related
Collect, prepare, distribute, or serve food
15.1%
Health care practitioner and technical
Provide counseling, medical care, fire/EMS, or protective services
11.4%
Legal Provide professional or management assistance, including serving on a board or committee
23.3%
Management Provide professional or management assistance, including serving on a board or committee
15.5%
Office and administrative support Provide general office services 6.9% Sales and related Fundraise or sell items to raise
money 14.2%
Capitalizing on Volunteers’ Skills: Volunteering by Occupation in America
4
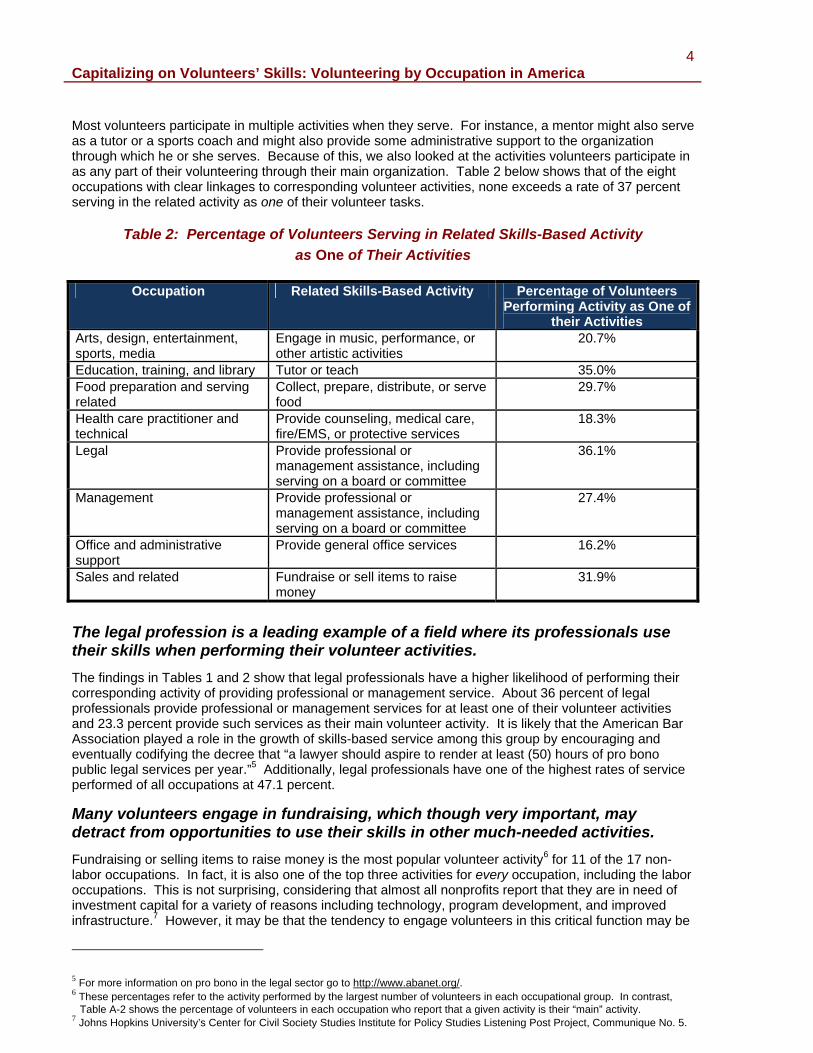
Most volunteers participate in multiple activities when they serve. For instance, a mentor might also serve as a tutor or a sports coach and might also provide some administrative support to the organization through which he or she serves. Because of this, we also looked at the activities volunteers participate in as any part of their volunteering through their main organization. Table 2 below shows that of the eight occupations with clear linkages to corresponding volunteer activities, none exceeds a rate of 37 percent serving in the related activity as one of their volunteer tasks.
Table 2: Percentage of Volunteers Serving in Related Skills-Based Activity as One of Their Activities
The legal profession is a leading example of a field where its professionals use their skills when performing their volunteer activities. The findings in Tables 1 and 2 show that legal professionals have a higher likelihood of performing their corresponding activity of providing professional or management service. About 36 percent of legal professionals provide professional or management services for at least one of their volunteer activities and 23.3 percent provide such services as their main volunteer activity. It is likely that the American Bar Association played a role in the growth of skills-based service among this group by encouraging and eventually codifying the decree that “a lawyer should aspire to render at least (50) hours of pro bono public legal services per year.”5 Additionally, legal professionals have one of the highest rates of service performed of all occupations at 47.1 percent.
Many volunteers engage in fundraising, which though very important, may detract from opportunities to use their skills in other much-needed activities. Fundraising or selling items to raise money is the most popular volunteer activity6 for 11 of the 17 non-labor occupations. In fact, it is also one of the top three activities for every occupation, including the labor occupations. This is not surprising, considering that almost all nonprofits report that they are in need of investment capital for a variety of reasons including technology, program development, and improved infrastructure.7 However, it may be that the tendency to engage volunteers in this critical function may be
5 For more information on pro bono in the legal sector go to http://www.abanet.org/. 6 These percentages refer to the activity performed by the largest number of volunteers in each occupational group. In contrast,
Table A-2 shows the percentage of volunteers in each occupation who report that a given activity is their “main” activity. 7 Johns Hopkins University’s Center for Civil Society Studies Institute for Policy Studies Listening Post Project, Communique No. 5.
Occupation Related Skills-Based Activity Percentage of Volunteers Performing Activity as One of
their Activities Arts, design, entertainment, sports, media
Engage in music, performance, or other artistic activities
20.7%
Education, training, and library Tutor or teach 35.0% Food preparation and serving related
Collect, prepare, distribute, or serve food
29.7%
Health care practitioner and technical
Provide counseling, medical care, fire/EMS, or protective services
18.3%
Legal Provide professional or management assistance, including serving on a board or committee
36.1%
Management Provide professional or management assistance, including serving on a board or committee
27.4%
Office and administrative support
Provide general office services 16.2%
Sales and related Fundraise or sell items to raise money
31.9%
Capitalizing on Volunteers’ Skills: Volunteering by Occupation in America
5
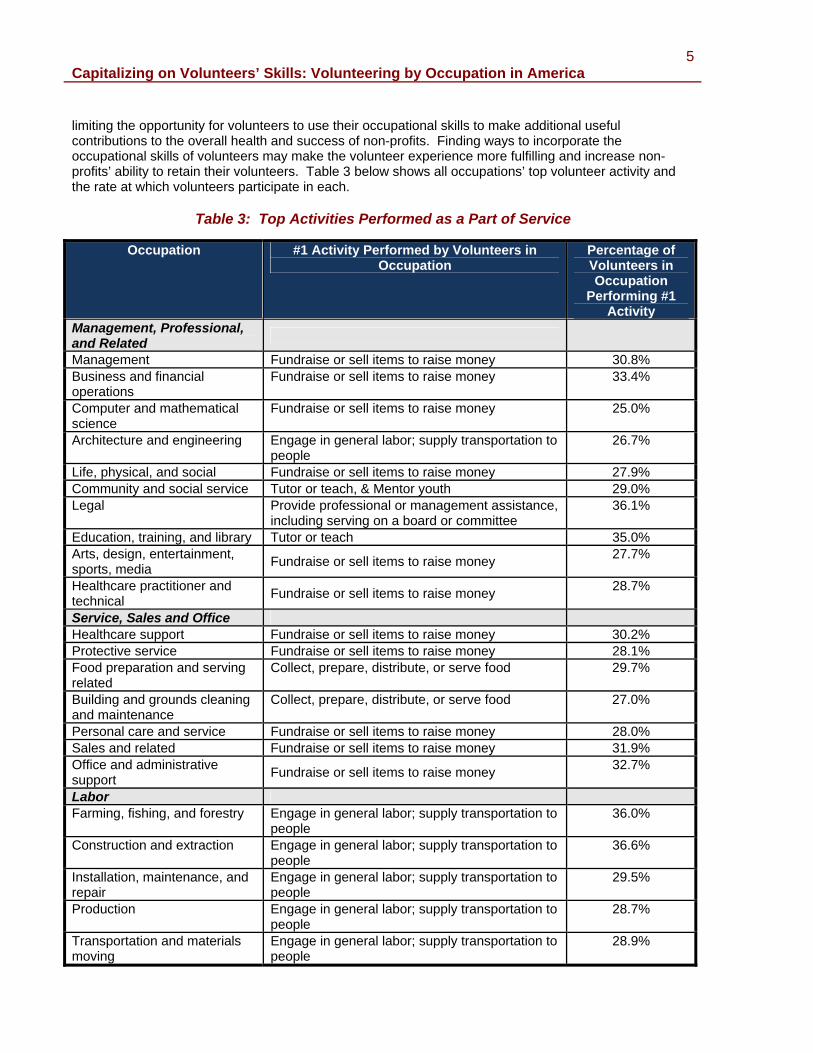
limiting the opportunity for volunteers to use their occupational skills to make additional useful contributions to the overall health and success of non-profits. Finding ways to incorporate the occupational skills of volunteers may make the volunteer experience more fulfilling and increase non-profits’ ability to retain their volunteers. Table 3 below shows all occupations’ top volunteer activity and the rate at which volunteers participate in each.
Table 3: Top Activities Performed as a Part of Service
Occupation #1 Activity Performed by Volunteers in Occupation
Percentage of Volunteers in Occupation
Performing #1 Activity
Management, Professional, and Related
Management Fundraise or sell items to raise money 30.8% Business and financial operations
Fundraise or sell items to raise money 33.4%
Computer and mathematical science
Fundraise or sell items to raise money 25.0%
Architecture and engineering Engage in general labor; supply transportation to people
26.7%
Life, physical, and social Fundraise or sell items to raise money 27.9% Community and social service Tutor or teach, & Mentor youth 29.0% Legal Provide professional or management assistance,
including serving on a board or committee 36.1%
Education, training, and library Tutor or teach 35.0% Arts, design, entertainment, sports, media Fundraise or sell items to raise money 27.7%
Healthcare practitioner and technical Fundraise or sell items to raise money 28.7%
Service, Sales and Office Healthcare support Fundraise or sell items to raise money 30.2% Protective service Fundraise or sell items to raise money 28.1% Food preparation and serving related
Collect, prepare, distribute, or serve food 29.7%
Building and grounds cleaning and maintenance
Collect, prepare, distribute, or serve food 27.0%
Personal care and service Fundraise or sell items to raise money 28.0% Sales and related Fundraise or sell items to raise money 31.9% Office and administrative support Fundraise or sell items to raise money 32.7%
Labor Farming, fishing, and forestry Engage in general labor; supply transportation to
people 36.0%
Construction and extraction Engage in general labor; supply transportation to people
36.6%
Installation, maintenance, and repair
Engage in general labor; supply transportation to people
29.5%
Production Engage in general labor; supply transportation to people
28.7%
Transportation and materials moving
Engage in general labor; supply transportation to people
28.9%
Capitalizing on Volunteers’ Skills: Volunteering by Occupation in America
6
Interestingly, providing general labor or transportation is the most likely volunteer activity for workers in all the labor occupations. While the relationship between each labor occupation and this activity is not explicitly clear, this general trend could be a sign that adults in labor occupations are doing more skills-based volunteering than adults in most other occupations.
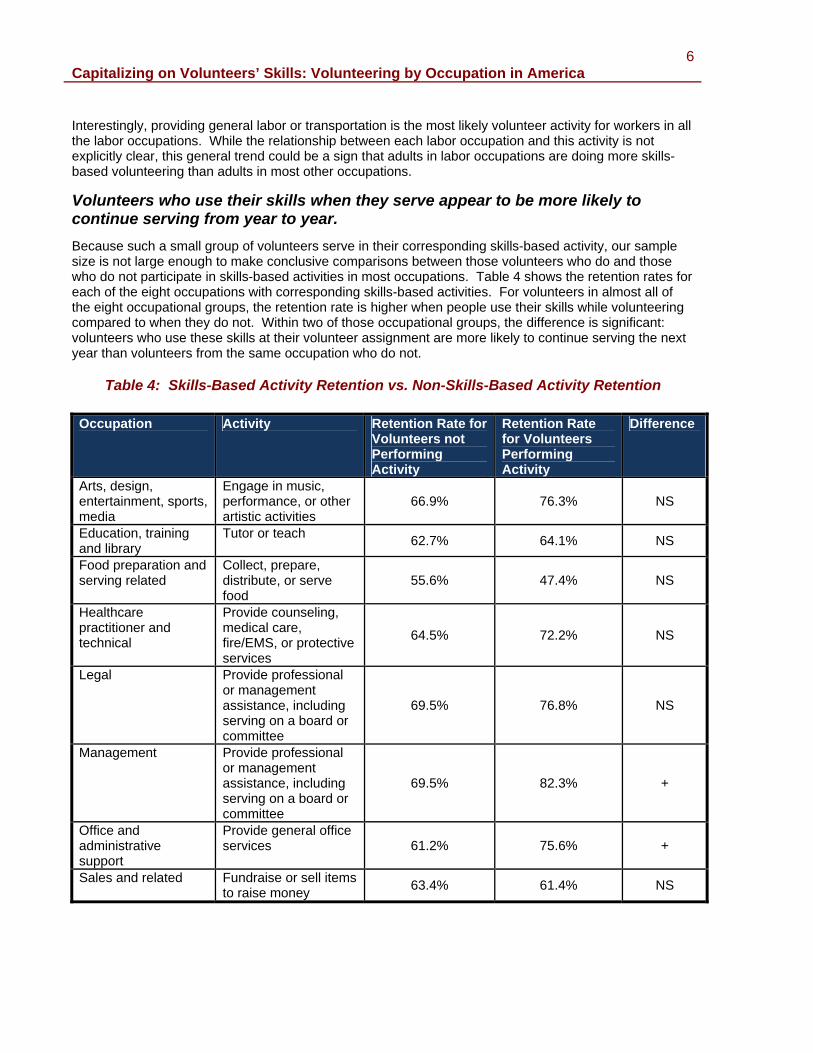
Volunteers who use their skills when they serve appear to be more likely to continue serving from year to year. Because such a small group of volunteers serve in their corresponding skills-based activity, our sample size is not large enough to make conclusive comparisons between those volunteers who do and those who do not participate in skills-based activities in most occupations. Table 4 shows the retention rates for each of the eight occupations with corresponding skills-based activities. For volunteers in almost all of the eight occupational groups, the retention rate is higher when people use their skills while volunteering compared to when they do not. Within two of those occupational groups, the difference is significant: volunteers who use these skills at their volunteer assignment are more likely to continue serving the next year than volunteers from the same occupation who do not.
Table 4: Skills-Based Activity Retention vs. Non-Skills-Based Activity Retention Occupation Activity Retention Rate for
Volunteers not Performing Activity
Retention Rate for Volunteers Performing Activity
Difference
Arts, design, entertainment, sports, media
Engage in music, performance, or other artistic activities
66.9% 76.3% NS
Education, training and library
Tutor or teach 62.7% 64.1% NS
Food preparation and serving related
Collect, prepare, distribute, or serve food
55.6% 47.4% NS
Healthcare practitioner and technical
Provide counseling, medical care, fire/EMS, or protective services
64.5% 72.2% NS
Legal Provide professional or management assistance, including serving on a board or committee
69.5% 76.8% NS
Management Provide professional or management assistance, including serving on a board or committee
69.5% 82.3% +
Office and administrative support
Provide general office services 61.2% 75.6% +
Sales and related Fundraise or sell items to raise money 63.4% 61.4% NS
Capitalizing on Volunteers’ Skills: Volunteering by Occupation in America
7
Conclusion and Implications Volunteers with particular occupational skills can sometimes be challenging to find.
Of course, a limitless supply of volunteers with the skills a particular community or organization needs simply does not exist. For instance, nonprofits in need of business and financial operations skills will find that only 5.5 percent of people who volunteer are professionals in this field. While this is all the more reason to appreciate those skills and strive to make real use of them, it is also reason to consider alternative strategies for engaging the skilled volunteers needed. By forging strong partnerships, some nonprofits have been able to share volunteers among themselves. Such a cooperative agreement gives volunteers a broader menu of service options and gives nonprofits additional opportunities for recruiting volunteers with particular skills.
Taking advantage of volunteers’ skills can greatly benefit nonprofits by increasing the value of volunteers’ contributions.
While it can be a struggle for nonprofits to identify skills-based volunteer opportunities and to train volunteers appropriately to fill skills-based positions, the potential return on the investment can be substantial. By utilizing the skills of volunteers nonprofit organizations stand to benefit from hundreds, even thousands of dollars of value from each volunteer every year. For example, a traditional volunteer activity such as stuffing envelopes for a mail campaign might be worth about minimum wage (the federal minimum wage is currently set at $6.55 per hour). If that volunteer serves 50 hours in a year, that amounts to a little less than $330 of volunteer value gained by the nonprofit. However, if that volunteer is a management professional who uses their skills to manage the same mail campaign, each hour is worth an average of $46.22. Multiplied by the same 50 hours, that is a total of over $2300 of volunteer value for the nonprofit.8
Some nonprofits have already begun to make this shift. For example, Goodwill Industries of San Francisco welcomed a team of Harvard Business School Community Partners to their organization—not to sort clothes in their thrift store, but to evaluate new business opportunities that might generate increased revenue and new job opportunities for Goodwill clients. By putting the skills of these business development specialists to use, Goodwill greatly increased these volunteers’ value to the organization. Nonprofits interested in following in the footsteps of Goodwill might consider involving volunteers in activities like business planning, human resources and organizational development, information technology, logistics, communications, etc.
Professional associations and corporations can be key players in building momentum for service among professionals in their field.
The legal community provides a great example of how a professional association can lead its membership toward service that makes an impact on communities. By calling on lawyers across America to provide at least 50 hours of pro bono service each year, the American Bar Association has set a standard for all professionals in the field. Not only has this strong focus on pro bono activities fostered competition among firms that has spurred greater service, it has also encouraged the number of pro bono
8 This estimate is based on the average hourly wage for management professionals, according to wage data from the Occupational
Employment Statistics (OES) survey report, published May 2008 and. available at http://www.bls.gov/news.release/pdf/ocwage.pdf. Of the 23 major occupational groups in the Standard Occupational Classification (SOC) system, only military specific occupations are not represented in the OES survey.
BBUUSSIINNEESSSS AANNDD FFIINNAANNCCIIAALL OOPPEERRAATTIIOONNSS PPRROOFFEESSSSIIOONNAALLSS’’ AAVVEERRAAGGEE HHOOUURRLLYY WWAAGGEE:: $$3300..0011.. Many nonprofit leaders agree that organizations could benefit from the contributions of volunteers who are focused on strategic and business planning, as well as finance and accounting. By matching professionals in the field to these activities, nonprofits gain a great return on their volunteer investments. CCOOMMPPUUTTEERR AANNDD MMAATTHHEEMMAATTIICCAALL SSCCIIEENNCCEE PPRROOFFEESSSSIIOONNAALLSS’’ AAVVEERRAAGGEE HHOOUURRLLYY WWAAGGEE:: $$3344..7711.. A number of nonprofit leaders also identify that information technology is an area in which organizations tend to lack expertise. Again, matching volunteers who have these skills with activities like Web site design, data systems design, etc. can greatly increase the approximate value of their service to the organization.
Capitalizing on Volunteers’ Skills: Volunteering by Occupation in America
8
support organizations to grow by leaps and bounds and build the infrastructure for effective service.9 Public Architecture has similarly urged that all architectural firms pledge at least one percent of their billable hours to pro bono service and is already finding many firms rising to the challenge and even surpassing the one percent mark.10 Professional associations of all kinds can do much to establish skills-based service in a field as a norm and encourage pro bono and skills-based growth.
Just as professional associations have the opportunity to challenge and support their members in pro bono activities, corporations can afford their employees the same opportunity. Corporate social responsibility today goes way beyond not causing harm, instead it seeks to be a driver of good in communities across the country and around the world. Skills-based volunteering programs allow corporations to demonstrate this enhanced social responsibility by joining hand-in-hand with nonprofits to build their capacity, and simultaneously giving employees an opportunity to use their skills in new ways that lead to fulfillment and personal satisfaction.
Methodology The data for this brief were collected through the Current Population Survey’s (CPS) 2005, 2006, and 2007 September Volunteer Supplements. The CPS is a monthly survey of about 60,000 households (approximately 100,000 adults), conducted by the U.S. Census Bureau for the Bureau of Labor Statistics in order to obtain information on employment and unemployment among the nation’s non-institutionalized civilian population age 16 and over. Volunteers are defined as individuals who performed unpaid volunteer activities through or for an organization at any point during the 12-month period, from September 1 of the prior year through the survey week in September of the survey year. For more information about the volunteer supplement, see the Technical Note at http://www.nationalservice.gov/pdf/volunteer_study_07.pdf. For more information about the occupational categories used in this brief, please see footnote 2.
9 Segal, Debbie, and Steven Scudder. “Pro Bono: No longer Random Acts of Kindness.” 2005. 10 www.theonepercent.org.
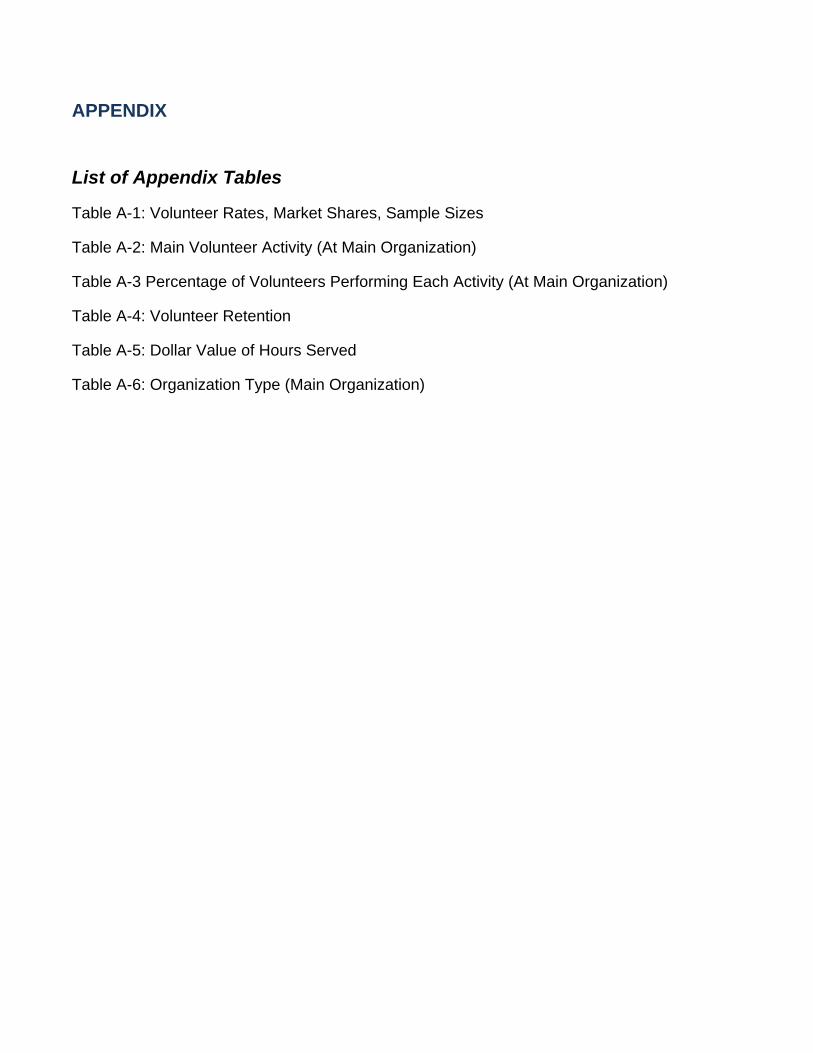
APPENDIX
List of Appendix Tables
Table A-1: Volunteer Rates, Market Shares, Sample Sizes
Table A-2: Main Volunteer Activity (At Main Organization)
Table A-3 Percentage of Volunteers Performing Each Activity (At Main Organization)
Table A-4: Volunteer Retention
Table A-5: Dollar Value of Hours Served
Table A-6: Organization Type (Main Organization)
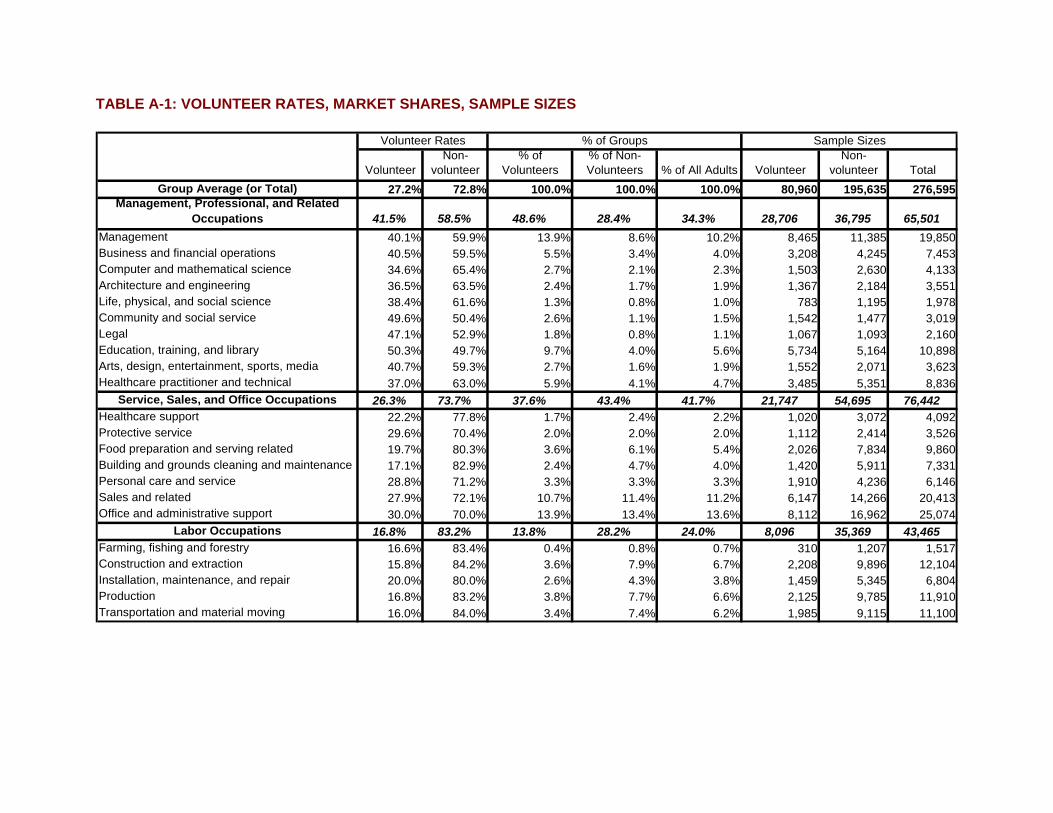
TABLE A-1: VOLUNTEER RATES, MARKET SHARES, SAMPLE SIZES
Volunteer
Non-volunteer
% of Volunteers
% of Non-Volunteers % of All Adults Volunteer
Non-volunteer Total
Group Average (or Total) 27.2% 72.8% 100.0% 100.0% 100.0% 80,960 195,635 276,595Management, Professional, and Related
Occupations 41.5% 58.5% 48.6% 28.4% 34.3% 28,706 36,795 65,501Management 40.1% 59.9% 13.9% 8.6% 10.2% 8,465 11,385 19,850Business and financial operations 40.5% 59.5% 5.5% 3.4% 4.0% 3,208 4,245 7,453Computer and mathematical science 34.6% 65.4% 2.7% 2.1% 2.3% 1,503 2,630 4,133Architecture and engineering 36.5% 63.5% 2.4% 1.7% 1.9% 1,367 2,184 3,551Life, physical, and social science 38.4% 61.6% 1.3% 0.8% 1.0% 783 1,195 1,978Community and social service 49.6% 50.4% 2.6% 1.1% 1.5% 1,542 1,477 3,019Legal 47.1% 52.9% 1.8% 0.8% 1.1% 1,067 1,093 2,160Education, training, and library 50.3% 49.7% 9.7% 4.0% 5.6% 5,734 5,164 10,898Arts, design, entertainment, sports, media 40.7% 59.3% 2.7% 1.6% 1.9% 1,552 2,071 3,623Healthcare practitioner and technical 37.0% 63.0% 5.9% 4.1% 4.7% 3,485 5,351 8,836
Service, Sales, and Office Occupations 26.3% 73.7% 37.6% 43.4% 41.7% 21,747 54,695 76,442Healthcare support 22.2% 77.8% 1.7% 2.4% 2.2% 1,020 3,072 4,092Protective service 29.6% 70.4% 2.0% 2.0% 2.0% 1,112 2,414 3,526Food preparation and serving related 19.7% 80.3% 3.6% 6.1% 5.4% 2,026 7,834 9,860Building and grounds cleaning and maintenance 17.1% 82.9% 2.4% 4.7% 4.0% 1,420 5,911 7,331Personal care and service 28.8% 71.2% 3.3% 3.3% 3.3% 1,910 4,236 6,146Sales and related 27.9% 72.1% 10.7% 11.4% 11.2% 6,147 14,266 20,413Office and administrative support 30.0% 70.0% 13.9% 13.4% 13.6% 8,112 16,962 25,074
Labor Occupations 16.8% 83.2% 13.8% 28.2% 24.0% 8,096 35,369 43,465Farming, fishing and forestry 16.6% 83.4% 0.4% 0.8% 0.7% 310 1,207 1,517Construction and extraction 15.8% 84.2% 3.6% 7.9% 6.7% 2,208 9,896 12,104Installation, maintenance, and repair 20.0% 80.0% 2.6% 4.3% 3.8% 1,459 5,345 6,804Production 16.8% 83.2% 3.8% 7.7% 6.6% 2,125 9,785 11,910Transportation and material moving 16.0% 84.0% 3.4% 7.4% 6.2% 1,985 9,115 11,100
Volunteer Rates Sample Sizes% of Groups
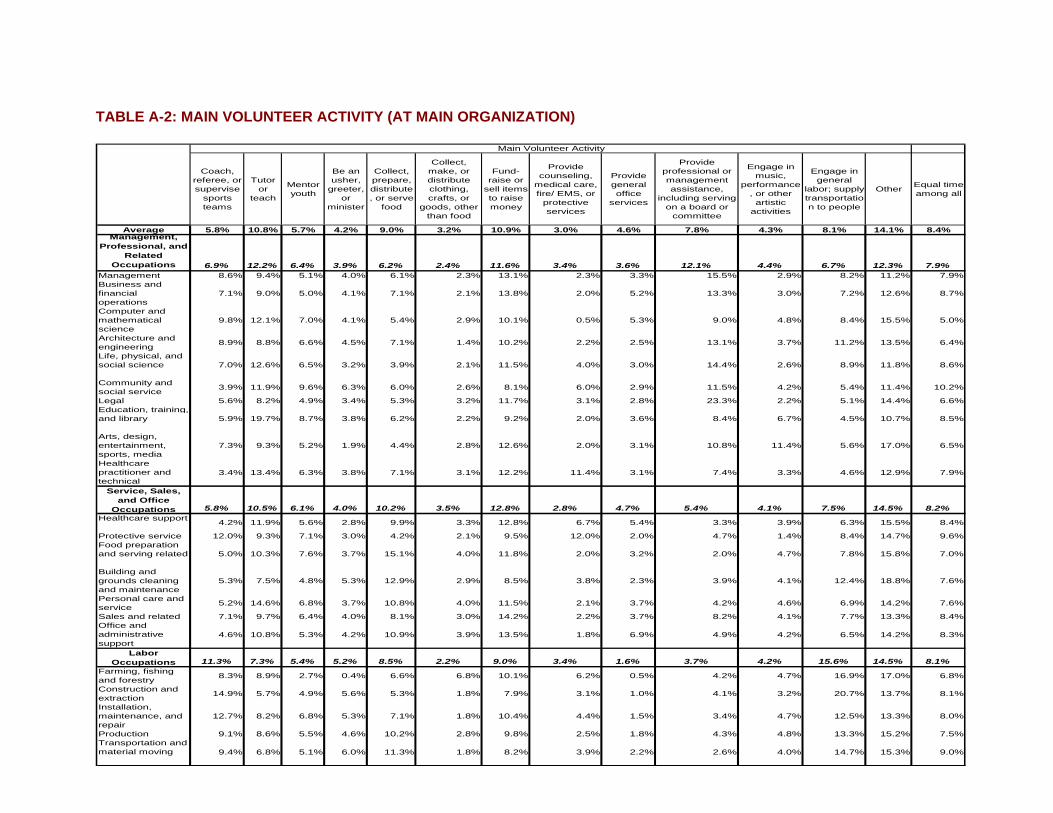
TABLE A-2: MAIN VOLUNTEER ACTIVITY (AT MAIN ORGANIZATION)
Coach, referee, or supervise
sports teams
Tutor or
teach
Mentor youth
Be an usher,
greeter, or
minister
Collect, prepare, distribute, or serve
food
Collect, make, or distribute clothing, crafts, or
goods, other than food
Fund-raise or
sell items to raise money
Provide counseling,
medical care, fire/ EMS, or
protective services
Provide general office
services
Provide professional or management assistance,
including serving on a board or
committee
Engage in music,
performance, or other artistic
activities
Engage in general
labor; supply transportation to people
Other Equal time among all
Average 5.8% 10.8% 5.7% 4.2% 9.0% 3.2% 10.9% 3.0% 4.6% 7.8% 4.3% 8.1% 14.1% 8.4%Management,
Professional, and Related
Occupations 6.9% 12.2% 6.4% 3.9% 6.2% 2.4% 11.6% 3.4% 3.6% 12.1% 4.4% 6.7% 12.3% 7.9%Management 8.6% 9.4% 5.1% 4.0% 6.1% 2.3% 13.1% 2.3% 3.3% 15.5% 2.9% 8.2% 11.2% 7.9%Business and financial operations
7.1% 9.0% 5.0% 4.1% 7.1% 2.1% 13.8% 2.0% 5.2% 13.3% 3.0% 7.2% 12.6% 8.7%
Computer and mathematical science
9.8% 12.1% 7.0% 4.1% 5.4% 2.9% 10.1% 0.5% 5.3% 9.0% 4.8% 8.4% 15.5% 5.0%
Architecture and engineering 8.9% 8.8% 6.6% 4.5% 7.1% 1.4% 10.2% 2.2% 2.5% 13.1% 3.7% 11.2% 13.5% 6.4%
Life, physical, and social science 7.0% 12.6% 6.5% 3.2% 3.9% 2.1% 11.5% 4.0% 3.0% 14.4% 2.6% 8.9% 11.8% 8.6%
Community and social service 3.9% 11.9% 9.6% 6.3% 6.0% 2.6% 8.1% 6.0% 2.9% 11.5% 4.2% 5.4% 11.4% 10.2%
Legal 5.6% 8.2% 4.9% 3.4% 5.3% 3.2% 11.7% 3.1% 2.8% 23.3% 2.2% 5.1% 14.4% 6.6%Education, training, and library 5.9% 19.7% 8.7% 3.8% 6.2% 2.2% 9.2% 2.0% 3.6% 8.4% 6.7% 4.5% 10.7% 8.5%
Arts, design, entertainment, sports, media
7.3% 9.3% 5.2% 1.9% 4.4% 2.8% 12.6% 2.0% 3.1% 10.8% 11.4% 5.6% 17.0% 6.5%
Healthcare practitioner and technical
3.4% 13.4% 6.3% 3.8% 7.1% 3.1% 12.2% 11.4% 3.1% 7.4% 3.3% 4.6% 12.9% 7.9%
Service, Sales, and Office
Occupations 5.8% 10.5% 6.1% 4.0% 10.2% 3.5% 12.8% 2.8% 4.7% 5.4% 4.1% 7.5% 14.5% 8.2%Healthcare support 4.2% 11.9% 5.6% 2.8% 9.9% 3.3% 12.8% 6.7% 5.4% 3.3% 3.9% 6.3% 15.5% 8.4%
Protective service 12.0% 9.3% 7.1% 3.0% 4.2% 2.1% 9.5% 12.0% 2.0% 4.7% 1.4% 8.4% 14.7% 9.6%Food preparation and serving related 5.0% 10.3% 7.6% 3.7% 15.1% 4.0% 11.8% 2.0% 3.2% 2.0% 4.7% 7.8% 15.8% 7.0%
Building and grounds cleaning and maintenance
5.3% 7.5% 4.8% 5.3% 12.9% 2.9% 8.5% 3.8% 2.3% 3.9% 4.1% 12.4% 18.8% 7.6%
Personal care and service 5.2% 14.6% 6.8% 3.7% 10.8% 4.0% 11.5% 2.1% 3.7% 4.2% 4.6% 6.9% 14.2% 7.6%
Sales and related 7.1% 9.7% 6.4% 4.0% 8.1% 3.0% 14.2% 2.2% 3.7% 8.2% 4.1% 7.7% 13.3% 8.4%Office and administrative support
4.6% 10.8% 5.3% 4.2% 10.9% 3.9% 13.5% 1.8% 6.9% 4.9% 4.2% 6.5% 14.2% 8.3%
Labor Occupations 11.3% 7.3% 5.4% 5.2% 8.5% 2.2% 9.0% 3.4% 1.6% 3.7% 4.2% 15.6% 14.5% 8.1%
Farming, fishing and forestry 8.3% 8.9% 2.7% 0.4% 6.6% 6.8% 10.1% 6.2% 0.5% 4.2% 4.7% 16.9% 17.0% 6.8%
Construction and extraction 14.9% 5.7% 4.9% 5.6% 5.3% 1.8% 7.9% 3.1% 1.0% 4.1% 3.2% 20.7% 13.7% 8.1%
Installation, maintenance, and repair
12.7% 8.2% 6.8% 5.3% 7.1% 1.8% 10.4% 4.4% 1.5% 3.4% 4.7% 12.5% 13.3% 8.0%
Production 9.1% 8.6% 5.5% 4.6% 10.2% 2.8% 9.8% 2.5% 1.8% 4.3% 4.8% 13.3% 15.2% 7.5%Transportation and material moving 9.4% 6.8% 5.1% 6.0% 11.3% 1.8% 8.2% 3.9% 2.2% 2.6% 4.0% 14.7% 15.3% 9.0%
Main Volunteer Activity
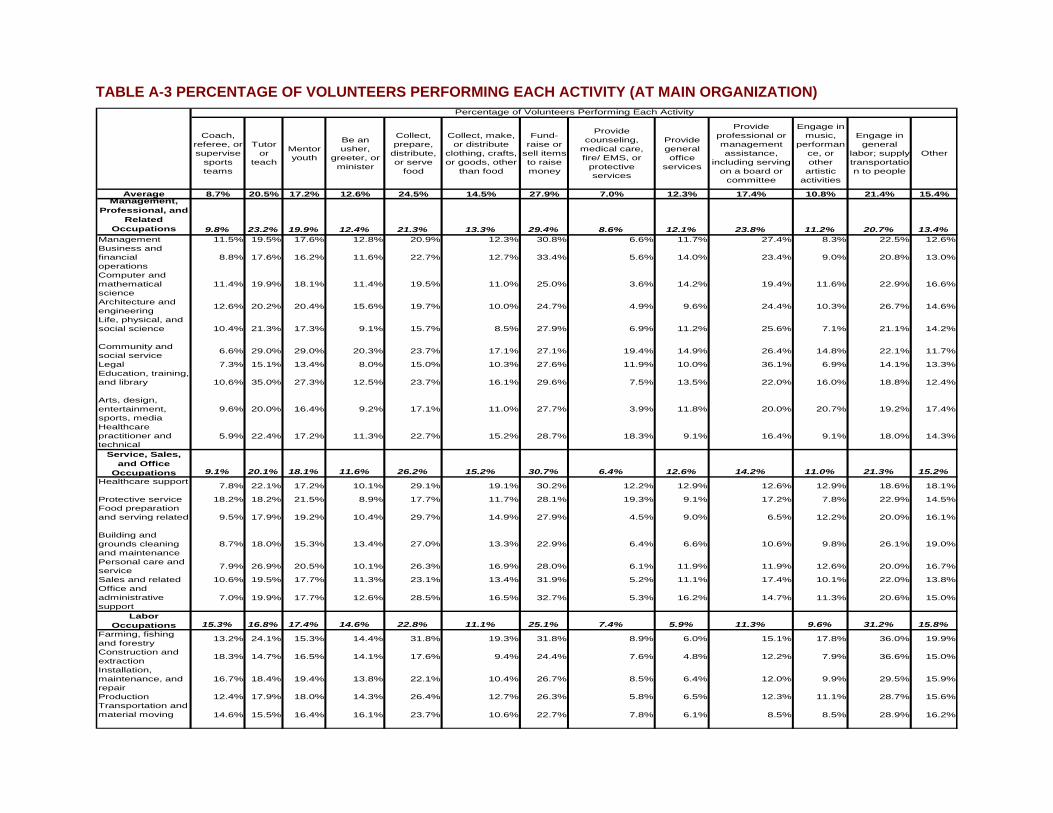
TABLE A-3 PERCENTAGE OF VOLUNTEERS PERFORMING EACH ACTIVITY (AT MAIN ORGANIZATION)
Coach, referee, or supervise
sports teams
Tutor or
teach
Mentor youth
Be an usher,
greeter, or minister
Collect, prepare,
distribute, or serve
food
Collect, make, or distribute
clothing, crafts, or goods, other
than food
Fund-raise or
sell items to raise money
Provide counseling,
medical care, fire/ EMS, or
protective services
Provide general office
services
Provide professional or management assistance,
including serving on a board or
committee
Engage in music,
performance, or other
artistic activities
Engage in general
labor; supply transportation to people
Other
Average 8.7% 20.5% 17.2% 12.6% 24.5% 14.5% 27.9% 7.0% 12.3% 17.4% 10.8% 21.4% 15.4%Management,
Professional, and Related
Occupations 9.8% 23.2% 19.9% 12.4% 21.3% 13.3% 29.4% 8.6% 12.1% 23.8% 11.2% 20.7% 13.4%Management 11.5% 19.5% 17.6% 12.8% 20.9% 12.3% 30.8% 6.6% 11.7% 27.4% 8.3% 22.5% 12.6%Business and financial operations
8.8% 17.6% 16.2% 11.6% 22.7% 12.7% 33.4% 5.6% 14.0% 23.4% 9.0% 20.8% 13.0%
Computer and mathematical science
11.4% 19.9% 18.1% 11.4% 19.5% 11.0% 25.0% 3.6% 14.2% 19.4% 11.6% 22.9% 16.6%
Architecture and engineering 12.6% 20.2% 20.4% 15.6% 19.7% 10.0% 24.7% 4.9% 9.6% 24.4% 10.3% 26.7% 14.6%
Life, physical, and social science 10.4% 21.3% 17.3% 9.1% 15.7% 8.5% 27.9% 6.9% 11.2% 25.6% 7.1% 21.1% 14.2%
Community and social service 6.6% 29.0% 29.0% 20.3% 23.7% 17.1% 27.1% 19.4% 14.9% 26.4% 14.8% 22.1% 11.7%
Legal 7.3% 15.1% 13.4% 8.0% 15.0% 10.3% 27.6% 11.9% 10.0% 36.1% 6.9% 14.1% 13.3%Education, training, and library 10.6% 35.0% 27.3% 12.5% 23.7% 16.1% 29.6% 7.5% 13.5% 22.0% 16.0% 18.8% 12.4%
Arts, design, entertainment, sports, media
9.6% 20.0% 16.4% 9.2% 17.1% 11.0% 27.7% 3.9% 11.8% 20.0% 20.7% 19.2% 17.4%
Healthcare practitioner and technical
5.9% 22.4% 17.2% 11.3% 22.7% 15.2% 28.7% 18.3% 9.1% 16.4% 9.1% 18.0% 14.3%
Service, Sales, and Office
Occupations 9.1% 20.1% 18.1% 11.6% 26.2% 15.2% 30.7% 6.4% 12.6% 14.2% 11.0% 21.3% 15.2%Healthcare support 7.8% 22.1% 17.2% 10.1% 29.1% 19.1% 30.2% 12.2% 12.9% 12.6% 12.9% 18.6% 18.1%
Protective service 18.2% 18.2% 21.5% 8.9% 17.7% 11.7% 28.1% 19.3% 9.1% 17.2% 7.8% 22.9% 14.5%Food preparation and serving related 9.5% 17.9% 19.2% 10.4% 29.7% 14.9% 27.9% 4.5% 9.0% 6.5% 12.2% 20.0% 16.1%
Building and grounds cleaning and maintenance
8.7% 18.0% 15.3% 13.4% 27.0% 13.3% 22.9% 6.4% 6.6% 10.6% 9.8% 26.1% 19.0%
Personal care and service 7.9% 26.9% 20.5% 10.1% 26.3% 16.9% 28.0% 6.1% 11.9% 11.9% 12.6% 20.0% 16.7%
Sales and related 10.6% 19.5% 17.7% 11.3% 23.1% 13.4% 31.9% 5.2% 11.1% 17.4% 10.1% 22.0% 13.8%Office and administrative support
7.0% 19.9% 17.7% 12.6% 28.5% 16.5% 32.7% 5.3% 16.2% 14.7% 11.3% 20.6% 15.0%
Labor Occupations 15.3% 16.8% 17.4% 14.6% 22.8% 11.1% 25.1% 7.4% 5.9% 11.3% 9.6% 31.2% 15.8%
Farming, fishing and forestry 13.2% 24.1% 15.3% 14.4% 31.8% 19.3% 31.8% 8.9% 6.0% 15.1% 17.8% 36.0% 19.9%
Construction and extraction 18.3% 14.7% 16.5% 14.1% 17.6% 9.4% 24.4% 7.6% 4.8% 12.2% 7.9% 36.6% 15.0%
Installation, maintenance, and repair
16.7% 18.4% 19.4% 13.8% 22.1% 10.4% 26.7% 8.5% 6.4% 12.0% 9.9% 29.5% 15.9%
Production 12.4% 17.9% 18.0% 14.3% 26.4% 12.7% 26.3% 5.8% 6.5% 12.3% 11.1% 28.7% 15.6%Transportation and material moving 14.6% 15.5% 16.4% 16.1% 23.7% 10.6% 22.7% 7.8% 6.1% 8.5% 8.5% 28.9% 16.2%
Percentage of Volunteers Performing Each Activity
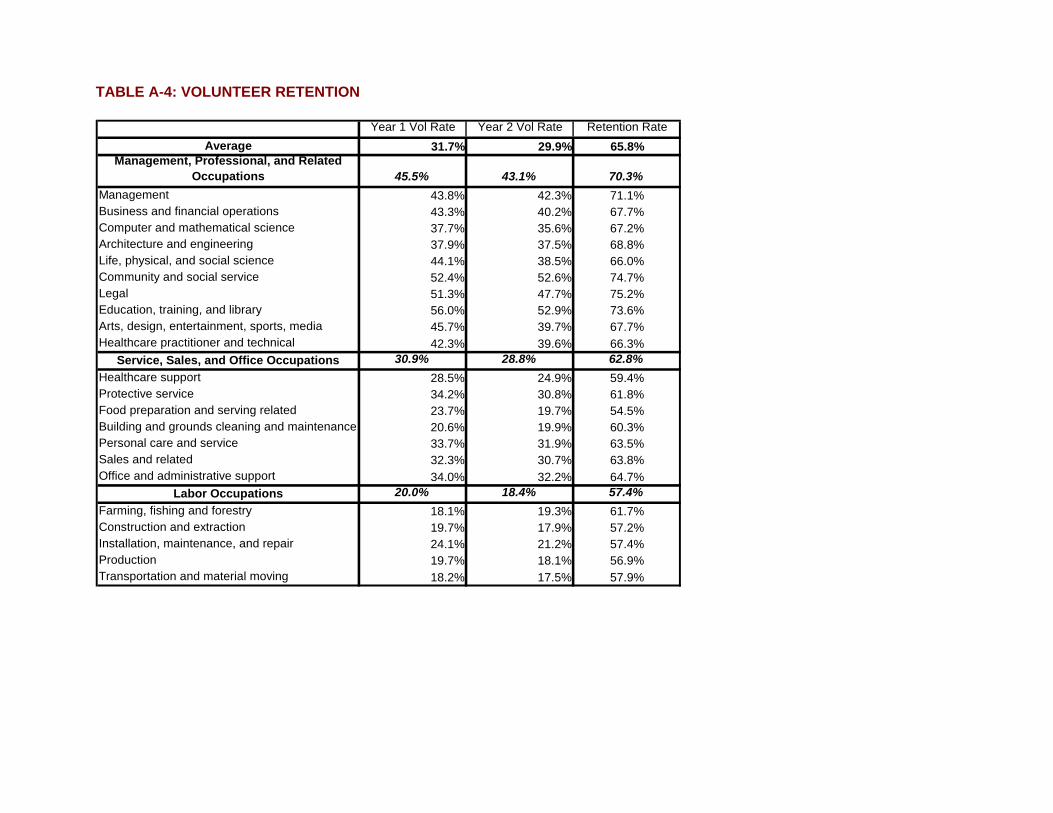
TABLE A-4: VOLUNTEER RETENTION
Year 1 Vol Rate Year 2 Vol Rate Retention RateAverage 31.7% 29.9% 65.8%
Management, Professional, and Related Occupations 45.5% 43.1% 70.3%
Management 43.8% 42.3% 71.1%Business and financial operations 43.3% 40.2% 67.7%Computer and mathematical science 37.7% 35.6% 67.2%Architecture and engineering 37.9% 37.5% 68.8%Life, physical, and social science 44.1% 38.5% 66.0%Community and social service 52.4% 52.6% 74.7%Legal 51.3% 47.7% 75.2%Education, training, and library 56.0% 52.9% 73.6%Arts, design, entertainment, sports, media 45.7% 39.7% 67.7%Healthcare practitioner and technical 42.3% 39.6% 66.3%
Service, Sales, and Office Occupations 30.9% 28.8% 62.8%Healthcare support 28.5% 24.9% 59.4%Protective service 34.2% 30.8% 61.8%Food preparation and serving related 23.7% 19.7% 54.5%Building and grounds cleaning and maintenance 20.6% 19.9% 60.3%Personal care and service 33.7% 31.9% 63.5%Sales and related 32.3% 30.7% 63.8%Office and administrative support 34.0% 32.2% 64.7%
Labor Occupations 20.0% 18.4% 57.4%Farming, fishing and forestry 18.1% 19.3% 61.7%Construction and extraction 19.7% 17.9% 57.2%Installation, maintenance, and repair 24.1% 21.2% 57.4%Production 19.7% 18.1% 56.9%Transportation and material moving 18.2% 17.5% 57.9%
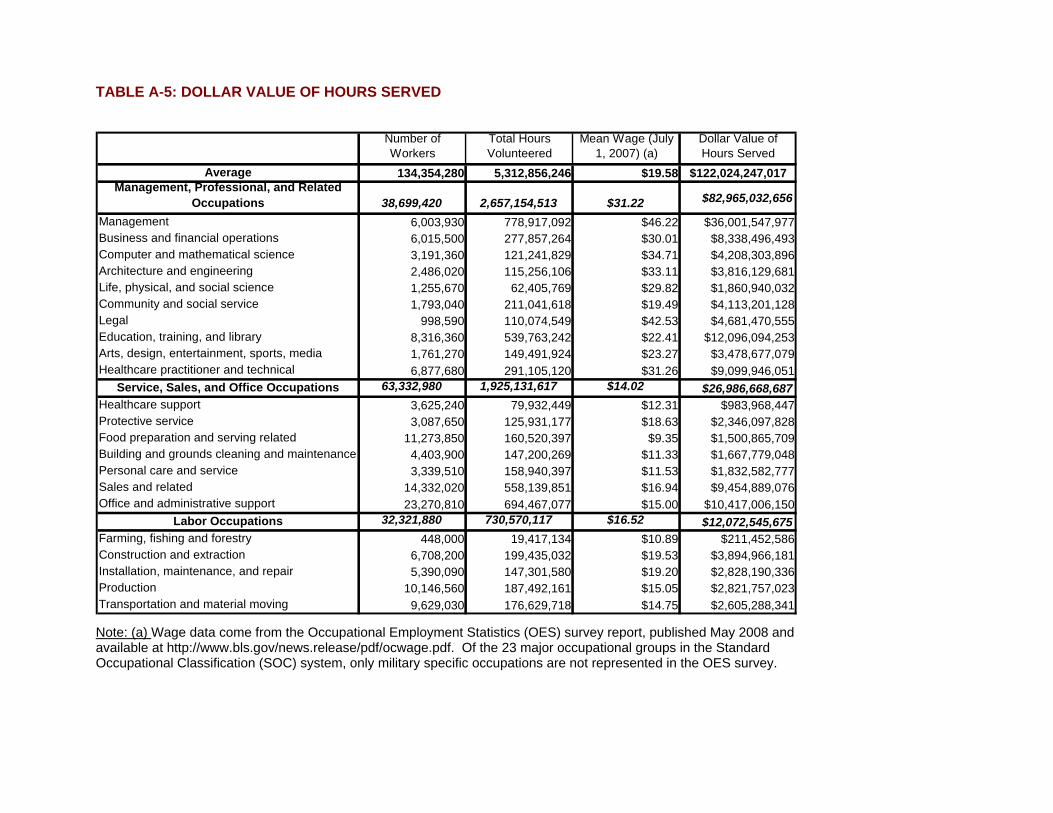
TABLE A-5: DOLLAR VALUE OF HOURS SERVED Note: (a) Wage data come from the Occupational Employment Statistics (OES) survey report, published May 2008 and available at http://www.bls.gov/news.release/pdf/ocwage.pdf. Of the 23 major occupational groups in the Standard Occupational Classification (SOC) system, only military specific occupations are not represented in the OES survey.
Number of Workers
Total Hours Volunteered
Mean Wage (July 1, 2007) (a)
Dollar Value of Hours Served
Average 134,354,280 5,312,856,246 $19.58 $122,024,247,017Management, Professional, and Related
Occupations 38,699,420 2,657,154,513 $31.22 $82,965,032,656
Management 6,003,930 778,917,092 $46.22 $36,001,547,977Business and financial operations 6,015,500 277,857,264 $30.01 $8,338,496,493Computer and mathematical science 3,191,360 121,241,829 $34.71 $4,208,303,896Architecture and engineering 2,486,020 115,256,106 $33.11 $3,816,129,681Life, physical, and social science 1,255,670 62,405,769 $29.82 $1,860,940,032Community and social service 1,793,040 211,041,618 $19.49 $4,113,201,128Legal 998,590 110,074,549 $42.53 $4,681,470,555Education, training, and library 8,316,360 539,763,242 $22.41 $12,096,094,253Arts, design, entertainment, sports, media 1,761,270 149,491,924 $23.27 $3,478,677,079Healthcare practitioner and technical 6,877,680 291,105,120 $31.26 $9,099,946,051
Service, Sales, and Office Occupations 63,332,980 1,925,131,617 $14.02 $26,986,668,687Healthcare support 3,625,240 79,932,449 $12.31 $983,968,447Protective service 3,087,650 125,931,177 $18.63 $2,346,097,828Food preparation and serving related 11,273,850 160,520,397 $9.35 $1,500,865,709Building and grounds cleaning and maintenance 4,403,900 147,200,269 $11.33 $1,667,779,048Personal care and service 3,339,510 158,940,397 $11.53 $1,832,582,777Sales and related 14,332,020 558,139,851 $16.94 $9,454,889,076Office and administrative support 23,270,810 694,467,077 $15.00 $10,417,006,150
Labor Occupations 32,321,880 730,570,117 $16.52 $12,072,545,675Farming, fishing and forestry 448,000 19,417,134 $10.89 $211,452,586Construction and extraction 6,708,200 199,435,032 $19.53 $3,894,966,181Installation, maintenance, and repair 5,390,090 147,301,580 $19.20 $2,828,190,336Production 10,146,560 187,492,161 $15.05 $2,821,757,023Transportation and material moving 9,629,030 176,629,718 $14.75 $2,605,288,341
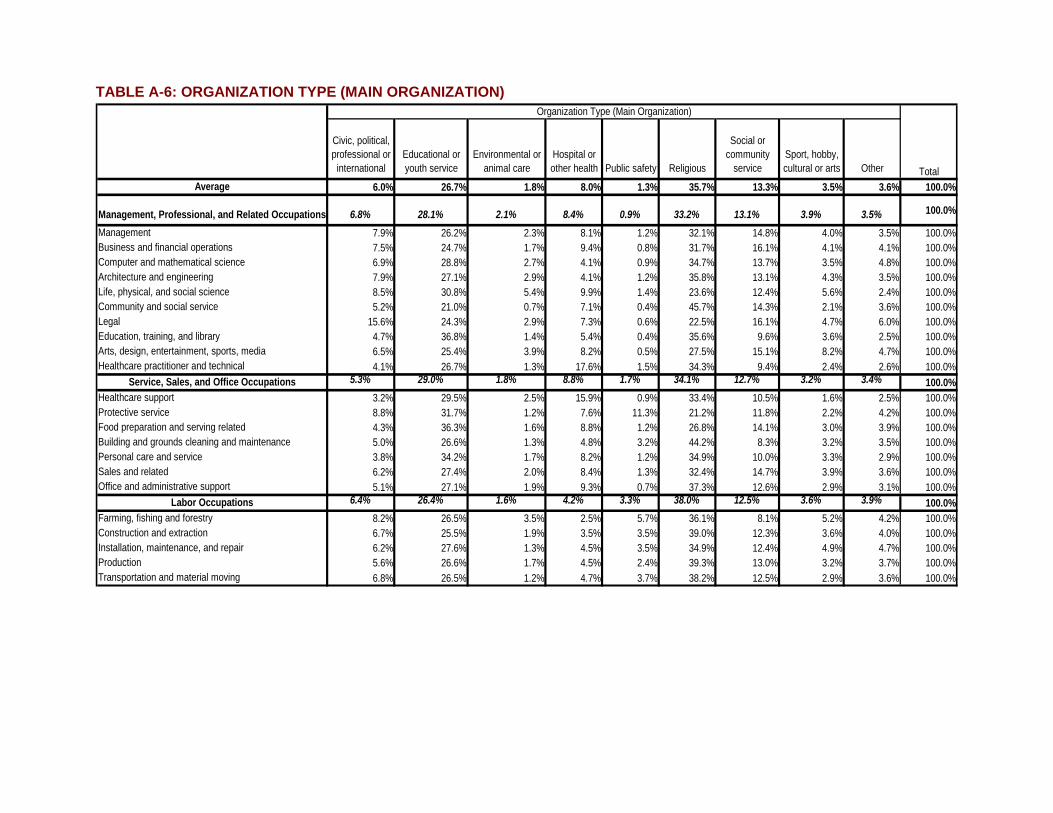
TABLE A-6: ORGANIZATION TYPE (MAIN ORGANIZATION)
Civic, political, professional or
internationalEducational or youth service
Environmental or animal care
Hospital or other health Public safety Religious
Social or community
serviceSport, hobby, cultural or arts Other
Average 6.0% 26.7% 1.8% 8.0% 1.3% 35.7% 13.3% 3.5% 3.6% 100.0%
Management, Professional, and Related Occupations 6.8% 28.1% 2.1% 8.4% 0.9% 33.2% 13.1% 3.9% 3.5% 100.0%
Management 7.9% 26.2% 2.3% 8.1% 1.2% 32.1% 14.8% 4.0% 3.5% 100.0%Business and financial operations 7.5% 24.7% 1.7% 9.4% 0.8% 31.7% 16.1% 4.1% 4.1% 100.0%Computer and mathematical science 6.9% 28.8% 2.7% 4.1% 0.9% 34.7% 13.7% 3.5% 4.8% 100.0%Architecture and engineering 7.9% 27.1% 2.9% 4.1% 1.2% 35.8% 13.1% 4.3% 3.5% 100.0%Life, physical, and social science 8.5% 30.8% 5.4% 9.9% 1.4% 23.6% 12.4% 5.6% 2.4% 100.0%Community and social service 5.2% 21.0% 0.7% 7.1% 0.4% 45.7% 14.3% 2.1% 3.6% 100.0%Legal 15.6% 24.3% 2.9% 7.3% 0.6% 22.5% 16.1% 4.7% 6.0% 100.0%Education, training, and library 4.7% 36.8% 1.4% 5.4% 0.4% 35.6% 9.6% 3.6% 2.5% 100.0%Arts, design, entertainment, sports, media 6.5% 25.4% 3.9% 8.2% 0.5% 27.5% 15.1% 8.2% 4.7% 100.0%Healthcare practitioner and technical 4.1% 26.7% 1.3% 17.6% 1.5% 34.3% 9.4% 2.4% 2.6% 100.0%
Service, Sales, and Office Occupations 5.3% 29.0% 1.8% 8.8% 1.7% 34.1% 12.7% 3.2% 3.4% 100.0%Healthcare support 3.2% 29.5% 2.5% 15.9% 0.9% 33.4% 10.5% 1.6% 2.5% 100.0%Protective service 8.8% 31.7% 1.2% 7.6% 11.3% 21.2% 11.8% 2.2% 4.2% 100.0%Food preparation and serving related 4.3% 36.3% 1.6% 8.8% 1.2% 26.8% 14.1% 3.0% 3.9% 100.0%Building and grounds cleaning and maintenance 5.0% 26.6% 1.3% 4.8% 3.2% 44.2% 8.3% 3.2% 3.5% 100.0%Personal care and service 3.8% 34.2% 1.7% 8.2% 1.2% 34.9% 10.0% 3.3% 2.9% 100.0%Sales and related 6.2% 27.4% 2.0% 8.4% 1.3% 32.4% 14.7% 3.9% 3.6% 100.0%Office and administrative support 5.1% 27.1% 1.9% 9.3% 0.7% 37.3% 12.6% 2.9% 3.1% 100.0%
Labor Occupations 6.4% 26.4% 1.6% 4.2% 3.3% 38.0% 12.5% 3.6% 3.9% 100.0%Farming, fishing and forestry 8.2% 26.5% 3.5% 2.5% 5.7% 36.1% 8.1% 5.2% 4.2% 100.0%Construction and extraction 6.7% 25.5% 1.9% 3.5% 3.5% 39.0% 12.3% 3.6% 4.0% 100.0%Installation, maintenance, and repair 6.2% 27.6% 1.3% 4.5% 3.5% 34.9% 12.4% 4.9% 4.7% 100.0%Production 5.6% 26.6% 1.7% 4.5% 2.4% 39.3% 13.0% 3.2% 3.7% 100.0%Transportation and material moving 6.8% 26.5% 1.2% 4.7% 3.7% 38.2% 12.5% 2.9% 3.6% 100.0%
Organization Type (Main Organization)
Total