Embed Size (px)
Citation preview
CAPITAL MARKETS INVESTORS
SURVEY
2012
The Capital Markets Investors Survey is a product of the Capital Markets Authority-Uganda. The findings, interpretations and conclusions expressed in this report do not necessarily reflect the official views of CMA. While every care has been taken in the preparation of this report, no representation, warranty or undertaking is given and no responsibility or liability is accepted by CMA as to the accuracy of the information contained therein.
Rights & Permissions
The material in this publication is copyrighted. Copying and/or transmitting portions or all of this work without permission may be violation of Ugandan law. The CMA encourages dissemination of its work and will normally grant permission to reproduce portions of its work promptly. For permission to photocopy or reprint any part of this work, please contact the CMA Research & Market Development Department.
8th Floor, Jubilee Insurance Centre, 14 Parliament Avenue, P. O. Box 24565 Kampala, UGANDA Tel: +256 - 414 - 342 788, +256 312 - 264 950/1, Fax: +256 - 414 - 342 803
Email: [email protected], Website: www.cmauganda.co.ug
CAPITAL MARKETS INVESTORS
SURVEY REPORT
2012
PREPARED BY
APAS CONSULTANTS LIMITED
Diamond Trust Building 4th floor, Kampala RoadP.O.Box 9360 KampalaTel. Office: 0791748472
Mob: +256 -772-402877/0772-569324Website: www.apasgroup.com
Email: [email protected]
JUNE 2012

2 | P a g e

3 | P a g e
TABLE OF CONTENTS
TABLE OF CONTENTS4
List of Figures 6
List of Tables 6
ACRONYMS 7
EXECUTIVE SUMMARY 8
1.0 INTRODUCTION 141.1 Purpose of the Survey 14
1.2 Objectives of the Survey 14
1.3 Approach and Methodology 15
2.0 CAPITAL MARKETS INVESTORS’ PROFILE 19
2.1 Introduction 19
2.2 Age 19
2.2 Gender of the Capital Markets Investors.20
2.3 Level of Education 20
2.4 Employment Status 21
2.5 Level of Income 22
3.0 KNOWLEDGE AND UNDERSTANDING OF CAPITAL MARKETS INDUSTRY 24
3.1 Introduction 24
3.2 Knowledge of capital Markets Terminology 24
3.3 Source of knowledge of Capital Markets 26
3.4 Reliability of Sources of Information 27
4.0 CAPITAL MARKETS INVESTMENTS 29
4.1 Introduction 29
4.2 Motivation to Invest in Capital Markets 29
4.3 Level of Investment 30
4.4 Frequency of Investment 35
4.5 Perception of Risks 36
5.0 INVESTOR PROTECTION 39
5.1 Introduction 39
5.2 Perception on Qualification of Capital Markets Participants 39
5.2 Perception on the Suitability of Products on the Market to Needs of Customers 40
5.3 Perception of confidence in Complaint Handling 41
5.4 Perception on Compliance with the Capital Markets laws 42
5.5 Perception that CMA regulates Capital Markets Effectively 43
6.0 SEEKING FOR INVESTMENT ADVICE 45
6.1 Introduction 45
6.2 Ever Sought Investment Advice 45

6.3 Source of Investment Advice 46
6.4 Perception about Appropriateness of Advice Given 47
4 | P a g e
6.5 Perception on Treatment of Customers 48
7.0 FACTORS AFFECTING INVESTMENTS IN UGANDA’S CAPITAL MARKETS 50
7.1 Introduction 50
7.2 Factors Affecting Investment 50
7.2.1 Low Financial Literacy Levels 50
7.2.2 Compliance of Companies 50
7.2.3 Number of Listed Companies 51
7.2.4 Limited Geographical Coverage 51
7.2.5 Level of Competition 51
7.2.6 Inflation 51
7.2.7 Liquidity 52
8.0 EMERGING ISSUES AND RECOMMENDATIONS 53
A.1 Questionnaire 55
A.2 Key Informant Guide 63
A.3 List of Key Informants 65

5 | P a g e

LIST OF FIGURES
Figure 1: Age Groups of Investors (% of Respondents) 19
Figure 2: Composition of the Capital Markets Investors by Gender 20
Figure 3: Level of Education of Investors (%) 21
Figure 4: Employment Status of investors 21
Figure 5: Level of Income 23
Figure 6: Knowledge of Terminologies used in Capital Markets 25
Figure 7: Sources of knowledge of Capital Markets 26
Figure 8: Reliability of Information (% of Respondents) 27
Figure 9: Motivation to invest in Capital Markets 29
Figure 10: Level of Investment in Capital Markets (% of Respondents) 31
Figure 11: Age and Level of investment (% of Respondents) 32
Figure 12: Sex and Level of Investment (% of Respondents) 33
Figure 13: Level of Education and Investment (% of Respondents) 34
Figure 14: Frequency of investment in Capital Markets (% of Respondents) 35
Figure 15: Level of Risk Investors Willing To Take (% of Respondents) 37
Figure 16: Confidence in Qualification of Capital Markets Participants (% of Respondents). 40
Figure 17: Confidence in the Suitability of Products for Consumers’ Needs (% of Respondents). 41
Figure 18: Perception of confidence in Complaint Handling (% of Respondents). 42
Figure 19: Confidence on Compliance with the Law and CMA Regulations 43
Figure 20: Perception that CMA regulates Capital Markets Effectively 44
Figure 21: Seeking Investment Advice (% of Respondents). 45
Figure 22: Sources of Investment Advice (% of Respondents) 46
Figure 23: Confidence in Appropriateness of Investment Advice Given 47
Figure 24: Level of Confidence on Treatment of Customers (% of Respondents). 48
LIST OF TABLES
Table 1: Emerging Issues and Recommendations 53

6 | P a g e
ACRONYMS
AIMS Alternative Investment Markets Segment
CMA Capital Markets Authority
FISMSFixed Income Securities Market Segment
IPO Initial Public Offers
MIMS Main Market Investment Segment
SCD Central Securities Depository
USE Uganda Securities Exchange
7 | P a g e
EXECUTIVE SUMMARY
This is a survey report focusing on the understanding of capital markets by the different players.
The survey intended to collect adequate information from CMA Primary and secondary
stakeholders. Specifically, the survey intended to:
1) Establish the profile of investors in Uganda’s capital markets;
2) Establish the levels of awareness and understanding of capital markets among investors;
3) Establish the levels of awareness about the capital Markets Authority among investors;
4) Establish the levels of awareness and understanding about capital markets participants
among investors;
5) Establish the levels of awareness and understanding about investors rights among
investors
6) Establish the factors affecting investments in Uganda’s capital markets.
The scope of the study covered individual and corporate investors; the Board of Directors,
Management and staff of the Capital Markets Authority (CMA) and Uganda Securities Exchange
(USE); the Market intermediaries and the Ministry of Finance. In total the survey covered 410
respondents. A summary of findings from the survey is as follows.
9. DEMOGRAPHIC CHARACTERISTICS
Under the demographic characteristics of the respondents, the following results were obtained:
8 | P a g e
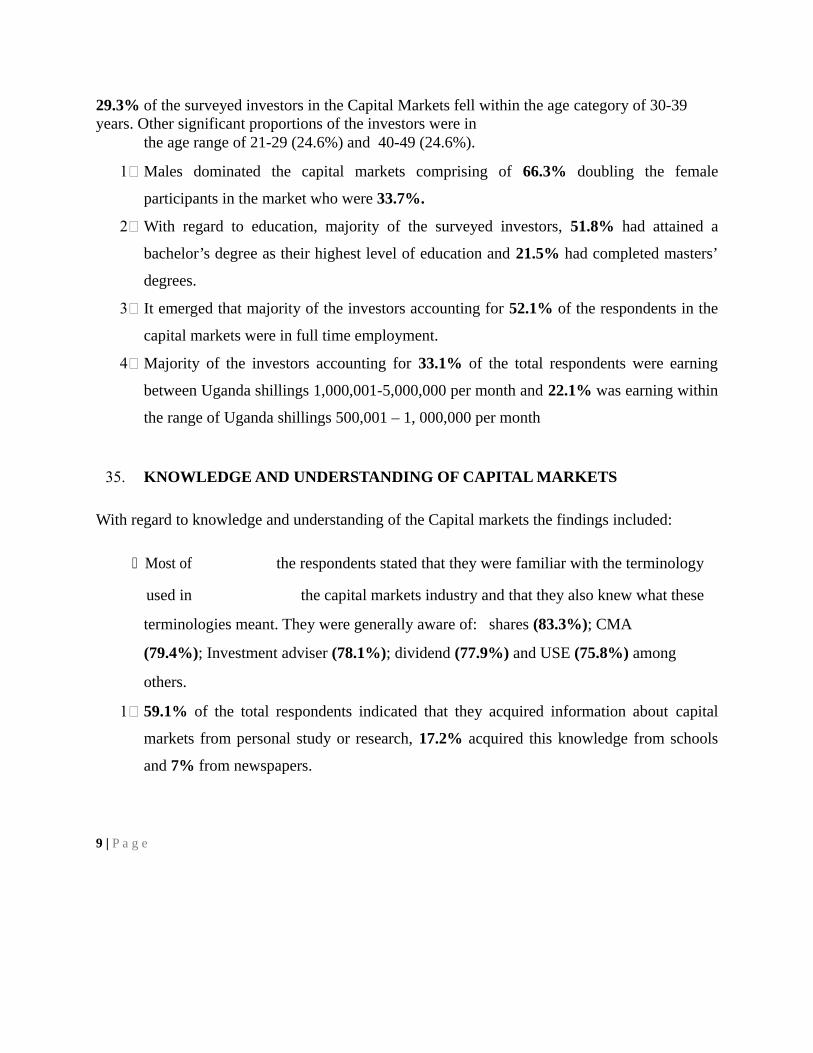
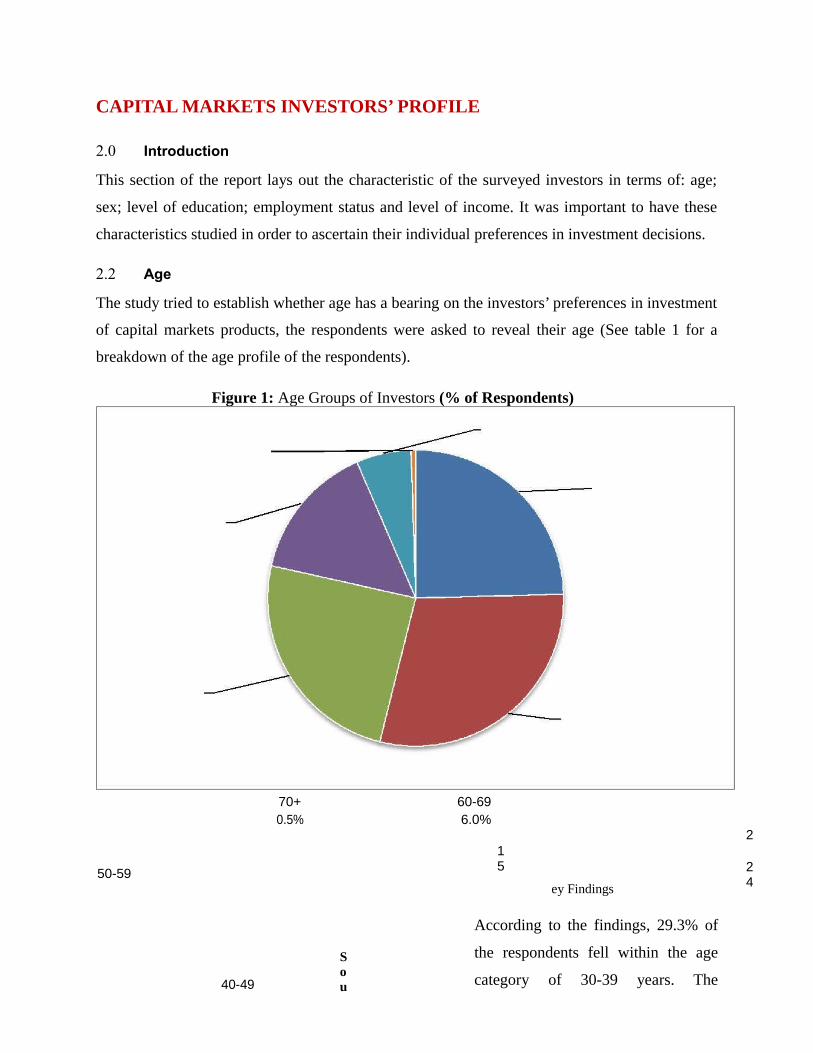
29.3% of the surveyed investors in the Capital Markets fell within the age category of 30-39 years. Other significant proportions of the investors were in
the age range of 21-29 (24.6%) and 40-49 (24.6%).
1Males dominated the capital markets comprising of 66.3% doubling the female
participants in the market who were 33.7%.
2With regard to education, majority of the surveyed investors, 51.8% had attained a
bachelor’s degree as their highest level of education and 21.5% had completed masters’
degrees.
3 It emerged that majority of the investors accounting for 52.1% of the respondents in the
capital markets were in full time employment.
4Majority of the investors accounting for 33.1% of the total respondents were earning
between Uganda shillings 1,000,001-5,000,000 per month and 22.1% was earning within
the range of Uganda shillings 500,001 – 1, 000,000 per month
35. KNOWLEDGE AND UNDERSTANDING OF CAPITAL MARKETS
With regard to knowledge and understanding of the Capital markets the findings included:
Most of the respondents stated that they were familiar with the terminology
used in the capital markets industry and that they also knew what these
terminologies meant. They were generally aware of: shares (83.3%); CMA
(79.4%); Investment adviser (78.1%); dividend (77.9%) and USE (75.8%) among
others.
1 59.1% of the total respondents indicated that they acquired information about capital
markets from personal study or research, 17.2% acquired this knowledge from schools
and 7% from newspapers.
9 | P a g e
CAPITAL MARKET INVESTMENT
Concerning Capital market investment, the survey established that:
1 27.9% of the total respondents were motivated by anticipated dividends or profits to
invest in capital markets. A significant proportion of other investors were encouraged by:
the fact that investing in capital markets is an easy way of saving money (15.9%); friends
(12.7%); availability of money (6.4%); and personal interest (6.1%) among other
reasons
2 46.4% of the total respondents had invested Uganda shillings One million and below.
3 The age categories that had invested the highest amount of money were 30-39 and 40-49
where 35% and 42.5% respectively invested Ush.10,000,000 and above.
4 The investors who had invested least in the capital markets were those who had attained
primary as their highest level of education with 4.5% investing
Ushs1,000,001- Ushs 5,000,000.
Those that invested in capital markets everyday were 3.7%; 7.2 % investing at
least once a week; 7.4 % invest at least once a fortnight.
1 28.6% of the total respondents perceived that there was moderate risk in investing in
capital markets where as 23.1% perceive that there is low risk.
IV. INVESTOR PROTECTION
Under investor protection, the following were found out.
1 50.4% of the respondents reported to be fairly confident qualification of firms in capital
market
2 The level of confidence in the products on the market in regard to their suitability to
needs of the clients is still low.
10 | P a g e
15.1% of respondents were very confident in the complaints handling mechanism compared to 51.2% who were fairly confident. 1 29.7% reported to be very confident CMA regulating the industry compared to 48.3%
who were fairly confident.
22. SEEKING FOR INVESTMENT ADVICE
With regard to seeking investment, the results were as follows:
1 46.4% of the respondents had sought professional advice on investment in capital
markets compared to 48.5% who had not
2Most of the investors accounting for 48.5% of the total respondents got the advice from
brokers or dealers representatives; and 17.2% got professional investment advice from an
investment adviser’s representative.
3 30% of the respondents had a lot of confidence in the investment advice; and 37.7%
were fairly confident that the advice was appropriate to their circumstances.
VI. FACTORS AFFECTING INVESTMENTS IN UGANDA’S CAPITAL MARKETS.
The factors affecting investments in capital markets in Uganda were reported to be:
1) low financial literacy;
2) low compliance levels of potential investors;
3) limited number of listed companies;
4) limited geographical coverage;
5) low level of completion in the market;
6) High inflation and illiquidity among others.
11 | P a g e
VII. RECOMMENDATIONS
From the issues that emerged, a number of recommendations were made including:
1) Designing products that are friendly with their earnings of the local potential investors
2) Increasing operations of capital markets in order to intensify their visibility.
3) Providing tax incentives for individuals willing to invest in shares.
4) Develop incentive mechanisms for parties interested in participating in capital markets
5) Identification of challenges that investors face which is a precursor to their doubts would
be a step in the right direction .This suggests that clients’ needs be identified so that
products can be tailored accordingly
6) Further popularizing information about complaints handling systems would produce
desirable results
7) Disseminating laws, rules and regulation governing capital markets and procedures for
their enforcement and information about the key players in the market, listed firms and
licensed ones to investors would also be instrumental
8) Initiating forums such as trade fairs and meetings of business associations to inform the
stakeholders and business associations about the mandate and functions of USE and
CMA
9) Providing information on the need for investment advisory services
10) Providing information on licensed firms that provide professional investment advice
11) Disseminating information on listing requirements and possibilities to obtain input from
e.g. business support institution.
12 | P a g e

13 | P a g e
INTRODUCTION
The Capital Markets Authority (CMA) was established by an Act of Parliament in 1996 to
regulate and promote the development of capital markets in Uganda. Fifteen years later the
capital markets in Uganda boosts of 14 companies, 5 corporate bonds and over 15 government
bonds listed on the Uganda Securities Exchange as well as over 40,000 investors. Out of the
40,000 investors, 8,920 have so far demobilized their certificates and opened Central Securities
Depository (SCD) accounts. One of the cornerstones of capital Markets regulation is investor
protection. Therefore, if CMA is to adequately protect the investors in Uganda’s Capital Markets,
it needs to fully understand the nature and needs of these investors. It was against this
background that CMA sought to procure the services of a consultancy firm to undertake a survey
of capital markets investors in Uganda.
1.1 Purpose of the Survey
The overall purpose of this survey was to collect adequate information from CMA stakeholders.
This information would become a basis for CMA interventions and focus on stakeholders’ needs
and concerns. The study would also provide practical recommendations for future planning
1.2 Objectives of the Survey
The survey intended to achieve the following objectives.
1) Establish the profile of investors in Uganda’s capital markets
2) Establish the levels of awareness and understanding of capital markets among investors
3) Establish the levels of awareness about the capital Markets Authority among investors
4) Establish the levels of awareness and understanding about capital markets participants
among investors
14 | P a g e
5) Establish the levels of awareness and understanding about investors rights among
investors
6) Establish the factors affecting investments in Uganda’s capital markets
1.3 Approach and Methodology
The assignment was highly participatory involving a broad range of stakeholders including but
not limited to Board of Directors (BoD), Management and staff of CMA and all relevant
stakeholders. This participatory approach was instrumental in maximizing ownership of the
assignment deliverables since it made it possible for participants to focus on facts while allowing
rapid appraisals. Both quantitative and qualitative methods of data collection were used.
1.3.1 Population, Sample Size and Sampling Strategies for the Study
Target Population
The study targeted:
1) The Key stakeholders’ i.e. individual and corporate investors.
2) Board of Directors, Management and staff of CMA and USE respectively.
3) The Market intermediaries and market participants
4) The relevant staff of the Ministry of Finance, Planning and Economic Development.
Sample Size determination and Selection procedures
Sample size determination
A sample frame of all individual investors has opened Central Securities Depository (SCD)
accounts were used to randomly select study participants. Given that 10,000 investors had
opened accounts with SCD, 10,000 were used as the study population. Using a confidence of
level of 95% with marginal error of 5% a sample size of sample
15 | P a g e

size of 370 respondents was generated. By applying a confidence level of 95% with a marginal
error of 5% for a 10,000 population on a Random
Sampling Table in Appendix 2 generated a sample size of 370 respondents. This sample was
increased by 10%, to cater for non-response. This increased the sample size to 407(adjusted to
410). Therefore, the study had a sample size of 410 individual investors.
Procedure for Selecting Individual investors to participate on the Survey
A systematic sampling technique1 was used to determine the investors to participate in the
survey. The following formula was used:
k = N n
Where
k, is Sampling interval,
N is the population size and n is the Sample size.
Given that N= 10,000 and n= 410;
Therefore k = 10,000/410 = 24.
So, every 24th individual investor on the sampling frame was selected after a random starting
point between 1 and 24. This process was repeated until the Sample size of 410 was obtained.
Corporate investors
All the corporate investors participated in the study.
1 Systematic Sampling is random sampling with a system in which units are selected from a given population at a
regular interval. The individuals to participate on the study will therefore be determined through a Systematic
Sampling Technique. Systematic sampling is a statistical method that is usually used when a population size is
known and a sample size has been determined.
16 | P a g e
Selection of Key Informants
The key informants mainly included officials from Board of Directors, Management and staff of
CMA and USE respectively. They also included Market intermediaries and market participants,
and relevant staff of the parent ministry.
1.3.2 The Methods of Data Collection
The methods to be used will include among others the following:
i) Pilot Survey
The pretest of the tools was conducted to determine the effectiveness of survey tools.
Pretesting also helped to determine the strengths and weaknesses of survey concerning
question format, wording and order and other deficiencies that needed to corrected before
the actual survey commenced.
2) Structured and Semi-structured Face to Face Questionnaire Interview.
The Questionnaire was administered to the investors selected from the sample frame. The
questionnaire covered the thematic areas spelt out in the terms of reference and
objectives, targets and expected outputs.
3) Key Informant Interviews
Key informant interviews/In-depth interviews were conducted with the BoD CMA
and USE, relevant officials in MEMD, development Partners and other
stakeholders using a key informant interview guide.
4) Literature Review/Secondary data or Desk Review:
A desk review of relevant documents of in regard to CMA and USE and other umbrella
organisations including concept papers, planning documents, MOUs, agreements,
financial and progress reports, budgets, work plans, logical
17 | P a g e
framework, M & E systems, baseline data, policy documents and sector guidelines was
conducted. A checklist was used to summarise the required information according to the
different indicators that were being studied. Data from documents was analyzed using
content analysis.
1.3.3 Data Processing, Analysis and Management
1) Data Editing, Coding and Cleaning
Data collected using the questionnaire and other tools mentioned above, was edited,
coded, and cleaned by well-trained data managers. Both qualitative and quantitative data
obtained from the field was entered via a data entry interface customized to the layout of
the field data forms. Further, data entry, verification; screen editing and system
development were done sequentially to enable the preparation of Draft Report of the
preliminary findings.
2) Data Analysis Package
The quantitative data were analyzed using EpiData, and exported to SPSS. Other MS
office Processing Programs (MS Word, MS Excel) were used to synthesis the findings.
Qualitative data on the other hand was categorised, summarised, and analysed along the
themes of the major variables. A sequential and content analysis was undertaken to
provide a much deeper insight into data collected.
18 | P a g e
CAPITAL MARKETS INVESTORS’ PROFILE
2.0 Introduction
This section of the report lays out the characteristic of the surveyed investors in terms of: age;
sex; level of education; employment status and level of income. It was important to have these
characteristics studied in order to ascertain their individual preferences in investment decisions.
2.2 Age
The study tried to establish whether age has a bearing on the investors’ preferences in investment
of capital markets products, the respondents were asked to reveal their age (See table 1 for a
breakdown of the age profile of the respondents).
Figure 1: Age Groups of Investors (% of Respondents)
70+ 60-690.5% 6.0%
50-59
15
2124
40-49
Sou
ey Findings
According to the findings, 29.3% of
the respondents fell within the age
category of 30-39 years. The

respondents who are 50 years of age a 19 | P a g e
Gender of the Capital Markets Investors.
The gender of the respondents was also recorded during the survey. Figure 1 shows a
breakdown of the respondents by gender.
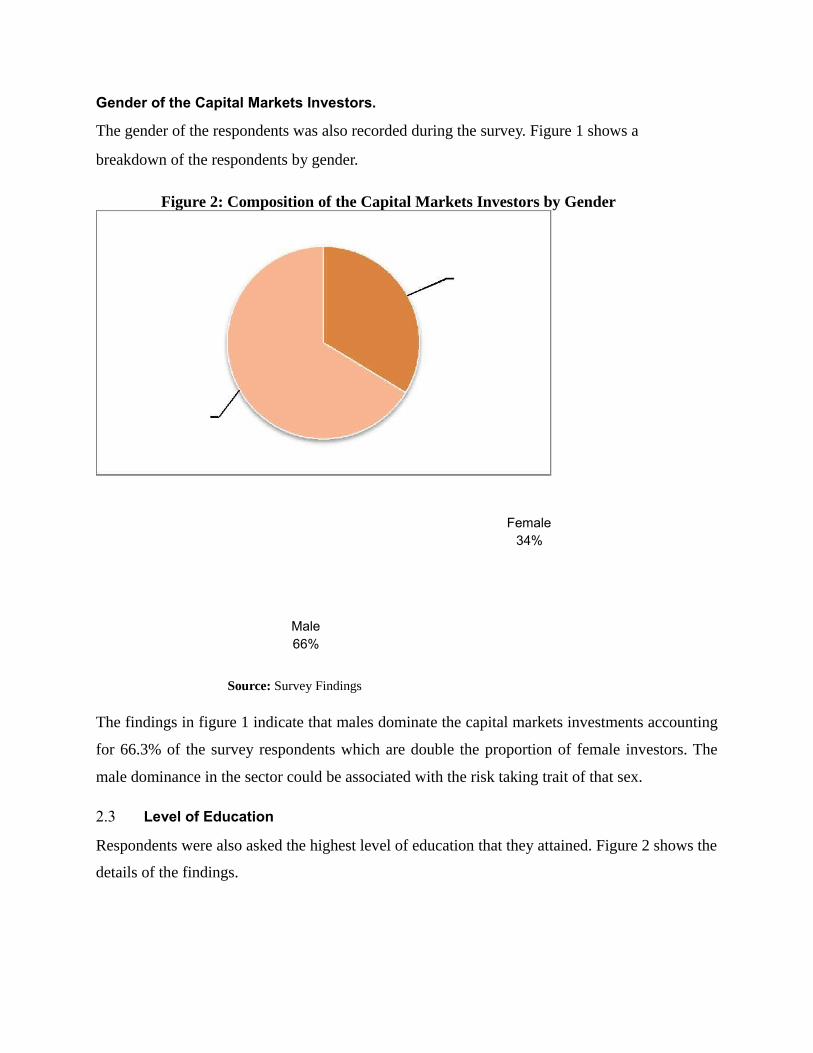
Figure 2: Composition of the Capital Markets Investors by Gender
Female34%
Male66%
Source: Survey Findings
The findings in figure 1 indicate that males dominate the capital markets investments accounting
for 66.3% of the survey respondents which are double the proportion of female investors. The
male dominance in the sector could be associated with the risk taking trait of that sex.
2.3 Level of Education
Respondents were also asked the highest level of education that they attained. Figure 2 shows the
details of the findings.

20 | P a g e
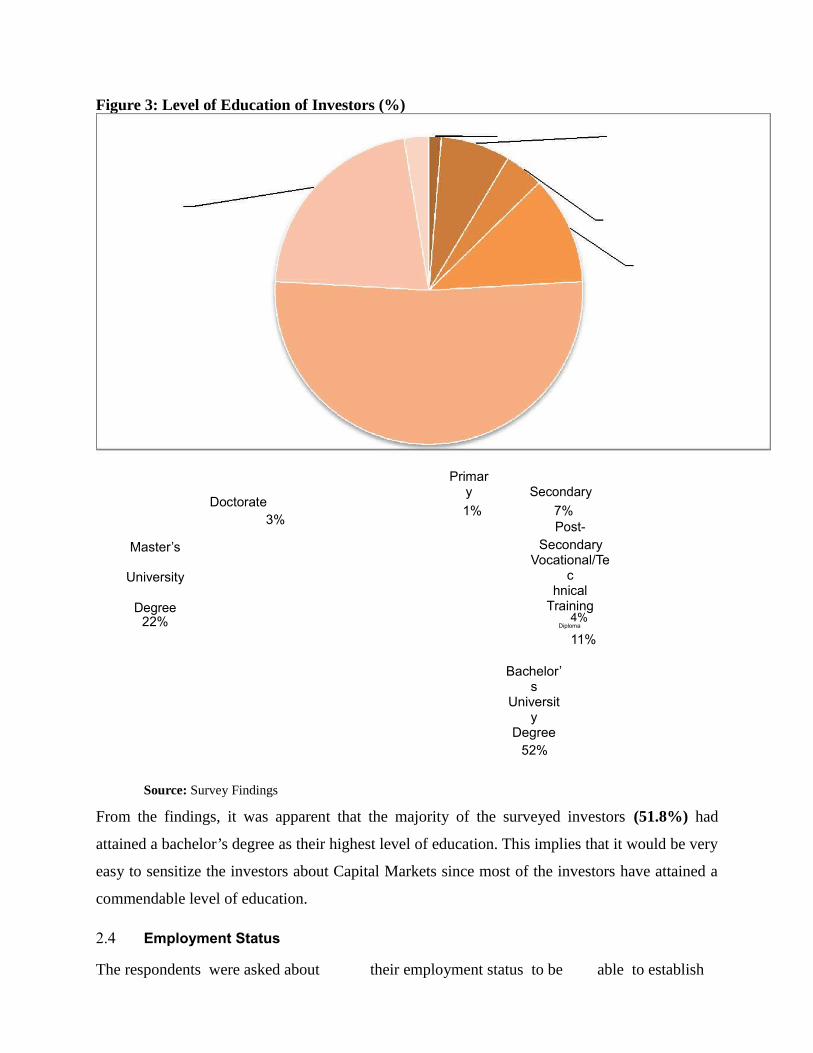
Figure 3: Level of Education of Investors (%)
Doctorate
Primary Secondary
1% 7%3% Post-
Master’s SecondaryVocational/Te
cUniversityhnical
TrainingDegree4%22% Diploma
11%
Bachelor’s
University
Degree52%
Source: Survey Findings
From the findings, it was apparent that the majority of the surveyed investors (51.8%) had
attained a bachelor’s degree as their highest level of education. This implies that it would be very
easy to sensitize the investors about Capital Markets since most of the investors have attained a
commendable level of education.
2.4 Employment Status
The respondents were asked about their employment status to be able to establish

the nature of their employment and whether this could have an effect on theirinvestment choices in the capital markets. The findings are as shown in the figure 3.
Figure 4: Employment Status of investors
21 | P a g e
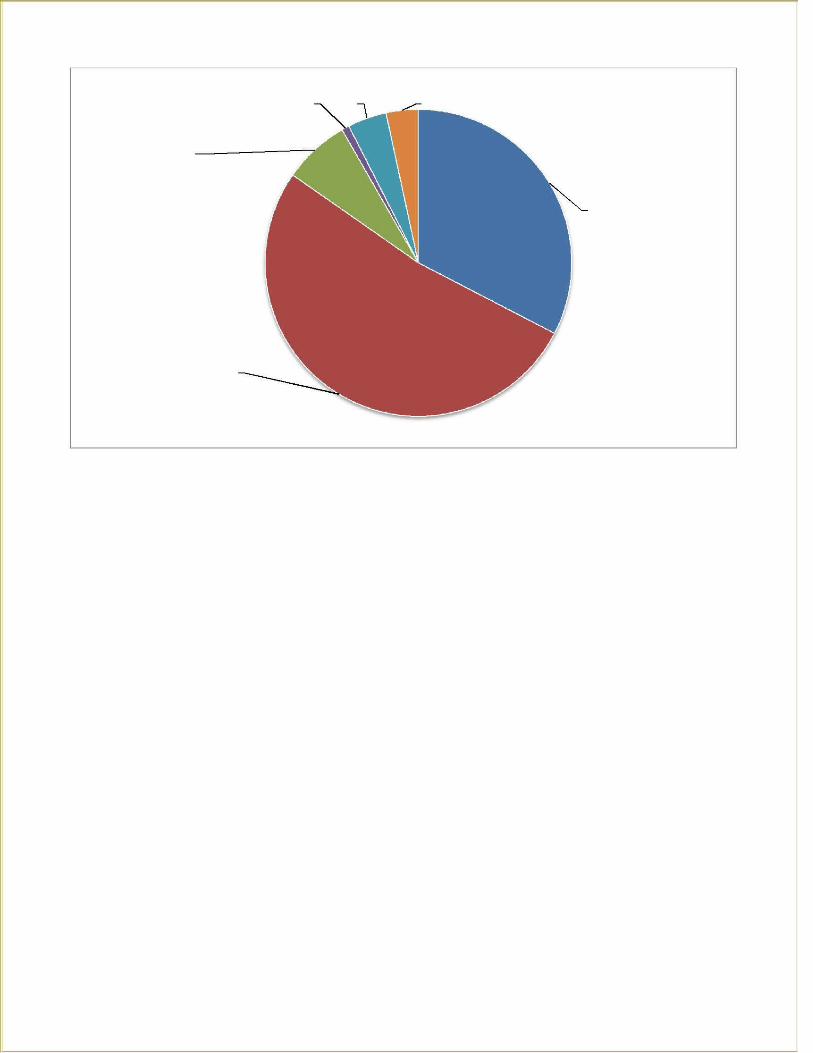
Unpaid for Unemployed Other
household work 4% 3%1%
Part- time employee 7%
Self employed 33%
Full-time employee 52%
Source: Survey Findings
From the findings, it emerged that majority of the investors (52.1%) in the capital markets were
in full time employment. A sizeable 32.6% were self-employed and 7% were in part-time
employment. It ought to be noted that the nature of employment will determine the level of
earnings and how much money one can be able to invest in Capital Market products. It also
affects the timing of earnings for investment.
2.5 Level of Income
An investor’s level of income was also established to be able to understand the effect it would
have on the level and choices of investment in capital markets. Analysis of findings is presented
in figure 4.
22 | P a g e
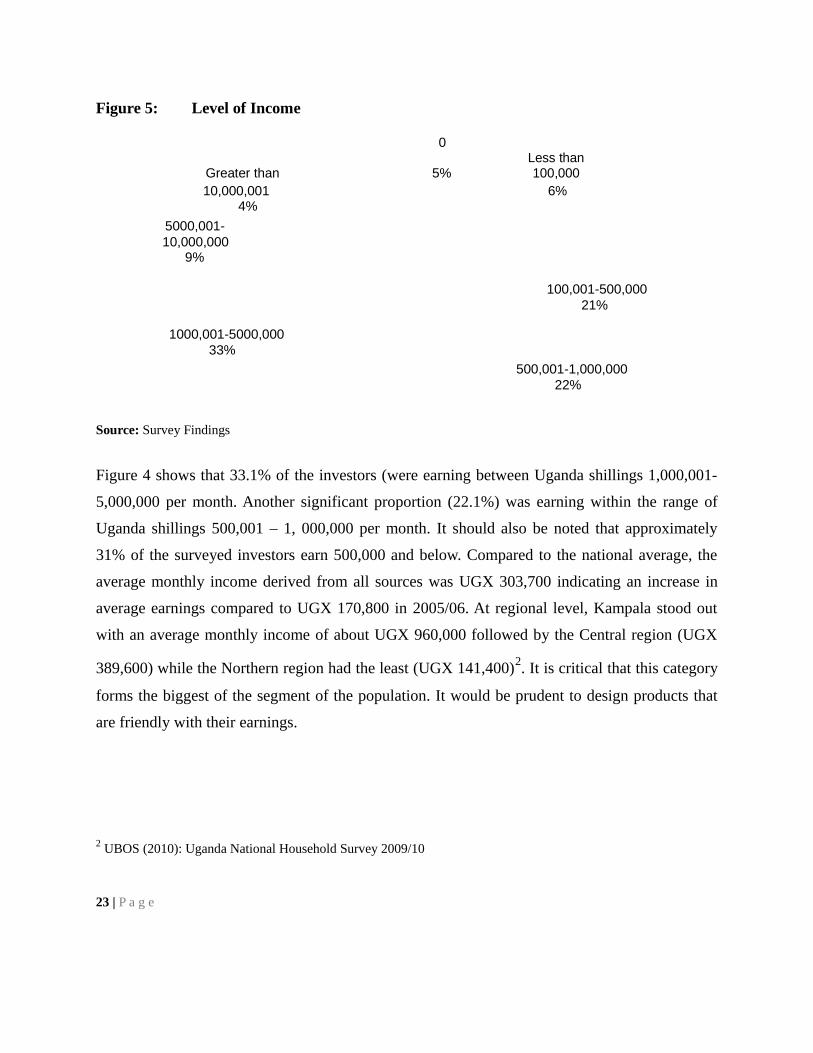
Figure 5: Level of Income
0
Greater than 5%Less than 100,000
10,000,001 6%4%
5000,001-10,000,000
9%
100,001-500,00021%
1000,001-5000,00033%
500,001-1,000,00022%
Source: Survey Findings
Figure 4 shows that 33.1% of the investors (were earning between Uganda shillings 1,000,001-
5,000,000 per month. Another significant proportion (22.1%) was earning within the range of
Uganda shillings 500,001 – 1, 000,000 per month. It should also be noted that approximately
31% of the surveyed investors earn 500,000 and below. Compared to the national average, the
average monthly income derived from all sources was UGX 303,700 indicating an increase in
average earnings compared to UGX 170,800 in 2005/06. At regional level, Kampala stood out
with an average monthly income of about UGX 960,000 followed by the Central region (UGX
389,600) while the Northern region had the least (UGX 141,400)2. It is critical that this category
forms the biggest of the segment of the population. It would be prudent to design products that
are friendly with their earnings.
2 UBOS (2010): Uganda National Household Survey 2009/10
23 | P a g e
3.0 KNOWLEDGE AND UNDERSTANDING OF CAPITAL MARKETS
INDUSTRY
3.1 Introduction
Capital markets are inevitable in the emerging economies like Uganda. The level of knowledge
of the capital markets industry by investors is central to their level of participation. For instance,
any investor needs to understand how the market operates, the products and markets and the
mathematics that explain it. As new products emerge on the national and regional market,
investors must understand all of this from an informed perspective. Therefore, this section
explores the level of knowledge that investors have with regard to capital markets.
3.2 Knowledge of capital Markets Terminology
All the respondents were asked: whether they had ever heard of a number of Capital
Markets’ terminologies or not and whether they know what the terminologies meant.
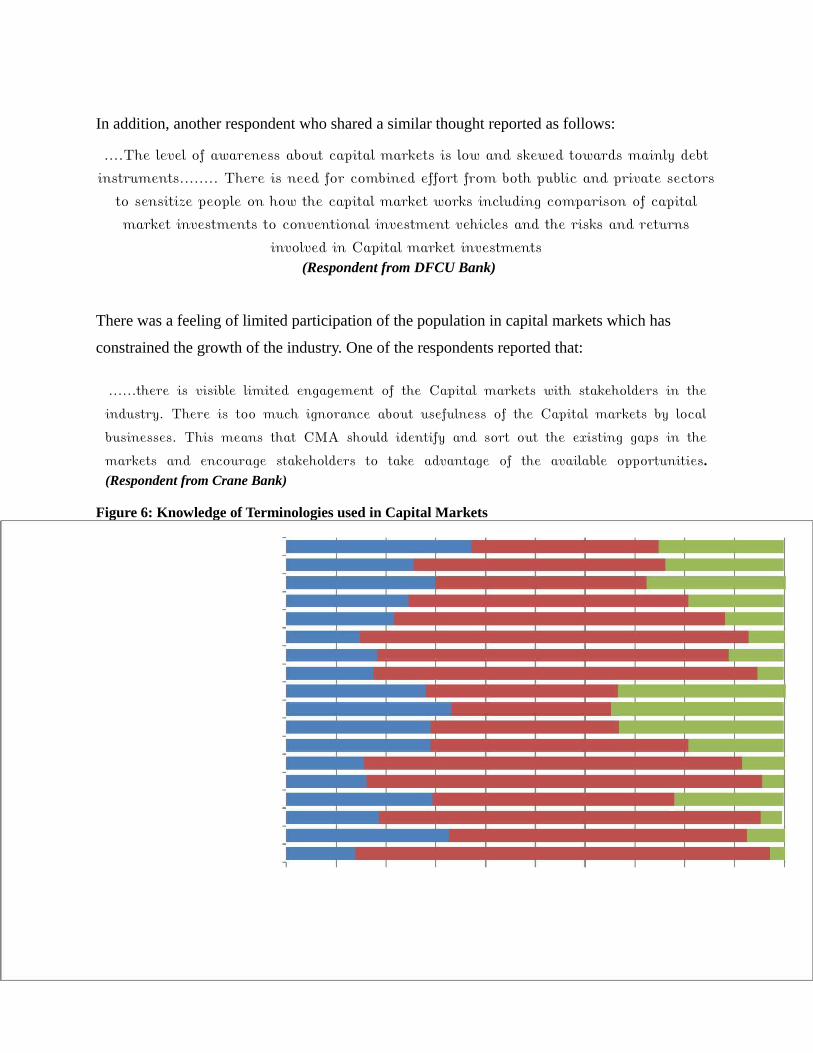
The findings are presented in figure 6. Most of the respondents stated that they were familiar
with the terminology used and that they knew what the terminologies meant. They were
generally aware of shares as reported by 83.3%.
It should also be noted that 73% of the population that is 10 years and above is literate. However,
this literacy is limited to reading with understanding and writing in any local language3 and not
related to financial literacy. Such literacy levels (reading and writing) may not be helpful in
understanding of the complex capital markets operations by the population. This seems to be in
line with the position of the one of the key informants thus:
…….Literacy levels in the country, and more especially financial literacy, are still low……
There is a lot of need for financial literacy about the CMA and its products as component
of saving (Head of
Legal Department, CMA)
3 UBOS (2010), Uganda National House hold Survey 2009/10.
24 | P a g e
In addition, another respondent who shared a similar thought reported as follows:
….The level of awareness about capital markets is low and skewed towards mainly debt
instruments…….. There is need for combined effort from both public and private sectors
to sensitize people on how the capital market works including comparison of capital
market investments to conventional investment vehicles and the risks and returns
involved in Capital market investments(Respondent from DFCU Bank)
There was a feeling of limited participation of the population in capital markets which has
constrained the growth of the industry. One of the respondents reported that:
……there is visible limited engagement of the Capital markets with stakeholders in the
industry. There is too much ignorance about usefulness of the Capital markets by local
businesses. This means that CMA should identify and sort out the existing gaps in the
markets and encourage stakeholders to take advantage of the available opportunities.
(Respondent from Crane Bank)
Figure 6: Knowledge of Terminologies used in Capital Markets

All share index 37 38 25Earnings Ratio 26 51 24
Yield Curve 30 42 28Yield to Maturity 25 56 19
Dividend Yield 22 6612
Dividends 1578 7
Fund Manager 18 7111
Investment Advisor 17 77 5Fixed Income Securities Market Segment
(FISMS) 2839
34
Alternative Investment Markets Segment (AIMS) 33 32 35
Main Market Investment Segment (MIMS) 29 3833
Securities Central Depository (SCD) 29 52 19Uganda Securities Exchange (USE) 16 76 9
Capital Markets Authority (CMA) 16 79 4
Trusts 2948 22
Bills 19 77 4Bonds 33 60 8
Shares 14 83 3
0 1020 30 40 50
60 70 80 90
100
Ihave ever heard of the word or phrase but do not know what it means
Ihave ever heard of the word or phrase and know what it means
Ihave never heard of the word or phrase and do not know what it means
Source: Survey Findings
25 | P a g e
There was an observation that potential Capital Markets Investors need to have tangible
experiences of a capital market to become interested. This implies that a fully functional capital
markets’ industry should generate increase products and visibility. This would encourage
potential investors that are currently skeptical about listing on the Uganda Securities Exchange to
reconsider their position.
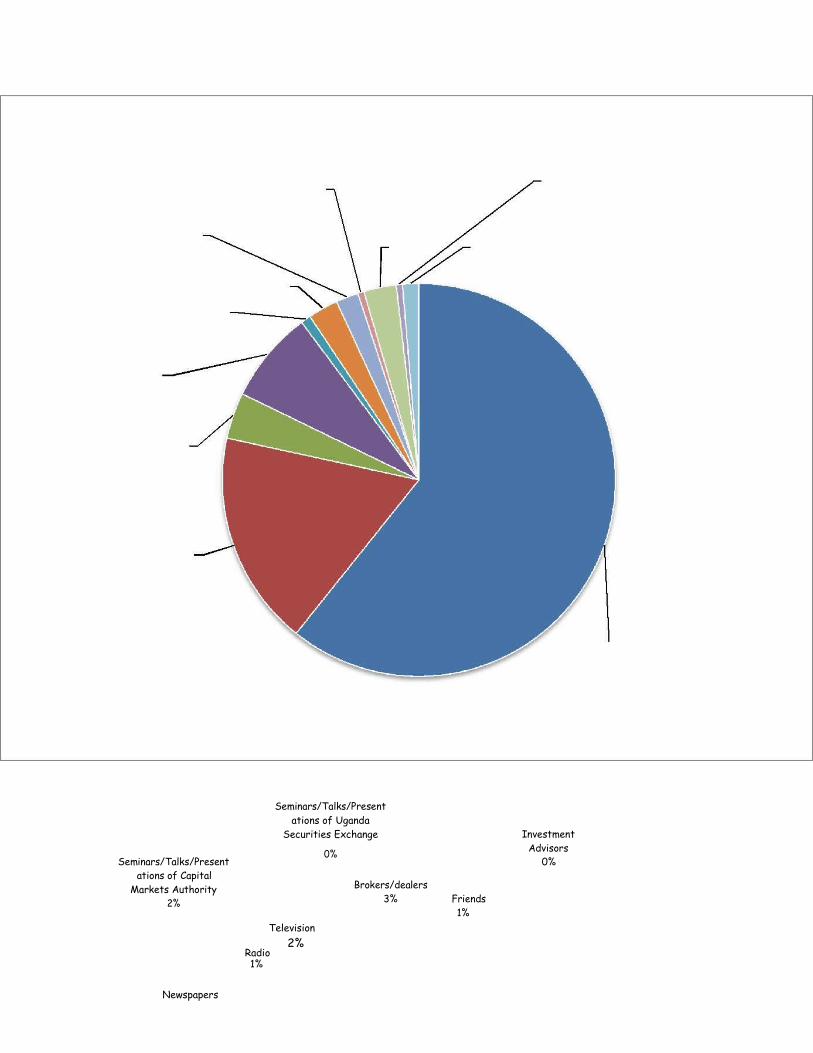
3.3 Source of knowledge of Capital Markets
The respondents were asked where they acquired knowledge about capital markets and the
related terminologies from. Figure 7 presents the various sources where the respondents got
information on capital markets from.
Figure 7: Sources of knowledge of Capital Markets
Seminars/Talks/Presentations of Uganda
Securities Exchange Investment Advisors
Seminars/Talks/Present0%
0%ations of Capital
Brokers/dealersMarkets AuthorityFriends3%2%1%
Television
Radio2%
1%
Newspapers

8%
Internet4%
Learnt about capital markets in
school/University/Vocat ional School
18%
PersonalStudy/Research
61%
Source: Survey Findings
26 | P a g e
It was established that majority of the surveyed investors (59.1%) acquired information about
capital markets and related terminologies from personal study or research. A significant 17.2%
acquired this knowledge from schools where as 7% got from newspapers. This could be
attributed to limited access to such sources of information.
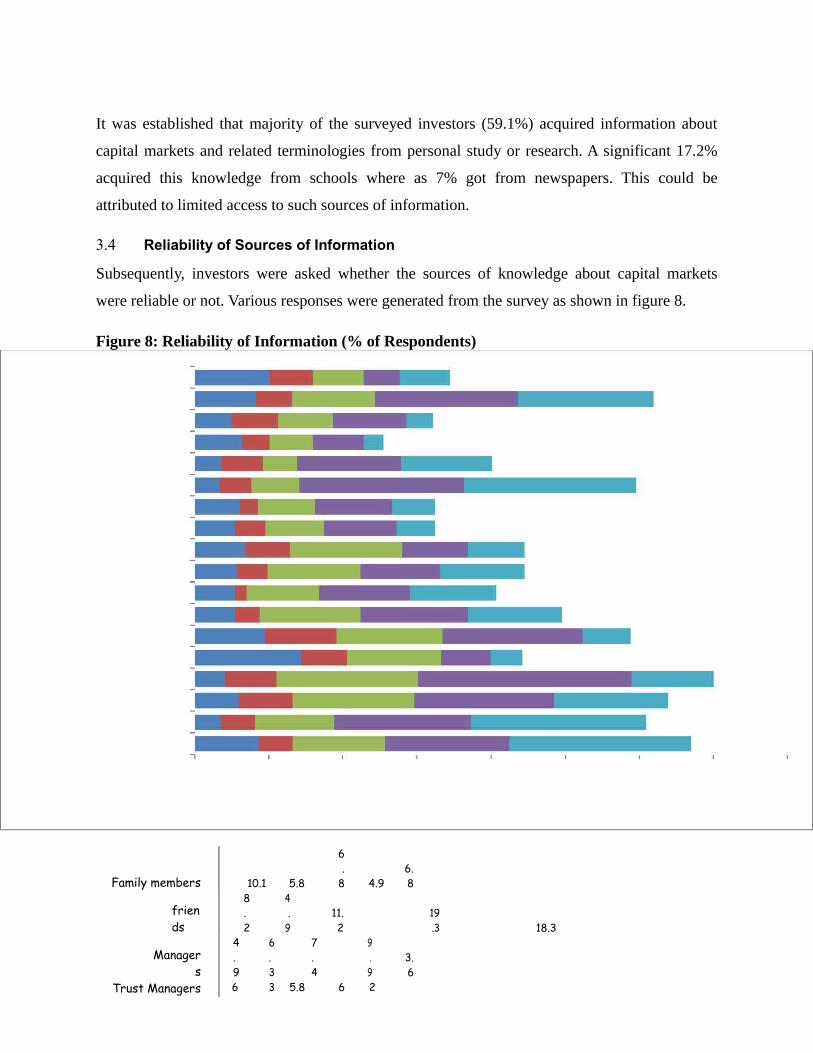
3.4 Reliability of Sources of Information
Subsequently, investors were asked whether the sources of knowledge about capital markets
were reliable or not. Various responses were generated from the survey as shown in figure 8.
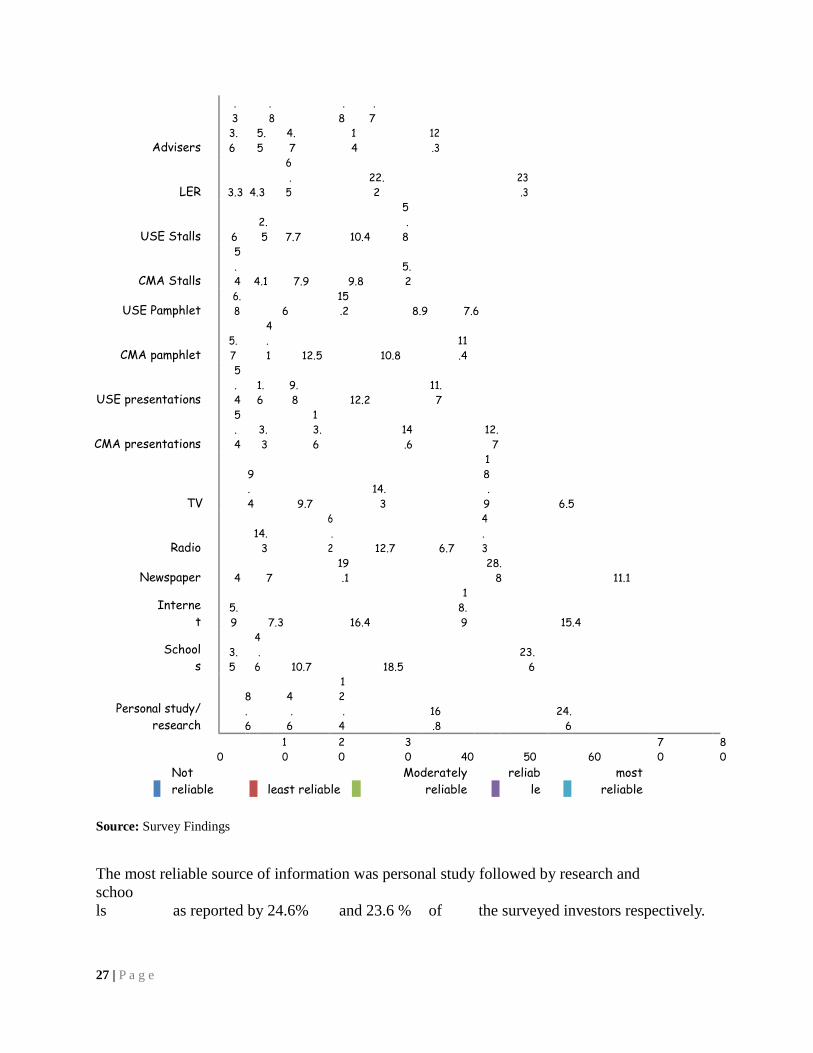
Figure 8: Reliability of Information (% of Respondents)
Family members 10.1 5.8
6.
8 4.96.8
friends
8.2
4.
911.2
19.3 18.3
Managers
4.9
6.3
7.4
9.9
3.6
Trust Managers 6 3 5.8 6 2
.3
.8
.8
.7
Advisers3.6
5.5
4.7
14
12.3
LER 3.3 4.3
6.
522.2
23.3
USE Stalls 62.5 7.7 10.4
5.
8
CMA Stalls
5.4 4.1 7.9 9.8
5.2
USE Pamphlet6.8 6
15.2 8.9 7.6
CMA pamphlet5.7
4.1 12.5 10.8
11.4
USE presentations
5.4
1.6
9.8 12.2
11.7
CMA presentations
5.4
3.3
13.6
14.6
12.7
TV
9.4 9.7
14.3
18.
9 6.5
Radio14.
3
6.
2 12.7 6.7
4.3
Newspaper 4 719.1
28.8 11.1
Internet
5.9 7.3 16.4
18.9 15.4
Schools
3.5
4.
6 10.7 18.523.
6
Personal study/ research
8.6
4.
6
12.
416.8
24.6
010
20
30 40 50 60
70
80
Not reliable least reliable
Moderately reliable
reliable
most reliable
Source: Survey Findings
The most reliable source of information was personal study followed by research andschools as reported by 24.6% and 23.6 % of the surveyed investors respectively.
27 | P a g e

Notable among the reliable sources of information were: newspapers (28.8%); Television
(18.9%); schools (18.5%); and personal study / research (16.8%).
28 | P a g e
CAPITAL MARKETS INVESTMENTS
4.0 Introduction
This chapter lays out motivations for the investors to buy or sell securities in the capital markets.
An investor is anyone who commits money to investment products with the expectation of
financial return. Generally, the primary concern of an investor is to minimize risk while
maximizing return4. There are some investors who depend on the advice of other people while
purchasing or selling a particular stock.
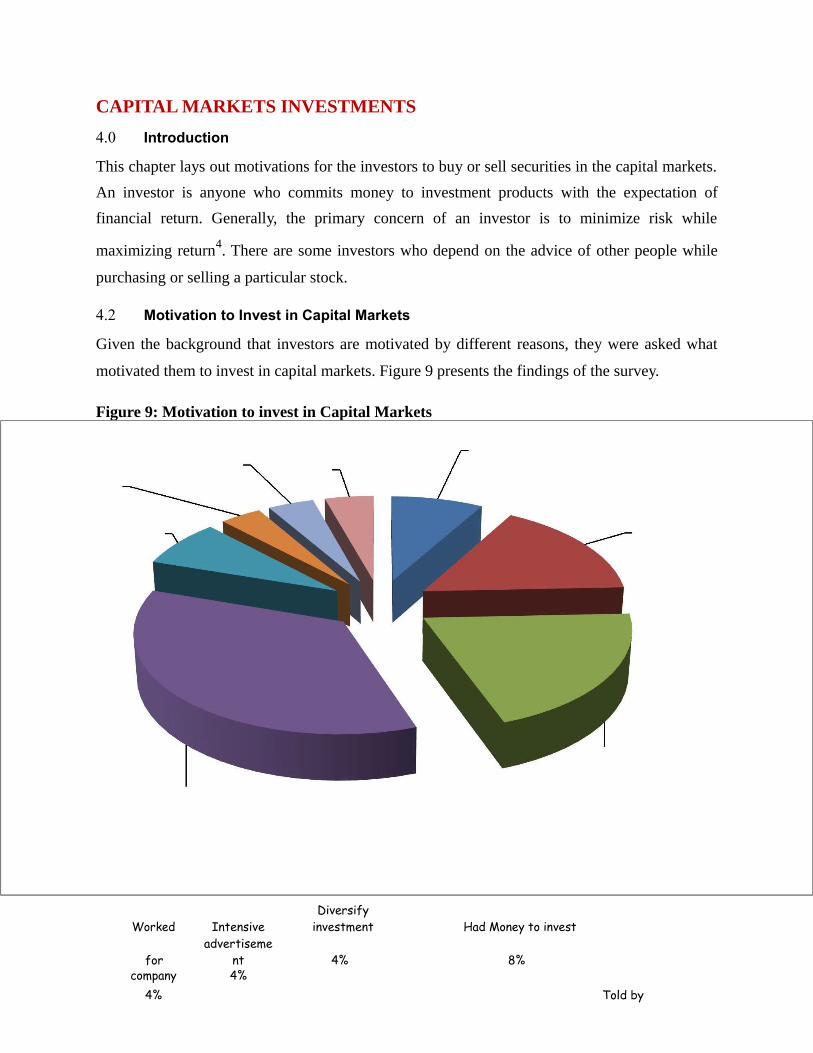
4.2 Motivation to Invest in Capital Markets
Given the background that investors are motivated by different reasons, they were asked what
motivated them to invest in capital markets. Figure 9 presents the findings of the survey.
Figure 9: Motivation to invest in Capital Markets
Worked IntensiveDiversify
investment Had Money to invest
foradvertiseme
nt 4% 8%company 4%
4% Told by

Personal Interest
friend/family
and research 16%8%
Easy way to save
Profits/dividendsmoney20%
36%
Source: Survey Findings
4 57 http://www.investorwords.com/2630/investor.html accessed on 23 April 2012
29 | P a g e
From figure 9, most of the investors (27.9%) were motivated by anticipated dividends or profits
to invest in capital markets among other reasons. This seems to suggest that many potential
investors may not be fully aware of the likely benefits available in investing in capital markets
and thus may be not be attracted to such investments. It was also noted by one of the key
informants that most times people invest in the capital markets when they anticipate a lot of
profit.
… The market is still young and slow. Investors are not putting money when there are no profits.
(Head of Legal Department, CMA)
Another respondent also concurred with such a position and reported that:
Investors want returns above pre-determined benchmarks, both the dividends and
capital gain……..Investors need assured access to money for investment and profit
actualization(Secretary and Director DFCU Bank)
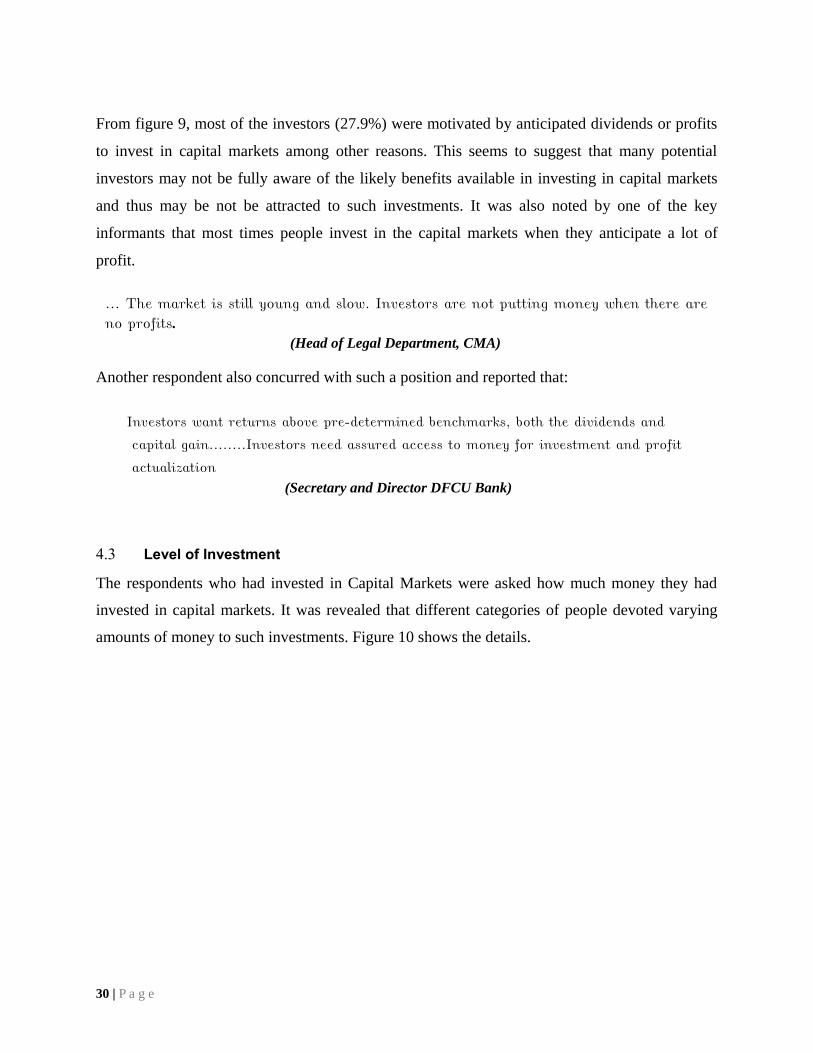
4.3 Level of Investment
The respondents who had invested in Capital Markets were asked how much money they had
invested in capital markets. It was revealed that different categories of people devoted varying
amounts of money to such investments. Figure 10 shows the details.
30 | P a g e
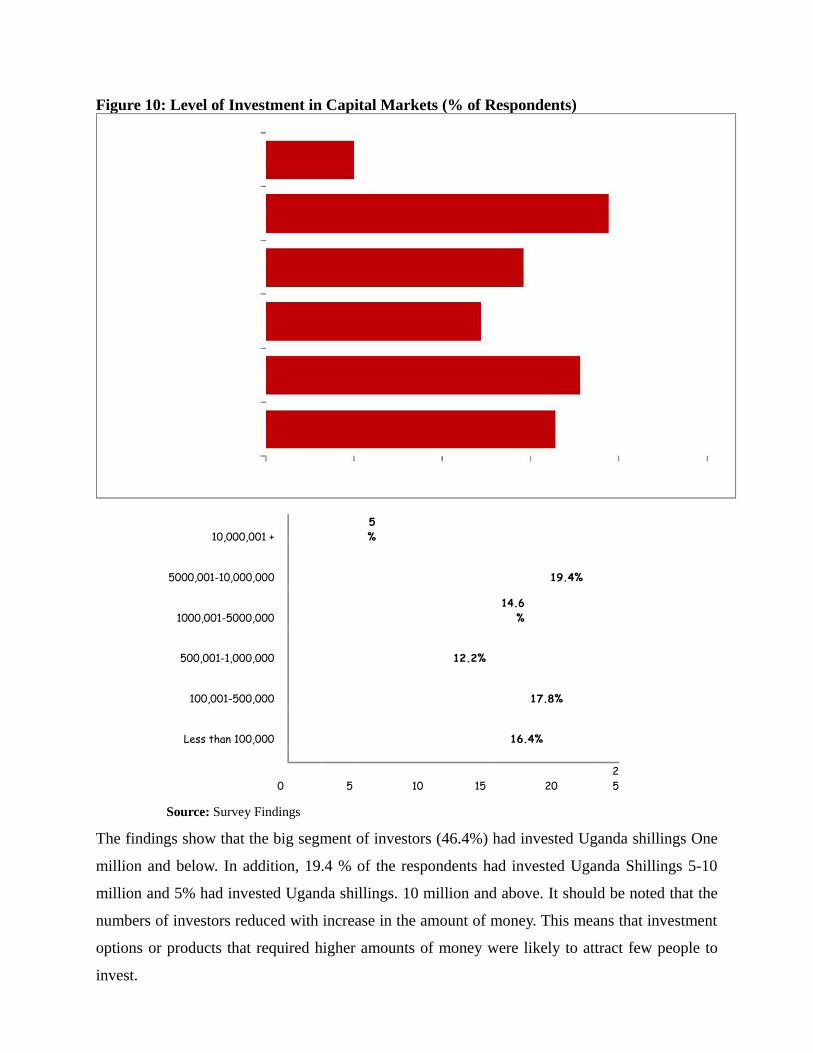
Figure 10: Level of Investment in Capital Markets (% of Respondents)
10,000,001 +5%
5000,001-10,000,000 19.4%
1000,001-5000,00014.6
%
500,001-1,000,000 12.2%
100,001-500,000 17.8%
Less than 100,000 16.4%
0 5 10 15 2025
Source: Survey Findings
The findings show that the big segment of investors (46.4%) had invested Uganda shillings One
million and below. In addition, 19.4 % of the respondents had invested Uganda Shillings 5-10
million and 5% had invested Uganda shillings. 10 million and above. It should be noted that the
numbers of investors reduced with increase in the amount of money. This means that investment
options or products that required higher amounts of money were likely to attract few people to
invest.

4.3.1 Age and Level of Investment
To ascertain the influence age may have on the preferences and choices of investors in capital
markets, analysis of data was carried as shown in figure 11.
31 | P a g e
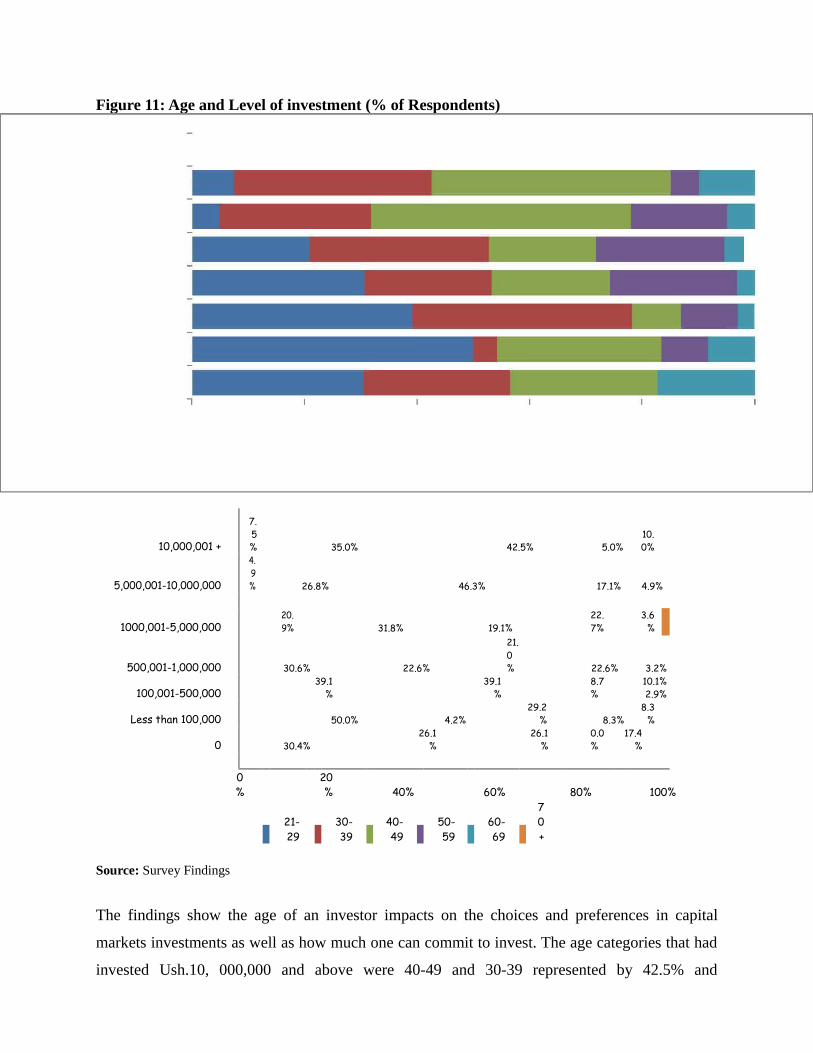
Figure 11: Age and Level of investment (% of Respondents)
10,000,001 +
7.5% 35.0% 42.5% 5.0%
10.0%
5,000,001-10,000,000
4.9% 26.8% 46.3% 17.1% 4.9%
1000,001-5,000,00020.9% 31.8% 19.1%
22.7%
3.6%
500,001-1,000,000 30.6% 22.6%
21.0% 22.6% 3.2%
100,001-500,00039.1
%39.1
%8.7%
10.1% 2.9%
Less than 100,000 50.0% 4.2%29.2
% 8.3%8.3
%
0 30.4%26.1
%26.1
%0.0%
17.4%
0%
20% 40% 60% 80% 100%
21- 29
30-39
40-49
50-59
60-69
70+
Source: Survey Findings
The findings show the age of an investor impacts on the choices and preferences in capital
markets investments as well as how much one can commit to invest. The age categories that had
invested Ush.10, 000,000 and above were 40-49 and 30-39 represented by 42.5% and

35%respectively. It was also established that the relationship between age and level of
investment was very significant (P=0.000).
4.3.2 Sex and Level of Investment
Given that investment in the capital markets is influenced by a number of factors, it was
important to establish whether sex of the investors contributed to their level of investment. figure
12 presents the findings.
32 | P a g e
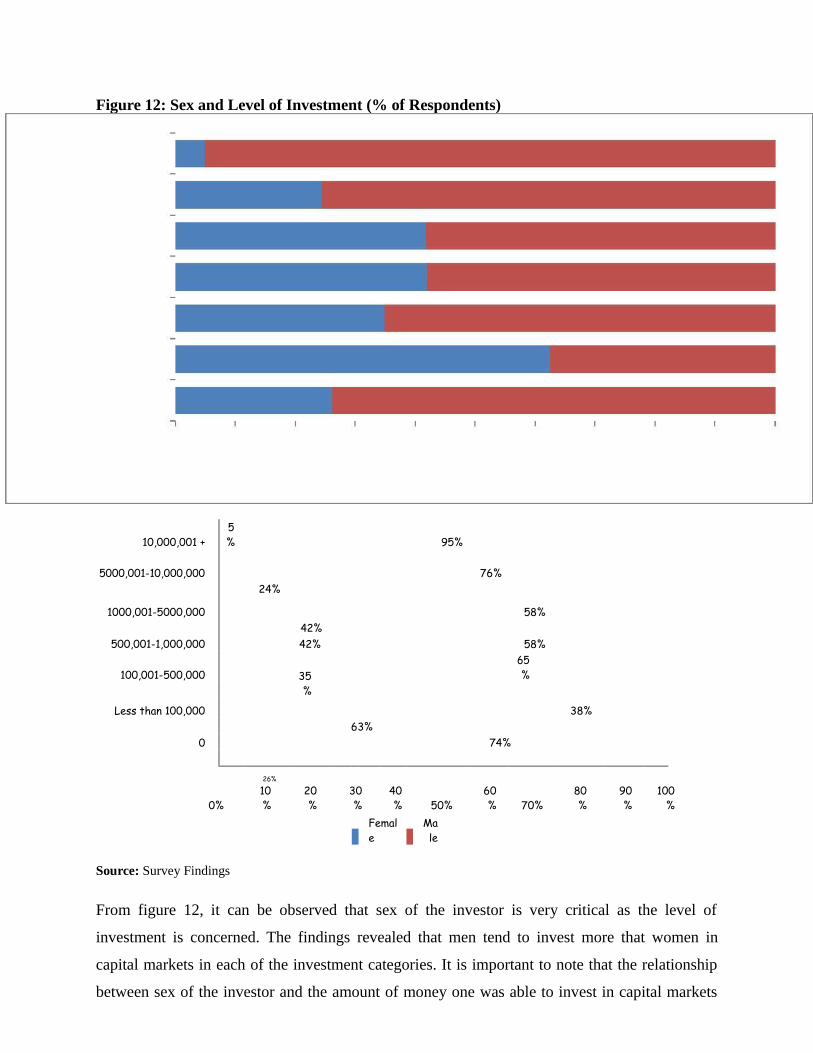
Figure 12: Sex and Level of Investment (% of Respondents)
10,000,001 +5% 95%
5000,001-10,000,00024%
76%
1000,001-5000,000 58%
500,001-1,000,00042%42% 58%
100,001-500,000 35%
65%
Less than 100,000 38%63%
0 74%
26%
0%10%
20%
30%
40% 50%
60% 70%
80%
90%
100%
Female
Male
Source: Survey Findings
From figure 12, it can be observed that sex of the investor is very critical as the level of
investment is concerned. The findings revealed that men tend to invest more that women in
capital markets in each of the investment categories. It is important to note that the relationship
between sex of the investor and the amount of money one was able to invest in capital markets

was very significant (P=0.000). This means that the investment choices in capital markets are
largely influenced by the sex of the investor. There are investment options that males can take on
which will not be appealing to females and vice versa.
4.3.3 Level of Education and Investment
In order to establish whether the level of education had a bearing on the level of investment in
capital markets that investors had so far made, the findings were cross tabulated as shown in
figure 13.
33 | P a g e
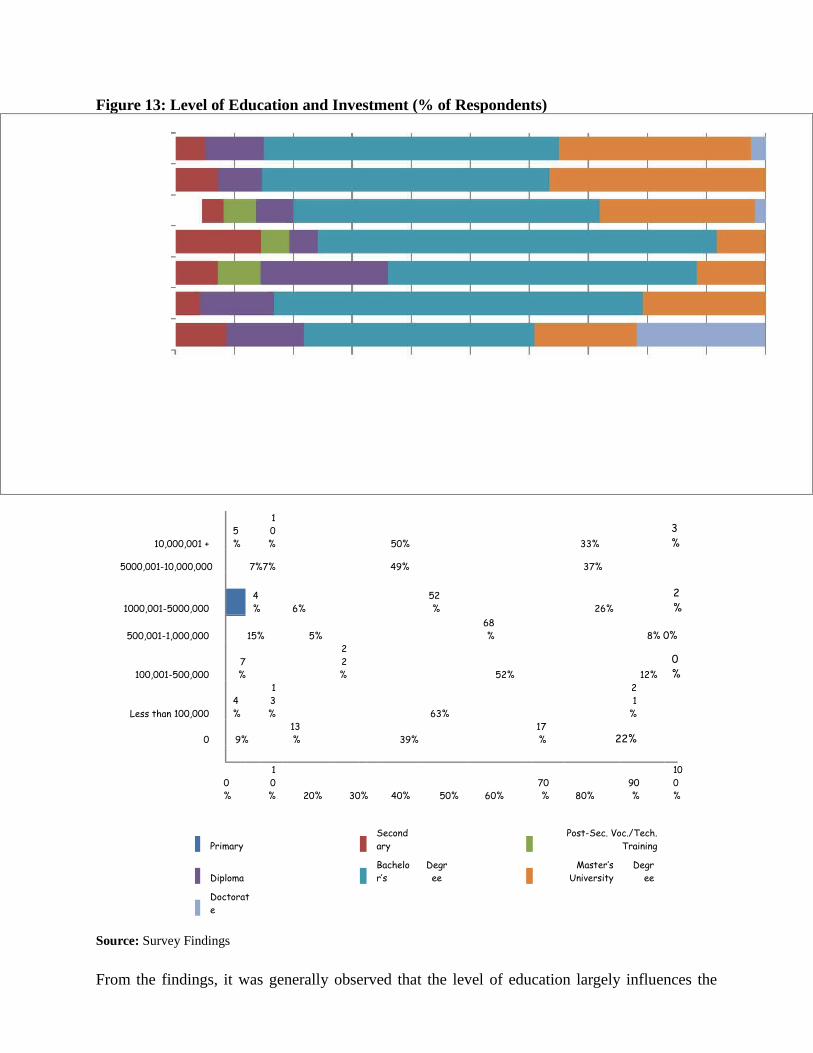
Figure 13: Level of Education and Investment (% of Respondents)
10,000,001 +5%
10% 50% 33%
3%
5000,001-10,000,000 7%7% 49% 37%
1000,001-5000,000 6%52% 26%
2%
4%
500,001-1,000,000 15% 5%68% 8% 0%
100,001-500,0007%
22% 52% 12%
0%
Less than 100,0004%
13% 63%
21
%
0 9%13% 39%
17% 22%
0%
10% 20% 30% 40% 50% 60%
70% 80%
90%
100%
PrimarySecondary
Post-Sec. Voc./Tech. Training
DiplomaBachelor’s
Degree
Master’s University
Degree
Doctorate
Source: Survey Findings
From the findings, it was generally observed that the level of education largely influences the

level of investment. For instance, the people who had invested least in the capital markets were
those who had attained primary as their highest level of education with 1.3% investing in capital
markets.
Compared with investors who had attained a bachelor’s degree as their highest level of
education, on average, 52.9% had invested in capital markets. From the findings, it can be
concluded that relationships between the highest level of education attained and level of
investment was very significant (P=0.000).This implies that the design of the products on the
market should be cognizant of the difference in education of potential investors and thus the
difference in appeal. The communication strategies for should also put this into consideration so
the communication is tailored to needs of the different categories of investors and potential
investors.
34 | P a g e
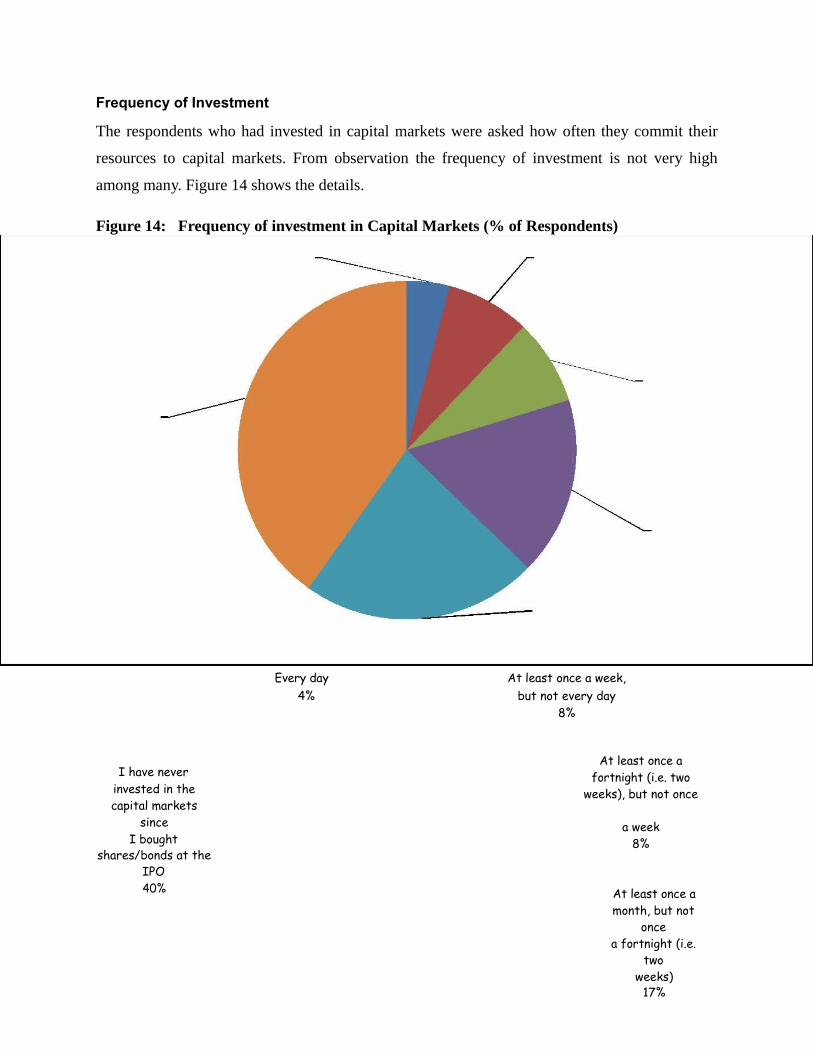
Frequency of Investment
The respondents who had invested in capital markets were asked how often they commit their
resources to capital markets. From observation the frequency of investment is not very high
among many. Figure 14 shows the details.
Figure 14: Frequency of investment in Capital Markets (% of Respondents)
Every day At least once a week,4% but not every day
8%
I have neverAt least once a
fortnight (i.e. twoinvested in the weeks), but not oncecapital markets
since a weekI bought 8%
shares/bonds at theIPO40% At least once a
month, but not once
a fortnight (i.e. two
weeks)17%
Less than once amonth23%
Source: Survey Findings
The findings show that frequency in investment in capital markets was low. The findings
indicate that 36.3% of the respondents did not invest again in capital markets after
buying shares. Such frequency in investment is not likely to stimulate the market and
even offer bigger returns for investors. Such behavior has been attributed to a narrow
market with few products that are appealing or affordable to investors. From a key
informant interview a respondent revealed:
The Capital market comprises of bonds (Government & corporate), equities
(Ugandan & Kenyan). However, secondary markets for bonds tend to be illiquid
due to low investor participation in these markets… …….Currently, the
exchange listings of shares and bonds are leading in the market, although other
products need to be modified due to low saving culture and also very expensive
and not financially viable for the investors…..The treasury
35 | P a g e
bills would in future lead the market because clients would be guaranteed of the
money at 27% per annum compared to shares which are very risky, yet very few
people know about it(Respondent from UAP).
In a related development another key informant reported that:
The market is still young and must grow through increased incentives that attract key
investors. Investors would be willing to come to the market when they see the benefits
or big companies joining. The biggest problem of markets going down today emanates
from lack of options(Respondent from CMA).
The conditions for SMEs to be listed are still hard for many to join the market, yet this
is where the industry can grow. There is need to focus on SMEs as driving factor for
local capital market expansion in Uganda (Respondent from CMA).
The small size of the market was also among the reported reasons for limited and
frequency of investment. The findings show that most of capital markets’ participants
were concentrated in central Uganda with limited or no participation of people from the
upcountry. In support of this argument, a respondent reported that:
Uganda capital markets need more companies listed on the stock exchange
market such that if one is not doing well, another can be picking up. The capital
market is mainly concentrated in Kampala. Brokers are profit making
organizations and are reluctant to go up country where the majority of the
population is. Access is still a problem because many people do not know about
the market (Respondent from African Alliance).
4.5 Perception of Risks
When making investment, capital markets investors may not consider risks involved. In
this regard, the respondents were therefore asked to the level of risk they are willing to
take in making investments in capital markets. Figure 13 shows positions held by
respondents.

36 | P a g e
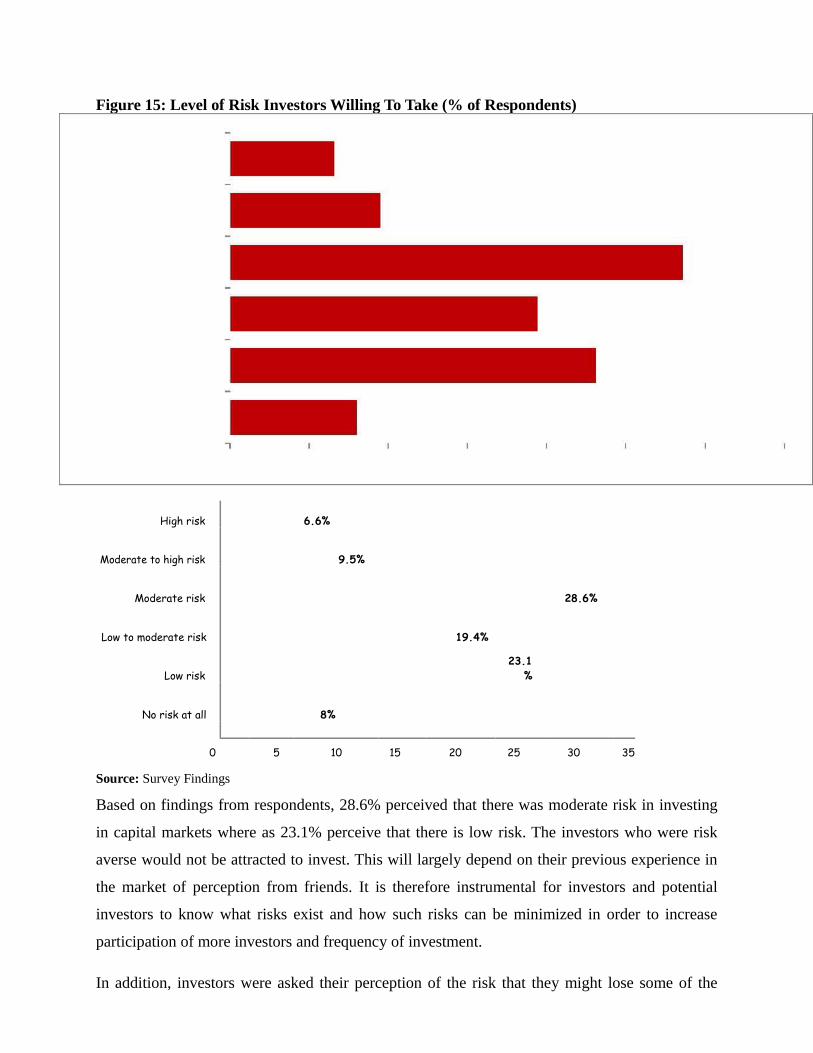
Figure 15: Level of Risk Investors Willing To Take (% of Respondents)
High risk 6.6%
Moderate to high risk 9.5%
Moderate risk 28.6%
Low to moderate risk 19.4%
Low risk23.1
%
No risk at all 8%
0 5 10 15 20 25 30 35
Source: Survey Findings
Based on findings from respondents, 28.6% perceived that there was moderate risk in investing
in capital markets where as 23.1% perceive that there is low risk. The investors who were risk
averse would not be attracted to invest. This will largely depend on their previous experience in
the market of perception from friends. It is therefore instrumental for investors and potential
investors to know what risks exist and how such risks can be minimized in order to increase
participation of more investors and frequency of investment.
In addition, investors were asked their perception of the risk that they might lose some of the

money they have invested. Figure 4.5 shows the details of the findings.
Figure 4.5: Risk that Investor Might Lose Some Money Invested (% of Respondents).
37 | P a g e

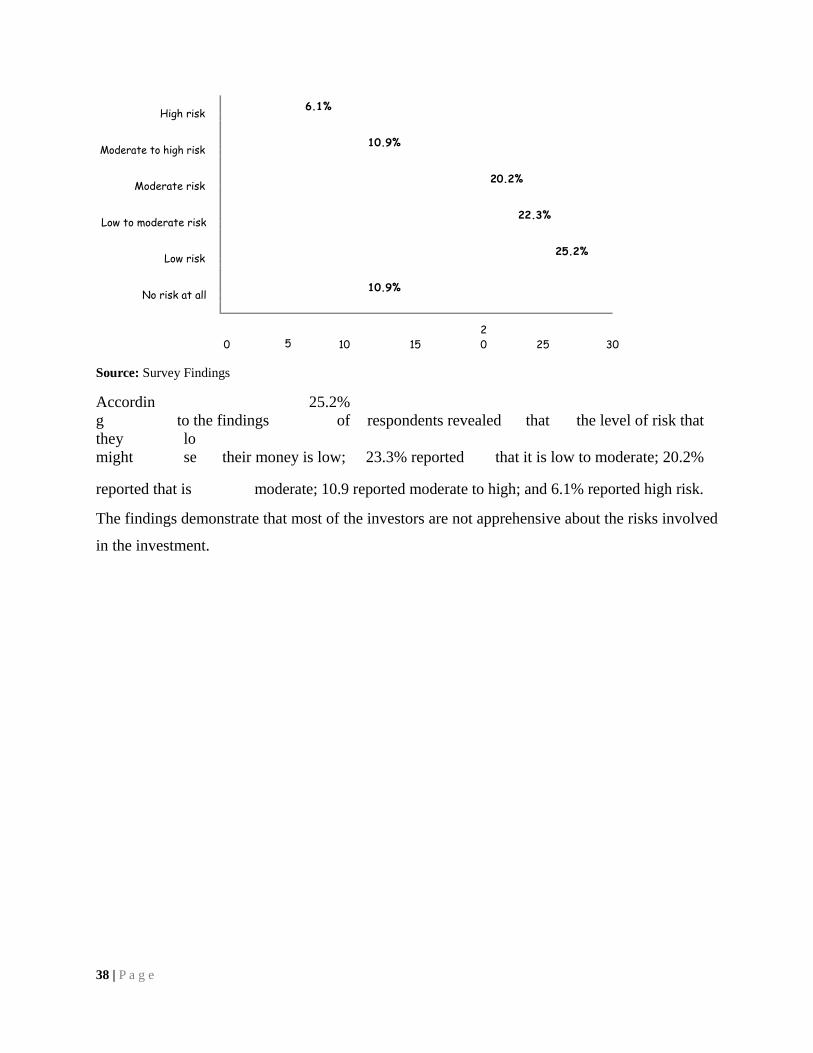
High risk 6.1%
Moderate to high risk 10.9%
Moderate risk 20.2%
Low to moderate risk 22.3%
Low risk 25.2%
No risk at all 10.9%
0 5 10 1520 25 30
Source: Survey Findings
According to the findings
25.2% of respondents revealed that the level of risk that
they might
lose their money is low; 23.3% reported that it is low to moderate; 20.2%
reported that is moderate; 10.9 reported moderate to high; and 6.1% reported high risk.
The findings demonstrate that most of the investors are not apprehensive about the risks involved
in the investment.
38 | P a g e
INVESTOR PROTECTION
5.0 Introduction
It is no coincidence that the capital markets have laws that govern them. There are numerous
regulations and laws that provide guideline on how capital markets should be run. These include
among others: Capital Markets Authority Act, Cap 84 Laws of Uganda 2000, the Capital Markets
(Prospectus Requirements) Regulations, 1999; Capital Markets (Cross Border Introductions)
Regulations, 2004; Capital Markets (Licensing) (Amendment) Regulations, 2003; and the
Companies Act, Cap 110 Laws of Uganda 2000. These laws, regulations and guidelines are
supposed to level the ground for players in the capital markets industry, provide protection to
investors and boast confidence among the players in the market. This section therefore attempts
to explore the levels of confidence of investors in the framework that is in place.
5.2 Perception on Qualification of Capital Markets Participants
In this context, the respondents were asked how confident they were that firms licensed in
Uganda’s capital markets industry have adequately qualified staff and enough money to operate.
The findings show varying levels of confidence as shown in figure 16.
39 | P a g e
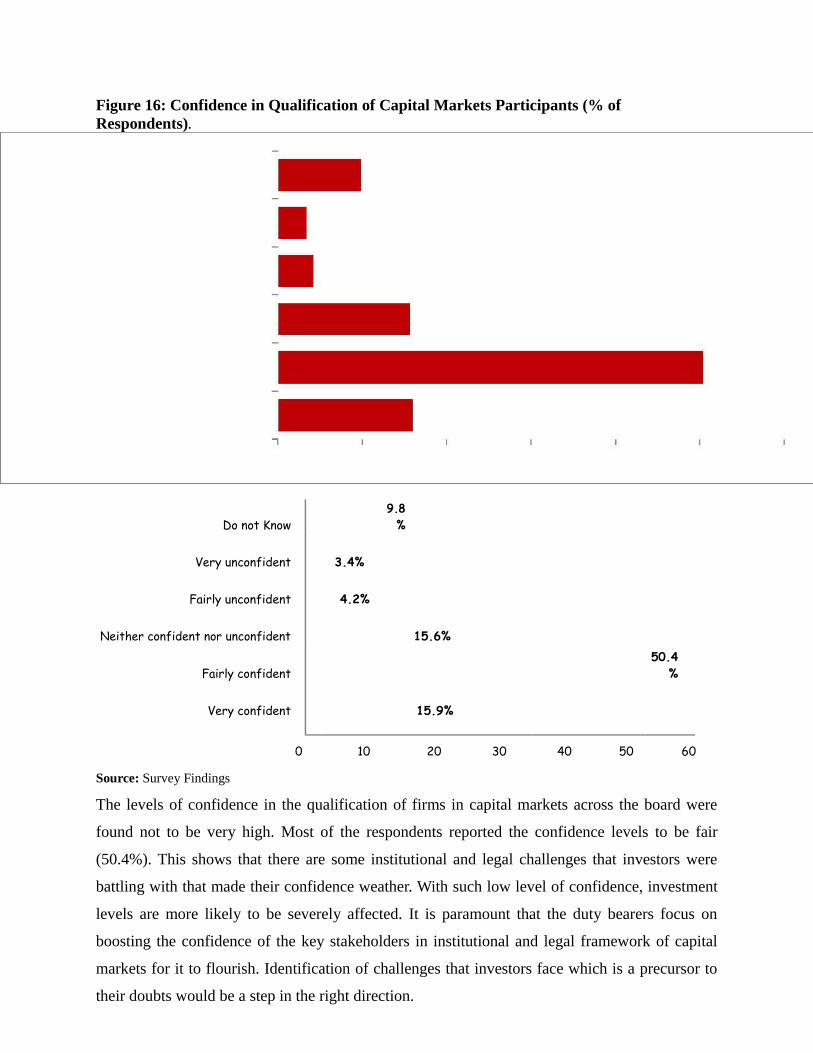
Figure 16: Confidence in Qualification of Capital Markets Participants (% of Respondents).
Do not Know9.8%
Very unconfident 3.4%
Fairly unconfident 4.2%
Neither confident nor unconfident 15.6%
Fairly confident50.4
%
Very confident 15.9%
0 10 20 30 40 50 60
Source: Survey Findings
The levels of confidence in the qualification of firms in capital markets across the board were
found not to be very high. Most of the respondents reported the confidence levels to be fair
(50.4%). This shows that there are some institutional and legal challenges that investors were
battling with that made their confidence weather. With such low level of confidence, investment
levels are more likely to be severely affected. It is paramount that the duty bearers focus on
boosting the confidence of the key stakeholders in institutional and legal framework of capital
markets for it to flourish. Identification of challenges that investors face which is a precursor to
their doubts would be a step in the right direction.

5.2 Perception on the Suitability of Products on the Market to Needs of Customers
Whenever investors want to commit funds to capital markets, they always lookout for products
the suit them. These financial products are also referred to as securities and are generally traded
on a stock (securities) exchange in the Uganda Securities Exchange5. This is mainly based on the
amount of money available and that they are willing to invest. Investors will therefore move to
licensed firms seeking to invest in a5 The common products are shares, collective investment schemes and bonds.
40 | P a g e
product which is appropriate at that moment. Investors were therefore asked about the
appropriateness of the products that were on the market. The responses are shown in figure 17.
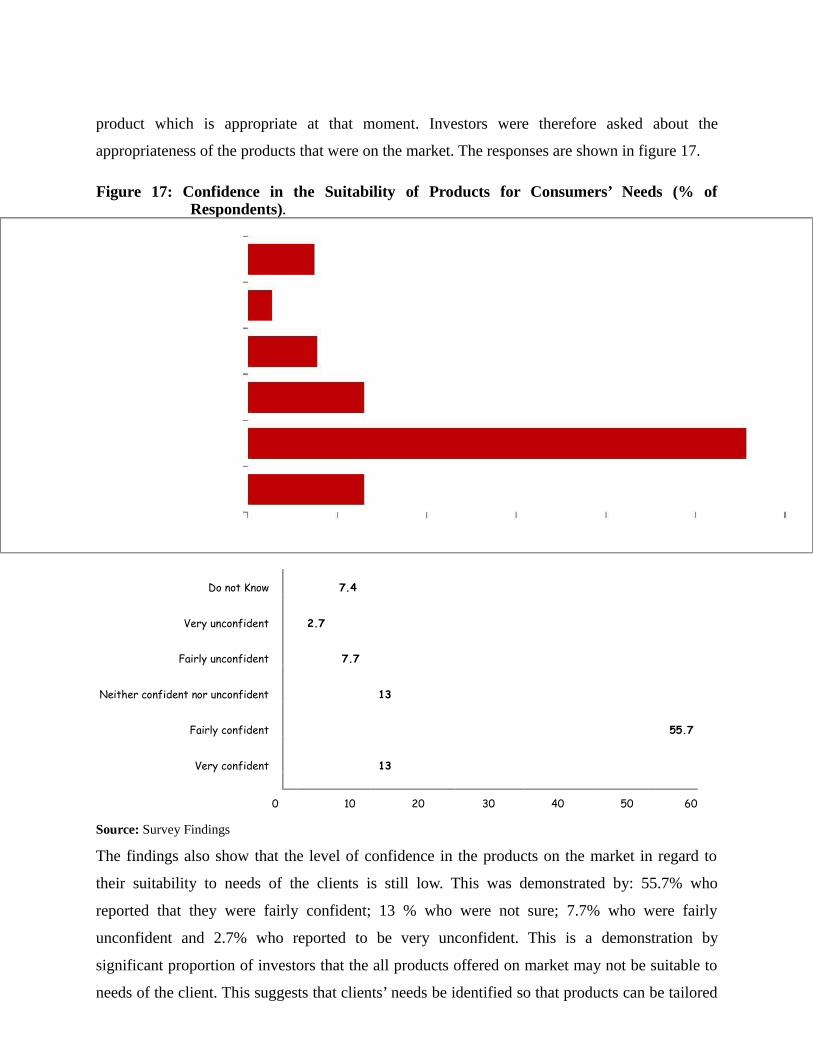
Figure 17: Confidence in the Suitability of Products for Consumers’ Needs (% of Respondents).
Do not Know 7.4
Very unconfident 2.7
Fairly unconfident 7.7
Neither confident nor unconfident 13
Fairly confident 55.7
Very confident 13
0 10 20 30 40 50 60
Source: Survey Findings
The findings also show that the level of confidence in the products on the market in regard to
their suitability to needs of the clients is still low. This was demonstrated by: 55.7% who
reported that they were fairly confident; 13 % who were not sure; 7.7% who were fairly
unconfident and 2.7% who reported to be very unconfident. This is a demonstration by
significant proportion of investors that the all products offered on market may not be suitable to
needs of the client. This suggests that clients’ needs be identified so that products can be tailored

accordingly.
5.3 Perception of confidence in Complaint Handling
With regard to perception of confidence in complaints handling, the investors were asked
whether they had confidence in compliant handling mechanism within the capital markets
industry .i.e. whether their complaints would be resolved fairly or not. Figure 18 presents a
graphic summary of the findings.
41 | P a g e
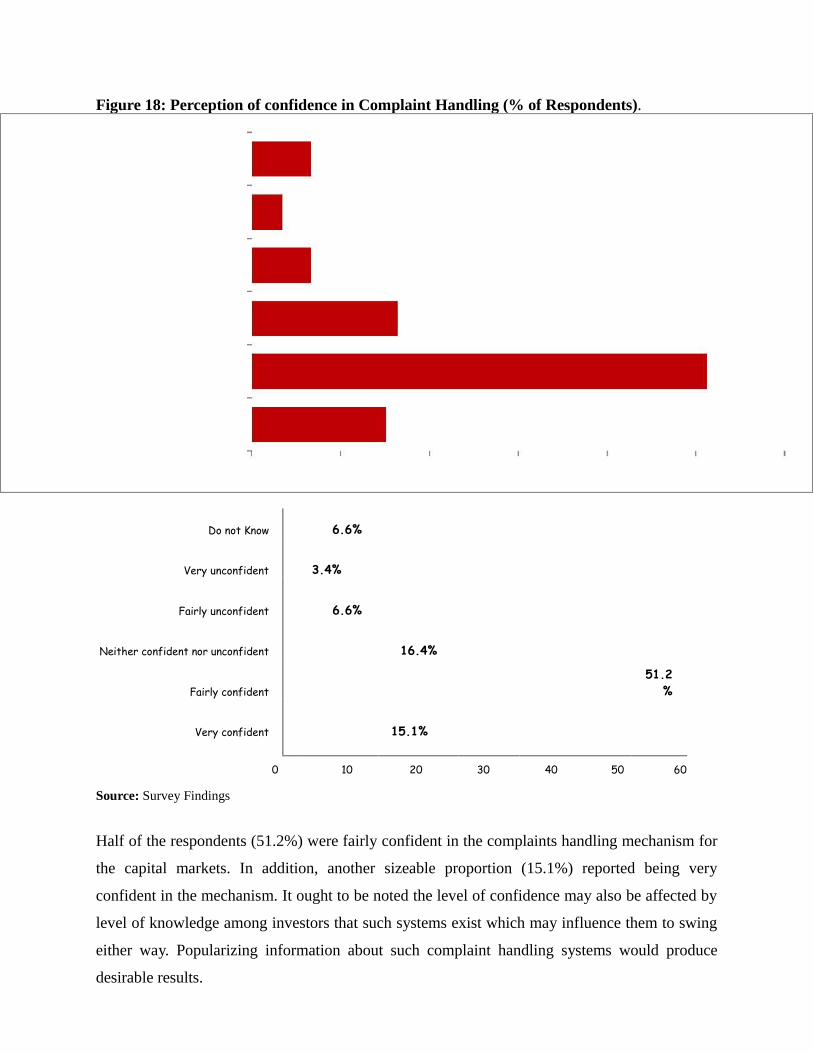
Figure 18: Perception of confidence in Complaint Handling (% of Respondents).
Do not Know 6.6%
Very unconfident 3.4%
Fairly unconfident 6.6%
Neither confident nor unconfident 16.4%
Fairly confident51.2
%
Very confident 15.1%
0 10 20 30 40 50 60
Source: Survey Findings
Half of the respondents (51.2%) were fairly confident in the complaints handling mechanism for
the capital markets. In addition, another sizeable proportion (15.1%) reported being very
confident in the mechanism. It ought to be noted the level of confidence may also be affected by
level of knowledge among investors that such systems exist which may influence them to swing
either way. Popularizing information about such complaint handling systems would produce
desirable results.

5.4 Perception on Compliance with the Capital Markets laws
Respondents were asked whether they have confidence that licensed firms operating in Uganda’s
capital markets industry follow the laws and Capital Markets Authority regulations. Figure 19
shows the details of findings.
42 | P a g e
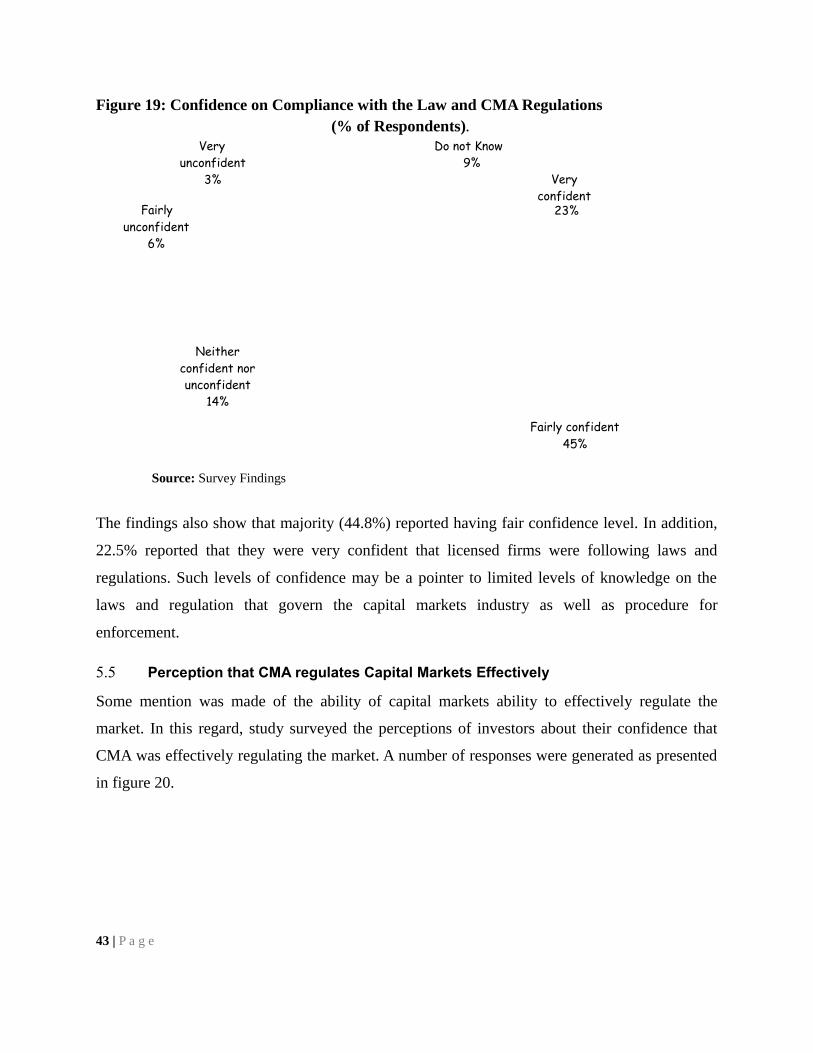
Figure 19: Confidence on Compliance with the Law and CMA Regulations(% of Respondents).
Very Do not Knowunconfident 9%
3% Very confident
Fairly 23%unconfident
6%
Neither confident nor unconfident
14%
Fairly confident 45%
Source: Survey Findings
The findings also show that majority (44.8%) reported having fair confidence level. In addition,
22.5% reported that they were very confident that licensed firms were following laws and
regulations. Such levels of confidence may be a pointer to limited levels of knowledge on the
laws and regulation that govern the capital markets industry as well as procedure for
enforcement.
5.5 Perception that CMA regulates Capital Markets Effectively
Some mention was made of the ability of capital markets ability to effectively regulate the
market. In this regard, study surveyed the perceptions of investors about their confidence that
CMA was effectively regulating the market. A number of responses were generated as presented
in figure 20.
43 | P a g e
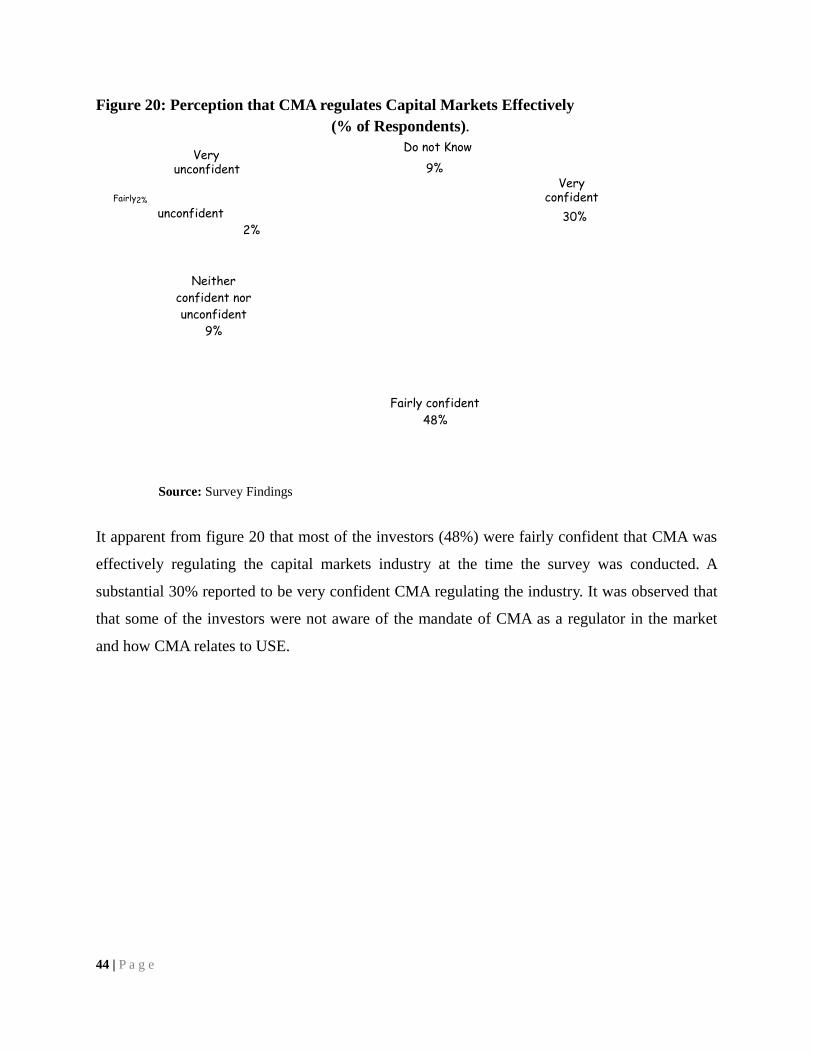
Figure 20: Perception that CMA regulates Capital Markets Effectively(% of Respondents).
Very Do not Know
9%unconfident
Fairly2%
Very confident
unconfident 30%2%
Neither confident nor unconfident
9%
Fairly confident 48%
Source: Survey Findings
It apparent from figure 20 that most of the investors (48%) were fairly confident that CMA was
effectively regulating the capital markets industry at the time the survey was conducted. A
substantial 30% reported to be very confident CMA regulating the industry. It was observed that
that some of the investors were not aware of the mandate of CMA as a regulator in the market
and how CMA relates to USE.
44 | P a g e
SEEKING FOR INVESTMENT ADVICE
6.0 Introduction
Capital Market's professional advisory are critical in making sound investment decisions whether
the investor is well-informed investor or a novice, an active or a passive. The capital markets
investors require this service if they plan to invest, or even more if they have already invested.
These services help to identify right investment opportunities, help the investor build a portfolio
to suit his/her risk-return equation, and sometimes keep monitoring on behalf of the investor and
suggest actions based on price movements and industry. It is partly on this basis that the survey
explored the level utilization of professional capital investment advisory services presented in
this section.
6.2 Ever Sought Investment Advice
The respondents were asked whether they had asked for professional investment advice or not
about capital markets products in the last 12 months. The results are shown in figure 21.
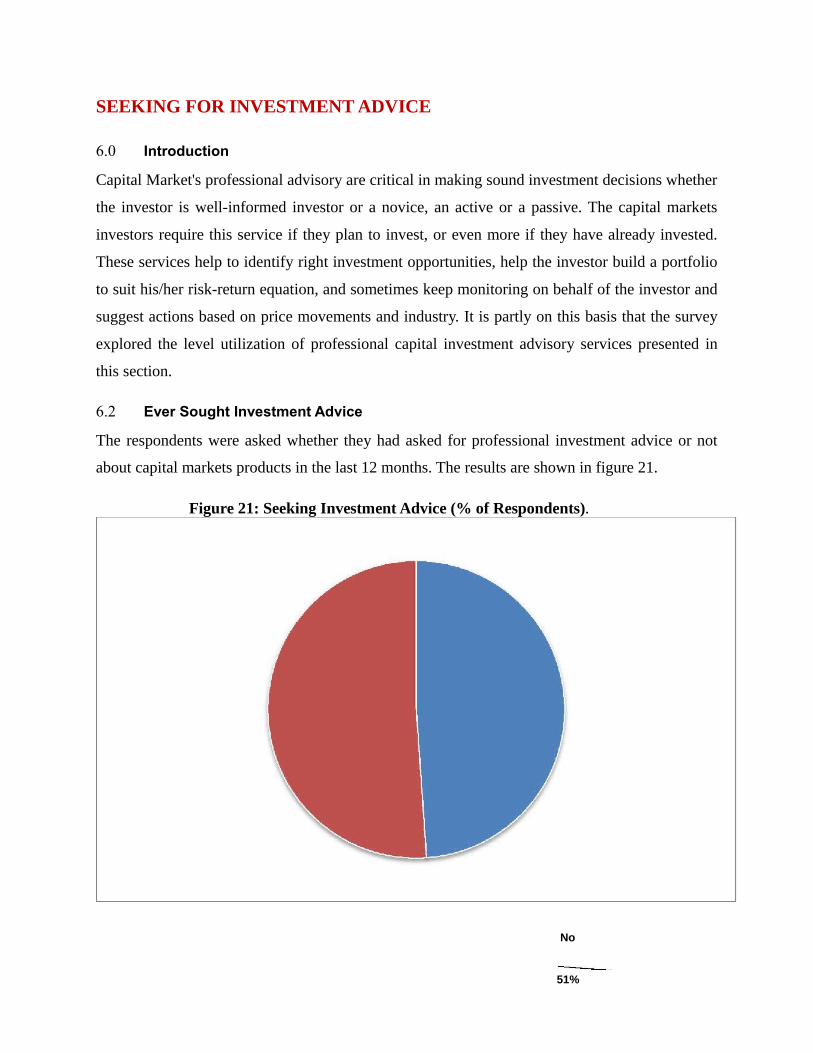
Figure 21: Seeking Investment Advice (% of Respondents).
No
51%

Source: Survey Findings
45 | P a g e
Yes 49%
From the results, 46.4% of the respondents had sought professional advice on investment in
capital markets compared to 48.5% who had not. This implies that very many investors do not
utilize the services of investment advisers partly because they may not know that they exist or
they want to avoid the costs involved. Such practice may increase the level of risk on part of the
investor.
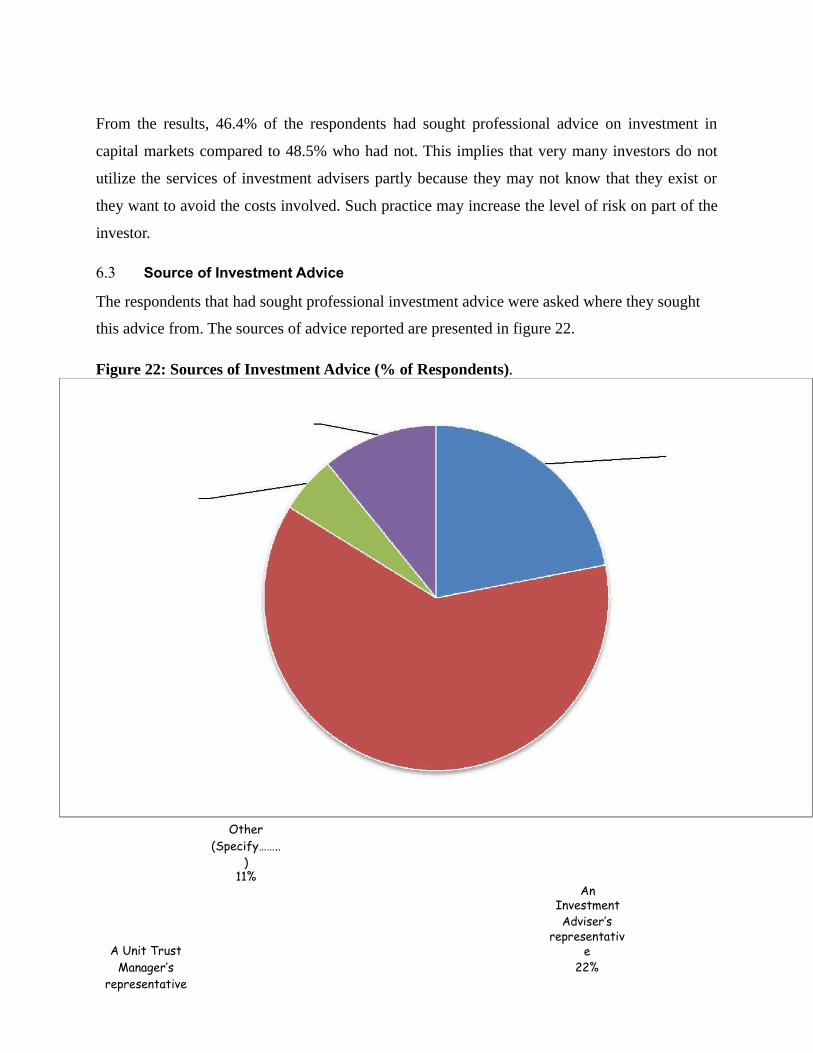
6.3 Source of Investment Advice
The respondents that had sought professional investment advice were asked where they sought
this advice from. The sources of advice reported are presented in figure 22.
Figure 22: Sources of Investment Advice (% of Respondents).
Other(Specify……..
)11%
An Investment
A Unit Trust
Adviser’srepresentativ
eManager’s 22%
representative
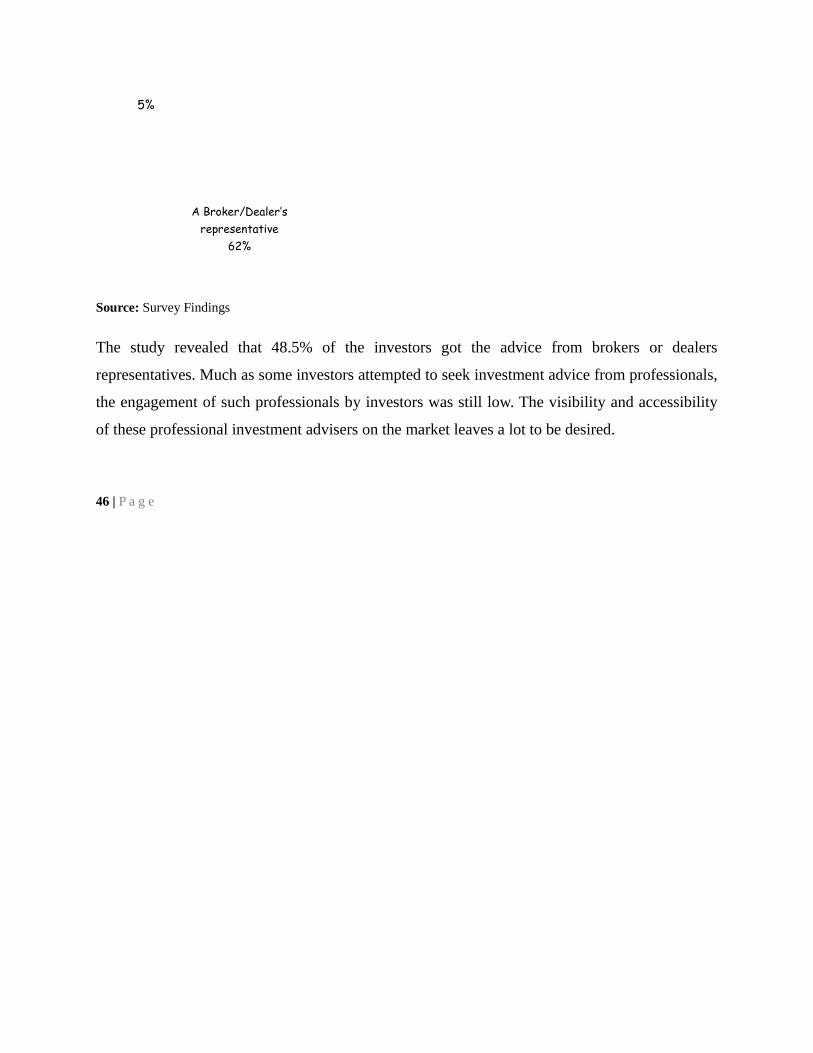
5%
A Broker/Dealer’s representative
62%
Source: Survey Findings
The study revealed that 48.5% of the investors got the advice from brokers or dealers
representatives. Much as some investors attempted to seek investment advice from professionals,
the engagement of such professionals by investors was still low. The visibility and accessibility
of these professional investment advisers on the market leaves a lot to be desired.
46 | P a g e
In this regard, a key informant noted that:
……..The investors have a right to knowledge. There is need to provide them with key
information to make better investment decisions in the capital market industry. For
those who are yet to be investors, they need to hear more about the benefits while
investors would want more information on websites, print media, radios and public
advocacy campaigns. This means they should have accesses to information on products,
structure return potential, and risk expectations. The investors must know that there
are risks in the capital markets that need to be managed. This will give them ability to
buy shares and invest where there is risk management. (Official from UgandaSecurities Exchange (USE) Governing Council)
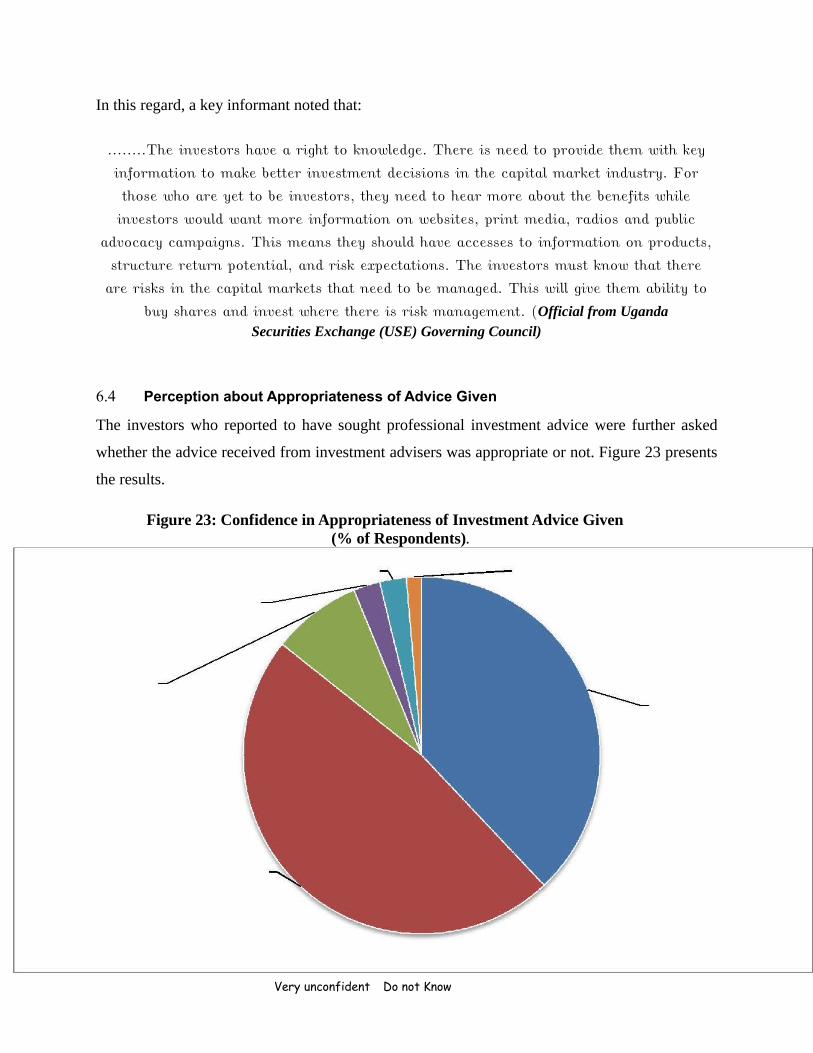
6.4 Perception about Appropriateness of Advice Given
The investors who reported to have sought professional investment advice were further asked
whether the advice received from investment advisers was appropriate or not. Figure 23 presents
the results.
Figure 23: Confidence in Appropriateness of Investment Advice Given(% of Respondents).
Very unconfident Do not Know

2% 1%Fairly unconfident
3%
Neither confidentnor unconfident Very confident
8% 38%
Fairly confident 48%
Source: Survey Findings
47 | P a g e
Findings revealed that 30% of the respondents had a lot of confidence in the investment advice;
and 37.7% were fairly confident that the advice was appropriate to their circumstances. The
findings therefore imply that investment advisers need to understand the needs of their
customer’s vis-à-vis what is prevailing on the market.
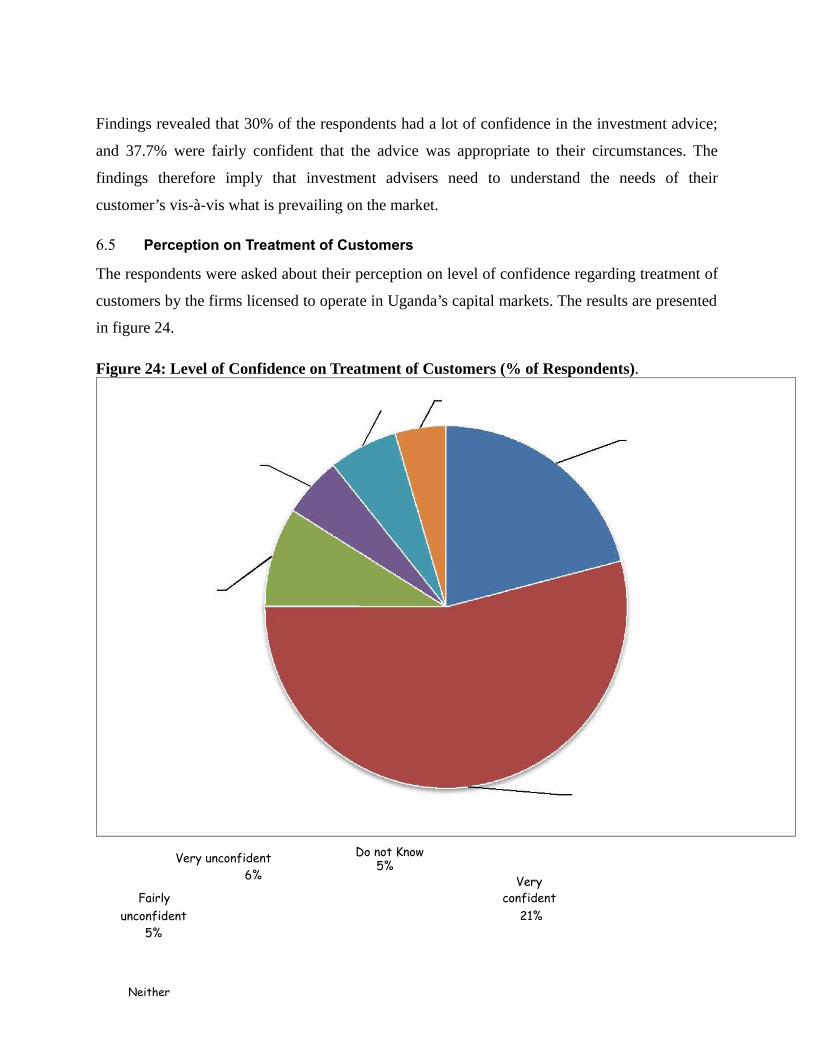
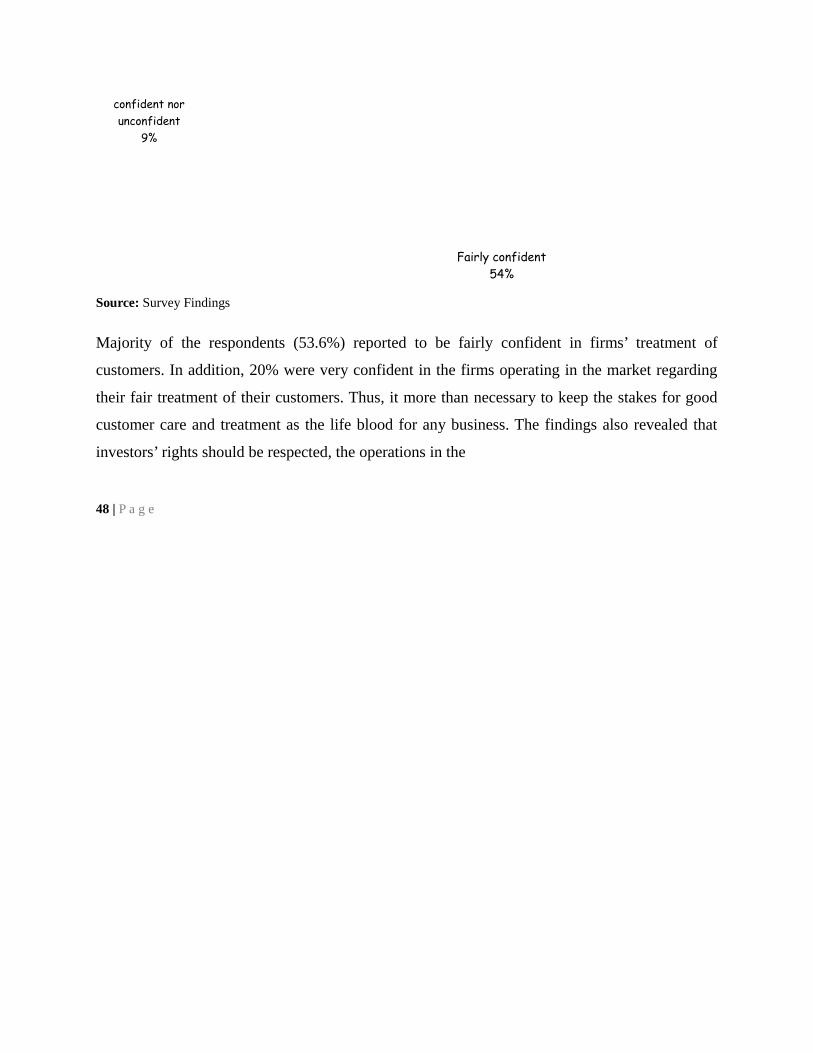
6.5 Perception on Treatment of Customers
The respondents were asked about their perception on level of confidence regarding treatment of
customers by the firms licensed to operate in Uganda’s capital markets. The results are presented
in figure 24.
Figure 24: Level of Confidence on Treatment of Customers (% of Respondents).
Very unconfident Do not Know5%
6%
FairlyVery
confidentunconfident 21%
5%
Neither
confident nor unconfident
9%
Fairly confident 54%
Source: Survey Findings
Majority of the respondents (53.6%) reported to be fairly confident in firms’ treatment of
customers. In addition, 20% were very confident in the firms operating in the market regarding
their fair treatment of their customers. Thus, it more than necessary to keep the stakes for good
customer care and treatment as the life blood for any business. The findings also revealed that
investors’ rights should be respected, the operations in the
48 | P a g e

market should be transparent and the market should treat all investors fairly. This was
revealed by some Officials from USE Governing Council, thus:
The investors need assurance that their money is safeguarded. Some rights of
investors are violated because; sometimes their shares are sold by brokers without
knowledge of investors and ploughed back after making profits. (Respondent from USE Governing Council)
………. Investors in the market should not be cheated by brokers. The rule of
transparency should override the market. Also investors should know their rights
through displays, etc, so that they know the benefits of joining capital markets. Such
benefits like discounts, and tax holidays are factors that can attract investors.
( Respondent from USE Governing Council)
………There is need for the same investment environment applied for all investors to
operate without any discrimination whatsoever. They should receive the same information
across the board. There should not be any privilege for the chosen few. For example, in
case of loss of stock brokerage or fraud, investor has a right to be given back his/her
price through rights issue. …the investors should have a right to repatriate their savings.
( Respondent from USE Governing
Council)

49 | P a g e
7.0 FACTORS AFFECTING INVESTMENTS IN UGANDA’S CAPITAL
MARKETS
7.1 Introduction
A well regulated and properly functioning capital market clearly plays many roles and offers
many benefits. Capital markets allow the efficient transfer of funds between borrowers and
lenders. Households and investors who are short of funds to take up profitable investment
opportunities that yield rates of return higher than the market are able to borrow funds and invest
more than they would have done without capital markets. However, to play the above roles and
attain these ideals, a capital market needs to be effectively organized and operated, with a
continuous flow of orders around the equilibrium prices. To this effect a number of factors were
found to impact on the achievement of a fully functional and well regulated capital market in
Uganda including:
7.2 Factors Affecting Investment
7.2.1 Low Financial Literacy Levels
It was reported that financial literacy levels were still low among most of the potential players. In
this regard, many potential investors were not able to make appropriate investment decisions in
capital markets. This was not only limited to finances but also limited knowledge about
usefulness of the Capital markets by local businesses persons and the trading process. This has
resulted in visible limited engagement of the Capital markets with stakeholders in the industry.
7.2.2 Compliance of Companies
In addition, there were compliance challenges where very few companies were in position to
comply with the present standards set and the legal regime. For a company to be listed, it would
be required to declare profits for the last 5 years. Those that made loses would not be eligible to
be listed. Many potential companies are still operating
50 | P a g e

informally and did not express any interest to be listed in the capital markets due to the costs
involved like paying taxes.
7.2.3 Number of Listed Companies
The number of listed companies on the market is still very limited and this has made the market
shallow and small. At the time of the study, it was established that there were only 7 Ugandan
companies and the rest are cross-listed. Most investors had a limited range of choices where they
could invest their money. It was established that majority of the investors in capital markets only
buy shares. It was also observed that the companies do not have a variety of products to be able
to spread their risks. They need to see more listings of companies on the market.
7.2.4 Limited Geographical Coverage
It was been observed that, the nature of the current trading system is that, most companies have
not been able to go beyond Kampala. This severely affected scope of operation and venturing
into virgin markets in the country side. The capital market was reported to be mainly
concentrated in Kampala. Brokers are profit making organizations and are reluctant to go up
country where the majority of the population is. Access was still a problem because many people
do not know about the market.
7.2.5 Level of Competition
The level of competition in the market was found to be low. At the time of the study, there were
only 8 brokers and 6 fund managers. This meant that there were only 14 companies listed of
which only 7 of them were Ugandan. Others were cross-listed and mainly from Kenya. There
was virtually no competition in the market as the market was full of monopolists.
7.2.6 Inflation
At the time of the survey, Uganda was still experiencing high levels of inflation. For around 5
months (September 2011- January 2012), inflation increased to 24% from 10%.
51 | P a g e
As a result of a high inflation, investment value had been eroded due to reduced purchasing
power. The high lending rates affected clients' investable funds due to increased monthly loan
commitments. In light of such a challenging environment, investors began to re-align investment
priorities leading reduced activity in capital markets. Such an environment made the capital
markets dull.
7.2.7 Liquidity
In terms of liquidity of the markets, measured by the value traded, it was reported that capital
markets experienced low levels of liquidity, in some instances zero values were recorded
52 | P a g e
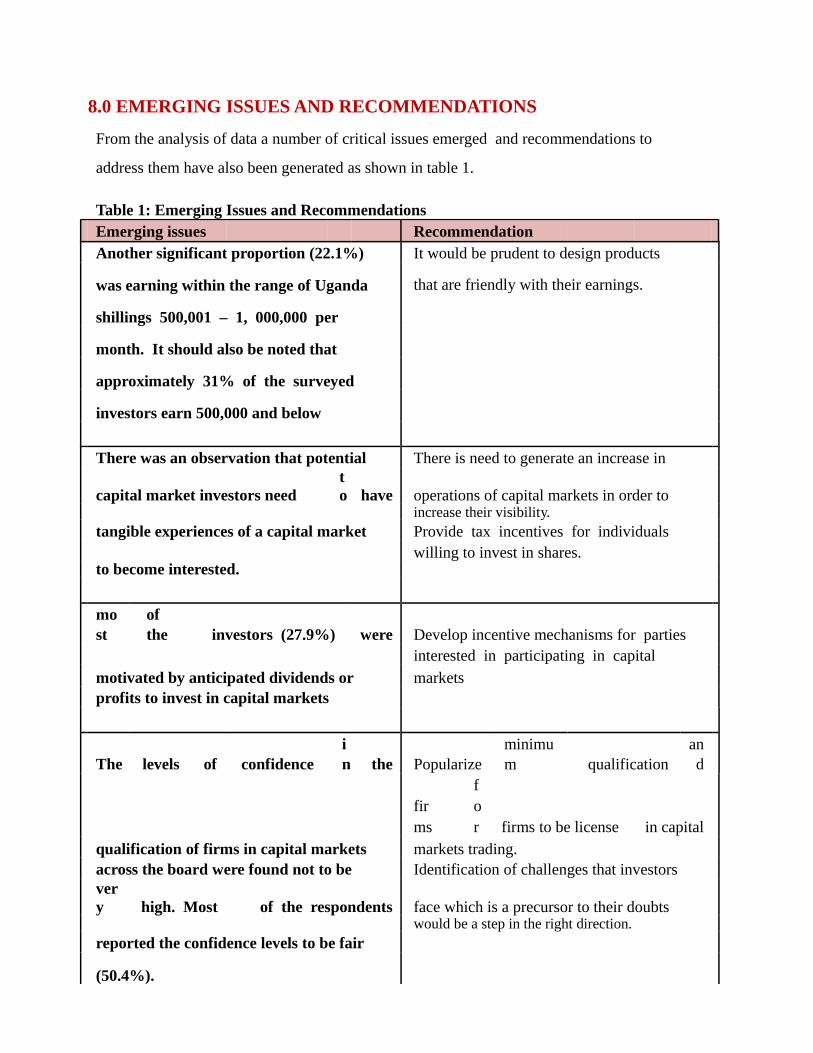
8.0 EMERGING ISSUES AND RECOMMENDATIONS
From the analysis of data a number of critical issues emerged and recommendations to
address them have also been generated as shown in table 1.
Table 1: Emerging Issues and RecommendationsEmerging issues RecommendationAnother significant proportion (22.1%) It would be prudent to design products
was earning within the range of Uganda that are friendly with their earnings.
shillings 500,001 – 1, 000,000 per
month. It should also be noted that
approximately 31% of the surveyed
investors earn 500,000 and below
There was an observation that potential There is need to generate an increase in
capital market investors needto have operations of capital markets in order to
increase their visibility.tangible experiences of a capital market Provide tax incentives for individuals
to become interested.willing to invest in shares.
most
of the investors (27.9%) were Develop incentive mechanisms for parties
motivated by anticipated dividends or
interested in participating in capital
marketsprofits to invest in capital markets
The levels of confidencein the Popularize
minimum qualification
and
qualification of firms in capital markets
firms
for firms to be license in capital
markets trading.across the board were found not to be Identification of challenges that investorsvery high. Most of the respondents face which is a precursor to their doubts
would be a step in the right direction.reported the confidence levels to be fair
(50.4%).
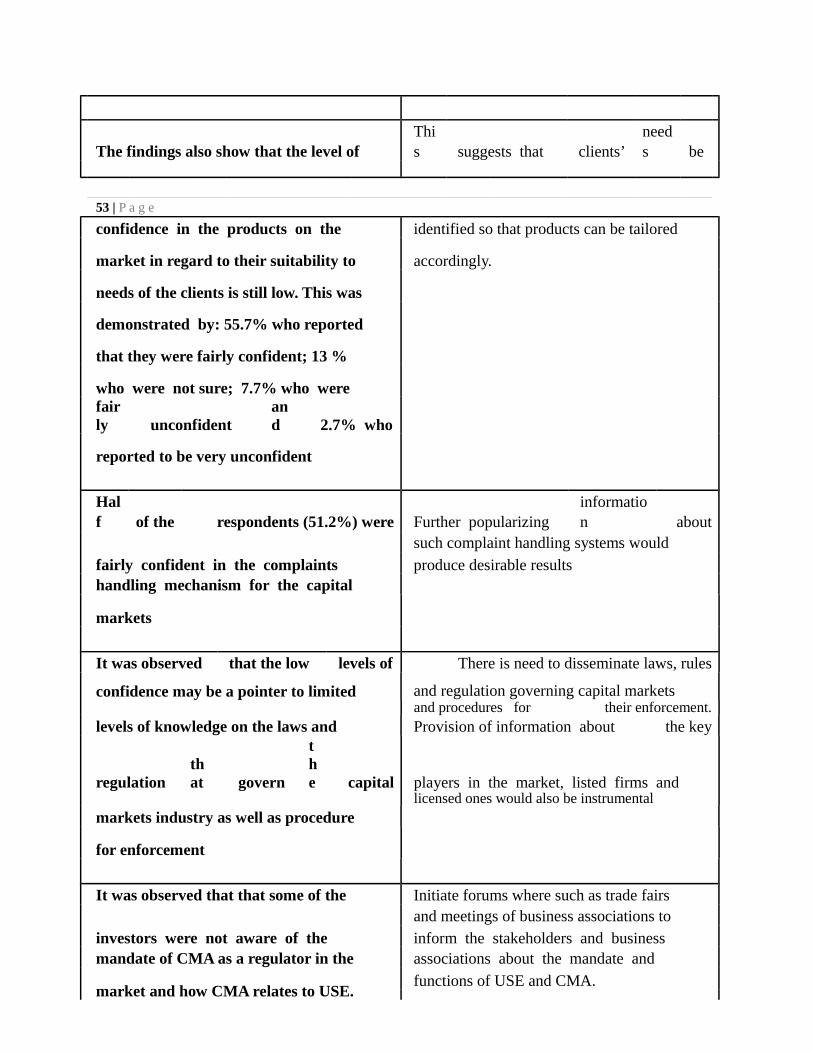
The findings also show that the level ofThis suggests that clients’
needs be
53 | P a g e
confidence in the products on the identified so that products can be tailored
market in regard to their suitability to accordingly.
needs of the clients is still low. This was
demonstrated by: 55.7% who reported
that they were fairly confident; 13 %
who were not sure; 7.7% who werefairly unconfident
and 2.7% who
reported to be very unconfident
Half of the respondents (51.2%) were Further popularizing
information about
fairly confident in the complaints
such complaint handling systems would
produce desirable resultshandling mechanism for the capital
markets
It was observed that the low levels of There is need to disseminate laws, rules
confidence may be a pointer to limited and regulation governing capital marketsand procedures for their enforcement.
levels of knowledge on the laws and Provision of information about the key
regulationthat govern
the capital players in the market, listed firms and
licensed ones would also be instrumentalmarkets industry as well as procedure
for enforcement
It was observed that that some of the Initiate forums where such as trade fairs
investors were not aware of theand meetings of business associations toinform the stakeholders and business
mandate of CMA as a regulator in the associations about the mandate and
market and how CMA relates to USE.functions of USE and CMA.

54 | P a g e
46.4% of the respondents had sought
professional advice on investment in capital
markets compared to 48.5% who had not.
This implies that very many investors do not
utilize the services of investment advisers
partly because they may not know that they
exist or they want to avoid the costs
involved. Such practice may increase the
level of risk on part of the investor.
Provide information on the need for investment advisory servicesProvide information on licensed firms that provide professional investment advice. Disseminate information on listing requirements and possibilities to obtain input from e.g. business support institution
ANNEXES
A.1 Questionnaire
CAPITAL MARKETS INVESTORS SURVEY
Capital
Market
Authority
(CMA)
was
establishe
d by an
Act of
Parliament
in 1996 to
regulate
and
promote
the
developm
ent of
capital
markets in
Uganda.
One of the
cornerston
es of
capital
Markets
regulation
is investor
protection.
Therefore if CMA is to
adequately protect the
investors in Uganda’s
capital markets it needs
to fully understand the
nature and needs of
these investors.
APAS Consultants Ltd
has been contracted to
carry out a survey
determine the needs of
investor so that CMA
in turn can make
relevant interventions
that will make CMA
meet it mandate of
protecting the investor.
55 | P a g e
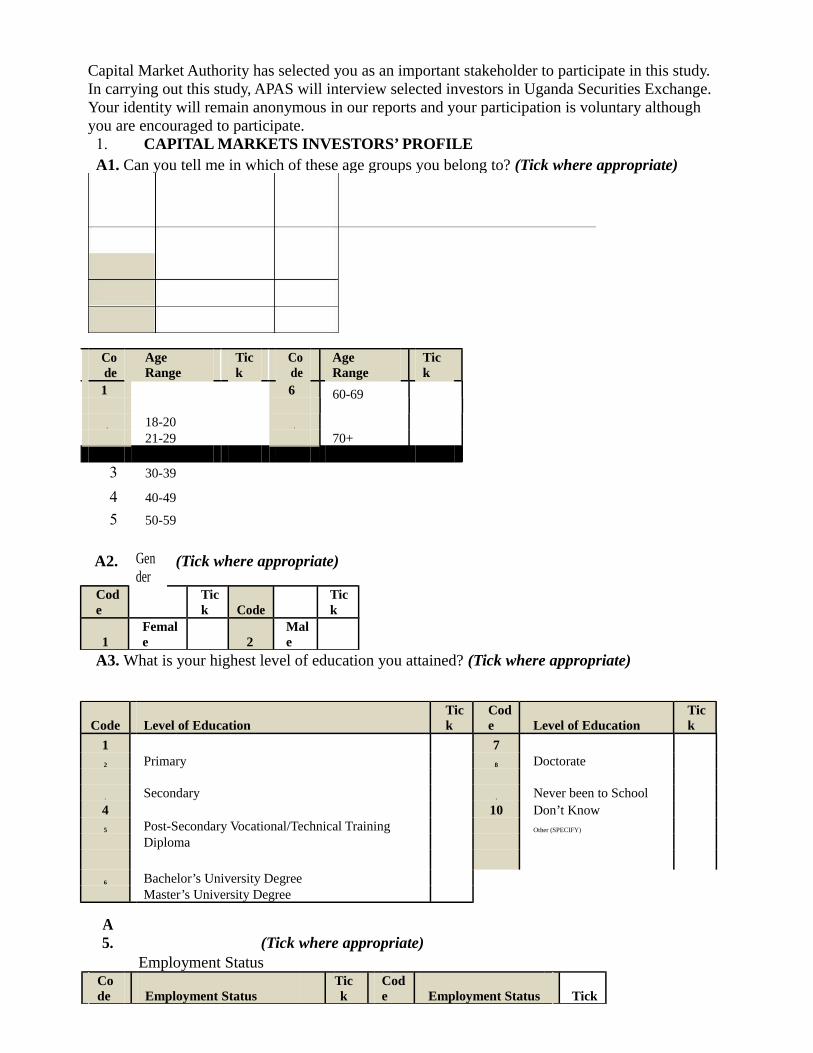
Capital Market Authority has selected you as an important stakeholder to participate in this study. In carrying out this study, APAS will interview selected investors in Uganda Securities Exchange. Your identity will remain anonymous in our reports and your participation is voluntary although you are encouraged to participate.1. CAPITAL MARKETS INVESTORS’ PROFILE A1. Can you tell me in which of these age groups you belong to? (Tick where appropriate)
Code
Age Range
Tick
Code
Age Range
Tick
1
18-20
6 60-69
2 7
21-29 70+
3 30-39
4 40-49
5 50-59
A2. Gender
(Tick where appropriate)
Code
Tick Code
Tick
1Female 2
Male
A3. What is your highest level of education you attained? (Tick where appropriate)
Code Level of EducationTick
Code Level of Education
Tick
1Primary
7Doctorate2 8
Secondary Never been to School3 9
4Post-Secondary Vocational/Technical Training
10 Don’t Know5 Other (SPECIFY)
Diploma
Bachelor’s University Degree6
Master’s University Degree
A5. (Tick where appropriate)
Employment StatusCode Employment Status
Tick
Code Employment Status Tick
1
Self employed
6
Other (specify)2
Full-time employee3
Part- time employee4
Unpaid for household work5
Unemployed
IF UNEMPLOYED GO TO SECTION B. IF EMPLOYED IN ANY FORM GO TO QUESTION A6.A6. (Tick where appropriate)
TickIncome Range (Ushs) Tick Code Income Range (Ushs)
Level of Income per MonthCo
de10,000,001 +1 Less than 100,000 6
56 | P a g e
100,001-500,000
2 500,001-1,000,000
3 1000,001-5000,000
4 5000,001-10,000,000
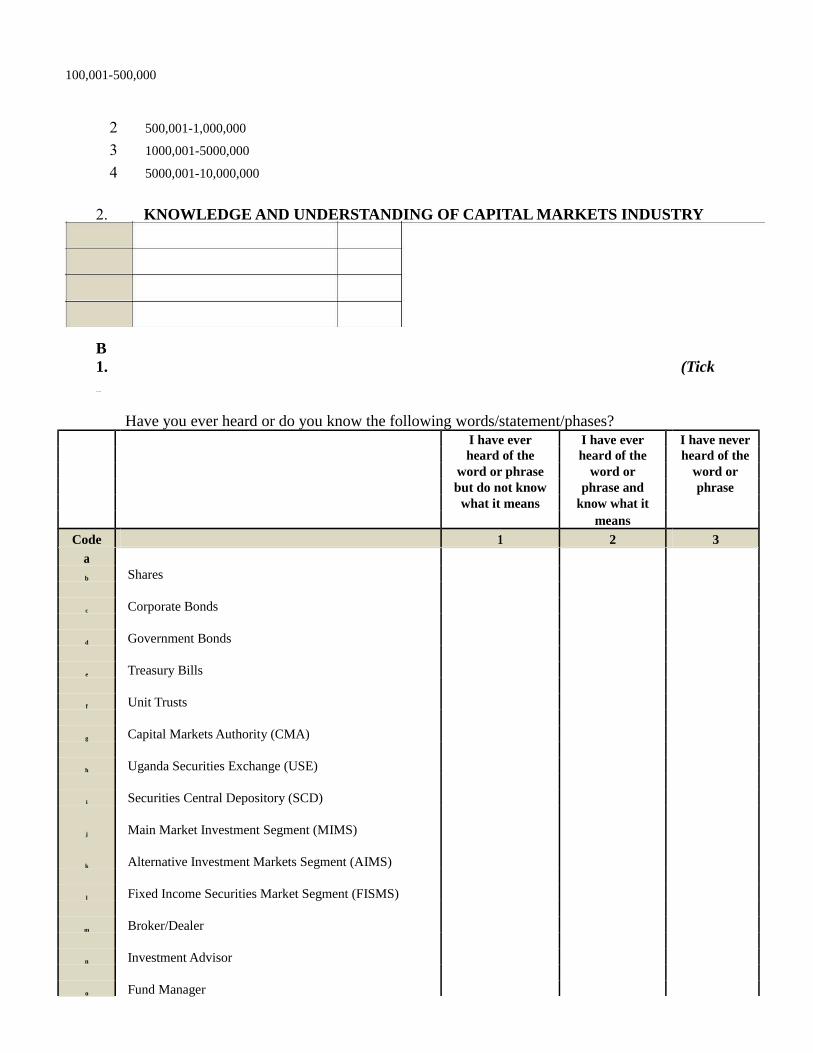
2. KNOWLEDGE AND UNDERSTANDING OF CAPITAL MARKETS INDUSTRY
B1. (Tickwhere appropriate)
Have you ever heard or do you know the following words/statement/phases?I have ever I have ever I have neverheard of the heard of the heard of the
word or phrase word or word orbut do not know phrase and phrase
what it means know what itmeans
Code 1 2 3
aSharesb
Corporate Bondsc
Government Bondsd
Treasury Billse
Unit Trustsf
Capital Markets Authority (CMA)g
Uganda Securities Exchange (USE)h
Securities Central Depository (SCD)i
Main Market Investment Segment (MIMS)j
Alternative Investment Markets Segment (AIMS)k
Fixed Income Securities Market Segment (FISMS)l
Broker/Dealerm
Investment Advisorn
Fund Managero

Dividendsp
Dividend Yieldq
Yield to Maturityr
Yield Curves
Price to Earnings Ratiot
USE All share Index
IF YOUR ANSWER TO ANY OF THE QUESTIONS IN B1 IS EITHER 1 “I HAVE EVER HEARD
OF THE WORD OR PHRASE BUT DO NOT KNOW WHAT IT MEANS” OR 2 “I HAVE EVER HEARD OF THE WORD OR PHRASE AND KNOW WHAT IT MEANS” THEN GO TO B2IF YOUR ANSWER TO ANY OF THE QUESTIONS IN B1 IS “I HAVE NEVER HEARD OF THE
WORD OR PHRASE” THEN GO TO Section C
57 | P a g e
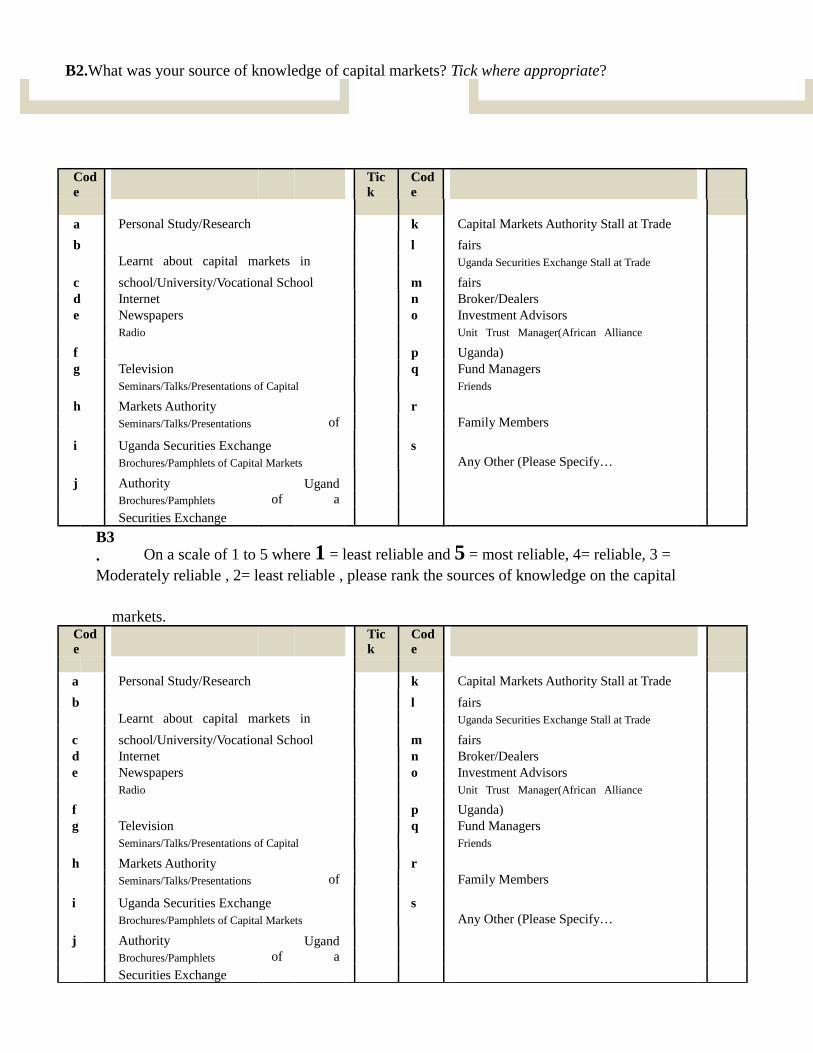
B2.What was your source of knowledge of capital markets? Tick where appropriate?
Code
Tick
Code
Personal Study/Research Capital Markets Authority Stall at Tradea k
bLearnt about capital markets in
l fairsUganda Securities Exchange Stall at Trade
c school/University/Vocational School m fairsd Internet n Broker/Dealerse Newspapers o Investment Advisors
Radio Unit Trust Manager(African Alliance
f p Uganda)g Television q Fund Managers
Seminars/Talks/Presentations of Capital Friends
h Markets Authorityof
rFamily MembersSeminars/Talks/Presentations
i Uganda Securities Exchange sAny Other (Please Specify…Brochures/Pamphlets of Capital Markets
j Authorityof
UgandaBrochures/Pamphlets
Securities Exchange
B3. On a scale of 1 to 5 where 1 = least reliable and 5 = most reliable, 4= reliable, 3 =Moderately reliable , 2= least reliable , please rank the sources of knowledge on the capital
markets.Code
Tick
Code
Personal Study/Research Capital Markets Authority Stall at Tradea k
bLearnt about capital markets in
l fairsUganda Securities Exchange Stall at Trade
c school/University/Vocational School m fairsd Internet n Broker/Dealerse Newspapers o Investment Advisors
Radio Unit Trust Manager(African Alliance
f p Uganda)g Television q Fund Managers
Seminars/Talks/Presentations of Capital Friends
h Markets Authorityof
rFamily MembersSeminars/Talks/Presentations
i Uganda Securities Exchange sAny Other (Please Specify…Brochures/Pamphlets of Capital Markets
j Authorityof
UgandaBrochures/Pamphlets
Securities Exchange

3. CAPITAL MARKETS INVESTMENTS C1. What motivated you to invest in the capital markets? Provide at least two one reason
……………………………………………………………………………………………………………..
58 | P a g e

………………………………………………………………………………………………………………..
………………………………………………………………………………………………………………..C2. How much money have you so far invested in the capital markets? Please tick where
appropriate
Code Income Range (Ushs)
Tick
Code Income Range (Ushs)
Tick
Less than 100,000 10,000,001 +1 6
2 100,001-500,000
3 500,001-1,000,000
4 1000,001-5000,000
5 5000,001-10,000,000
C3. How many years have you been invested in Uganda’s capital markets? ……………………….
C4. In how many Initial Public Offers (IPOs) have you participated in? ……………………….
C5. How frequently do you invest in the capital markets? Please tick where appropriate
CodeTick
1
Every day2(i.e. two weeks)
At least once a week, but not every day3 (i.e. two weeks)At least once a fortnight , but not once a week4
At least once a month, but not once a fortnight5
Less than once a month6
I have never invested in the capital markets since I bought shares/bonds at the IPO
C6. How much risk are you prepared to take that you might lose some of the money you invest in
the capital markets? Please tick where appropriate
CodeTick
1 No risk at all2
Low risk3
Low to moderate risk4
Moderate risk5
Moderate to high risk6
High risk
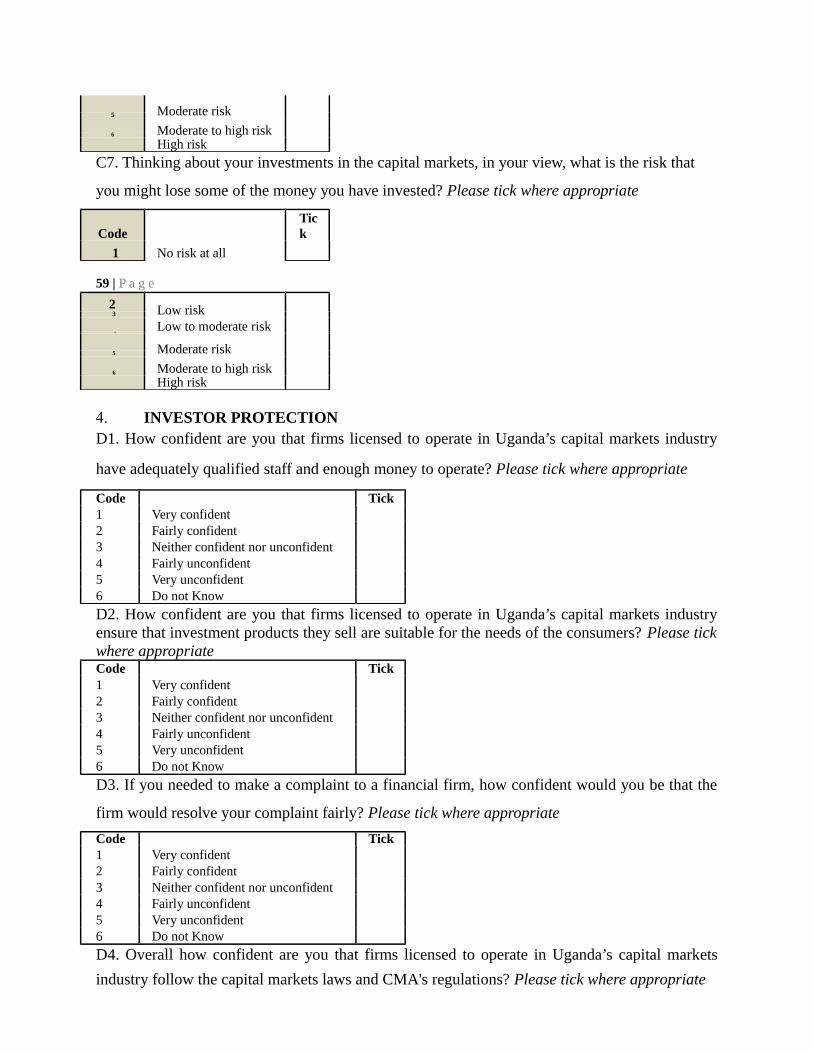
C7. Thinking about your investments in the capital markets, in your view, what is the risk that
you might lose some of the money you have invested? Please tick where appropriate
Code
No risk at all
Tick
1
59 | P a g e
2 Low risk3
Low to moderate risk4
Moderate risk5
Moderate to high risk6
High risk
4. INVESTOR PROTECTION D1. How confident are you that firms licensed to operate in Uganda’s capital markets industry
have adequately qualified staff and enough money to operate? Please tick where appropriate
Code Tick1 Very confident2 Fairly confident3 Neither confident nor unconfident4 Fairly unconfident5 Very unconfident6 Do not Know
D2. How confident are you that firms licensed to operate in Uganda’s capital markets industry ensure that investment products they sell are suitable for the needs of the consumers? Please tick where appropriateCode Tick1 Very confident2 Fairly confident3 Neither confident nor unconfident4 Fairly unconfident5 Very unconfident6 Do not Know
D3. If you needed to make a complaint to a financial firm, how confident would you be that the
firm would resolve your complaint fairly? Please tick where appropriate
Code Tick1 Very confident2 Fairly confident3 Neither confident nor unconfident4 Fairly unconfident5 Very unconfident6 Do not Know
D4. Overall how confident are you that firms licensed to operate in Uganda’s capital markets
industry follow the capital markets laws and CMA's regulations? Please tick where appropriate
Code Tick1 Very confident2 Fairly confident3 Neither confident nor unconfident4 Fairly unconfident5 Very unconfident
60 | P a g e
6 Do not Know
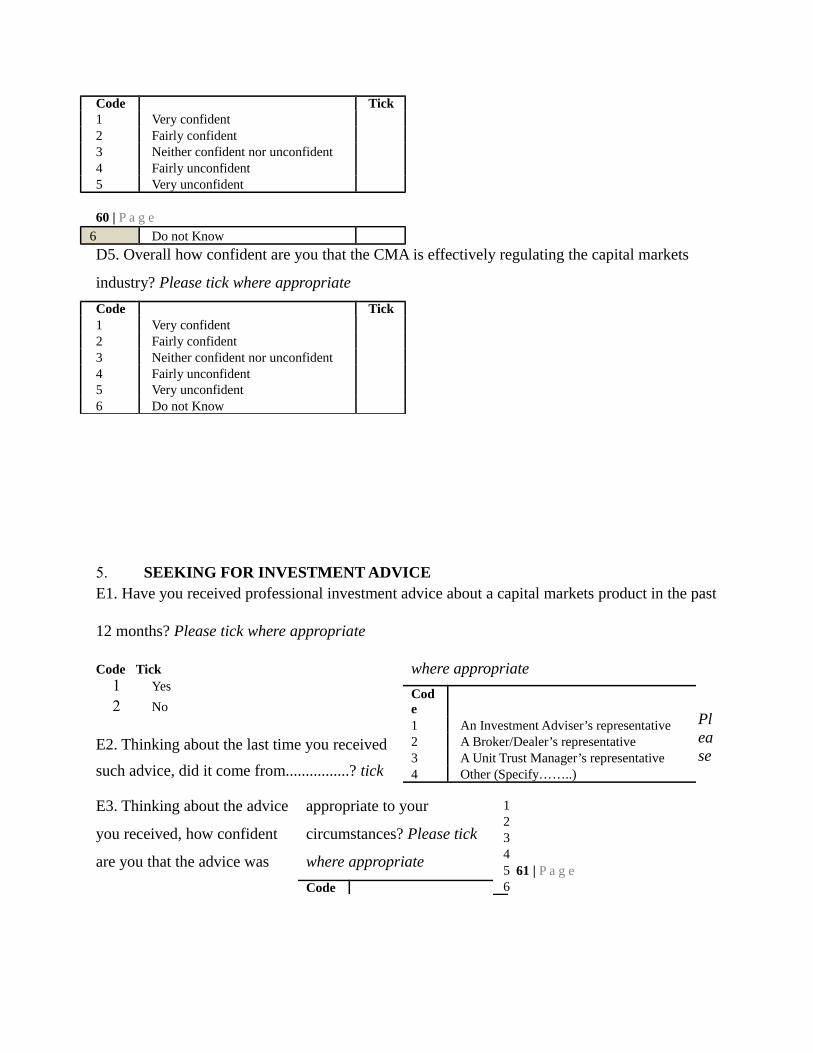
D5. Overall how confident are you that the CMA is effectively regulating the capital markets
industry? Please tick where appropriate
Code Tick1 Very confident2 Fairly confident3 Neither confident nor unconfident4 Fairly unconfident5 Very unconfident6 Do not Know
5. SEEKING FOR INVESTMENT ADVICE E1. Have you received professional investment advice about a capital markets product in the past
12 months? Please tick where appropriate
Code Tick1 Yes
2 No
E2. Thinking about the last time you received
such advice, did it come from................? tick
where appropriate
Code1 An Investment Adviser’s representative2 A Broker/Dealer’s representative3 A Unit Trust Manager’s representative4 Other (Specify……..)
Please
E3. Thinking about the advice
you received, how confident
are you that the advice was
appropriate to your
circumstances? Please tick
where appropriate
Code
123456
61 | P a g e

E4. IN GENERAL, how confident are you that firms licensed to operate in Uganda’s capital markets industry treat their customers fairly? Please tick where appropriate
Code Tick1 Very confident2 Fairly confident3 Neither confident nor unconfident4 Fairly unconfident5 Very unconfident6 Do not Know
62 | P a g e
A.2 Key Informant Guide
CAPITAL MARKETS INVESTORS SURVEY
A SURVEY QUESTIONNAIRE FOR MARKET PARTICIPANTS AND REGULATORCapital Market Authority (CMA) was established by an Act of Parliament in 1996 to regulate
and promote the development of capital markets in Uganda. One of the cornerstones of capital
Markets regulation is investor protection. Therefore if CMA is to adequately protect the investors
in Uganda’s capital markets it needs to fully understand the nature and needs of these investors.
APAS Consultants Ltd has been contracted to carry out a survey determine the needs of investor
so that CMA in turn can make relevant interventions that will make CMA meet it mandate of
protecting the investor.
Capital Market Authority has selected you as an important stakeholder to participate in this
study. In carrying out this study, APAS will interview selected investors in Uganda Securities
Exchange. Your identity will remain anonymous in our reports and your participation is
voluntary although you are encouraged to participate.
TARGET AUDIENCE: TECHNICAL STAFF OF CMA, USE, BROKERS AD MINISTRY OF
FINANCE?1. Do you have any knowledge about capital market in Uganda?
2. If yes, how do they operate?

3. What types of capital markets are you aware of?
4. Who are the prayers of capital markets in Uganda?
5. Do you think there has been growth in capital market?
63 | P a g e
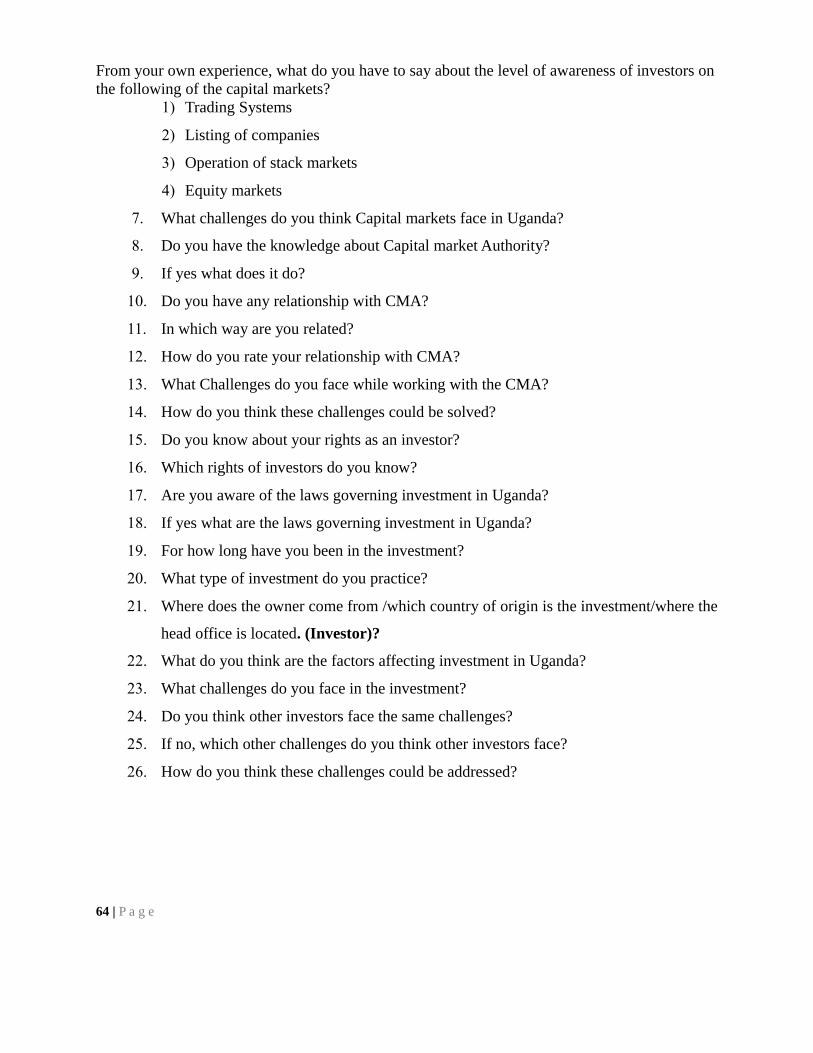
From your own experience, what do you have to say about the level of awareness of investors on the following of the capital markets?
1) Trading Systems
2) Listing of companies
3) Operation of stack markets
4) Equity markets
7. What challenges do you think Capital markets face in Uganda?
8. Do you have the knowledge about Capital market Authority?
9. If yes what does it do?
10. Do you have any relationship with CMA?
11. In which way are you related?
12. How do you rate your relationship with CMA?
13. What Challenges do you face while working with the CMA?
14. How do you think these challenges could be solved?
15. Do you know about your rights as an investor?
16. Which rights of investors do you know?
17. Are you aware of the laws governing investment in Uganda?
18. If yes what are the laws governing investment in Uganda?
19. For how long have you been in the investment?
20. What type of investment do you practice?
21. Where does the owner come from /which country of origin is the investment/where the
head office is located. (Investor)?
22. What do you think are the factors affecting investment in Uganda?
23. What challenges do you face in the investment?
24. Do you think other investors face the same challenges?
25. If no, which other challenges do you think other investors face?
26. How do you think these challenges could be addressed?
64 | P a g e
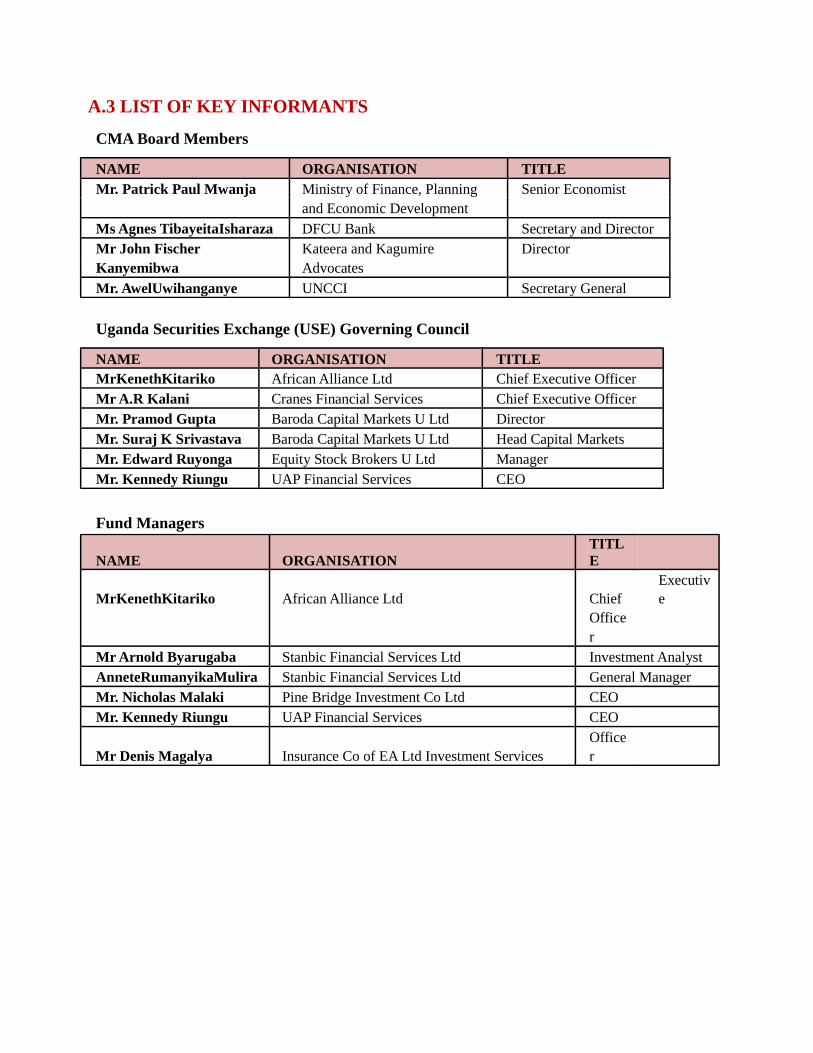
A.3 LIST OF KEY INFORMANTS
CMA Board Members
NAME ORGANISATION TITLEMr. Patrick Paul Mwanja Ministry of Finance, Planning Senior Economist
and Economic Development
Ms Agnes TibayeitaIsharaza DFCU Bank Secretary and DirectorMr John Fischer Kateera and Kagumire DirectorKanyemibwa Advocates
Mr. AwelUwihanganye UNCCI Secretary General
Uganda Securities Exchange (USE) Governing Council
NAME ORGANISATION TITLEMrKenethKitariko African Alliance Ltd Chief Executive OfficerMr A.R Kalani Cranes Financial Services Chief Executive OfficerMr. Pramod Gupta Baroda Capital Markets U Ltd DirectorMr. Suraj K Srivastava Baroda Capital Markets U Ltd Head Capital MarketsMr. Edward Ruyonga Equity Stock Brokers U Ltd ManagerMr. Kennedy Riungu UAP Financial Services CEO
Fund Managers
NAME ORGANISATIONTITLE
MrKenethKitariko African Alliance Ltd ChiefExecutive
Officer
Mr Arnold Byarugaba Stanbic Financial Services Ltd Investment AnalystAnneteRumanyikaMulira Stanbic Financial Services Ltd General ManagerMr. Nicholas Malaki Pine Bridge Investment Co Ltd CEOMr. Kennedy Riungu UAP Financial Services CEO
Mr Denis Magalya Insurance Co of EA Ltd Investment ServicesOfficer

65 | P a g e