Embed Size (px)
Citation preview

Capital Flows to DevelopingEconomies: Implications for Saving and Investment
THE CURRENCY CRISESthat broke out in East Asia in mid-1997 have beenfollowed by more than a year of tumult in international financial markets.These crises have had a serious impact on the emerging market economies,forcing many to raise domestic interest rates so as to stem an outflow offinancial capital and prevent further exchange rate collapse. These inter-est rate increases have, in turn, depressed domestic economic activity.Not surprisingly, this severe financial instability has intensified discussionsabout the benefits and risks to developing economies from allowing capi-tal to flow freely across national borders.1
For many developing countries, the ability to draw upon an interna-tional pool of financial capital offers large potential benefits. Low levels ofcapital per worker in these countries have long held output down. Netforeign resource inflows—current account deficits—can augment privatesaving and help these countries reach higher rates of capital accumulationand growth. Access to international capital markets provides the means tofinance those resource flows. Some types of foreign capital inflows, prin-cipally foreign direct investment (FDI), may also facilitate the transfer of
143
B A R R Y P. B O S W O R T H Brookings Institution
S U S A N M . C O L L I N SBrookings Institution and Georgetown University
We wish to thank Ron Alquist for his invaluable research assistance. We also thankGeorge Akerlof, Marcus Noland, Carmen Reinhart, and Dani Rodrik for comments on ear-lier drafts. Financial support was provided by the Tokyo Club Foundation for GlobalStudies.
1. Cardoso and Dornbusch (1989) and Obstfeld (1999) provide overviews of the acade-mic literature on capital flows to developing countries. Dooley (1996) surveys work oncapital controls. Eichengreen (1999) discusses current policy options.

managerial and technological know-how.2 Portfolio investment and for-eign bank lending are seen as adding to the depth and breadth of domes-tic financial markets. Some proponents have gone on to argue that, byincreasing the rewards for good policies and the penalties for bad poli-cies, the free flow of capital across borders promotes more disciplinedmacroeconomic policies and reduces the frequency of policy errors.3 Bythe mid-1990s, growing support for open financial markets had led someofficials to suggest amending the articles of the International MonetaryFund (IMF) to place capital account convertibility on the same level ofdesirability as a convertible current account.4 Some analysts reason that theobvious benefits of open trade in goods and services create a presumptionof positive net benefits from open cross-border trade in financial instru-ments as well.
On the other hand, opening domestic financial markets to internationaltransactions creates added risks, as evidenced by a string of recent cur-rency crises, particularly in developing countries. These crises have mostoften been blamed on mistaken macroeconomic policies in the affectedcountries, or what are characterized as bad fundamentals. But the recentcrises in Latin America and East Asia, in countries with reasonably suc-cessful policy regimes, have called attention to the inherent instability offinancial markets and the risks that cross-border financial transactionscan pose for countries with relatively unsophisticated financial systemsand weak regulatory oversight. Today’s crises recall the bank runs andfinancial panics that plagued the U.S. financial system in the nineteenthcentury, in the sense that they are triggered by liquidity problems, as coun-tries get caught in a mismatch of maturities between their foreign assetsand liabilities. In addition, international financial transactions involve haz-ards not present in domestic markets, especially the risk of exchange ratechanges. And when markets are stressed, governments are inevitablydrawn in by their commitment to a fixed exchange rate, when one exists, orby the societal consequences of large swings in currency values.
Most of the current policy discussion implicitly accepts the notion thatopen capital markets are highly beneficial, and proposals for reform have
144 Brookings Papers on Economic Activity, 1:1999
2. Recent studies emphasizing the potential role of FDI in raising growth through tech-nological diffusion include Borensztein and others (1998) and Grossman and Helpman(1991, chapters 11 and 12). See also Moran (1998) for a general discussion of FDI.
3. For more discussion of the potential benefits, see Eatwell (1996) and Obstfeld (1998). 4. Fischer and others (1998) provide a useful discussion of this issue.

been directed toward reducing the risks of financial instability and crisesso that capital flows can continue unabated. But few resources have beendevoted to a systematic evaluation of the benefits of open capital markets.The benefits to foreign investors seem quite evident and stem largely fromhigher expected long-term rates of return and opportunities for risk diver-sification. Returns on investments in emerging markets show a low corre-lation with returns on a global index, and they often exhibit low correla-tions with one another as well.5 Much less is known about the benefits tothe economies receiving foreign capital inflows. In particular, little isknown about the extent to which the promise of expanded resources forinvestment and growth has been realized. In part this is due to the inher-ent difficulties in constructing counterfactual outcomes—what would hap-pen in the absence of such inflows.
There is also a severe shortage of historical data. The internationalfinancial market largely disappeared with the outbreak of World War I, andin contrast to the current enthusiasm for the benefits of capital inflows,the postwar reconstruction of the industrial economies was conductedwithin regimes of tight capital controls. Most countries, concerned not somuch with potential instability as with the pressures for currency appre-ciation that capital inflows would bring, prohibited all but direct invest-ment until the mid-1970s. The free international flow of financial capitalbecame feasible only as countries moved away from the Bretton Woodssystem of fixed exchange rates. Until then, countries maintained controlover external financial transactions to allow some freedom for monetarypolicy to address domestic concerns. Even as late as 1980, only six indus-trial countries were judged as having open financial markets: Canada, Ger-many, the Netherlands, Switzerland, the United Kingdom, and the UnitedStates.6 Most financial flows to developing countries, other than directinvestment, took the form of government borrowing from official organi-zations or from commercial banks in the industrial economies. Large-scaleflows of portfolio capital to developing economies are primarily a phe-nomenon of the 1990s.
This study uses regression analysis to evaluate the implications of cap-ital inflows for recipient countries. We examine a panel data set consist-
Barry P. Bosworth and Susan M. Collins 145
5. World Bank (1997, pp. 89–91). From the investor perspective the puzzle is why thereis so little international diversification of portfolios (French and Poterba, 1991).
6. Frankel (1986). However, in earlier years some countries did allow capital inflowsfor specific projects, such as the development of Norway’s oil reserves in the mid-1970s.
ing of balance of payments and domestic investment and saving data infifty-eight developing countries for each of the years 1978–95. We are con-cerned with the uses made of financial capital inflows: do they financeadditional inflows of real resources (a current account deficit), or are theyoffset by compensating financial transactions such as increased reserves orcapital outflows? We also ask, to the extent that there is a resource transfer,how is it divided between increased investment and added consumption?Before addressing these questions, however, we first review recent trendsin the growth of international financial markets and in the extent ofinvolvement of developing countries. We also show the different types ofcapital inflows (FDI, portfolio investment, and other finance) and howthese inflows are allocated among alternative uses in the aggregate.
Recent Trends
Our data on capital flows are drawn largely from the balance of pay-ments files of the IMF. The fifth edition of the IMF’s Balance of PaymentsManualprovides for the separate reporting of financial capital inflows(which add to the receiving country’s liabilities) and outflows (which addto its assets). Both are reported net of repayments.7 One advantage of thesedata for our purposes is that they distinguish among three types of capitalflows: FDI, portfolio investment, and other financial flows (primarily bankloans). This lets us study, for example, whether FDI is “different” fromother inflows.8 A second advantage is that the consistent accounting frame-work enables us to relate capital inflows to other components of the bal-ance of payments: in particular, the current account, capital outflows, andreserve accumulation.9 Foreign aid (bilateral and multilateral) is largely
146 Brookings Papers on Economic Activity, 1:1999
7. IMF (1993).8. Claessens, Dooley, and Warner (1995) argue that FDI is indistinguishable from other
capital flows in terms of its volatility and predictability. Sarno and Taylor (1997), on theother hand, find that FDI is more persistent than other components of capital flows.
9. Although we do not use them in this study, we note that the World Bank has developeda second source of data in its annual Global Development Finance(GDF). That report pro-vides detailed information on the debt stocks of developing countries, but it excludes assettransactions of the balance of payments, and it includes only those financial liabilities thatare denominated in foreign currencies. Thus it includes borrowing in eurocurrency marketsbut excludes bond purchases by foreign investors in the domestic market. The GDF dataare very similar to the balance of payments data in the aggregate, but there are substantialdifferences at the level of individual countries.

classified as a transfer in the balance of payments and excluded from cap-ital inflows, but some forms of concessionary finance are included.
The following identity provides a simplified overview of the differenttypes of transactions in the balance of payments accounts:
(1) 0 = (CA + KA) + FINI + FINO + ERR+ RES,
whereCA = current account balanceKA = capital account balanceFINI = financial inflowsFINO = financial outflowsERR= errors and omissions, andRES= reserves and related items.
As usual, sources of foreign exchange, such as financial inflows andexports, are denoted as positive (credits), whereas uses of foreignexchange, such as financial outflows and imports, are negative (debits).This identity is based on the redesign in the fifth edition of the Balance ofPayments Manual,which unfortunately uses somewhat confusing termi-nology. A newly created category, which primarily includes capital trans-fers and transactions related to the purchase and sale of used equipment, iscalled the capital account. This new account is zero or small for the coun-tries in our sample, and for simplicity we have combined it with the currentaccount. Thus we have a current account, a financial account, and a reserveaccount. What used to be referred to as the capital account now corre-sponds most closely to the sum of the financial account and the reserveaccount. Within this simplified framework, inflows of financial capital canbe set aside as reserves, used to finance current account deficits, or offsetby financial capital outflows.
Most countries have revised their historical accounts to conform to thenew format, and with minor extensions we have been able to put togethera complete data set. The period includes five years prior to the 1982 debtcrisis. Unfortunately, delayed publication of the full balance of paymentsaccounts for some countries made it infeasible to extend the period beyond1995. The sample of countries is drawn from our earlier study that ana-lyzed patterns of economic growth using data on GDP and investment.10
Barry P. Bosworth and Susan M. Collins 147
10. Collins and Bosworth (1996).

The sample (listed in appendix table A1) covers nearly all of Latin Amer-ica and Asia as well as many countries in Africa.11 Singapore, Hong Kong,and Panama are excluded from the analysis because their role as financialcenters involves atypically large capital outflows and inflows and leads tosome double counting of inflows at the regional level. For some purposes,we also include the twenty-three high-income countries of the Organiza-tion for Economic Cooperation and Development (OECD).
As the top panel of figure 1 shows, total international flows of capitalexpanded fourfold between 1978 and 1995. However, this trend is com-pletely dominated by the high-income OECD countries, which receivedabout 85 percent of the total. Furthermore, the nominal increase shownsignificantly overstates the growth in relative importance of these inflows.The bottom panel of figure 1 shows that, as a share of GDP, total capitalinflows and the portion going to industrial countries were roughlyunchanged over the two decades.
A key point that emerges from these data is that the very rapid growthof capital flows to developing countries since 1988 is largely just a recov-ery from the severely depressed flows following the 1982 debt crisis.Flows to developing economies were about the same percentage of theiroutput in 1995 as during 1978–81.12 Furthermore, at 5 percent of GDP,capital inflows to the developing economies in 1995 are about the sameproportion as flows to industrial countries, despite a far less sophisticatedinfrastructure of financial markets and institutions.
Capital flows to developing economies are concentrated among a fewcountries in Asia and Latin America. Five countries (in descending order,China, Mexico, Korea, Thailand, and Brazil) accounted for nearly two-thirds of financial flows to developing countries in the 1990–95 period; theeighteen countries identified as emerging markets by J.P. Morgan & Com-pany accounted for 90 percent of the total.13 It is interesting to ask howtotal flows to developing economies have been used. One might assume
148 Brookings Papers on Economic Activity, 1:1999
11. In 1990 these countries together represented about 95 percent of gross world productexcluding the high-income member countries of the Organization for Economic Coopera-tion and Development (OECD) and the transition economies of Europe and Central Asia.
12. Bank lending to some developing countries, especially in Latin America, grewrapidly between 1973 and 1981, as efforts were made to encourage those countries to gen-erate current account deficits as offsets to the large surpluses of the oil-producing countries.
13. Their list of emerging markets also includes Singapore, which, as already noted, isexcluded from the eighteen. See appendix table A1 for a complete list and appendix table A3for additional information about flows to individual countries.

Barry P. Bosworth and Susan M. Collins 149
Figure 1. Capital Inflows to Industrial and Developing Countries, 1978–95a
Source: IMF (1998b) and authors’ calculations.a. Industrial countries are OECD members since 1978, except Luxembourg. Developing countries are those listed in appendix
table A1 plus Guyana, Mozambique, Nicaragua, Panama, Singapore, Sudan, and Zaire.
1,500
1,000
500
9
8
7
6
5
4
3
2
1
1982 1986 1990 1994
1982 1986 1990 1994
Billions of U.S. dollars
Total
Developingcountries
Industrial countries
Total
Developingcountries
Industrial countries
Percent of GDP

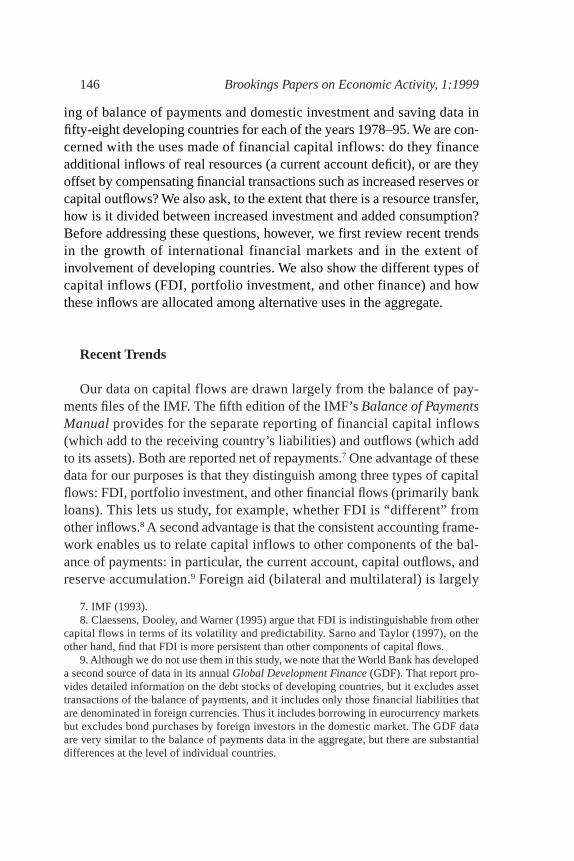
that these flows have financed larger current account deficits, with anemphasis on investment goods, but the actual pattern is more complex.As the bottom part of table 1 shows, only about half of the cumulativeinflows have been associated with increased current account deficits, andthat proportion has declined in the 1990s. Roughly a third of the inflowshave been funneled into reserve assets. The need to hold reserves is a sig-nificant concern in evaluating the net benefits of financial inflows, becausethe return on reserves is typically very low. To offset this low return wouldrequire a high private return on the remaining inflows or substantial netexternalities. In the aggregate, a third of the inflows have been offset byfinancial outflows, but that percentage is strongly influenced by a few largecountries that allow their residents to transfer capital freely. Errors andomissions in the balance of payments are frequently associated with capi-tal flight. Like capital outflows, they were very large in the period after theLatin American debt crisis. Most recently, the errors have been large forChina. Exceptional financing transactions and IMF credits are includedin total reserve accumulation (RESin equation 1).14 Such transactionscould be classified as capital inflows, but because they are frequently asso-ciated with crises, debt forgiveness, and debt restructuring, they are nega-tively correlated with other inflows. During the 1982–89 period, excep-tional financing transactions averaged 116 percent of total capital inflows.
As already noted, the data also enable us to disaggregate total capitalflows into three types: FDI, portfolio capital, and other liabilities (mostlyloans). As the top portion of table 1 shows, the composition of capitalflows to developing countries has shifted significantly toward FDI andaway from loans. The 1990s have also witnessed an explosive growth inportfolio capital (equities and bonds), which was practically nonexistent inprior decades.
The pattern of inflows differs markedly by region (see appendix tableA2). Prior to 1982, bank loans either to governments or to other bankswere the dominant type of international financial transaction in LatinAmerica. After the 1982 crisis, this region largely avoided or could notobtain bank loans and focused instead on repayment and conversion ofthe old loans to marketable equities. Hence more recent net loan activityhas been consistently negative, and growth in capital inflows has instead
150 Brookings Papers on Economic Activity, 1:1999
14. Exceptional financing refers to transactions undertaken by the authorities to financebalance of payments needs, including external borrowing, payment arrears, and debt for-giveness.
been concentrated in FDI and portfolio capital. East Asia experienced aneven more rapid growth in FDI, but lending there remains more impor-tant than portfolio capital. Indeed, Asia accounts for most of the growthin bank loans to developing countries.
Interestingly, the three types of capital inflows (FDI, portfolio invest-ment, and loans) are not significantly correlated with one another over timeor across countries. That is, there is little tendency for countries with largeamounts of portfolio capital or loans to receive correspondingly largeamounts of FDI. China, the largest developing-country recipient of FDIin the 1990s, obtained very little portfolio capital or lending, while Brazil,the largest recipient of portfolio capital among developing countries, actu-ally reduced its reliance on loans and maintained a very restrictive policytoward FDI. The lack of correlation is shown more formally in table 2,the top half of which reports the correlation coefficients for the full set offifty-eight countries and eighteen years. The first set of correlations in eachhalf of the table pools the data and treats all observations as equivalent.The second set averages the data for each country over time and exam-ines the correlations across the fifty-eight country means. The third set
Barry P. Bosworth and Susan M. Collins 151
Table 1. Capital Inflows to Developing Countries by Type and Use, 1978–95a
Units as indicated
Category 1978–95 1978–81 1982–89 1990–95
Billions of U.S. dollarsBy type of inflow
Total 71 68 24 135Foreign direct investment 26 9 13 54Portfolio investment 19 2 2 52Loans 26 57 9 29
Percent of total inflowsBy use of inflow
Current account financing 53 67 88 40Capital outflows 34 17 65 32Reserves and related items 2 6 –75 19
Reserve assets 34 13 46 38IMF creditsb –2 –3 –5 –1Exceptional financingc –30 –5 –116 –18
Errors and omissionsd 11 11 21 9
Source: IMF (1998b) and authors’ calculations.a. Figures are averages for the period. Percentages may not sum to 100 because of rounding. The fifty-eight countries in the
sample are listed in appendix table A1.b. Use of Fund credit and loans. A negative value indicates that a country is a net borrower.c. Transactions undertaken by a country’s authorities to finance balance of payments shortfalls.d. The statistical discrepancy between outflows and inflows as reported by different countries.

subtracts the country-specific effects to focus on the time dimension. Thecorrelations are all low. Indeed, the only statistically significant one (thatbetween FDI and loans in the time dimension) is just 0.09.
The bottom half of the table reports parallel correlations for the subsetof eighteen emerging market countries. By eliminating most of the coun-tries with no portfolio capital inflows, this subsample may be more repre-sentative of countries with active linkages to external financial markets.There is some modest increase in the correlation between portfolio capi-
152 Brookings Papers on Economic Activity, 1:1999
Table 2. Correlations between Types of Financial Flow for Developing Countries, 1978–95a
Foreigndirect Portfolio
Groupingb investment investment Loans
Full samplec
TotalForeign direct investment 1.00Portfolio investment 0.01 1.00Loans 0.00 0.00 1.00
Cross-country correlationsForeign direct investment 1.00Portfolio investment 0.13 1.00Loans 0.16 0.08 1.00
Cross-period correlationsForeign direct investment 1.00Portfolio investment 0.04 1.00Loans 0.09* 0.02 1.00
Emerging marketsd
TotalForeign direct investment 1.00Portfolio investment 0.06 1.00Loans 0.01 0.10 1.00
Cross-country correlationsForeign direct investment 1.00Portfolio investment 0.31 1.00Loans 0.02 0.32 1.00
Cross-period correlationsForeign direct investment 1.00Portfolio investment 0.00 1.00Loans 0.03 0.08 1.00
Source: IMF (1998b) and authors’ calculations.a. An asterisk denotes significance at the 5 percent level.b. See text for descriptions of the correlations.c. The full sample consists of the fifty-eight developing countries listed in appendix table A1 (1,031 observations).d. The emerging markets subsample is taken from Morgan Guaranty’s (1998) list of nineteen emerging markets. Singapore was
excluded because of its role as a money center, leaving 18 countries and 324 observations.

tal and other inflows in the cross-country dimension, but none of the coef-ficients is statistically significant. Perhaps surprisingly, there remains littleevidence of complementarity between different types of capital inflows.
Capital Inflows and the Resource Transfer
For developing economies, the primary benefits of capital inflows arethe opportunities they provide to accelerate economic growth and increasecurrent consumption. Such inflows can raise growth rates by supplement-ing domestic saving, thereby raising the rate of capital accumulation. Theymay also accelerate growth through the transfer of technology and man-agement skills that accompanies direct investment. Alternatively, capitalinflows may be used to raise current consumption, which may reduce sav-ing. Indeed, there is a long-standing interest in the extent to which theresource inflows associated with current account deficits are invested orconsumed.15
In this section we use regression analysis to examine the links amongcapital inflows, investment, and saving in our sample of countries.16
Although our analysis focuses on capital inflows and the two componentsof the identity that define the current account, it is important to reiterate apoint already made: capital inflows need not be associated with a resourcetransfer. Indeed, significant shares of the recent flows to developing coun-tries have been offset by reserve accumulation, capital outflows, or errorsand omissions.
Our work differs from other such empirical studies in one or more of thefollowing dimensions. We recognize that capital inflows are likely to beinfluenced by domestic economic conditions, and we use an instrumentalvariable estimator to allow for this endogeneity. We consider possible dif-ferences among types of inflows and look at both investment and saving.We focus on experiences within countries over time, instead of only on dif-ferences among countries. Finally, our specifications include a variety of
Barry P. Bosworth and Susan M. Collins 153
15. Obstfeld (1998) summarizes this literature, much of which focuses on the implica-tions of foreign aid, which we do not examine here.
16. Other, similar studies have taken a different approach or asked a somewhat differ-ent question. Eatwell (1996) compares investment and growth rates during periods identifiedas having limited versus high international capital mobility. Rodrik (1998) examines theeffects of capital account liberalization, thus focusing on the implications of changes in pol-icy, and not on the implications of capital inflows themselves.

factors likely to influence the shares of GDP devoted to saving and invest-ment, and we allow for unobserved country characteristics.17
Determinants of Investment and Saving
Ideally, we would like to embed the empirical estimates of the effects ofcapital inflows within the framework of a realistic theoretical model. Onepossibility is to rely on a neoclassical model of intertemporal utility max-imization by a representative consumer or planner, subject to the constraintof capital accumulation within a neoclassical production function. For aneconomy with constrained access to international capital markets, foreignresource inflows can be viewed as an income transfer that can be eitherconsumed or invested. Maurice Obstfeld outlines such a model in a recentpaper that extends earlier models of the effects of foreign aid transfers.18 Inthese models a foreign resource inflow is no different from any otherincrease in income. Unless the rate of intertemporal substitution is veryhigh, the representative agent will respond to a permanent resource inflowwith a large increase in consumption. Because the inflow affects income aswell as consumption, saving may rise or fall. If the resource transfer istemporary or takes the form of a loan that must be repaid, the consumptioneffect is somewhat damped, but it is still likely to exceed the effect oninvestment. Within such models, resource inflows may raise utility pri-marily by smoothing consumption rather than by raising investment andlong-run growth.
These utility-based models miss some essential features of foreign cap-ital inflows. The assumption of a single representative agent assumes adegree of capital market development—equalization of lending and bor-rowing rates—that does not exist in most developing economies. Also, for-eign suppliers of credit may not be indifferent to its allocation betweenconsumption and investment. With FDI, the foreign investor is likely toface different investment options than the domestic firm, because of estab-lished links to foreign markets or access to technology. Even in the caseof foreign loans, lenders are likely to require collateral.
154 Brookings Papers on Economic Activity, 1:1999
17. For example, Borensztein and others (1998) and Gruben and McLeod (1998) bothused pooled data sets that do not focus on the time dimension. The first study examines thelinks between FDI and investment and growth but does not adjust for endogeneity. Thesecond uses annual data to study the effects of FDI versus portfolio equity and short- ver-sus long-term capital inflows on saving and growth.
18. Obstfeld (1998). See also Schmidt-Hebbel and Servén (1995) and Eaton (1989).

More disaggregated theoretical models allow for a separation of thedeterminants of investment and saving, with explicit use of interest rates asequilibrating mechanisms. But their extensive data requirements makethese models ill suited for estimation among developing economies.Instead, they have been calibrated to match the major stylized facts andused to simulate policy changes.
We have settled for a less structured approach based on existing empir-ical research on the determinants of investment and saving in developingeconomies. The empirical literature on investment reflects three differingviews of investment behavior. The oldest model, the accelerator theory,emphasizes the proportionality between the stock of capital and output andties investment to the rate of growth of output. Early versions of the neo-classical model expand on the accelerator model by relating the optimalstock of capital to the relative cost of capital as well as the level of out-put. The cost of capital is a function of the price of capital goods, taxes, therate of interest, and depreciation. More recent versions, associated withTobin, Brainard, and others, emphasize the relationship between the mar-ket value of additional investment and its replacement costs, the “mar-ginal” q ratio, as a determinant of investment.19 The use of q is particularlycompatible with the current emphasis on forward-looking rational expec-tations, and with the incorporation of adjustment costs it yields a well-defined investment relationship.
Efforts to validate the q approach with historical data have had limitedsuccess, but its strong theoretical underpinnings have made it popular formacroeconomic simulation models.20 For our purposes, the formulationraises a host of empirical problems: most important, we lack measures ofmarket valuation in developing economies. Most of the empirical studiesthat focus on developing economies have also lacked the measures of taxesand interest rates needed to compute accurate measures of the effectivecost of capital as called for by the neoclassical model.
In practice, nearly all of the empirical research on investment in devel-oping economies has been driven by rather ad hoc approaches that arestrongly influenced by the availability of data. A 1993 World Bank studysurveyed a large number of these studies.21 They find that output growth,
Barry P. Bosworth and Susan M. Collins 155
19. See Lucas (1967), Tobin (1969), and Treadway (1969).20. See, for example, McKibbin and Sachs (1991) and Laxton and others (1998).21. Servén and Solimano (1993).

terms-of-trade improvements, and reductions in external debt all havestrong, positive influences on investment.
A similar dichotomy between theory and empirical analysis arises withrespect to saving. Most of the theoretical literature emphasizes a life-cycle model where consumption is determined by the maximization ofintertemporal utility subject to a wealth constraint: consumption is pro-portionate to the annuitized value of nonhuman and human wealth. Empir-ically, however, there appears to be much less consumption smoothingthan these models predict—or an excessive sensitivity to current incomefluctuations. Furthermore, sustained increases in income growth appearto have a positive effect on saving, rather than the negative relationshipsuggested by the theory. In response, borrowing constraints are often usedto account for the importance of current income. Similarly, the existenceof borrowing constraints in international capital markets is used to arguethat capital inflows will reduce national saving.
A more recent World Bank study surveys many of the empirical analy-ses of saving behavior in developing countries.22 The authors find impor-tant parallels between the determinants of saving and investment: likethose for investment, national saving rates have a robust positive relation-ship with income growth and improvements in the terms of trade. Othervariables that usually have significantly negative effects on saving are cap-ital inflows, external debt, and dependency ratios (the proportion of thepopulation that is old or very young). The results for other variables, suchas the interest rate and financial market depth, tend to be ambiguous.
Our review of these earlier studies of investment and saving leads us toformulate both saving and investment as functions of capital inflows, out-put growth, and changes in the terms of trade. There may be a role foradditional country characteristics, such as external indebtedness and, in thecase of saving, for dependency ratios. However, although these variablesvary considerably across countries, they have limited variation withincountries over time.
ESTIMATION WITH PANEL DATA . Given fifty-eight countries and up toseventeen years, our data set provides us with a total of 972 observations.23
Its panel nature has the important advantage of allowing us to control for
156 Brookings Papers on Economic Activity, 1:1999
22. Loayza, Schmidt-Hebbel, and Servén (1998). See also Masson, Bayoumi, andSamiei (1995).
23. Missing values for some variables and the need to allow for lagged variables reducethe sample size from the full potential of 986 observations.

country-specific effects when estimating investment and saving relation-ships. In contrast, many previous studies have pooled their data acrosscountries and over time, implicitly assuming that country-specific effectsare either absent or uncorrelated with the regressors. It is well known thatsuch correlation will bias coefficient estimates.24 Fixed-effects estimationenables us to focus on relationships within countries over time. As dis-cussed above, this is the dimension of the data set that we wish to empha-size.
Thus we use the following specification:
(2) (I/Y)it = γi + βXit + νit, and(3) (S/Y)it = α i + δXit + εit ,
where i = 1, . . . , 58 and t = 1, . . . , 17; (I/Y) and (S/Y) are the percentagesof GDP devoted to investment and saving, respectively; and Xit denotesseveral explanatory variables that vary across countries and over time.First, we include either the total capital inflow, expressed as a percentageof GDP (FINI/Y), or its three components (FDI/Y, PORT/Y,and LOANS/Y).Second, we include the rate of real GDP growth with one- and two-yearlags (G–1 and G–2). Finally,DTOTis the change in the terms-of-trade index.Country-specific effects are denoted by γi and α i. Given their limited vari-ation over time, other variables such as the age structure of the popula-tion and external indebtedness will be reflected in these terms. The empir-ical analysis measures saving as the sum of investment and the currentaccount balance. Thus the impact of a change in “X” on the real resourcetransfer (the current account deficit) is simply (β – δ).
THE ENDOGENEITY OF CAPITAL INFLOWS. Just as investment and savingmay depend on capital inflows, so too the capital inflow a country receivesis likely to depend on domestic economic activity.25 This two-way inter-action creates an endogeneity that may lead to biased coefficient esti-mates when capital inflows are used as an explanatory variable. However,the direction of this bias is unclear. A domestic shock that raises the returnto capital may increase both capital inflows and investment. This wouldtend to bias the coefficient on capital inflows in an investment equationupward. In contrast, consider a domestic policy change that raises interest
Barry P. Bosworth and Susan M. Collins 157
24. The studies by Borensztein and others (1998) and Gruben and McLeod (1998) bothrelied on pooled data sets.
25. The endogeneity issue is discussed more fully in Dooley, Frankel, and Mathieson(1987).

rates. This may be expected both to increase the flow of capital into thecountry and to reduce domestic investment, tending to induce a negativecorrelation. Similarly, errors in the measurement of capital inflows wouldtend to bias the coefficient estimate downward.
To uncover the effect of capital inflows on saving and investment, weuse instrumental variables to isolate the flows that are related to exogenousfactors. Of particular interest are developments in the global financial mar-kets that alter the pool of capital available to developing countries, sincethese can be interpreted as changes in developing countries’ access to theinternational market. Unlike shocks to domestic demand for capitalinflows, external supply shocks provide an opportunity to identify theunderlying relationships of interest between capital inflows and domesticinvestment and saving.
We turned to the literature on determinants of capital inflows to developour instruments. However, the empirical literature here is limited. Becauseof the difficulty of modeling capital inflows, most macroeconomic simu-lation models specify outcomes in terms of interest rate parity conditionsrather than in terms of the capital flows that are part of the process. Thoseparity conditions may be appropriate for the major industrial economies,but they are of doubtful value for developing countries with their infantfinancial markets. Unfortunately, the interest rate and rate-of-return datathat are critical for a fully articulated model of capital flows are availablefor only a small subset of developing economies and, when available,may be distorted by sharply changing investor perceptions of risk.
We have relied heavily on a study of financial inflows and their deter-minants by Calvo, Leiderman, and Reinhart that documented a major rolefor external factors.26 To measure these factors, their vector autoregres-sive (VAR) analysis extracted the first two principal components of ninemeasures of interest rates and cyclical conditions in the United States.But even their empirical work focused on reserves and real exchange ratesrather than capital inflows per se.
As measures of exogenous external factors to use as instruments, weexperimented with U.S. interest rates and deviations of real U.S. GDPfrom trend, as suggested by Calvo, Leiderman, and Reinhart.27 Althougheach instrument was statistically significant by itself, both were dominatedby a measure of total gross capital flows to the developing economies in
158 Brookings Papers on Economic Activity, 1:1999
26. Calvo, Leiderman, and Reinhart (1993). See also Calvo and Reinhart (1996).27. Calvo, Leiderman, and Reinhart (1993, 1996).

our sample. This variable should reflect a broader range of supply-side fac-tors than just economic conditions in the United States and is largely inde-pendent of economic conditions in any one developing economy.28
Whereas this instrument is identical for each country, our other instru-ments vary across countries. One of these is the IMF indicator of the pres-ence or absence of controls on financial account transactions.29 Additionalinstruments included the change in the terms of trade, the prior year’scapital inflows, and the lagged change in GDP—all variables that areincluded in the equations for saving and investment. Fixed-effects esti-mation was used in our first-stage regressions. As stated above, this pro-cedure enables us to focus on the relatively permanent component of cap-ital inflows and on those inflows associated with changes in externalsupply conditions.
EMPIRICAL RESULTS. We begin by focusing on total financial inflows.Regressions relating those inflows to rates of investment and saving arereported in table 3. The ordinary least-squares (OLS) estimates in the topleft panel show a significant role for financial inflows in both the invest-ment and the saving equations: about 20 percent of the inflow goes intohigher investment, and about 14 percent is reflected in increased con-sumption. On average, 35 percent of the capital inflow is used to financeresource transfers through the current account. This implies a somewhatsmaller diversion of the inflow into other offsetting financial transactionsthan suggested by the decomposition in table 1. As expected, outputgrowth and variations in the terms of trade account for a large proportionof the variation in rates of investment and saving.
The top right panel of table 3 presents the results of instrumental vari-able (IV) estimations using the full sample.30 IV estimation substantiallyincreases the effect of capital inflows on investment: the coefficient risesfrom 0.20 in the OLS regression to 0.52. However, there is no significant
Barry P. Bosworth and Susan M. Collins 159
28. The variable is the cumulative sum of the capital flows divided by the cumulativesum of the GDPs, both expressed in U.S. dollars. There is considerable variation amongcountries in the behavior of investment, saving, and capital inflows. For example, the cor-relation coefficient between the individual-country investment rates and the fifty-eight-country aggregate was only 0.25, and that for capital inflows was 0.20. In any case, the choiceof instruments had little or no significant effect on the results reported in tables 3 and 4.
29. IMF (1998b).30. The first-stage estimates account for 42 percent of the variation in the financial
inflow, with large roles for the aggregate flow to developing countries, the lagged inflow, andthe lagged change in GDP.

Tabl
e 3.
Effe
cts
of A
ggre
gate
Fin
anci
al F
low
s on
Inve
stm
ent,
Sav
ing,
and
the
Cur
rent
Acc
ount
in D
evel
opin
g C
ount
ries,
1979
–95
a
OL
Sre
gre
ssio
ns
Inst
rum
en
tal v
ari
ab
le r
egre
ssio
ns
b
Cu
rre
nt
Cu
rre
nt
Ind
ep
en
de
nt
vari
ab
leIn
vest
me
nt
Sa
vin
ga
cco
un
tc
Inve
stm
en
tS
avi
ng
acc
ou
nt
c
Fu
ll sa
mp
le
Tota
l fin
an
cia
l flow
s0
.20
–0
.14
–0
.35
0.5
2–
0.1
7–
0.6
9(8
.6)
(4.5
)(1
1.2
)(2
.6)
Ch
an
ge
in t
erm
s o
f tr
ad
e0
.01
0.0
70
.05
0.0
10
.07
0.0
5(1
.9)
(6.6
)(2
.0)
(6.6
)
Ch
an
ge
in G
DP
,on
e la
g0
.18
0.1
5–
0.0
20
.12
0.1
60
.04
(7.7
)(4
.9)
(5.1
)(4
.8)
Ch
an
ge
in G
DP
,tw
o la
gs
0.2
00
.21
0.0
10
.18
0.2
10
.03
(8.3
)(6
.4)
(0.0
)(6
.2)
Ad
just
ed
R2
0.7
70
.74
0.7
80
.73
Em
erg
ing
ma
rke
tsTo
tal fi
na
nci
al fl
ows
0.2
7–
0.0
2–
0.2
90
.47
–0
.07
–0
.53
(6.5
)(0
.3)
(5.9
)(0
.7)
Ch
an
ge
in t
erm
s o
f tr
ad
e0
.00
0.0
70
.07
0.0
00
.07
0.0
7(0
.2)
(3.8
)(0
.3)
(3.8
)
Ch
an
ge
in G
DP
,on
e la
g0
.20
0.0
7–
0.1
20
.17
0.0
8–
0.0
9(4
.3)
(1.3
)(3
.6)
(1.4
)
Ch
an
ge
in G
DP
,tw
o la
gs
0.2
30
.16
–0
.07
0.2
1
0.1
7–
0.0
4(5
.0)
(2.7
)(4
.4)
(2.8
)
Ad
just
ed
R2
0.7
40
.68
0.7
40
.68
So
urc
e:A
uth
ors
’reg
ress
ion
s b
ase
d o
n I
MF
(1
99
8a
,19
98
b)
an
d W
orl
d B
an
k (1
99
8).
a.
Reg
ress
ion
s a
re b
ase
d o
n a
nn
ua
l da
ta in
pe
rce
nt
of
GD
P.
Th
e f
ull
sam
ple
an
d t
he
em
erg
ing
ma
rke
ts s
am
ple
are
as
de
scri
be
d in
th
e n
ote
s to
ta
ble
2.
In t
he
fu
ll sa
mp
le,t
he
OL
S r
egre
ssio
ns
con
tain
97
2 o
bse
rva
tion
s a
nd
th
e in
stru
me
nta
l va
ria
ble
reg
ress
ion
s 9
70
. In
th
e e
me
rgin
g m
ark
ets
sa
mp
le,t
he
OL
S r
egre
ssio
ns
con
tain
30
6
ob
serv
atio
ns
an
d t
he
inst
rum
en
tal v
ari
ab
le r
egre
ssio
ns
30
5.
t-st
atis
tics
are
in p
are
nth
ese
s.b.
Th
e f
ollo
win
g v
ari
ab
les
we
re u
sed
as
inst
rum
en
ts:
tota
l in
flow
s to
six
ty-o
ne
dev
elo
pin
g c
ou
ntr
ies;
th
e o
ne
-ye
ar-
lag
ge
d e
nd
og
en
ou
s va
ria
ble
; th
e o
ne
-ye
ar-
lag
ge
d p
erc
en
t ch
an
ge
in G
DP
; th
ech
an
ge
in t
he
te
rms
of
tra
de
; a
nd
a d
um
my
vari
ab
le f
or
wh
eth
er
a c
ou
ntr
y h
ad
ca
pita
l co
ntr
ols
.c.
Co
mp
ute
d a
s sa
vin
g m
inu
s in
vest
me
nt.

change in the saving relationship. Thus the estimated resource transferinduced by a capital inflow increases to 69 percent. The remaining 31percent of the inflow is absorbed by reserve accumulation and capital out-flows. The difference between the IV and the OLS estimates may reflectendogeneity bias, as discussed above.But it could also reflect extreme val-ues in measured capital inflows that are not closely related to investmentand are similar to measurement error. In support of the latter interpretation,the predicted values from the first-stage estimate of capital inflows have anotably smaller variance than the original data.
The results for the subsample of emerging market economies, shownin the lower panels of table 3, are similar to those for the entire sample.OLS estimation yields a positive, and slightly larger, effect of capitalinflows on investment. The impact of foreign inflows on the saving rate,although negative, is small and insignificant. Again, the shift from the OLSto the IV method results in a sharply increased coefficient on financialinflows in the investment equation, but the impact on saving remainsinsignificant. These results for total financial flows are also robust withrespect to other changes in the sample, such as a division of the countriesby region or a focus on the more recent years.
Table 4 presents a more disaggregated model of the relationships, withcapital flows divided into three types: FDI, portfolio investment, and loans.Only the IV results are reported. However, the reported regressions useactual values of portfolio inflows because we were unable to obtain use-ful first-stage estimates for this component. Several points emerge fromthe estimates. First, the results show substantial differences by type in theeffects of capital inflows on investment. FDI has the strongest relationship,with an estimated coefficient close to one. Portfolio inflows have the small-est and least significant relationship, and loans are in between. This find-ing is particularly evident for the emerging market economies that accountfor the bulk of portfolio capital inflows. It, too, is robust to a variety of dif-ferent specifications.
Second, the three types of financial inflows also appear to have sharplydifferent implications for the current account and therefore for saving. Inparticular, we find a strikingly large positive coefficient on FDI on sav-ing.31 Thus FDI has a large positive effect on both investment and saving,implying no net deterioration of the current account. Instead, all of the
Barry P. Bosworth and Susan M. Collins 161
31. Gruben and McLeod (1998) also find a positive effect of FDI on saving.

negative correlation between total capital inflows and the current accountis associated with loans, which raise investment but lower saving. Portfolioinflows have little impact on investment, saving, or the current account andappear to be largely offset by other financial transactions.
162 Brookings Papers on Economic Activity, 1:1999
Table 4. Effects of Disaggregate Financial Flows on Investment, Saving, and theCurrent Account in Developing Countries, 1979–95a
Independent variable Investment Saving Current accountb
Full sampleForeign direct investment 0.81 0.77 –0.05
(4.4) (3.0)
Portfolio investment 0.14 –0.01 –0.16(1.1) (0.1)
Loans 0.50 –0.22 –0.72(10.3) (3.2)
Change in terms of trade 0.01 0.06 0.05(1.9) (6.3)
Change in GDP, one lag 0.11 0.13 0.01(4.7) (3.8)
Change in GDP, two lags 0.17 0.21 0.04(7.0) (6.1)
Adjusted R2 0.78 0.74
Emerging marketsForeign direct investment 0.90 0.87 –0.03
(4.0) (3.1)
Portfolio investment 0.15 –0.17 –0.33(0.9) (0.8)
Loans 0.44 –0.12 –0.56(5.7) (1.3)
Change in terms of trade 0.00 0.07 0.07(0.2) (3.6)
Change in GDP, one lag 0.13 0.05 –0.08(2.6) (0.8)
Change in GDP, two lags 0.20 0.16 –0.04(4.3) (2.7)
Adjusted R2 0.75 0.69
Source: Authors’ regressions based upon IMF (1998a, 1998b) and World Bank (1998).a. Instrumental variable regressions using the following instruments: total inflows to sixty-one developing countries of for-
eign direct investment, portfolio investment, and loans; the one-year-lagged values of foreign direct investment, portfolio invest-ment, and loans; the one-year-lagged percent change in GDP; the change in the terms of trade; and a dummy variable for whethera country had capital controls. The full sample and the emerging markets sample are described in the notes to table 2. In the fullsample, the regressions contain 970 observations, and in the emerging markets sample, the regressions contain 305 observations.t-statistics are in parentheses.
b. Computed as saving minus investment.

However, the strong positive effect of FDI on saving, implying theabsence of any negative effect on the current account balance, is surpris-ing.32 Although the positive impact on saving might be dismissed in thefull sample as a reflection of the imperfect nature of the IV estimation, it isalso evident in the OLS estimates (not shown) for emerging markets. Fur-thermore, we note that the role of FDI is sensitive to the definition of theexternal balance. Additional analysis (not shown) finds that, like loans,FDI inflows have a negative effect on the trade balance for goods and ser-vices. This narrower measure excludes factor income payments and trans-fers.33 The differences between the current account and the trade balanceare less marked for the emerging market sample. It might be argued thatvariations in the impact on the current account are the result of changesin the timing between an inflow of financial capital and the purchase ofreal goods. To explore this possibility, we reestimated the equations intables 3 and 4 using three-year averages. In this triannual data set, there areup to six observations per country, providing 340 observations in the fullsample. The result was little or no change in the parameter estimates. Asbefore, the aggregate capital inflows increase investment and the currentaccount deficit, with no significant effect on saving; in contrast, the dis-aggregated IV equations show large positive effects of FDI on both invest-ment and saving, with no net effect on the current account.34 Loans con-tinue to raise investment and lower saving, thereby accounting for all ofthe negative impact on the current account.
We conclude that although the disaggregated flows are consistentlydifferent in their effects on investment, they do not have stable and pre-dictable differences in their impact on the net external balance and thuson saving. The results may reflect difficulty with obtaining reliable instru-ments for the disaggregated flows, but they are also consistent with theview that the different types of capital flows are fully fungible with oneanother in their financing of an external deficit.
Barry P. Bosworth and Susan M. Collins 163
32. Since the capital inflows are part of an overall balance of payments identity, we canapply the specification of table 4 to the other components: reserve accumulation, capital out-flows, and extraordinary financing.
33. These items are sizable and volatile for many developing countries because factorpayments include interest on foreign debt, and transfers are dominated by foreign aid andremittances from relatives living abroad.
34. The use of three-year averages also allows us to address some of the concerns aboutthe presence of lagged capital flows and lagged GDP in the first-stage estimation. Any prob-lem of autocorrelation is much reduced in the three-year averages.

Concluding Remarks
Our basic conclusions are that a large proportion of capital flows todeveloping countries over the past two decades has been used to financecurrent account deficits, and that this resource transfer is directed primar-ily into investment and not consumption. Our overview of capital flowsreveals that the widely discussed surge in international capital movementsto these countries in the last decade has been less dramatic than oftensuggested. First, the lion’s share of the increase has gone to industrial,not developing, countries, and to a large extent the increase in capital flowsto developing countries since the late 1980s reflects a return to earlierlevels. Flows to these countries as a group amounted to roughly the samepercentage of GDP in the mid-1990s as they had in the late 1970s. Further,capital inflows are highly concentrated among a small number of coun-tries, those frequently labeled the emerging markets of Latin Americaand Asia.
The aggregate figures also mask a significant shift in the composition ofcapital inflows from bank lending toward FDI and portfolio capital. Per-haps surprisingly, we find very little correlation among types of capitalinflows, either across countries or within countries over time. In particular,increased receipts of portfolio capital or bank loans are not associated withincreased inflows of FDI. In the aggregate, about half of the inflows overthe last two decades have been used to finance resource transfers throughlarger current account deficits. Roughly 30 percent of these inflows havebeen used to increase reserves, and a substantial portion has been offset bycapital outflows.
Our regression analysis of the data for individual countries also sug-gests that about half of each dollar of capital inflow translates into anincrease in domestic investment. There is a small negative effect, of mar-ginal statistical significance, on national saving. In combination, the IVestimates for saving and investment suggest a foreign resource transferequal to between 53 and 69 percent of the inflow of financial capital, withthe remainder being diverted into reserve accumulation or capital outflows.
This aggregate result, however, masks significant differences amongtypes of capital inflows. FDI appears to have highly beneficial effects ondomestic investment: indeed, the results suggest a near one-for-one rela-tionship. In contrast, portfolio capital inflows appear to have no dis-cernible impact on investment, and the effect of loans lies between the
164 Brookings Papers on Economic Activity, 1:1999

other two. We are less certain of the differential effect on the currentaccount and saving. In some of the estimates, FDI appears to generatelarge increases in domestic saving, with no negative implications for theexternal balance, but the results were not robust to alternative specifica-tions. Loans have a large negative impact on the current account, but a sig-nificant portion of the corresponding resource inflows is used to augmentconsumption. In this case, it would be useful to distinguish between pub-lic and private sector borrowing—something we have not yet incorporatedinto our data set.
Are these benefits of financial inflows sufficient to offset the evidentrisks of allowing markets to freely allocate capital across the borders ofdeveloping countries? The answer would appear to be a strong yes for FDI.Indeed, FDI has long been viewed as “different,” and most countries haveactively sought such investment through special provisions to permitexchange convertibility and repatriation of funds. However, the currentdebate over capital convertibility is much more focused on portfolio capi-tal, which we find to have a lesser impact on real resource use.
It is probably a mistake to believe that the current momentum towardinternational financial liberalization can or should be reversed. At the sametime, the orderly sequencing of financial liberalization appears to beextremely important: strengthening domestic markets and regulatory over-sight should precede external convertibility. We interpret our results assupporting such a sequenced procedure, because the most useful form ofcapital inflow, FDI, can be accommodated without full capital con-vertibility.
Barry P. Bosworth and Susan M. Collins 165

166 Brookings Papers on Economic Activity, 1:1999
A P P E N D I X
Table A1. Developing Countries in the Full Sample, by Regiona
East Asia Middle East and China* North AfricaIndonesia* AlgeriaKorea* CyprusMalaysia* EgyptPhilippines* IranTaiwan* IsraelThailand* Jordan
MaltaSouth Asia Morocco*Bangladesh TunisiaIndia*Myanmar Latin AmericaPakistan Argentina*Sri Lanka Bolivia
Brazil*Sub-Saharan Africa Chile*Cameroon Colombia*Cote d’Ivoire Costa RicaEthiopia Dominican RepublicGhana Ecuador*Kenya El SalvadorMadagascar GuatemalaMalawi HaitiMali HondurasMauritius JamaicaNigeria Mexico*Rwanda ParaguaySenegal Peru*Sierra Leone Trinidad and TobagoSouth Africa* UruguayTanzania Venezuela*UgandaZambiaZimbabwe
a. Asterisks indicate countries in the eighteen-country emerging markets sample.

Barry P. Bosworth and Susan M. Collins 167
Table A2. Capital Inflows by Region and Type, 1978–95Billions of U.S. dollars
Region 1978–81 1982–89 1990–95
All types
Total 442 578 1,050Industrial countries 374 554 915Developing countries 68 24 135
Latin America 38 –5 47East Asia 16 17 69South Asia 3 6 10Sub-Saharan Africa 5 1 3Middle East and N. Africa 6 5 6
Foreign direct investmentTotal 47 92 205Industrial countries 38 79 151Developing countries 9 13 54
Latin America 6 6 18East Asia 2 5 31South Asia 0 0 1Sub-Saharan Africa 0 1 2Middle East and N. Africa 1 1 2
Portfolio investmentTotal 40 168 470Industrial countries 38 166 418Developing countries 2 2 52
Latin America 2 0 36East Asia 1 2 12South Asia 0 0 2Sub-Saharan Africa 0 0 1Middle East and N. Africa 0 1 2
LoansTotal 355 318 375Industrial countries 299 309 345Developing countries 57 9 29
Latin America 31 –11 –7East Asia 13 11 26South Asia 2 6 7Sub-Saharan Africa 5 1 0Middle East and N. Africa 5 2 3
Source: IMF (1998b) and authors’ calculations.

Tabl
e A
3. C
apita
l Infl
ows
to E
mer
ging
Mar
kets
,197
8–95
Bill
ion
s o
f U
.S.
do
llars
,exc
ep
t a
s in
dic
ate
d
Fore
ign
dire
ct in
vest
me
nt
Po
rtfo
lio in
vest
me
nt
Lo
an
sTo
tal
Co
un
try
19
78
–8
11
98
2–
89
19
90
–9
51
97
8–
81
19
82
–8
91
99
0–
95
19
78
–8
11
98
2–
89
19
90
–9
51
97
8–
81
19
82
–8
91
99
0–
95
Tota
l6
.61
0.5
48
.31
.91
.44
9.8
44
.74
.32
4.7
53
.31
6.1
12
2.8
La
tin A
me
rica
5.2
5.4
16
.31
.5–
0.5
35
.62
8.3
–1
1.2
–6
.63
5.0
–6
.34
5.3
Arg
en
tina
0.5
0.5
3.2
0.4
–0
.38
.01
.4–
1.5
–4
.22
.3–
1.2
7.1
Bra
zil
2.2
1.6
2.2
0.3
–0
.31
3.8
8.4
–6
.4–
5.2
10
.9–
5.1
10
.8C
hile
0.3
0.5
1.5
0.0
0.0
0.5
2.8
–1
.51
.23
.1–
1.0
3.2
Co
lom
bia
0.2
0.5
1.1
0.0
0.0
0.2
1.0
0.9
0.9
1.2
1.5
2.2
Ecu
ad
or
0.1
0.1
0.3
0.0
0.0
0.0
0.9
–1
.0–
0.4
1.0
–0
.90
.0M
exic
o1
.82
.06
.10
.4–
0.1
10
.31
1.4
–0
.63
.71
3.6
1.2
20
.1P
eru
0.1
0.0
1.0
0.0
0.0
0.2
–0
.1–
0.5
–0
.40
.0–
0.5
0.7
Ve
ne
zue
la0
.10
.10
.90
.50
.22
.72
.4–
0.6
–2
.33
.0–
0.3
1.2
Asi
a1
.55
.03
1.4
0.6
2.0
13
.31
4.6
14
.62
9.8
16
.82
1.6
74
.6C
hin
a0
.11
.81
9.4
0.0
0.6
1.5
1.2
2.5
0.8
1.3
5.0
21
.7In
dia
0.0
0.0
0.7
0.0
0.0
1.5
0.7
4.1
3.4
0.7
4.1
5.6
Ind
on
esi
a0
.20
.42
.10
.10
.11
.61
.23
.32
.51
.43
.76
.3K
ore
a0
.10
.51
.00
.10
.26
.04
.8–
0.5
8.6
5.0
0.2
15
.6M
ala
ysia
0.8
0.9
4.2
0.3
0.5
–0
.70
.40
.42
.11
.51
.85
.6P
hili
pp
ine
s0
.00
.30
.90
.00
.10
.82
.50
.52
.62
.60
.84
.4Ta
iwa
n0
.10
.61
.20
.00
.00
.52
.03
.0–
0.1
2.2
3.6
1.6
Th
aila
nd
0.1
0.6
2.0
0.1
0.4
2.1
1.8
1.4
9.8
2.0
2.4
14
.0
Afr
ica
–0
.10
.80
.5–
0.2
–0
.10
.92
.30
.91
.62
.01
.62
.9M
oro
cco
0.0
0.6
0.4
0.0
0.0
0.0
1.6
0.7
0.7
1.6
1.3
1.1
So
uth
Afr
ica
–0
.10
.10
.1–
0.2
–0
.10
.80
.70
.20
.90
.40
.21
.8

Me
mo
ran
da
:A
ll co
un
trie
s in
the
sa
mp
lea8
.91
3.1
53
.72
.12
.25
2.0
56
.59
.02
9.3
67
.62
4.4
13
5.0
Em
erg
ing
ma
rke
tsa
s p
erc
en
t o
f co
un
trie
s in
sa
mp
le7
3.9
79
.68
9.8
89
.96
0.4
95
.77
9.2
47
.98
4.5
78
.86
6.1
90
.9S
am
ple
co
un
trie
sp
lus
OE
CDb
46
.79
2.5
20
5.1
40
.01
67
.84
70
.03
55
.03
18
.03
74
.54
41
.75
78
.31
,04
9.6
So
urc
e:I
MF
(1
99
8b
) a
nd
Mo
rga
n G
ua
ran
ty E
con
om
ic R
ese
arc
h (
19
98
).a
.T
he
fift
y-e
igh
t co
un
trie
s in
ta
ble
A1
plu
s G
uya
na
,Mo
zam
biq
ue
,an
d N
ica
rag
ua
.b.
Th
e s
ixty
-on
e c
ou
ntr
ies
in n
ote
a p
lus
twe
nty
-th
ree
OE
CD
cou
ntr
ies.

170
Comment and Discussion
Carmen M. Reinhart: Capital flows to developing countries have beenthe subject of much discussion in recent years, in both academic and pol-icy circles. In the early 1990s much of the discussion focused on the wel-come resurgence of capital inflows to emerging markets after a decade dur-ing which many of these countries had limited, if any, access tointernational capital markets. The Mexican peso crisis in late 1994, theAsian crises in 1997–98, the Russian default in 1998, and Brazil’s currentwoes have, however, shifted the tone of the discussion. Fickle portfolioflows and short-term bank loans have come to be widely perceived as asource of instability.
The literature of the 1990s on capital flows to emerging markets fallsinto four broad categories. The early literature attempted to examine thecauses of these inflows. It was widely debated whether inflows were drivenby “push” factors, such as interest rates and the stage of the business cyclein the United States, or by “pull” factors, which were largely taken to beprivatization, structural reform, and inflation stabilization in the capital-importing countries. The majority of researchers concluded that externalfactors mattered a great deal.1 A second, very large body of literature con-sidered the policy challenges posed by a surge in capital inflows. Thesestudies discussed the relative merits of a menu of policy responses to cap-ital inflows, ranging from selective capital controls (a topic to which Iwill return) to changes in exchange rate policy. A third, rather slim strandof analysis focused on the behavioral characteristics of different types of
1. Dooley, Fernandez-Arias, and Kletzer (1994) find the strongest effect for external fac-tors among researchers who have studied this issue.

Barry P. Bosworth and Susan M. Collins 171
capital flows. The questions posed by these studies included the following:Does foreign direct investment (FDI) behave differently from portfolioflows? Are short-term flows more volatile and subject to sudden reversals?The answers to these questions have been mixed. The fourth category,taking the causes of the flows as given, turned its attention toward gaugingtheir effects on the recipient countries. More often than not, these studiesexamined the link between foreign saving (the source of capital inflows)and domestic saving.2
The paper by Bosworth and Collins is a welcome contribution to thecapital flows literature in that it merges the issues raised in the last twostrands in the literature. On the one hand, the handful of papers that haveexamined the effects of capital flows on saving or growth in the capital-importing countries make little or no distinction among the various typesof flows. On the other, the literature on behavioral differences has largelyignored the effects of capital flows on capital accumulation. If the receivedwisdom is correct and there are important behavioral differences acrosstypes of flows, then their effects on economic activity, such as saving andinvestment, are also likely to differ. This is the central issue investigatedin this paper.
The paper begins with an overview of recent trends in capital flows toemerging markets. Along the way the authors examine capital inflows bytype and use; they note that a substantial share of these inflows has beenfunneled into reserve accumulation, and that an equally large share foundits way back out of the country. Neither of these observations should beparticularly surprising. As regards outflows, the recent string of currencycrises in emerging markets reminds us that international capital is volatileand prone to drastic reversals. Yesterday’s inflows often become today’soutflows. To illustrate with a recent example, in 1996 Thailand had a sur-plus in its capital account amounting to over 10 percent of GDP, yet oneyear later it ran a capital account deficit of 15 percent of GDP. That is a26 percent swing in the course of a year—probably a record.
Similarly, it is not surprising that over a third of inflows to emergingmarkets financed the buildup of foreign currency reserves in the centralbank, in light of the fact that very few developing countries allow their cur-
2. See Reinhart and Talvi (1998) for a recent review of this literature, as well as forevidence from Asia and Latin America on the relationship between domestic and foreignsaving.

172 Brookings Papers on Economic Activity, 1:1999
rencies to float freely. Indeed, the most common policy response to capitalinflows in the earlier part of this decade was sterilized intervention. Theauthorities intervened in the foreign exchange market to stem the cur-rency appreciation associated with capital inflows and sold bonds in thedomestic market to offset the monetary consequences of that intervention.
What is both surprising and interesting in the descriptive statistics pre-sented in this paper is the extent to which different types of inflows showlittle correlation with one another. Although this kind of correlation analy-sis may face some limitations, particularly as regards portfolio flows(which are a phenomenon of the 1990s), these low correlations in a senseanticipate one of the paper’s later results, namely, that not all capital flowsare created equal. Low correlations may well arise if different types of cap-ital flows respond to different factors. Montiel and Reinhart also presentevidence in that regard.3 Among the findings in that paper is that portfolioflows, particularly to Latin America, are extremely sensitive to the levelof international interest rates, whereas FDI flows are little affected by suchconsiderations. Hence these two types of inflows need not covary.
In their regression analyses of the impact of capital flows on savingand investment, the authors pool their cross-country and time-series dataand, allowing for fixed effects, estimate a variety of reduced-form specifi-cations, while recognizing that the capital inflow measures themselvesare likely to be endogenous. After experimenting with various external(U.S.) variables, the authors settle on total gross capital flows to develop-ing countries as the preferred instrument. This choice is not altogether sur-prising. As several studies have shown, U.S. interest rates have historicallyinfluenced capital flows, particularly to Latin America. Private capitalflows to Asia, on the other hand, have tended to respond more to Japaneseinterest rates than to U.S. interest rates.4 This observation would have sim-ply argued for the inclusion of both interest rates in the vector of instru-ments. Yet the full “push” story of the 1990s also had to do with an exo-genous, “latent” variable from the vantage point of emerging markets,namely, regulatory changes in the United States and Europe that made iteasier for emerging markets to place equity and debt instruments in inter-national capital markets.5 Hence total capital flows to developing countries
3. Montiel and Reinhart (forthcoming).4. See Montiel and Reinhart (forthcoming).5. See El-Erian (1992).
Barry P. Bosworth and Susan M. Collins 173
may be the “catch-all” that incorporates these unobservable variables,while from the vantage point of an individual country it is still exogenous.
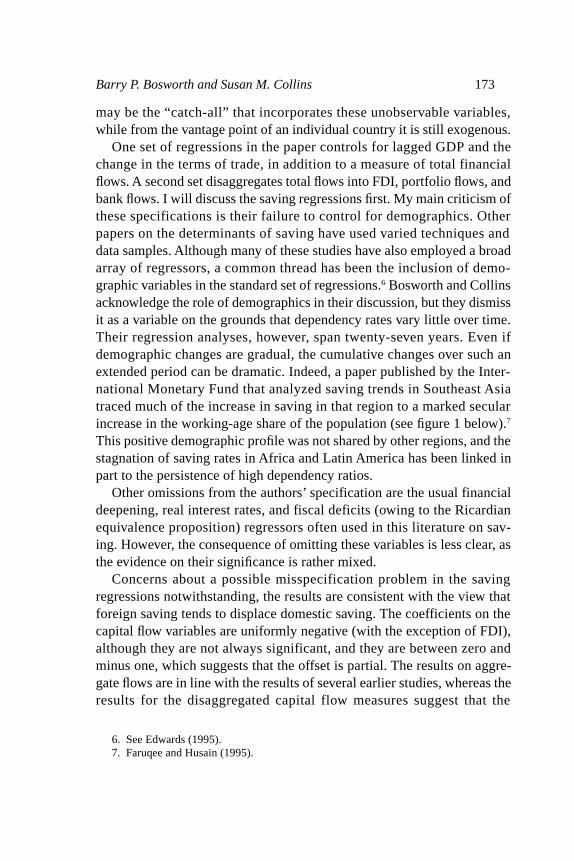
One set of regressions in the paper controls for lagged GDP and thechange in the terms of trade, in addition to a measure of total financialflows. A second set disaggregates total flows into FDI, portfolio flows, andbank flows. I will discuss the saving regressions first. My main criticism ofthese specifications is their failure to control for demographics. Otherpapers on the determinants of saving have used varied techniques anddata samples. Although many of these studies have also employed a broadarray of regressors, a common thread has been the inclusion of demo-graphic variables in the standard set of regressions.6 Bosworth and Collinsacknowledge the role of demographics in their discussion, but they dismissit as a variable on the grounds that dependency rates vary little over time.Their regression analyses, however, span twenty-seven years. Even ifdemographic changes are gradual, the cumulative changes over such anextended period can be dramatic. Indeed, a paper published by the Inter-national Monetary Fund that analyzed saving trends in Southeast Asiatraced much of the increase in saving in that region to a marked secularincrease in the working-age share of the population (see figure 1 below).7
This positive demographic profile was not shared by other regions, and thestagnation of saving rates in Africa and Latin America has been linked inpart to the persistence of high dependency ratios.
Other omissions from the authors’ specification are the usual financialdeepening, real interest rates, and fiscal deficits (owing to the Ricardianequivalence proposition) regressors often used in this literature on sav-ing. However, the consequence of omitting these variables is less clear, asthe evidence on their significance is rather mixed.
Concerns about a possible misspecification problem in the savingregressions notwithstanding, the results are consistent with the view thatforeign saving tends to displace domestic saving. The coefficients on thecapital flow variables are uniformly negative (with the exception of FDI),although they are not always significant, and they are between zero andminus one, which suggests that the offset is partial. The results on aggre-gate flows are in line with the results of several earlier studies, whereas theresults for the disaggregated capital flow measures suggest that the
6. See Edwards (1995).7. Faruqee and Husain (1995).

174 Brookings Papers on Economic Activity, 1:1999
8. See Kaminsky and Reinhart (forthcoming).
Figure 1. Working-Age Population in Four Southeast Asian Countries, 1970–92
Percent of total population
Singapore
Malaysia
Thailand
Indonesia
70
65
60
55
1990198819861984198219801978197619741972
Source: Faruqee and Husain (1995). Reprinted with permission of the International Monetary Fund.
strongest negative link comes from bank loans, at least for the full sampleof countries. This is quite interesting and intuitively appealing in light ofthe household consumption and saving story stressed in Obstfeld (1998)and discussed in this paper. If foreign banks lend to banks in emergingmarkets, households may find themselves with access to credit that waspreviously denied them. Indeed, booms in consumer loans have often char-acterized capital inflow episodes.8 The result that FDI increases saving issomewhat puzzling and much harder to interpret on theoretical grounds,nor does the paper offer any explanation for it. Perhaps future researchshould aim at studying a more disaggregated measure of saving that dis-entangles corporate from household saving.
Turning to the investment regressions, the main result that emerges isthat FDI shows the strongest link to aggregate investment, with a coeffi-

Barry P. Bosworth and Susan M. Collins 175
cient close to one. Bank flows are also positively linked to investment,although the coefficient of this variable is about half of that of FDI; thereis little evidence that portfolio flows have any effect on investment. Again,I would place less weight on the role of portfolio flows, given their briefhistory in developing countries. On the basis of these results, one isinclined to believe that FDI is the “preferred” type of flow for promotinggrowth. This, of course, assumes that the investment projects being under-taken are productive. As the recent Asian crises have revealed, that is notalways the case. I will return to this issue later.
Although their results on investment have a clear intuitive appeal, Iwould urge the authors to extend their analysis of the links between invest-ment and capital flows and to examine the role of capital flow volatilityon investment. Such an exercise can be easily justified on theoreticalgrounds, as recent models of investment have stressed the role of uncer-tainty.9 Uncertainty, in this case as regards the continued availability offinance, may be a powerful deterrent to the undertaking of investment inprojects that take time to come to fruition.
As table 1 highlights, reversals in capital flows can be drastic. Further-more, the evidence from many of the recent crises suggests that FDI hasbeen more resilient than portfolio and other types of flows. Decomposingvarious types of capital flows into their stochastic trend (permanent) andcyclical and irregular (temporary) components, Sarno and Taylor find evi-dence that FDI has a higher permanent component than other types offlows.10 Taking these observations together, some proxy for volatility, suchas the change in capital flows from one year to the next, or their varianceover a moving narrow window over the sample (say, five to seven years),may be worth investigating for its link to investment.
On the regressions of the current account and the trade balance I havelittle to say. An accounting identity tells us that capital inflows eitherfinance a current account deficit or add to reserve accumulation, so thenegative coefficients on all the capital flow variables are hardly surprising.What is puzzling is that the relationship between FDI and the currentaccount (and, perhaps more surprisingly, the trade balance) is so impreciseso as to render the coefficient statistically insignificant. No obvious expla-nations for this result come to mind.
9. Dixit and Pyndick (1994).10. Sarno and Taylor (forthcoming).

176 Brookings Papers on Economic Activity, 1:1999
Finally, let me turn to some of the policy implications raised by thisanalysis. This paper has suggested that the implications of a capital inflowfor saving and investment depend importantly on the nature of that inflow.FDI is strongly linked to aggregate investment and appears not to dis-place domestic saving (although I am puzzled as to why it should increasesaving). Bank flows have a smaller impact on investment and, at least forthe full sample, are negatively related to domestic saving. Portfolio flowsseem to matter little for either saving or investment. Evidence from otherstudies suggests that portfolio and bank flows are more prone than FDI tosudden reversals. Taken together with those findings, the evidence pre-sented here not only suggests, as the authors note, that there may be goodreasons for selective liberalization of the capital account. It also suggestsan equally plausible rationale for the taxation of short-term and portfolioflows along the lines adopted. If we add to these arguments the fact thathigh levels of short-term debt exacerbated the recent crises, the case fordiscouraging short-term capital flows, whether in the form of bank loans orof bonds, is that much more convincing.
General discussion:Much of the discussion centered around the difficul-ties of interpretation created by the endogeneity of capital flows and thepossibility of reverse causation. William Brainard noted, for example, thata rise in the profitability of investment would, by increasing the demandfor foreign capital, contribute to a positive coefficient on capital flows in theinvestment equations. In this case the coefficient should not be interpretedas indicating the effect of capital flows on investment. He noted thatBosworth and Collins had dealt with this issue by looking for variablesthat would be associated with the supply of capital to developing countries
Table 1. Selected Large Reversals in Net Private Capital Flows to Developing CountriesPercent of GDP
Country and date of episode Reversal
Argentina, 1982–83 20.0Argentina, 1993–94 4.0Mexico, 1981–83 12.0Mexico, 1993–95 6.0Venezuela, 1992–94 9.0Thailand, 1996–98 26.0
Source: International Monetary Fund,World Economic Outlook, various issues.

and using them as instruments in their first-stage regression for capitalflows. They had reported that the U.S. short-term interest rate—a proxyfor shocks to the supply of capital, which Carmen Reinhart and her coau-thors had used as an instrument in explaining capital flows to Latin Amer-ica—had not worked well. Therefore they had chosen total capital inflowsto all developing countries as an instrument for explaining the inflows toparticular countries. Brainard, while agreeing with the authors that exoge-nous shocks to the supply of capital are likely to be correlated across thesample of countries, observed that the same could be true for the demandfor capital. A positive correlation across countries of the shocks to invest-ment demand—shocks that country by country affect the demand for capi-tal flows—implies that the errors in any particular country’s investmentequation are correlated with the capital flows of other countries and hencewith total capital flows. Therefore the use of total capital flows as an instru-ment would not remove the bias in the coefficient estimates, and indeedwould not necessarily improve on the ordinary least-squares regression.
Jeffrey Frankel was also skeptical of the use of total capital flows as aninstrument in individual-country equations and suggested that U.S. inter-est rates are probably the best candidate for an instrument that is bothexogenous to the country demands and plausibly related to the supply ofcapital. Both Frankel and Reinhart stressed that developing countries arehighly sensitive to changes in U.S. interest rates—which are the strongestexplanatory variable for explaining crises in developing countries. GeorgePerry, however, queried whether the role of interest rates in crises, whichwould be especially important for countries that have large dollar debtsoutstanding, was relevant to the phenomena the authors were analyzing.He doubted that, in noncrisis times, a modest change in the U.S. rate wouldmake much difference to decisions to invest abroad, since it would beswamped by large risk factors. Frankel did not disagree but wonderedwhether the exogenous movements in total capital flows as used by theauthors might not also be contaminated by the crisis episodes.
Laurence Ball questioned the use of lagged capital flows and laggedGDP as instruments, given the likely serial correlation of errors. However,Bosworth noted that both measures are much more volatile in developingthan in developed countries, so that serial correlation was likely to be lessof a problem. He also reported that the first-stage coefficient on the lagwas very small, typically about 0.25. When the lagged dependent variablewas left out of the first-stage regressions, the only change was a worse fit.
Barry P. Bosworth and Susan M. Collins 177

178 Brookings Papers on Economic Activity, 1:1999
References
Borensztein, E., J. De Gregorio, and J.-W. Lee. 1998. “How Does Foreign DirectInvestment Affect Growth?”Journal of International Economics45(1): 115–35.
Calvo, Guillermo A., Leonardo Leiderman, and Carmen M. Reinhart. 1993. “Cap-ital Inflows to Latin America: The Role of External Factors.”IMF Staff Papers40(1): 108–51.
______. 1996. “Inflows of Capital to Developing Countries in the 1990s.”Jour-nal of Economic Perspectives10(2): 123–39.
Calvo, Sara, and Carmen M. Reinhart. 1996. “Capital Flows to Latin America: IsThere Evidence of Contagion Effects?” In Private Capital Flows to EmergingMarkets After the Mexican Crisis, edited by Guillermo Calvo, Morris Goldstein,and Eduard Hochreiter. Washington: Institute for International Economics andVienna: Austrian National Bank.
Cardoso, Eliana A., and Rudiger Dornbusch. 1989. “Foreign Private CapitalFlows.” In Handbook of Development Economics,vol. 2, edited by H. Cheneryand T. N. Srinivasan. Amsterdam: North Holland.
Claessens, Stijn, Michael P. Dooley, and Andrew Warner. 1995. “Portfolio Capi-tal Flows: Hot or Cold?”World Bank Economic Review9(1): 153–74.
Collins, Susan M., and Barry Bosworth. 1996. “Economic Growth in East Asia:Accumulation versus Assimilation.”BPEA, 2:1996,135–203.
Dixit, Avinash, and Robert Pyndick. 1994. Investment Under Uncertainty. Prince-ton University Press.
Dooley, Michael P. 1996. “A Survey of Literature on Controls over InternationalCapital Transactions.”IMF Staff Papers43(4): 639–87.
Dooley, Michael P., Jeffrey Frankel, and Donald J. Mathieson. 1987. “InternationalCapital Mobility: What Do Saving-Investment Correlations Tell Us?”IMF StaffPapers34(3): 503–30.
Dooley, Michael P., Eduardo Fernandez-Arias, and Kenneth M. Kletzer. 1994.“Recent Private Capital Inflows to Developing Countries: Is the Debt Crisis His-tory?” Working Paper 4792. Cambridge, Mass.: National Bureau of EconomicResearch (July).
Eaton, Jonathan. 1989. “Foreign Public Capital Flows.” InHandbook of Devel-opment Economics,vol. 2, edited by H. Chenery and T. N. Srinivasan. Amster-dam: North Holland.
Eatwell, John. 1996. “International Financial Liberalization: The Impact on WorldDevelopment.” UNDP Discussion Paper (September). New York: UnitedNations Development Programme.
Edwards, Sebastian. 1995. “Why are Saving Rates So Different Across Countries?An International Comparative Analysis.” Working Paper 5097. Cambridge,Mass.: National Bureau of Economic Research (April).
Eichengreen, Barry. 1999. Toward a New International Financial Architecture: APractical Post-Asia Agenda. Washington: Institute for International Economics.

Barry P. Bosworth and Susan M. Collins 179
El-Erian, M. A. 1992. “Restoration of Access to Voluntary Capital Market Financ-ing.” IMF Staff Papers39(1): 175–94.
Faruqee, H., and A. Husain. 1995. “Saving Trends in Southeast Asia: A Cross-Country Analysis.” Working Paper WP/95/39. Washington: International Mon-etary Fund (April).
Fischer, Stanley, and others. 1998. Should the IMF Pursue Capital-account Con-vertibility? Essays in International Finance 207. Department of Economics,Princeton University (May).
Frankel, Jeffrey. 1986. “International Capital Mobility and Crowding-out in theU.S. Economy: Imperfect Integration of Financial Markets or of Goods Mar-kets?” In How Open Is the U.S. Economy?edited by R. W. Hafer. Lexington,Mass.: Lexington Books.
French, Kenneth, and James Poterba. 1991. “Investor Diversification and Interna-tional Equity Markets.”American Economic Review81(2): 222–26.
Grossman, Gene M., and Elhanan Helpman. 1991. Innovation and Growth in theGlobal Economy. MIT Press.
Gruben, William C., and Darryl McLeod. 1998. “Capital Flows, Savings, and Growthin the 1990s.”Quarterly Review of Economics and Finance38(3): 287–301.
International Monetary Fund. 1993. Balance of Payments Manual,5th edition.Washington.
______. 1998a. Exchange Arrangements and Exchange Restrictions, AnnualReport.Washington.
______. 1998b. International Financial Statistics. CD-ROM edition. Washington.Kaminsky, Graciela L., and Carmen M. Reinhart. Forthcoming. “The Twin Crises:
The Causes of Banking and Balance of Payments Problems.”American Eco-nomic Review.
Laxton, Douglas, and others. 1998. Multimod Mark II: The Core Dynamics andSteady-State Models. Occasional Paper 164. Washington: International Mone-tary Fund (May).
Loayza, Norman, Klaus Schmidt-Hebbel, and Luis Servén. 1998. “What DrivesSaving Across the World?” Paper prepared for a World Bank conference on“Saving Across the World.” Washington, September.
Lucas, Robert E., Jr. 1967. “Adjustment Costs and the Theory of Supply.”Jour-nal of Political Economy75(4, part 1): 321–34.
Masson, Paul R., Tamin Bayoumi, and Hossein Samiei. 1995. “Saving Behavior inIndustrial and Developing Countries.”Staff Studies for the World Economic Out-look. Washington: International Monetary Fund (September).
McKibbin, Warwick J., and Jeffrey D. Sachs. 1991. Global Linkages: Macroeco-nomic Interdependence and Cooperation in the World Economy. Brookings.
Montiel, Peter, and Carmen M. Reinhart. Forthcoming. “The Dynamics of Capi-tal Movements to Emerging Economies During the 1990s.” InShort-Term Cap-

180 Brookings Papers on Economic Activity, 1:1999
ital Movements and Balance of Payments Crises,edited by Stephany Griffith-Jones and Manuel Montes. Oxford University Press.
Moran, Theodore. 1998. Foreign Direct Investment and Development: The NewPolicy Agenda for Developing Countries and Economies in Transition. Wash-ington: Institute for International Economics.
Morgan Guaranty Economic Research. 1998. Emerging Markets: Economic Indi-cators. New York.
Obstfeld, Maurice. 1998. “The Global Capital Market: Benefactor or Menace?”Working Paper 6559. Cambridge, Mass.: National Bureau of EconomicResearch (May).
______. 1999. “Foreign Resource Inflows, Saving, and Growth.” In The Econom-ics of Saving and Growth: Theory, Evidence and Implications for Policy,editedby K. Schmidt-Hebbel and L. Servén. Washington: World Bank and CambridgeUniversity Press (forthcoming).
Reinhart, Carmen M., and Ernesto Talvi. 1998. “Capital Flows and Saving in LatinAmerica and Asia: A Reinterpretation.”Journal of Development Economics57(1): 45–66.
Rodrik, Dani. 1998. “Who Needs Capital-account Convertibility?” In StanleyFischer and others,Should the IMF Pursue Capital-account Convertibility?Essays in International Finance 207. Princeton, N.J.: International FinanceSection, Princeton University (May).
Sarno, Lucio, and Mark P. Taylor. 1997. “Hot Money, Accounting Labels and thePersistence of Capital Flows to Developing Countries: An Empirical Investiga-tion.” Working Paper 97–07. Twickenham, U.K.: Brunel University.
______. Forthcoming. “The Persistence of Capital Inflows and the Behavior ofStock Prices in East Asian Emerging Markets: Some Empirical Evidence.”Jour-nal of International Money and Finance(August).
Schmidt-Hebbel, Klaus, and Luis Servén. 1995. “Dynamic Response to ExternalShocks in Classical and Keynesian Economies.” In North-South Linkages andInternational Macroeconomic Policy, edited by David Currie and David Vines.Cambridge University Press.
Servén, Luis, and Andres Solimano, eds. 1993. Striving for Growth After Adjust-ment: The Role of Capital Formation. Washington: World Bank.
Tobin, James. 1969. “A General Equilibrium Approach to Monetary Theory.”Journal of Money, Credit, and Banking1(1): 15–29.
Treadway, Arthur B. 1969. “On Rational Entrepreneurial Behavior and theDemand for Investment.”Review of Economic Studies36(1): 227–39.
World Bank. 1997. Private Capital Flows to Developing Countries. World BankPolicy Research Report. Washington: World Bank.
______. 1998. World Development Indicators 1998. CD-ROM edition. Washington.