Embed Size (px)
Citation preview

1 7 3 7 C A M B R I D G E S T R E E T • C A M B R I D G E , M A 0 2 1 3 8 • T E L 6 1 7. 4 9 5 . 4 4 2 0 • F A X 6 1 7. 4 9 5 . 8 2 9 2 pub l i cat ions@wcf ia .harvard .edu • ht tp : //www.wcf ia .harvard .edu
Work ing Paper Ser ies
No. 06-03
“Capital Flows and Capital Goods”
by Laura Alfaro and Eliza Hammel
Capital Flows and Capital Goods
by Laura Alfaro and Eliza Hammel
Paper No. 06-03
March 2006 About the Authors:
Laura Alfaro is associate professor at the Harvard Business School and faculty associate at the Weatherhead Center. Email: [email protected]. Eliza Hammel is a Ph.D. candidate at the Harvard Business School.

Published by the Weatherhead Center for International Affairs, Harvard University. Copyright by the author. The author bears sole responsibility for this paper. The views expressed here are those of the author and do not necessarily represent the views of the WCFIA or Harvard University. Publications Chair, Weatherhead Center for International Affairs Robert Paarlberg Director of Publications, Weatherhead Center for International Affairs Amanda Pearson Submission procedures: Weatherhead Center affiliates are encouraged to submit papers to the Working Paper Series. Manuscripts are assessed on the basis of their scholarly qualities—the extent of original research, the rigor of the analysis, the significance of the conclusions—as well as their relevance to contemporary issues in international affairs. Manuscripts should range between 25 and 80 double-spaced pages and must include an abstract of no more than 150 words. Authors should submit their paper as an e-mail attachment in a standard word processing application (Microsoft Word or Word Perfect) to the Publications Department at [email protected]. Orders: Working Papers are available for $7.00 each, plus $1.00 for shipping and handling, from the Publications Office, 1737 Cambridge Street, Cambridge, MA 02138.
WEATHERHEAD CENTER FOR INTERNATIONAL AFFAIRS HARVARD UNIVERSITY
1737 CAMBRIDGE STREET CAMBRIDGE, MA 02138
TEL: 617-495-4420 FAX: 617-495-8292
www.wcfia.harvard.edu

Abstract
We examine one of the channels through which international financial integration can
help promote growth. We study the relation between equity market liberalization and
imports of capital goods. For the period 1980-1997, we find that, after controlling for
other macroeconomic policies and fundamentals, stock market liberalization is associated
with a significant increase in the share and variety of imports of machinery and
equipment. We hypothesize this can be attributed to the consequences of financial
integration, which allows access to foreign capital, and provide evidence consistent with
this channel. Hence, we find that increased access to international capital allows countries
to enjoy the benefits embodied in international capital goods.
Acknowledgements
We thank Rawi Abdelal, Joshua Aizenman, Pol Antras, Richard Cooper, James
Costantini, Rafael Di Tella, Elhanan Helpman, Lakshmi Iyer, Marc Melitz, Gara
Minguez-Afonso, Ken Rogoff, Jeremy Stein, Catherine Thomas, Carlos Végh, Stanley
Watt, Eric Werker and seminar participants at the IMF Research Department seminar,
Harvard’s International Brown Bag Lunch, the Universidade de São Paulo Seminar
Series, the Syracuse University seminar, the 3rd Infiniti Conference, the Global Finance
Conference, the XIII Foro de Finanzas, and the New York Federal Reserve seminar for
valuable comments and suggestions. We are grateful to Geert Bekaert for kindly
providing us with the Growth Opportunities data.
JEL Classification: E22, F15, F21, F40, G15. Key words: capital account liberalization, stock market liberalization, trade liberalization, capital goods, equipment imports, international technology diffusion.
Introduction
There is an intense debate in academic and policy circles over the merits of international
financial integration. On the one hand, there are a number of channels through which financial
integration can promote economic growth. With access to foreign resources, for example,
developing countries with little domestic capital can borrow to finance productive investment
without having to increase savings. Financial integration can also facilitate international risk
sharing, lowering the cost of capital for many developing countries. However, in the presence of
pre-existing distortions and weak institutional settings, international capital mobility can
potentially exacerbate the misallocation of capital, increase the likelihood of financial crises, and
impair growth.
Fueling this debate is the mixed empirical evidence on whether financial integration
contributes to growth.1 A closer look at the evidence, however, indicates that the measurement of
international financial integration and its direct linkages to growth are complicated. Even in the
best of circumstances, the many factors that influence GDP growth and the importance of the
local institutional setting make it difficult to pinpoint the effects of capital account liberalization.
Given the difficulty in demonstrating direct links to growth, several recent papers study
the different mechanisms through which international financial integration can lead to faster
growth.2 In this spirit, we aim to contribute to the debate by exploring one of these mechanisms.
In particular, we examine whether liberalization episodes lead to more imports of capital goods.
By lowering the cost of capital and increasing the financial resources available to an economy,
1 Surveying the literature, Prasad, Rogoff, Wei, and Kose (2003) overview fourteen of the most recent studies on whether financial integration contributes to growth. The authors conclude that the literature does not seem to find a robust significant effect of financial integration on economic growth. See also Edison, Klein, Ricci, and Slok (2002). 2 Bekaert and Harvery (2000) and Henry (2000), for example, use an event study approach and find that stock market liberalization in emerging markets leads to a lower cost of capital. In addition, a recent set of micro papers explores how capital controls have generated specific distortions in individual countries. See Forbes (2004) for an overview of this literature.
[2] Weatherhead Center for International Affairs
financial integration should spur productive investment and, crucially, machinery and equipment
investment. By improving access to foreign technological advancements, the increasing share of
capital goods imports can enhance the competitiveness and efficiency of these liberalizing
countries beyond the effect of increased investment, thus driving key ingredients to economic
growth.
We make a distinction among different forms of capital account liberalization, paying
particular attention to the effects of stock market liberalization. Because countries tend to impose
an array of price and quantity controls on financial transactions, the broad measures of the degree
of financial integration used in the cross-country regressions of typical empirical studies may not
consistently measure the severity of such restrictions across countries. While establishing the date
of equity market liberalization is difficult, the timing of such changes may be easier to determine
precisely than a broader measure of capital account liberalization. An additional advantage is that
liberalization dates facilitate the comparison of within country changes following a sizable
discrete jump in capital account openness. Despite the difficulty in dating liberalization episodes,
researchers have obtained robust results when using this approach.3
We look at a broad sample of 25 machine importing countries that liberalized their equity
markets in the period between 1980 and 1997 and analyze if this discrete change led to an
increase in capital goods imports. Figure 1 illustrates our results, presenting the sample average of
machine imports as a percent of total imports and of GDP during the sample period, where 0
corresponds to the year in which the stock market was liberalized.4 As Figure 1 suggests, there is
an increase in capital imports to total imports as well as capital imports to GDP following the
liberalization of equity markets.
3 See Bekaert and Harvey (2000), Chari and Henry (2004), and Henry (April, October 2000). 4 Note that different countries liberalized at different points and that the graph does not control for other reforms. See the data appendix for a description of the data and a list of countries.
Alfaro/Hammel [3]
Our regression analysis shows that equity liberalization episodes are followed by both an
increase in the share of capital goods imports to total imports of 6% and an increase in the share
of total machine imports to GDP of 12% in our preferred estimations. We also find a significant
increase in the variety of capital goods imported. We hypothesize that these effects can be
attributed to two consequences of financial integration. On the one hand, increased financial
integration allows for increased access to foreign capital, thus providing additional resources to
import more capital goods. Indeed, our evidence suggests that equity market liberalizations are
followed by an increase in the financial resources available to the country and these resources are
associated with greater imports of capital goods. At the same time, there is significant evidence
that stock market liberalizations lead to a reduction in the liberalizing country’s cost of capital.5
Our results are consistent with the prediction that financial integration increases the ability of
firms to take advantage of profitable investment opportunities. Thus, it appears that with
increased financial integration, firms begin to increasingly invest in imported machinery and
equipment. These results are robust to controlling for other reforms, policies and fundamentals,
including trade, world business cycles, and exogenous forward looking growth opportunities.6
We focus on imports of capital goods because of their effect both on the quantity and
quality of investment. First, consider the basic relations among the capital account, savings,
investment, and net imports. One way in which international capital flows can affect growth is if
the country uses the increased resources provided by international financial markets to buy more
productive capital goods, rather than more consumption goods or increased reserves. Following
an increase in access to financial capital, importing machinery and equipment is an immediate
5 Bekaert and Harvey (2000) and Henry (2000). 6 Note that a positive correlation between international financial integration and the share of capital goods cannot simply be interpreted as causal because of concerns related to omitted variables or policy endogeneity (policy makers may have liberalized in anticipation of favorable conditions). Institutional change is never exogenous (see Rodrik, 2005). However, we are more confident of interpreting our results as casual given that, as mentioned, we perform a series of robustness tests mitigating the concern that results are driven by potential omitted variables and mechanisms consistent with such interpretation are supported by our empirical evidence. See sections 3.4 and 3.5 for further discussion.
[4] Weatherhead Center for International Affairs
mechanism to increase investment. Moreover, by increasing liquidity and opportunities for risk
sharing, increased foreign funds may lower the cost of capital and thus increase investment by
firms.7
Besides their quantity effect on investment, by transmitting the benefits of technological
advances across borders, imports of capital goods may have additional benefits to an economy.8
As DeLong (2004) notes, there is an expectation following capital account liberalization “that
developing countries and industries would enjoy the benefits from technology advances and from
learning-by-doing using modern machinery.” Technological advances, in the form of world
production of capital equipment and world R&D activity, are highly concentrated in a small
number of countries. Most other countries, in particular developing countries, import the bulk of
their machinery and equipment.9 Thus, while only a few countries do much R&D, the benefits
may spread around the world through exports of capital goods that embody new technology. In
other words, imported machinery may be a crucial mechanism through which knowledge
spillovers are transmitted across borders.10 In this vein, researchers have also explored the role of
imported machinery in stimulating growth through increasing export competitiveness.11 These
effects may be reflected in both the quantity and the number of varieties of capital goods
imported. While we focus mainly on quantity, we also explore the extent to which the number of
7 See Bekaert and Harvey (2000), and Henry (April, October 2000). 8 See Eaton and Kortum (2001) for a model linking imports of capital goods to productivity gains. See also Caselli and Wilson (2003). 9 Eaton and Kortum (2001) document these facts. 10 The work by Grossman and Helpman (1991), Coe and Helpman (1995), Coe, Helpman, and Hoffmaister (1997), and Caselli and Coleman (2000) relate international trade to technology diffusion. In particular, Coe, Helpman, and Hoffmaister (1997) show that total factor productivity in developing countries depends positively both on machinery imports from industrial countries and on the interaction between machinery imports and the stock of foreign R&D. Mody and Yilmaz’s (2002) work suggests that innovative effort based on imported technologies can be a precursor to the development of domestic innovation capabilities. See Keller (2004) for a review of the literature on international knowledge spillovers. 11 See Lee (1994) and Mody and Yilmaz (2002).
Alfaro/Hammel [5]
imported varieties rises, as the degree to which firms have access to specialized equipment may
have important benefits to their productivity.12
Critically, the fact that developing countries tend to import the bulk of their machinery
and equipment from a small group of R&D intensive exporters suggests that imports of capital
goods are an adequate proxy for a certain type of equipment investment.13 As such, with machine
imports as a proxy, we emphasize capital goods, allowing us to focus on the effect of
liberalization on productive investment. One view in the literature following the Mexico and East
Asian crises, for example, was that the capital flowing into such countries after liberalization was
squandered on real estate booms and other unproductive activities instead of growth enhancing
investments.14 Hence, one central issue is not just whether savings are channeled towards
investment, as DeLong and Summers (1991) note; it is also important “whether the savings are
efficiently used to ‘buy’ appropriate equipment.”
Why would capital goods provide a better measure for productive investment than
aggregate investment statistics? A central reason relates to the composition of the national
accounts investment data. Broadly speaking, investment can be divided into residential structures
and business investment, which can be further divided into machinery and business structures.
Investment data that include structures are a relatively noisy measure of productive investment.
These include residential structures, which are more accurately classified as consumption, and
business structures that can often reflect price increases as well as non-productive firm
12 Technological advancement has been modeled in the literature as an expansion in the number of varieties of goods, capturing the notion that the degree of specialized intermediate goods available increases a firm’s productivity, see Grossman and Helpman (1991). 13 See DeLong and Summers (1993) and Caselli and Wilson (2003). 14 See Corsetti, Pesenti and Roubini (1999). Indeed, the argument that capital inflows are unlikely to contribute to long term economic growth if they are not used to finance productive investment has been made for developed countries as well. Bernanke (2005) argues: “Much of the recent capital inflow into the developed world has shown up in higher rates of home construction and in higher home prices… However, in the long run, productivity gains are more likely to be driven by nonresidential investment, such as business purchases of new machines.”
[6] Weatherhead Center for International Affairs
“consumption.”15 Ideally we would use data only on business investment. However, it is difficult
to find comparable long-term data across countries. As a result, data on machinery and equipment
investment arguably provide a better proxy for true productive investment than national accounts
investment statistics. At the same time, equipment investment may have higher social returns than
other forms of investment. For example, historical accounts of economic growth assign a central
role to mechanization; only in recent years has growth in the most advanced economies been
driven by growth in the service sector. In part due to these issues, researchers have found that the
strong positive relationship between investment rates and growth is driven primarily through
machinery and equipment investment.16 Again, while this work complements the research on the
real effects of stock market liberalization by providing a more refined measure of productive
investment, it also investigates a new channel through which international capital mobility can
contribute to growth beyond its effect on investment.17
Combining these strands of literature, our basic hypothesis is that following capital
account liberalization, one direct mechanism for capital flows to increase growth is to finance
productive investment. Again, while imports of consumption goods can have positive welfare
effects, our view is that the effect of such imports on growth is, at best, indirect. Moreover,
imports of capital goods can affect growth not only through an increase in productive investment
but can also positively affect the efficiency with which resources are used in the economy (TFP).
Based on these arguments, we ask this simple question: does capital account liberalization lead to
15 They may be, for example, lavish offices that perhaps should be deemed managerial perks rather than firm investment or several forms of “conspicuous investment” that are simply a disguised form of consumption. More generally, the building of new structures for investment tends to be dominated by domestic production of non-tradables. We hypothesize that additional machines are a necessary complement to the new structures for these to lead to a further increase in output. 16 Underlying the importance of machinery investment as a source of economic growth, DeLong and Summers (1991, 1992, 1993) provide quantitative evidence in support of the view that the accumulation of machinery, more than the other components of investment, is a prime determinant of national rates of productivity growth. Jorgenson (1988) finds substantial complementarities between equipment investment and TFP. Caselli and Wilson (2003) find the composition of capital investment to account for large part of the observed differences of TFP across countries. See Blomstrom, Lipsey and Zejan (1996) for an alternative view. 17 See Henry (October 2000) and references therein.
Alfaro/Hammel [7]
more imports of capital goods? Section 2 presents the data. Section 3 analyzes the effects of
liberalization on imports of capital goods. Section 4 concludes the paper.
Section 2: Data
Machinery and Equipment Data
We use data on imports of machinery and equipment for several reasons. First,
comparable long-term direct measures of production and trade in capital equipment are not
available across countries.18 Second, the majority of world’s capital goods are provided by a
small number of R&D intensive countries, and most countries, in particular developing countries,
tend to import a large fraction of their capital goods. Hence, imports of capital goods are a good
proxy for the type of equipment investment that transfers the benefits of advanced technology
across borders.19 Import data on capital goods were taken from the World Trade Flows, 1980-
1997 database, compiled by Statistics Canada, which recompiles UN trade data classified by
Standard Industrial Trade Class (SITC) Revision 2. It includes bilateral trade flows reported in
U.S. dollars for a wide range of countries from 1980 to 1997 at the four digit level.20 The SITC
codes are matched to U.S. Bureau of Economic Analysis (BEA) codes for 34 manufacturing
sectors. We associate capital equipment with the non-electrical equipment, electrical equipment,
18 The United Nations International Comparison Project (UNICP) collects data on three components of producers’ durables (producer transportation equipment, electrical machinery, and non-electrical machinery). However, the data is collected from national accounts and is not available on a yearly basis. For example, the most recent benchmark year with estimates of machinery and equipment expenditures is 1996, with data for 115 countries. For non-benchmark years, data is inferred using regressions on benchmark data. 19 As Eaton and Kortum (2001) point out, there is nevertheless a strong bias towards domestic producers in some countries. See their paper for a comparison of machine imports and local production. 20 A single value is reported for each year, country pair, and industry code. In other words, exports from country A to country B are valued the same as imports to country B from country A. As a result, the data will tend to report a lower value of imports compared to what is reported by the importing countries, which include transport costs (c.i.f.). Conversely, exports tend to be reported higher than what is reported by exporting countries, which exclude these costs (f.o.b.). Consequently, net exports will tend to be biased upwards for all countries. Comparisons between the imports data reported in the World Trade Flows and the national income accounts should be then taken with caution.

[8] Weatherhead Center for International Affairs
and instruments industries.21 We define equipment trade as the sum of BEA industry codes 20-27
and 33 (Farm and Garden Machinery, Construction, Mining, etc.; Computer and Office
Equipment; Other Non-Electric Machinery; Electronic Components; Other Electrical Machinery;
and Instruments and Apparatus). Data Appendix I explains all data in detail.22
In the regression analysis, we exclude the eleven major machine exporters. As major
producers of machinery and equipment, imports of capital goods to these countries cannot serve
as a proxy for capital goods investment. Following Eaton and Kortum (2001), the United States,
the United Kingdom, Japan, Germany, France, Sweden, and Italy fall in this category. We also
exclude the Netherlands, Switzerland, and Canada, which are among the top ten exporters in most
of our sample years and often export more than the seven countries previously mentioned. We
treat South Korea as a machine exporter, which entered the top ten countries in more than one
third of the 18 years. These eleven countries represent over 70% of world machine exports in a
given year. Finally, we exclude Hong Kong and Singapore, which as entrepôts present special
problems for using imports as a proxy for productive investment. In total, we exclude 13
countries. In practice, this leads to dropping only South Korea from regressions of countries that
liberalized within the sample period.23
We use as dependent variables both the percentage of capital goods imports to GDP and
also the percentage of capital goods imports to total imports. We use log values of these variables
in our regression analysis. Total imports were taken from World Trade Flows. GDP data were
taken from World Bank Development Indicators. Both are measured in current U.S. dollars. In
Appendix A, we also test for the effects on the number of varieties of capital goods imports. The
number of 4-digit SIC codes measures the varieties of total and machine imports.
21 We follow Eaton and Kortum (2001). See also DeLong and Summers (1991) for a similar treatment. 22 Whereas the dataset attempts to capture trade between all pairs of countries, in practice, not all countries are available. For example, some report trade data jointly with other countries. When combined with the World Bank data; trade and GDP data is available for 148 countries. 23 Results are robust to including South Korea in the sample.
Alfaro/Hammel [9]
Capital Account Liberalization Data
A key issue in constructing estimates associated with a country’s initial opening up of the
capital markets lies in the complicated task of establishing the date of liberalization.24 The process
of international financial integration—that is, the change in the degree to which a country’s
government restricts cross-border financial transactions—is complex and involves multiple
phases. Markets may be liberalized gradually, or reforms can be anticipated so the effects are
smoothed.25 As a result, it is hard to find an exact “liberalization date.” At the same time, de jure
liberalization dates might not reflect the de facto liberalization process. These dates are based on
the stated changes in official rules, which may not reflect reality in terms of what is happening to
openness to foreign capital. If one part of the system is liberalized, investors may use it to
circumvent other controls; for example, they may invest in American Depository Receipts
(ADRs) even when direct share purchases are not permitted. Other reforms may not be credible,
or countries may not have access to foreign capital despite being officially open. For measuring
the effect on investment, both capital account and capital market liberalization could be
important. All these factors contribute to the difficulty of choosing a single liberalization date.
These complications notwithstanding, researchers have found robust results using this
methodology. Nevertheless, to address some of these issues, we focus on stock market
liberalization for reasons discussed below. We use yearly data to minimize the effects of small
timing errors. We also perform several robustness tests.
Stock Market Liberalization Dates
Equity market liberalization is a specific type of capital account liberalization in which a
country’s government allows foreigners to purchase shares in the domestic equity market. We
focus on this narrow definition of capital account openness for several reasons. Equity market
24 See Bekaert, Harvey and Lumsdaine (1998) and Edison, et al. (2002) for a discussion of these issues. 25 Anticipation and gradualness should bias our results away from finding an effect.
[10] Weatherhead Center for International Affairs
liberalizations are relatively easier to establish than broader capital account liberalization and are
much more easily comparable across countries.26 Moreover, the discrete jump in openness
provides enough of a change in order to be able to isolate its effects.
Henry (2000), Bekaert and Harvey (2000) and Bekaert, Harvey, and Lundblad (2005)
(henceforth BHL, for data purposes) have constructed data on equity market liberalization.27. In
order to construct the dates for the opening of the equity markets to foreigners, Henry (2000) uses
information from various sources and defines a country’s first stock market liberalization as the
first month with a verifiable occurrence of a liberalization by policy decree, the establishment of
the first country fund, or a 10% increase in the IFC Investability Index.28 These dates are
available for only 12 countries. Bekaert and Harvey (2000) and Bekaert, Harvey, and Lundblad
(2005) develop three sets of equity market liberalization dates. These include the “official
liberalization date” which coincides with regulatory changes that mark the period when the equity
markets are opened to foreigners and often coincides with the IFC liberalization date. The data is
available for 95 countries. The authors also provide data on the year the first closed-end country
fund was introduced as well as on the year of the first American Depository Receipt (ADR)
issue.29
In our main analysis, we use the BHL “official liberalization dates” because of the larger
sample size.30 In the robustness section, we also use the equity market liberalization dates
26 Moreover, the access to contingent liabilities following equity market liberalizations is arguably more likely to have a direct effect on the cost of capital and firms’ investment decisions than financial opening to non-contingent liabilities such as bank loans which in emerging markets are usually intermediated through a poorly regulated financial system. See Henry and Lorentzen (2003) and Obstfeld and Taylor (2004). 27 Data in Bekaert, Harvey, and Lundblad (2005) is based on Bekaert and Harvey (2000). 28 The Investability Index is the ratio of the stock market capitalization of the portion of stocks that foreigners may legally hold to total market capitalization. 29 A closed-end country fund is an investment company that invests in a portfolio of assets in a foreign country and issues a fixed number of shares domestically. ADRs are rights to foreign shares that are traded in U.S. dollars on a U.S. Exchange or over-the-counter. 30 Edison and Warnock (2001) construct a measure of restrictions on foreign ownership of domestic equities that focuses on the intensity of controls. The initial relaxation of controls shown by the Edison and Warnock (2001) index corresponds closely to the BHL liberalization dates.
Alfaro/Hammel [11]
constructed by Henry (2000).31 We also use dates for the introduction of the first closed-end
country fund and for the first ADR issue as additional robustness checks. These two indicators are
each available for 14 countries.32 When looking at financial liberalization, we focus mostly on
developing countries. However, we include countries such as Greece, Portugal, and Spain, which
integrated into the global capital markets in the late 1980s and early 1990s as part of the process
of joining the European Union. The final dataset with the official date of liberalization presented
in Bekaert, Harvey, and Lundblad (2005) includes 95 countries, 25 of which liberalized between
1980 and 1997 and are included in our sample 33 Data Appendix II lists all the countries included
in the BHL data set. Data Appendix III presents the liberalization dates for the countries that
liberalized in the sample period. Most dates are clustered around the late eighties and nineties, but
overall there is variation within the sample.
IMF Capital Account Index
As a proxy for a government’s restrictions on capital flows and international financial
transactions, the literature commonly uses an index based on the International Monetary Fund’s
(IMF) Annual Report on Exchange Arrangements and Exchange Restriction (AREAER). The
index uses data from four different restrictions (multiple exchange arrangements, payments
restrictions on current transactions, payments restrictions on capital transactions, and repatriation
requirements for export proceeds). A corresponding dummy variable takes the value of 1 if each
of the restrictions is present in each country each year. We use this measure as a broader capital
31 The liberalization dates in Henry (2000) are somewhat earlier than those of Bekaert, Harvey, and Lundblad (2005) for some emerging markets, in particular those for which country funds existed in the mid 1980s. 32 The original sample included 16 countries. We dropped Taiwan, which had no trade data, and South Korea, which as explained above, we treat as a machine exporter. 33 BHL have 95 countries in their sample, 27 of which liberalized between 1980 and 1997. As mentioned, we exclude the 13 major machine exporters and the two entrepôts. In addition, Belgium is excluded because the trade data is reported with Luxembourg. Botswana, Swaziland, and Lesotho are also excluded because there are no individual trade data reported for these countries. See the data appendix for a detailed list of the countries included in each sample. These exclusions result in South Korea and Taiwan being excluded from the 27 liberalized country sample leaving 25 countries for our sub-sample regressions.
[12] Weatherhead Center for International Affairs
account indicator. In order for our IMF indicator to fall between 0 and 1 and increase with
openness, our measure is the negative of the average of the four dummy variables for each
country. Note, however, that this measure does not control for the fact that legal restrictions are
sometimes circumvented. In addition, the way the IMF index is constructed results in a general
indicator that distinguishes varying intensities of capital restrictions in a very limited way.34
Other Reforms, Policies, and Control Variables
Since we focus on imports of capital goods, we control for the role of trade liberalization.
Our main trade liberalization dates comes from Wacziarg and Welch (2003) (henceforth WW, for
data purposes). The authors update the Sachs and Warner (1995) (henceforth SW, for data
purposes) database of trade liberalization indicators. Sachs and Warner (1995) define a country as
closed if one of the following is true: average tariff rates are 40% or more, non-tariff barriers
cover 40% or more of trade, a black market exchange rate exists and is depreciated by on average
20% or more relative to the official exchange rate, the state holds a monopoly on major exports,
or there is a socialist economic system.35 Sachs and Warner (1995) define a liberalization date
based on these criteria but also on a detailed study of country case studies. They verified that
when only a few of the criteria changed, the liberalization date indeed reflected broader trade
liberalization. Wacziarg and Welch (2003) review these liberalization dates and update them for
34 See Edwards (2001) for criticisms of this index. Quinn (1997) improves the IMF restriction measure by reading through the IMF’s narrative descriptions of capital account restrictions and assigning scores of the intensity of capital restrictions. Unfortunately, this measure is only available for intermittent years for some countries, and as a result we do not use this indicator. 35 Ideally we would like a measure of trade liberalization of capital goods. However, it is difficult to find time series measures that are consistent across countries and incorporate both tariff and non-tariff barriers to capital goods imports. More generally, Anderson and van Wincoop (2004) survey the literature on trade costs and write: “Economists new to the analysis of international trade are always shocked at the poor quality of direct measures of the policy barriers to trade…[I]t is natural to assume that trade policy is well documented…[y]et the seemingly simple question ‘how high are policy barriers to trade?’ cannot usually be answered with accuracy for most goods in most countries at most dates. The inaccuracy arises from three sources: absence of data, data which are useful only in combination with other missing or fragmentary data, and aggregation bias.”
Alfaro/Hammel [13]
the 1990s. Their dates broadly match those provided by Sachs and Warner (1995).36 There are
141 countries in their sample. By updating the SW dataset, they identified 18 countries that
liberalized between 1995 and 2001, and found 25 that were closed as of 2001. In their sample, 66
countries liberalized between 1980 and 1997.
As additional robustness checks, we control for other macroeconomic variables to ensure
that these are not driving the results. In particular, we control for the level of inflation and terms
of trade. We also control for the level of financial development and use the ratio of private credit
as a percentage of GDP as a proxy variable. To control for growth in the local economy, we use
both lagged growth and deviation from trend growth. As an additional variable to control for the
world business cycle, we use growth in high-income countries as defined by the World Bank and
real interest rates in the U.S. We take private credit by deposit banks as a percent of GDP from
the Beck, Demirguc-Kunt, and Levine (2001) Financial Structure Database. All other variables
were taken from the World Bank’s World Development Indicators.
Finally, we control for exogenous growth opportunities following Bekaert, Harvey, and
Lundblad (2005). As such, these authors calculate a measure of a country's forward-looking
growth opportunities based on a country’s industrial structure, which is plausibly exogenous at
the time of liberalization. First, for each industry at the 3-digit SIC code level, they calculate the
global price-to-earnings (PE) ratio for all countries. Then, they calculate a country-specific
measure of these growth opportunities, measured by the average the industry PE ratios weighted
by the industry’s share in the local economy, adjusted by world growth opportunities.37 As the
authors explain, this measure captures a country’s growth opportunities that are plausibly
exogenous to any of the countries that liberalized in the 1980s and 1990s. Their measure predicts
growth and thus is a good measure of growth opportunities, but does not predict liberalization 36 Their liberalization dates are different for only four countries: India, Estonia, Croatia, and Belarus. Of these, only India is also in our sample. WW define India as closed through the entire 1990s due to the notable presence of non-tariff barriers. 37 The authors use weights both on value added in industrial production and stock market valuations. They find the results are broadly similar using the different categorizations.

[14] Weatherhead Center for International Affairs
episodes and so is more likely to be truly exogenous. This variable provides an additional
robustness check for possible endogeneity related to omitted variables affecting both growth and
our LHS variables.
Capital Flows and Stock Market Indicators
We take data for equity flows as a percent of GDP and market turnover as a percent of
GDP from the World Development Indicators. We take new equity issues as a percent of GDP
and market capitalization as a percent of GDP from the Beck, Demirguc-Kunt, and Levine (2001)
Financial Structure Database. Increased liquidity drives down transactions costs and could have
a direct effect on a firm’s cost of capital. New equity issues, equity inflows, and increased market
value all improve a firm’s ability to invest, and as such would be expected to have a positive
impact on machinery imports. Out of our sample of 25 countries, market capitalization data is
available for all 25 countries, equity flows are available for 20 countries, and new equity issues
are available for 18 countries.
Section 3: Empirical Results: Effect of Liberalization on Imports of Capital Goods
Descriptive Statistics
Table 1 gives descriptive statistics of the main variables. Using the BHL liberalization
dates and excluding the entrepôts and major machine exporters, we have 79 countries with both
trade data and liberalization data. Of these, 25 countries have liberalized over the period of 1980
and 1997. The observations are spread roughly equally among Asia, Africa, Europe, and Latin
America, with a smaller number of Middle Eastern countries. Most countries liberalized trade
before opening their stock markets.38 For all 79 countries, machine imports as a percentage of
total imports have a mean of 23.82%, with a minimum of 2.60% for Haiti in 1992 and a
maximum of 57.67% for Malaysia in 1996. For the 25 country sub-sample, the mean is slightly 38 See Data Appendix III for liberalization dates.
Alfaro/Hammel [15]
higher at 27.09%. For the 79-country sample, machine imports as a percentage of GDP range
from 0.43% for Chad in 1980, to 52.35% for Malaysia in 1995, with a mean of 6.16%. For the 25
countries that liberalized in the sample period, the data is very similar with a mean of 6.31%. The
sample of countries that liberalized over the time period has a smaller dispersion of income; this
is due to the fact that the wealthier countries tend to have liberalized before 1980, and many of
the poor African countries still had not liberalized by 2001.
Figure 1, as mentioned above, presents the sample average of machine imports as a
percentage of GDP and of total imports in each year before and after liberalization for the 25
countries that liberalized between 1980 and 1997. A change in these ratios around the dates of
liberalization is evident. Note that once they have opened, the countries in our sample all remain
open. There is, however, wide variation across different countries and regions. In the case of
Greece, Portugal, Spain and Turkey, for example, there is a dramatic increase in the percentage of
imports following equity market liberalization. Similarly, East-Asian countries have dramatically
increased the share imports of capital goods. The Latin American countries experience, on the
other hand, was less dramatic while a sharp increase was evident in the case of the African
countries in our sample.

Years: 1980-1997
Obs. Mean Std. Dev. Min. Max.
Machine Imports (% Total Imports) 1422 23.82 7.57 2.60 57.67Machine Imports (% of GDP) 1420 6.16 5.10 0.43 52.35GDP per capita (2000 U.S.D.) 1417 4,262 6,304 133 37,199
Years: 1980-1997
Obs. Mean Std. Dev. Min. Max.
Machine Imports (% Total Imports) 450 27.09 7.95 11.76 57.67Machine Imports (% of GDP) 450 6.31 5.74 0.78 52.35GDP per capita (2000 U.S.D.) 450 3,952 4,281 222 17,356
Notes: Machine Imports correspond to non-electrical equipment, electrical equipment and instrument industries fromFeentra's World Trade Flows data base. GDP data used to calculate shares and imports data are measured in current U.S.Dollars. All measures of imports come from World Trade Flows; GDP in current U.S. dollars data and GDP in 2000 U.S.dollars are taken from the World Bank's World Development Indicators. GDP data in current U.S. dollars for Iran aremissing for the years 1991 and 1992. GDP data in 2000 U.S. dollars for Kuwait are missing for five years. Liberalizationdates correspond to stock market liberalization dates by Bekaert, Harvey, and Lundblad (2005). See the Data Appendixfor detailed data description and for a list of countries included in each sample.
Sample: Only countries that changed status (25 countries)
Sample: Entire sample (79 countries)
Table 1: Descriptive Statistics
[16] Weatherhead Center for International Affairs
Non liberalized LiberalizedMachine Imports (% Total Imports) 22.36 29.60Machine Imports (% of GDP) 5.74 7.84% of observations 80% 20%
Non liberalized LiberalizedMachine Imports (% Total Imports) 24.97 30.30Machine Imports (% of GDP) 5.24 7.93% of observations 60% 40%
Sample: Entire sample (79 countries)
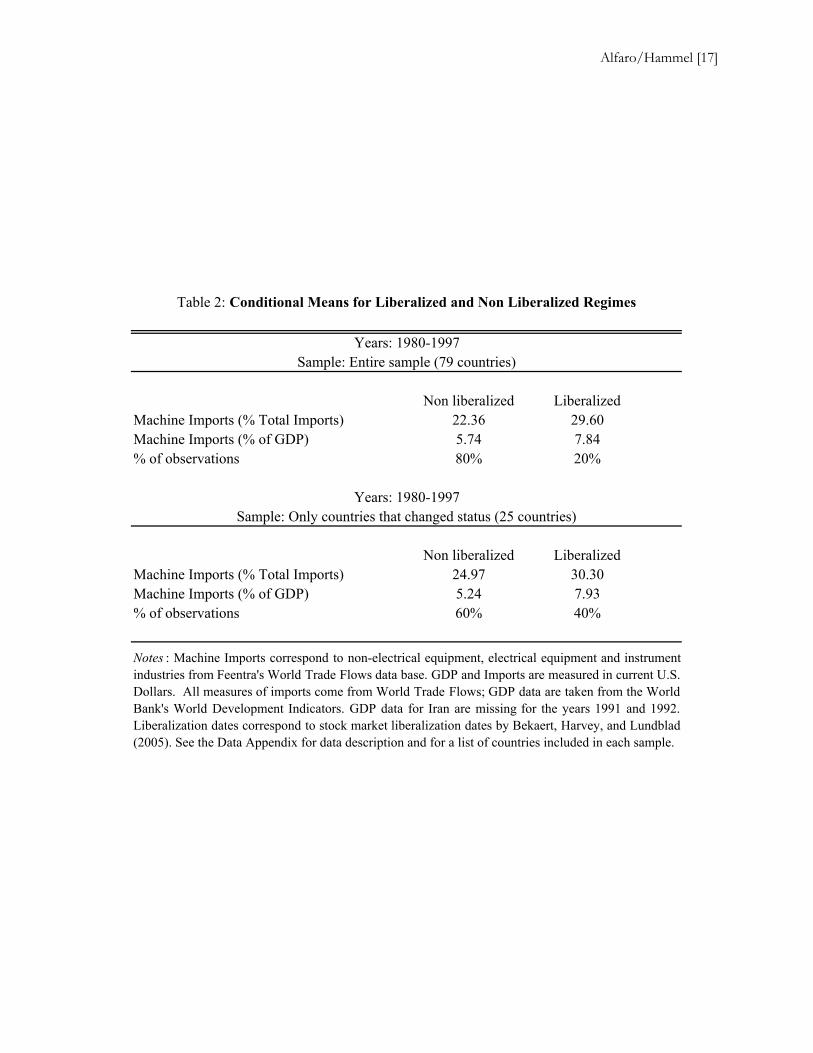
Table 2: Conditional Means for Liberalized and Non Liberalized Regimes
Sample: Only countries that changed status (25 countries)
Notes : Machine Imports correspond to non-electrical equipment, electrical equipment and instrumentindustries from Feentra's World Trade Flows data base. GDP and Imports are measured in current U.S.Dollars. All measures of imports come from World Trade Flows; GDP data are taken from the WorldBank's World Development Indicators. GDP data for Iran are missing for the years 1991 and 1992.Liberalization dates correspond to stock market liberalization dates by Bekaert, Harvey, and Lundblad(2005). See the Data Appendix for data description and for a list of countries included in each sample.
Years: 1980-1997
Years: 1980-1997
Alfaro/Hammel [17]
[18] Weatherhead Center for International Affairs
As seen in Table 2, in the 79-country sample, 20% of country-year observations occur in
a liberalized regime. For such countries, the conditional means for machine imports as a percent
of total imports and for machine imports as a percent of GDP in a liberalized regime are,
respectively, 29.60% and 7.84%. The means in a non-liberalized regime are, respectively, 22.36%
and 5.74%. Notice that the conditional means for the sample of the countries that changed status
are very similar. In this case, the conditional means of machine imports as a percentage of total
imports and as a percentage of GDP were, respectively, 30.30% and 7.93% for liberalized
countries and 24.97% and 5.24% for the non-liberalized regimes. In this case, 40% of the
country-year observations occur in a liberalized regime. A test of means for both samples shows
these differences to be significant at a 1% level. These conditional means are based on both cross-
country and within-country variation. However, a pooled regression is inappropriate in this
context, due to country level factors that may associate worse outcomes to the regimes that never
liberalized and good outcomes for the regimes that were always open.
Main Regression analysis
As mentioned, country specific factors are likely driving cross-country differences in
machine imports, and so in what follows we include country fixed effects in all regressions. As
our main regression, we estimate the following panel regression:
ln(Imports of Machineryit) = αi+ γ Liberalizeit + dt + εit (1)
where Imports of Machineryit are the imports of machinery in country i in the period t. Our
dependent variable is measured both the percentage of capital goods imports to total imports and
the percentage of capital goods imports to GDP, both in logs. Liberalizeit is a dummy variable
that takes on the value 1 on or after the liberalization date. In the main specification, we use the
BHL liberalization dates. αi refers to country specific dummies, dt is a vector of year dummies
Alfaro/Hammel [19]
variables included to control for common world shocks, and εit is an error term.39 We postpone
the discussion of potential omitted variables and endogeneity issues to section 3.4.40
The first regression simply asks the question: Is the machine import ratio higher after a
country opens its financial markets? Using only country fixed effects, Column 1 in Panel A of
Table 3 shows this to be the case. We find that for the countries that liberalized between 1980 and
1997, the machine imports as a percentage of total imports in a liberalized regime are 20% higher
than in a non-liberalized regime. The effect is significant at 1%.41 As mentioned above, the
financial liberalization indicator could be picking up time effects, which we explicitly control for
with time dummies. Generally, the results remain positive and significant.42 When controlling for
year effects in Column 2, the within country capital goods imports as a percentage of total
imports increase by about to 6% after liberalization.
Columns 1 and 2 in Panel B present the results for machine imports as a percentage of
GDP. The results remain positive and significant, ranging from close to a 40% increase in the
case where we do not control for time effects to about 12% when we control for time effects. Our
results are also economically significant, both in terms of the estimated increase in investment as
well as the implied increase in TFP. Coe, Helpman, and Hoffmaister (1997) estimate that the
(semi) elasticity of TFP with respect to machine imports is 0.279.43
39 Tests for stationarity based on Levin, Lin and Chu (2002) indicate that both measures of machine imports are stationary. 40 Although it is hard to argue this is a "natural experiment," it is also hard to believe that the policymakers were observing the share of capital good imports when deciding whether to liberalize the economy or not. Omitted variables, such as changes in growth expectations due to other macroeconomic reforms, seemed to be a more fundamental concern. 41 Results are robust to excluding any potential outlier (e.g. Malaysia). Results are robust also to excluding India and Brazil, which produce an important share of machinery domestically, and Portugal, Spain, and Greece, which joined the European Union around the time of liberalization. 42 We obtain similar results when controlling for a time trend and a time trend squared. We do not report these results due to space considerations. 43 Coe, Helpman, and Hoffmaister (1997) estimate a model where TFP depends on machine imports as a percent of GDP, the interaction of machine imports and the trade weighted foreign R&D stock , and other control variables. A rough estimation of the same specification using only our time period and sample of countries also obtains an economically and statistically significant elasticity of TFP.

CountryFixed Effects
Country and YearFixed Effects
(1) (2)
Financial liberalization indicator 0.20 0.06(12.43)** (2.95)**
Observations 450 450R-squared 0.76 0.82
CountryFixed Effects
Country and YearFixed Effects
(1) (2)
Financial liberalization indicator 0.37 0.12(11.85)** (2.77)**
Observations 450 450R-squared 0.82 0.84
Notes: Dependent variable is the log of machines imports to total imports in panel A and log of machine imports to GDPin Panel B. All regressions include country dummies and are estimated by OLS with White's correction ofheteroskedasticity. t-statistics are in parentheses denoting ** 1% and *5% significance. Machine Imports correspond tonon-electrical equipment, electrical equipment and instrument industries from Feentra's World Trade Flows database. GDPand Imports are measured in current U.S. Dollars. All measures of imports come from World Trade Flows; GDP data aretaken from the World Bank's World Development Indicators. GDP data for Iran are missing for the years 1991 and 1992.The financial liberalization indicator is one for the years after the official liberalization date of the equity market presentedin Bekaert, Harvey, and Lundblad (2005). See the Data Appendix for the description of the data.
Table 3: Fixed Effects Regressions of Imports on Stock Market LiberalizationSample: 25 countries, 1980-1997
Panel A. Dependent variable: ln(Machine Imports as a % of Total Imports)
Panel B. Dependent variable: ln(Machine Imports as a % of GDP)
[20] Weatherhead Center for International Affairs

Alfaro/Hammel [21]
Using their estimates, a 12% increase in machine imports as a percent of GDP, which
corresponds to an increase of 0.873 percentage points, implies a 0.244% increase in TFP over the
liberalization period.
An important concern is that our main independent variable, the liberalization of the
equity market, is serially correlated. We perform additional robustness tests in order to address
this issue. First, we run a test of means between liberalized and non-liberalized regimes, for five
years before and after liberalization. Using this method, we find that machine imports as
percentage of GDP rise by 1% and machine imports as a percentage of total imports by 2% after
liberalization. These differences are significant at 5% and 1% respectively, despite the substantial
reduction in the number of observations.44 Following BHL and Bertand, Duflo, and Mullainathan
(2004), we also ran these regressions using randomly generated liberalization dates. We did this
by generating a random year from a uniform distribution between 1980 and 1997 as well as a
random year within five years of the actual liberalization date. We obtain significant results for
less than 5% of the randomly generated results, suggesting both that serial correlation of the
independent variable is not driving our result and that the coefficient on the liberalization
indicator is not driven merely by chance.
Appendix A explores the effect of financial liberalization on the number of varieties of
capital goods a country imports. We find a significant increase in the variety of capital goods
imports following stock market liberalization.
Examining these results (discussed in detail in Appendix A), it appears that when firms
are granted access to international equity investors, international funds are increasingly used to
finance capital goods imports.45 This effect is statistically and economically significant when
44 In the sample of 25 countries, following liberalization, the average share of machinery imports as a percentage of total imports and as a percentage of GDP were higher for 21 and 23 countries respectively. 45 When we replicate the regression using investment as a share of GDP as our left hand side variable, stock market liberalization has a positive although not significant effect when controlling for time fixed effects. The estimated coefficient for the liberalization dummy for the regression ln (real investment/real GDPit)= αi+ γ Liberalizeit + dt + εit is 0.0018 (s.e. 0.03). Real investment as a percentage of real GDP was taken
[22] Weatherhead Center for International Affairs
compared both to total imports and to GDP. Our results suggest that although total imports also
increase, countries tend to react to equity market liberalization by buying disproportionately more
capital goods, not simply more consumption goods. This result suggests that the increased access
to capital facilitated firms’ investments in capital goods.46
Other Reforms, Policies, and Control Variables
The liberalization process is intricately linked with the macro-economy, and as a result
may coincide with other economic reforms that would also impact machinery imports. More
generally, other factors that affect overall access to capital could also drive increases in machine
imports. So far, we have not considered the role of other reforms, macroeconomic fundamentals,
the world business cycle, or additional variables correlated with both liberalization and imports of
machinery. To check that our results are not driven by omitted variables, we run the following
regression:
ln(Imports of Machineryit) = αi+ γ Liberalizeit + β Control Variablesit + dt + εit (2)
where Other Control Variables have been added to the main regression.
For example, it is possible that the increase in imports of capital goods is caused by
concurrent trade liberalization. A natural question is then whether the changes in imports are
driven by trade liberalization, rather than equity. We control for trade liberalization episodes
using the Wacziarg and Welch (2003) trade liberalization indicators. Examining the data, only
Turkey and Brazil liberalized trade and finance in the same year, and half the countries liberalized
trade and finance more than two years apart. It is noteworthy that most countries liberalized trade
before equity investment. To take into account trade reform, we include a trade liberalization from the Penn World Tables. If we use nominal investment as a percentage of GDP, the estimated coefficient is 0.06 (s.e. 0.04). As Henry (October 2000) notes, the evidence on whether capital account liberalization has any effect on total real investment is ambiguous. 46 We also explored the effects of stock market liberalization on the production of machinery. There are several measurement and data collection issues with the production data limiting comparisons with the trade data. We find an increase in machinery production following stock market liberalization, although the results are not significant. Note, however, that production of capital goods for most countries in our sample is quite small, contributing to our motivation to use machinery imports.
Alfaro/Hammel [23]
dummy in our main regression, which takes on a value of 0 in the years a country has not opened
to trade, and 1 in the years including and following trade liberalization.47
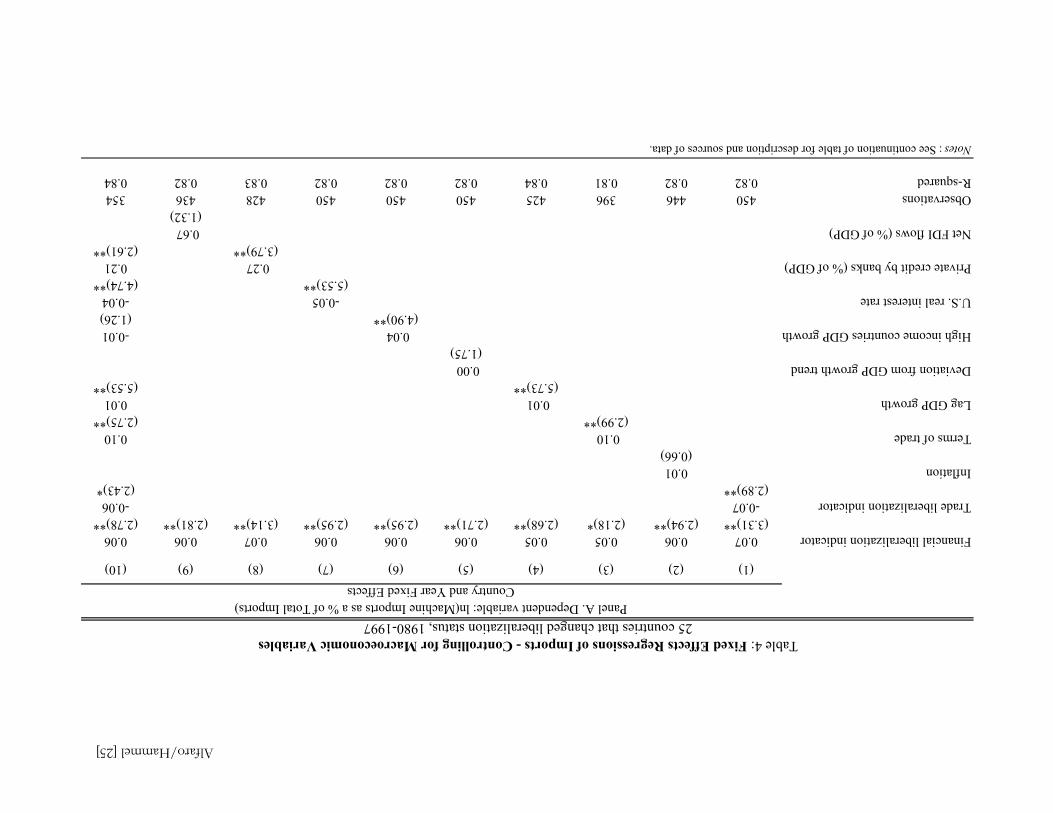
Column 1 in Panel A of Table 4 shows the results from a fixed effects regression of the
natural log of machine imports to total imports on both the date of opening the stock market and
trade liberalization taking into account time trends. Once we control for both trade and stock
market liberalization, the estimated effect from opening up the equity market on the percentage of
capital imports to total imports remains close to 7% and significant, while trade liberalization on
its own leads to a nearly 6% reduction in the percentage of capital imports to total imports.
Column 1 in Panel B of Table 4 shows similar results for machine imports as percent of GDP.
The coefficient on stock market liberalization changes little, close to 12%, and remains
significant when controlling for trade liberalization episodes. Trade liberalization appears to have
a negative impact on the share of capital goods imports to GDP.48
These results suggest that for the countries that liberalized in the eighties and nineties,
opening up to trade initially caused the relative importance of capital goods to fall, ostensibly
suggesting a small consumption boom. Only with the increased access to capital do firms begin to
disproportionately increase their spending on machinery and equipment. We suspect that the
negative or insignificant effect of trade liberalization may be due to the fact that initial tariffs on
consumption goods tended to be much higher than on capital goods, whereas trade liberalization
episodes tend to be broad liberalizations across many categories of goods that often
disproportionately impact consumption goods.49 Unfortunately, consistent cross-country time
47 Note that we do not include an interaction term. This is because of the 25 countries that liberalized finance in this period, only 6 did so before trade. These are Argentina, India, Nigeria, Pakistan, Venezuela, and Zimbabwe. As a result, the interaction term is highly collinear with the financial liberalization indicator. 48 We also run the regression using the sum of exports and imports as a percentage GDP as a control variable. We obtain significant estimates for the coefficient for the liberalization dummy with values similar to the ones obtained before. In this case, the estimates for the trade openness indicator were positive and significant. 49 In the period pre-trade liberalization, most of the countries in the sample followed import substitution strategies and imposed higher tariffs to final goods in order to foster domestic production. For example,
[24] Weatherhead Center for International Affairs
series data on capital good trade restrictions are difficult to obtain, and we cannot capture the
effect of falling capital good restrictions. We leave this for future research. Nevertheless, in terms
of our research question, these results suggest that the changes in machine imports are not driven
by trade policy.
Can results be driven by other reforms or policies? In Column 2 of Panels A and B of
Table 4, we control for inflation. Higher inflation in a country reduces the cost of imported goods
relative to domestic goods. Since the bulk of capital goods is produced abroad, this effect can lead
to a relative increase in the purchases of foreign goods and thus imported machinery.50 Perhaps
more importantly, low inflation can coincide with increased stability and high expected growth
due to government stabilization polices. Thus, inflation can capture the increase in machinery
imports to government’s successful implementation of other macroeconomic reforms. As seen in
Table 4, our results remain robust to including inflation.
We also control for terms of trade shocks. By affecting the relative price of imports to
exports, terms of trade shocks could affect our variables, although the expected direction is
ambiguous. As seen in Column 3, the terms of trade variable appears to have a positive and
significant effect at 5% on the percentage of capital goods imports, but including this variable
does not materially affect our results.
Bulmer-Thomas (1994) documents that in Latin America, the degree of nominal protection on capital goods was less than half of the overall degree of nominal protection. 50 The real exchange rate and shocks to the terms of trade are better measures of the relative price of domestic goods. Terms of trade shocks are included below. Results for the real exchange rate are generally similar but are not shown due to the large number of missing observations in the standard sources. Most of these missing observations are due to episodes of high inflation, which complicates constructing our own series in a consistent way.
(1)(2)(3)(4)(5)(6)(7)(8)(9)(10)
Financial liberalization indicator0.070.060.050.050.060.060.060.070.060.06(3.31)**(2.94)**(2.18)*(2.68)**(2.71)**(2.95)**(2.95)**(3.14)**(2.81)**(2.78)**
Trade liberalization indicator-0.07-0.06(2.89)**(2.43)*
Inflation0.01(0.66)
Terms of trade0.100.10(2.99)**(2.75)**
Lag GDP growth0.010.01(5.73)**(5.53)**
Deviation from GDP growth trend0.00 (1.75)High income countries GDP growth0.04-0.01
(4.90)**(1.26)U.S. real interest rate-0.05-0.04
(5.53)**(4.74)**Private credit by banks (% of GDP)0.270.21
(3.79)**(2.61)**Net FDI flows (% of GDP)0.67
(1.32)Observations450446396425450450450428436354R-squared0.820.820.810.840.820.820.820.830.820.84
Table 4: Fixed Effects Regressions of Imports - Controlling for Macroeconomic Variables25 countries that changed liberalization status, 1980-1997
Notes: See continuation of table for description and sources of data.
Country and Year Fixed EffectsPanel A. Dependent variable: ln(Machine Imports as a % of Total Imports)
Alfaro/Hammel [25]
(1) (2) (3) (4) (5) (6) (7) (8) (9) (10)
Financial liberalization indicator 0.13 0.12 0.09 0.12 0.11 0.12 0.12 0.13 0.10 0.12(3.06)** (2.78)** (1.97)* (2.94)** (2.49)* (2.77)** (2.77)** (2.81)** (2.41)* (2.92)**
Trade liberalization indicator -0.12 -0.06(2.44)* (1.21)
Inflation 0.00(0.14)
Terms of trade 0.01(0.13)
Lag GDP growth 0.02 0.02(5.33)** (4.37)**
Deviation from GDP growth trend 0.01 (1.84)High income-countries GDP growth 0.02
(1.44)U.S. real interest rate -0.05 -0.05
(3.01)** (3.10)**Private credit by banks (% of GDP) 0.40 0.46
(2.62)** (3.03)**Net FDI flows (% of GDP) 3.83 3.32
(2.99)** (2.64)**Observations 450 446 396 425 450 450 450 428 436 393R-squared 0.84 0.84 0.79 0.87 0.84 0.84 0.84 0.85 0.85 0.88
Table 4: Fixed Effects Regressions of Imports - Controlling for Macroeconomic Variables (Continuation)
Country and Year Fixed Effects
25 countries that changed liberalization status, 1980-1997Panel B. Dependent variable: ln(Machine Imports as a % of GDP)
Notes: Dependent variable is the log of machines imports to total imports in panel A and log of machine imports to GDP in Panel B. All regressions include country and time dummies andare estimated by OLS with White's correction of heteroskedasticity. t-statistics are in parentheses denoting ** 1% and *5% significance. Machine Imports correspond to non-electricalequipment, electrical equipment and instrument industries from Feentra's World Trade Flows data base. GDP and Imports are measured in current U.S. Dollars. All measures of importscome from World Trade Flows; GDP data are taken from the World Bank's World Development Indicators. GDP data for Iran are missing for the years 1991 and 1992. The financialliberalization indicator is one for the years after the official liberalization date of the equity market presented in Bekaert, Harvey, and Lundblad (2001). The trade liberalization indicator isone for the years after trade liberalization as classified by Wacziarg and Welch (2003). Macroeconomic variables are taken from the World Development Indicators. High-Income GDPgrowth refers to the growth of the High-Income countries as categorized in the World Bank Development indicators. U.S. real interest rate corresponds to the lending interest rate adjustedfor inflation as measured by the GDP deflator from the World Bank, WDI. Private credit by banks is taken from Beck, Demirguc-Kunt, and Levine (2005). Only controls variables that aresignificant in the regressions are shown in the last column of the Table. See the Data Appendix for the description of the data.
[26] Weatherhead Center for International Affairs
Alfaro/Hammel [27]
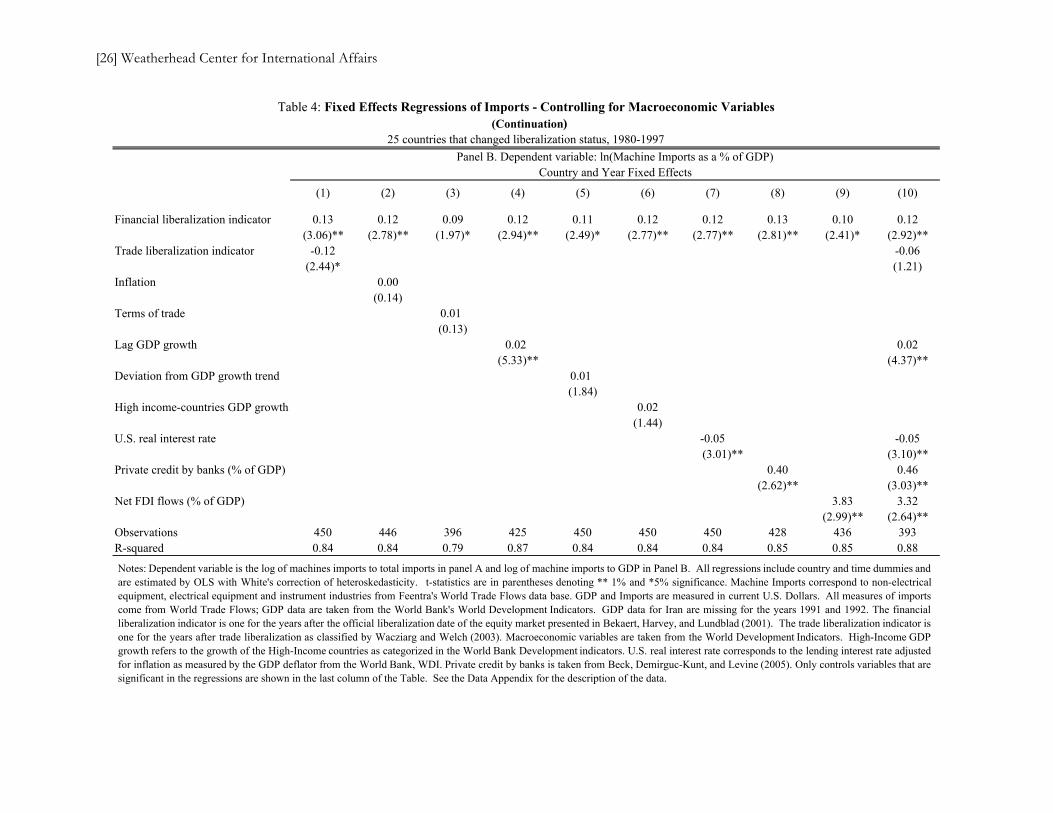
We also take into consideration domestic fundamentals and world business cycles.
Columns 4 and 5 show that the results are robust to including lagged GDP growth and the
deviation from trend GDP growth. While year dummies already control for world business
cycles, we control for industrialized country output growth rates and the U.S. real interest rate in
order to isolate the impact of world business cycles. As Bartolini and Drazen (1997) point out,
countries may have liberalized during a time when interest rates were low, thus increasing their
ability to take advantage of international capital flows. Again, our liberalization indicator
remains robust to including these variables, as seen in Columns 6 and 7.51 Panel B replicates
results for capital goods imports as a percentage of GDP. The domestic and international
economic environment do have a significant effect on the share of capital goods imports to GDP,
however, the equity market liberalization variable remains statistically and economically
significant.
Since our results suggest that equity market liberalization allows firms access to
additional funds that finance an increasing amount of capital goods imports, we check whether
our results are not simply driven by the level of financial development. We use private credit by
deposit banks as a percent of GDP as a proxy for financial development that may occur
independently of the equity market liberalization channel. Using the share of capital imports to
total imports as the dependent variable, Panel A in Table 4, Column 8, shows the estimated
coefficient of the financial development proxy to be positive and significant at 5%. The
coefficient on the financial liberalization dummy remains positive and significant at 5%. Panel B,
Column 8, shows similar results for capital imports as a percentage of GDP. We obtain similar
results if we use private credit by all financial institutions. These results suggest that access to
international capital markets have additional effects beyond the development of the local financial
markets.
51 We also controlled for a weighed average of G7 real interest rates obtaining similar results.
[28] Weatherhead Center for International Affairs
Another factor that could be driving our results is the flow of foreign direct investment
(FDI) into the economy. Foreign companies may be more likely to use inputs from their parent
country and, more generally, may be more likely to use sophisticated technology than would
domestic companies. Column 9 of Panels A and B show the results of our regression controlling
for FDI inflows, which we take from the World Development Indicators. As shown in the tables,
the coefficient on both imports as a percent of total imports and as a percent of GDP remain
virtually unchanged when controlling for FDI flows.52 The coefficient on FDI inflows is positive
and significant at 1% when using imports as a percent of GDP but is not significant when looking
at imports as a percent of total imports.
Finally, Columns 10 in both panels show that when controlling for all significant
variables, our results remain virtually unchanged. Both dependent variables remain economically
significant and robust to controlling for other potential determinants of increases of machine
imports.
As mentioned above, the process of capital account liberalization is a complex one that
may involve different steps. Therefore, we test whether our results are driven by changes in other
capital account policies. As seen in Appendix B, the results are robust to other measures of capital
account liberalization (using the IMF Index as a proxy). Appendix B also presents the results of
other relevant dates of equity market integration such as the introduction of the first country fund
and the first ADR used in Bekaert and Harvey (2000) and stock market liberalization dates
presented in Henry (2000).
Endogeneity Issues
A final concern is whether both the share of capital goods imports and stock market
liberalizations might be determined by a potential omitted third factor or that reverse causality
might be driving our results. For example, it may be possible that policy makers in a country
52 The results also hold when controlling for net or gross FDI flows.
Alfaro/Hammel [29]
liberalize at a time when the world economy is booming or after they observe good economic
outcomes. However, this does not seem born out by the facts. Henry (October 2000) shows that
countries do not pursue stock market liberalizations in response to investment booms. Using a
probit analysis, Bekaert, Harvey, and Lundblad (2005) find that past GDP growth cannot explain
liberalization. Additionally, as seen in the previous tables, we have controlled for other economic
reforms and macroeconomic variables that might influence the policy makers’ timing in opening
up the markets, including lagged GDP growth and proxies for the world business cycle. The
results remain robust, thus strengthening our confidence that our results are not driven primarily
by omitted variables.
On the other hand, it is impossible to rule out the possibility that policy makers
liberalized in anticipation of favorable economic outcomes and hence, lacking a valid instrument,
estimates should be taken with caution. However, we have a proxy for forward-looking growth
opportunities that can help strengthen our confidence in the direction of causality. As discussed
in the data section of the paper, Bekaert, Harvey, and Lundblad (2005) construct an exogenous
measure of a country’s growth opportunities by taking the average of global industry price-to-
earnings ratio weighted by the fraction of the stock market that each industry represents in the
domestic economy. While local measures of forward-looking growth opportunities could reflect
the improvement in growth prospects due to equity liberalization, a measure based on a country’s
predetermined (at the time of liberalization) industrial structure reflects exogenous world factors.
These authors show that their measure can explain growth but does not explain equity
liberalizations, and in fact find that growth opportunities are negatively associated with the
decision to liberalize.
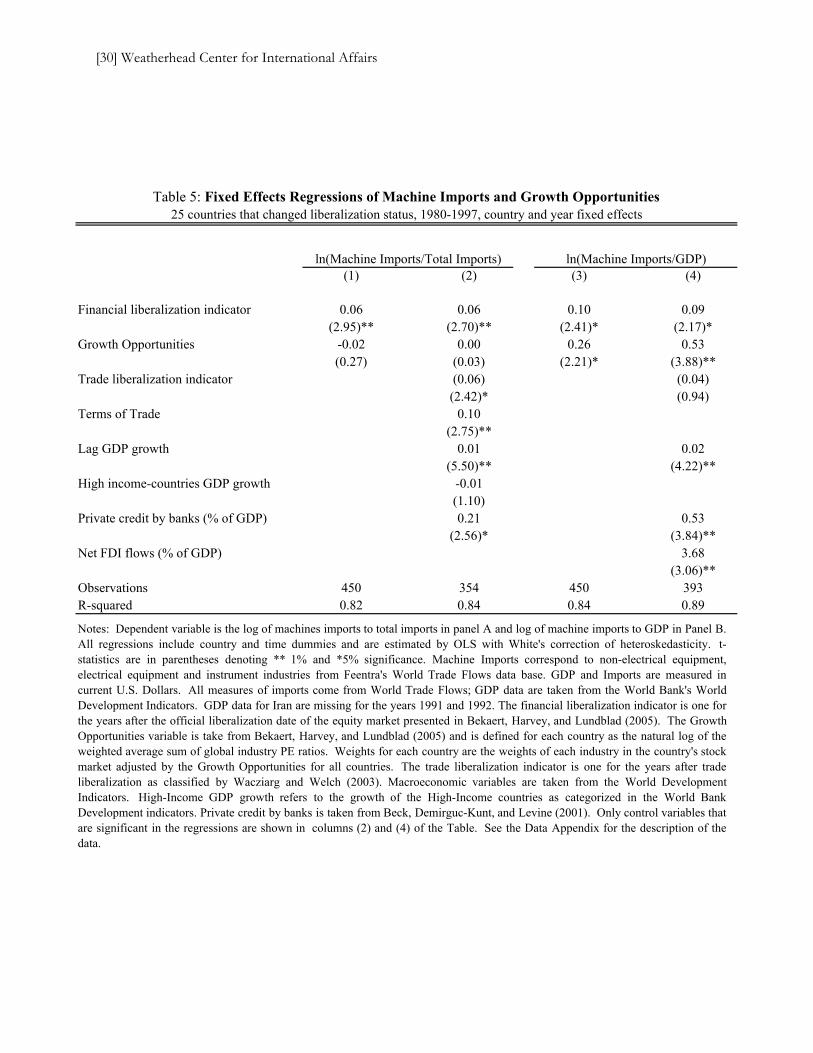
(1) (2) (3) (4)
Financial liberalization indicator 0.06 0.06 0.10 0.09(2.95)** (2.70)** (2.41)* (2.17)*
Growth Opportunities -0.02 0.00 0.26 0.53(0.27) (0.03) (2.21)* (3.88)**
Trade liberalization indicator (0.06) (0.04)(2.42)* (0.94)
Terms of Trade 0.10(2.75)**
Lag GDP growth 0.01 0.02(5.50)** (4.22)**
High income-countries GDP growth -0.01(1.10)
Private credit by banks (% of GDP) 0.21 0.53(2.56)* (3.84)**
Net FDI flows (% of GDP) 3.68(3.06)**
Observations 450 354 450 393R-squared 0.82 0.84 0.84 0.89
Table 5: Fixed Effects Regressions of Machine Imports and Growth Opportunities
ln(Machine Imports/Total Imports)
25 countries that changed liberalization status, 1980-1997, country and year fixed effects
ln(Machine Imports/GDP)
Notes: Dependent variable is the log of machines imports to total imports in panel A and log of machine imports to GDP in Panel B.All regressions include country and time dummies and are estimated by OLS with White's correction of heteroskedasticity. t-statistics are in parentheses denoting ** 1% and *5% significance. Machine Imports correspond to non-electrical equipment,electrical equipment and instrument industries from Feentra's World Trade Flows data base. GDP and Imports are measured incurrent U.S. Dollars. All measures of imports come from World Trade Flows; GDP data are taken from the World Bank's WorldDevelopment Indicators. GDP data for Iran are missing for the years 1991 and 1992. The financial liberalization indicator is one forthe years after the official liberalization date of the equity market presented in Bekaert, Harvey, and Lundblad (2005). The GrowthOpportunities variable is take from Bekaert, Harvey, and Lundblad (2005) and is defined for each country as the natural log of theweighted average sum of global industry PE ratios. Weights for each country are the weights of each industry in the country's stockmarket adjusted by the Growth Opportunities for all countries. The trade liberalization indicator is one for the years after tradeliberalization as classified by Wacziarg and Welch (2003). Macroeconomic variables are taken from the World DevelopmentIndicators. High-Income GDP growth refers to the growth of the High-Income countries as categorized in the World BankDevelopment indicators. Private credit by banks is taken from Beck, Demirguc-Kunt, and Levine (2001). Only control variables thatare significant in the regressions are shown in columns (2) and (4) of the Table. See the Data Appendix for the description of thedata.
[30] Weatherhead Center for International Affairs

Alfaro/Hammel [31]
Reassuringly, as shown in Table 5, our results are robust to including this measure.53
These results also hold when controlling for other macroeconomic variables. This result further
suggests that it is not the case that the liberalization indicator is simply picking up strong
expected growth at the time of liberalization.
All of these factors support the idea that policy makers were not looking at observable
characteristics of future growth when they decided to liberalize. Moreover, the notion that policy
makers anticipated future growth gives quite a bit of credit to policy makers who had already
tried to implement a host of other, often unsuccessful, reforms.54 It is unclear why stock market
liberalization would be one of the few reforms they were able to implement in correct anticipation
of future events. Additionally, the political process of liberalizing the stock market is somewhat
lengthy and complex; it would be quite remarkable if policy makers were able to successfully
anticipate the positive economic future of their countries and liberalize their equity markets
quickly enough to capture it. Notwithstanding the battery of robustness tests, we acknowledge
the difficulties of establishing causation. At our most cautious, we can conclude that the within
correlation of capital goods imports and stock market liberalization is positive and significant. At
the same time, given the limitations of available data, the use of event analysis data seems to
provide a better link from the policy change to the observed outcomes.
Capital Flows and Stock Market Indicators
Finally, we explore the channels through which equity market liberalization leads to
higher imports of capital goods, focusing on stock market valuation, new equity issues, and net
53 Results are robust to other ways of measuring growth opportunities as calculated by Bekaert, Harvey, and Lundblad (2005). 54 For example, since the 1950s, many developing countries—particularly in Latin American—suffered from high and persistence inflation. Since the mid-sixties, a myriad of stabilization programs were implemented, most of which failed, ending in balance of payment crises and recession. Calvo and Vegh (1999), for example, attribute the boom-bust cycles to the lack of credibility of reforms due to the failure to implement fiscal reforms.

[32] Weatherhead Center for International Affairs
equity inflows.55 Because our liberalization dates capture equity market liberalization, we would
expect these indicators to be highly correlated with the financial liberalization indicator. Table 6
shows that this is indeed the case. Market capitalization and new equity issues as a percent of
GDP are on average about four times higher after liberalization. Equity inflows as a percent of
GDP are on average about 70 times higher after liberalization, although there is a high variation.56
A test of means shows these differences are significant at the 1% level. When controlling both for
country and year effects, stock market capitalization increases by about 5%, new equity issues
increase by 80%, and equity inflows more than double.
How should different stock market indicators impact imports of machinery and
equipment? First, suppose the stock market valuation increases due to a fall in the cost of capital,
without any additional capital flowing into the economy. There will be an effect on the
investment levels of the directly affected firms. Suppose the value of a firm increases because the
cost of capital decreases. If managers use the cost of capital to calculate the internal rate of return
on investment projects, more projects would pass their internal hurdle rates, and the lower cost of
capital would increase their investment rates. Moreover, the higher stock price may also allow
firms to borrow more, because their higher market value allows them to borrow either more
cheaply or with less collateral. Furthermore, there may be an effect on investment in other firms.
55 Increased liquidity should also be a consequence of liberalization due to the increased number of investors. Indeed, liquidity is over four times higher after liberalization, and these differences are significant at the 1% level. Since increased liquidity reduces transaction costs and thus directly reduces the equity premium, the subsequent reduction in the cost of capital should also increase investment. We do not report our results due to smaller number of observations, but our results are consistent with Henry (October 2000). See also Levine and Zervos (1998) and Fuchs-Schündeln and Funke (2001). 56 Outliers include Indonesia and Turkey, whose stock market turnover increased over 100 times, and Pakistan, whose capital outflows were large and negative before liberalization. Equity inflows were near zero for most countries before liberalization, with an average of 0.02% of GDP. We find that after controlling for country and year effects, net equity inflows more than double and the stock market capitalization increases by 5 percentage points after liberalization.
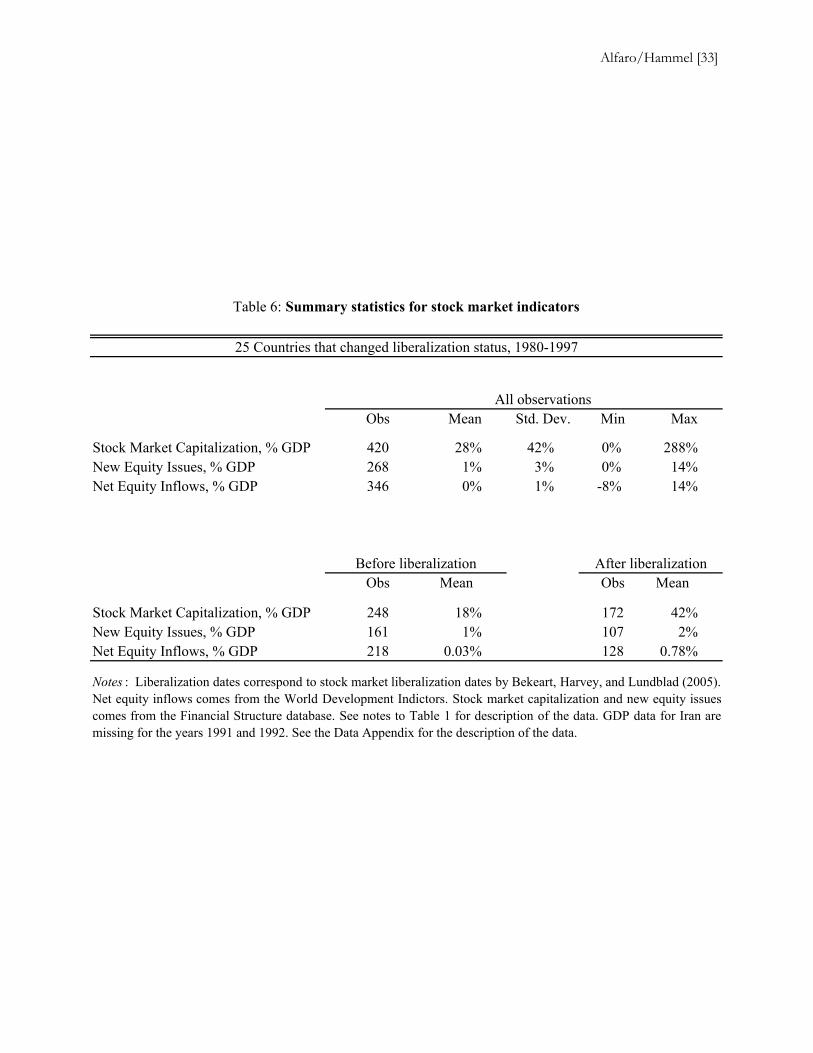
All observationsObs Mean Std. Dev. Min Max
Stock Market Capitalization, % GDP 420 28% 42% 0% 288%New Equity Issues, % GDP 268 1% 3% 0% 14%Net Equity Inflows, % GDP 346 0% 1% -8% 14%
Obs Mean Obs Mean
Stock Market Capitalization, % GDP 248 18% 172 42%New Equity Issues, % GDP 161 1% 107 2%Net Equity Inflows, % GDP 218 0.03% 128 0.78%
Table 6: Summary statistics for stock market indicators
Notes : Liberalization dates correspond to stock market liberalization dates by Bekeart, Harvey, and Lundblad (2005).Net equity inflows comes from the World Development Indictors. Stock market capitalization and new equity issuescomes from the Financial Structure database. See notes to Table 1 for description of the data. GDP data for Iran aremissing for the years 1991 and 1992. See the Data Appendix for the description of the data.
Before liberalization After liberalization
25 Countries that changed liberalization status, 1980-1997
Alfaro/Hammel [33]
[34] Weatherhead Center for International Affairs
Investors who have seen their portfolio values increase may sell their investments to
others on the stock market. If those selling their stocks have a higher propensity to invest than
those buying the stocks, then the higher valuation would result in increased investment.57 Finally,
the increased wealth of stock holders may affect their investment behavior. They may, for
example, direct resources into productive investments such as capital goods instead of
government bonds or other unproductive assets. Thus, a high stock market valuation could have
an independent effect on capital goods purchases and productive investment, even if total funds
into the economy do not change.
Another potential channel is through new equity issues. With an increased number of
potential buyers, firms may be more likely to issue equity after stock market liberalization. New
equity investments directly inject cash flow for investment into the issuing firm. Thus, we should
see investment rise with new equity issues.
Unless they are used to purchase new equity issues, net equity inflows do not directly
increase cash flow to firms. Thus, their direct impact on the firm whose shares were sold to
foreigners should only be through their impact on market valuation. However, if net purchases by
foreigners are higher than new net equity issues, net equity sales by domestic residents must be
positive. Those funds could then be used to increase investment in other firms. Moreover, to the
extent that the increased inflows of capital allow the purchase of more imports, the increase in
foreign investment should impact machine imports directly. Finally, it may be that international
investors facilitate international linkages and exert pressure on firms to upgrade their technology,
thus directly affecting the use of foreign machinery and equipment.
Thus, increased market value, new equity issues, and equity inflows are all expected to
increase total investment and have a positive impact on machinery imports. In order to test the
57 This would be the case, for example, if the buyers previously kept their funds in poorly managed financial institutions or low productivity assets.
Alfaro/Hammel [35]
impact of the different stock market variables on machinery and equipment imports, we run the
following set of regressions:
ln(Imports of Machineryit) = αi+ γ Stock Market Indicatorsit + dt + εit (3)
Overall, the broad range of stock market indicators has a positive and significant effect on
machine imports, both as a percent of total imports and of GDP. As seen in the first column of
each panel of Table 7, the share of capital goods imports to total imports and to GDP rises with
market capitalization, controlling for time and country fixed effects.58 The coefficient is 0.14 and
significant at 5% for machine imports to total imports, and 0.43 and significant at 1% for machine
imports to GDP. In Column 2, new equity issues have a positive and significant impact on
machine imports. Net equity inflows appear to have a positive impact on machine imports,
although this effect is marginally significant. The coefficients change little when both stock
market capitalization and new equity issues are included, suggesting independent effects. These
results also hold when controlling for concurrent and lagged GDP growth (not shown). Overall,
we interpret these results as suggestive that financial liberalization affects machine imports
through its impact on capital flows and on stock market capitalization.
58 We do not show the trade liberalization indicator since it is not significant in these regressions.
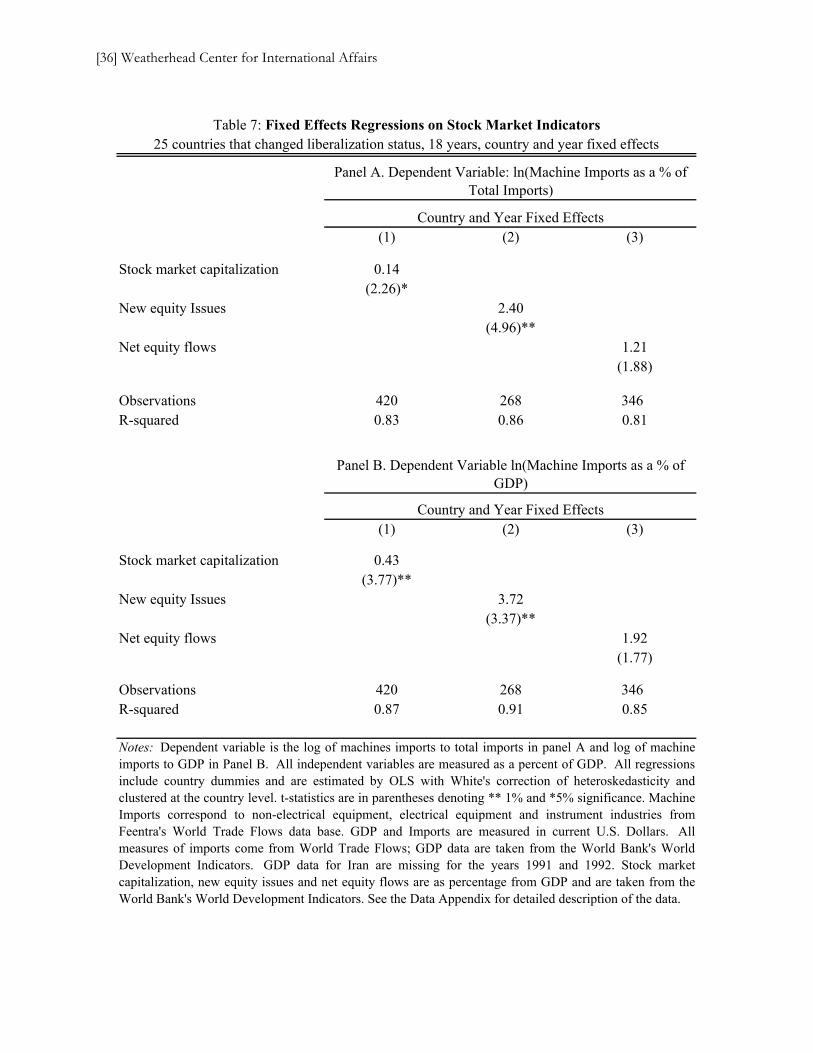
(1) (2) (3)
Stock market capitalization 0.14(2.26)*
New equity Issues 2.40(4.96)**
Net equity flows 1.21(1.88)
Observations 420 268 346R-squared 0.83 0.86 0.81
(1) (2) (3)
Stock market capitalization 0.43(3.77)**
New equity Issues 3.72(3.37)**
Net equity flows 1.92(1.77)
Observations 420 268 346R-squared 0.87 0.91 0.85
Panel B. Dependent Variable ln(Machine Imports as a % of GDP)
Notes: Dependent variable is the log of machines imports to total imports in panel A and log of machineimports to GDP in Panel B. All independent variables are measured as a percent of GDP. All regressionsinclude country dummies and are estimated by OLS with White's correction of heteroskedasticity andclustered at the country level. t-statistics are in parentheses denoting ** 1% and *5% significance. MachineImports correspond to non-electrical equipment, electrical equipment and instrument industries fromFeentra's World Trade Flows data base. GDP and Imports are measured in current U.S. Dollars. Allmeasures of imports come from World Trade Flows; GDP data are taken from the World Bank's WorldDevelopment Indicators. GDP data for Iran are missing for the years 1991 and 1992. Stock marketcapitalization, new equity issues and net equity flows are as percentage from GDP and are taken from theWorld Bank's World Development Indicators. See the Data Appendix for detailed description of the data.
Table 7: Fixed Effects Regressions on Stock Market Indicators25 countries that changed liberalization status, 18 years, country and year fixed effects
Country and Year Fixed Effects
Country and Year Fixed Effects
Panel A. Dependent Variable: ln(Machine Imports as a % of Total Imports)
[36] Weatherhead Center for International Affairs

Alfaro/Hammel [37]
In previous research looking closely at the drivers of low equipment investment rates,
much attention has been drawn to the relative price of capital.59 Given the importance of financial
integration, our results suggest additional explanations for the low level of machinery and
equipment imports in poor countries: either credit constraints or a high cost of capital may help
explain why countries do not import more machinery and equipment. As Henry (2000) and
Bekaert and Harvey (2000) show, stock market liberalization leads to a lower cost of capital. The
lower cost of capital means that some projects that were not profitable before stock market
liberalization are now profitable, encouraging firms to invest in new machines. In addition, our
results suggest that access to international capital markets may have additional effects in terms of
easing financing constraints. The resulting increase in productive investment can lead to faster
growth through its effect on TFP.
Conclusion
In this paper, we examine whether liberalization episodes lead to more imports of capital
goods. We pay particular attention to the effects of equity market liberalization. We find that for
the period from 1980 to 1997, after controlling for trade liberalization, other reforms, policies and
fundamentals, stock market liberalization leads to a significant increase in imports of capital
goods. When financial barriers fall, firms can begin to increase investment in capital goods. We
hypothesize that this can be attributed to the consequences of financial integration which allows
access to funds and lowers the cost of capital in an economy.
These results suggest potential growth benefits to the liberalizing country stemming from
the acquisition of imported machinery. It is worth emphasizing that this work is silent on other
welfare and efficiency improving effects of capital liberalization linked to better risk
management, risk sharing, increased competition, or consumption smoothing. However, we
59 The work by several authors suggest that the high cost paid by poor countries in terms of tariffs, taxes, and other restrictions on capital goods have a negative impact in growth; see DeLong and Summers (1991, 1992). See Hsieh and Klenow (2003) for an alternative explanation underlying relative price differences between consumption and capital goods.

[38] Weatherhead Center for International Affairs
believe this exercise provides a more focused analysis of the effects of capital account
liberalization that overcomes some of the issues in the existing literature.
Alfaro/Hammel [39]
Appendix A: Variety of Capital Goods Imports
In Table A1, we explore the effect of financial liberalization on the number of varieties a
country imports. In our sample, the average of the overall number of imported 4-digit SITC code
varieties of the countries is 446, with a minimum of 285 and a maximum of 552. In terms of
capital goods, the average number of imported 4-digit SITC code varieties of machinery was 75,
with a minimum of 63 and a maximum of 91. As Column 1 in Panel A shows, when we control
for time and country fixed effects, the variety of capital goods imports increases by 1. While this
number is small, the 4-digit category is quite broad and does not capture the higher degree of
variety that would be observable at the 10-digit level. If we define a variety by its SITC code and
the exporting country (for example, a U.S. turbine is one variety, and a French turbine is another),
then the number of variety increases by about 90 country-varieties after liberalization. These
effects are robust at the 1% level even after controlling for trade liberalization. It is interesting to
note, as seen in Column 2 of Panel A, that the effect of trade liberalization on machine import
varieties is not significant. In Panel B, we contrast these results with the effects of liberalization
on the variety of total imports. In this case, we find a significant increase in the varieties of all
types of goods imported following both stock market and trade liberalization.60 Thus, while trade
liberalization appears to impact total variety of imports as one would expect, the effect on
machinery is seen only through financial liberalization. This is consistent with the notion that
financial liberalization eases a firm’s investment constraints and only then do firms increase their
purchases of productive investment via more and greater variety of capital goods.
60 See Klenow and Rodríguez-Clare (1997) for the effects of trade liberalization on the variety of imports.
[40] Weatherhead Center for International Affairs
Appendix B: Other Financial Liberalization Indicators
As mentioned above, the process of capital account liberalization is complex and
involves different steps. Could our results be driven by broader inflows of capital following
equity liberalization or broader capital account liberalization? We first test whether our results are
driven by changes in other capital account policies. We estimate an appended panel regression:
Imports of Machineryit = αi+ γ Liberalizeit + βTrade Liberalizeit + λIMFit
+ φIMFit *Liberalizeit + dt + εit (B.1)
where IMF is our measure of international integration based on the IMF indicators of capital
account restrictions discussed above.
The results from these estimations for the smaller sample are shown in Table A2. As seen
in Table A2, once we control for time effects or other reforms, the IMF index does not seem to
have a significant effect on either the share of capital goods imports to total imports or to GDP.
The equity market liberalization index, however, remains positive and significant even after
controlling for both the IMF indicator and the trade liberalization indicator. The trade
liberalization indicator remains negative and significant. We also control for an interaction term
of the IMF index and the stock market index. This term, however, is not significant. The effect of
equity liberalization remains positive and significant at the 10% level with an estimated effect of
close to 7% for capital imports to total imports and 12% for capital imports as a percentage of
GDP once we control for time effects. As shown in Table A2, Panel A, the effect of trade
liberalization is in this case negative and close to -8% and -15% respectively. As mentioned, a
concern of using the IMF index stems from the difficulty in accurately gauging the magnitude
and effectiveness of government restrictions. For example, Figure A1 plots the IMF index for
Brazil against the liberalization date of the equity markets. According to the IMF index, there has
been no variation in Brazil’s capital account openness. The access to foreign funds, however, has
Alfaro/Hammel [41]
considerably increased in the country after 1991. The Figure A1 shows the different indicators for
other countries in the sample, namely Chile, Mexico and Colombia. As seen in the figures, the
liberalization dates provide a better indicator of de facto liberalization than the IMF index.
We also present the results of using other relevant dates of equity market integration.
They include the introduction of the first country fund, the first ADR used in Bekaert and Harvey
(2000) and stock market liberalization dates presented in Henry (2000). Both for the case of the
introduction of the first country fund and for Henry’s liberalization dates, around 56% of the
observations belong to the liberalized regime. For the introduction of the first ADR, 40% of the
observations correspond to a liberalized regime. The conditional means in liberalized regime for
machine imports as a percent of total imports and as a percent of GDP range, respectively, from
31% to 34% and 8% to 9%. The means in a non-liberalized regime range from 23% to 26% for
capital imports as a percentage of total imports and are close to 4% for the percentage of GDP.
Notice that the conditional means are very similar to those of our small sample used previously.
Tables A3 and A4 present the main results using the BHL and the Henry (2000) liberalization
dates. Notice that with the new liberalization dates, the number of countries in our sample falls
dramatically. As a result, we have much lower levels of significance than the conventional levels.
Overall, we find a positive effect of equity market liberalization with magnitudes similar to those
found using the BHL indicator.

[42] Weatherhead Center for International Affairs
Data Appendix I: Variables
Dependent Variable
Import Data on Capital Goods, from Freenstra, Lipsey and Bowen (1997) World Trade
Flows, 1980-1997 database. Statistics Canada compiled the data, which recompiles UN trade
data classified by Standard Industrial Trade Class (SITC) Revision 2. It includes bilateral trade
flows reported in U.S. dollars from 1980 to 1997. In order to reconcile these data with domestic
production data, the 4-digit SITC codes are matched to U.S. Bureau of Economic Analysis (BEA)
codes for 34 manufacturing sectors. We define equipment trade as the sum of BEA industry codes
20-27 and 33 (Farm and Garden Machinery, Construction, Mining, etc.; Computer and Office
Equipment; Other Non-Electric Machinery; Appliances, Audio and Video etc.; Electronic
Components; Other Electrical Machinery; and Instruments and Apparatus). We use the number of
4-digit SIC codes to measure varieties. In the regression analysis, we exclude the 11 major
machine exporters: United States, the United Kingdom, Japan, Germany, France, Sweden and
Italy, Netherlands, Switzerland, Canada, and South Korea. These 11 countries represent over 70%
of machine exports in a given year. We also excluded major entrepôts (Hong Kong and
Singapore). We use as dependent variables the log of the percentage of capital goods imports to
GDP, the log of percentage of capital goods imports to total imports, and the varieties of capital
goods. All imports data were taken from World Trade Flows. GDP data in U.S. dollars were
taken from World Bank Development Indicators. GDP data for Iran are missing for the years
1991 and 1992.
Independent Variables
Equity Liberalization Dates, taken from Bekaert, Harvey, and Lundblad (2005). Dates are
based on broad regulatory changes of capital markets, and often coincide with the IFC’s official
liberalization date. BHL have 95 countries in their sample and 27 that liberalized during our
Alfaro/Hammel [43]
sample period; we exclude the 11 major machine exporters and Singapore. We also exclude
Belgium, Lesotho, Botswana, and Swaziland that do not have comparable trade data available. In
the regressions, the 25 countries that changed financial liberalization status between 1980 and
1997 exclude Japan and South Korea. Henry (2000) defines a country’s first stock market
liberalization as the first month with a verifiable occurrence of liberalization policy decree, the
establishment of the first country fund, or a 10% increase in the IFC Investability Index. Dates
available for 12 countries.
Introduction of a Closed-End Country Fund, taken from Bekaert and Harvey (2000). A
closed-end country fund is a fund that owns shares in securities of one country and issues shares
to investors in a foreign country. From the list of 16 countries in Bekaert and Harvey (2000),
Venezuela is not included in the list of countries that introduced a country fund. In the regression
sample, Taiwan is excluded for lack of trade data, and South Korea is excluded because it is a
major machine exporter.
Introduction of American Depository Receipts (ADRs), taken from Bekaert and Harvey
(2000). An ADR is a foreign security that is held by an American financial institution. The
institution holds the underlying security and issues a corresponding share, traded in U.S. dollars
and classified as a domestic security. In the regression sample, Taiwan is excluded for lack of
trade data, and South Korea is excluded because it is a major machine exporter.
IMF’s Capital Account Liberalization Index, from the IMF's Annual Report on Exchange
Arrangements and Exchange Restriction (AREAER). The index was constructed using data on
multiple exchange arrangements, payments restrictions on current transactions and on capital
transactions, and repatriation requirements for export proceeds. A corresponding dummy variable
takes the value of one if each of the restrictions was present in each country each year. In order
for our IMF indicator to fall between 0 and 1 and increase with openness, our IMF capital control
measure is the negative of the average of the four dummy variables for each country.
[44] Weatherhead Center for International Affairs
Trade Liberalization Dates, from Wacziarg and Welch (WW) (2003). The authors update
the Sachs and Warner (SW) (1995) database of trade liberalization indicators. SW define a
country as closed if one of the following is true: average tariff rates are 40% or more; non-tariff
barriers cover 40% or more of trade; a black market exchange rate exists and is depreciated by on
average 20% or more relative to the official exchange rate; the state holds a monopoly on major
exports; or there is a socialist economic system. WW create a new dummy for the 1990s, as well
as define a liberalization date after which all the SW criteria are continuously met. The sample
includes 141 countries. By updating the SW dataset, they identified 18 countries that liberalized
between 1995 and 2001, and found 25 that were closed as of 2001. In the sample, 66 countries
liberalized between 1980 and 1997.
Macroeconomic Data, from the World Development Indicators (WDI): Terms of trade,
GDP growth (annual percentage growth rate of GDP at market prices based on constant local
currency), inflation (percent growth in the CPI), industrialized country growth (High Income
country GDP growth as defined in the WDI), real interest rate for the U.S (lending interest rate
adjusted for inflation as measured by the GDP deflator), net Foreign Direct Investment (FDI)
inflows.
Financial market data, from Financial Structure Database and the World Development
Indicators: Stock market capitalization, new equity issues, and private credit by deposit banks
and other financial institutions as a percent of GDP are taken from the Beck, Demirguc-Kunt and
Levine (2001) Financial Structure Database. GDP, net equity inflows, and turnover as a percent
of GDP are taken from WDI.
Growth opportunities, from Bekaert, Harvey, and Lundblad (2005): This measure is
constructed as follows. First, for each industry at the 3-digit SIC code level, the authors calculate
the global price-to-earnings (PE) ratio for all countries. Then, they calculate a country-specific
measure of these growth opportunities, measured by the average the industry PE ratios weighted
by the industry’s share in the local economy. They calculate the weights using both the weights
Alfaro/Hammel [45]
of the industry in the domestic stock market and also by the fraction of value added in production
for each industry. They finally adjust this measure by dividing it by the world weighted average
PE ratio. As the authors explain, this measure captures a country’s growth opportunities that are
plausibly exogenous to any of the concurrent economic policies of countries that liberalized in the
1980s and 1990s.

Algeria Syrian Arab RepublicBangladesh TogoBarbados Trinidad And TobagoBenin TunisiaBurkina Faso UruguayCameroon ZambiaCentral Afr. Rep.ChadCongo AustraliaCosta Rica AustriaCote D'Ivoire DenmarkDominican Republic FinlandEcuador IrelandEl Salvador NorwayFijiGabonGambia ArgentinaGhana BrazilGuatemala ChileGuyana ColombiaHaiti EgyptHonduras GreeceIceland IndiaIran IndonesiaJamaica IsraelKenya JordanKuwait MalaysiaMadagascar MexicoMalawi MoroccoMali New ZealandMalta NigeriaMauritius PakistanNepal PhilippinesNicaragua PortugalNiger South AfricaOman SpainParaguay Sri LankaPeru ThailandRwanda TurkeySaudi Arabia VenezuelaSenegal ZimbabweSierra Leone
Countries that liberalized between 1980-1997
Notes : Liberalization dates are taken from Bekaert, Harvey, Lundblad (2005).
Data Appendix II: Sample of 95 Countries
Countries that never liberalized Countries that never liberalized (cont .)
Countries that liberalized before 1980
[46] Weatherhead Center for International Affairs
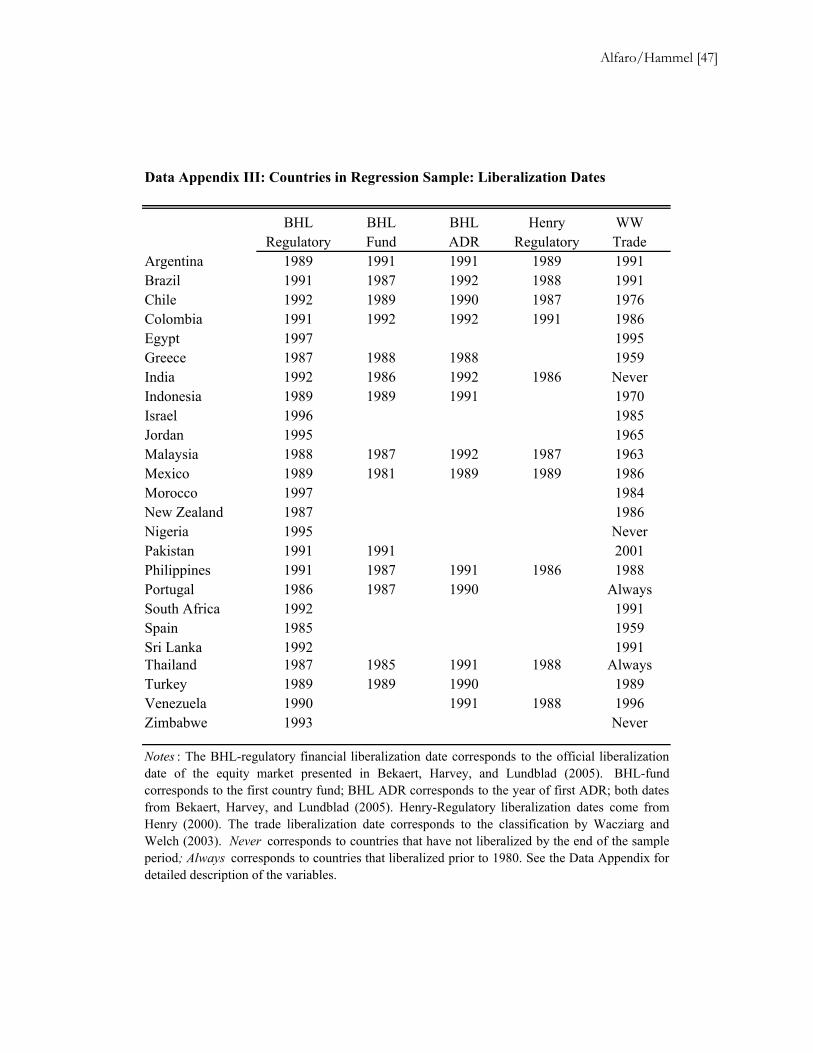
BHL BHL BHL Henry WWRegulatory Fund ADR Regulatory Trade
Argentina 1989 1991 1991 1989 1991Brazil 1991 1987 1992 1988 1991Chile 1992 1989 1990 1987 1976Colombia 1991 1992 1992 1991 1986Egypt 1997 1995Greece 1987 1988 1988 1959India 1992 1986 1992 1986 NeverIndonesia 1989 1989 1991 1970Israel 1996 1985Jordan 1995 1965Malaysia 1988 1987 1992 1987 1963Mexico 1989 1981 1989 1989 1986Morocco 1997 1984New Zealand 1987 1986Nigeria 1995 NeverPakistan 1991 1991 2001Philippines 1991 1987 1991 1986 1988Portugal 1986 1987 1990 AlwaysSouth Africa 1992 1991Spain 1985 1959Sri Lanka 1992 1991Thailand 1987 1985 1991 1988 AlwaysTurkey 1989 1989 1990 1989Venezuela 1990 1991 1988 1996Zimbabwe 1993 Never
Notes : The BHL-regulatory financial liberalization date corresponds to the official liberalizationdate of the equity market presented in Bekaert, Harvey, and Lundblad (2005). BHL-fundcorresponds to the first country fund; BHL ADR corresponds to the year of first ADR; both datesfrom Bekaert, Harvey, and Lundblad (2005). Henry-Regulatory liberalization dates come fromHenry (2000). The trade liberalization date corresponds to the classification by Wacziarg andWelch (2003). Never corresponds to countries that have not liberalized by the end of the sampleperiod; Always corresponds to countries that liberalized prior to 1980. See the Data Appendix fordetailed description of the variables.
Data Appendix III: Countries in Regression Sample: Liberalization Dates
Alfaro/Hammel [47]
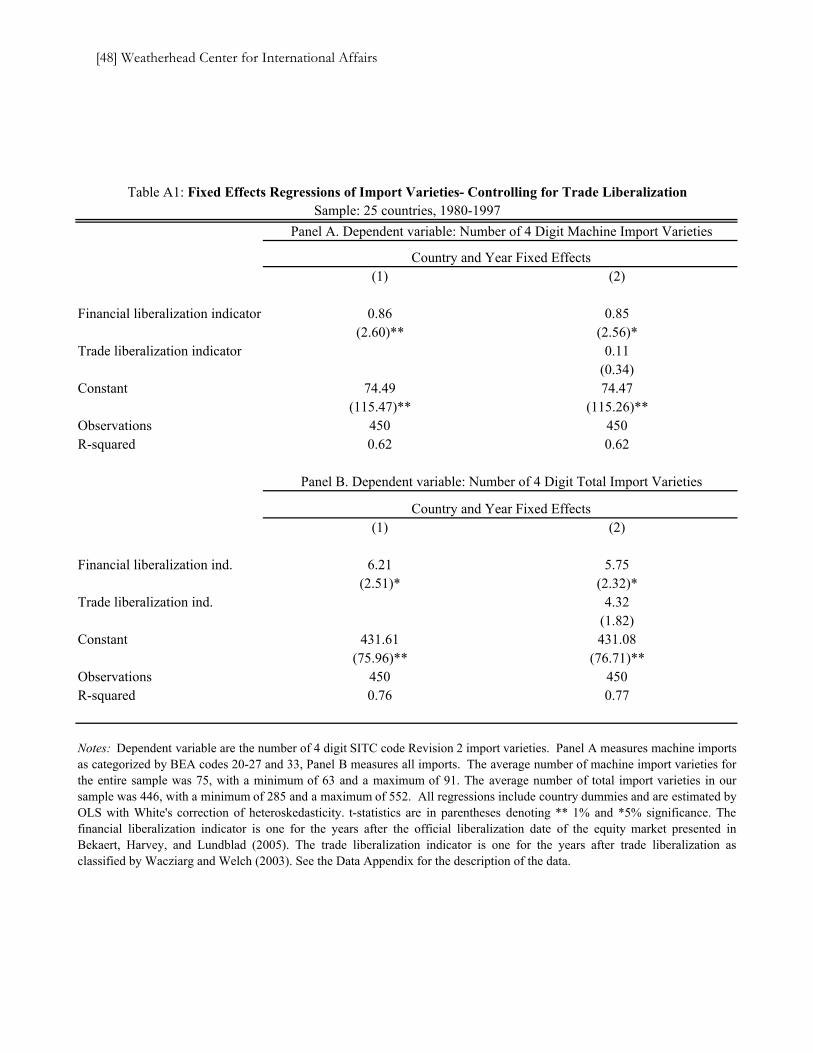
(1) (2)
Financial liberalization indicator 0.86 0.85(2.60)** (2.56)*
Trade liberalization indicator 0.11(0.34)
Constant 74.49 74.47(115.47)** (115.26)**
Observations 450 450R-squared 0.62 0.62
(1) (2)
Financial liberalization ind. 6.21 5.75(2.51)* (2.32)*
Trade liberalization ind. 4.32(1.82)
Constant 431.61 431.08(75.96)** (76.71)**
Observations 450 450R-squared 0.76 0.77
Notes: Dependent variable are the number of 4 digit SITC code Revision 2 import varieties. Panel A measures machine importsas categorized by BEA codes 20-27 and 33, Panel B measures all imports. The average number of machine import varieties forthe entire sample was 75, with a minimum of 63 and a maximum of 91. The average number of total import varieties in oursample was 446, with a minimum of 285 and a maximum of 552. All regressions include country dummies and are estimated byOLS with White's correction of heteroskedasticity. t-statistics are in parentheses denoting ** 1% and *5% significance. Thefinancial liberalization indicator is one for the years after the official liberalization date of the equity market presented inBekaert, Harvey, and Lundblad (2005). The trade liberalization indicator is one for the years after trade liberalization asclassified by Wacziarg and Welch (2003). See the Data Appendix for the description of the data.
Country and Year Fixed Effects
Panel B. Dependent variable: Number of 4 Digit Total Import Varieties
Table A1: Fixed Effects Regressions of Import Varieties- Controlling for Trade LiberalizationSample: 25 countries, 1980-1997
Panel A. Dependent variable: Number of 4 Digit Machine Import Varieties
Country and Year Fixed Effects
[48] Weatherhead Center for International Affairs
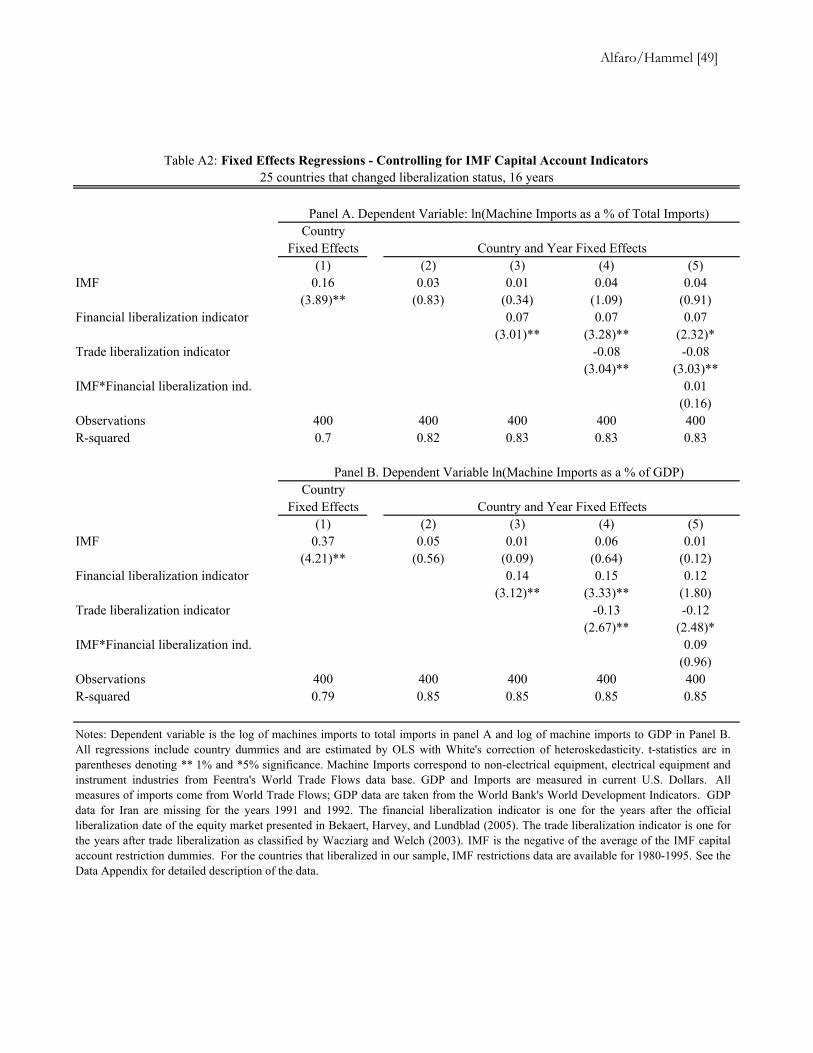
CountryFixed Effects
(1) (2) (3) (4) (5)IMF 0.16 0.03 0.01 0.04 0.04
(3.89)** (0.83) (0.34) (1.09) (0.91)Financial liberalization indicator 0.07 0.07 0.07
(3.01)** (3.28)** (2.32)*Trade liberalization indicator -0.08 -0.08
(3.04)** (3.03)**IMF*Financial liberalization ind. 0.01
(0.16)Observations 400 400 400 400 400R-squared 0.7 0.82 0.83 0.83 0.83
CountryFixed Effects
(1) (2) (3) (4) (5)IMF 0.37 0.05 0.01 0.06 0.01
(4.21)** (0.56) (0.09) (0.64) (0.12)Financial liberalization indicator 0.14 0.15 0.12
(3.12)** (3.33)** (1.80)Trade liberalization indicator -0.13 -0.12
(2.67)** (2.48)*IMF*Financial liberalization ind. 0.09
(0.96)Observations 400 400 400 400 400R-squared 0.79 0.85 0.85 0.85 0.85
Table A2: Fixed Effects Regressions - Controlling for IMF Capital Account Indicators25 countries that changed liberalization status, 16 years
Panel B. Dependent Variable ln(Machine Imports as a % of GDP)
Panel A. Dependent Variable: ln(Machine Imports as a % of Total Imports)
Country and Year Fixed Effects
Country and Year Fixed Effects
Notes: Dependent variable is the log of machines imports to total imports in panel A and log of machine imports to GDP in Panel B.All regressions include country dummies and are estimated by OLS with White's correction of heteroskedasticity. t-statistics are inparentheses denoting ** 1% and *5% significance. Machine Imports correspond to non-electrical equipment, electrical equipment andinstrument industries from Feentra's World Trade Flows data base. GDP and Imports are measured in current U.S. Dollars. Allmeasures of imports come from World Trade Flows; GDP data are taken from the World Bank's World Development Indicators. GDPdata for Iran are missing for the years 1991 and 1992. The financial liberalization indicator is one for the years after the officialliberalization date of the equity market presented in Bekaert, Harvey, and Lundblad (2005). The trade liberalization indicator is one forthe years after trade liberalization as classified by Wacziarg and Welch (2003). IMF is the negative of the average of the IMF capitalaccount restriction dummies. For the countries that liberalized in our sample, IMF restrictions data are available for 1980-1995. See theData Appendix for detailed description of the data.
Alfaro/Hammel [49]
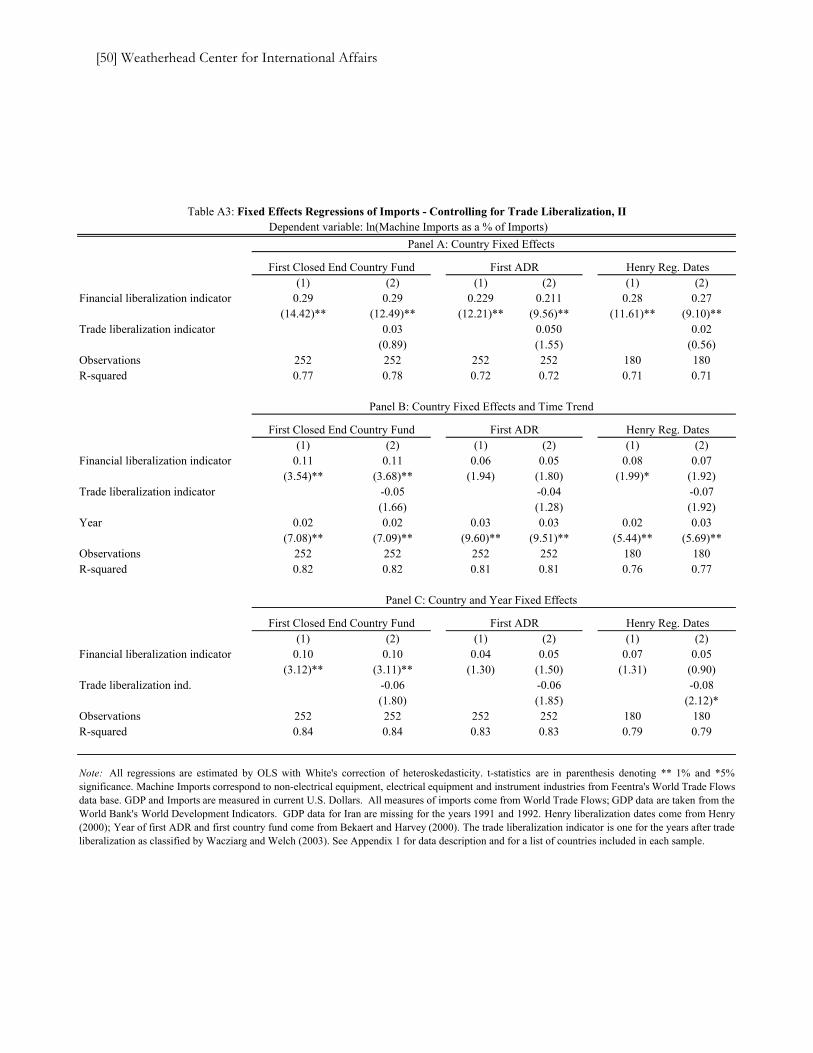
Panel A: Country Fixed Effects
(1) (2) (1) (2) (1) (2)Financial liberalization indicator 0.29 0.29 0.229 0.211 0.28 0.27
(14.42)** (12.49)** (12.21)** (9.56)** (11.61)** (9.10)**Trade liberalization indicator 0.03 0.050 0.02
(0.89) (1.55) (0.56)Observations 252 252 252 252 180 180R-squared 0.77 0.78 0.72 0.72 0.71 0.71
Panel B: Country Fixed Effects and Time Trend
(1) (2) (1) (2) (1) (2)Financial liberalization indicator 0.11 0.11 0.06 0.05 0.08 0.07
(3.54)** (3.68)** (1.94) (1.80) (1.99)* (1.92)Trade liberalization indicator -0.05 -0.04 -0.07
(1.66) (1.28) (1.92)Year 0.02 0.02 0.03 0.03 0.02 0.03
(7.08)** (7.09)** (9.60)** (9.51)** (5.44)** (5.69)**Observations 252 252 252 252 180 180R-squared 0.82 0.82 0.81 0.81 0.76 0.77
Panel C: Country and Year Fixed Effects
(1) (2) (1) (2) (1) (2)Financial liberalization indicator 0.10 0.10 0.04 0.05 0.07 0.05
(3.12)** (3.11)** (1.30) (1.50) (1.31) (0.90)Trade liberalization ind. -0.06 -0.06 -0.08
(1.80) (1.85) (2.12)*Observations 252 252 252 252 180 180R-squared 0.84 0.84 0.83 0.83 0.79 0.79
Note: All regressions are estimated by OLS with White's correction of heteroskedasticity. t-statistics are in parenthesis denoting ** 1% and *5%significance. Machine Imports correspond to non-electrical equipment, electrical equipment and instrument industries from Feentra's World Trade Flowsdata base. GDP and Imports are measured in current U.S. Dollars. All measures of imports come from World Trade Flows; GDP data are taken from theWorld Bank's World Development Indicators. GDP data for Iran are missing for the years 1991 and 1992. Henry liberalization dates come from Henry(2000); Year of first ADR and first country fund come from Bekaert and Harvey (2000). The trade liberalization indicator is one for the years after tradeliberalization as classified by Wacziarg and Welch (2003). See Appendix 1 for data description and for a list of countries included in each sample.
First Closed End Country Fund First ADR
Henry Reg. DatesFirst Closed End Country Fund First ADR
First Closed End Country Fund First ADR Henry Reg. Dates
Henry Reg. Dates
Table A3: Fixed Effects Regressions of Imports - Controlling for Trade Liberalization, IIDependent variable: ln(Machine Imports as a % of Imports)
[50] Weatherhead Center for International Affairs

Panel A: Country Fixed Effects
(1) (2) (1) (2) (1) (2)Financial liberalization indicator 0.44 0.38 0.48 0.45 0.53 0.48
(13.59)** (10.65)** (14.34)** (12.94)** (12.02)** (8.88)**Trade liberalization indicator 0.21 0.10 0.12
(3.23)** (1.79) (1.48)Observations 252 252 252 252 180 180R-squared 0.87 0.88 0.88 0.88 0.89 0.89
Panel B: Country Fixed Effects and Time Trend
(1) (2) (1) (2) (1) (2)Financial liberalization indicator 0.03 0.02 0.15 0.15 0.14 0.14
(0.44) (0.39) (2.53)* (2.55)* (1.86) (1.84)Trade liberalization indicator 0.06 0.00 -0.04
(1.08) (0.04) (0.57)Year 0.046 0.05 0.04 0.04 0.04 0.04
(7.14)** (6.70)** (5.49)** (5.33)** (4.81)** (5.07)**Observations 252 252 252 252 180 180R-squared 0.91 0.91 0.90 0.90 0.91 0.91
Panel C: Country and Year Fixed Effects
(1) (2) (1) (2) (1) (2)Financial liberalization ind. 0.02 0.01 0.12 0.12 0.07 0.05
(0.23) (0.21) (1.51) (1.57) (0.74) (0.52)Trade liberalization ind. 0.04 -0.03 -0.09
(0.71) (0.47) (1.23)Observations 252 252 252 252 180 180R-squared 0.91 0.91 0.91 0.91 0.93 0.93
Note: All regressions are estimated by OLS with White's correction of heteroskedasticity. t-statistics are in parenthesis denoting ** 1% and *5%significance. Machine Imports correspond to non-electrical equipment, electrical equipment and instrument industries from Feentra's World TradeFlows data base. GDP and Imports are measured in current U.S. Dollars. All measures of imports come from World Trade Flows; GDP data are takenfrom the World Bank's World Development Indicators. GDP data for Iran are missing for the years 1991 and 1992. Henry liberalization dates comefrom Henry (2000); Year of first ADR and first country fund come from Bekaert and Harvey (2000). The trade liberalization indicator is one for theyears after trade liberalization as classified by Wacziarg and Welch (2003). See Appendix 1 for data description and for a list of countries included ineach sample.
Dependent variable: ln(Machine Imports as a % of GDP)
Henry Reg. Dates
Henry Reg. Dates
Henry Reg. DatesFirst Closed End Country Fund First ADR
Table A4: Fixed Effects Regressions of Imports - Controlling for Trade Liberalization, II
First Closed End Country Fund First ADR
First Closed End Country Fund First ADR
Alfaro/Hammel [51]
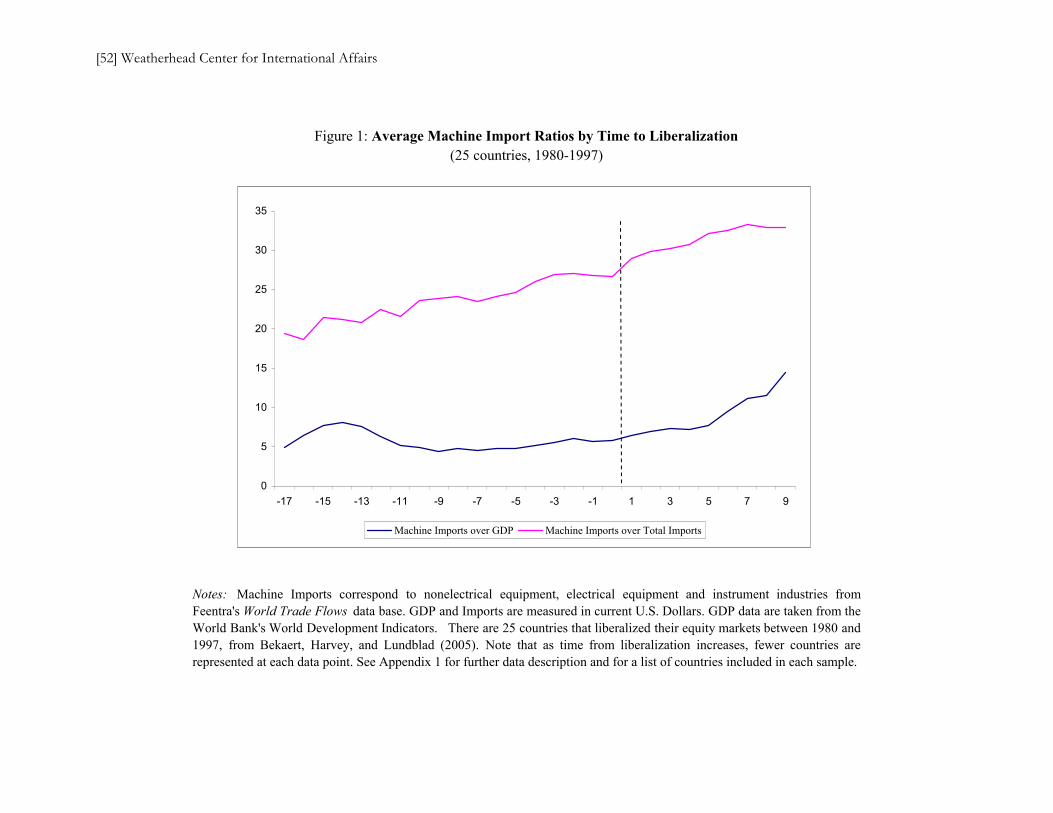
Notes: Machine Imports correspond to nonelectrical equipment, electrical equipment and instrument industries fromFeentra's World Trade Flows data base. GDP and Imports are measured in current U.S. Dollars. GDP data are taken from theWorld Bank's World Development Indicators. There are 25 countries that liberalized their equity markets between 1980 and1997, from Bekaert, Harvey, and Lundblad (2005). Note that as time from liberalization increases, fewer countries arerepresented at each data point. See Appendix 1 for further data description and for a list of countries included in each sample.
Figure 1: Average Machine Import Ratios by Time to Liberalization(25 countries, 1980-1997)
0
5
10
15
20
25
30
35
-17 -15 -13 -11 -9 -7 -5 -3 -1 1 3 5 7 9
Machine Imports over GDP Machine Imports over Total Imports
[52] Weatherhead Center for International Affairs
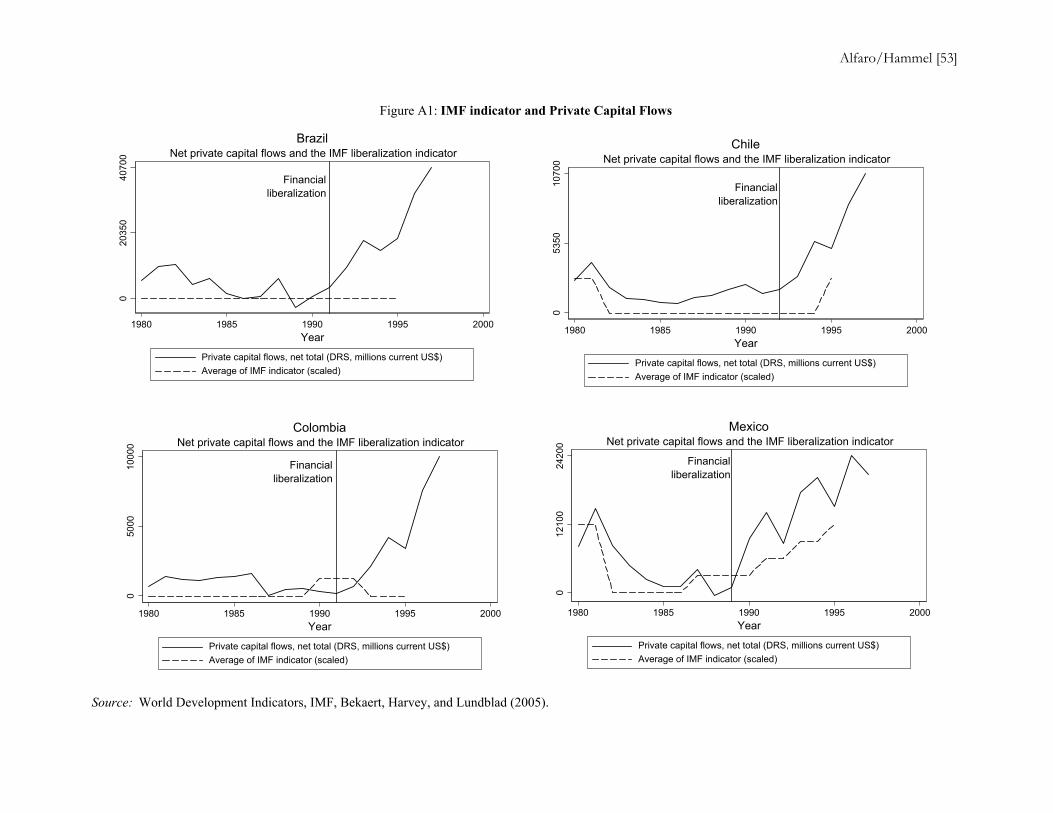
Figure A1: IMF indicator and Private Capital Flows
Source: World Development Indicators, IMF, Bekaert, Harvey, and Lundblad (2005).
053
5010
700
1980 1985 1990 1995 2000Year
Private capital flows, net total (DRS, millions current US$)Average of IMF indicator (scaled)
Net private capital flows and the IMF liberalization indicatorChile
020
350
4070
0
1980 1985 1990 1995 2000Year
Private capital flows, net total (DRS, millions current US$)Average of IMF indicator (scaled)
Net private capital flows and the IMF liberalization indicatorBrazil
050
0010
000
1980 1985 1990 1995 2000Year
Private capital flows, net total (DRS, millions current US$)Average of IMF indicator (scaled)
Net private capital flows and the IMF liberalization indicatorColombia
012
100
2420
0
1980 1985 1990 1995 2000Year
Private capital flows, net total (DRS, millions current US$)Average of IMF indicator (scaled)
Net private capital flows and the IMF liberalization indicatorMexico
Financialliberalization Financial
liberalization
Financialliberalization
Financialliberalization
Alfaro/Hammel [53]
[54] Weatherhead Center for International Affairs
Bibliography
Anderson, James, and Eric van Wincoop. “Trade Costs.” Journal of Economic Literature 42, no. 3 (2004):
691–751.
Bartolini, Leonardo, and Allan Drazen. "When Liberal Policies Reflect External Shocks, What Do We
Learn?" Journal of International Economics 42, no. 3-4 (1997): 249-273.
Beck, Thorsten, Asli Demirguc-Kunt, and Ross Levine. “The Financial Structure Database.” In Financial
Structure and Economic Growth, Asli Demirguc-Kunt and Ross Levine, editors. Cambridge, MA:
MIT Press, 2001.
Bekaert, Gert, and Campbell R. Harvey. “Foreign Speculators and Emerging Equity Markets.” Journal of
Finance 55, no. 2 (2000): 565-613.
Bekaert, Geert, Campbell R. Harvey, and Robin L. Lumsdaine. “Dating the Integration of World Equity
Markets.” Working Paper No. 6724, National Bureau of Economic Research, September 1998.
Bekaert, Geert, Campbell R. Harvey, and Christian Lundblad. “Does Financial Liberalization Spur
Growth?” Journal of Financial Economics 77, no. 1 (2005): 3-55.
Bernanke, Ben S. Remarks at the Sandridge Lecture, Virginia Association of Economics, Richmond,
Virginia, March 10, 2005. http://www.federalreserve.gov/boarddocs/speeches/2005/200503102
/default.htm.
Bertrand, Marianne, Esther Duflo, and Sendhil Mullainathan. “How Much Should We Trust Differences-
in-Differences Estimates?” The Quarterly Journal of Economics 119, no. 1 (2004): 249-75.
Blomstrom, Magnus, Robert E. Lipsey, and Mario Zejan. “Is Fixed Investment the Key to Economic
Growth,” The Quarterly Journal of Economics 111, no. 1 (1996): 269-276.
Bulmer-Thomas, V. The Economic History of Latin America Since Independence. Cambridge, UK:
Cambridge University Press, 1994.
Calvo, G., and C. Vegh. “Inflation Stabilization and BOP Crises in Developing Countries.” In Handbook of
Macroeconomics Volume 1C, J.B. Taylor and M. Woodford, editors. Amsterdam: EconPapers,
Örebro University,1999.
Alfaro/Hammel [55]
Caselli, Franceso, and Wilbur J. Coleman II. “The World Technology Frontier,” Working Paper No. 7904,
National Bureau of Economic Research, September 2000.
Caselli, F., and D. Wilson. “Importing Technology.” Journal of Monetary Economics 51 (2003): 1-32.
Chari, Anusha, and Peter Blair Henry. “Risk Sharing and Asset Prices: Evidence From a Natural
Experiment.” Journal of Finance 59, no. 3 (2004): 1295-1324.
Coe, D. T., and E. Helpman. “International R&D Spillovers.” European Economic Review 39 (1995): 859-
887.
Coe, D.T., E. Helpman, and A. Hoffmaister. “North-South R&D Spillovers.” Economic Journal 107
(1997): 134-149.
Corsetti, G., P. Pesenti, and N. Roubini. “What Caused the Asian Currency and Financial Crisis?" Japan
and the World Economy 11 (1999): 305-373.
DeLong, J. Bradford “Should We Still Support Untrammeled International Capital Mobility? Or Are
Capital Controls Less Evil than We Once Believed?” The Economists’ Voice 1, no. 1 (2004).
http://www.bepress.com/ev/vol1/iss1/art1/.
DeLong, J. Bradford, and Lawrence H. Summers. “Equipment Investment and Economic Growth.” The
Quarterly Journal of Economics 106, no. 2 (1991): 445-502.
DeLong, J. Bradford, and Lawrence H. Summers. “Equipment Investment and Economic Growth: How
Strong Is the Nexus?” Brookings Papers on Economic Activity 1992, no. 2 (1992): 157-99.
DeLong, J. Bradford, and Lawrence H. Summers. “How Strongly Do Developing Economies Benefit from
Equipment Investment?” Journal of Monetary Economics 32, no. 3 (1993): 395-415.
Eaton, Jonathan, and Samuel Kortum. “Trade in Capital Goods.” European Economic Review 45, no. 7
(2001): 1195-1235.
Edison, Hali J., Michael W. Klein, Luca Ricci, and Torsten Sloek. “Capital Account Liberalization and
Economic Performance: Survey and Synthesis.” Working Paper No. 9100, National Bureau of
Economic Research, August 2002.
Edison, Hali J., and Francis E. Warnock. “A Simple Measure of the Intensity of Capital Controls.” Journal
of Empirical Finance 10, no. 1-2 (2001): 81-103.
[56] Weatherhead Center for International Affairs
Edwards, Sebastian. “Capital Mobility and Economic Performance: Are Emerging Economies Different?''
Working Paper No. 8076, National Bureau of Economic Research, January 2001.
Feenstra, Robert C., Robert E. Lipsey, and Harry P. Bowen. “World Trade Flows, 1980-1997, with
Production and Tariff Data.” Working Paper No. 5910, National Bureau of Economic Research,
January 1997.
Forbes, Kristin. “Capital Controls: Mud in the Wheels of Market Discipline,” Working Paper No. 10284,
National Bureau of Economic Research, February 2004.
Fuchs-Schündeln, Nicola, and Norbert Funke. “Stock Market Liberalizations: Financial and
Macroeconomic Implications,” Working Paper No. 01/193, International Monetary Fund,
December 2001.
Grossman, Gene. and Elhanan. Helpman. Innovation and Growth in the Global Economy. Cambridge, MA:
MIT Press, 1991.
Henry, Peter Blair. “Stock Market Liberalization, Economic Reform, and Emerging Market Equity Prices.”
Journal of Finance 55, no. 2 (April 2000): 529-564.
Henry, Peter Blair. “Do Stock Market Liberalizations Cause Investment Booms.” Journal of Financial
Economics 58, no. 1-2 (October 2000): 301-334.
Henry, Peter Blair, and Peter L. Lorentzen. “Domestic Capital Market Reform and Access to Global
Finance: Making Markets Work.” Working Paper No. 10064, National Bureau of Economic
Research, November 2003.
Hsieh, Chang-Tai, and Peter J. Klenow. “Relative Prices and Relative Prosperity.” Working Paper No.
9701, National Bureau of Economic Research, May 2003.
International Monetary Fund. Annual Report on Exchange Arrangements and Exchange Restriction.
Various issues. Washington, DC: International Monetary Fund.
Jorgenson, D. W. “Productivity and Postwar U.S. Economic Growth.” Journal of Economic Perspectives 2
(1988): 23-41.
Keller, Wolfgang. “International Technology Diffusion.” Journal of Economic Literature 42, no. 3 (2004):
752-782.
Alfaro/Hammel [57]
Klenow, Pete, and Andrés Rodríguez-Clare. “Quantifying Variety Gains from Trade Liberalization.”
Mimeo, University of Chicago, 1997.
Lee, Jong-Wha. “Capital Goods Imports and Long-Run Growth.” Journal of Development Economics 48,
no. 1 (1995): 91-110.
Levin, Andrew, Chien-Fu Lin and Chia-Shang James Chu. “Unit Root Tests in Panel Data: Asymptotic and
Finite-Sample Properties.” Journal of Econometrics 108, no. 1 (2002): 1-24.
Levine, Ross, and Sara Zervos. “Capital Control Liberalization and Stock Market Development.” World
Development 26, no. 7 (1998): 1169-1183.
Mody, Ashoka, and Kamil Yilmaz. “Imported Machinery for Export Competitiveness.” The World Bank
Economic Review 16, no. 1 (2002): 23-48.
Obstfeld, Maurice, Alan Taylor, Ryzuo Sato, editors. Global Capital Markets Integration, Crisis, and
Growth. Cambridge, UK: Cambridge University Press, 2004.
Prasad, Eswar, Rogoff, Kenneth, Wei, Shang-Jin, Kose, M. Ayhan. “The Effects of Financial Globalization
on Developing Countries: Some Empirical Evidence.” Occasional Paper No. 220. International
Monetary Fund, September 2003.
Quinn, Dennis P. “The Correlates of Change in International Financial Regulation.” American Political
Science Review 91, no. 3 (1997): 531-551.
Rodrik, Dani. “Why We Learn Nothing from Regressing Economic Growth on Policies.” Mimeo, John F.
Kennedy School of Government, March 2005.
Sachs, Jeffrey D., and Andrew Warner, Anders Aslund, Stanley Fischer. "Economic Reform and the
Process of Global Integration.” Brookings Papers on Economic Activity 1995, no. 1 (1995): 1-95.
Wacziarg, Romain, and Karen H. Welch. “Trade Liberalization and Growth: New Evidence.” Working
Paper No. 10152, National Bureau of Economic Research, December 2003.
World Bank. World Development Indicators. Washington, D.C.: World Bank, 2002.