Embed Size (px)
DESCRIPTION
Presented by: Nidhi Sharma
Citation preview

A RESEARCH PROJECT BY: NIDHI SHARMA
ROLL NO.: IM-98-35 COURSE: MMS (5YRS.) – VII SEM.
AN INTRODUCTION TOTHE CAPITAL ASSET PRICING MODEL
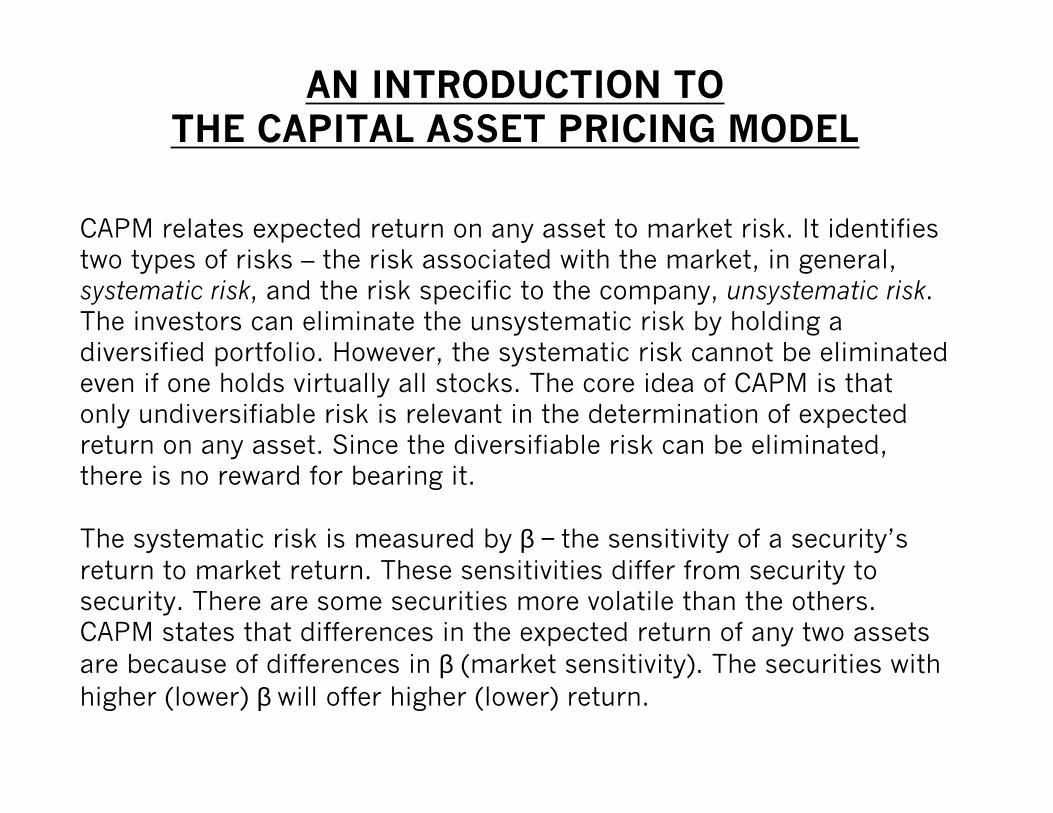
CAPM relates expected return on any asset to market risk. It identifies two types of risks – the risk associated with the market, in general, systematic risk, and the risk specific to the company, unsystematic risk. The investors can eliminate the unsystematic risk by holding a diversified portfolio. However, the systematic risk cannot be eliminated even if one holds virtually all stocks. The core idea of CAPM is that only undiversifiable risk is relevant in the determination of expected return on any asset. Since the diversifiable risk can be eliminated, there is no reward for bearing it. The systematic risk is measured by β − the sensitivity of a security’s return to market return. These sensitivities differ from security to security. There are some securities more volatile than the others. CAPM states that differences in the expected return of any two assets are because of differences in β (market sensitivity). The securities with higher (lower) β will offer higher (lower) return.
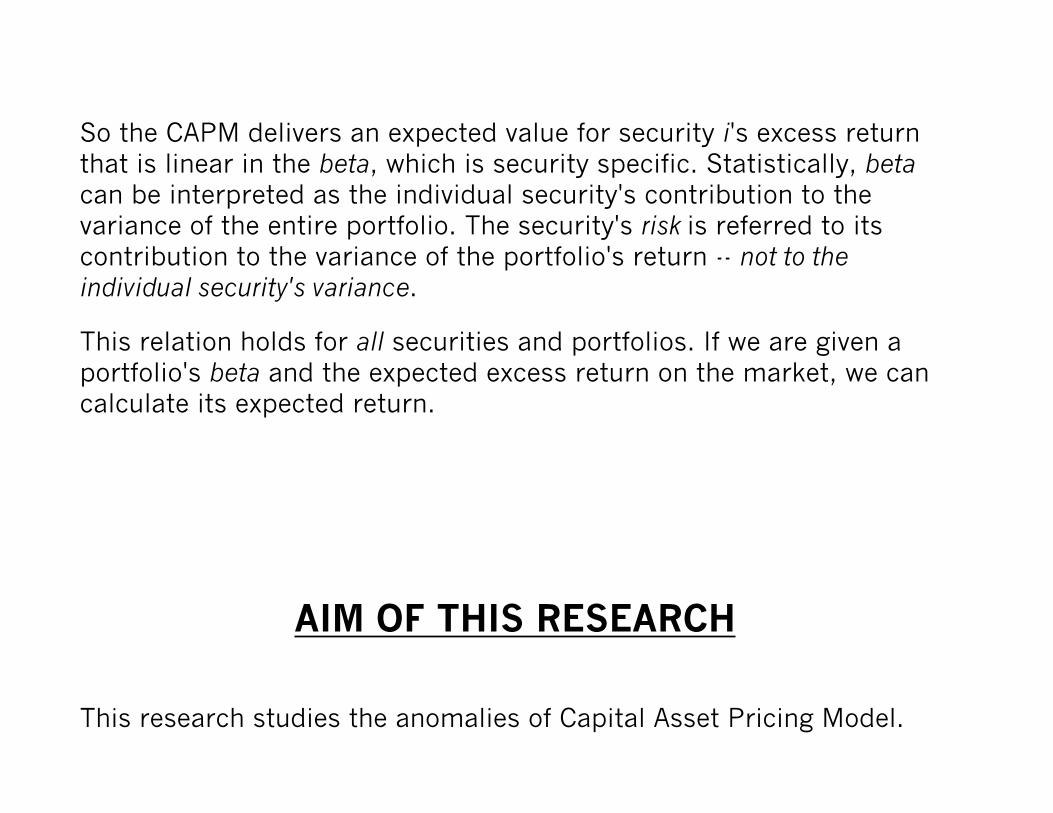
So the CAPM delivers an expected value for security i's excess return that is linear in the beta, which is security specific. Statistically, beta can be interpreted as the individual security's contribution to the variance of the entire portfolio. The security's risk is referred to its contribution to the variance of the portfolio's return -- not to the individual security's variance.
This relation holds for all securities and portfolios. If we are given a portfolio's beta and the expected excess return on the market, we can calculate its expected return.
AIM OF THIS RESEARCH
This research studies the anomalies of Capital Asset Pricing Model.
There is a controversy regarding the empirical validity of CAPM. This research work reviews the content and scope of the model, examines the issues in the controversy, and provides an empirical assessment of the model in India.
The question is, should one really believe in CAPM? Does anyone? Firstly, it does not say anything about the company. It is only some simple calculations using historical data of market and stock prices. As Warren Buffett has written, one company might make Barbie dolls and the other pet rocks; if they have the same beta, then CAPM says that one is as good as the other.
Secondly, it does not say anything about the price you pay for the stock. Current stock prices do not appear in the CAPM. (This is not quite true. They may have a small effect on the calculations of the beta.) The reason for this is that the CAPM depends on the notion that the market is efficient. “Whatever is the current price of a stock, this is what you should buy, or sell, it for. No amount of analysis will enable
With the Efficient Market Hypothesis, stock prices are assumed to follow paths that can be described by tosses of a coin.
you to outperform this strategy”, says EMH, the efficient market hypothesis.
LITERATURE REVIEW
§ Investing: Managing the Most Important Risks
Author – Paul MerrimanJournal – Journal of Finance, July 2001
§ Stocks Ben Graham Would Buy Today…Author – Narendra Nathan, Avinash Singh, Clifford Alvares, Vishal ChhabariaJournal – Intelligent Investor, January 10, 2001

§ Capital Asset Pricing Model: Should We Stop Using It?
Author – Valeed A AnsariJournal – Vikalpa, January-March 2000
§ The Cross-section of Expected ReturnAuthor – Fama E and French KJournal – Journal of Finance, Vol 47 1992
HYPOTHESIS FORMULATION
a) Expected returns on securities are a positive linear function of their market betas (market sensitivity). The securities with higher (lower) β will offer higher (lower) return. b) Market β is adequate to describe the cross section of expected returns. In other words, beta is the sole determinant of expected return.
DATA COLLECTION TECHNIQUES β is the ratio of the movements of an individual stock relative to the movements of the overall market portfolio or a proxy such as the S&P500 index. The portfolio containing all assets in the economy is called Market Portfolio. This portfolio plays a central role in CAPM. The market portfolio is unobservable, and therefore, it has to be proxied by some index like stock market. Technically speaking, β is the covariance of a stock’s return with the return on a market index scaled by variance of that index. It is also measured as slope in the regression of a stock’s return on market. CAPM predicts that risk premium varies in direct proportion to β.
These returns are plotted for 15 months in the year 1998-1999 for the S&P500 index and Gillette on the following chart. The thing to notice is that swings of Gillette are more pronounced than those of the index.
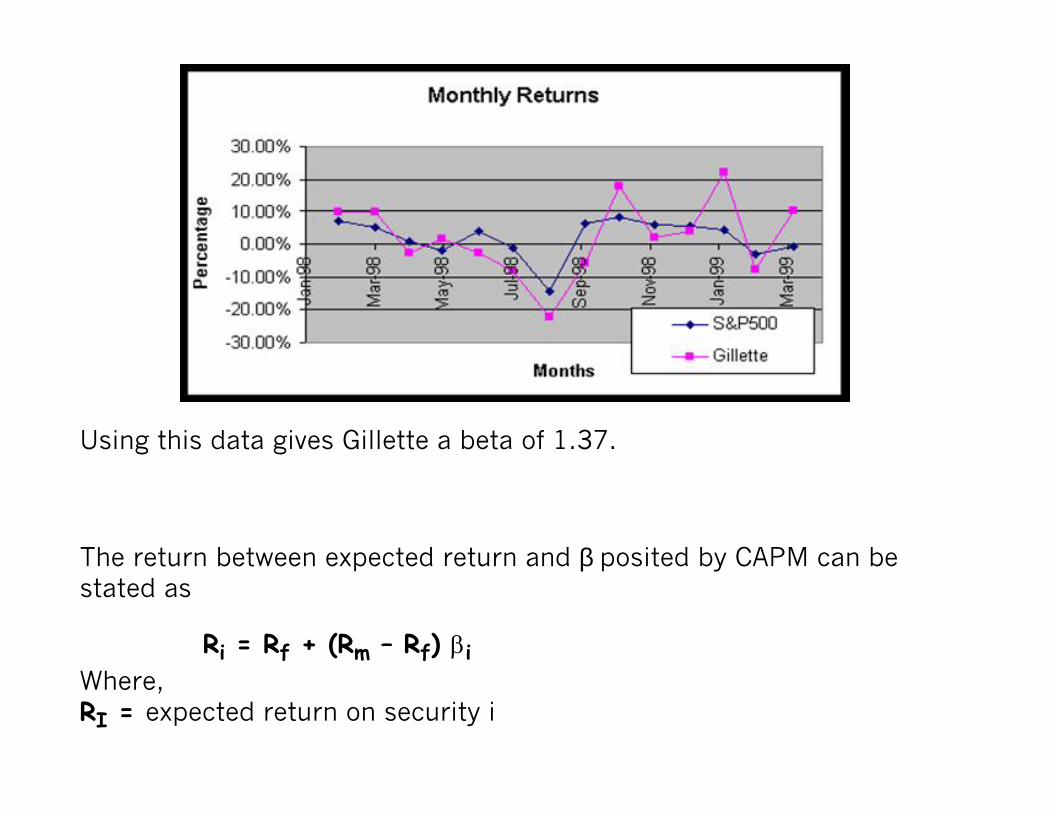
Using this data gives Gillette a beta of 1.37.
The return between expected return and β posited by CAPM can be stated as Ri = Rf + (Rm – Rf) βiWhere,RI = expected return on security i
Rf = risk – free interest rateRm = expected rate of return on market portfolioβI = for security IRm – Rf = market risk premium OrEXPECTED RETURN = PRICE OF TIME + PRICE OF RISK * AMOUNT OF RISK The first expression is the reward for waiting i.e. delaying consumption without risk. The second expression is the reward per unit of risk borne. This component is return required due to risk. Rm – Rf is the reward market offers for bearing average systematic risk in addition to waiting. The amount of systematic risk present in a security is presented by β. Thus, the return on any asset is risk-free rate plus the β multiplied by the market risk premium. CAPM assumes existence of risk-free asset. CAPM holds that market does not reward for bearing the risk which investors themselves can diversify.
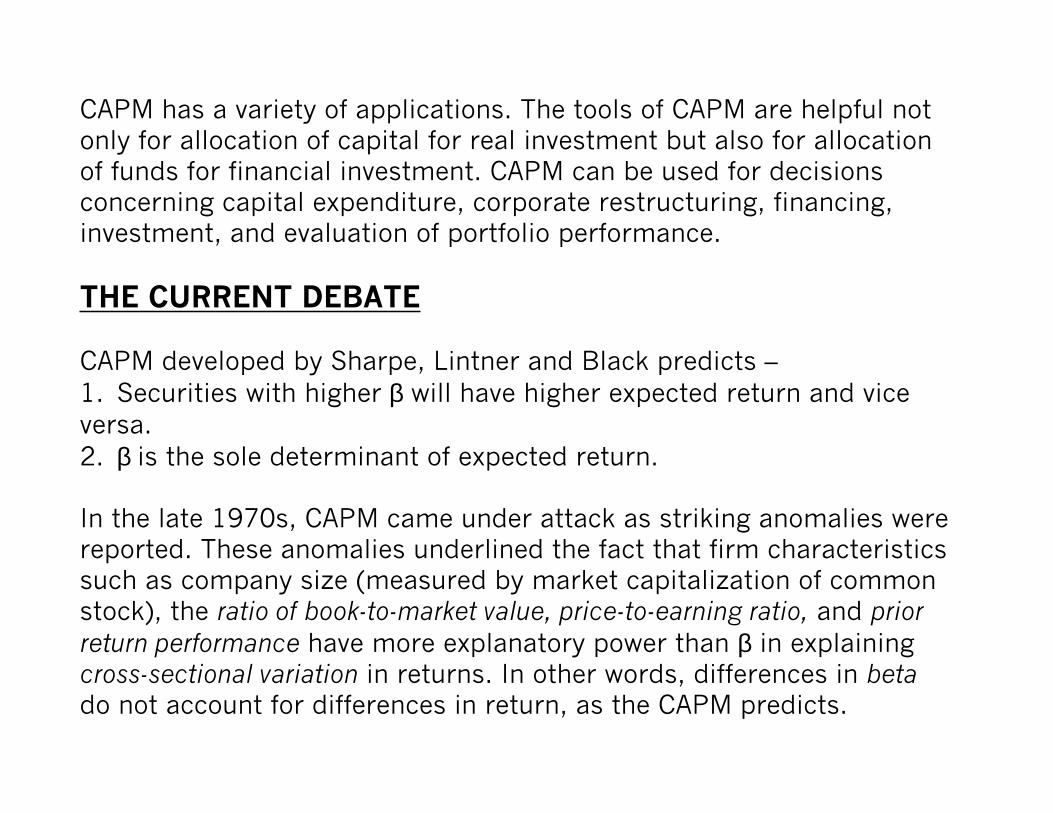
CAPM has a variety of applications. The tools of CAPM are helpful not only for allocation of capital for real investment but also for allocation of funds for financial investment. CAPM can be used for decisions concerning capital expenditure, corporate restructuring, financing, investment, and evaluation of portfolio performance. THE CURRENT DEBATE CAPM developed by Sharpe, Lintner and Black predicts – 1. Securities with higher β will have higher expected return and vice versa.2. β is the sole determinant of expected return. In the late 1970s, CAPM came under attack as striking anomalies were reported. These anomalies underlined the fact that firm characteristics such as company size (measured by market capitalization of common stock), the ratio of book-to-market value, price-to-earning ratio, and prior return performance have more explanatory power than β in explaining cross-sectional variation in returns. In other words, differences in beta do not account for differences in return, as the CAPM predicts.
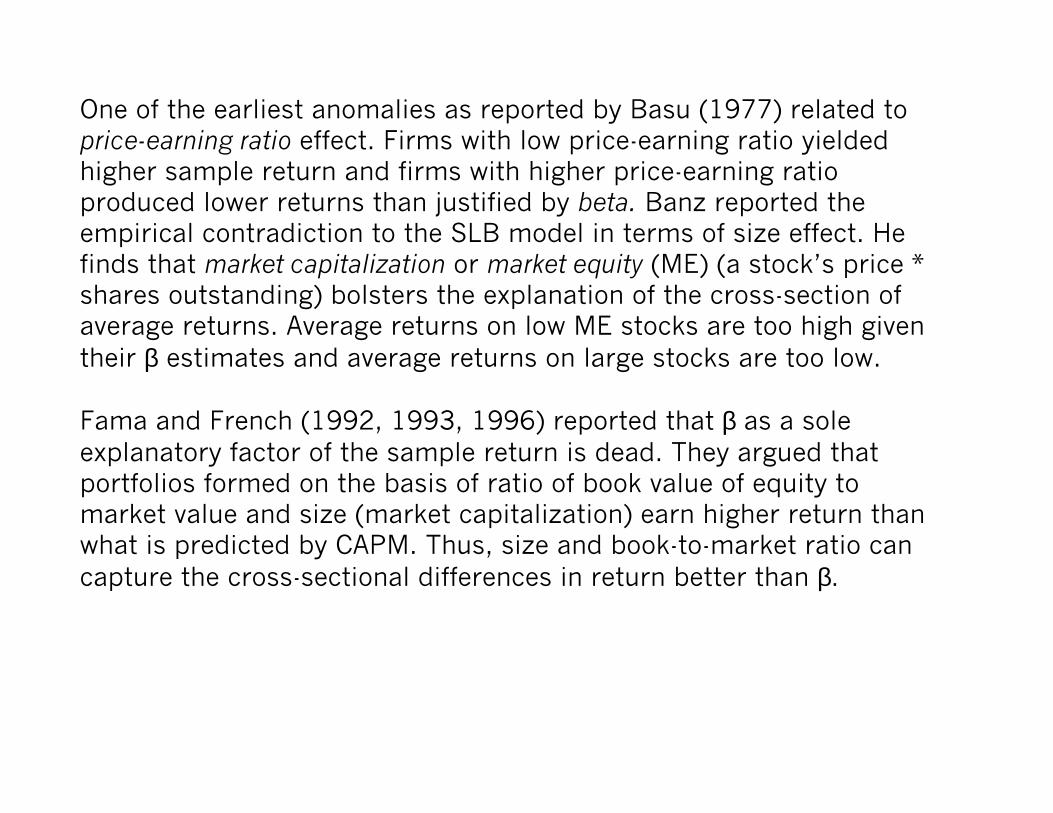
One of the earliest anomalies as reported by Basu (1977) related to price-earning ratio effect. Firms with low price-earning ratio yielded higher sample return and firms with higher price-earning ratio produced lower returns than justified by beta. Banz reported the empirical contradiction to the SLB model in terms of size effect. He finds that market capitalization or market equity (ME) (a stock’s price * shares outstanding) bolsters the explanation of the cross-section of average returns. Average returns on low ME stocks are too high given their β estimates and average returns on large stocks are too low. Fama and French (1992, 1993, 1996) reported that β as a sole explanatory factor of the sample return is dead. They argued that portfolios formed on the basis of ratio of book value of equity to market value and size (market capitalization) earn higher return than what is predicted by CAPM. Thus, size and book-to-market ratio can capture the cross-sectional differences in return better than β.
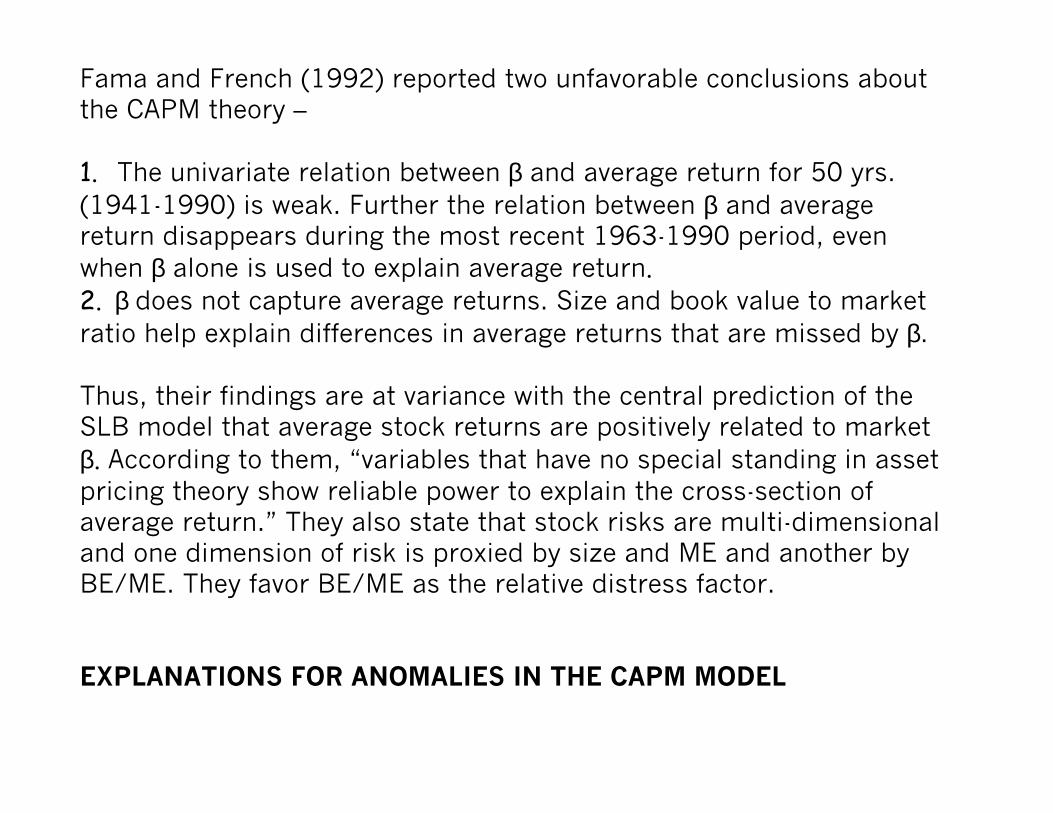
Fama and French (1992) reported two unfavorable conclusions about the CAPM theory – 1. The univariate relation between β and average return for 50 yrs. (1941-1990) is weak. Further the relation between β and average return disappears during the most recent 1963-1990 period, even when β alone is used to explain average return.2. β does not capture average returns. Size and book value to market ratio help explain differences in average returns that are missed by β. Thus, their findings are at variance with the central prediction of the SLB model that average stock returns are positively related to market β. According to them, “variables that have no special standing in asset pricing theory show reliable power to explain the cross-section of average return.” They also state that stock risks are multi-dimensional and one dimension of risk is proxied by size and ME and another by BE/ME. They favor BE/ME as the relative distress factor. EXPLANATIONS FOR ANOMALIES IN THE CAPM MODEL
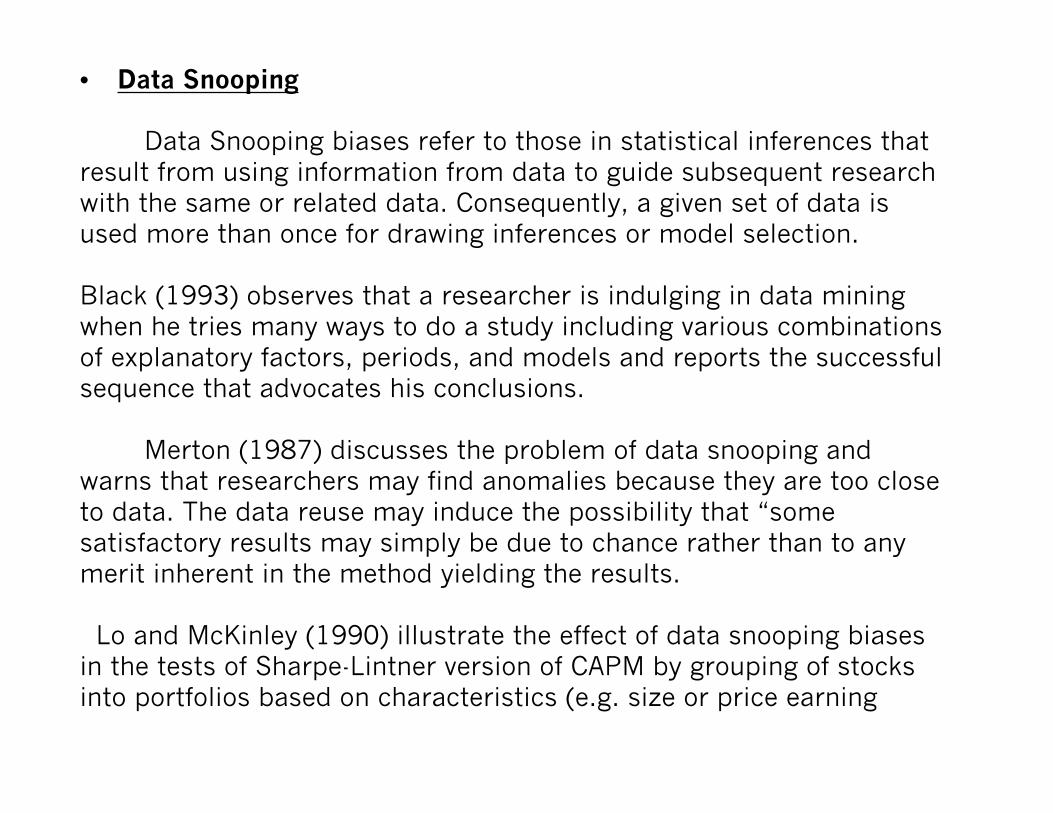
• Data Snooping Data Snooping biases refer to those in statistical inferences that result from using information from data to guide subsequent research with the same or related data. Consequently, a given set of data is used more than once for drawing inferences or model selection. Black (1993) observes that a researcher is indulging in data mining when he tries many ways to do a study including various combinations of explanatory factors, periods, and models and reports the successful sequence that advocates his conclusions. Merton (1987) discusses the problem of data snooping and warns that researchers may find anomalies because they are too close to data. The data reuse may induce the possibility that “some satisfactory results may simply be due to chance rather than to any merit inherent in the method yielding the results. Lo and McKinley (1990) illustrate the effect of data snooping biases in the tests of Sharpe-Lintner version of CAPM by grouping of stocks into portfolios based on characteristics (e.g. size or price earning
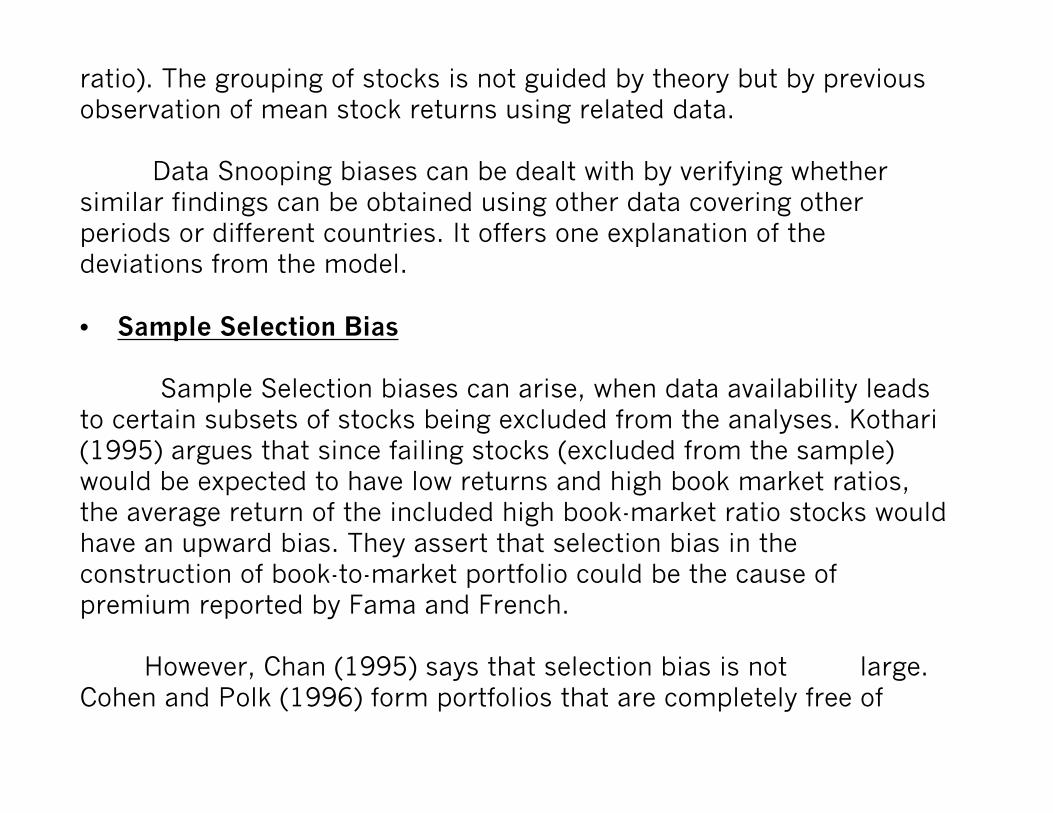
ratio). The grouping of stocks is not guided by theory but by previous observation of mean stock returns using related data. Data Snooping biases can be dealt with by verifying whether similar findings can be obtained using other data covering other periods or different countries. It offers one explanation of the deviations from the model.
• Sample Selection Bias Sample Selection biases can arise, when data availability leads to certain subsets of stocks being excluded from the analyses. Kothari (1995) argues that since failing stocks (excluded from the sample) would be expected to have low returns and high book market ratios, the average return of the included high book-market ratio stocks would have an upward bias. They assert that selection bias in the construction of book-to-market portfolio could be the cause of premium reported by Fama and French. However, Chan (1995) says that selection bias is not large. Cohen and Polk (1996) form portfolios that are completely free of
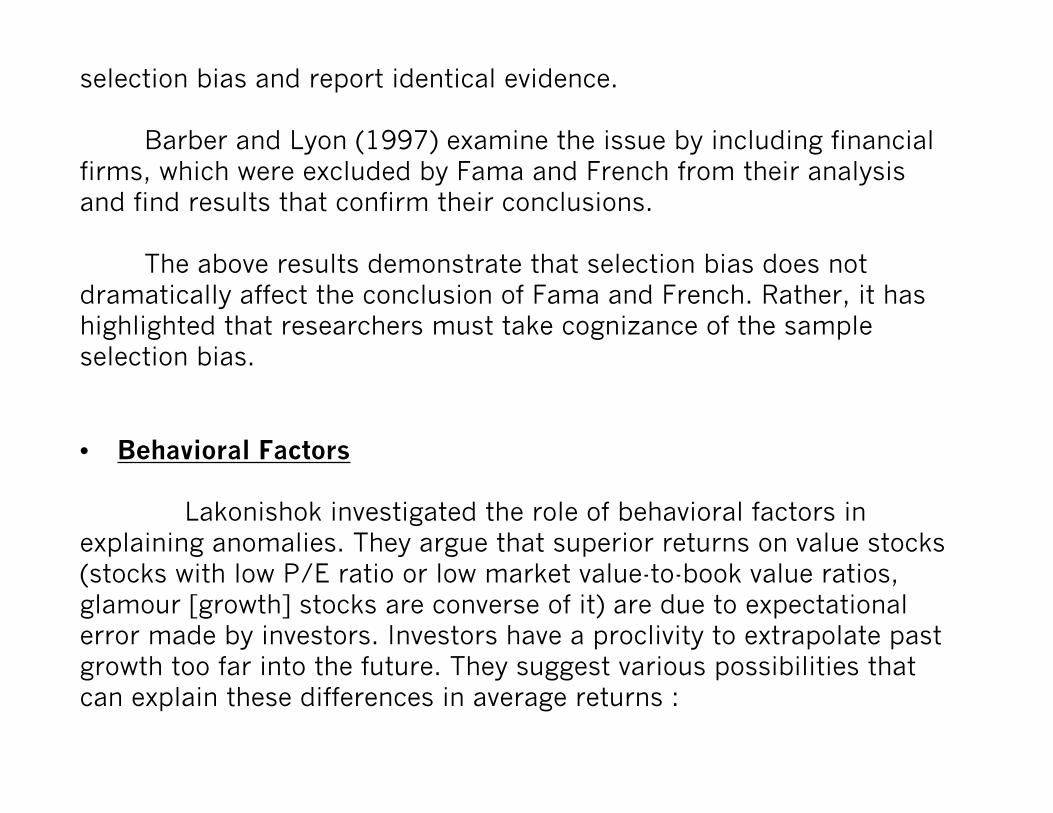
selection bias and report identical evidence. Barber and Lyon (1997) examine the issue by including financial firms, which were excluded by Fama and French from their analysis and find results that confirm their conclusions. The above results demonstrate that selection bias does not dramatically affect the conclusion of Fama and French. Rather, it has highlighted that researchers must take cognizance of the sample selection bias. • Behavioral Factors Lakonishok investigated the role of behavioral factors in explaining anomalies. They argue that superior returns on value stocks (stocks with low P/E ratio or low market value-to-book value ratios, glamour [growth] stocks are converse of it) are due to expectational error made by investors. Investors have a proclivity to extrapolate past growth too far into the future. They suggest various possibilities that can explain these differences in average returns :
§ Investors may have a tendency to invest in “good” companies with high level of profitability and superior management. In the eyes of unsophisticated investors, a “good” company may be synonymous with investment irrespective of the price and even view such stocks to be less risky.§ Sophisticated institutional investors may tilt their portfolios towards well-known glamour stocks because they can easily justify it to their clients. This may push up the prices of these stocks and lower the expected return.
The development in behavioral economics seeking to understand the influence of human behavior and psychology in the determination of stock prices in the financial market has greatly enriched understanding of drivers of stock returns. Thus, behavioral explanation has the potential to capture what is not capturable by β. EMPIRICAL TESTS TO TEST CAPM
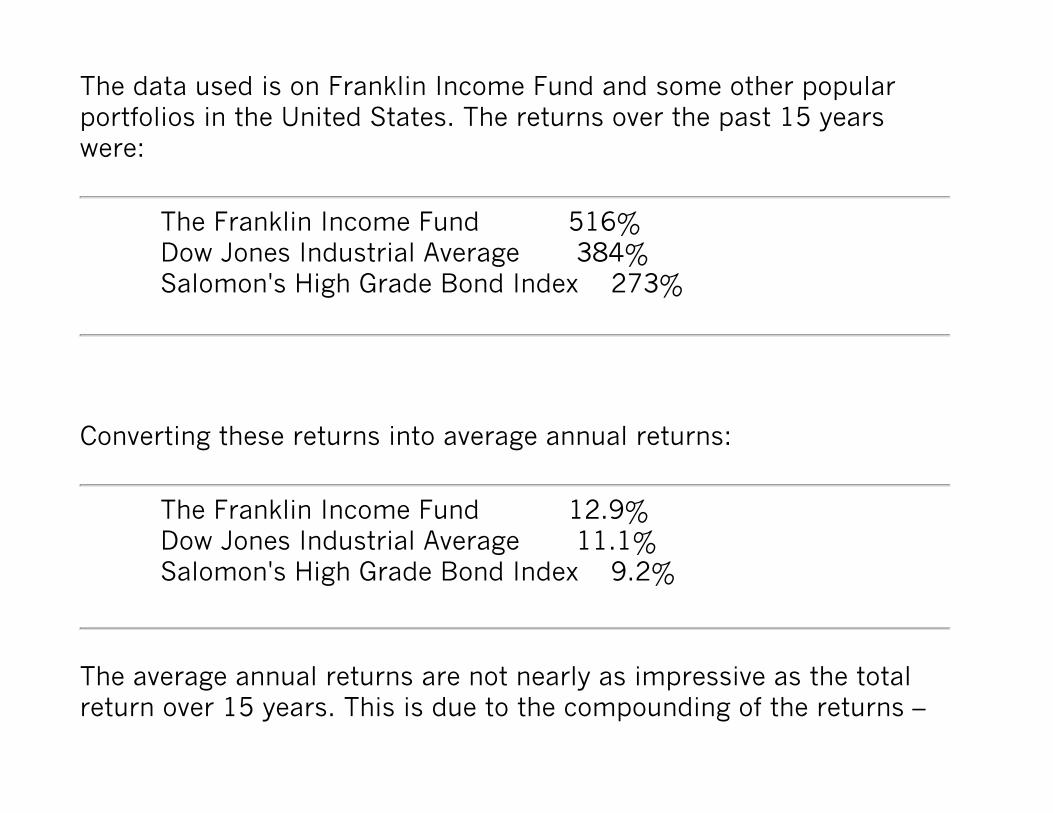
The data used is on Franklin Income Fund and some other popular portfolios in the United States. The returns over the past 15 years were:
The Franklin Income Fund 516% Dow Jones Industrial Average 384% Salomon's High Grade Bond Index 273%
Converting these returns into average annual returns:
The Franklin Income Fund 12.9% Dow Jones Industrial Average 11.1% Salomon's High Grade Bond Index 9.2%
The average annual returns are not nearly as impressive as the total return over 15 years. This is due to the compounding of the returns –
the present value is calculated.
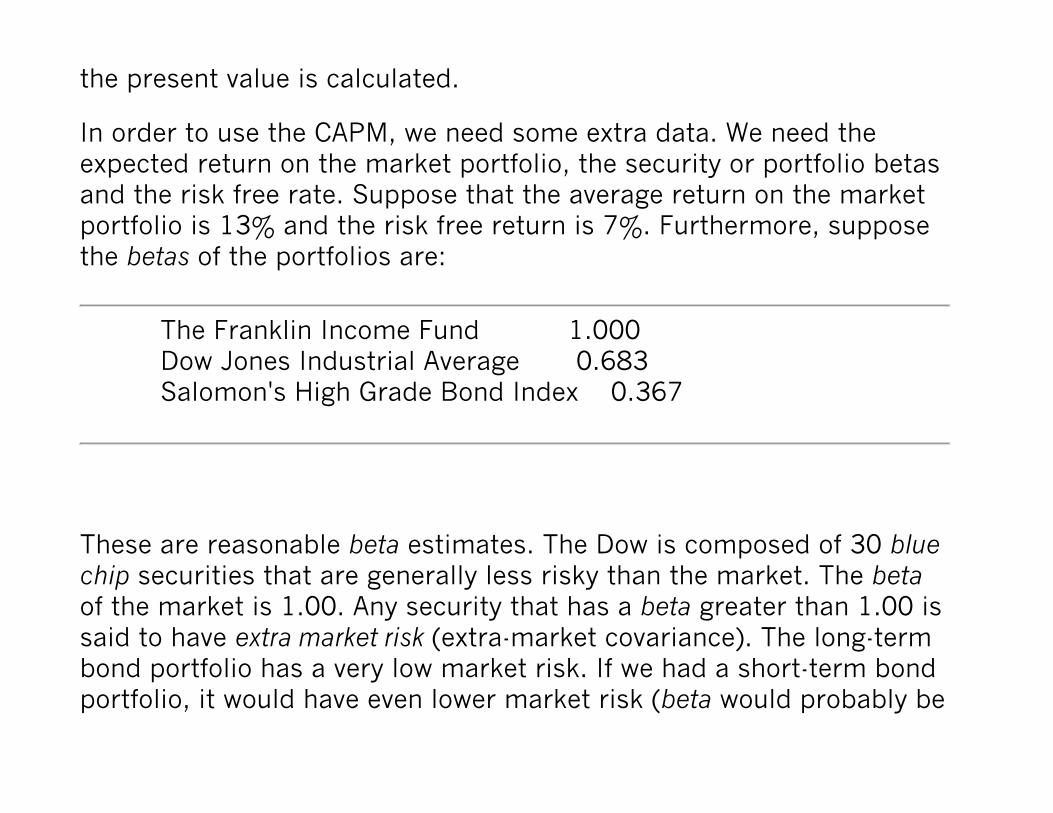
In order to use the CAPM, we need some extra data. We need the expected return on the market portfolio, the security or portfolio betas and the risk free rate. Suppose that the average return on the market portfolio is 13% and the risk free return is 7%. Furthermore, suppose the betas of the portfolios are:
The Franklin Income Fund 1.000 Dow Jones Industrial Average 0.683 Salomon's High Grade Bond Index 0.367
These are reasonable beta estimates. The Dow is composed of 30 blue chip securities that are generally less risky than the market. The beta of the market is 1.00. Any security that has a beta greater than 1.00 is said to have extra market risk (extra-market covariance). The long-term bond portfolio has a very low market risk. If we had a short-term bond portfolio, it would have even lower market risk (beta would probably be

0.10). I have assumed that the beta of Franklin is slightly larger than the market. The Franklin Growth Fund probably has a beta that is much higher because growth stocks are usually small and have higher market risk. Income stocks are usually larger and have market risk about equal to the market or lower.
Now let's calculate the expected excess returns on each of these portfolios using the CAPM.
The Franklin Income Fund 13.0% = 7% + 1.000 x (13% - 7%)Dow Jones Industrial Average 11.1% = 7% + 0.683 x (13% - 7%)Salomon's High Grade Bond Index 9.2% = 7% + 0.367 x (13% - 7%)
The expected returns for the Dow and the Salomon Bonds were exactly what the actual average returns were. Note also that the expected return on the Franklin Income Fund was higher than what was realized.
The market expected 13% performance and the Fund delivered 12.9%. The difference between the expected performance and the actual is called the abnormal return. The abnormal return is often used in performance evaluation.
So now we have a powerful tool with which to calculate expected returns for securities and portfolios. We can go beyond examination of historical returns and determine what the risk adjusted expected return for the security is.
The Security Market Line
Consider the Security Market Line (SML), which relates expected returns on assets to their non-diversifiable risks -- or their beta.

The Security Market line can also be written in terms of excess returns.
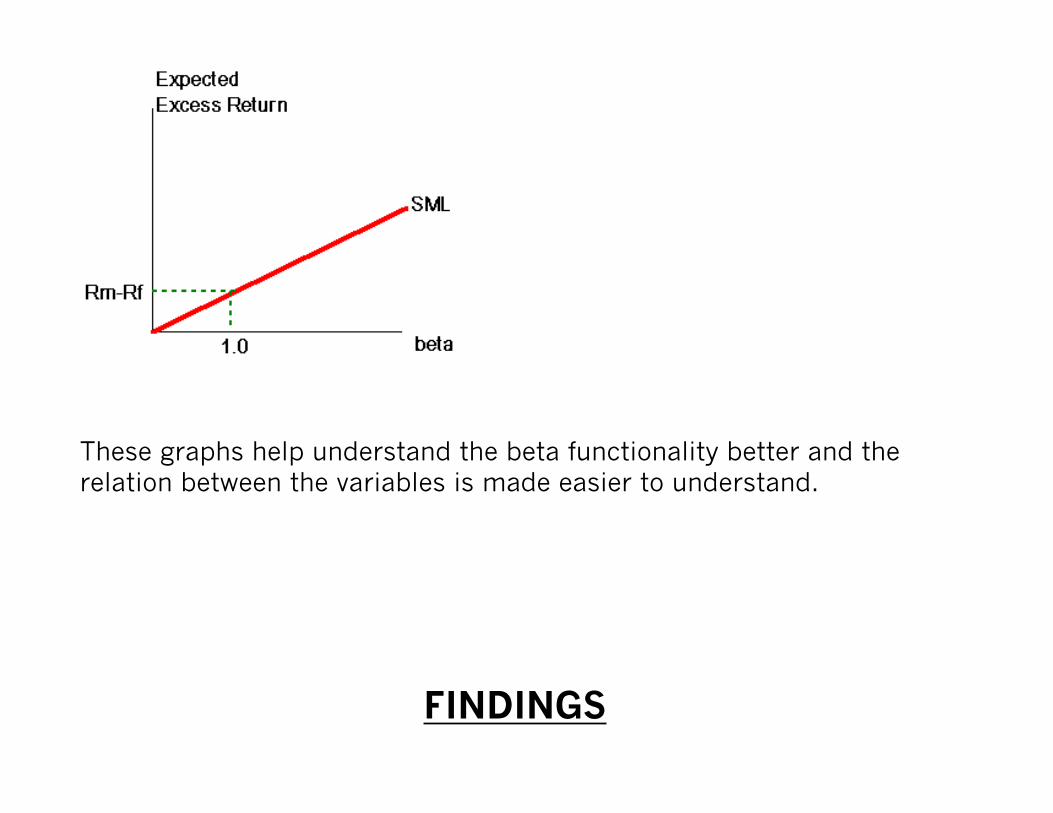
These graphs help understand the beta functionality better and the relation between the variables is made easier to understand.
FINDINGS
The CAPM comes out of two things: Markowitz, who showed how to create an efficient frontier, and James Tobin, who in a 1958 paper said if you hold risky securities and are able to borrow—buying stocks on margin—or lend—buying risk-free assets— and you do so at the same rate, then the efficient frontier is a single portfolio of risky securities plus borrowing and lending, and that dominates any other combination.
Tobin's Separation Theorem says you can separate the problem into first finding that optimal combination of risky securities and then deciding whether to lend or borrow, depending on your attitude toward risk. It then showed that if there's only one portfolio plus borrowing and lending, it's got to be the market.
Both the CAPM and index funds come from that. You can't beat the average; net of costs, the returns for the average active manager are going to be worse. You don't have to do that efficient frontier stuff. If markets were perfectly efficient, you'd buy the market and then use borrowing and lending to the extent you can. Once you get into
different investment horizons, there are many complications. This is a very simple setting. You get a nice, clean result. The basic philosophical results carry through in the more complex settings, although the results aren't quite as simple.
All empiricists tend to exaggerate the importance of their particular empirical study. There are different time periods, different markets, and different countries. You don't always get the same thing. Fama and French are looking at the question using historical manifestations of these ex-ante constructs, can confirm that expected returns are related to beta and/or related to book-to-price and/or related to size. Given what they did and how they did it—using realized average returns, which are not expected returns—they found a stronger empirical correlation with book-to-price and with size than to their measure of historic beta.
The size effect and the value/growth effect had been written about before, so neither of these phenomena were new What was new was that Fama and French got that very strong result at least for the period they looked at—which, by the way, included the mid-1970s, a very good period for value stocks, which really drove up those results.
There's a whole industry of turning out papers showing things "wrong" and "partially wrong" with the Fama- French study. Sharpe points out that during the period when Fama and French conducted their tests in the United States, value stocks did much better than growth. He says in an interview to Dow Jones Asset Manager, May/June 1998 that, “In the bear market of 1973 and 1974, people thought the world was coming to an end. The stocks that had been beaten down came back, and they came back a lot more than some of the growth stocks.
Maybe in an efficient market, small stocks would do better because they're illiquid, and people demand a premium for illiquidity That gets to be less compelling if you start thinking about mutual funds that package a bunch of small stocks and therefore make the illiquid liquid. As people figured that out, they'd put money into those funds, which would drive up the price of small stocks, and there goes the premium. For the value/growth effect, there's the behaviorist story that people overextrapolate. I have quite a bit of sympathy with that. I'm a bit of a fan of behavioral finance—the psychology of markets—so I don't dismiss that argument out of hand.
Since the studies about the size effect were published, small stocks have not done better than large stocks on average. Since the publicity
about the value effect, value stocks haven't done as well as before around the world. So there's always the possibility that whatever these things were may have gone away, and that the publication of these studies may have helped them go away. It's too early to tell. It's a short data period.”
CONCLUSION
The evaluation of these studies questions the sufficiency of evidence to bury beta. It is difficult to take a definitive stand on this issue in view of the inconclusive nature of debate. Pronouncing the death of beta will be premature.
Fama and French do not provide a theory and only conjecture that return premia can be captured by a factor model. Their argument against beta suffers from any supporting theory to justify choice of factors. Also, the period when the tests were conducted favoured the conclusion so derived.
Hence, I would like to conclude that beta does help in making
important investment decisions. CAPM not only survives, but is still the most preferred tool in corporate finance.
FURTHER AREAS OF RESEARCH
Another related issue is whether returns are indeed based on risk or whether some other behavioural factor unrelated to risk is at work in return-generating process. Lastly, if returns are indeed driven by characteristics and a characteristics-based model is correct in explaining returns, then it will bring about a totally different perspective to corporate finance.
REFERNCES
§ www.sherlockinvesting.com

§ www.stanford.edu
§ www.economictimes.com
§ Campbell Harvey’s homepage
BIBLIOGRAPHY
§ ECONOMETRICS - P.N.GUJRATI
§ FINANCIAL MANAGEMENT – I.M.PANDEY

§ C.A MODULE PAPERS – 2000-2001


![Capital Asset Pricing Theory[1]Capem](https://img.dokumen.tips/doc/110x75/577d24701a28ab4e1e9c7e2b/capital-asset-pricing-theory1capem.jpg)