Embed Size (px)
Citation preview
WP/15/243
IMF Working Papers describe research in progress by the author(s) and are published to elicit comments and to encourage debate. The views expressed in IMF Working Papers are those of the author(s) and do not necessarily represent the views of the IMF, its Executive Board, or IMF management.
Capital Account Liberalization and Inequality
by Davide Furceri and Prakash Loungani
© 2015 International Monetary Fund WP/15/243
IMF Working Paper
Research Department
Capital Account Liberalization and Inequality1
Prepared by Davide Furceri and Prakash Loungani
Authorized by Prakash Loungani
November 2015
Abstract
This paper examines the distributional impact of capital account liberalization. Using panel
data for 149 countries from 1970 to 2010, we find that, on average, capital account
liberalization reforms increase inequality and reduce the labor share of income in the short
and medium term. We also find that the level of financial development and the occurrence of
crises play a key role in shaping the response of inequality to capital account liberalization
reforms.
JEL Classification Numbers: F13, G32, O11.
Keywords: Globalization, Inequality, Capital Account Openness, Crises, Institutions.
Author’s E-Mail Address: [email protected], [email protected]
1 We would like to thank Florence Jaumotte, who worked with us on an earlier version of this paper and offered her
guidance on this revision. We also thank: Hui He, Anton Korinek, Mauricio Larrain and Ted Truman for discussions
on this topic; Nicolas Mombrial and Nick Galasso of Oxfam for organizing a useful seminar on this work;
participants at the IMF Jobs & Growth Seminar, the October 2015 IMF-DFID workshop on “Macroeconomic Policy
and Income Inequality” and at the IMF’s surveillance meeting and several colleagues at the IMF for useful
comments. We would like also to thank Maria Jovanovic for excellent editorial assistance.
IMF Working Papers describe research in progress by the author(s) and are published to
elicit comments and to encourage debate. The views expressed in IMF Working Papers are
those of the author(s) and do not necessarily represent the views of the IMF, its Executive Board,
or IMF management.
CONTENTS PAGE
Abstract ........................................................................................................................................2
I. Introduction .............................................................................................................................4
II. Data and trends ......................................................................................................................6
III. The effect of capital account liberalization reforms on inequality ..................................7
A. Methodology ................................................................................................................7
B. Results ..........................................................................................................................8
C. Robustness checks ........................................................................................................9
IV. Mechanisms .........................................................................................................................11
V. Conclusions and policy implications ..................................................................................14
References ..................................................................................................................................16
Figures
Figure 1. Income inequality within income groups (1985-2005) ...............................................19
Figure 2. Capital account openness within income groups (1970-2010)....................................19
Figure 3. The evolution of inequality before and after capital account liberalizations ..............19
Figure 4. The effect of capital account liberalization on inequality (1970-2010), OLS .............20
Figure 5. The effect of capital account liberalization on inequality (1970-2010),
Depth of liberalization ................................................................................................................20
Figure 6. The effect of capital account restriction on inequality (1970-2010) ...........................21
Figure 7. The effect of capital account liberalization on inequality (1970-2010),
WLS ............................................................................................................................................21
Figure 8. The effect of capital account liberalization on inequality (1970-2010),
different lags ...............................................................................................................................21
Figure 9. The effect of capital account liberalization on inequality (1970-2010),
Quinn and Toyoda measure of capital account openness ...........................................................22
Figure 10. The effect of capital account liberalization on inequality, additional controls .........22
Figure 11. The effect of capital account liberalization on inequality across income groups......22
Figure 12. The effect of capital account liberalization on inequality,
the role of financial institutions ..................................................................................................23
Figure 13. The effect of capital account liberalization on inequality,
the role of financial crises ...........................................................................................................24
Figure 14. The effect of capital account liberalization on the labor share (1970-2010) .............24
Tables
Table 1. Descriptive statistics by income groups ........................................................................25
Table 2. Number of capital account liberalization reforms ........................................................25
Table 3. The effect of capital account liberalization on inequality (1970-2010), OLS ..............26
4
I. INTRODUCTION
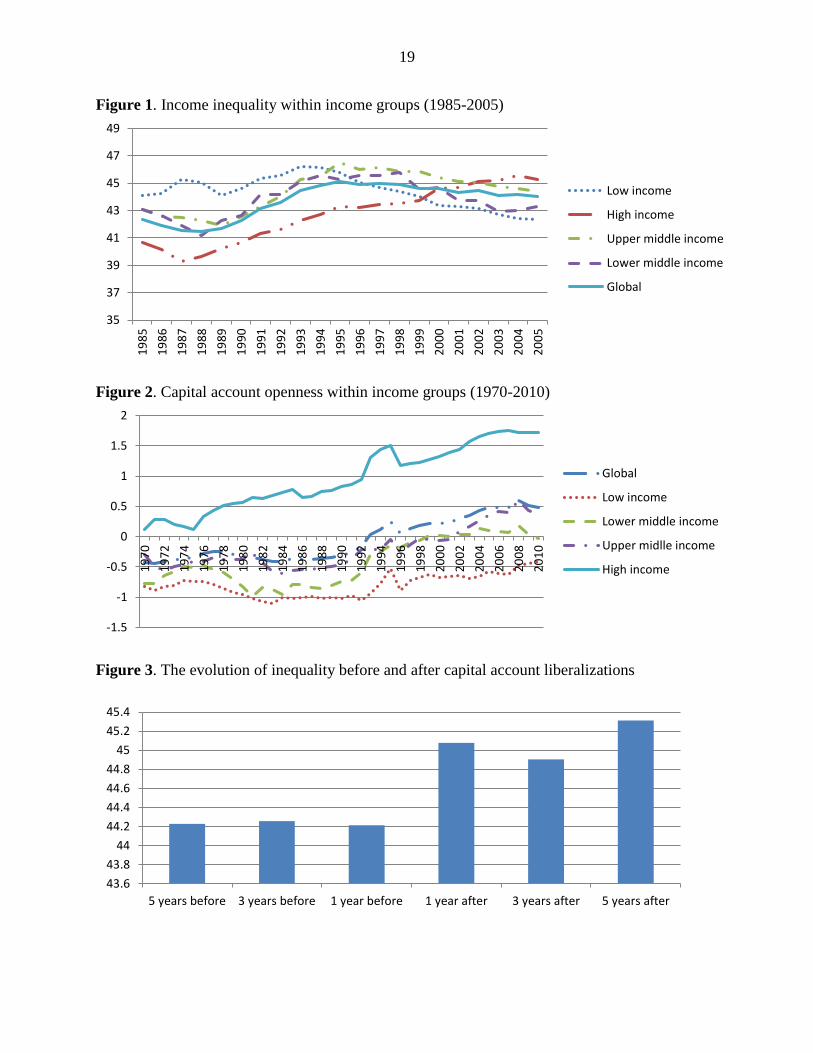
Income inequality has been on the rise in many countries over the past three decades. For
instance, the average Gini coefficient for countries in different income groups shows a rise since
the late-1980s in high-income and middle-income economies (Figure 1). In particular, a
significant rise in inequality took place at the beginning of the 1990s. While inequality has kept
on rising in high-income countries since that time, it has stabilized or decreased, on average, in
the other income groups.
The past three decades have also been associated with greater openness in global
financial markets. There has been a steady decline in the number of restrictions that countries
impose on cross-border financial transactions. An index of capital account openness shows an
increase, on average, in all income groups, with a particularly significant rise occurring at the
beginning of the 1990s (Figure 2).
This paper studies whether the increase in global financial integration is behind some of
the increase in inequality. While there is a vast literature on the effects of capital account
liberalization on growth (Henry, 2007 and references cited therein) and on the effects of trade
globalization on inequality (Helpman et al. 20102, and references cited therein), there are only a
few studies that analyzes the relation between financial globalization and inequality. This is
surprising because there are various channels through which capital account liberalization can
affect inequality (Claessens and Perotti, 2009).
A first channel is through the impact of liberalization on risk-sharing. In theory, financial
openness should foster international risk-sharing and domestic consumption smoothing (Kose et
al. 2009). In practice, the strength of financial institutions may play a crucial role in determining
the extent to which this takes place. In countries with strong financial institutions, financial
globalization may reduce inequality by allowing better consumption smoothing and lower
volatility. But where financial institutions are weak and access to credit is not inclusive,
liberalization may bias financial access in favor of those well-off and therefore increase
inequality.
A second channel is through the effect of liberalization on the likelihood of financial
crises. On the one hand, financial crises may reduce inequality as bankruptcies and falling asset
prices may have greater impact on those who are better off. On the other hand, financial crises
associated with long-lasting recessions may disproportionately hurt the poor (Atkinson and
Morelli, 2011; Agnello and Sousa, 2012).
A third channel is through increased foreign direct investment (FDI) in the host economy.
Since capital and skilled labor tend to be complements (Cragg and Epelbaum, 1996), opening the
capital account can increase the demand for skilled labor compared to unskilled labor, leading to
higher wage inequality. Moreover, highly skill-intensive inward FDI for a less developed
country may be relatively low skill-intensive outward FDI for advanced economies. Therefore,
an increase in FDI from advanced to developing countries could increase the relative demand for
skilled labor in both countries, increasing inequality in both advanced and developing
economies.
5
Finally, capital account openness may affect the distribution of income through its effect
on the labor share of income. In the context of a bargaining game between labor and capital, if
capital account liberalization represents a credible threat to reallocate production abroad, it may
lead to an increase in the profit-wage ratio and to a decrease in the labor share of income
(Harrison, 2002).
This paper contributes to the empirical literature on the effects of financial globalization
on inequality, by examining the distributional consequences of capital account liberalization for
a large (unbalanced) panel of 149 countries from 1970 to 2010. The main contribution of the
paper is to provide robust evidence of the effects of capital account liberalization on inequality
using a large panel dataset comprising advanced, emerging and low-income economies, while
the focus of previous papers has been largely on within-country experience (Larrain, 2015) or on
a more limited set of countries (Das and Mohapatra, 2003). In addition, we provide empirical
evidence of some of the mechanisms—such as the extent of financial development, the
occurrence of financial crises, and the impact on labor shares—through which capital account
liberalization may affect inequality.2
The key findings of the paper are as follows. Capital account liberalization reforms are
associated with a statistically significant and persistent increase in inequality. In particular, we
find that capital account liberalization reforms have typically increased the Gini coefficient by
about 0.8 percent in the very short term (1 year after the occurrence of a liberalization reform)
and by about 1.4 percent in the medium term (5 years after). In addition, we find that the level of
financial development and the occurrence of crises play a key role in shaping the response of
inequality to financial globalization reforms. In particular, we find that capital account
liberalization reforms lead to larger increases in inequality in countries with a weak level of
financial institutions and when they are followed by episodes of financial crises. We also find
evidence that an important channel through which capital account liberalization episodes affect
the distribution of income is by reducing the labor share of income. The results are robust to
different sets of controls, different estimation techniques, alternate measures of capital account
openness, and endogeneity checks.
The rest of the paper is organized as follows. The next section describes the data and
descriptive statistics of the evolution of inequality and capital account openness. Section III
analyzes the effect of capital account openness on inequality and provides some robustness
checks. Section IV empirically identifies some of the mechanisms through which capital account
liberalization may affect inequality. Section V concludes summarizing the main findings and
discussing policy implications.
2 Since we do not have a direct measure of capital account liberalization reforms concerning only FDI inflows we
cannot test the role of these types of reforms on wage inequality. Moreover, at the macro level it is difficult to
differentiate the effect of FDI inflows from that associated to portfolio and debt flows given the high correlations
between these flows, and a careful analysis would require using sector level data (as used in Larrain, 2015) which
are not available for the great majority of emerging and developing economies.
6
II. DATA AND TRENDS
We use data for Gini coefficients from by the Standardized World Income Inequality Database
(SWIID), which combines information from the United Nations World Income Database
(UNWIDER) and the Luxembourg Income Study (LIS). It provides comparable estimates of
Gini indices (and associated standard deviations) of gross income inequality for 173 countries for
as many years as possible from 1960 to 2010.3
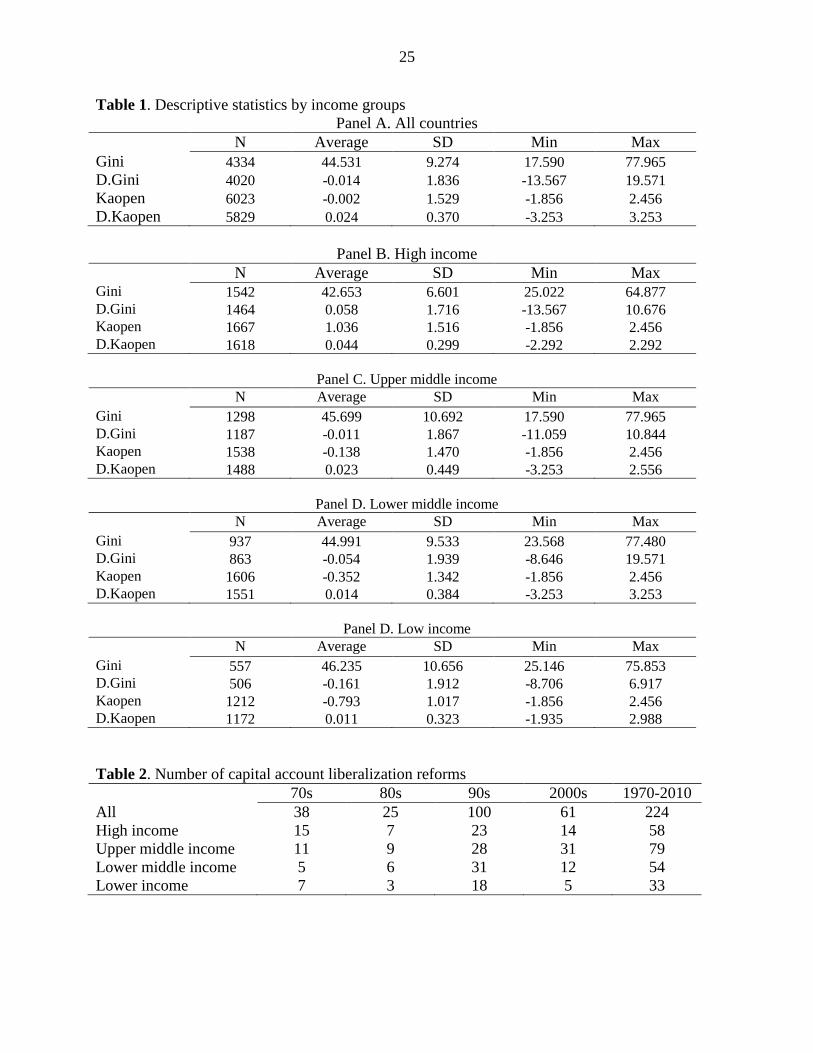
Gini coefficients are theoretically bounded between 0 (each reference unit receives an
equal share of income) and 100 (a single reference unit receives all income while all the others
receive nothing). In our sample they range from 18 to 78, with higher levels of inequality
typically recorded for low and middle-income countries (Table 1).
The measure of financial globalization used in this paper is based on a de jure indicator
of capital account restrictions. While it has been argued that de jure measures are noisy
indicators of the true degree of openness of the capital account, they have the advantage of being
less sensitive to reverse causality issues in panel regressions (Collins, 2007). Data for capital
account openness are taken from the Chinn and Ito (2008) database. While alternative de jure
measures of capital account openness have been proposed in the literature (e.g. Quinn, 1997;
Quinn and Toyoda, 2008), the Chinn and Ito index (Kaopen) provides the largest country and
time period coverage.4 The index measures a country's degree of capital account openness based
on the binary dummy variables that codify the tabulation of restrictions on cross-border financial
transactions reported in the IMF's Annual Report on Exchange Arrangements and Exchange
Restrictions (AREAER) database.5 The index is available for an unbalanced panel of 182
countries from 1970 to 2010, and it ranges from -1.856 (more restricted capital account) to 2.456
(less restricted). The score of the capital account openness index varies greatly across income
groups, with higher restrictions typically recorded in low-income and lower-middle income
countries (Table 1).
In summary, two stylized facts emerge from this descriptive evidence. First, income
inequality has increased in almost all income groups during the last two decades, but more
persistently in high income countries. Second, capital account openness has increased in all
income groups, with most of the increase in capital account openness occurring during the 1990s.
Incidentally, the largest increase in income inequality seems to have taken place also during this
period.
Inequality before and after capital account liberalizations
Examining the behavior of inequality before and after the removal of restrictions on the
capital account requires information about the date on which the restrictions were lifted.
Unfortunately information on such dates is not easily obtainable for a large set of countries, as
3 See Solt (2009) for details on the methodology. 4 While Kaopen is used as a baseline, alternative measures of capital account openness are also considered as a
robustness check (see Section III). 5 See Chinn and Ito (2008) for details on the methodology.
7
ideally one would require information about the dates on which the capital account has been
liberalized by policy decree (legislative change). In order to overcome this problem, and to
indirectly infer the official liberalization date, we identity capital account liberalization episodes
by assuming that a liberalization takes place when, for a given country at a given time, the
annual change in the Kaopen indicator exceeds by two standard deviations the average annual
change over all observations (i.e. exceeds 0.76). 6 This criterion identifies 224 episodes of
liberalization, with the majority of them occurring during the last two decades (Table 2). In
particular, the largest number of episodes seems to have occurred around the 1990s (which is
consistent with the description of the evolution of the Kaopen indicator documented in the
previous section) and among middle-income countries.
Looking at the change in the Gini coefficient before and after the beginning of these
liberalization episodes (Figure 3) suggests that capital account liberalization episodes, on
average, have been typically associated with an increase of the Gini of about 0.8 percentage
point (2 percent) in the short term (in the year after the occurrence of a liberalization episode)
and of about 1.2 percentage points (2 ½ percent) in the medium term (5 years after the
occurrence of a liberalization episode). The next section checks whether this descriptive
evidence holds up to more formal tests.
III. THE EFFECT OF CAPITAL ACCOUNT LIBERALIZATION REFORMS ON INEQUALITY
A. Methodology
The methodology used in this paper to assess the impact of capital account liberalization
reforms on inequality follows Cerra and Saxena (2008) and Romer and Romer (2010), among
others. This approach is particularly suited to assess the dynamic response of the variable of
interest in the aftermath of a shock (a capital account liberalization episode in our case). The
methodology consists of estimating a univariate autoregressive inequality equation and deriving
the associated impulse response functions:
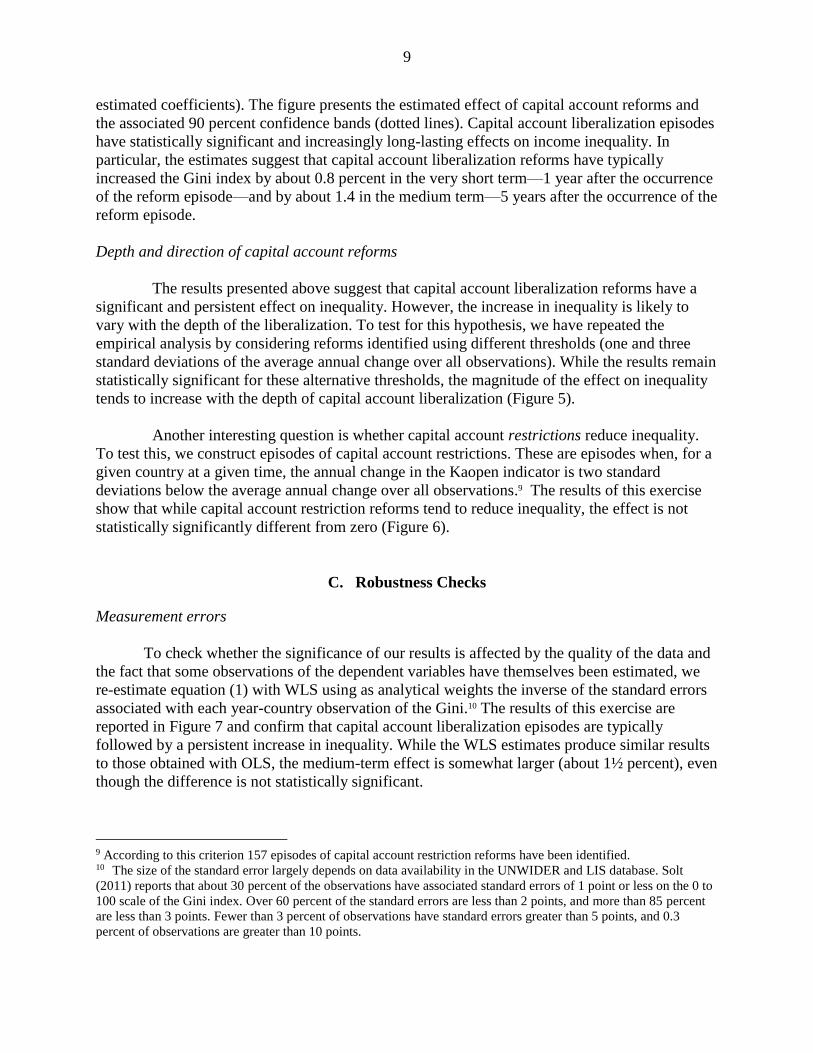
𝑔𝑖𝑡 = 𝑎𝑖 + 𝛾𝑡 + ∑ 𝛽𝑗𝑔𝑖,𝑡−𝑗𝑙𝑗=1 + ∑ 𝛿𝑗𝐷𝑖,𝑡−𝑗 + ∑ 𝜗𝑗𝑋𝑖,𝑡−𝑗
𝑙𝑗=1 + 휀𝑖𝑡
𝑙𝑗=0 (1)
where g is the annual change in the (log of the) Gini coefficient; D is a dummy variable which is
equal to 1 at the start of a capital account liberalization episode and zero otherwise; 𝑎𝑖 are
country fixed effects included to control for unobserved cross-country heterogeneity of
inequality and also to control for the fact that in some countries inequality is measured using
income data while in other countries using consumption data ; 𝛾𝑡are time fixed effects to control
for global shocks.
6 A similar strategy has been followed in previous papers to indentify episodes of stock market liberalizations
(Henry, 2007) and labor and product market reforms (Bernal-Verdugo et al. 2013 and Bouis et al. 2012).
8
We include lagged inequality growth to control for the normal dynamics of inequality. In
addition, since the variables affecting inequality in the short term are typically serially correlated,
it also helps to control for various factors that may influence inequality.
Finally, since several types of economic reforms are often implemented simultaneously—
this is particularly the case for current and capital account reforms—, we include a set of other
structural reform variables (X) to distinguish the effect of capital account liberalization episodes
from others. Specifically, the set of reform variables included as controls are: (i) current account
reforms, defined as an episode where the annual change of the Quinn and Toyoda (2008)
measure of current account openness exceeds by two standard deviations the average annual
change over all observations; and (ii) regulation reforms, defined as an episode where the annual
change of the EFW’s composite measure of credit, product and labor market regulation exceeds
by two standard deviations the average annual change over all observations.7
Equation (1) is estimated using OLS on an unbalanced panel of annual observations from
1970 to 2010 for 149 advanced and developing economies. While the presence of a lagged
dependent variable and country fixed effects may in principle bias the estimation of 𝛿𝑗 and 𝛽𝑗 in
small samples (Nickell (1981)), the length of the time dimension mitigates this concern.8 The
number of lags chosen is 2, but different lag lengths are tested as a robustness check (see next
section).
Impulse response functions (IRFs) are obtained by simulating a shock in the capital
account liberalization episode dummy. The shape of these response functions depends on the
value of the 𝛿 and 𝛽 coefficients; For instance, the simultaneous response is 𝛿0, the one-year
ahead cumulative response is 𝛿0 + (𝛿1 + 𝛽0𝛿0).
Since some of the observations of the dependent variable are based on estimates, the
regression residuals can be thought of as having two components. The first component is
sampling error (the difference between the true value of the dependent variable and its estimated
value). The second component is the random shock that would have been obtained even if the
dependent variable was observed directly as opposed to estimated. This would lead to an
increase in the standard deviation of the estimates, which would lower the t-statistics. This means
that any correction to the presence of this un-measurable error term will increase the significance
of our estimates. As a further check, equation (1) is also been estimated with Weighted Least
Squares (WLS). Specifically, the WLS estimator assumes that the errors 휀𝑖 in equation (1) are
distributed as 휀𝑖~𝑁(0, 𝜎2 𝑠𝑖⁄ ), where 𝑠𝑖 are the estimated standard deviations of the Gini
coefficient for each country i provided in the SWIID database, and 𝜎2 is an unknown parameter
that is estimated in the second-stage regression.
B. Results
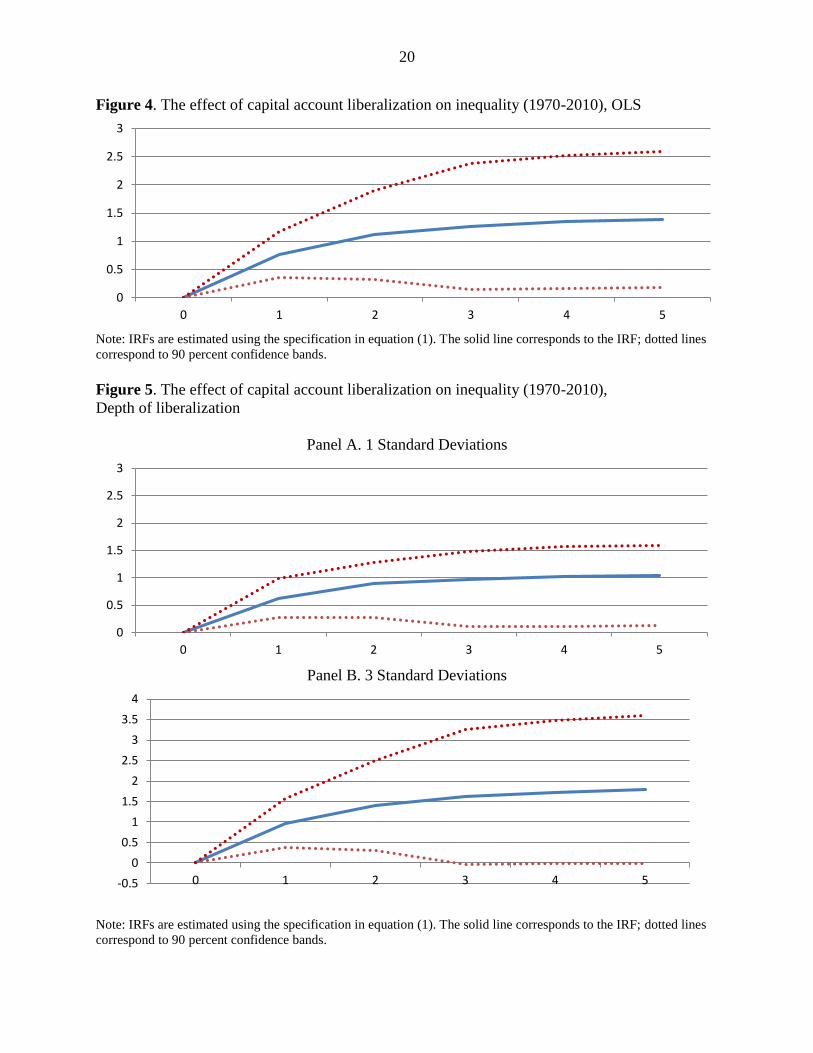
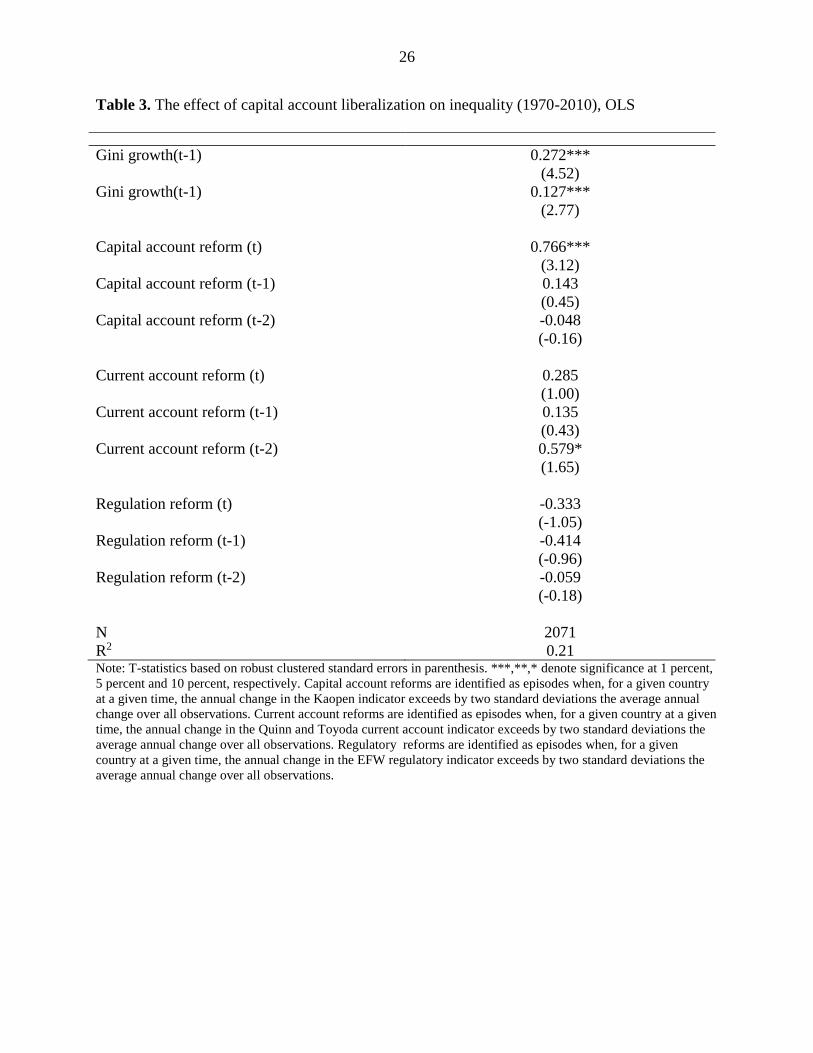
The results from estimating the impact of capital account liberalization reforms on
inequality using equation (1) are presented in Figure 4 (see also Table 3 for the underlying
7 Higher values of these indicators indicate more open and competitive markets. 8 The finite sample bias is in the order of 1/T, where T in our sample is 41.
9
estimated coefficients). The figure presents the estimated effect of capital account reforms and
the associated 90 percent confidence bands (dotted lines). Capital account liberalization episodes
have statistically significant and increasingly long-lasting effects on income inequality. In
particular, the estimates suggest that capital account liberalization reforms have typically
increased the Gini index by about 0.8 percent in the very short term—1 year after the occurrence
of the reform episode—and by about 1.4 in the medium term—5 years after the occurrence of the
reform episode.
Depth and direction of capital account reforms
The results presented above suggest that capital account liberalization reforms have a
significant and persistent effect on inequality. However, the increase in inequality is likely to
vary with the depth of the liberalization. To test for this hypothesis, we have repeated the
empirical analysis by considering reforms identified using different thresholds (one and three
standard deviations of the average annual change over all observations). While the results remain
statistically significant for these alternative thresholds, the magnitude of the effect on inequality
tends to increase with the depth of capital account liberalization (Figure 5).
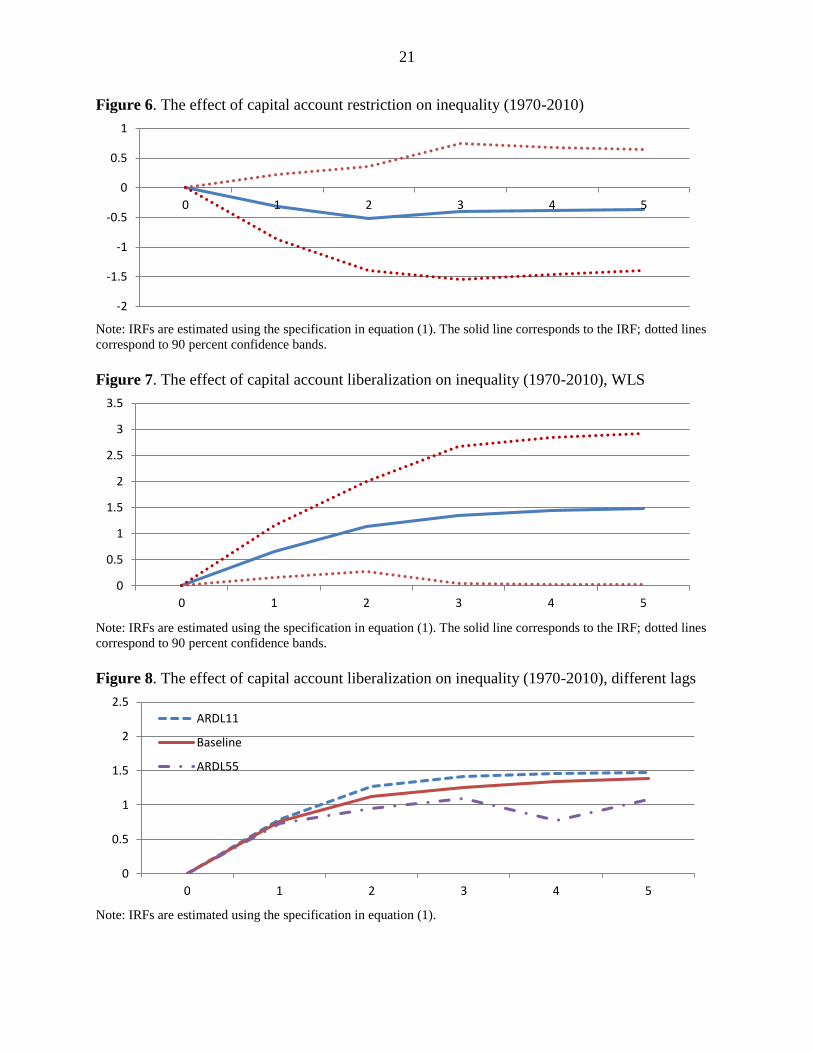
Another interesting question is whether capital account restrictions reduce inequality.
To test this, we construct episodes of capital account restrictions. These are episodes when, for a
given country at a given time, the annual change in the Kaopen indicator is two standard
deviations below the average annual change over all observations.9 The results of this exercise
show that while capital account restriction reforms tend to reduce inequality, the effect is not
statistically significantly different from zero (Figure 6).
C. Robustness Checks
Measurement errors
To check whether the significance of our results is affected by the quality of the data and
the fact that some observations of the dependent variables have themselves been estimated, we
re-estimate equation (1) with WLS using as analytical weights the inverse of the standard errors
associated with each year-country observation of the Gini.10 The results of this exercise are
reported in Figure 7 and confirm that capital account liberalization episodes are typically
followed by a persistent increase in inequality. While the WLS estimates produce similar results
to those obtained with OLS, the medium-term effect is somewhat larger (about 1½ percent), even
though the difference is not statistically significant.
9 According to this criterion 157 episodes of capital account restriction reforms have been identified. 10 The size of the standard error largely depends on data availability in the UNWIDER and LIS database. Solt
(2011) reports that about 30 percent of the observations have associated standard errors of 1 point or less on the 0 to
100 scale of the Gini index. Over 60 percent of the standard errors are less than 2 points, and more than 85 percent
are less than 3 points. Fewer than 3 percent of observations have standard errors greater than 5 points, and 0.3
percent of observations are greater than 10 points.
10
Lag parameterizations
Teulings and Zubanov (2014) and Bernal-Verdugo et al. (2013) note that the IRFs using
ARDL models can be sensitive to the choice of the number of lags. To check if that is the case
with our results, we re-estimate equation (1) using two different lag-parameterizations: (i) ARDL
(1, 1) and (ii) ARDL (5, 5). The results reported in Figure 8 show that the IRFs tend to be close
to each other, and the differences in the IRFs are never statistically significant.
Different measures of capital account openness
As an additional robustness check, we also test the impact of financial globalization on
inequality using alternative measures of capital account openness. In particular, we re-estimate
equation (1) using episodes of capital account liberalization reforms constructed applying a
similar methodology to the Quinn and Toyoda (2008) indicator of capital account openness. The
results obtained with this measure still point to a statistically significant and persistent impact of
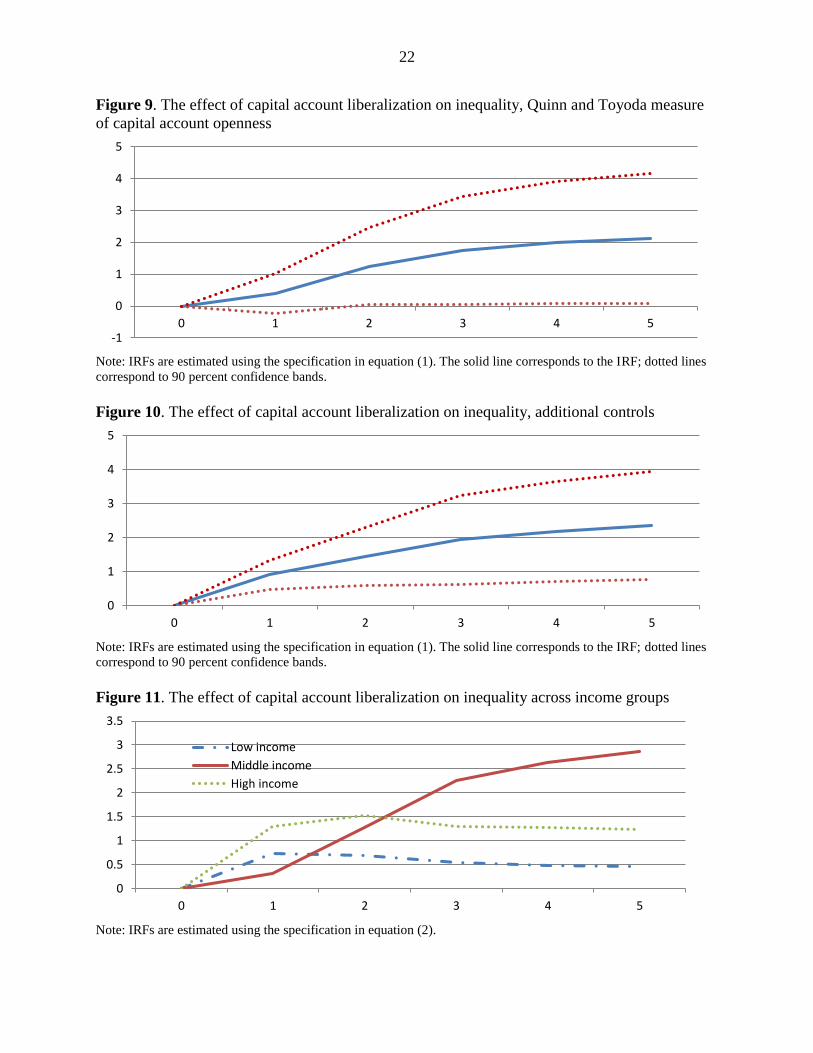
capital account liberalization reforms on inequality (Figure 9). While the short-term effect is very
similar to the one reported in the baseline, the medium-term effect appears to be significantly
higher (about 2½ percent) than the one obtained using the Kaopen index.
Endogeneity checks and additional controls
While potential reverse causality is likely to not be an issue, since the decision on
whether to liberalize the capitally count is unlikely to be influenced by inequality, it could still be
the case that unobserved factors influencing the dynamics of inequality over time could affect the
probability of a financial liberalization reform.11 While including reforms in other
macroeconomic should mitigate this problem, to additionally check the robustness of our results,
we have also re-estimated equation (1) including a set of control variables which may affect the
evolution of inequality and influence the impact of capital account liberalization, namely: (i)
GDP growth; (ii) the level and the square of log GDP per capita; (iii) change in trade openness
(defined as the sum of exports and imports over GDP); (iv) change in the GDP’s share of
government expenditure; (v) change in the share of industry and agriculture value added; (vi)
change in dependency ratios; (vi) change in product, labor and credit market regulations; and
(vii) time fixed effects to control for shocks common to all countries. The results of this exercise
are presented in Figure 10, and confirm a significant and persistent effect of capital account
liberalization reforms on inequality. The results also suggest a larger medium-term effect than
the one reported in the baseline, even though the difference is not statistically significant.12
11 Indeed, granger causality tests not reported here suggest that lagged inequality does not significantly affect the
probability of capital account liberalization reforms.
12 Following Larrain (2015), we also conduct an instrumental variables approach using the lag of the capital account
openness indicator as an instrument for liberalization reforms. The results, not reported here, are very similar to
those obtained with OLS.
11
Among the control variables included in the regression we find that GDP growth and the
level of GDP per capita are positively associated with change in the Gini, while the change in the
share of Agriculture and the square of GDP per capita are negatively related. The other controls
variables are not statistically significant.
Effect across income groups
The descriptive evidence presented in Section II has shown that while capital account
openness has increased in all income groups, the pattern of inequality has been much more
mixed, particularly during the last decade where inequality has stabilized or decreased in middle
and low-income countries, while it has increased in high-income countries. This different pattern
may reflect a different effect of capital account liberalization reforms on inequality across
different income groups. To test for this hypothesis, we extend equation (1) to allow for a
different effect across income groups. In particular, we estimate the following specification:
𝑔𝑖𝑡 = 𝑎𝑖 + 𝛾𝑡 + ∑ 𝛽𝑗𝑔𝑖,𝑡−𝑗𝑙𝑗=1 + ∑ 𝜗𝑗𝑋𝑖,𝑡−𝑗
𝑙𝑗=1 + ∑ 𝛿𝑗
𝐻𝐷𝑖,𝑡−𝑗𝐻𝑖 +𝑙𝑗=0 ∑ 𝛿𝑗
𝑀𝐷𝑖,𝑡−𝑗𝑀𝑖 +𝑙𝑗=0 ∑ 𝛿𝑗
𝐿𝐷𝑖,𝑡−𝑗𝐿𝑖 +𝑙𝑗=0 휀𝑖𝑡 (2)
where H, M, L denotes dummy for high, middle and low income countries, respectively. The
results of this exercise reported in Figure 11 show different effects across income groups, with
the magnitude of the effect being the largest in middle-income countries, and the smallest in low
income countries. At the same time, while the effect of high-income countries is more precisely
estimated, the effects across different income groups are not statistically different from those for
the whole sample.
IV. MECHANISMS
This section tries to identify empirically some of the mechanisms through which capital
account liberalization may affect inequality, namely: (i) the extent of financial development; (ii)
the occurrence of financial crises; and (iii) the impact on labor shares.
Financial development and inclusion
It is commonly argued that the benefits of financial globalization depend on the level of
financial institutions. Kose et al. (2011) identify certain threshold levels of financial development
(in particular the depth of the credit market) that an economy needs to attain before it can benefit
from, and reduce the risks associated with, financial globalization. Capital account liberalization
may allow better consumption smoothing and lower volatility for countries with strong financial
institutions, but where institutions are weak and the access to credit is not inclusive, it may
further exacerbate inequality by increasing the bias in financial access in favor of those agents
that are well off.13
13 We find that the measures of the quality of financial institutions used in the paper are negatively related to the
probability of financial crises.
12
To test this hypothesis, we modify equation (1) by allowing the effect of capital account
liberalization to vary across different regimes of financial institutions. In detail, we estimate the
following equation:
𝑔𝑖𝑡 = 𝑎𝑖 + 𝛾𝑡 + ∑ 𝛽𝑗𝑔𝑖,𝑡−𝑗𝑙𝑗=1 + ∑ 𝜗𝑗𝑋𝑖,𝑡−𝑗
𝑙𝑗=1 + ∑ 𝛿𝑗
−𝐷𝑖,𝑡−𝑗𝐺(𝑧𝑖𝑡) +𝑙𝑗=0 ∑ 𝛿𝑗
+𝐷𝑖,𝑡−𝑗(1 − 𝐺(𝑧𝑖𝑡)) +𝑙𝑗=0 휀𝑖𝑡 (3)
with
𝐺(𝑧𝑖𝑡) =exp (−γ𝑧𝑖𝑡)
1+exp (−γ𝑧𝑖𝑡), γ > 0,
in which z is an indicator of the financial development, normalized to have zero mean and unit
variance, and G(zit) is the corresponding smooth transition function of the degree of public
financial deepening.14 This approach is equivalent to the smooth transition autoregressive
(STAR) model developed by Granger and Teravistra (1993). The main advantage of this
approach relative to estimating SVARs for each regime is that it uses a larger number of
observations to compute the impulse response functions of only the dependent variables of
interest, improving the stability and precision of the estimates. This estimation strategy can also
more easily handle the potential correlation of the standard errors within countries, by clustering
at the country level.15
Three indicators of financial development are considered in the analysis. The first is a
composite indicator of credit market freedom provided by the Fraser Institute’s Economic
Freedom of the World (EFW) which rates countries between 0 and 10, with higher scores being
assigned to economies with deeper and more open credit markets.16 The second indicator is the
ratio of credit to GDP (Global Financial Development Database), which represents a proxy of
credit market depth. Finally, the third indicator is a measure of financial inclusion and access to
credit, identified as the ratio of adults borrowing from a formal financial institution in the past
years to total adults (Demirguc-Kunt et al. 2015).17
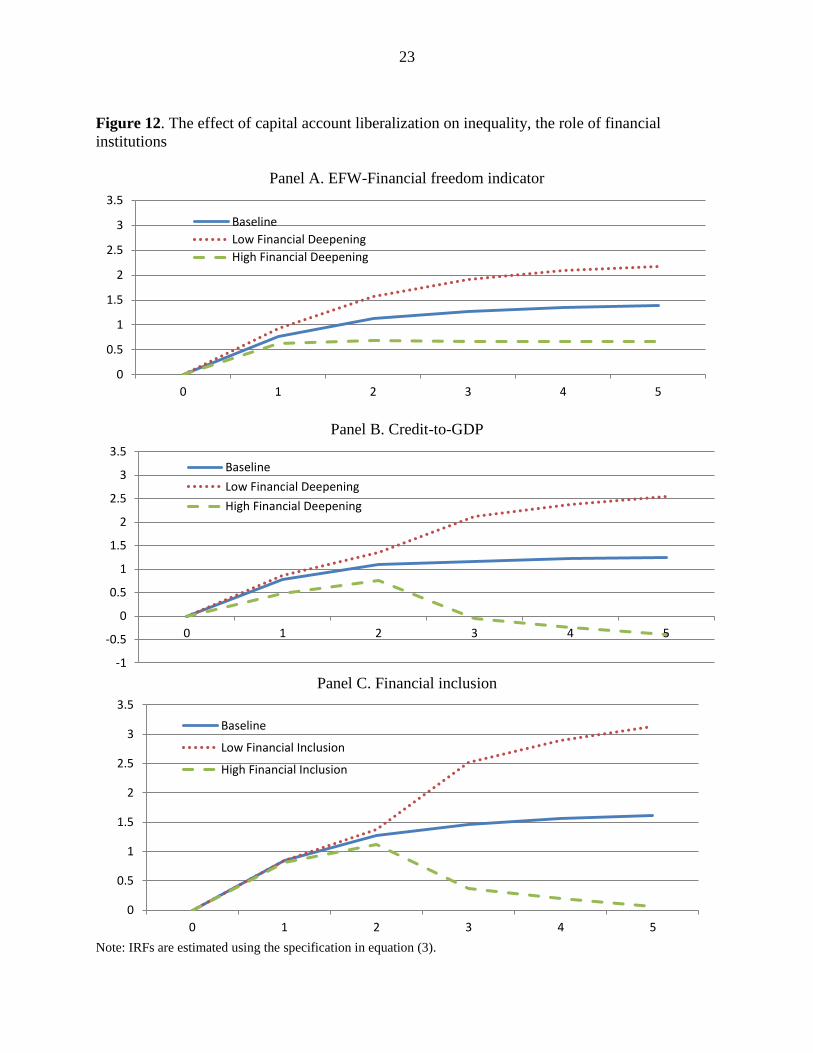
Starting with the EFW’s composite indicator, the results obtained by estimating equation
(3) show the effect of capital account openness on inequality depends on the level of credit
market institutions, with the medium-term effect being (statistically significantly) smaller in
countries with an high level of credit market openness. This result is illustrated in Panel A of
14 γ is chosen equal to 1.5 (see Abiad and others, 2015), but the results are robust to different parameterizations. 15 This approach has been applied to model non-linearities in number of different economic issues such as exchange
rates dynamics (Sarrno and Taylor, 2002); sectoral performance during the business cycle (Fok and others 2005);
money demand (Chen and Wu, 2005) fiscal multipliers (Auerbach and Gorodnichenko, 2013). 16 The indicator is based on the following sub-components: i) Ownership of banks; ii) Foreign bank competition; iii)
Private sector credit; and iv) Interest rate controls. The indicator is available for an unbalanced panel of 122
countries from 1980 to 2010, at 5-year frequency from 1980 to 2000 and at annual frequency afterward. Missing
data during the five years in which annual observations are not available have been interpolated using a linear trend.
The rationale for using this indicator, instead of others such as those provided by the World Bank Governance
Indicator, is to maximize the country/ time sample coverage. 17 Since this indicator is only available for few years, the interaction terms have been constructed by multiplying the
reform dummies by the average level of the indicator in each country.
13
Figure 11, which presents the baseline results together with the IRFs obtained estimating
equation (3) for the two degree of regimes.
The analysis is then repeated using the share of private credit to GDP. The results
presented in Panel B of Figure 12 show that the effect of capital account reforms on inequality
also decreases with the depth of the credit market, with the medium-term effect of capital
account liberalization reform being (statistically significantly) smaller in countries with an high
level of credit market openness. Interestingly, the results suggest that in countries with very high
credit-to-GDP ratio the medium-term effect of capital account liberalization on inequality is
actually negative, even though not statistically different from zero.
Finally, we have repeated the analysis using the indicator of financial inclusiveness. The
results presented in Panel C of Figure 12 show that financial inclusion plays a significant role in
shaping the response of inequality to capital account reforms, particularly over the medium term.
Specifically, the figure shows that while liberalization reforms in countries with relatively low
levels of financial inclusion are associated with a medium-term increase in inequality of more
than 3 percent, in countries with relatively high levels of financial inclusion inequality increases
by less than 0.1 percent over the medium term.
Crises
As noted in the introduction, a channel through which capital account liberalization
reforms may increase income inequality is by increasing the likelihood of financial crises. To test
for the this hypothesis, we construct a dummy variable for those capital account liberalization
episodes that have been followed by the occurrence of a financial crisis over a time horizon of 5
years , the same time horizon of the IRFs presented in Figure 4. The financial crisis can be either
a banking, currency, or debt crisis, using the crisis dates identified in Laeven and Valencia
(2010). Equation (1) is then augmented by this dummy variable, 𝐶𝑖𝑡:
𝑔𝑖𝑡 = 𝑎𝑖 + 𝛾𝑡 + ∑ 𝛽𝑗𝑔𝑖,𝑡−𝑗𝑙𝑗=1 + ∑ 𝜗𝑗𝑋𝑖,𝑡−𝑗
𝑙𝑗=1 + ∑ 𝛿𝑗
𝑐𝑟𝑖𝑠𝑖𝑠𝐷𝑖,𝑡−𝑗𝐶𝑖𝑡 +𝑙𝑗=0 ∑ 𝛿𝑗
𝑛𝑜−𝑐𝑟𝑖𝑠𝑖𝑠𝐷𝑖,𝑡−𝑗(1 − 𝐶𝑖𝑡) +𝑙𝑗=0 휀𝑖𝑡 (4)
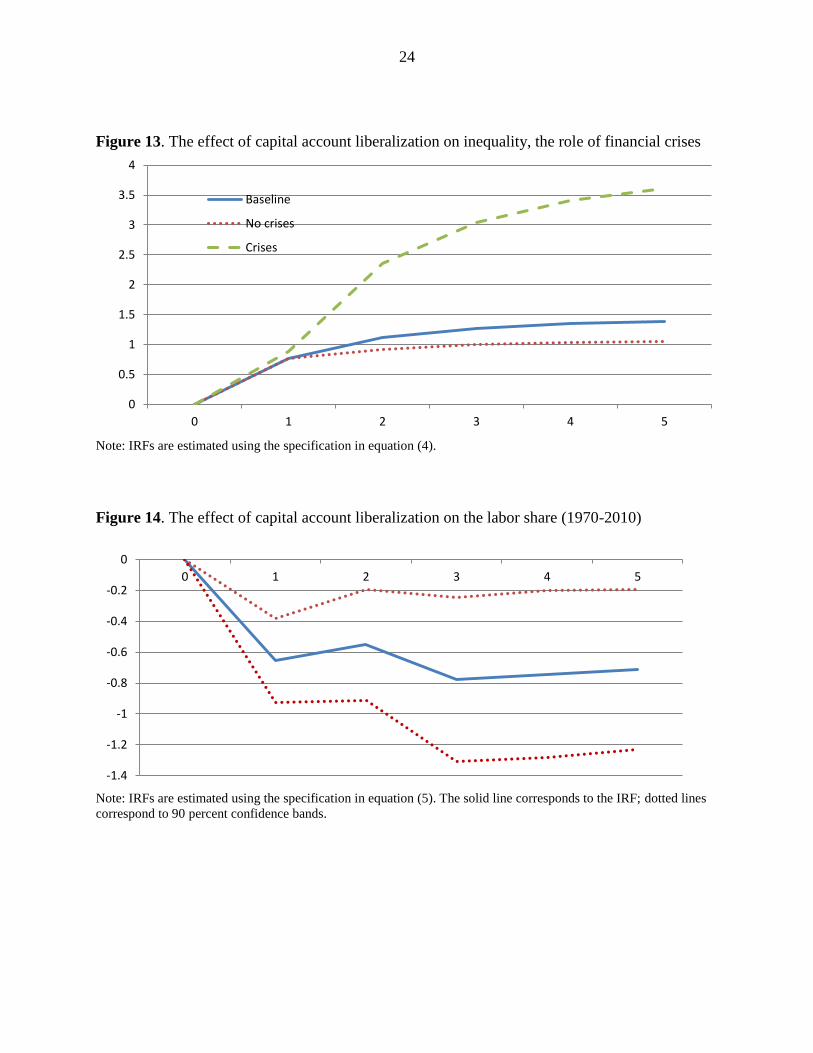
The results of this exercise show that the effect of financial globalization on inequality
varies markedly between crisis and non-crisis reform episodes (Figure 13). In particular, while
crisis reform episodes are associated with a medium-term increase in inequality of more than 3.5
percent, in the aftermath of non-crisis reform episodes inequality increases by about 1 percent
over the medium term. The difference in the IRFs increases over time, and it becomes
statistically significant after the third year following a reform episode.
Finally, the results not reported here, suggest that financial crises per-se are associated
with a significant and long-lasting increase in inequality. In particular, the estimates suggest that
financial crises have typically increased the Gini index by about 0.1 percent in the very short
term—1 year after the occurrence of the reform episode—and by about 2.5 in the medium
term—5 years after the occurrence of the crisis.
Labor share of income
14
Another way to look at the distributional consequences of capital account liberalization is
to examine the impact on the functional distributional of income between capital and labor.
Looking at factor shares involves comparing returns to the activity of labor (the main source of
income for the vast majority of the population) versus the returns to ownership (a more important
source of income for the wealthy). This classification provides another perspective of how the
benefits of financial globalization are shared; it also addresses the bias in measures of inequality
such as the Gini which typically omits sources of income for the very wealthy.
As previously discussed, to the extent that capital liberalization represents a credible
threat to reallocate production abroad, it may lead to an increase in the profit-wage ratio and to a
decrease in the labor share of income (Jayadev, 2007). To test for this hypothesis, we have
estimated a modified version of equation (1):
∆𝐿𝑖𝑡 = 𝑎𝑖 + 𝛾𝑡 + ∑ 𝛽𝑗∆𝐿𝑖,𝑡−𝑗𝑙𝑗=1 + ∑ 𝛿𝑗𝐷𝑖,𝑡−𝑗 + ∑ 𝜗𝑗𝑋𝑖,𝑡−𝑗
𝑙𝑗=1 + 휀𝑖𝑡
𝑙𝑗=0 (5)
where L is the labor share of income computed as the ratio of compensation of employees to
GDP.18
The results obtained from estimating equation (5) are presented in Figure 14. Looking at
the figure it can be noted that capital liberalization episodes have statistically significant and
long-lasting effects on the labor share of income. In particular, the estimates suggest that reforms
have typically decreased the labor share of income by about 0.7 percentage point in the very
short term—1 year after the reform—and by about 0.7 percentage point in the medium term—5
years after the reform. This result is consistent with Jayadev (2007), which reports an effect of
capital account openness on the labor share of income ranging between 0.5 and 1 percentage
point.
Similarly, repeating the analysis for the labor share of income we find that capital
account liberalization reforms tend to have the largest medium-term effects on high and middle
income countries, while the effect on the low-income group countries is not statistically
significant. This result is consistent with previous empirical evidence suggesting that the impact
of international financial flows on inequality and labor market shares tends to be larger in
advanced economies (Jaumotte et al. 2013; Jayadev, 2007).
V. CONCLUSIONS AND POLICY IMPLICATIONS
Financial globalization is widely regarded to play a catalytic role in generating an array of
collateral benefits that boost long-run growth and welfare. However, it is not clear whether these
benefits are typically shared equally across all segments of the population. Indeed, while income
18 Data are taken from the detailed aggregate tables of the UN national accounts, table 203 using the SNA 1993
methodology. Where multiple series were available (since the UN collects data using multiple methods), we apply
the first difference of the labor share from the later series to the labor share derived from the earlier series. One
shortcoming of our measure is that it does not include the labor income part of the income of self-employed.
15
inequality has risen in most countries and regions over the past three decades, this period has
also been associated with unprecedented financial integration.
The aim of this paper is to empirically test the impact of capital account liberalization
reforms on inequality. Using an unbalanced panel of 149 countries from 1970 to 2010, we find
that, capital account liberalization episodes are associated with a statistically significant and
persistent increase in inequality. In particular, we find that, on average, capital account
liberalization reforms have typically increased the Gini coefficient by about 0.8 percent in the
very short term (1 year after the occurrence of the liberalization reform) and by about 0.7- 2½
percent in the medium term (5 years after).
This finding does not imply that countries should not undertake capital account
liberalization, but it suggests an additional reason for caution. As noted in “The Liberalization
and Management of Capital Flows: An Institutional View” (IMF 2012):
“Capital flows can have substantial benefits for countries, including by enhancing
efficiency, promoting financial sector competitiveness, and facilitating greater productive
investment and consumption smoothing. At the same time, capital flows also carry risks,
which can be magnified by gaps in countries’ financial and institutional infrastructure.
Capital flow liberalization is generally more beneficial and less risky if countries have
reached certain levels or thresholds of financial and institutional development.”
The reason for caution given in the IMF’s institutional view is that capital flows can be volatile
and—particularly given their large size relative to domestic markets—this can pose a risk to
economic and financial stability. Our finding points to an additional reason for caution: countries
where reduction in inequality is an important policy goal may need to design liberalization in a
manner that balances this consideration against the other effects.
In addition, we also find that the occurrence of crises and the level of financial and
institutional development play a key role in shaping the response of inequality to financial
globalization reforms. In particular, our results suggest that the negative effect of globalization
reforms on inequality tend to be significantly smaller in countries with a strong level of financial
institutions, and when they are not followed by episodes of financial crises. These results provide
an additional reason to support the IMF’s institutional view that the benefit-to-cost ratio of
liberalization is higher past certain thresholds of financial development: the impact of
liberalization on inequality is also muted at higher thresholds. In this context, economic policies
designed to foster these necessary supporting conditions, while beneficial per se, are important to
enhance the benefits stemming from financial integration. Finally, it is essential to see financial
integration not just as an isolated policy goal but as part of a broader package of reforms and
supportive macroeconomic policies.
16
REFERENCES
Abiad, Abdul G. and Furceri, Davide and Topalova, Petia B., The Macroeconomic Effects of
Public Investment: Evidence from Advanced Economies (May 2015). IMF Working
Paper No. 15/95.
Agnello, Luca and Ricardo M. Sousa (2012), "How do banking crises impact on income
inequality?" Applied Economics Letters, Taylor and Francis Journals, 19(15), 1425-1429,
October.
Atkinson, A. B. and S. Morelli (2011), Inequality and banking crises: A first look. Paper
prepared for the Global Labour Forum in Turin organized by the International Labour
Organization.
Auerbach, Alan, and Yuriy Gorodnichenko. 2013. “Fiscal Multipliers in Recession and
Expansion.” In Fiscal Policy After the Financial Crisis, eds. Alberto Alesina and
Francesco Giavazzi, NBER Books, National Bureau of Economic Research, Inc.,
Cambridge, Massachusetts.
Bernal-Verdugo, L., D. Furceri, and D. Guillaume (2013), “Banking crises, labor reforms and
unemployment,” Journal of Comparative Economics, vol. 4, 1202-1219.
Bouis, Romain, Orsetta Causa, Lilas Demmou, Romain Duval, and Aleksandra Zdzienicka
(2012), "The Short-Term Effects of Structural Reforms: An Empirical Analysis," OECD
Economics Department Working Papers 949, OECD Publishing.
Cerra. Valerie. and Sweta .C. Saxena, (2008). “Growth Dynamics: The Myth of Economic
Recovery”, American Economic Review, 98, 439-457.
Chen, S.L., J.L. Wu (2005), Long-run Money Demand Revisited: Evidence from a Non-linear
Approach. Journal of International Money and Finance, Vol. 24, pp. 19-37.
Chinn, M. and H. Ito (2008), "A New Measure of Financial Openness", Journal of Comparative
Policy Analysis , 10(3), 309 – 322, September.
Claessens, S. and E.C. Perotti (2007), “Finance and Inequality,” Journal of Comparative
Economics 35, 748-773.
Collins, S. M. (2007), “Comments on “Financial globalization, growth, and volatility in
developing countries” by Eswar Prasad, Kenneth Rogoff, Shang-Jin Wei, and M. Ayhan
Kose”. In: Harrison, A. (Ed.), Globalization and Poverty, National Bureau of Economic
Research Conference Report. University of Chicago Press, Chicago.
Cragg, M.I. and M. Epelbaum (1996), “Why Has Wage Dispersion Grown in Mexico? Is it the
Incidence of Reforms of the Growing Demand for Skills?” Journal of Development
Economics 51, 99-116.
17
Cukierman, Alex and Mariano Tommasi (1998), “When Does It Take a Nixon to Go to China?”
American Economic Review, 88(1), 180–97.
Das, Mitali and Mohapatra Sanket (2003), “Income inequality: the aftermath of stock market
liberalization in emerging markets” Journal of Empirical Finance, 10, 217-248.
Demirguc-Kunt, Asli, Leora Klapper, Dorothe Singer, and Peter Van Oudheusden. 2015. “The
Global Findex Database 2014: Measuring Financial Inclusion around the World.” Policy
Research Working Paper 7255, World Bank, Washington, DC.
Fok D., D. van Dijk, P. H. Franses (2005), A multi-level panel STAR model for US
manufacturing sectors. Journal of Applied Econometrics, Vol. 20(6), pp. 811-827.
Granger, Clive W. J., and Timo Teräsvirta. 1993. Modelling Nonlinear Economic Relationships.
New York: Oxford University Press.
Harrison, A. E. (2002), ‘Has Globalization Eroded Labour’s Share’ mimeo, University of
California Berkeley
Helpman, Elhanan, Oleg Itskhoki, Marc-Andreas Muendler, and Stephen Redding. 2015. “Trade
and Inequality: From Theory to Estimation”. Harvard University, manuscript.
Henry, P.B. 2007. Capital Account Liberalization: Theory, Evidence, and Speculation, Journal of
Economic Literature, vol. XLV (December), 887-935.
Kose, M. Ayhan, Eswar S. Prasad, and Marco E. Terrones (2009), "Does financial globalization
promote risk sharing?," Journal of Development Economics, Elsevier, 89(2), 258-270,
July.
Kose, Ayhan M, Eswar S. Prasad, and Ashley D. Taylor (2011), "Thresholds in the process of
international financial integration," Journal of International Money and Finance, Elsevier,
30(1), 147-179, February.
IMF (2012), “The Liberalization and Management of Capital Flows: An Institutional View”,
IMF Policy Paper.
Jayadev, Arjun (2007), "Capital account openness and the labour share of income," Cambridge
Journal of Economics, Oxford University Press, 31(3), 423-443, May
Jaumotte, Florence, Subir Lall, and Chris Papageorgiou (2013), "Rising Income Inequality:
Technology, or Trade and Financial Globalization? " IMF Economic Review, 61(2).
Quinn, Dennis P. and A. Maria Toyoda. (2008), Does Capital Account Liberalization Lead to
Economic Growth? Review of Financial Studies, 21(3), 1403-1449.
18
Laeven, Luc and Fabian Valencia (2010), “Resolution of Banking Crises: The Good, the Bad,
and the Ugly.” IMF Working Paper WP/10/146 (Washington: International Monetary
Fund).
Larrain, Mauricio (2015), “Capital Account Opening and Wage Inequality”, Review of Financial
Studies, Society for Financial Studies, vol. 28(6), pp. 1555-1587.
Nickell, S. (1981). Biases in dynamic models with fixed effects. Econometrica: Journal of the
Econometric Society, 1417-1426.
Romer, Christina D. and David H. Romer (2010), “The Macroeconomic Effects of Tax Changes:
Estimates Based on a New Measure of Fiscal Shocks,” American Economic Review,
100(3), 763–801.
Sarno, L., M. P. Taylor (2002), Purchasing power parity and the real exchange rate. IMF Staff
Papers 49, pp. 65-105.
Solt, Frederick. (2009), “Standardizing the World Income Inequality Database.” Social Science
Quarterly, 90(2), 231-242. SWIID Version 3.1, December 2011.
Teulings, C. N. and Zubanov, N. (2014), Is economic recovery a myth? robust estimation of
impulse responses. Journal of Applied Econometrics, 29: 497–514.
19
Figure 1. Income inequality within income groups (1985-2005)
Figure 2. Capital account openness within income groups (1970-2010)
Figure 3. The evolution of inequality before and after capital account liberalizations
35
37
39
41
43
45
47
491
98
5
19
86
19
87
19
88
19
89
19
90
19
91
19
92
19
93
19
94
19
95
19
96
19
97
19
98
19
99
20
00
20
01
20
02
20
03
20
04
20
05
Low income
High income
Upper middle income
Lower middle income
Global
-1.5
-1
-0.5
0
0.5
1
1.5
2
19
70
19
72
19
74
19
76
19
78
19
80
19
82
19
84
19
86
19
88
19
90
19
92
19
94
19
96
19
98
20
00
20
02
20
04
20
06
20
08
20
10
Global
Low income
Lower middle income
Upper midlle income
High income
43.6
43.8
44
44.2
44.4
44.6
44.8
45
45.2
45.4
5 years before 3 years before 1 year before 1 year after 3 years after 5 years after
20
Figure 4. The effect of capital account liberalization on inequality (1970-2010), OLS
Note: IRFs are estimated using the specification in equation (1). The solid line corresponds to the IRF; dotted lines
correspond to 90 percent confidence bands.
Figure 5. The effect of capital account liberalization on inequality (1970-2010),
Depth of liberalization
Panel A. 1 Standard Deviations
Panel B. 3 Standard Deviations
Note: IRFs are estimated using the specification in equation (1). The solid line corresponds to the IRF; dotted lines
correspond to 90 percent confidence bands.
0
0.5
1
1.5
2
2.5
3
0 1 2 3 4 5
0
0.5
1
1.5
2
2.5
3
0 1 2 3 4 5
-0.5
0
0.5
1
1.5
2
2.5
3
3.5
4
0 1 2 3 4 5
21
Figure 6. The effect of capital account restriction on inequality (1970-2010)
Note: IRFs are estimated using the specification in equation (1). The solid line corresponds to the IRF; dotted lines
correspond to 90 percent confidence bands.
Figure 7. The effect of capital account liberalization on inequality (1970-2010), WLS
Note: IRFs are estimated using the specification in equation (1). The solid line corresponds to the IRF; dotted lines
correspond to 90 percent confidence bands.
Figure 8. The effect of capital account liberalization on inequality (1970-2010), different lags
Note: IRFs are estimated using the specification in equation (1).
-2
-1.5
-1
-0.5
0
0.5
1
0 1 2 3 4 5
0
0.5
1
1.5
2
2.5
3
3.5
0 1 2 3 4 5
0
0.5
1
1.5
2
2.5
0 1 2 3 4 5
ARDL11
Baseline
ARDL55
22
Figure 9. The effect of capital account liberalization on inequality, Quinn and Toyoda measure
of capital account openness
Note: IRFs are estimated using the specification in equation (1). The solid line corresponds to the IRF; dotted lines
correspond to 90 percent confidence bands.
Figure 10. The effect of capital account liberalization on inequality, additional controls
Note: IRFs are estimated using the specification in equation (1). The solid line corresponds to the IRF; dotted lines
correspond to 90 percent confidence bands.
Figure 11. The effect of capital account liberalization on inequality across income groups
Note: IRFs are estimated using the specification in equation (2).
-1
0
1
2
3
4
5
0 1 2 3 4 5
0
1
2
3
4
5
0 1 2 3 4 5
0
0.5
1
1.5
2
2.5
3
3.5
0 1 2 3 4 5
Low income
Middle income
High income
23
Figure 12. The effect of capital account liberalization on inequality, the role of financial
institutions
Panel A. EFW-Financial freedom indicator
Panel B. Credit-to-GDP
Panel C. Financial inclusion
Note: IRFs are estimated using the specification in equation (3).
0
0.5
1
1.5
2
2.5
3
3.5
0 1 2 3 4 5
Baseline
Low Financial Deepening
High Financial Deepening
-1
-0.5
0
0.5
1
1.5
2
2.5
3
3.5
0 1 2 3 4 5
Baseline
Low Financial Deepening
High Financial Deepening
0
0.5
1
1.5
2
2.5
3
3.5
0 1 2 3 4 5
Baseline
Low Financial Inclusion
High Financial Inclusion
24
Figure 13. The effect of capital account liberalization on inequality, the role of financial crises
Note: IRFs are estimated using the specification in equation (4).
Figure 14. The effect of capital account liberalization on the labor share (1970-2010)
Note: IRFs are estimated using the specification in equation (5). The solid line corresponds to the IRF; dotted lines
correspond to 90 percent confidence bands.
0
0.5
1
1.5
2
2.5
3
3.5
4
0 1 2 3 4 5
Baseline
No crises
Crises
-1.4
-1.2
-1
-0.8
-0.6
-0.4
-0.2
0
0 1 2 3 4 5
25
Table 1. Descriptive statistics by income groups
Panel A. All countries
N Average SD Min Max
Gini 4334 44.531 9.274 17.590 77.965
D.Gini 4020 -0.014 1.836 -13.567 19.571
Kaopen 6023 -0.002 1.529 -1.856 2.456
D.Kaopen 5829 0.024 0.370 -3.253 3.253
Panel B. High income
N Average SD Min Max Gini 1542 42.653 6.601 25.022 64.877
D.Gini 1464 0.058 1.716 -13.567 10.676
Kaopen 1667 1.036 1.516 -1.856 2.456
D.Kaopen 1618 0.044 0.299 -2.292 2.292
Panel C. Upper middle income
N Average SD Min Max
Gini 1298 45.699 10.692 17.590 77.965
D.Gini 1187 -0.011 1.867 -11.059 10.844
Kaopen 1538 -0.138 1.470 -1.856 2.456
D.Kaopen 1488 0.023 0.449 -3.253 2.556
Panel D. Lower middle income
N Average SD Min Max
Gini 937 44.991 9.533 23.568 77.480
D.Gini 863 -0.054 1.939 -8.646 19.571
Kaopen 1606 -0.352 1.342 -1.856 2.456
D.Kaopen 1551 0.014 0.384 -3.253 3.253
Panel D. Low income
N Average SD Min Max
Gini 557 46.235 10.656 25.146 75.853
D.Gini 506 -0.161 1.912 -8.706 6.917
Kaopen 1212 -0.793 1.017 -1.856 2.456
D.Kaopen 1172 0.011 0.323 -1.935 2.988
Table 2. Number of capital account liberalization reforms
70s 80s 90s 2000s 1970-2010
All 38 25 100 61 224
High income 15 7 23 14 58
Upper middle income 11 9 28 31 79
Lower middle income 5 6 31 12 54
Lower income 7 3 18 5 33
26
Table 3. The effect of capital account liberalization on inequality (1970-2010), OLS
Gini growth(t-1) 0.272***
(4.52)
Gini growth(t-1) 0.127***
(2.77)
Capital account reform (t) 0.766***
(3.12)
Capital account reform (t-1) 0.143
(0.45)
Capital account reform (t-2) -0.048
(-0.16)
Current account reform (t) 0.285
(1.00)
Current account reform (t-1) 0.135
(0.43)
Current account reform (t-2) 0.579*
(1.65)
Regulation reform (t) -0.333
(-1.05)
Regulation reform (t-1) -0.414
(-0.96)
Regulation reform (t-2) -0.059
(-0.18)
N 2071
R2 0.21 Note: T-statistics based on robust clustered standard errors in parenthesis. ***,**,* denote significance at 1 percent,
5 percent and 10 percent, respectively. Capital account reforms are identified as episodes when, for a given country
at a given time, the annual change in the Kaopen indicator exceeds by two standard deviations the average annual
change over all observations. Current account reforms are identified as episodes when, for a given country at a given
time, the annual change in the Quinn and Toyoda current account indicator exceeds by two standard deviations the
average annual change over all observations. Regulatory reforms are identified as episodes when, for a given
country at a given time, the annual change in the EFW regulatory indicator exceeds by two standard deviations the
average annual change over all observations.