Embed Size (px)
Citation preview

Prepared for the by the Drowning Canada
CanadianDrowning Report2019 edition
CanadianDrowning Report2019 editionPrepared for the Lifesaving Society Canada by the Drowning Prevention Research Centre Canada

2 Canadian Drowning Report • 2019 Edition • Lifesaving Society
The long-term downward trend of drowning deaths in Canada con tinued in 2016. There were 408 unintentional drowning deaths in 2016, according to the most recent data from the chief coroners’ and medical examiners’ offi ces; the lowest reported in 25 years. Note that only partial data for 2016 was available from British Columbia at the time of data collection.
An average of 444 water-related fatalities occurred each year in 2012–16, down from an average of 475 in 2007–11. The average annual water-related death rate has decreased over the past 25 years from 2.2 per 100,000 population in the early 90s to 1.3 in the most recent data (2012–16). Despite this long-term progress, high numbers of preventable drowning deaths continue to occur in Canada: a total of 2,220 people lost their lives in Canadian waters between 2012 and 2016.
Change in Number of Unintentional Water-Related Deaths and Death Rates in Canada over 25 Years, 1992–2016
Average number of deaths per year
Average death rate per 100,000 population
Number of Unintentional Water-Related Deaths in Canada, 1990–2016
1992–1996 1997–2001 2002–2006 2007–2011 2012–2016
Water image designed by Freepik
2.2 1.7 1.5 1.4 1.3
631
508
468475
444
683
632
601
685
622 617
566
503
472
448
457
433
492508
480470
450
495
466
428
408*
551
450
494483
423
632
199219941996199820002002200420062008201020122014
1990
2016
* Incomplete data, as not all data for British Columbia were available at the time of data collection.

Canadian Drowning Report • 2019 Edition • Lifesaving Society 3
Unintentional Water-Related Fatalities by Province/Territory, 2017 and 2018Number of Canada-wide
preventable water-related deaths, 2017 & 2018
Complete, fi nal data on drowning and water-related fatalities are not yet available for 2017 and 2018. The preliminary data from media and internet reports indicate that at least 283 drowning deaths occurred in 2017 and at least 286 in 2018.
Province/Territory 2017 2018Alberta 31 12British Columbia 50 58Manitoba 12 16New Brunswick 1 4Newfoundland and Labrador 6 11Nova Scotia 9 18Northwest Territories 1 3Nunavut 3 1Ontario 93 100Prince Edward Island 2 5Quebec 59 49Saskatchewan 14 9Yukon 2 0Total 283 286
4 Canadian Drowning Report • 2019 Edition • Lifesaving Society
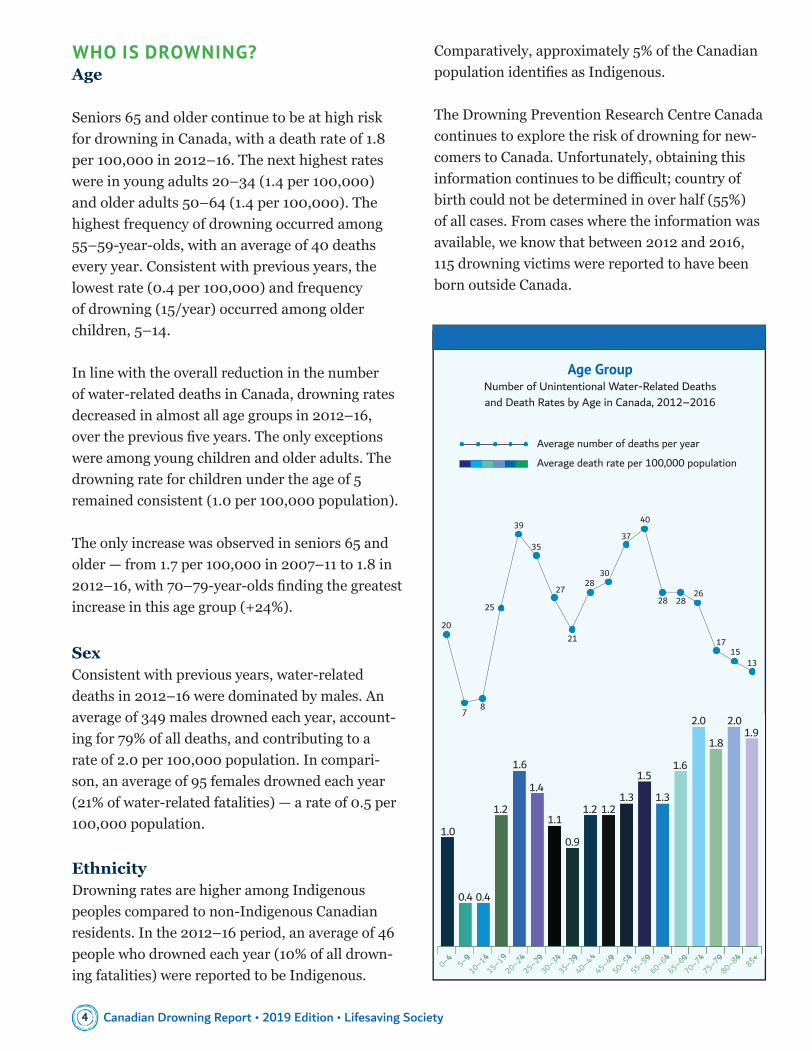
WHO IS DROWNING?Age
Seniors 65 and older continue to be at high risk for drowning in Canada, with a death rate of 1.8 per 100,000 in 2012–16. The next highest rates were in young adults 20–34 (1.4 per 100,000) and older adults 50–64 (1.4 per 100,000). The highest frequency of drowning occurred among 55–59-year-olds, with an average of 40 deaths every year. Consistent with previous years, the lowest rate (0.4 per 100,000) and frequency of drowning (15/year) occurred among older children, 5–14.
In line with the overall reduction in the number of water-related deaths in Canada, drowning rates decreased in almost all age groups in 2012–16, over the previous fi ve years. The only exceptions were among young children and older adults. The drowning rate for children under the age of 5 remained consistent (1.0 per 100,000 population).
The only increase was observed in seniors 65 and older — from 1.7 per 100,000 in 2007–11 to 1.8 in 2012–16, with 70–79-year-olds fi nding the greatest increase in this age group (+24%).
SexConsistent with previous years, water-related deaths in 2012–16 were dominated by males. An average of 349 males drowned each year, account-ing for 79% of all deaths, and contributing to a rate of 2.0 per 100,000 population. In compari-son, an average of 95 females drowned each year (21% of water-related fatalities) — a rate of 0.5 per 100,000 population.
EthnicityDrowning rates are higher among Indigenous peoples compared to non-Indigenous Canadian residents. In the 2012–16 period, an average of 46 people who drowned each year (10% of all drown-ing fatalities) were reported to be Indigenous.
Comparatively, approximately 5% of the Canadian population identifi es as Indigenous.
The Drowning Prevention Research Centre Canada continues to explore the risk of drowning for new-comers to Canada. Unfortunately, obtaining this information continues to be diffi cult; country of birth could not be determined in over half (55%) of all cases. From cases where the information was available, we know that between 2012 and 2016, 115 drowning victims were reported to have been born outside Canada.
Age GroupNumber of Unintentional Water-Related Deaths and Death Rates by Age in Canada, 2012–2016
25–2910–14
15–1920–24
30–3435–39
40–440–4
45–495–9
50–5455–59
65–6970–74
75–7960–64
80–8485+
20
7 8
25
39
35
27
21
2830
37
40
28 2826
1715
13
Average number of deaths per year
Average death rate per 100,000 population
25–2910–14
15–1920–24
30–3435–39
40–440–4
45–495–9
50–5455–59
65–6970–74
75–7960–64
80–8485+
7
1.0
0.4 0.4
1.2
1.6
1.4
1.1
0.9
1.2 1.21.3
1.5
1.3
1.6
2.0
1.8
2.01.9

Canadian Drowning Report • 2019 Edition • Lifesaving Society 5
WHEN ARE THEY DROWNING?
Although water-related fatalities occur in every month of the year, the majority continued to occur during the warmest months. Approximately
two-thirds (66%) of all drown-ing deaths in 2012–16 occurred from May to September. Water-related fatalities most frequently occurred in July, with an average of 83 drowning deaths (19%) each year.
Over half (52%) of water-related fatalities in 2012 –16 occurred on the weekend (Friday to Sunday). Saturdays were the most frequentday when drowning deaths occurred (90 per year, 20%).
Males Approximately 8 out of 10 were male.
Drowning Victims
65+SENIORS
Seniors People 65 and older had the highest rate of all age groups.
Older seniors The largest increase was observed among ages 70–79.

6 Canadian Drowning Report • 2019 Edition • Lifesaving Society
WHERE ARE THEY DROWNING?Body of water
Consistent with previous years, the majority of drowning deaths in Canada occurred in natural bodies of water (69%). Between 2012 and 2016, lakes and ponds (34%) were the most frequent location for water-related deaths, followed by rivers and streams (28%). On average, 276 people drown in one of these two settings each year. The locations of drowning incidents varied by province; the Atlantic provinces and the territories had even higher proportions of drowning fatalities in natural bodies of water than other provinces: Newfound-land and Labrador (94%), Prince Edward Island (100%), Nova Scotia (92%), New Brunswick (90%), Northwest Territories (100%), Nunavut (100%), and Yukon (94%).
Bathtubs (12%) continued to be a common setting for drowning in 2012–16. An average of 52 water-related deaths occurred in bathtubs each year. Bathtub drowning deaths most frequently occurred in Ontario (47% of all bathtub drownings), fol-lowed by Alberta (18%), Quebec (16%), and British Columbia (10%).
Body of Water Average Number of Deaths per Year and Percentage of Unintentional Water-Related Deaths in Canada, 2007–2016
After bathtubs, pools (9%) were the next most common artifi cial setting where drowning deaths occurred. Private pools (87%) accounted for the majority of pool-related drowning deaths, with an average of 33 water-related fatalities each year. The highest incidence of private-pool fatalities occurred in Ontario (17 per year) followed by Quebec (10 per year). It is diffi cult to obtain detailed information on fences and gates from backyard-pool drowning cases. In instances where this information was available, 39% of the pools had no fence or had a non-compliant fence, and 74% had either no gate or a gate that was neither self-closing nor self-latching.
Few drowning deaths occur in lifeguard-supervised settings such as public pools and waterfronts (less than 1%).
Drowning can happen in any water, but the most common locations of water-related fatalities vary by age. Young and middle-aged adults most com-monly drown in natural bodies of water, such as lakes and rivers. Young children and seniors over 65 are vulnerable groups for drowning in artifi cial bodies of water, such as bathtubs and pools. Bath-
Most Vulnerable
Bathtubs/pools Children and seniors.
Lakes/rivers Young/middle-aged adults.
2007–11 2012–16Lake or Pond 182 (38%) 153 (34%)River/Creek/Stream 134 (28%) 123 (28%)Ocean 46 (10%) 33 (7%)Bathtub 42 (9%) 52 (12%)Private Pool 28 (6%) 33 (7%)Ditch/Culvert 14 (3%) 13 (3%)Hot Tub/Whirlpool 8 (2%) 7 (2%)Public Pool 3 (1%) 5 (1%)Canal 3 (1%) 1 (0%)Dam 2 (0%) 2 (0%)Quarry 2 (0%) 2 (0%)Dugout/Retention Pond 1 (0%) 4 (1%)Other/Unknown 10 (2%) 16 (4%)
Images designed by Freepik.
Bathtubs/pools Children and seniors.

Canadian Drowning Report • 2019 Edition • Lifesaving Society 7
tubs were the second most common setting where seniors, who had the highest death rate of all age groups, drowned (second only to lakes and ponds). In 2012–16, seniors more frequently drowned in a bathtub (20%) than in a river (18%).
Provinces and territoriesAs in previous years, the average water-related fatality rates in the territories were higher than anywhere else in Canada; Nunavut (10.0 per 100,000), the Yukon (8.6 per 100,000), and the Northwest Territories (8.2 per 100,000). After the territories, the next-highest drowning rates were found in Newfoundland and Labrador (2.9 per 100,000), followed by Saskatchewan (2.3).
Death rates decreased in 10 of the 13 provinces and territories in 2012–16, in line with the over-
all decrease. The largest decreases occurred in Newfoundland and Labrador (–31%), followed by Manitoba (–30%) and Nunavut (–29%).
Small increases in the drowning and water-related fatality rates were reported in the Northwest Ter-ritories (+19%), Alberta (+10%), and Saskatchewan (+15%).
Urban versus rural locationNearly half (44%) of those who drowned in rural areas were not rural residents. A disproportionately high number of people drowned in rural environ-ments: less than 20% live in a rural area, yet 35% of all drowning fatalities occurred there. The areas of Canada with the highest proportion of rural drown-ings were Nunavut (94%), Saskatchewan (79%), the Northwest Territories (67%), and Manitoba (63%).
Province and Territory Average Water-Related Death Rates per 100,000 per Year, 2012–2016
2.9
1.6
1.1
8.210.0
8.6
1.02.3
1.6
1.11.4
1.30.7
Average Annual Deaths (rate per 100,000) 2007–11 2012–16Newfoundland & Labrador 22 (4.2) 15 (2.9)Prince Edward Island 1 (0.9) 1 (0.7)Nova Scotia 17 (1.8) 13 (1.4)New Brunswick 13 (1.7) 10 (1.3)Quebec 83 (1.1) 78 (1.0)Ontario 167 (1.3) 152 (1.1)Manitoba 28 (2.3) 21 (1.6)Saskatchewan 21 (2.0) 25 (2.3)Alberta 35 (1.0) 44 (1.1)British Columbia 78 (1.8) 74 (1.6)Northwest Territories 3 (6.9) 4 (8.2)Nunavut 5 (14.1) 4 (10.0)Yukon 4 (10.6) 3 (8.6)

8 Canadian Drowning Report • 2019 Edition • Lifesaving Society
WHAT WERE THEY DOING?Purpose of activity
Recreational activities continued to account for the majority of drowning deaths in Canada in 2012–16. An average of 258 water-related fatalities each year (58% of all water-related deaths) occurred while people were recreating in, on, or near the water. Consistent with previous years, the most common recreational activities were swimming (31%), walk-ing, running, or playing near water or on ice (14%), and powerboating (10%).
Daily living activities (29%) were the next most common, and deaths continued to increase in this category despite an overall decrease in drowning fatalities. Between 2012 and 2016, an average of 131 (29%) people drowned annually while engaged in routine daily activities (up from an average of 121 per year, 25% of all drowning fatalities in 2007–11). Bathing (38%) and motor-vehicle travel (28%) were the most common daily living activities engaged in prior to drowning. A higher proportion of daily-living-related drowning deaths occurred in Saskatchewan (57%), Nunavut (50%), and the Northwest Territories (39%) than in other prov-inces and territories.
Fewer drowning incidents involved occupational activities (4%) or attempting to rescue another per-son who was drowning (2%). The highest propor-tion of occupational drowning deaths occurred in New Brunswick (16%), followed by Newfoundland and Labrador (13%). Commercial fi shing accounted for 72% of these deaths.
Most Common Primary Recreational ActivitiesAverage Number of Deaths per Year and Percentage of Recreational Drowning Deaths in Canada, 2012–2016
Recreational288 (61%) 258 (58%)
Daily Living 121 (25%) 131 (29%)
Occupational25 (5%)18 (4%)
Attempting Rescue 9 (2%) 7 (2%)
Unknown 32 (7%) 30 (7%)
Purpose of ActivityUnintentional Drownings per Year in Canada,
Average Number and Percentage
2007–11 2012–16
Images: designed by freepik.
Walking/R
unning/
Playing N
ear W
ater
Swimming
Powerb
oating
Fishing f
rom a Boat
Canoein
g
Diving/Ju
mping
Other Non-pow
er Boati
ng
Riding ATV
Scuba D
iving
Fishing f
rom Land
Kayakin
g
Snowmobilin
g
Walking/R
unning/
Playing N
ear W
ater
Swimming
Powerb
oating
Fishing f
rom a Boat
Canoein
g
Diving/Ju
mping
Other Non-pow
er Boati
ng
Riding ATV
Scuba D
iving
Fishing f
rom Land
Kayakin
g
Snowmobilin
g
Hot Tu
bbing
80 31%
7 3%
35 14%
7 3%
7 3%
15 6%
7 3%
7 3%
26 10%
12 5%
27 10%
6 2%
6 2%
Phot
o: fr
eepi
k.co
m

Canadian Drowning Report • 2019 Edition • Lifesaving Society 9
Type of activityAquatic activities (27%) where the victim intended to be in the water but something went wrong were the most frequent type of activity in drown-ing deaths. An average of 118 people drowned each year while engaged in an aquatic activity. Despite the overall de-crease in the number of water-related fatality deaths in Canada in 2012–16, the number and proportion of aquatic-activity drowning deaths increased (up from 116 per year, 24% in 2007–11).
An average of 103 people drowned each year while engaged in powered or non-powered boating, making it the next most common type of activity linked with drowning deaths (23%). The number of boating-related deaths is down from 126 per year in 2007–11 (27%), when it was the most common related activity. Unintended water entry (such as an unexpected fall into water) during a non-aquatic activity accounted for the next greatest propor-tion of incidents (20%). An average
(54%) powerboat-related deaths oc-curred each year. Small powerboats less than 5.5 metres long were more commonly involved in drowning fatalities (21%) than large powerboats (13%) or personal watercraft (4%). Canoes were the next most common vessel in boating incidents; each year, an average of 22 people (22%) drowned while canoeing.
In boating-related deaths for which personal fl otation device (PFD) information was available, 81% were not wearing one at the time of the incident and an additional 5% were not wearing one properly. Of those known not to be wearing a PFD or lifejacket, at least 34% had a lifejacket present in the boat but were unable to put it on during the incident. Alcohol consumption was a factor in 35% of boating-related fatalities. The most common types of boating incidents that led to drowning were capsizing (42%) and falling or being thrown overboard (29%).
Boating Incidents by Type of VesselAverage Number of Deaths per Year and Percentage of Boating Deaths in Canada
2007–2011 2012–2016
Type of ActivityUnintentional Drownings per Year in Canada, Average Number and Percentage
Non-Aquatic Activity
ing deaths during bathing are less frequent compared to other activities, their number and proportion continued to increase. A yearly average of 50 drowning deaths occurred while the person was bathing (11%), up from 41 (9%) in 2007–11.
BoatingPowerboats were consistently the craft most often involved in boating-related drowning fatalities: an average of 55
Aquatic Activity
2012–162007–11
Land/Air/Ice Transportation
Boating
of 87 people drowned each year after fall-ing into water.
While drown- 36 29%21 21%
26 20%22 22%
17 13%13 13%
13 10%17 17%
8 6%7 7%
6 4%6 5%
4 3%3 3%
3 3%2 2%
2 1%4 4%
13 10%7 6%
Powerboat < 5.5m
Canoe
Powerboat Size Unknown
Powerboat > 5.5m
Kayak
Rowboat
Infl atable Craft
Sailboat
Personal Watercraft
Other/Unknown
126 (27%)
93 (19%)
79 (17%)
41 (9%)
19 (4%)
103 (23%)
87 (20%)
60 (14%)
25 (6%)
Bathing
Unknown
Bubb
les:
deis
nged
by
star
line
/ fr
eepi
k.
50 (11%)
BoatingBoating
Aquatic ActivityAquatic Activity
Non-Aquatic Activity
116 (24%) 118 (27%)

Canadian Drowning Report • 2019 Edition • Lifesaving Society10
WHY DID THEY DROWN? …RISK FACTORS
The major risk factors contributing to water-related fatalities in Canada remain consistent with those identified in previous years. They are sum-marized here by most common activities (swim-ming and boating), as well as by age group.
BoatingNot wearing a PFD/lifejacket (81%, where information available)Cold water (65%, where information available)Consuming alcohol (35%)Capsizing (42%)Boating alone (30%)Falling or being thrown overboard (29%)Boating in darkness or twilight (22%)Boating in rough water (22%)
SwimmingWeak or non-swimmer (31%, where information available)Consuming alcohol (32%)Swimming alone (27%)Heart disease/sudden cardiac event while swimming (20%)
0–4Alone near water (64%)Supervision absent (71%)Supervision present but distracted (25%)With other minors only (22%)
5–14Not wearing a PFD when recommended (67%, where informa-tion available)Alone or with other minors only (53%)
15–19Not wearing a PFD when recommended (94%, where information available)Consuming alcohol (38%)Alone (27%)Being in, on, or near the water after dark (24%)
20–34Not wearing a PFD when recommended (87%, where information available)Consuming alcohol (49%)Alone (33%)Being in, on, or near the water after dark (21%)
35–64Not wearing a PFD when recommended (78%, where information available)Alone (53%)Consuming alcohol (43%)
65+Not wearing a PFD when recommended (79%, where information available)Alone (72%)Consuming alcohol (19%)

Canadian Drowning Report • 2019 Edition • Lifesaving Society 11
Research methodology
Complete data from 1990–2016The drowning research process involves data collection, research tabulation, and analysis. The water-related death data is extracted from the offices of the chief coroners and medical examiners in each province/territory. This research:
collects the data needed to profile victims of aquatic incidents, includ-ing circumstances and contributing factors.
includes all deaths in each province/territory resulting from incidents “in, on, or near” water; “near-water” incidents were included if the incident was closely related to water-based recreational, vocational or daily living activity or if the presence of water appeared to contribute to the activity.
includes only unintentional deaths. It does not include deaths due to natural causes, suicide, or homicide.
Interim dataComplete final data on more recent drownings and other water-related deaths are not yet available from the offices of the provincial/territorial chief coroners and medi-cal examiners. The interim, preliminary data are derived from media releases, media clippings, news reports, and internet searches.
AcknowledgementsWe gratefully acknowledge the support, cooperation, and efforts of:
The chief coroners’ and the chief medical examiners’ offices in each province/territory,
who permitted and facilitated confidential access to the coroners’ reports on unintentional water-related deaths that provided the base data for this report.
The volunteers who contributed their time and energy to extract data on preventable water-related deaths from coroners’ files.
Tessa Clemens, the primary author and data analyst for this report, and Lucie Simoes, who provided data input and verification.
SciEditor’s team, for editing and design services.

CONTACT USNational Offi [email protected]
British Columbia and [email protected]
Alberta and Northwest [email protected]
Saskatchewan306-780-9255lifesaving@sasktel.netwww.lifesavingsociety.sk.ca
The Lifesaving SocietyThe Lifesaving Society — Canada’s lifeguarding experts — works to prevent drowning and water-related injury through its training programs, Water Smart® public education, aquatic safety management, drowning research, and lifesaving sport. More than 1.2 million Canadians participate in the Society’s swimming, lifesaving, lifeguard and leadership-training programs every year. The Society sets the standard for aquatic safety in Canada and certifi es Canada’s National Lifeguards.
[email protected] www.lifesaving.mb.ca
Ontario416-490-8844experts@lifeguarding.comwww.lifesavingsociety.com
Nova Scotia902-425-5450experts@lifesavingsociety.ns.cawww.lifesavingsociety.ns.ca
Prince Edward Island902-368-7757info@lifesavingsocietypei.cawww.lifesavingsocietypei.ca
Newfoundland and [email protected]
Drowning Prevention Research Centre CanadaThe Drowning Prevention Research Centre is the lead agency for drowning and water-incident research in Canada. The Centre conducts research into fatal and non-fatal drowning, signifi cant aquatic injury, and rescue interventions. Contact Barbara Byers, Research Director, [email protected], 416-490-8844.