Embed Size (px)
Citation preview
Can Insurance Help Manage Climate Risk andFood Insecurity? Evidence from the Pastoral
Regions of East Africa
Michael R. Carter∗
Sarah A. Janzen†
Quentin Stoeffler‡
March 2016
Abstract
Can insurance cost-effectively mitigate the increasingly deleterious impactsof climate risk on poverty and food insecurity? The theory reviewed in thischapter suggests an affirmative answer if well-designed insurance contracts canbe implemented and priced at a reasonable level despite the uncertainties thatattend climate change. Evidence from the IBLI index insurance project in thepastoral regions in East Africa suggest that these practical difficulties can beovercome and that insurance can have the impacts that underlay the positivetheoretical evaluation. At the same time, continuing analysis of the IBLIexperience suggests that much remains to be done if quality index insurancecontracts are to be scaled up and sustained. We conclude that insurance is notan easy, off-the-shelf solution to the problem of climate risk and food insecurity.Creativity in the technical and institutional design of contracts is still required,as our efforts to forge the more effective public-private partnerships needed toprice insurance at levels that will allow insurance to fulfill its potential as partof an integrated approach to social protection and food security in an era ofclimate change.
∗Professor, Department of Agricultural and Resource Economics at the University of Califor-nia, Davis, NBER and the Ginanni Foundation. +1-530-752-4672; fax: +1-530-752-5614. E-mailaddress: [email protected]†Assistant Professor of Economics, Montana State University; [email protected]‡Post-doctoral Fellow, University of California, Davis; [email protected]

Can Insurance Help Manage Climate Risk andFood Insecurity? Evidence from the the Pastoral
Regions of East Africa
There is ample evidence that climate shocks create and sustain poverty and foodinsecurity in rural regions of the developing world. There is also ample evidence thatclimate change is increasing the frequency and severity of climate shocks. Togetherthese pieces of evidence in turn provoke the question: Can insurance cost-effectivelymitigate the increasingly deleterious impacts of climate risk on poverty and foodinsecurity?
Two inter-related claims suggest an affirmative answer to this question:
1. After a shock is realized (ex post), insurance payments should help familiesmaintain their economic assets (physical and human) and their long-term eco-nomic viability. In simpler terms, insurance should help families avoid a (po-tentially inter-generational) poverty trap.
2. Because it increases ex post security, insurance should also have an ex anteeffect through increasing the expected level and certainty of returns to invest-ment. This ex ante ‘risk reduction dividend’ should allow more families toescape poverty and food insecurity.
Taken together these two arguments suggest that insurance can be a cost-effectiveinstrument to address food insecurity in the face of climate change. As opposedto a policy that simply treats the casualties of climate shocks with, say, food aidtransfers, an integrated policy that includes an insurance element may reduce thetotal required social protection expenditures by addressing the causes, not just thesymptoms, of food insecurity. Such an integrated policy cost effective if it allowsmore more households to maintain and achieve economic viability so that they cantake care of their own needs.
The goal of this paper is to interrogate these claims and reflect on obstacles thatmay limit the efficacy of insurance as an instrument to manage climate risk. Todo this, we proceed in several stages. First, in Section 1, we use recent theoreticalmodeling to explore the relative cost effectiveness of insurance as a device to managethe food insecurity induced by climate change. This modeling exercise assumes that:
• A contract can be designed that offers quality protection to inured individuals(i.e., insurance payouts correlate well with household losses) and avoids theproblems of moral hazard and adverse selection that can undercut the com-mercial sustainability of insurance;

• Households understand and trust the insurance and make purchase decisionsbased on a standard model of economic rationality; and,
• Insurance is commercially priced at the same proportionate levels observed inUS crop insurance markets (120% of the actuarially fair price).
Under these assumptions, we find that while the logic outlined above holds and thatintegrated social protection, which employs an insurance element, can be a part ofsmart public policy, especially in the face or climate change. We do find that therelative benefits of an integrated social protection begins to weaken as climate changeworsens and insurance itself becomes increasingly expensive.
While the theoretical case for insurance-augmented integrated social protectionis clear, can it work in practice–that is, can the three conditions assumed by the the-oretical analysis be met in practice? To provide insight into this question, we thenturn to a specific case study–livestock insurance in the pastoral regions of northernKenya and southern Ethiopia–to consider the practical barriers that limit the feasi-bility of insurance as a mechanism to help manage increasing climate risk. Section2 first shows how satellite-based index insurance has been developed to overcomethe most pressing barriers to using insurance for managing risk among low wealth,spatially disperse rural households. Empirical impact evaluations of the Kenya andEthiopia programs generally support the ex post and the ex ante insurance impactsoutlined above.
While this evidence from the pastoral regions of East Africa is promising, even inthis area the expansion and sustainability of the insurance contract remains funda-mentally challenged by a number of issues, including contract quality, demand andpricing. After putting forward a framework for thinking about the factors that limitthe quality of index insurance, Section 3 reviews new evidence on the quality of theEast African insurance contracts and considers possible future steps for improvingits quality. Section 4 then summarizes our findings concerning whether insurancecan in practice play a useful role in managing climate risk and food insecurity.
1 The Logic of Insurance as a Device to Mitigate
the Impacts of Climate Change on Food Inse-
curity
In an earlier paper, Barrett, Carter, and Ikegami (2013) identify what might betermed a social protection paradox. They compare two social protection scenarios.
2

In the first scenario, which mimics the targeting of conventional social protectionprograms, a fixed government budget is used to bring all poor households up to thepoverty line, or as close to the poverty line as the budget permits. This conventionalscenario is purely progressive in the sense that larger transfers go to poorer house-holds. In contrast, a second scenario considered by these authors–which they term atriage policy–is not purely progressive. Instead, the fixed government budget is firstallocated to the vulnerable non-poor to keep them from falling below a critical assetthreshold, thereby stemming their descent into long-term poverty. These transfersto the vulnerable non-poor are contingent transfers that are only made if an unfa-vorable shock occurs and threatens the vulnerable with economic collapse. After thecontingent needs of the vulnerable are met through these transfers, any remainingbudget is then allocated progressively to the poor, again moving all poor householdsas close to the poverty line as possible.
To compare the effectiveness of these two social protection schemes in managingpoverty, Barrett, Carter, and Ikegami (2013) employ a dynamic simulation model,similar to the model developed below. In their model, shocks are realized and in-dividuals optimally choose current consumption and the amount of assets to carryforward to generate future income. Based on household asset and consumption lev-els, an omniscient government then allocates its budget in accordance with its socialprotection policy regime. Results are derived for both the standard and the triageregimes. Barrett, Carter, and Ikegami (2013) find that while the extent and depthof poverty are lower in the short term under the conventional needs-based approach,those results are reversed in the medium and long terms. In other words, the poorare paradoxically better off in the medium term despite less social assistance beingallocated to them and more social assistance targeted to vulnerable but non-poorhouseholds.
The reason behind this paradoxical reversal is that when aid is concentrated solelyon the neediest and not the vulnerable non-poor, then the number of aid-eligiblepoor people slowly swells over time, diluting the resources available for each poorindividual. In contrast, transfers to the vulnerable both prevent them from fallingbelow the threshold (and becoming poor) and allow them to successfully build upassets and eventually move away from the threshold and the vulnerability that itimplies. Over time, under the triage policy an increasingly large share of the socialprotection resources become allocable to the poor whose ranks have not grown. Wemight anticipate that this social protection paradox revealed by Barrett, Carter, andIkegami (2013) will only become larger in the face of climate change.
Building on this work, Janzen, Carter, and Ikegami (2015) ask whether or notthe contingent transfers envisioned in the Barrett, Carter, and Ikegami (2013) triage
3

policy can be implemented via an insurance contract. Implementing these transfersas an insurance contract would have two advantages. First, it may be able to relyon self-selection, obviating the need for the government to monitor needs and issuepayments.1 Second, having an insurance contract available could also offer a benefitto non-vulnerable households, including poorer households. To the extent that theselatter households pay a portion of the insurance cost, they would be provisioning aportion of their own social protection.
While this logic may seem compelling, prior theoretical studies have suggestedthat insurance could actually increase the likelihood of collapse by vulnerable house-holds.2 However, these other studies ask what happens if vulnerable households areforced to purchase insurance. In contrast to these other theoretical analyses, Janzen,Carter, and Ikegami (2015) allow individuals to optimally decide and how much in-surance to purchase. This difference is subtle but important as Janzen, Carter, andIkegami (2015) find that the most vulnerable households optimally purchase onlyminimal insurance unless it is subsidized. These same households quickly switch tofull insurance as soon as they successfully accumulate a small amount of additionalproductive assets.
Using their model, Janzen, Carter, and Ikegami (2015) go on to show that thediscounted present value of a hybrid policy (which subsidizes insurance and makescash transfers to close the poverty gap for all poor households) is less than the costof a conventional transfer program that simply closes the poverty gap for all poorhouseholds. After briefly reviewing the Janzen, Carter, and Ikegami (2015) model,this section then extends their analysis to consider the relative cost effectiveness ofan insurance-based hybrid social protection scheme in the face of different climatechange scenarios.
1.1 Theoretical Model of the Ex Post and Ex Ante Impactsof Insurance on Poverty
Janzen, Carter, and Ikegami (2015) analyze the following dynamic model of a house-hold optimally allocating its resources across consumption, accumulation of assetsthat generate income through a risky production process, and purchase of an insur-
1The Barrett, Carter, and Ikegami (2013) policy assumes an omniscient government that canobserve shocks and issue precisely the transfer required to protect vulnerable households fromslipping into a poverty trap.
2See Chantarat et al. (2010) and Kovacevic and Pflug (2011).
4

ance contract that protects the household against asset losses:
maxct, 0≤It≤At
Eθ,ε∞∑t=0
u(ct)
subject to:
ct + pIt ≤ At + f(At)
f(At) = max[FH(At), FL(At)]
At+1 = (At + f(At)− ct) (1− θt+1 − εt+1) + (δ(θt+1)− p)Itδ(θt+1) = max ((θt+1 − s), 0)
At ≥ 0
(1)
The first constraint restricts current spending (consumption plus insurance pur-chases) to cash on hand (current assets plus income). As shown in the secondconstraint, the model assumes that assets are productive (f(At)) and that the house-holds have access to both a high and low production technology, FH(At) and FL(At),respectively. Fixed costs associated with the high technology make it the preferredtechnology only for households above a minimal asset threshold. As has been demon-strated elsewhere, this non-convexity in the production function can lead to multipleequilibria and a poverty trap. Households with assets above a critical threshold levelwill strive to reach to a higher, non-poor equilibrium level of asset holdings andconsumption. Those who begin with assets below that level (or whom shocks pushbelow that level), will settle down at a lower level of asset holding typified by lowerconsumption and a poor standard of living.
Assets are subject to stochastic shocks (or depreciation). The random variable,θt+1 ≥ 0 is a covariant shock and εt+1 ≥ 0 is an idiosyncratic shock.3 Both shocksare exogenous and realized after decision-making in the current period (t), but be-fore decision-making in the next period (t+ 1) occurs. While these risks affect allhouseholds, they play an especially important role for households in the vicinity ofthe critical asset threshold. Because a shock can send households in this vicinity intoa downward spiral to the low level equilibrium, we will refer to these households asthe ’vulnerable.’
A unit of insurance can be purchased at a price p and the insurance payout isbased on the realized covariant shock according to the linear indemnity schedule:
δ(θt) = max((θt)− s), 0), (2)
3The distinction between these two stochastic elements will become important later when weconsider feasible insurance mechanisms in the next section.
5

where s is the contractually determined depreciation rate above which insuranceindemnity payments begin. Note that this insurance mechanism is akin to an indexinsurance mechanism as it only pays based on common or covariant shocks and doesnot provide protection against idiosyncratic shocks.
The third constraint is the equation of motion for asset dynamics: period t cashon hand that is not consumed by the household or destroyed by nature is carriedforward as assets in period t + 1. Finally, the non-negativity restriction on assetsreflects the model’s assumption that households cannot borrow. This assumptionimplies that consumption cannot be greater than current production and assets, butit does not preclude saving for the future.
Figure 1 presents some of the key results from the Janzen, Carter, and Ikegami(2015) analysis of this dynamic model. The horizontal axis represents time periods(“years”) in the dynamic model. The vertical axis measures the headcount povertyrate for a stylized economy under three scenarios: An autarky scenario in which noinsurance contracts are made available; A market-based insurance scenario in whichinsurance costs 120% of its actuarially fair price; and, A targeted insurance subsidyscenario in which the government pays half of the commercial insurance premiumfor all households that hold assets less than the level required to generate an averageincome equal to 150% of the poverty line. In all cases, the simulation assumes thathouseholds behave optimally based on the price of insurance and the dynamic choiceproblem displayed above.
As can be seen from Figure 1, under the autarchy scenario with no insurance,headcount poverty steadily increases over time by about 25%, rising from 40% to 50%of the population. Under the targeted insurance subsidy scheme, there is an initialuptick in consumption poverty from 40% to 50%. This initial rise reflects the decisionof vulnerable or near poor households to consume at levels below the poverty line inorder to invest and (or) purchase insurance. However, over the longer-term, wheninsurance is partially subsidized for less well-off households, consumption povertyeventually falls to about 15% of the population, as opposed to the 50% level that oc-curs when there is no insurance market. This long-term drop in consumption povertywhen insurance is available and subsidized reflects the fact that a significant fractionof the vulnerable ultimately escape the poverty trap. In contrast, without insurance,more of these vulnerable households fail and swell the ranks of the income poor.When an asset insurance market simply exists, but contracts are not subsidized, theimpacts on poverty dynamics are qualitatively similar to the impacts of subsidizedinsurance, but quantitatively, the impacts are roughly two-thirds the magnitude ofthe impacts of subsidized insurance. This smaller impact occurs because the risk
6

Figure 1: Consumption Poverty Headcount
Source: Janzen, Carter, and Ikegami (2015)
7

reduction dividend effects are smaller when insurance is more costly.4
To gauge the cost-effectiveness of insurance subsidies from a public finance per-spective, Janzen, Carter, and Ikegami (2015) sum the cost of all required cash transferpayments and add to that amount the cost of targeted insurance subsidies. Theiranalysis reveals an intertemporal tradeoff. The cost of transfers cum insurance sub-sidies is initially quite high, but over time total social protection costs are higherunder the scheme that only provides cash transfers. Achieving the lower long-termpoverty measures afforded by insurance subsidies costs more money in the short-term, but leads to substantial long term savings. Using a 5% discount rate the netpresent value of the two public expenditure streams over the 50 year time horizonof the simulation are 16% lower under the targeted subsidy scheme. Note of coursethat the public expenditures are only a portion of the full cost of social protectionunder the insurance scheme as individuals are in some sense privately provisioning aportion of the cost of their own “social” protection.
1.2 Analysis of Climate Change Scenarios
The analysis reported in Janzen, Carter, and Ikegami (2015) assumes a baseline riskscenario that is roughly calibrated to the climate conditions of the pastoral regions ofEast Africa circa the year 2000. In order to explore the effectiveness of the insurancecum social protection scenario explored by Janzen, Carter, and Ikegami (2015), wetook their model and slowly increased the frequency and severity of the covariantshocks. Figure 2a shows the baseline scenario on which these results are based.5 Overa 50 year simulation scenario, we then allowed the climate to worsen every decade.Figure 2 shows the distribution of shocks assumed to exist in the final decade of thesimulation. The analysis assumes that individuals are fully informed about the lessfavorable climate and adjust their behavior accordingly. The cost of insurance is alsore-priced with every shift in climate, raising its costs, and the cost of the associatedtargeted insurance subsidies.
Figure 3 explores the costs of using subsidized insurance as part of a social pro-tection package that seeks to eliminate poverty by transferring to every indigenthousehold the amount of money necessary to lift them to a level of consumptionachievable at the poverty line. The vertical axis measures the percentage change in
4Janzen, Carter, and Ikegami (2015) discuss in detail how the price of insurance changes optimalinsurance purchase and asset investment decisions.
5The risk levels at baseline in the simulations that follow are similar, but not directly comparableto the baseline scenario originally presented in Janzen, Carter, and Ikegami (2015) and describedin the previous section.
8

Figure 2: Climate Change Scenarios
(a) Baseline Scenario (b) Year 50 Scenario
annual government expenditures relative to the the year-zero transfers that wouldbe required to close the poverty gap for all households under the alternative socialprotection policies. Results are again shown for three policy scenarios (autarkic riskmanagement; unsubsidized insurance; and, subsidized insurance for poor and vul-nerable households). For ease of comparison, we also include the social protectioncost trajectories for a given policy both with and without climate change.
As can be seen, as climate change kicks in at year 10 of the simulation, the costsof cash transfers needed to close the poverty gap for all poor households begins toskyrocket above the costs absent climate change. Interestingly, even though insurancebecomes increasingly expensive, it manages to hold steady the total cost of socialprotection (insurance and cash transfers) across the first 3 decades of climate change.This result attains in part because during the first decade of the simulation, manyhouseholds are able to escape vulnerability and accumulate sufficient assets such thatthey are no longer eligible for insurance subsidies.
However, when the fourth round of climate change kicks in at year 40 of thesimulation, the total costs of social protection begin to accelerate. The hybrid socialprotection continues to be cost-effective public policy, but as risk rises to an everhigher level, even the hybrid policy begins to loose its effectiveness in absolute terms.
9

Figure 3: Cost of Social Protection
2 Index Insurance as a Solution: Livestock insur-
ance in the Pastoral Regions of East Africa
Section 1 employed abstract modeling techniques to consider the public finance casefor insurance as a mechanism to offset the negative impacts of climate change onpoverty and food insecurity. While it is relatively easy to implement an insurancepolicy in a theoretical model, a key question is whether it is possible to implementan insurance scheme in the real world that offers quality insurance protection, whilekeeping administrative costs, moral hazard and adverse selection in line.
Conventional agricultural insurance, which requires field visits to verify loss claimsby individual households, has a dismal record when applied to small-scale rural house-holds, especially those located in isolated areas. In a study of a conventional insur-ance program established with heavy subsidies for the small-farm sector in Ecuador,Carter, Boucher, and Castillo (2014) find that the costs associated with a single lossverification visit may exceed $400. Given that the total annual premium associatedwith the typical small scale farmer is less than $100, it is easy to see why the busi-ness case for individual insurance evaporates. Cutting corners on loss verificationis an open invitation to morally hazardous behavior. Moreover, given that it is not
10

cost effective to individually rate the loss probabilities for each and every small-scalefarmer, conventional insurance is also subject to problems of adverse selection inwhich those households most likely to experience a loss are also most likely to buythe insurance. As summarized by Hazell and Valdes (1985) and Hazell (2006), thenet result of these problems has been loss ratios well in excess of 100%, implyingthat the insurance cannot be financially sustained.
Against this backdrop, index insurance appears as a promising, cost-effectivesolution. Under index insurance, loss verification is not required because payouts arebased on an index. For agricultural insurance the index might be yields measureddirectly or predicted by satellite-based biomass growth indicators for an insurancezone.6 The index is meant to be highly correlated with, but not identical to, the lossesexperienced by individual farmers. In principal, index insurance should eliminateproblems of high transactions costs, moral hazard and adverse selection. However,its key advantage is also its achilles heel. If the insurance index is only weaklycorrelated with farmer losses (as Clarke et al. (2012) show in the case of rainfallinsurance in India), then index insurance is more similar to a lottery ticket than aninsurance contract. Lottery tickets are as likely to pay out when farmers have goodcrops as when they have bad crops, meaning that lottery ticket ‘insurance’ is likely todestabilize farmer income by perversely transferring money from bad to good statesof the world.
If index insurance is to be part of the solution to helping manage climate risk, thenthe challenge is clearly to design an insurance index that is sufficiently well correlatedwith farmer losses such that it offers real ex post protection and thereby incentivizesex ante investment such that the risk reduction dividend is gained. The remainderof this section focusses on one of the better researched index insurance projects, theIBLI (index-based livestock insurance) program in the semi-arid pastoral zones ofnorthern Kenya an southern Ethiopia.
2.1 Designing the IBLI Index Insurance Contract
As detailed by Chantarat et al. (2013), the IBLI project began with the notion thatsatellite measures of vegetative growth, which had been in use for some time aspart of famine early warning systems, might provide a reliable measure of forage
6Because the index is the same for all households in the insurance zone, it does not matterin terms of payout probabilities whether high or loss risk producers select into purchasing theinsurance, eliminating the adverse selection problem (assuming that the insurance is priced correctlyfor each zone). Moreover, as long as the zone is large enough, then moral hazard problems alsodisappear as no single farmer can influence the index by her actions.
11

Figure 4: Satellite-based NDVI Measures of Forage Availability
availability for pastoral households. This measure was then transformed into anindex of predicted livestock mortality losses experienced by pastoral households indrought years.
Figure 4 displays “NDVI” maps for the original IBLI insurance zones in theMarsabit District of Northern Kenya. NDVI (or the Normalized Difference Vege-tation Index) measures the intensity of light reflected from the earth’s surface indifferent spectral bands. NDVI is essentially a ‘greeness’ measure that follows a reg-ular cycle as rains come and forage crops grow. The maps displayed in Figure 4 arebased on a pixel size of 8 km by 8 km–that is, each square of this size receives itsown unique NDVI reading on a daily basis as the satellite passes overhead.7 Theplot on the left shows a year with normal conditions, whereas the plot on the rightshows a year where drought pressure was severe and livestock losses were high.
While NDVI can clearly distinguish drought from non-drought years, the insur-ance quality question swings on how well economic losses experienced by pastoralisthouseholds can be explained by the NDVI measure. To answer this question, Chan-tarat et al. (2013) assembled historical data on livestock losses and estimated anon-linear response function that maps NDVI signals into observed livestock mor-tality losses. Figure 5 gives a sense of the predictive accuracy of this mapping for
7The current version of IBLI operates with much smaller grids based on changes in satellitesand satellite technology.
12

Figure 5: Predicted versus Actual Mortality Losses
one of the insurance zones in Marsabit District. Using out-of-sample prediction tests,Chantarat et al. (2013) report that based on the estimated response function and thehistorical distribution of NDVI, households would have been correctly indemnified75% of the time when they experienced severe mortality losses (those in excess of30%). The level of predictive accuracy falls to 60% when losses are 30% or less.
While imperfect, the predictive accuracy of the IBLI mortality was sufficientlyhigh that a pilot project was launched in 2009.8 While often hampered by imple-mentation problems, the IBLI contract continues to date. Originally rolled out as arandomized controlled trail, the IBLI case study provides an excellent opportunityto learn, not just if index insurance can be implemented, but if it also delivers theexpected ex post and ex ante effects that motivate the use of index insurance as acost-effective device to help mitigate the costs of climate change. We turn now toconsider some of that evidence.
2.2 Impacts of the IBLI Contract on Ex Post Coping andEx Ante Investment
Severe drought in northern Kenya in 2011 resulted in high rates of livestock mortalityin the IBLI pilot zone, with mortality estimates ranging from 25% to 50%. Inaccordance with the contract, all insured households received indemnity paymentsin October 2011. These payments coincided with the round 3 survey of IBLI studyhouseholds. While the coincidence of the survey and the payments made it impossible
8More recent work byBarre, Stoeffler, and Carter (2016) proposes specific quality measures anda safe minimum standard for contract quality.
13

Table 1: Causal Impacts of Insurance
All Poor Non-poorEx Ante Risk Management StrategiesReduce Meals -20% points -30% points -Sell Livestock - - -
Ex Post Risk Coping StrategiesReduce Meals -25% points -43% points -Sell Livestock -36% points - 64% points
Overall WelfareIncome +3% +1% -MUAC scores +1 s.d. - -
InvestmentExpenditures on Livestock +72% - -
Sources: Janzen and Carter (2013); Jensen, Barrett, and Mude (2014)
Jensen, Ikegami, and Mude (2016)
to observe the short run impacts of the payments on coping strategies, householdswere asked what their coping strategies had been the third quarter of 2011 (theperiod immediately preceding the payouts, but well into the period of drought losses)and what they anticipated their coping strategies would be in the fourth quarter of2011. Janzen and Carter (2013) use this data to study the impacts of insuranceon families’ ability to maintain their assets and food security during and after thesevere drought. They achieve causal identification of impacts by exploiting randomlydistributed inducements for households to actually purchase the insurance.
The first half of Table 1 summarizes the results of the Janzen and Carter (2013)analysis. The table reports the estimated percentage point reduction in the indicatedcoping strategy caused by insurance. For example, when pooling all householdstogether, insurance causes 25 percentage point reduction in the probability that thehousehold relies on meal reduction to cope with the drought in the immediate post-payout period.
The first column of the table displays the estimated average impacts of insurance.Looking at the post-payout period, we see that on average insured households re-duce anticipated reliance on meal reductions by 25 percentage points and anticipated
14

reliance on livestock sales by 36 percentage points. Looking at the quarter 3, imme-diate pre-payout figures, we see–perhaps surprisingly–that insurance reduced by 20percentage points households’ reliance on meal reduction. This decrease presumablyreflects households’ anticipation of the impending insurance payments, which allowedthem to reduce hoarding of available food and other stocks.
While these average effects are impressive, looking beyond the averages tells aricher and perhaps more compelling story. As discussed by Janzen and Carter (2013),poverty trap theory (and other theoretical perspectives) suggest that poorer house-holds will confront shocks by holding onto productive assets and destabilizing con-sumption. While this ‘asset-smoothing’ behavior reflects an understandable effort toavoid falling into a long-term poverty trap, its impacts on the next generation’s hu-man capital are potentially large.9 At the same time, wealthier households would beexpected to respond ex post to a shock by selling assets and smoothing consumption.
Motivated by these theoretical propositions, Janzen and Carter (2013) use thresh-old estimation techniques to test for the presence of a critical asset threshold aroundwhich coping behavior switches between asset and consumption smoothing. Thisestimated threshold is used to distinguish between the poor and non-poor in Table1. the results are striking. The average post-payout results disguise a strongly het-erogenous pattern of insurance impacts. Reductions in meal reductions as a copingstrategy is driven almost entirely by poorer households below the threshold, whereasthe reduced reliance on livestock sales is driven almost entirely by households abovethe estimated threshold. These estimates tell an interesting story about the im-pact of insurance on ex post coping strategies. It appears to equally help both poorand non-poor (or at least less poor) households avoid costly coping strategies withpotentially deleterious long-term consequences. But the mechanism through whichinsurance achieves this end is distinctive across the two sub-populations.
The second half of Table 1 reports the results of two additional impact evalu-ations that take advantage of rich panel data collected for the evaluation of IBLI.Both studies (Jensen, Barrett, and Mude (2014) and Jensen, Ikegami, and Mude(2016)) also use randomly distributed premium discount coupons to instrument forIBLI purchases. Jensen, Barrett, and Mude (2014) show that insured householdsdemonstrate improved child health (as measured by MUAC) and increased incomeper adult equivalent. An examination of production strategies also finds that house-holds with IBLI coverage reduce herd sizes and invest more heavily in health andveterinary services for their remaining herd, which is associated with increased milkproductivity (and milk income) within the herd. Without explicitly estimating a
9See the analysis in Carter and Janzen (2015b) for an effort to model these consequences as wellas references to other empirical literature that documents this asset smoothing behavior.
15

threshold (as in Janzen and Carter (2013)), Jensen, Ikegami, and Mude (2016) alsoreveal heterogeneous impacts, at least for income10: the impact on income is sig-nificant only for the poorest households. These changes signal the kind of ex anteinvestment impacts discussed in the introduction, complementing the ex post impactfindings of of Janzen and Carter (2013).
3 Limitations to Index Insurance as a Solution for
Climate Change and Food Insecurity
While the economic case for index insurance as a smart response to managing climaterisk and food insecurity is well developed, and while the IBLI project itself has shownthat workable contracts can be devised that deliver the anticipated ex ante and expost benefits of insurance, it remains far from clear whether index insurance can bescaled and operate as an essential part of the solution to the problem of climatechange and food insecurity. Two of the fundamental challenges that may preventindex insurance from reaching its potential are:
1. Demand : Similar to other settings, Jensen, Mude, and Barrett (2014) foundthat poorer households (in this case, smaller herds) are less likely to purchaseIBLI coverage, that liquidity plays an important role in the purchase decision,and that demand is price sensitive. In the model presented in Section 1, Janzen,Carter, and Ikegami (2015) find that the most vulnerable households, despitehaving the most to gain from insurance, also have a high opportunity cost ofinsurance that may inhibit demand for an otherwise valuable product.
2. Pricing : A variety of factors have tended to push the price of index insurancecontracts in developing country agriculture–including the IBLI project–to levelswell in excess of 150% of the actuarially fair price.11 Small project size is clearlya problem (as many insurance companies do not see it worth their while toparticipate in these markets), as are thin data problems which makes insurers
10Jensen, Barrett, and Mude (2014) find no statistically significant difference in impacts forincome, MUAC, or investment in their original analysis. They do find a larger impact in milkproductivity among poor households, which may partially explain the heterogenous income resultsrevealed in the latter study.
11The actuarially fair price of an insurance contract is the price that is just equal to the expectedindemnity payments to the farmers. Clearly the price must be marked up in excess of that amountin order to cover administrative costs, cost of capital, etc. However, a price that is, say, 150% ofthe actuarially fair price means that the farmer (or whoever is paying the insurance premium) ispaying $1.50 for every $1.00 of protection for the farmers.
16

have imprecise estimates of loss probabilities. Carter (2013a) suggests thatinsurance pricing seems to reflect an ’uncertainty loading,’ meaning an extramark-up that charged when data are of mixed quality and loss probabilitiesuncertain. Solution to these problems may ultimately require a mixed private-public reinsurance model to keep the price of insurance in the range that it isrational to buy it.
While these challenges are clearly important, in the remainder of this section, wefocus on a third, equally important challenge–that of providing scalable high qualitycontracts. While the IBLI contract was designed with much more care and attentionto the ability of the index to adequately cover losses (see Section 2 above), even theIBLI contract shows signs of quality slippage as more data and experience becomeavailable. This section analyzes these challenges and suggests a way forward toaddress them and make IBLI an efficient instrument that protects Kenyan herdersfrom the threat represented by climate change.
3.1 The quality challenge to Index Insurance
Unlike conventional insurance, index insurance includes a remaining uninsured “basisrisk”: a farmer or herder may encounter losses when the index does not trigger, orthat the index may trigger when she does not have any loss. In the model above,this element was captured with the idiosyncratic risk component. Losses triggeredin the model by idiosyncratic shocks were not compensated in the model. It is nowwidely recognized that basis risk may prevent index insurance to achieve its promiseof delivering affordable protection to poor households (Miranda and Farrin, 2012;Jensen and Barrett, 2015). Clarke (2011) shows that because of basis risk, the mostrisk averse households may not be interested in purchasing index insurance products.Indeed, if they have losses, pay a premium, and fail to receive insurance premiums,they end up in a worse situation than without insurance.
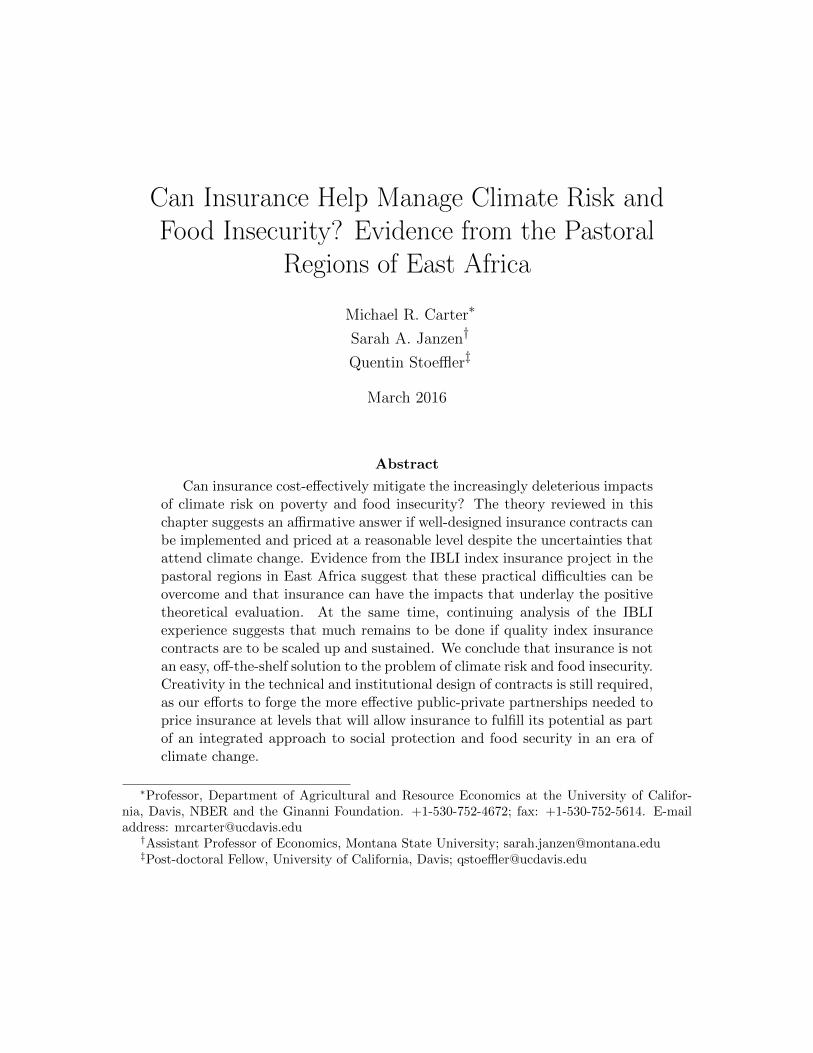
Basis risk may be an even bigger problem than work like Clarke (2011) suggests.Elabed and Carter (2015) use a field experiment in Mali to show that behavioral fac-tors related to basis risk further affect insurance demand. Specifically they show thatpeople dislike the uncertainty of insurance payments, which, added to the originaluncertainty of shocks, creates a “compound risk aversion” (the aversion to the com-bination of two uncertain events) among some households. This behavioral reactiongenerates a drop in insurance demand from 60% approximately for compound-riskneutral individuals, to only 35% of the population when compound-risk aversion istaken into consideration (Figure 6).
17
Figure 6: Impact of Basis Risk on Willingness to Pay for Index Insurance
Source: Elabed and Carter (2015)
18
While the necessity to reduce basis risk is now well acknowledged, there exists adebate regarding its exact definition, which harms efforts to increase overall indexinsurance quality. For example, there is a disagreement on whether basis risk shouldmeasure rainfall index correlation with farmers’ rainfall shocks (i.e. accuracy of theindex as a rainfall predictor) or its accuracy as a predictor of farmers’ overall losses(i.e. overall quality of the protection). Clearly it is the latter that matters fromthe farmer’s perspective and that will influence her insurance purchase decision. Amisplaced focus on accuracy of the index as a predictor of, say, rainfall, can leadto inappropriate index insurance products, which trigger payments when rainfallsare low in a given region rather than when farmers have actual losses, as rainfallsin a given region and actual individual losses are, at best, imperfectly correlated.Before analyzing the different sources of low quality of protection, let us step backand examine the objectives of index insurance.
For households, a good insurance means an insurance which improves their well-being by protecting their consumption and assets Barre, Stoeffler, and Carter (2016).In addition, the quality of insurance as a development instrument stems from itsability to foster investments and reallocation of resources– and thus generate higherincome– by removing risk. In other words, an insurance product needs to be eval-uated based on its efficiency in stabilizing highly volatile income streams for poorfarmers or herders. As a consequence, an index insurance product should be carefullyanalyzed to determine if its expected payments are actually correlated with house-holds’ losses, or if the insurance rather acts as a weather derivative–or even worse:as a lottery ticket (Jensen, Barrett, and Mude, 2014; Barre, Stoeffler, and Carter,2016). In India, Clarke et al. (2012) have shown that insurance payments actuallycorrelates poorly with farmers’ low yield events (Figure 7).
The inadequacy of indemnity payments, observed in India and other settings,raises the issue of index insurance quality. Several sources of errors lead to low levelsof index insurance quality. As shown in Figure 8, for products which aim at coveringall types of shocks, these sources of error relate:
• Design risk occurs when an insurance index is poorly correlated with averagelosses in the insurance zone covered by the index; and,
• Idiosyncratic risk occurs when the individual’s losses differ from the averagelosses in her insurance zone.
In the theoretical model presented in Section 1, the insurance contract exhibitedidiosyncratic, but not design risk.
Design risk emerges from prediction errors embedded in the index. The averageloss within a defined geographic zone can be measured by indices based on several
19

Figure 7: Relationship between average yields and insurance payments in India
Source: Clarke et al. (2012).The red line shows the point estimate for an Epanechnikov kernel with a bandwidth of 0.8. Thegreen lines show the 95% confidence intervals for the point estimate. The blue dots represent thescatter plot of claim payments for the respective district yield levels.
20

Figure 8: Insured and Uninsured Risk under Index Insurance
Source: Elabed et al. (2013)
methods: crop cutting, satellite information, weather stations, etc. Besides, a de-signed formula maps (implicitly or explicitly) the index to losses. Both the indexand the mapping necessarily include some errors, which can be limited by using goodindices and good insurance designs, but will not be eradicated.
However, even if design risk can be eliminated by improving even further thepredictive power of the index, there typically remains some uninsured risk at theindividual level. Pure idiosyncratic risk may induce households to encounter agricul-tural losses. For instance, a single farm’s crop may suffer damage from idiosyncraticfactors such as animal damage. Local communities often have some informal riskmanagement strategies to cope with such type of pure idiosyncratic shocks whenother villagers are not affected. Nevertheless, idiosyncratic risk diminishes the over-all protection provided to farmers or herders.
21

The relative magnitude of both design and idiosyncratic risks are both influencedby the nature of the contract and its geographic scale. In terms of Figure 8, howmuch risk appears as idiosyncratic and how much appears as correlated depends onthe geographic scale of the index. As the geographic zone covered by a single indexincreases in size, household losses will correlate less well with the insurance index.For example, a weather-based index that covers households within 30 kilometer ofthe weather station will track outcomes worse than an index that covers householdswithin 1 kilometers of the weather station. Similarly, an area yield index at the levelof a state or province will cover individual farmer losses less well than an index whereyields are measured at the level of each municipality or village. However in practice,reducing the geographic scale of the index too much leads to issues related to moralhazard, i.e. the fear that households may become able to manipulate the index.
Finally, for products which do not aim to cover all types of shocks (such asinsurance products based on a rainfall index), an additional source of low qualityarise from uncovered covariate risks (e.g.: locusts, tsunamis). This type of error isrelated to the traditional distinction between single-peril and multiple-peril insuranceproducts, but the difference is not as clear in the case of index insurance: satellite-based products such as IBLI, for instance, are supposed to cover all types of shocksrelated to lack of forage- including increase in livestock diseases- but cannot detectshocks which are not related to the ground vegetation- such as a new epidemicaffecting well-fed livestock. These uncovered covariate risks further decrease thequality of the protection offered to poor households. Of course, households may bestill interested in affordable index insurance products which only protects from onetype of shock (e.g. drought), but the overall protection provided by this type ofproduct has to be carefully analyzed and put in perspective with the price of theproduct and the probability that a farmer is made worse off with the insurance thanwithout it.12
The lack of a strong negative correlation between the insurance indemnities andincome shocks due to yield losses will result in a low demand for the insurance prod-uct (Clarke, 2011; Smith and Watts, 2009). Low correlation will not only fail toprotect farmers, but eventually seriously damage livelihoods, because poor house-holds pay high premiums to purchase protection, and plan on being protected whenmaking investment decisions. Thus, a detailed analysis of the sources of errors needsto be conducted before implementing an index-based insurance and after its imple-mentation, in order to rule out low quality products and pave the road for future
12Note that if farmer pays for an insurance that only covers a sub-set of rainfall events, and thenshe suffers an uncovered pest invasion, she is actually worse off then if she had the invasion but notpurchased the insurance. Clarke (2011) discusses these issues in detail.
22

product improvements. While this type of analysis is rarely undertaken in practice,IBLI is one of the most studied index insurance programs, and its quality has beenclosely scrutinized before and after implementation.
3.2 IBLI’s quality effort & remaining weaknesses
IBLI’s initial design considered carefully the above quality challenges, employing theavailable data. Indeed, as summarized in Section 2 above, Chantarat et al. (2013)conducted a rigorous ex-ante analysis intended to design the best performing indexinsurance product in the Kenyan ASALs. However, ex-post analyses have been lessoptimistic regarding IBLI’s index performance in terms of basis risk and contractquality. Jensen, Barrett, and Mude (2014) and Jensen, Mude, and Barrett (2014)have investigated IBLI’s performance using data collected between 2009 and 2012(four years, eight rainy seasons). This dataset was employed for the impact evaluationof the IBLI pilot and includes detailed information on livestock dynamics, which canbe used to assess the actual protection offered to herders over the period.
Jensen, Barrett, and Mude (2014) decomposes basis risk in several ways. First,by considering livestock surviving rates, the authors show that outcomes for insuredhouseholds do not stochastically dominate outcomes for uninsured households. Actu-ally, as expected, the insurance contract reduces the mean survival rate (taking intoaccount insurance payments) but reduces skewness of the survival rate distribution.Simulations based on a constant relative risk aversion (CRRA) utility function showsthat most households are actually better-off with the insurance at the commercialpremium rate, but the benefits vary across locations and households.
To unpack these results, the authors decompose uncovered risks between designrisk (the IBLI index was a poor predictor of average losses) and idiosyncratic risk (theindividual suffered a worse loss than her neighbors on average did). At the aggregatelevel, design risk is relatively low since IBLI reduces covariate risk by about 62.8%.However, when individual idiosyncratic risk is added, IBLI only covers between 23.3%and 37.7% of the total risk. Note that at the individual level, the precision of theindex when covariate losses are above the strike point is much higher, between 43.1%and 78.6%, which is closer to the objective, but still unsatisfying in some districts.Moreover, covering covariate shocks is arguably a first priority, as households mayhave informal insurance mechanisms when they receive adverse idiosyncratic shocks(Mobarak and Rosenzweig, 2012).13 Overall, these results call for caution when
13 The complementarity of informal and formal insurance is not straightforward, and depends onthe structure of the informal networks and of the index insurance, a point reinforced by Boucherand Delpierre (2014).
23

assessing insurance ex-ante, given that ex-post quality may be lower than expectedbased on ex-ante, out-of-sample predictions.14
An analysis of the consequence of basis risk on insurance demand was furtherperformed by Jensen, Barrett, and Mude (2014). First, basis risk may deter insurancepurchase. Second, while index insurance avoids moral hazard issues and individual-level adverse selection, it leaves some room for spatiotemporal adverse selection:households can buy insurance when they anticipate a bad climatic season in a givenlocation, or not buy insurance if they expect a good climatic season in that location.Indeed, households may have an idea of the future season based on their informationat the time of the insurance sale, as forage is affected by previous seasons and bythe current season early rains. Thus, pastoralists can buy more insurance when theyanticipate a bad climatic event– while on the other hand, price tends not to adjustto changing conditions.
The analysis shows that price, liquidity and social relationships have a strongimpact on index insurance demand. In addition, both basis risk and special adverseselection play a major role. In particular, households in districts with high idiosyn-cratic risk (which cannot possibly be covered by the index insurance) are much lesslikely to purchase the IBLI product compared to households living in districts with ahigher share of covariate risk. Design risk, on the other hand, plays a much smallerrole in diminishing demand by about 1% only, compared to idiosyncratic risk, whichexplains about 30% of the demand.15 This conclusion is relatively pessimistic re-garding IBLI’s potential, as contract design can only address inherent basis risk bylowering the geographic scale of the index. In pastoral regions, where individualhouseholds may seasonally migrate across large spaces, there are natural limits tohow much a forage index like IBLI can be downscaled.
There are, of course, additional challenges to index insurance quality.16 However,these issues of basis risk relate directly to the core economic value of the insuranceproduct. If an index insurance does not pay pastoralists when they have losses, it
14 The difference between ex-ante and ex-post assessments is striking. Factors explaining thismismatch may include: the use of an out-of-sample prediction which was never used in the designprocess (thus avoiding overfitting better); the application to a different time period (which wasnot available at the time of the contract design); the use of more detailed household data; and thecomputation of mortality rates and basis risk in a different manner.
15 Note that design risk is difficult to measure with a short panel and a limited number ofobservations, are insured catastrophic losses are rare events by definition.
16 These challenges relate to contract pricing and implementation (Chantarat et al., 2013), andnon-price factors such as trust and liquidity (Jensen, Mude, and Barrett, 2014), among others.Climate change also intensifies these challenges, as it creates some short-term uncertainties aroundfuture payments (Carter, 2013b) and may lead to very high premiums if climatic conditions dete-riorate in the long-run (Collier, Skees, and Barnett, 2009; Carter and Janzen, 2015a).
24

does not matter how precisely it is priced, how efficiently it is implemented, andwhether demand is low or high: households are not protected.17 Index insuranceproducts offer imperfect protection by definition, but efforts have to be made toprovide the highest quality of protection as possible. Fortunately, there are severalimprovements that IBLI has realized in the last year or plans on including, whichcan improve household protection in several manners.
3.3 The way forward
Since the introduction of IBLI pilot project in 2009, the program has introducedsome improvements and is planning further changes based on recent studies whichit conducted. As the project has developed, we learned a lot about the strengthsand weaknesses of IBLI. New ex-post data have become available at the householdlevel, as well as longer term satellite information. IBLI has also expanded in scale infour districts in Northern Kenya and one district in neighboring Southern Ethiopia.This combination of factors has brought new opportunities and challenges. WhileIBLI has already operated some modifications since the studies mentioned above,further studies are planned to help continue improving the product design and theprotection it provides to herders.
Notably, the program has evolved from an asset replacement mechanism to anasset protection philosophy. From an economic point of view, it is more efficient tointervene early and protect households’ productive assets, rather than compensatingthem after the received a shock and possibly employed other costly coping strategies(Janzen and Carter, 2013). In addition, as the project extended to geographic areaswhere livestock mortality data were lacking (in particular Southern Ethiopia), IBLIhad to rely exclusively on NDVI data. Thus, payments would be triggered whenNDVI data indicate a deterioration of the climatic conditions.
This move towards early payments have been accompanied by improvements ofthe product design. Since 2013, in order to limit spatiotemporal adverse selection,IBLI has started to disaggregate more the index, so that households located in dif-ferent locations receive appropriate (different) insurance contracts. At this disaggre-
17Of course, for households with full information, demand should be a good indication of thevalue of an insurance products. However, even for households who understand the product sold,the value of an insurance is difficult to assess ex-ante (Clarke and Wren-Lewis, 2013). In addition,households do not always understand very well the insurance product, given the complexity of someindex insurance schemes, the low levels of literacy in some contexts, and the poor quality of somemarketing/information campains. For that reason, implementation of index insurance projectsshould focus on the quality of the protection offered rather than on the demand for these productsonly.
25

gated scale, a larger share of shocks should be considered as covariate risk by theindex, and as such reduce the effect of idiosyncratic risk (Jensen, Mude, and Barrett,2014).
Additional analyses have been conducted to further improve index quality. Vriel-ing et al. (2014) have investigated the possibility to combine remote sensing indicesover longer periods in order to increase the predictive power of IBLI’s formula. Basedon newly constructed remote sensing from 1981 to 2011, the authors show how com-bining remote sensing indices allow a higher predictive power at a highly disaggre-gated level–i.e., there is still scope for reducing the magnitude of idiosyncratic riskby downscaling the insurance index. On the other hand, Klisch, Atzberger, andLuminari (2015) have realized technical improvements in the computation of thevegetation index which can be used to detect droughts.18
Finally, Vrieling et al. (2016) have conducted some work on the temporality ofthe payments. The initial IBLI designed considered fixed dates for beginning andend of season in each district location. However, Vrieling et al. (2016) show that itis possible to use a phenomenological model to describe the temporality of foragedevelopment, based on historical NDVI data in each location. This change offers thepotential to predict more accurately livestock mortality in each district, but also toprovide payments one to three months earlier to pastoralists. These early paymentscould allow pastoralists to protect their herd by buying forage, water or medicinefor instance, and prevent other shocks associated with low levels of forage such asanimal diseases.
Additional research is required, however, on the relationship between insurancequality and temporality of payments. If early payments do not compromise the cor-relation between insurance payments and household’s losses, then they are clearlyvaluable. However, there may be some trade-offs between early protection and ac-curate protection. Future work will analyze these trade-offs, as well as measure howthe identified improvements in satellite indices computations translate into higherindex insurance quality for herders.
4 Conclusions
We began this paper with the question:
Can insurance cost-effectively mitigate the increasingly deleterious im-
18 These improvements regard the smoothing and filtering of satellite data, the modelling ofuncertainty, the spatial and temporal aggregation of satellite data, and the timing of satellite dataacquisition and processing.
26

pacts of climate risk on poverty and food insecurity?
The answer, it seems is both yes and no. Theory suggests that if quality insurancecoverage can be delivered and the expected ex post and ex ante impacts take place,then the answer should be yes. Indeed, research on the Index-based Livestock Insur-ance (IBLI) pilot project in Kenya indicate that these conditions can be met givingfurther power to the likelihood of a yes answer.
And yet, even within the generally positive environment of the IBLI project,there is ample evidence of the limitations to index insurance. Demand has oftenbeen tepid and unstable. Outreach and administration costs have been high. Pricingby a private insurance industry made nervous by climate change has pushed costsup. Finally, the effective quality of the IBLI contact has been scrutinized and foundwanting. Efforts to scale the IBLI contract to nearby pastoral regions has provenchallenging.
While efforts are underway to respond to these challenges, their breadth anddepth make clear that index insurance is not a sliver bullet that can be pulled offthe shelf and used to mitigate the food insecurity and other consequences of climatechange. Skeptics might suggest that these challenges are insurmountable. Others–and we count ourselves among them–remain undeterred given the evidence that indexinsurance can be a valuable instrument if these problems can just be solved. Doingso will require continued creativity, piloting and evaluation to see if indeed these notinconsequential challenges can be overcome.
27

References
Barre, T., Q. Stoeffler, and M. Carter. 2016. “Assessing index insurance: conceptualapproach and empirical illustration from Burkina Faso.” Unpublished.
Barrett, C.B., M.R. Carter, and M. Ikegami. 2013. “Poverty Traps and Social Pro-tection.” Unpublished.
Boucher, S., and M. Delpierre. 2014. “The impact of index-based insurance on infor-mal risk-sharing arrangements.” Working paper, CEPS/INSTEAD.
Carter, M. 2013a. “Sharing the Risk and the Uncertainty: Public-Private Reinsur-ance Partnerships for Viable Agricultural Insurance Markets.” I4 Index InsuranceInnovation Initiative Brief 1.
—. 2013b. “Sharing the Risk and the Uncertainty: Public-Private Reinsurance Part-nerships for Viable Agricultural Insurance Markets.” I4 Index Insurance Innova-tion Initiative Brief 1.
Carter, M.R., S. Boucher, and M.J. Castillo. 2014. “Index Insurance: InnovativeFinancial Technology to Break the Cycle of Risk and Rural Poverty in Ecuador.”Working paper, I4, Index Insurance Innovation Initiative.
Carter, M.R., and S. Janzen. 2015a. “Social Protection in the Face of ClimateChange: Targeting Principles and Financing Mechanisms.” World Bank PolicyResearch Working Paper , pp. .
Carter, M.R., and S.A. Janzen. 2015b. “Social Protection in the Face of ClimateChange: Targeting Principles and Financing Mechanisms.” Unpublished.
Chantarat, S., A. Mude, C. Barrett, and C. Turvey. 2010. “The Performance of IndexBased Livestock Insurance in the Presence of a Poverty Trap.” Unpublished.
Chantarat, S., A.G. Mude, C.B. Barrett, and M.R. Carter. 2013. “Designing index-based livestock insurance for managing asset risk in northern Kenya.” Journal ofRisk and Insurance 80:205–237.
Clarke, D. 2011. A theory of rational demand for index insurance. Department ofEconomics, University of Oxford.
Clarke, D., O. Mahul, K.N. Rao, and N. Verma. 2012. “Weather based crop insurancein India.” World Bank Policy Research Working Paper , pp. .
28

Collier, B., J. Skees, and B. Barnett. 2009. “Weather index insurance and climatechange: opportunities and challenges in lower income countries.” The GenevaPapers on Risk and Insurance-Issues and Practice 34:401–424.
Elabed, G., M.F. Bellemare, M.R. Carter, and C. Guirkinger. 2013. “Managing basisrisk with multiscale index insurance.” Agricultural Economics 44:419–431.
Elabed, G., and M. Carter. 2015. “Ex-ante impacts of agricultural insurance: Evi-dence from a field experiment in Mali.”, pp. .
Hazell, P.B.R. 2006. “The appropriate role of agricultureal insurance in developingcountries.” Journal of International Development 4:567–581.
Hazell, P.B.R., and A. Valdes. 1985. Crop insurance for agricultural development: Is-sues and experiences,. Baltimore, Maryland, USA: John Hopkins University Press,International Food Policy Research Institute, Washington, DC USA.
Janzen, S.A., and M.R. Carter. 2013. “After the drought: The impact of microinsur-ance on consumption smoothing and asset protection.” Working paper, NationalBureau of Economic Research.
Janzen, S.A., M.R. Carter, and M. Ikegami. 2015. “Valuing Asset Insurance in thePresence of Poverty Traps.” Unpublished.
Jensen, N., M. Ikegami, and A. Mude. 2016. “Integrating social protection strate-gies for improved impact: A comparative evaluation of cash transfers and indexinsurance in Kenya.” Unpublished.
Jensen, N.D., and C.B. Barrett. 2015. “Agricultural Index Insurance for Sub-SaharanAfrican Development.”, pp. .
Jensen, N.D., C.B. Barrett, and A. Mude. 2014. “Index Insurance and Cash Trans-fers: A Comparative Analysis from Northern Kenya.” Available at SSRN 2547660 ,pp. .
Jensen, N.D., A. Mude, and C.B. Barrett. 2014. “How basis risk and spatiotemporaladverse selection influence demand for index insurance: Evidence from northernKenya.” Available at SSRN 2475187 , pp. .
Klisch, A., C. Atzberger, and L. Luminari. 2015. “Satellite-based drought monitoringin Kenya in an operational setting.” The International Archives of Photogramme-try, Remote Sensing and Spatial Information Sciences 40:433.
29

Kovacevic, R., and G.C. Pflug. 2011. “Does Insurance Help to Escape the PovertyTrap? - A Ruin Theoretic Approach.” The Journal of Risk and Insurance 78:1003–1028.
Miranda, M.J., and K. Farrin. 2012. “Index insurance for developing countries.”Applied Economic Perspectives and Policy 34:391–427.
Mobarak, A.M., and M.R. Rosenzweig. 2012. “Selling formal insurance to the infor-mally insured.”, pp. .
Smith, V., and M. Watts. 2009. “Index based agricultural insurance in developingcountries: Feasibility, scalability and sustainability.”
Vrieling, A., M. Meroni, A.G. Mude, S. Chantarat, C.C. Ummenhofer, and K.C.de Bie. 2016. “Early assessment of seasonal forage availability for mitigating theimpact of drought on East African pastoralists.” Remote Sensing of Environment174:44–55.
Vrieling, A., M. Meroni, A. Shee, A.G. Mude, J. Woodard, C.K. de Bie, and F. Rem-bold. 2014. “Historical extension of operational NDVI products for livestock insur-ance in Kenya.” International Journal of Applied Earth Observation and Geoin-formation 28:238–251.
30