Embed Size (px)
Citation preview
Can Indigenous Associations Foster Trust, Tolerance, and Public Goods? Exploring the Role of Grins in Post-Conflict Mali Research and Innovation Grants Working Papers Series April 28, 2017
Can Indigenous Associations Foster Trust, Tolerance, and Public Goods? Exploring the Role of Grins in Post-Conflict Mali Research and Innovation Grants Working Papers Series Jaimie Bleck University of Notre Dame Philippe LeMay-Boucher Heriot-Watt University In collaboration with: Jacopo Bonan Catholic University of the Sacred Heart Bassirou Sarr Paris School of Economics April 28, 2017

Disclaimer: This report is made possible with support from the American people through the United States Agency for International Development (USAID). The contents are the sole responsibility of the University of Notre Dame and do not necessarily reflect the views of USAID; the United States government; or the Democracy Fellows and Grants Program implementer, IIE.
TABLE OF CONTENTS
RESULTS .................................................................................................................................. 6 A. Summary of Findings ..............................................................................................................7 B. Results: Research Question 1 ..................................................................................................8
i. Public Goods Games .................................................................................................................. 8 ii. Trust Games ............................................................................................................................. 13 iii. Analyzing Tolerance and Political Knowledge ......................................................................... 17
C. Results: Research Question 2 ................................................................................................ 26 D. Results: Research Question 3 ................................................................................................ 46 E. Results: Research Question 4 ................................................................................................ 55
APPENDIX A: DESCRIPTIVE STATISTICS ON GRINS AND GRIN MEMBERSHIP .............................................. 61 A. Descriptive Statistics on Grin Members and on Grin Activities and Trends .............................. 61 B. Descriptive Statistics: Grin Members Versus Non-Members ................................................... 67 C. Descriptive Statistics: Variables that Drive Grin Membership................................................. 71
APPENDIX B: METHODOLOGY...................................................................................................... 74 A. Selection of Clusters in Both Sites ......................................................................................... 74
i. Sampling Starting Points and Walking Direction .................................................................... 75 ii. Household Selection: Systematic Sampling ............................................................................. 76 iii. Selection of Respondents ......................................................................................................... 76 iv. Call Backs ................................................................................................................................. 76 vii. Selection of Grins ..................................................................................................................... 77
B. Protocol for Public Goods Game ........................................................................................... 77 C. Protocol for Trust Games ...................................................................................................... 79
MESSAGE FROM THE DRG CENTER ACTING DIRECTOR The Center of Excellence on Democracy, Human Rights, and Governance (DRG) is pleased to share “Can Indigenous Associations Foster Trust, Tolerance, and Public Goods? Exploring the Role of Grins in Post-Conflict Mali.” This publication was produced by USAID in partnership with the Institute of International Education and the University of Notre Dame as part of the Research and Innovation Grants Working Papers Series. The Strategy on Democracy, Human Rights, and Governance1 reaffirmed USAID’s commitment to “generate, analyze, and disseminate rigorous, systematic, and publicly accessible evidence in all aspects of DRG policy, strategy and program development, implementation, and evaluation.” This paper, along with the others contained in the series, makes a valuable contribution to advancing this commitment to learning and evidence-based programming. This series is part of USAID’s Learning Agenda for the DRG Sector, a dynamic collection of research questions that serve to guide the DRG Center’s and USAID field missions’ analytical efforts. USAID seeks to inform strategic planning and project design efforts with the very best theory, evidence, and practical guidance. Through these efforts, the Learning Agenda is contributing to USAID’s objective to support the establishment and consolidation of inclusive and accountable democracies to advance freedom, dignity, and development. The research provides useful insights into how informal community groups—called grin, ubiquitous in urban Mali—function as an individual and community support system. Using surveys and experimental games, the research concludes that the grins’ primary purpose is social, but the groups also help members meet economic needs and provide a venue for political discussion and community service, such as neighborhood cleanup. Most grins are male-only, and most members are male, comparatively better educated, and unmarried. Overall, members are better able to produce public goods than non-members, but only when working with members of their own grin. Members also are considered more trustworthy than non-members, except for grins with internally displaced persons as members. Grin members also had more trust in social institutions and diverse ethnic groups, though no more trust of the government; members of ethnically homogenous grins trusted diverse ethnic groups less. In addition, members of male-only grins trusted one another less than members of mixed-gender or female-only grins. I hope you find this research enlightening and helpful. As the DRG Center’s Learning Agenda progresses, we will continue our effort to bring forward the latest in relevant social science research to important constituencies for our work, particularly our DRG cadre and implementing partners, but also others. I invite you to stay involved as this enriching, timely, and important work proceeds. Madeline Williams, Acting Director Center of Excellence on Democracy, Human Rights, and Governance US Agency for International Development
1 https://www.usaid.gov/sites/default/files/documents/1866/USAID%20DRG_%20final%20final%206-24%203%20(1).pdf
ACRONYM LIST DFG Democracy Fellows and Grants Program DRG Center USAID’s Center of Excellence on Democracy, Human Rights, and Governance FCFA Franc CFA GIS Geographic Information System IDP Internally Displaced Person LPM Linear Probability Model MFI Monetary Financial Institutions OLS Ordinary Least Squares PSU Primary Sampling Unit ROSCA Rotating Savings and Credit Association USAID United States Agency for International Development VCM Voluntary Contributions Mechanism
University of Notre Dame USAID/DCHA/DRG Working Papers Series 1
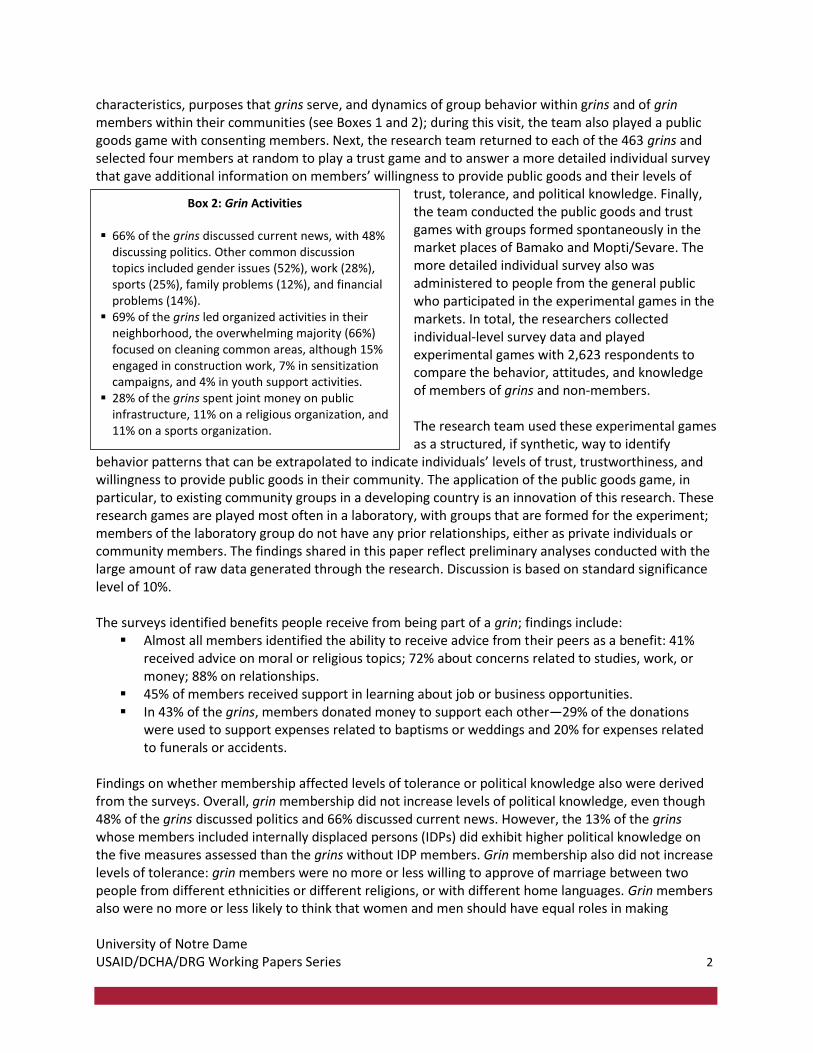
EXECUTIVE SUMMARY People gather in structured, if informal, community groups for many reasons—social, such as a book club or softball league; economic, such as a team hosting a fundraiser for a member’s medical expenses; or political, such as neighbors meeting to address flooding caused by poor infrastructure. But how does participating in such groups affect people’s well-being or decisions to work for other community improvements? Level of political knowledge? Level of trust toward group members, people in the broader community, or institutions such as the government? Or willingness to tolerate differences that are often at the root of conflict, such as ethnicity and religion? Through an Innovation and Research Grant funded by USAID’s Center of Excellence on Democracy, Human Rights, and Governance under the Democracy Fellows and Grants Program, Professors Jaimie Bleck from the University of Notre Dame and Philippe LeMay-Boucher from Heriot-Watt University, in collaboration with Jacopo Bonan from Catholic University of the Sacred Heart and Bassirou Sarr from the Paris School of Economics, worked to answer these questions by studying community groups called grins that meet in neighborhoods across Mali’s cities. The grins provide an excellent opportunity to study the effects of informal civic participation and community organizing because, although their primary purpose is social—members gather to drink tea and talk—the grins also help members meet economic needs and serve as a venue for political discussion. In the ongoing aftermath of the 2012 Mali coup, understanding the effects of grin membership on members’ levels of trust, tolerance, and political knowledge; on their willingness to undertake projects that benefit the whole community; and on their personal, economic, and food security takes on particular importance. The research, which included both survey data and data generated through the public goods and trust experimental games, was implemented in two sites in Mali: the capital Bamako and the twin cities of Mopti and Sevare, on the border between the formerly occupied north and the south. To identify grins at each research site, the team first conducted a census of 4,300 household members, ages 18-45, from 1,128 homes—642 homes in Bamako and 486 in Mopti/Sevare. Among these respondents, 59% of men and 24% of women were members of a grin. The team then visited 463 grins, split between the two research sites, to survey basic grin
Box 1: Grin Characteristics ▪ Average grin size was 13.5 people, who had been meeting
regularly for an average of 9 years. ▪ 73% of grin members had some post-high school education. ▪ 57% of the grins were men only, 14% were women only, and the
remainder were mixed for men and women. ▪ In 53% of the grins, more than half of the members were from
the same ethnicity. ▪ 13% of the grins included IDPs and 32% included members from
northern Mali. ▪ 30% of the grins were affiliated with a political party, 15% with a
youth organization, and 15% with sport organization; 47% were completely unaffiliated with any formal organization.
▪ 61% of the grins were formed among childhood friends, and 83% among neighbors.
▪ 83% of the grins had a leader; of those, 37% elected this leader by consensus.
▪ Among the 39% of the grins that experienced an internal problem or disagreement, 58% resolved the problem by the leader working with the members involved; 72% resolved internal problems through group discussion.
University of Notre Dame USAID/DCHA/DRG Working Papers Series 2
characteristics, purposes that grins serve, and dynamics of group behavior within grins and of grin members within their communities (see Boxes 1 and 2); during this visit, the team also played a public goods game with consenting members. Next, the research team returned to each of the 463 grins and selected four members at random to play a trust game and to answer a more detailed individual survey that gave additional information on members’ willingness to provide public goods and their levels of
trust, tolerance, and political knowledge. Finally, the team conducted the public goods and trust games with groups formed spontaneously in the market places of Bamako and Mopti/Sevare. The more detailed individual survey also was administered to people from the general public who participated in the experimental games in the markets. In total, the researchers collected individual-level survey data and played experimental games with 2,623 respondents to compare the behavior, attitudes, and knowledge of members of grins and non-members. The research team used these experimental games as a structured, if synthetic, way to identify
behavior patterns that can be extrapolated to indicate individuals’ levels of trust, trustworthiness, and willingness to provide public goods in their community. The application of the public goods game, in particular, to existing community groups in a developing country is an innovation of this research. These research games are played most often in a laboratory, with groups that are formed for the experiment; members of the laboratory group do not have any prior relationships, either as private individuals or community members. The findings shared in this paper reflect preliminary analyses conducted with the large amount of raw data generated through the research. Discussion is based on standard significance level of 10%. The surveys identified benefits people receive from being part of a grin; findings include:
▪ Almost all members identified the ability to receive advice from their peers as a benefit: 41% received advice on moral or religious topics; 72% about concerns related to studies, work, or money; 88% on relationships.
▪ 45% of members received support in learning about job or business opportunities. ▪ In 43% of the grins, members donated money to support each other—29% of the donations
were used to support expenses related to baptisms or weddings and 20% for expenses related to funerals or accidents.
Findings on whether membership affected levels of tolerance or political knowledge also were derived from the surveys. Overall, grin membership did not increase levels of political knowledge, even though 48% of the grins discussed politics and 66% discussed current news. However, the 13% of the grins whose members included internally displaced persons (IDPs) did exhibit higher political knowledge on the five measures assessed than the grins without IDP members. Grin membership also did not increase levels of tolerance: grin members were no more or less willing to approve of marriage between two people from different ethnicities or different religions, or with different home languages. Grin members also were no more or less likely to think that women and men should have equal roles in making
Box 2: Grin Activities
▪ 66% of the grins discussed current news, with 48% discussing politics. Other common discussion topics included gender issues (52%), work (28%), sports (25%), family problems (12%), and financial problems (14%).
▪ 69% of the grins led organized activities in their neighborhood, the overwhelming majority (66%) focused on cleaning common areas, although 15% engaged in construction work, 7% in sensitization campaigns, and 4% in youth support activities.
▪ 28% of the grins spent joint money on public infrastructure, 11% on a religious organization, and 11% on a sports organization.
University of Notre Dame USAID/DCHA/DRG Working Papers Series 3
financial decisions, or that people should spend the same amount to educate boys and girls. However, differences in tolerance and attitudes toward gender equality did emerge among certain types of grins:
▪ Female-only, mixed-gender, and more ethnically diverse grins demonstrated increased tolerance on one measure each: members of female-only or mixed-gender grins were more likely to accept a marriage between two people of different religions; members of more ethnically diverse grins were more likely to accept mixed-language weddings.
▪ Grins whose members included IDPs demonstrated less tolerance on one measure: members were less likely to accept an inter-religious marriage.
▪ Grins that included members from northern Mali were consistently more tolerant: members were more likely to accept inter-ethnic, inter-religious, and mixed-language marriages and more likely to think that men and women should have equal roles in making financial decisions.
The key findings on trust and trustworthiness, derived both from the individual surveys and from the experimental trust games, are contradictory. The trust games showed that although grin members overall were significantly more trustworthy, they did not have higher levels of trust than non-members, while members scored better on attitudinal measures of trust than non-members. In the trust game, the trustworthiness of grin members decreased significantly for grins that included IDPs. The games did reveal differences in levels of trust among types of grin:
▪ Members of male-only grins trusted one another less. ▪ Members of mixed-gender or female-only grins trusted one another more. ▪ Members of more ethnically homogenous grins trusted other members of society less.
The survey data, however, show that grin members do have higher levels of trust in many groups and institutions, but no higher trust of the government. See table below:
High level of trust in… Grin members Non-members Other ethnic groups 27% 17% Religious leaders 47% 32% People speaking the same language 28% 14% People speaking a different language 16% 12% People from the North 15% 7% The government 25% 25%
Among types of grins, members of groups that included IDPs had lower trust in the government, and members of groups that included people from northern Mali had a higher level of trust in the government. The findings on public good provision, derived from the public goods games, show that grin members are better able to produce public goods than non-members, a finding that may be augmented by the survey data that describe the types of public goods that grins have provided (see Box 2). However, members demonstrated this increased ability to generate public goods only when working with other members of their own grin: grin members who participated in the games played among groups formed spontaneously in the markets of Bamako and Mopti/Sevare were no more able to produce public goods than non-members participating in those same groups.
University of Notre Dame USAID/DCHA/DRG Working Papers Series 4
INTRODUCTION The 2012 coup d’état and northern occupation of Mali upset 20 years of democratic rule and ruptured the social fabric of a state long known for peace and inter-ethnic tolerance (Pringle 2005, Dunning and Harrison 2009). The August 2013 elections ushered in a second era of democracy, but the newly elected government faced unprecedented challenges, including addressing mounting ethnic and North/South tension, addressing the needs of more than 400,000 IDPs and refugees, suppressing non-state challengers, rebuilding state legitimacy, and restoring faith in democracy. In this context, it is critical to understand how indigenous associations already contribute to these goals. This research explores the role of grins,2 social clubs ubiquitous in urban Mali, in generating trust, tolerance, and public goods within diverse Malian communities. Grins are widely acknowledged as important conduits of political information and discussion throughout urban and peri-urban centers in Mali. They are less formal than official associations (ton) and yet more formal than friend groups (teriya). Grins meet regularly around tea, or another beverage, to discuss local news, their personal lives, and to share information. Grins are typically identified as a locus of activity for male youth—a key demographic as Mali seeks to restore democratic governance and state capacity. Youth are future political constituencies; the primary demographic targeted by rebel groups; and the most likely to join militia, police, or army organizations. Grins offer members an egalitarian environment to exchange information and debate socio-political issues—a contrast to the hierarchical composition of most Malian households and systemic exclusion of youth from formal politics. This research carefully mapped grins3 in two urban centers in Mali—the capital Bamako, which has a
population of around 2 million, and the twin cities of Mopti/Sevare, which are on the border between
the formerly occupied North and the South and have a combined population of about 100,000. Our research suggests that more than 59% of men and 24% of women between the ages of 18 – 45 in these two cities are grin members. Of the grins engaged through this research, 83% were formed by a group of similarly aged youth living in the same neighborhood. In addition, 61% were formed with childhood friends, 13% with members of the same origin, 8% with others in the same profession, and only 1% sharing the same mosque or church. The vast majority of grins engaged through this research were formed before the turbulent events of 2012 – 2013, which enables us to compare how organizational and membership differences might mediate attitudes and political behaviors as Mali seeks to reconstruct democracy and dampen rising ethnic tension. Neighborhoods in Bamako and Mopti/Sevare are still relatively integrated—both ethnically and socio-economically—meaning that even when members come from homes on the same block, they may be connected to very different ethnic and/or regional constituencies. On the other hand, grins whose members come from the same hometown or family might have more insular, overlapping networks. This study builds on emerging insight that indigenous organizations can contribute to sustained cooperation in divided societies better than externally imposed initiatives (van der Windt 2013). The
2 In Bamana, grinw is the plural of grin. In this document, we will use the English plural. 3 See Appendix B for more information on research methodology.

University of Notre Dame USAID/DCHA/DRG Working Papers Series 5
literature on social capital suggests that groups with horizontal organization and diverse composition of people with weak ties can promote trust and tolerance among members as well as toward other members of society. Associational membership is thought not only to nurture democratic citizenship by providing citizens with skills to deliberate and discuss politics,4 but also to foster trust and tolerance.5 Trust and tolerance, cornerstones of democratic society (Sullivan and Transue 1999), are particularly important in post-conflict reconstruction and conflict settings, where they can stem violence and contribute to community policing and other forms of public goods provision (Brinkerhoff 2005). Group discussion and cooperation in post-conflict settings have been shown to improve the willingness to contribute to social cohesion (Fearon et al. 2009) and influence social norms (Paluck 2009). However, group solidarity can also generate negative externalities toward society (Fukuyama 2001), so it is critical to understand the nature of group organization and composition. Despite the vast literature on the importance of associational membership and social capital for development, democratization, and post-conflict recovery, few papers have analyzed the impact of associational membership on trust, tolerance, public goods provision, and political knowledge in a developing country (see Etang et al. 2011 for ROSCAs in Cameroon; see Mosley and Verschoor 2005 for self-help groups in Uganda). Our study seeks to address this gap by answering the following four questions:
1. Do grin members exhibit greater levels of trust, tolerance, political knowledge, and willingness to provide public goods than non-members?
2. Which types of grins best foster trust, tolerance, political knowledge, and willingness to
provide public goods to in-group members, but also to out-group members?
3. How does membership of IDPs from the north affect attitudes and political behaviors of other grin members? IDPs form around 13% of grin members in our sample, a significant share, and both research sites host high numbers of IDPs, which could increase tension and conflict in the future.
4. What are the effects of trust on redistributive behaviors? As in many developing countries,
Malians face regular financial requests from relatives, friends, or members of extended or close
social networks (Dercon and De Weerd 2006). This financial assistance is a key component of the distribution of wealth, given the absence of meaningful state welfare services, and an integral part of households' economies. This study examines the impact of our different measure of trust on redistributive actions such as giving remittances to family members, charitable giving (at mosque or to those in need), giving at life ceremonies (baptisms and weddings), and volunteer work for the broader community.
4 Fung (2003), de Toqueville (2003) 5 Putnam (1993, 1995)
University of Notre Dame USAID/DCHA/DRG Working Papers Series 6
RESULTS The research combined individual and group surveys with trust and public good experimental games;6 a proxy for the dictator experimental game was also included as part of one survey. The surveys and experimental games were conducted in three environments: members in their own grin (E1), grin members who were selected from the market place (E2), and individuals selected from the market who were not currently grin members (E3). Full details on sampling and protocol for all research steps are included in Appendix B. To identify a representative sample of grins from Bamako and Mopti/Sevare for E1, we conducted a household census of 1,128 homes (642 in Bamako and 486 in Mopti/Sevare), where we asked for a full list of residents aged 18-45 (our population of interest). We then captured basic demographic characteristics, contact information, and whether respondents were members of grins. We used the list of members to randomly select grins to be included in our study. Once we had a sample of around 250 grins, our enumerators gained consent from grin members to visit the selected grins to conduct a survey and play a public goods game with all members who gave consent. In a final step, we returned to the selected grin and selected four consenting members (at random) to play a trust game and to answer an individual survey. Then, to generate a sample of members and non-members for E2 and E3, we conducted two types of experimental games (trust and public goods) and administered individual surveys with both members and non-members in several different markets in Bamako and Mopti/Sevare. Our total sample for all three environments includes 463 grins—228 from Bamako and 235 from Mopti/Sevare—and 2,623 individuals: 59% from Mopti/Sevare and 41% from Bamako. Within the total sample, 68% were current members of a grin. For E1, we selected about four members at random from our sample of 463 grins, resulting in a sample of 1,445 individuals. The selection of random groups for E2 and E3 was done via systematic sampling in public places with a strong confluence of people, such as markets and bus stations. In an ideal situation, we would have sampled from the list of grin members from the household survey and asked them to participate in the games organized in public places. But organizing such gatherings with individuals scattered throughout Bamako and Mopti/Sevare is a logistical quagmire. Instead, we opted for this random selection of individuals in public places. To ensure the comparability of our groups of individuals selected in E2 and E3 with those in E1, we target their characteristics based on data we observed on grin composition. At the time when we conducted the experiment in E2 and E3, we had already completed the experiment in E1. Ex ante, we designed the groups based on the distributions of group size and gender composition that we saw in the E1 data. We administered a screening question to record the grin membership status of individuals targeted in the systematic sampling. Selected participants waited in an experimental booth until the desired group characteristics were met in terms of size and gender composition. This allowed us to gather observations on a further 1,178 grin members (E2) and on non-members (E3).
6 Barr (2003) and Karlan (2005) have used similar games in developing countries to measure the impact of such variables on microfinance decisions.
University of Notre Dame USAID/DCHA/DRG Working Papers Series 7
A. Summary of Findings7 Our survey of grins and their members revealed a strong belief that belonging to a grin increases the well-being of both members and of the greater community. Grins’ main purpose is to provide a space for community discussion and resource-sharing. Twenty-seven percent of grins offer a “formal help fund” and 16% organize an intra-group ROSCA8. A large majority (69%) provides support for their communities including cleaning common space (66%), contributing to construction work (15%), or participating in sensitization campaigns (7%). Almost one-third of grins contribute money to public goods projects in their communities. Grins also provide psychosocial support for members; members value the advice they receive from the grin including discussions about life style, religion, study, work, money, and relationships. About half of members (45%) said that they benefited from a new business or job opportunity because of their grin. Members have experienced less shock on provision of food, water, medication, and fuel in the last six months than non-members. We used the experimental public goods game to determine grin members’ ability to provide public goods compared to the ability demonstrated by groups of strangers. Results show that when people play the game with other members of their own grin, they have higher contribution and win rates than 1) when grin members play with people they do not know and who are not grin members and 2) when non-members play with other non-members. The data from these games indicate that members of grins are better able to produce public goods than non-members, but only when they are collaborating with their fellow members, specifically people from their same grin. We also integrated a form of the dictator game, as questions in our survey; the results from those “games” showed that individuals from more ethnically homogeneous grins contribute significantly less than those from more diverse grins. We used the experimental trust game and an attitudinal survey to gauge whether grin members are more trusting and trustworthy than non-members. The experimental games did not indicate significant differences in levels of trust between members and non-members, but did indicate that grin members were considered significantly more trustworthy. Based on the survey, grin members showed greater levels of trust of many demographic and social groups in Mali: other ethnic groups, religious leaders, people speaking the same language, those speaking a different language, and people from the North. However, grin members are no more trusting of the government than non-members. Interestingly, members of male-only grins are less likely to express high trust of the members of their own grin. In other words, mixed-gender grins are more likely to generate co-member trust. Relatedly, individuals from ethnically homogenous grins exhibit lower trust levels. Based on the survey, grin membership has no significant effect on political knowledge or on the degree of tolerance (proxied by our three questions about willingness to marry a Tuareg, a Christian, or
7 Differences discussed are significant at 10%. This applies for the entirety of the report. 8 A ROSCA is a group of individuals that gathers on a regular basis for a cycle of meetings. At each meeting, all members contribute a fixed amount of money to a common pot allocated to one of them. That person is then excluded from the reception of the pot in subsequent meetings, but is still obliged to put in her contributions up until the end of the cycle. This process repeats itself until each member has received the pot, marking the end of a cycle. The ROSCA may then renew another cycle or choose to break up. Except for this basic principle, groups vary widely in terms of the amount contributed, number of members, frequency of meetings, and functioning. The pot can be allocated either according to a random process (random ROSCAs), based upon a decision imposed by the governing body of the group (decision ROSCAs) or through a bidding process (bidding ROSCAs).
University of Notre Dame USAID/DCHA/DRG Working Papers Series 8
someone who speaks a different language at home). However, there is some evidence that grins with female members are more tolerant, in general. Members of mixed-gender and female-only grins are more likely to say they accept mixed-religion marriages than members of male-only grins. Individuals belonging to ethnically diverse grins are more likely to accept mixed-language weddings but not more likely to accept mixed-religion weddings. There is no clear connection between grin membership and attitudes toward gender equality, proxied by questions about respondent agreement with the statements that women should play an equal role in household financial decisions and that households should invest equally in the education of boys and girls. Grin members are more likely to agree that women should play equal roles in financial decisions, but less likely to believe that households should make equal investments in education. We also used the survey to investigate how having an IDP in a grin affects political attitudes and orientations. Since the crisis in Mali is largely interpreted through a northern vs. southern lens, we also investigated whether having grin members from the North affects citizens’ attitudes and behavior. Overall, such effects never exceed 10% and thus remain small, but:
▪ Belonging to grins with IDPs leads to members having higher political knowledge. ▪ Individuals in grins with IDPs exhibit less trust of the government than individuals from grins
without IDPs; however, individuals from grins with Northerners exhibit more trust of the government.
▪ Having at least one IDP member significantly decreases the likelihood of accepting a wedding with someone from a different religion; at the same time, having a member from the North significantly increases the likelihood of accepting a wedding with different religion but decreases the likelihood of accepting a wedding with a Tuareg.
▪ Individuals from grins with Northerners are more likely to agree with statements of gender equality in financial decisions.
▪ Belonging to a grin with IDPs decreases trustworthiness, based on the trust game: in this game, the size of the endowment given is interpreted as a proxy for trustworthiness; belonging to a grin with IDPs decreases the size of the endowment by 11%.
B. Results: Research Question 1 Below are the results for our first research question: compared to non-members, do grin members exhibit greater levels of trust, tolerance, political knowledge, and willingness to provide public goods?
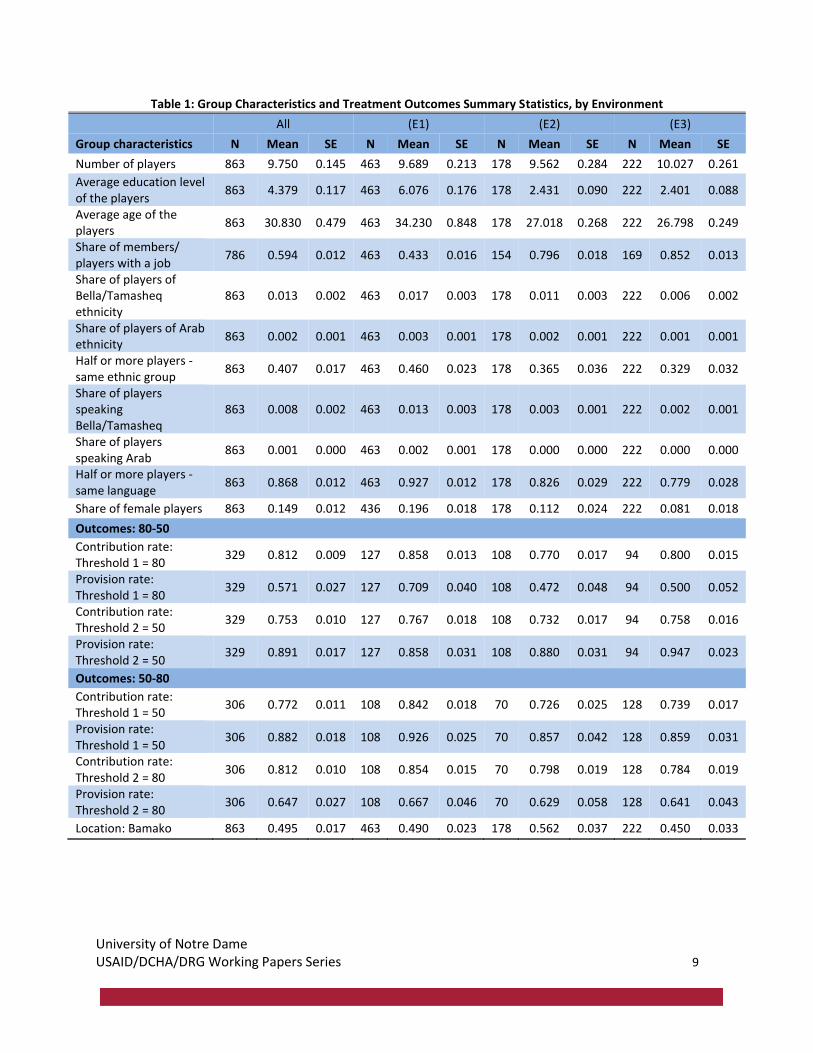
i. Public Goods Games We present two types of evidence, based on the public goods games. First, Table 1 shows descriptive statistics of means for grin characteristics and public goods games outcomes. Table 2 displays pairwise comparisons among the different environments. Table 3 shows that individuals in E1—those working with members of their own grins—on average provide more public goods than individuals in E2 or E3.
University of Notre Dame USAID/DCHA/DRG Working Papers Series 9
Table 1: Group Characteristics and Treatment Outcomes Summary Statistics, by Environment All (E1) (E2) (E3)
Group characteristics N Mean SE N Mean SE N Mean SE N Mean SE
Number of players 863 9.750 0.145 463 9.689 0.213 178 9.562 0.284 222 10.027 0.261
Average education level of the players
863 4.379 0.117 463 6.076 0.176 178 2.431 0.090 222 2.401 0.088
Average age of the players
863 30.830 0.479 463 34.230 0.848 178 27.018 0.268 222 26.798 0.249
Share of members/ players with a job
786 0.594 0.012 463 0.433 0.016 154 0.796 0.018 169 0.852 0.013
Share of players of Bella/Tamasheq ethnicity
863 0.013 0.002 463 0.017 0.003 178 0.011 0.003 222 0.006 0.002
Share of players of Arab ethnicity
863 0.002 0.001 463 0.003 0.001 178 0.002 0.001 222 0.001 0.001
Half or more players - same ethnic group
863 0.407 0.017 463 0.460 0.023 178 0.365 0.036 222 0.329 0.032
Share of players speaking Bella/Tamasheq
863 0.008 0.002 463 0.013 0.003 178 0.003 0.001 222 0.002 0.001
Share of players speaking Arab
863 0.001 0.000 463 0.002 0.001 178 0.000 0.000 222 0.000 0.000
Half or more players - same language
863 0.868 0.012 463 0.927 0.012 178 0.826 0.029 222 0.779 0.028
Share of female players 863 0.149 0.012 436 0.196 0.018 178 0.112 0.024 222 0.081 0.018
Outcomes: 80-50
Contribution rate: Threshold 1 = 80
329 0.812 0.009 127 0.858 0.013 108 0.770 0.017 94 0.800 0.015
Provision rate: Threshold 1 = 80
329 0.571 0.027 127 0.709 0.040 108 0.472 0.048 94 0.500 0.052
Contribution rate: Threshold 2 = 50
329 0.753 0.010 127 0.767 0.018 108 0.732 0.017 94 0.758 0.016
Provision rate: Threshold 2 = 50
329 0.891 0.017 127 0.858 0.031 108 0.880 0.031 94 0.947 0.023
Outcomes: 50-80
Contribution rate: Threshold 1 = 50
306 0.772 0.011 108 0.842 0.018 70 0.726 0.025 128 0.739 0.017
Provision rate: Threshold 1 = 50
306 0.882 0.018 108 0.926 0.025 70 0.857 0.042 128 0.859 0.031
Contribution rate: Threshold 2 = 80
306 0.812 0.010 108 0.854 0.015 70 0.798 0.019 128 0.784 0.019
Provision rate: Threshold 2 = 80
306 0.647 0.027 108 0.667 0.046 70 0.629 0.058 128 0.641 0.043
Location: Bamako 863 0.495 0.017 463 0.490 0.023 178 0.562 0.037 222 0.450 0.033
University of Notre Dame USAID/DCHA/DRG Working Papers Series 10
Table 2: Pairwise Comparisons by Environment on Characteristics and Treatment Outcomes Group Differences
E1-E2 E1-E3 E2-E3
Group characteristics diff. stars diff. stars diff. stars
Number of players 0.07 0 -0.40 0 -0.47 0
Average education level of the players 3.65 3 3.68 3 0.03 0
Average age of the players 7.21 3 7.43 3 0.22 0
Share of members/players with a job -0.36 3 -0.42 3 -0.06 2
Share of players of Bella/Tamasheq ethnicity 0.01 0 0.01 2 0.01 0
Share of players of Arab ethnicity 0.00 0 0.00 0 0.00 0
Half or more players - same ethnic group 0.09 2 0.13 3 0.04 0
Share of players speaking Bella/Tamasheq 0.01 1 0.01 2 0.00 0
Share of players speaking Arabic 0.00 0 0.00 0 0.00 3
Half or more players - same language 0.10 3 0.14 3 0.05 0
Table 3: Pairwise Comparisons by Environment on Characteristics and Treatment Outcomes
E1-E2 E1-E3 E2-E3
diff stars diff stars diff stars
Outcomes: 80-50
Contribution rate: Threshold 1 =80 0.088 3 0.058 3 0.018 0
Provision rate: Threshold 1 =80 0.236 3 0.209 3 0.1 1
Contribution rate: Threshold 2 =50 0.035 0 0.009 0 -0.007 0
Provision rate: Threshold 2 =50 -0.021 0 -0.089 2 -0.079 2
Outcomes: 50-80
Contribution rate: Threshold 1 =50 0.116 3 0.104 3 0.058 3
Provision rate: Threshold 1 =50 0.069 0 0.067 0 0.056 1
Contribution rate: Threshold 2 =80 0.056 2 0.07 3 0.023 0
Provision rate: Threshold 2 =80 0.038 0 0.026 0 0.035 0
Location: Bamako 0.073 1 0.039 0 0.111 2
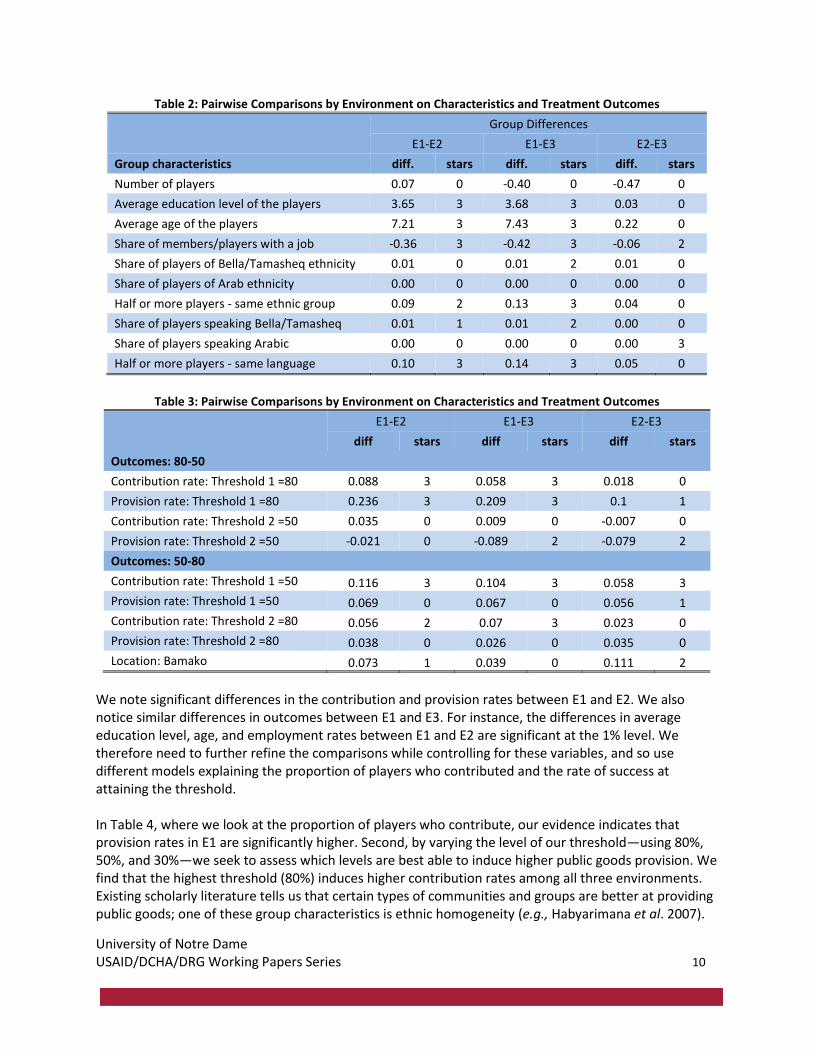
We note significant differences in the contribution and provision rates between E1 and E2. We also notice similar differences in outcomes between E1 and E3. For instance, the differences in average education level, age, and employment rates between E1 and E2 are significant at the 1% level. We therefore need to further refine the comparisons while controlling for these variables, and so use different models explaining the proportion of players who contributed and the rate of success at attaining the threshold. In Table 4, where we look at the proportion of players who contribute, our evidence indicates that provision rates in E1 are significantly higher. Second, by varying the level of our threshold—using 80%, 50%, and 30%—we seek to assess which levels are best able to induce higher public goods provision. We find that the highest threshold (80%) induces higher contribution rates among all three environments. Existing scholarly literature tells us that certain types of communities and groups are better at providing public goods; one of these group characteristics is ethnic homogeneity (e.g., Habyarimana et al. 2007).
University of Notre Dame USAID/DCHA/DRG Working Papers Series 11
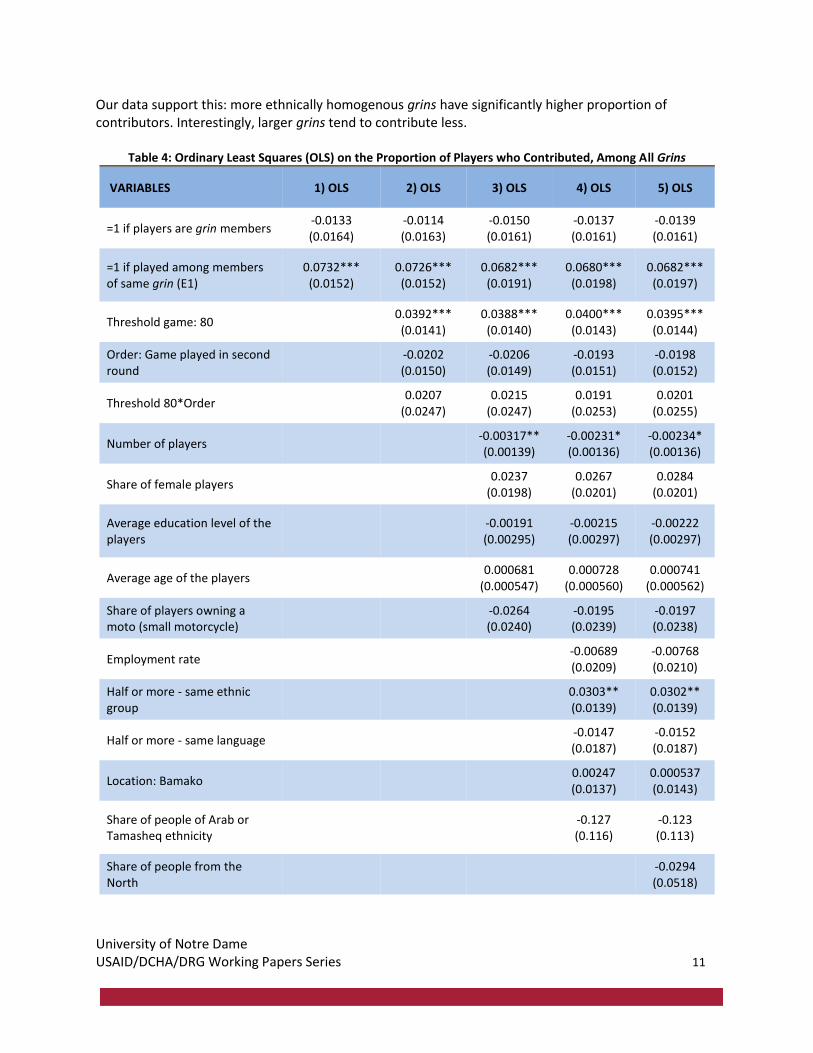
Our data support this: more ethnically homogenous grins have significantly higher proportion of contributors. Interestingly, larger grins tend to contribute less.
Table 4: Ordinary Least Squares (OLS) on the Proportion of Players who Contributed, Among All Grins
VARIABLES 1) OLS 2) OLS 3) OLS 4) OLS 5) OLS
=1 if players are grin members -0.0133 (0.0164)
-0.0114 (0.0163)
-0.0150 (0.0161)
-0.0137 (0.0161)
-0.0139 (0.0161)
=1 if played among members of same grin (E1)
0.0732*** (0.0152)
0.0726*** (0.0152)
0.0682*** (0.0191)
0.0680*** (0.0198)
0.0682*** (0.0197)
Threshold game: 80 0.0392*** (0.0141)
0.0388*** (0.0140)
0.0400*** (0.0143)
0.0395*** (0.0144)
Order: Game played in second round
-0.0202 (0.0150)
-0.0206 (0.0149)
-0.0193 (0.0151)
-0.0198 (0.0152)
Threshold 80*Order 0.0207 (0.0247)
0.0215 (0.0247)
0.0191 (0.0253)
0.0201 (0.0255)
Number of players -0.00317** (0.00139)
-0.00231* (0.00136)
-0.00234* (0.00136)
Share of female players 0.0237 (0.0198)
0.0267 (0.0201)
0.0284 (0.0201)
Average education level of the players
-0.00191 (0.00295)
-0.00215 (0.00297)
-0.00222 (0.00297)
Average age of the players 0.000681 (0.000547)
0.000728 (0.000560)
0.000741 (0.000562)
Share of players owning a moto (small motorcycle)
-0.0264 (0.0240)
-0.0195 (0.0239)
-0.0197 (0.0238)
Employment rate -0.00689 (0.0209)
-0.00768 (0.0210)
Half or more - same ethnic group
0.0303** (0.0139)
0.0302** (0.0139)
Half or more - same language -0.0147 (0.0187)
-0.0152 (0.0187)
Location: Bamako 0.00247 (0.0137)
0.000537 (0.0143)
Share of people of Arab or Tamasheq ethnicity
-0.127 (0.116)
-0.123 (0.113)
Share of people from the North
-0.0294 (0.0518)
University of Notre Dame USAID/DCHA/DRG Working Papers Series 12
VARIABLES 1) OLS 2) OLS 3) OLS 4) OLS 5) OLS
Constant 0.769*** (0.0112)
0.753*** (0.0141)
0.785*** (0.0299)
0.777*** (0.0324)
0.781*** (0.0333)
Observations 1,270 1,270 1,270 1,270 1,270
R-squared 0.031 0.051 0.064 0.072 0.073
Robust standard errors in parentheses; *** p<0.01, ** p<0.05, * p<0.1
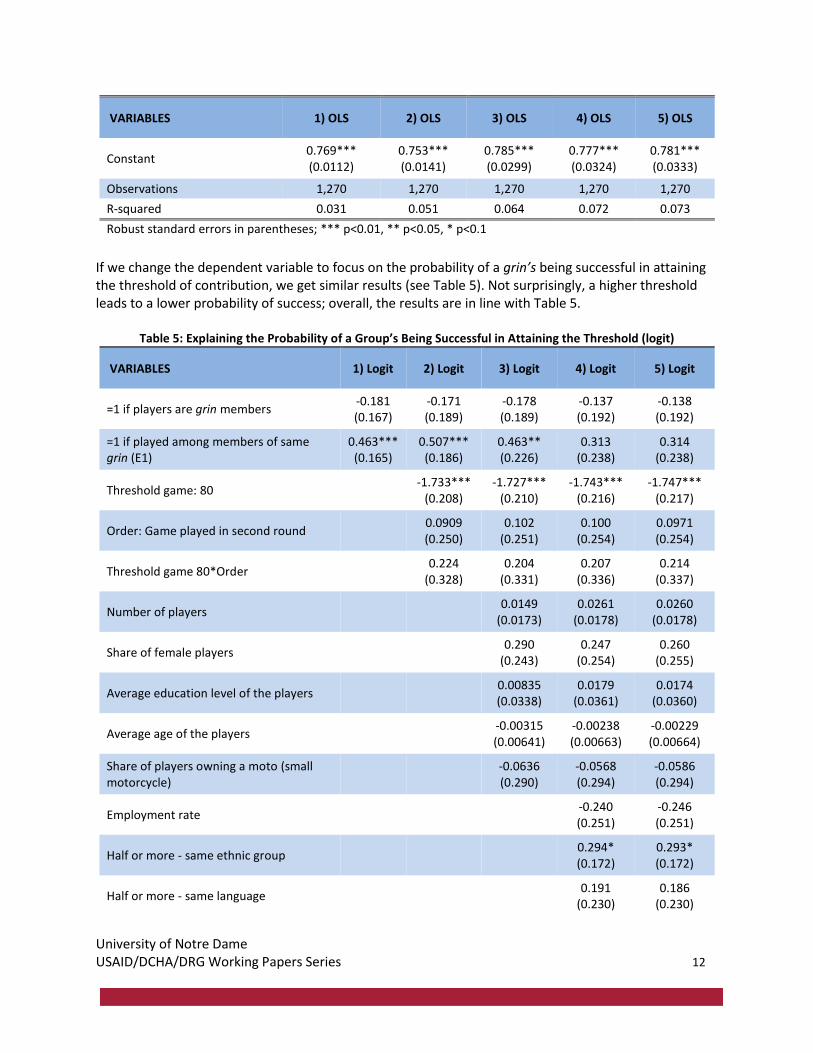
If we change the dependent variable to focus on the probability of a grin’s being successful in attaining the threshold of contribution, we get similar results (see Table 5). Not surprisingly, a higher threshold leads to a lower probability of success; overall, the results are in line with Table 5.
Table 5: Explaining the Probability of a Group’s Being Successful in Attaining the Threshold (logit)
VARIABLES 1) Logit 2) Logit 3) Logit 4) Logit 5) Logit
=1 if players are grin members -0.181 (0.167)
-0.171 (0.189)
-0.178 (0.189)
-0.137 (0.192)
-0.138 (0.192)
=1 if played among members of same grin (E1)
0.463*** (0.165)
0.507*** (0.186)
0.463** (0.226)
0.313 (0.238)
0.314 (0.238)
Threshold game: 80 -1.733*** (0.208)
-1.727*** (0.210)
-1.743*** (0.216)
-1.747*** (0.217)
Order: Game played in second round 0.0909 (0.250)
0.102 (0.251)
0.100 (0.254)
0.0971 (0.254)
Threshold game 80*Order 0.224 (0.328)
0.204 (0.331)
0.207 (0.336)
0.214 (0.337)
Number of players 0.0149 (0.0173)
0.0261 (0.0178)
0.0260 (0.0178)
Share of female players 0.290 (0.243)
0.247 (0.254)
0.260 (0.255)
Average education level of the players 0.00835 (0.0338)
0.0179 (0.0361)
0.0174 (0.0360)
Average age of the players -0.00315 (0.00641)
-0.00238 (0.00663)
-0.00229 (0.00664)
Share of players owning a moto (small motorcycle)
-0.0636 (0.290)
-0.0568 (0.294)
-0.0586 (0.294)
Employment rate -0.240 (0.251)
-0.246 (0.251)
Half or more - same ethnic group 0.294* (0.172)
0.293* (0.172)
Half or more - same language 0.191 (0.230)
0.186 (0.230)
University of Notre Dame USAID/DCHA/DRG Working Papers Series 13
VARIABLES 1) Logit 2) Logit 3) Logit 4) Logit 5) Logit
Location: Bamako -0.299* (0.175)
-0.314* (0.180)
Share of people of Arab or Tamasheq ethnicity
-1.222 (1.319)
-1.197 (1.292)
Share of people from the North -0.227 (0.639)
Constant 1.039*** (0.115)
1.950*** (0.208)
1.879*** (0.382)
1.797*** (0.434)
1.832*** (0.445)
Observations 1,270 1,270 1,270 1,270 1,270
Robust standard errors in parentheses; *** p<0.01, ** p<0.05, * p<0.1
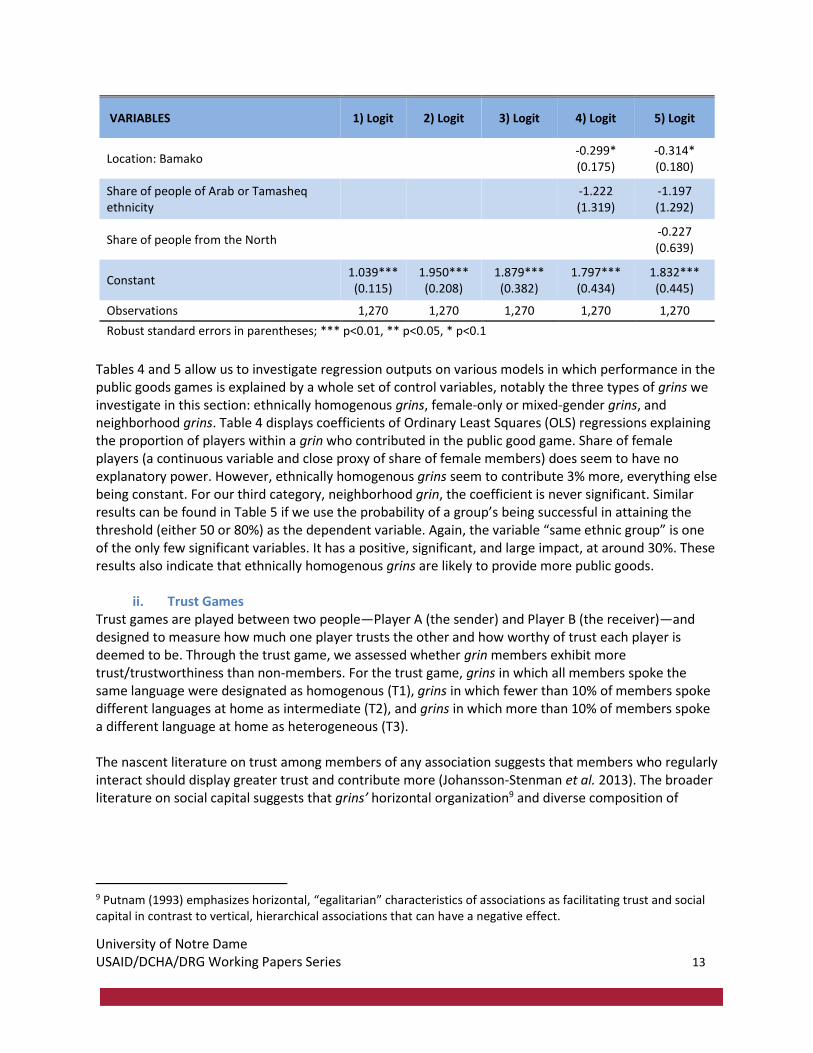
Tables 4 and 5 allow us to investigate regression outputs on various models in which performance in the public goods games is explained by a whole set of control variables, notably the three types of grins we investigate in this section: ethnically homogenous grins, female-only or mixed-gender grins, and neighborhood grins. Table 4 displays coefficients of Ordinary Least Squares (OLS) regressions explaining the proportion of players within a grin who contributed in the public good game. Share of female players (a continuous variable and close proxy of share of female members) does seem to have no explanatory power. However, ethnically homogenous grins seem to contribute 3% more, everything else being constant. For our third category, neighborhood grin, the coefficient is never significant. Similar results can be found in Table 5 if we use the probability of a group’s being successful in attaining the threshold (either 50 or 80%) as the dependent variable. Again, the variable “same ethnic group” is one of the only few significant variables. It has a positive, significant, and large impact, at around 30%. These results also indicate that ethnically homogenous grins are likely to provide more public goods.
ii. Trust Games Trust games are played between two people—Player A (the sender) and Player B (the receiver)—and designed to measure how much one player trusts the other and how worthy of trust each player is deemed to be. Through the trust game, we assessed whether grin members exhibit more trust/trustworthiness than non-members. For the trust game, grins in which all members spoke the same language were designated as homogenous (T1), grins in which fewer than 10% of members spoke different languages at home as intermediate (T2), and grins in which more than 10% of members spoke a different language at home as heterogeneous (T3). The nascent literature on trust among members of any association suggests that members who regularly interact should display greater trust and contribute more (Johansson-Stenman et al. 2013). The broader literature on social capital suggests that grins’ horizontal organization9 and diverse composition of
9 Putnam (1993) emphasizes horizontal, “egalitarian” characteristics of associations as facilitating trust and social capital in contrast to vertical, hierarchical associations that can have a negative effect.
University of Notre Dame USAID/DCHA/DRG Working Papers Series 14
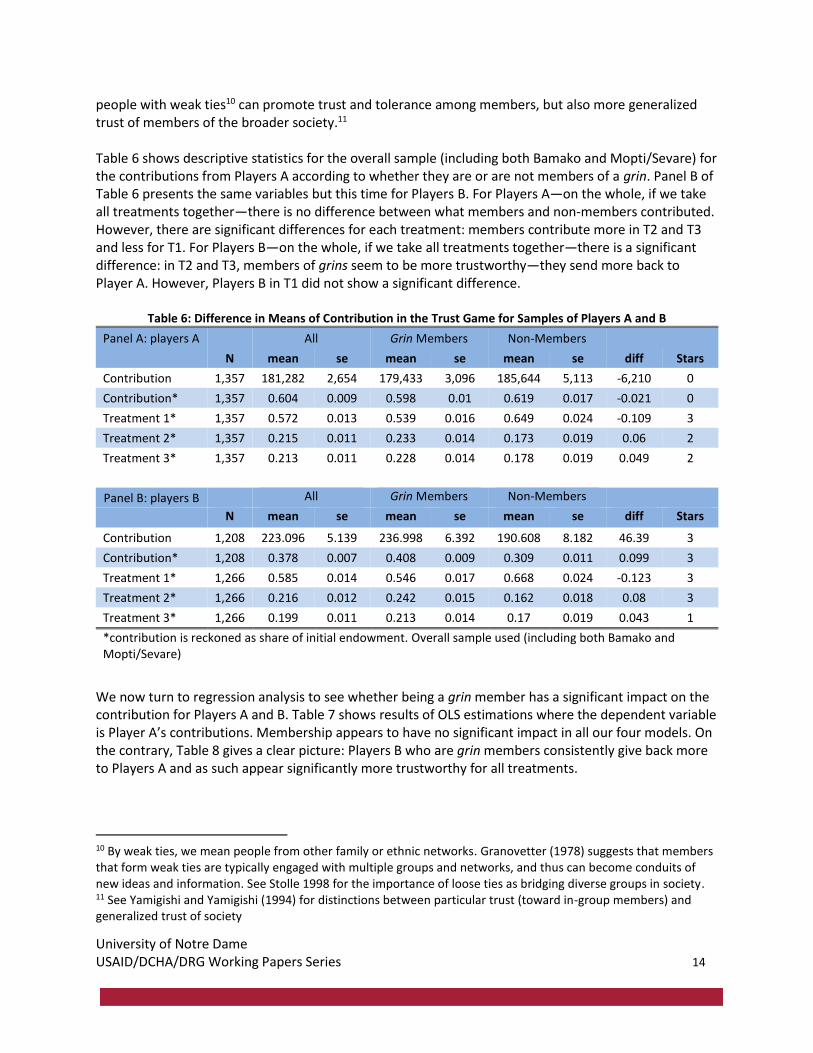
people with weak ties10 can promote trust and tolerance among members, but also more generalized trust of members of the broader society.11 Table 6 shows descriptive statistics for the overall sample (including both Bamako and Mopti/Sevare) for the contributions from Players A according to whether they are or are not members of a grin. Panel B of Table 6 presents the same variables but this time for Players B. For Players A—on the whole, if we take all treatments together—there is no difference between what members and non-members contributed. However, there are significant differences for each treatment: members contribute more in T2 and T3 and less for T1. For Players B—on the whole, if we take all treatments together—there is a significant difference: in T2 and T3, members of grins seem to be more trustworthy—they send more back to Player A. However, Players B in T1 did not show a significant difference.
Table 6: Difference in Means of Contribution in the Trust Game for Samples of Players A and B
Panel A: players A All Grin Members Non-Members
N mean se mean se mean se diff Stars
Contribution 1,357 181,282 2,654 179,433 3,096 185,644 5,113 -6,210 0
Contribution* 1,357 0.604 0.009 0.598 0.01 0.619 0.017 -0.021 0
Treatment 1* 1,357 0.572 0.013 0.539 0.016 0.649 0.024 -0.109 3
Treatment 2* 1,357 0.215 0.011 0.233 0.014 0.173 0.019 0.06 2
Treatment 3* 1,357 0.213 0.011 0.228 0.014 0.178 0.019 0.049 2
Panel B: players B
All Grin Members Non-Members
N mean se mean se mean se diff Stars
Contribution 1,208 223.096 5.139 236.998 6.392 190.608 8.182 46.39 3
Contribution* 1,208 0.378 0.007 0.408 0.009 0.309 0.011 0.099 3
Treatment 1* 1,266 0.585 0.014 0.546 0.017 0.668 0.024 -0.123 3
Treatment 2* 1,266 0.216 0.012 0.242 0.015 0.162 0.018 0.08 3
Treatment 3* 1,266 0.199 0.011 0.213 0.014 0.17 0.019 0.043 1
*contribution is reckoned as share of initial endowment. Overall sample used (including both Bamako and Mopti/Sevare)
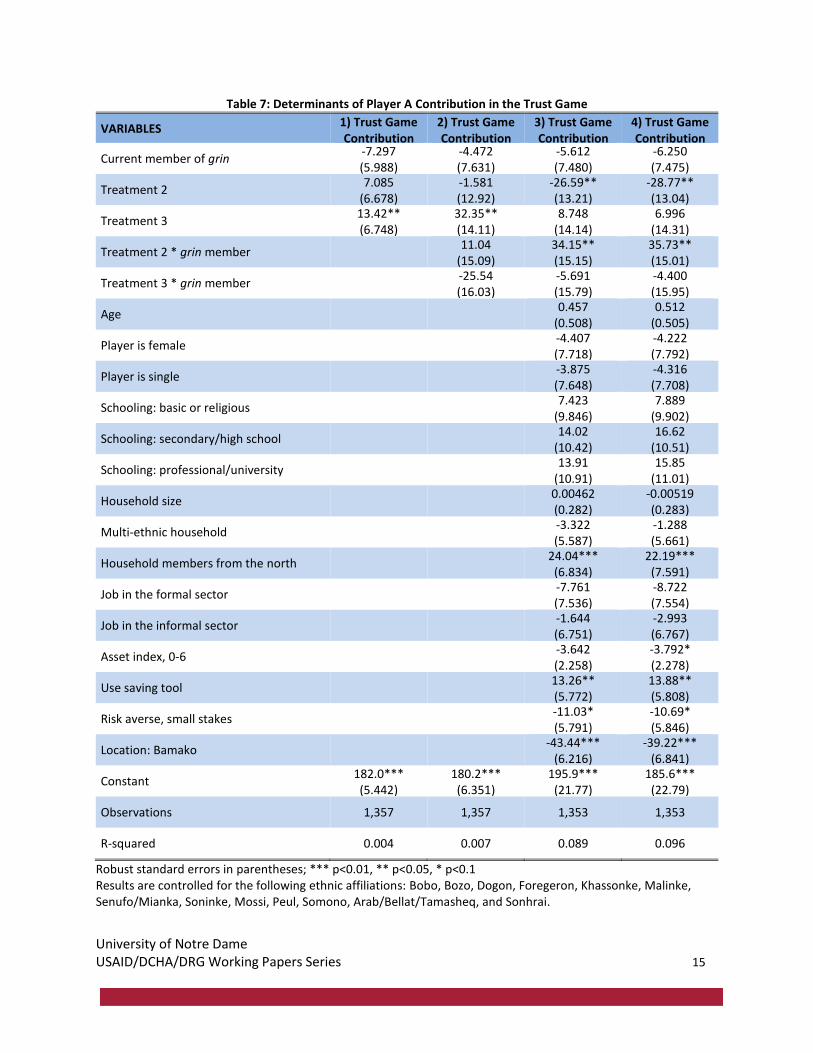
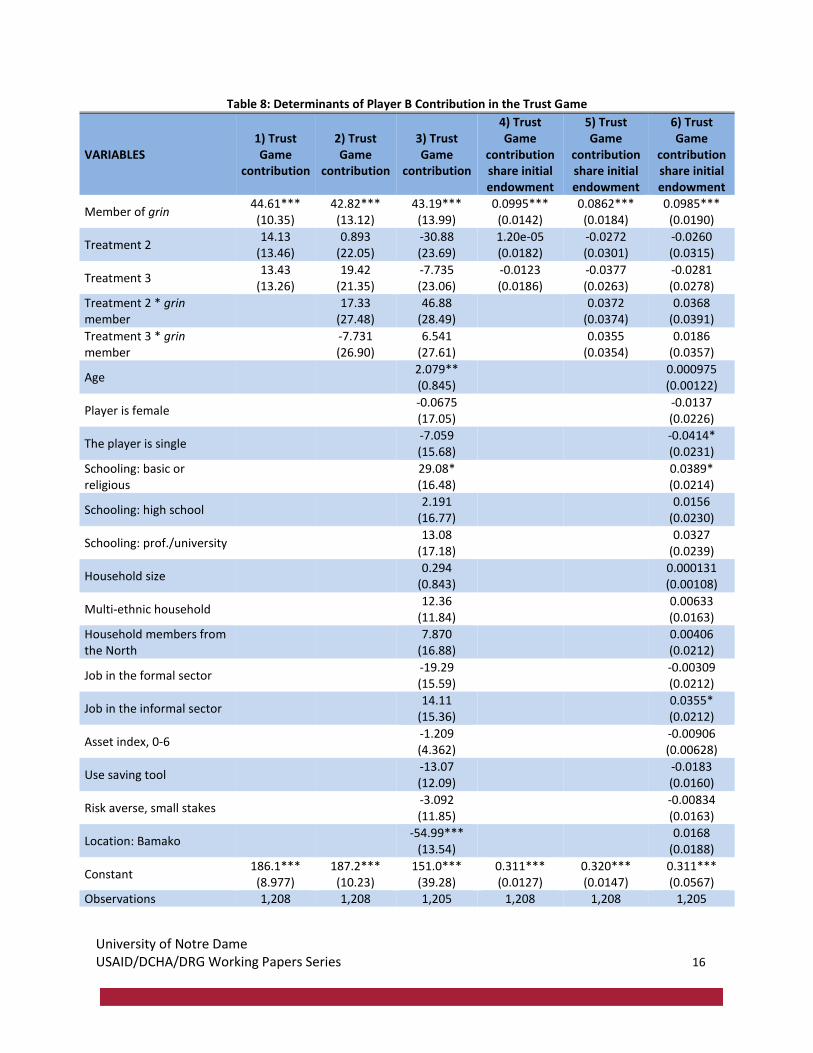
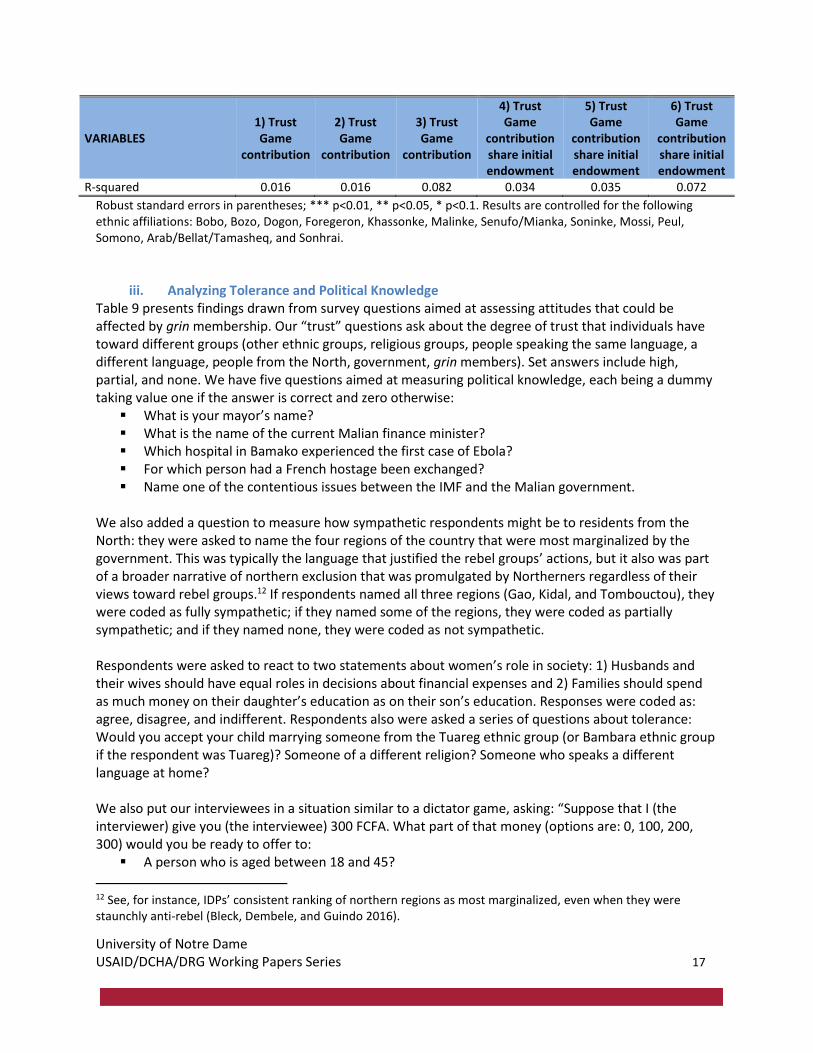
We now turn to regression analysis to see whether being a grin member has a significant impact on the contribution for Players A and B. Table 7 shows results of OLS estimations where the dependent variable is Player A’s contributions. Membership appears to have no significant impact in all our four models. On the contrary, Table 8 gives a clear picture: Players B who are grin members consistently give back more to Players A and as such appear significantly more trustworthy for all treatments.
10 By weak ties, we mean people from other family or ethnic networks. Granovetter (1978) suggests that members that form weak ties are typically engaged with multiple groups and networks, and thus can become conduits of new ideas and information. See Stolle 1998 for the importance of loose ties as bridging diverse groups in society. 11 See Yamigishi and Yamigishi (1994) for distinctions between particular trust (toward in-group members) and generalized trust of society
University of Notre Dame USAID/DCHA/DRG Working Papers Series 15
Table 7: Determinants of Player A Contribution in the Trust Game
VARIABLES 1) Trust Game Contribution
2) Trust Game Contribution
3) Trust Game Contribution
4) Trust Game Contribution
Current member of grin -7.297 (5.988)
-4.472 (7.631)
-5.612 (7.480)
-6.250 (7.475)
Treatment 2 7.085
(6.678) -1.581 (12.92)
-26.59** (13.21)
-28.77** (13.04)
Treatment 3 13.42** (6.748)
32.35** (14.11)
8.748 (14.14)
6.996 (14.31)
Treatment 2 * grin member 11.04
(15.09) 34.15** (15.15)
35.73** (15.01)
Treatment 3 * grin member -25.54 (16.03)
-5.691 (15.79)
-4.400 (15.95)
Age 0.457
(0.508) 0.512
(0.505)
Player is female -4.407 (7.718)
-4.222 (7.792)
Player is single -3.875 (7.648)
-4.316 (7.708)
Schooling: basic or religious 7.423
(9.846) 7.889
(9.902)
Schooling: secondary/high school 14.02
(10.42) 16.62
(10.51)
Schooling: professional/university 13.91
(10.91) 15.85
(11.01)
Household size 0.00462 (0.282)
-0.00519 (0.283)
Multi-ethnic household -3.322 (5.587)
-1.288 (5.661)
Household members from the north 24.04*** (6.834)
22.19*** (7.591)
Job in the formal sector -7.761 (7.536)
-8.722 (7.554)
Job in the informal sector -1.644 (6.751)
-2.993 (6.767)
Asset index, 0-6 -3.642 (2.258)
-3.792* (2.278)
Use saving tool 13.26** (5.772)
13.88** (5.808)
Risk averse, small stakes -11.03* (5.791)
-10.69* (5.846)
Location: Bamako -43.44***
(6.216) -39.22***
(6.841)
Constant 182.0*** (5.442)
180.2*** (6.351)
195.9*** (21.77)
185.6*** (22.79)
Observations 1,357 1,357 1,353 1,353
R-squared 0.004 0.007 0.089 0.096
Robust standard errors in parentheses; *** p<0.01, ** p<0.05, * p<0.1 Results are controlled for the following ethnic affiliations: Bobo, Bozo, Dogon, Foregeron, Khassonke, Malinke, Senufo/Mianka, Soninke, Mossi, Peul, Somono, Arab/Bellat/Tamasheq, and Sonhrai.
University of Notre Dame USAID/DCHA/DRG Working Papers Series 16
Table 8: Determinants of Player B Contribution in the Trust Game
VARIABLES 1) Trust Game
contribution
2) Trust Game
contribution
3) Trust Game
contribution
4) Trust Game
contribution share initial endowment
5) Trust Game
contribution share initial endowment
6) Trust Game
contribution share initial endowment
Member of grin 44.61*** (10.35)
42.82*** (13.12)
43.19*** (13.99)
0.0995*** (0.0142)
0.0862*** (0.0184)
0.0985*** (0.0190)
Treatment 2 14.13
(13.46) 0.893
(22.05) -30.88 (23.69)
1.20e-05 (0.0182)
-0.0272 (0.0301)
-0.0260 (0.0315)
Treatment 3 13.43
(13.26) 19.42
(21.35) -7.735 (23.06)
-0.0123 (0.0186)
-0.0377 (0.0263)
-0.0281 (0.0278)
Treatment 2 * grin member
17.33
(27.48) 46.88
(28.49)
0.0372 (0.0374)
0.0368 (0.0391)
Treatment 3 * grin member
-7.731 (26.90)
6.541 (27.61)
0.0355
(0.0354) 0.0186
(0.0357)
Age 2.079** (0.845)
0.000975 (0.00122)
Player is female -0.0675 (17.05)
-0.0137 (0.0226)
The player is single -7.059 (15.68)
-0.0414* (0.0231)
Schooling: basic or religious
29.08* (16.48)
0.0389* (0.0214)
Schooling: high school 2.191
(16.77)
0.0156 (0.0230)
Schooling: prof./university 13.08
(17.18)
0.0327 (0.0239)
Household size 0.294
(0.843)
0.000131 (0.00108)
Multi-ethnic household 12.36
(11.84)
0.00633 (0.0163)
Household members from the North
7.870
(16.88)
0.00406 (0.0212)
Job in the formal sector -19.29 (15.59)
-0.00309 (0.0212)
Job in the informal sector 14.11
(15.36)
0.0355* (0.0212)
Asset index, 0-6 -1.209 (4.362)
-0.00906 (0.00628)
Use saving tool -13.07 (12.09)
-0.0183 (0.0160)
Risk averse, small stakes -3.092 (11.85)
-0.00834 (0.0163)
Location: Bamako -54.99***
(13.54)
0.0168 (0.0188)
Constant 186.1*** (8.977)
187.2*** (10.23)
151.0*** (39.28)
0.311*** (0.0127)
0.320*** (0.0147)
0.311*** (0.0567)
Observations 1,208 1,208 1,205 1,208 1,208 1,205
University of Notre Dame USAID/DCHA/DRG Working Papers Series 17
VARIABLES 1) Trust Game
contribution
2) Trust Game
contribution
3) Trust Game
contribution
4) Trust Game
contribution share initial endowment
5) Trust Game
contribution share initial endowment
6) Trust Game
contribution share initial endowment
R-squared 0.016 0.016 0.082 0.034 0.035 0.072
Robust standard errors in parentheses; *** p<0.01, ** p<0.05, * p<0.1. Results are controlled for the following ethnic affiliations: Bobo, Bozo, Dogon, Foregeron, Khassonke, Malinke, Senufo/Mianka, Soninke, Mossi, Peul, Somono, Arab/Bellat/Tamasheq, and Sonhrai.
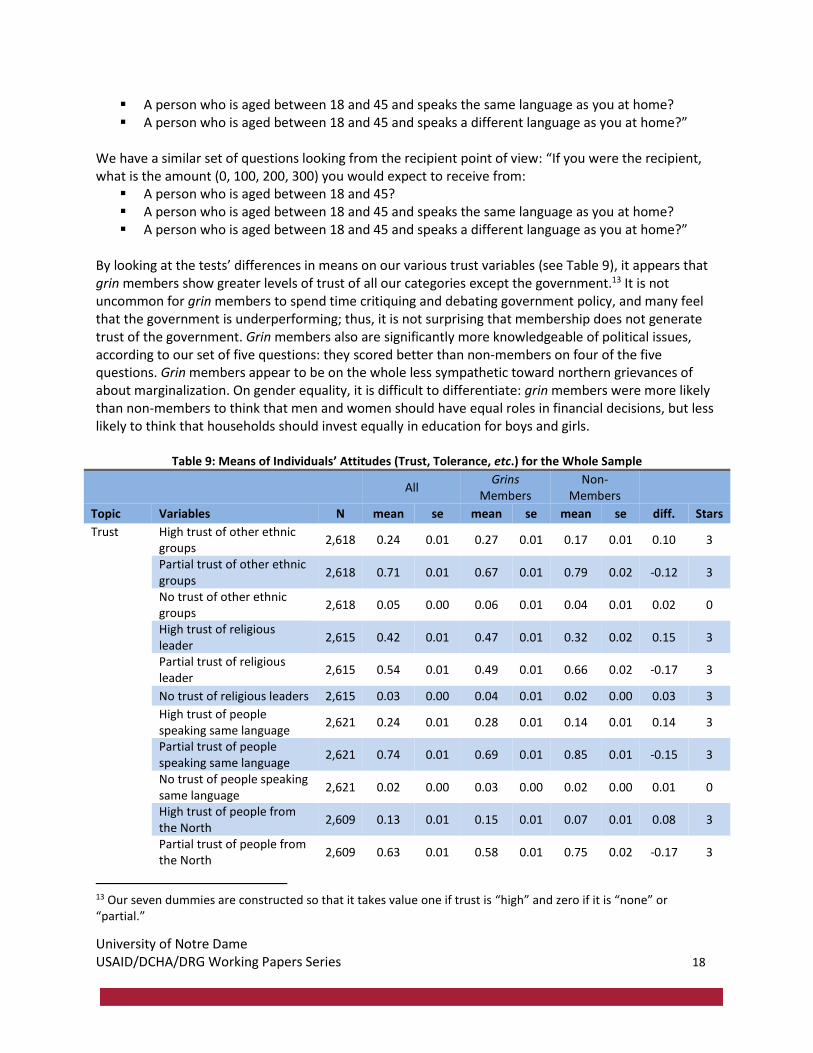
iii. Analyzing Tolerance and Political Knowledge Table 9 presents findings drawn from survey questions aimed at assessing attitudes that could be affected by grin membership. Our “trust” questions ask about the degree of trust that individuals have toward different groups (other ethnic groups, religious groups, people speaking the same language, a different language, people from the North, government, grin members). Set answers include high, partial, and none. We have five questions aimed at measuring political knowledge, each being a dummy taking value one if the answer is correct and zero otherwise:
▪ What is your mayor’s name? ▪ What is the name of the current Malian finance minister? ▪ Which hospital in Bamako experienced the first case of Ebola? ▪ For which person had a French hostage been exchanged? ▪ Name one of the contentious issues between the IMF and the Malian government.
We also added a question to measure how sympathetic respondents might be to residents from the North: they were asked to name the four regions of the country that were most marginalized by the government. This was typically the language that justified the rebel groups’ actions, but it also was part of a broader narrative of northern exclusion that was promulgated by Northerners regardless of their views toward rebel groups.12 If respondents named all three regions (Gao, Kidal, and Tombouctou), they were coded as fully sympathetic; if they named some of the regions, they were coded as partially sympathetic; and if they named none, they were coded as not sympathetic. Respondents were asked to react to two statements about women’s role in society: 1) Husbands and their wives should have equal roles in decisions about financial expenses and 2) Families should spend as much money on their daughter’s education as on their son’s education. Responses were coded as: agree, disagree, and indifferent. Respondents also were asked a series of questions about tolerance: Would you accept your child marrying someone from the Tuareg ethnic group (or Bambara ethnic group if the respondent was Tuareg)? Someone of a different religion? Someone who speaks a different language at home? We also put our interviewees in a situation similar to a dictator game, asking: “Suppose that I (the interviewer) give you (the interviewee) 300 FCFA. What part of that money (options are: 0, 100, 200, 300) would you be ready to offer to:
▪ A person who is aged between 18 and 45?
12 See, for instance, IDPs’ consistent ranking of northern regions as most marginalized, even when they were staunchly anti-rebel (Bleck, Dembele, and Guindo 2016).
University of Notre Dame USAID/DCHA/DRG Working Papers Series 18
▪ A person who is aged between 18 and 45 and speaks the same language as you at home? ▪ A person who is aged between 18 and 45 and speaks a different language as you at home?”
We have a similar set of questions looking from the recipient point of view: “If you were the recipient, what is the amount (0, 100, 200, 300) you would expect to receive from:
▪ A person who is aged between 18 and 45? ▪ A person who is aged between 18 and 45 and speaks the same language as you at home? ▪ A person who is aged between 18 and 45 and speaks a different language as you at home?”
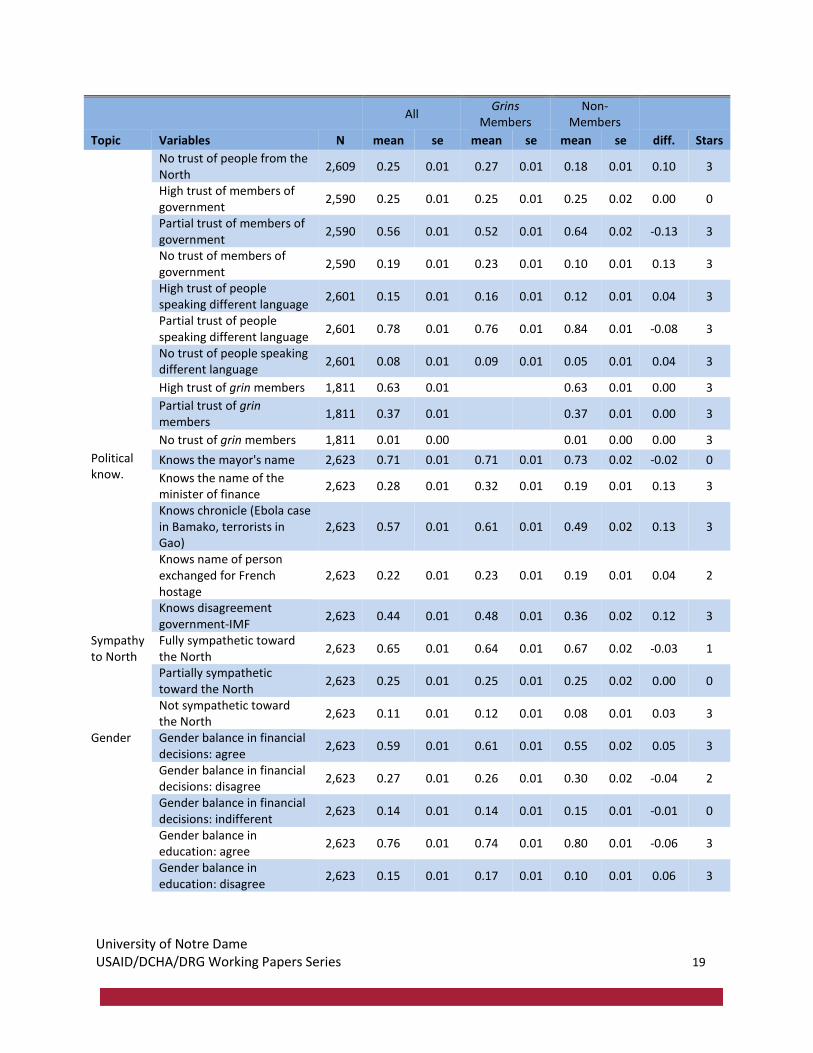
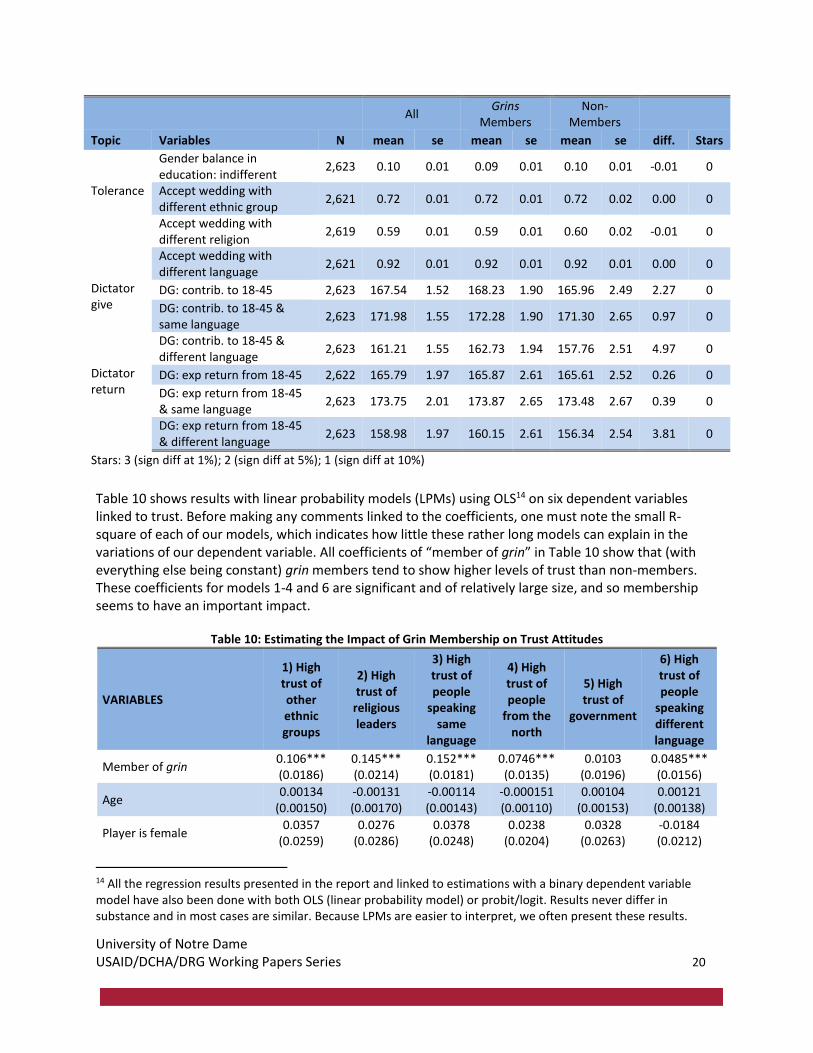
By looking at the tests’ differences in means on our various trust variables (see Table 9), it appears that grin members show greater levels of trust of all our categories except the government.13 It is not uncommon for grin members to spend time critiquing and debating government policy, and many feel that the government is underperforming; thus, it is not surprising that membership does not generate trust of the government. Grin members also are significantly more knowledgeable of political issues, according to our set of five questions: they scored better than non-members on four of the five questions. Grin members appear to be on the whole less sympathetic toward northern grievances of about marginalization. On gender equality, it is difficult to differentiate: grin members were more likely than non-members to think that men and women should have equal roles in financial decisions, but less likely to think that households should invest equally in education for boys and girls.
Table 9: Means of Individuals’ Attitudes (Trust, Tolerance, etc.) for the Whole Sample
All Grins
Members Non-
Members
Topic Variables N mean se mean se mean se diff. Stars
Trust High trust of other ethnic groups
2,618 0.24 0.01 0.27 0.01 0.17 0.01 0.10 3
Partial trust of other ethnic groups
2,618 0.71 0.01 0.67 0.01 0.79 0.02 -0.12 3
No trust of other ethnic groups
2,618 0.05 0.00 0.06 0.01 0.04 0.01 0.02 0
High trust of religious leader
2,615 0.42 0.01 0.47 0.01 0.32 0.02 0.15 3
Partial trust of religious leader
2,615 0.54 0.01 0.49 0.01 0.66 0.02 -0.17 3
No trust of religious leaders 2,615 0.03 0.00 0.04 0.01 0.02 0.00 0.03 3
High trust of people speaking same language
2,621 0.24 0.01 0.28 0.01 0.14 0.01 0.14 3
Partial trust of people speaking same language
2,621 0.74 0.01 0.69 0.01 0.85 0.01 -0.15 3
No trust of people speaking same language
2,621 0.02 0.00 0.03 0.00 0.02 0.00 0.01 0
High trust of people from the North
2,609 0.13 0.01 0.15 0.01 0.07 0.01 0.08 3
Partial trust of people from the North
2,609 0.63 0.01 0.58 0.01 0.75 0.02 -0.17 3
13 Our seven dummies are constructed so that it takes value one if trust is “high” and zero if it is “none” or “partial.”
University of Notre Dame USAID/DCHA/DRG Working Papers Series 19
All Grins
Members Non-
Members
Topic Variables N mean se mean se mean se diff. Stars
No trust of people from the North
2,609 0.25 0.01 0.27 0.01 0.18 0.01 0.10 3
High trust of members of government
2,590 0.25 0.01 0.25 0.01 0.25 0.02 0.00 0
Partial trust of members of government
2,590 0.56 0.01 0.52 0.01 0.64 0.02 -0.13 3
No trust of members of government
2,590 0.19 0.01 0.23 0.01 0.10 0.01 0.13 3
High trust of people speaking different language
2,601 0.15 0.01 0.16 0.01 0.12 0.01 0.04 3
Partial trust of people speaking different language
2,601 0.78 0.01 0.76 0.01 0.84 0.01 -0.08 3
No trust of people speaking different language
2,601 0.08 0.01 0.09 0.01 0.05 0.01 0.04 3
High trust of grin members 1,811 0.63 0.01 0.63 0.01 0.00 3
Partial trust of grin members
1,811 0.37 0.01 0.37 0.01 0.00 3
No trust of grin members 1,811 0.01 0.00 0.01 0.00 0.00 3
Political know.
Knows the mayor's name 2,623 0.71 0.01 0.71 0.01 0.73 0.02 -0.02 0
Knows the name of the minister of finance
2,623 0.28 0.01 0.32 0.01 0.19 0.01 0.13 3
Knows chronicle (Ebola case in Bamako, terrorists in Gao)
2,623 0.57 0.01 0.61 0.01 0.49 0.02 0.13 3
Knows name of person exchanged for French hostage
2,623 0.22 0.01 0.23 0.01 0.19 0.01 0.04 2
Knows disagreement government-IMF
2,623 0.44 0.01 0.48 0.01 0.36 0.02 0.12 3
Sympathy to North
Fully sympathetic toward the North
2,623 0.65 0.01 0.64 0.01 0.67 0.02 -0.03 1
Partially sympathetic toward the North
2,623 0.25 0.01 0.25 0.01 0.25 0.02 0.00 0
Not sympathetic toward the North
2,623 0.11 0.01 0.12 0.01 0.08 0.01 0.03 3
Gender Gender balance in financial decisions: agree
2,623 0.59 0.01 0.61 0.01 0.55 0.02 0.05 3
Gender balance in financial decisions: disagree
2,623 0.27 0.01 0.26 0.01 0.30 0.02 -0.04 2
Gender balance in financial decisions: indifferent
2,623 0.14 0.01 0.14 0.01 0.15 0.01 -0.01 0
Gender balance in education: agree
2,623 0.76 0.01 0.74 0.01 0.80 0.01 -0.06 3
Gender balance in education: disagree
2,623 0.15 0.01 0.17 0.01 0.10 0.01 0.06 3
University of Notre Dame USAID/DCHA/DRG Working Papers Series 20
All Grins
Members Non-
Members
Topic Variables N mean se mean se mean se diff. Stars
Gender balance in education: indifferent
2,623 0.10 0.01 0.09 0.01 0.10 0.01 -0.01 0
Tolerance Accept wedding with different ethnic group
2,621 0.72 0.01 0.72 0.01 0.72 0.02 0.00 0
Accept wedding with different religion
2,619 0.59 0.01 0.59 0.01 0.60 0.02 -0.01 0
Accept wedding with different language
2,621 0.92 0.01 0.92 0.01 0.92 0.01 0.00 0
Dictator give
DG: contrib. to 18-45 2,623 167.54 1.52 168.23 1.90 165.96 2.49 2.27 0
DG: contrib. to 18-45 & same language
2,623 171.98 1.55 172.28 1.90 171.30 2.65 0.97 0
DG: contrib. to 18-45 & different language
2,623 161.21 1.55 162.73 1.94 157.76 2.51 4.97 0
Dictator return
DG: exp return from 18-45 2,622 165.79 1.97 165.87 2.61 165.61 2.52 0.26 0
DG: exp return from 18-45 & same language
2,623 173.75 2.01 173.87 2.65 173.48 2.67 0.39 0
DG: exp return from 18-45 & different language
2,623 158.98 1.97 160.15 2.61 156.34 2.54 3.81 0
Stars: 3 (sign diff at 1%); 2 (sign diff at 5%); 1 (sign diff at 10%)
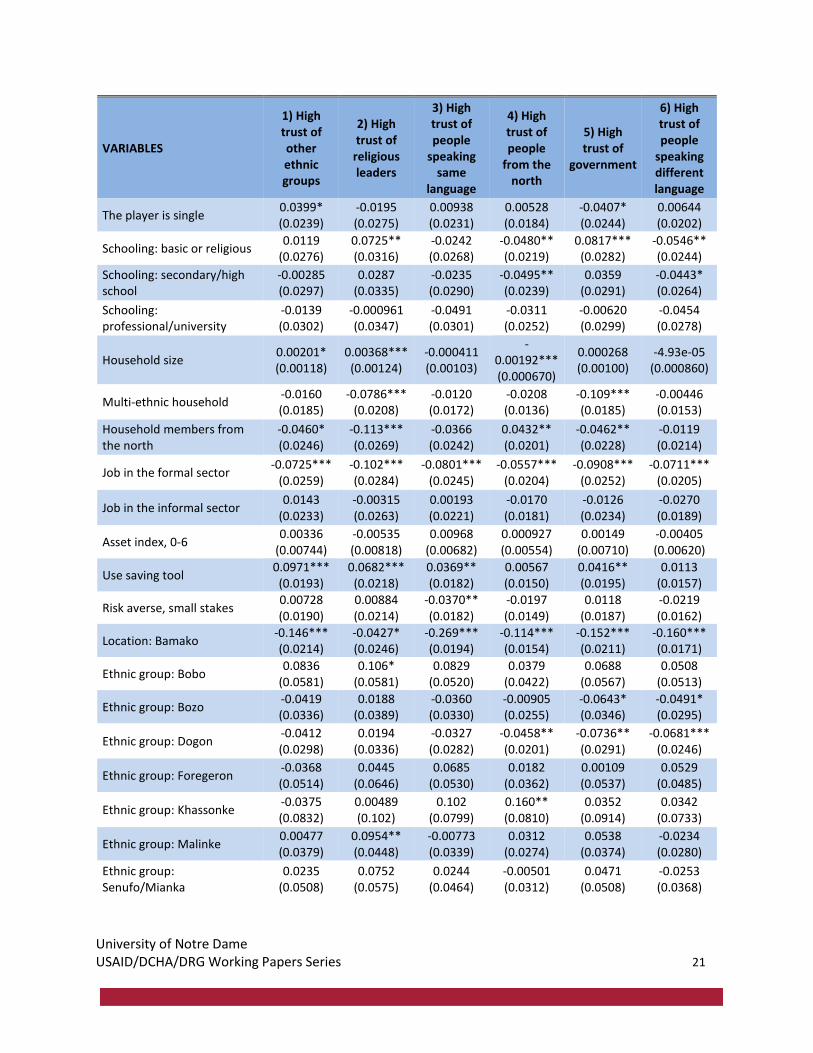
Table 10 shows results with linear probability models (LPMs) using OLS14 on six dependent variables linked to trust. Before making any comments linked to the coefficients, one must note the small R-square of each of our models, which indicates how little these rather long models can explain in the variations of our dependent variable. All coefficients of “member of grin” in Table 10 show that (with everything else being constant) grin members tend to show higher levels of trust than non-members. These coefficients for models 1-4 and 6 are significant and of relatively large size, and so membership seems to have an important impact.
Table 10: Estimating the Impact of Grin Membership on Trust Attitudes
VARIABLES
1) High trust of other ethnic groups
2) High trust of
religious leaders
3) High trust of people
speaking same
language
4) High trust of people
from the north
5) High trust of
government
6) High trust of people
speaking different language
Member of grin 0.106*** (0.0186)
0.145*** (0.0214)
0.152*** (0.0181)
0.0746*** (0.0135)
0.0103 (0.0196)
0.0485*** (0.0156)
Age 0.00134
(0.00150) -0.00131 (0.00170)
-0.00114 (0.00143)
-0.000151 (0.00110)
0.00104 (0.00153)
0.00121 (0.00138)
Player is female 0.0357
(0.0259) 0.0276
(0.0286) 0.0378
(0.0248) 0.0238
(0.0204) 0.0328
(0.0263) -0.0184 (0.0212)
14 All the regression results presented in the report and linked to estimations with a binary dependent variable model have also been done with both OLS (linear probability model) or probit/logit. Results never differ in substance and in most cases are similar. Because LPMs are easier to interpret, we often present these results.
University of Notre Dame USAID/DCHA/DRG Working Papers Series 21
VARIABLES
1) High trust of other ethnic groups
2) High trust of
religious leaders
3) High trust of people
speaking same
language
4) High trust of people
from the north
5) High trust of
government
6) High trust of people
speaking different language
The player is single 0.0399* (0.0239)
-0.0195 (0.0275)
0.00938 (0.0231)
0.00528 (0.0184)
-0.0407* (0.0244)
0.00644 (0.0202)
Schooling: basic or religious 0.0119
(0.0276) 0.0725** (0.0316)
-0.0242 (0.0268)
-0.0480** (0.0219)
0.0817*** (0.0282)
-0.0546** (0.0244)
Schooling: secondary/high school
-0.00285 (0.0297)
0.0287 (0.0335)
-0.0235 (0.0290)
-0.0495** (0.0239)
0.0359 (0.0291)
-0.0443* (0.0264)
Schooling: professional/university
-0.0139 (0.0302)
-0.000961 (0.0347)
-0.0491 (0.0301)
-0.0311 (0.0252)
-0.00620 (0.0299)
-0.0454 (0.0278)
Household size 0.00201* (0.00118)
0.00368*** (0.00124)
-0.000411 (0.00103)
-0.00192*** (0.000670)
0.000268 (0.00100)
-4.93e-05 (0.000860)
Multi-ethnic household -0.0160 (0.0185)
-0.0786*** (0.0208)
-0.0120 (0.0172)
-0.0208 (0.0136)
-0.109*** (0.0185)
-0.00446 (0.0153)
Household members from the north
-0.0460* (0.0246)
-0.113*** (0.0269)
-0.0366 (0.0242)
0.0432** (0.0201)
-0.0462** (0.0228)
-0.0119 (0.0214)
Job in the formal sector -0.0725***
(0.0259) -0.102*** (0.0284)
-0.0801*** (0.0245)
-0.0557*** (0.0204)
-0.0908*** (0.0252)
-0.0711*** (0.0205)
Job in the informal sector 0.0143
(0.0233) -0.00315 (0.0263)
0.00193 (0.0221)
-0.0170 (0.0181)
-0.0126 (0.0234)
-0.0270 (0.0189)
Asset index, 0-6 0.00336
(0.00744) -0.00535 (0.00818)
0.00968 (0.00682)
0.000927 (0.00554)
0.00149 (0.00710)
-0.00405 (0.00620)
Use saving tool 0.0971*** (0.0193)
0.0682*** (0.0218)
0.0369** (0.0182)
0.00567 (0.0150)
0.0416** (0.0195)
0.0113 (0.0157)
Risk averse, small stakes 0.00728 (0.0190)
0.00884 (0.0214)
-0.0370** (0.0182)
-0.0197 (0.0149)
0.0118 (0.0187)
-0.0219 (0.0162)
Location: Bamako -0.146*** (0.0214)
-0.0427* (0.0246)
-0.269*** (0.0194)
-0.114*** (0.0154)
-0.152*** (0.0211)
-0.160*** (0.0171)
Ethnic group: Bobo 0.0836
(0.0581) 0.106*
(0.0581) 0.0829
(0.0520) 0.0379
(0.0422) 0.0688
(0.0567) 0.0508
(0.0513)
Ethnic group: Bozo -0.0419 (0.0336)
0.0188 (0.0389)
-0.0360 (0.0330)
-0.00905 (0.0255)
-0.0643* (0.0346)
-0.0491* (0.0295)
Ethnic group: Dogon -0.0412 (0.0298)
0.0194 (0.0336)
-0.0327 (0.0282)
-0.0458** (0.0201)
-0.0736** (0.0291)
-0.0681*** (0.0246)
Ethnic group: Foregeron -0.0368 (0.0514)
0.0445 (0.0646)
0.0685 (0.0530)
0.0182 (0.0362)
0.00109 (0.0537)
0.0529 (0.0485)
Ethnic group: Khassonke -0.0375 (0.0832)
0.00489 (0.102)
0.102 (0.0799)
0.160** (0.0810)
0.0352 (0.0914)
0.0342 (0.0733)
Ethnic group: Malinke 0.00477 (0.0379)
0.0954** (0.0448)
-0.00773 (0.0339)
0.0312 (0.0274)
0.0538 (0.0374)
-0.0234 (0.0280)
Ethnic group: Senufo/Mianka
0.0235 (0.0508)
0.0752 (0.0575)
0.0244 (0.0464)
-0.00501 (0.0312)
0.0471 (0.0508)
-0.0253 (0.0368)
University of Notre Dame USAID/DCHA/DRG Working Papers Series 22
VARIABLES
1) High trust of other ethnic groups
2) High trust of
religious leaders
3) High trust of people
speaking same
language
4) High trust of people
from the north
5) High trust of
government
6) High trust of people
speaking different language
Ethnic group: Soninke 0.0380
(0.0385) 0.0601
(0.0426) 0.0462
(0.0358) 0.0469* (0.0267)
0.0479 (0.0381)
0.00257 (0.0292)
Ethnic group: Mossi 0.0350
(0.0904) -0.0670 (0.0909)
-0.0345 (0.0723)
0.0411 (0.0673)
-0.0128 (0.0818)
-0.0640 (0.0601)
Ethnic group: Peul -0.0226 (0.0254)
-0.00921 (0.0297)
-0.0148 (0.0241)
0.0386** (0.0195)
-0.00546 (0.0254)
-0.0270 (0.0209)
Ethnic group: Somono 0.128
(0.108) 0.227** (0.106)
0.328*** (0.0953)
-0.00368 (0.0800)
0.114 (0.104)
0.00751 (0.0926)
Ethnic group: Sonhrai 0.000115 (0.0349)
0.0757* (0.0392)
0.0595* (0.0355)
0.131*** (0.0320)
0.00265 (0.0339)
-0.0292 (0.0308)
Ethnic group: Arab, Bellat, or Tamasheq
0.0523 (0.0732)
0.208*** (0.0783)
0.00538 (0.0701)
0.136* (0.0721)
0.0834 (0.0767)
0.00214 (0.0663)
Constant 0.104
(0.0673) 0.343*** (0.0770)
0.298*** (0.0648)
0.189*** (0.0510)
0.326*** (0.0681)
0.265*** (0.0606)
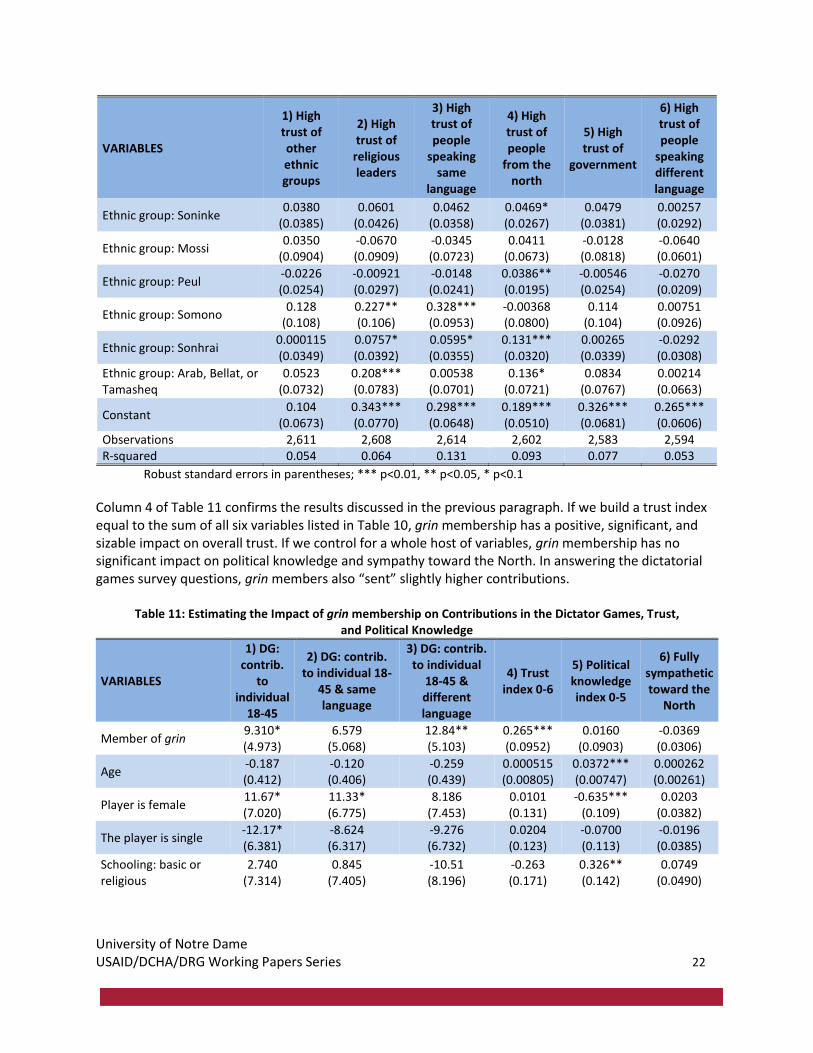
Observations 2,611 2,608 2,614 2,602 2,583 2,594 R-squared 0.054 0.064 0.131 0.093 0.077 0.053
Robust standard errors in parentheses; *** p<0.01, ** p<0.05, * p<0.1
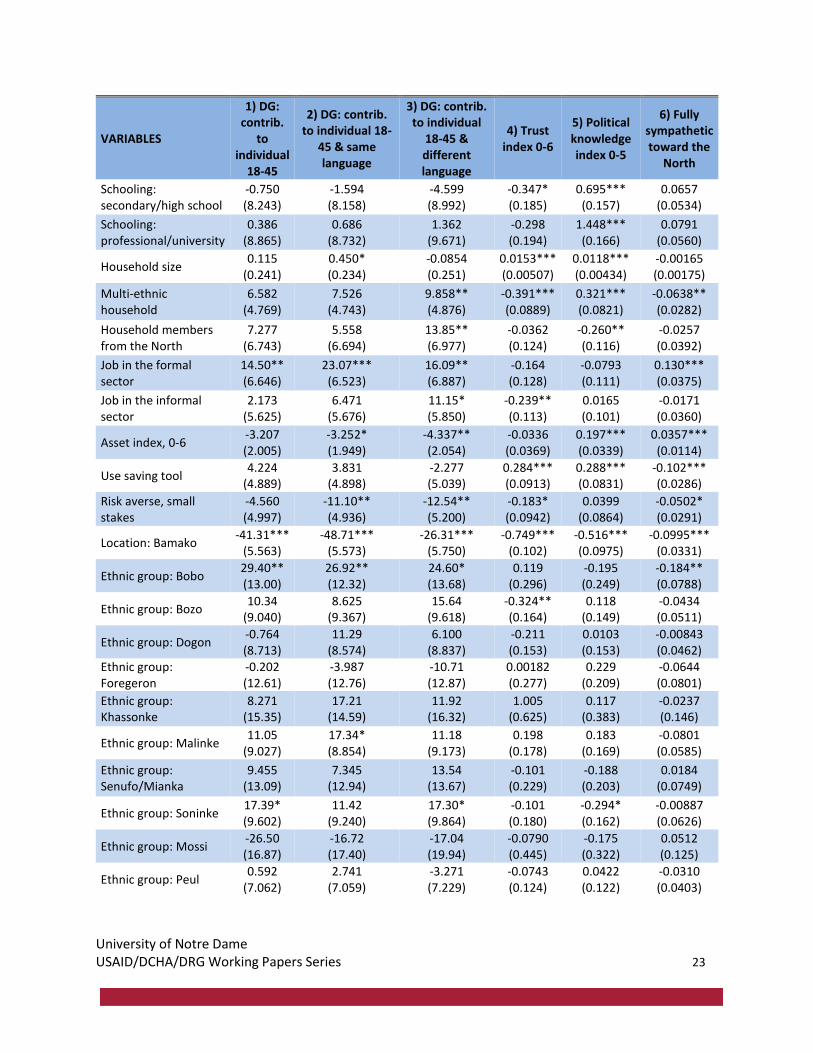
Column 4 of Table 11 confirms the results discussed in the previous paragraph. If we build a trust index equal to the sum of all six variables listed in Table 10, grin membership has a positive, significant, and sizable impact on overall trust. If we control for a whole host of variables, grin membership has no significant impact on political knowledge and sympathy toward the North. In answering the dictatorial games survey questions, grin members also “sent” slightly higher contributions.
Table 11: Estimating the Impact of grin membership on Contributions in the Dictator Games, Trust, and Political Knowledge
VARIABLES
1) DG: contrib.
to individual
18-45
2) DG: contrib. to individual 18-
45 & same language
3) DG: contrib. to individual
18-45 & different language
4) Trust index 0-6
5) Political knowledge index 0-5
6) Fully sympathetic toward the
North
Member of grin 9.310* (4.973)
6.579 (5.068)
12.84** (5.103)
0.265*** (0.0952)
0.0160 (0.0903)
-0.0369 (0.0306)
Age -0.187 (0.412)
-0.120 (0.406)
-0.259 (0.439)
0.000515 (0.00805)
0.0372*** (0.00747)
0.000262 (0.00261)
Player is female 11.67* (7.020)
11.33* (6.775)
8.186 (7.453)
0.0101 (0.131)
-0.635*** (0.109)
0.0203 (0.0382)
The player is single -12.17* (6.381)
-8.624 (6.317)
-9.276 (6.732)
0.0204 (0.123)
-0.0700 (0.113)
-0.0196 (0.0385)
Schooling: basic or religious
2.740 (7.314)
0.845 (7.405)
-10.51 (8.196)
-0.263 (0.171)
0.326** (0.142)
0.0749 (0.0490)
University of Notre Dame USAID/DCHA/DRG Working Papers Series 23
VARIABLES
1) DG: contrib.
to individual
18-45
2) DG: contrib. to individual 18-
45 & same language
3) DG: contrib. to individual
18-45 & different language
4) Trust index 0-6
5) Political knowledge index 0-5
6) Fully sympathetic toward the
North
Schooling: secondary/high school
-0.750 (8.243)
-1.594 (8.158)
-4.599 (8.992)
-0.347* (0.185)
0.695*** (0.157)
0.0657 (0.0534)
Schooling: professional/university
0.386 (8.865)
0.686 (8.732)
1.362 (9.671)
-0.298 (0.194)
1.448*** (0.166)
0.0791 (0.0560)
Household size 0.115
(0.241) 0.450* (0.234)
-0.0854 (0.251)
0.0153*** (0.00507)
0.0118*** (0.00434)
-0.00165 (0.00175)
Multi-ethnic household
6.582 (4.769)
7.526 (4.743)
9.858** (4.876)
-0.391*** (0.0889)
0.321*** (0.0821)
-0.0638** (0.0282)
Household members from the North
7.277 (6.743)
5.558 (6.694)
13.85** (6.977)
-0.0362 (0.124)
-0.260** (0.116)
-0.0257 (0.0392)
Job in the formal sector
14.50** (6.646)
23.07*** (6.523)
16.09** (6.887)
-0.164 (0.128)
-0.0793 (0.111)
0.130*** (0.0375)
Job in the informal sector
2.173 (5.625)
6.471 (5.676)
11.15* (5.850)
-0.239** (0.113)
0.0165 (0.101)
-0.0171 (0.0360)
Asset index, 0-6 -3.207 (2.005)
-3.252* (1.949)
-4.337** (2.054)
-0.0336 (0.0369)
0.197*** (0.0339)
0.0357*** (0.0114)
Use saving tool 4.224
(4.889) 3.831
(4.898) -2.277 (5.039)
0.284*** (0.0913)
0.288*** (0.0831)
-0.102*** (0.0286)
Risk averse, small stakes
-4.560 (4.997)
-11.10** (4.936)
-12.54** (5.200)
-0.183* (0.0942)
0.0399 (0.0864)
-0.0502* (0.0291)
Location: Bamako -41.31***
(5.563) -48.71***
(5.573) -26.31***
(5.750) -0.749***
(0.102) -0.516*** (0.0975)
-0.0995*** (0.0331)
Ethnic group: Bobo 29.40** (13.00)
26.92** (12.32)
24.60* (13.68)
0.119 (0.296)
-0.195 (0.249)
-0.184** (0.0788)
Ethnic group: Bozo 10.34
(9.040) 8.625
(9.367) 15.64
(9.618) -0.324** (0.164)
0.118 (0.149)
-0.0434 (0.0511)
Ethnic group: Dogon -0.764 (8.713)
11.29 (8.574)
6.100 (8.837)
-0.211 (0.153)
0.0103 (0.153)
-0.00843 (0.0462)
Ethnic group: Foregeron
-0.202 (12.61)
-3.987 (12.76)
-10.71 (12.87)
0.00182 (0.277)
0.229 (0.209)
-0.0644 (0.0801)
Ethnic group: Khassonke
8.271 (15.35)
17.21 (14.59)
11.92 (16.32)
1.005 (0.625)
0.117 (0.383)
-0.0237 (0.146)
Ethnic group: Malinke 11.05
(9.027) 17.34* (8.854)
11.18 (9.173)
0.198 (0.178)
0.183 (0.169)
-0.0801 (0.0585)
Ethnic group: Senufo/Mianka
9.455 (13.09)
7.345 (12.94)
13.54 (13.67)
-0.101 (0.229)
-0.188 (0.203)
0.0184 (0.0749)
Ethnic group: Soninke 17.39* (9.602)
11.42 (9.240)
17.30* (9.864)
-0.101 (0.180)
-0.294* (0.162)
-0.00887 (0.0626)
Ethnic group: Mossi -26.50 (16.87)
-16.72 (17.40)
-17.04 (19.94)
-0.0790 (0.445)
-0.175 (0.322)
0.0512 (0.125)
Ethnic group: Peul 0.592
(7.062) 2.741
(7.059) -3.271 (7.229)
-0.0743 (0.124)
0.0422 (0.122)
-0.0310 (0.0403)
University of Notre Dame USAID/DCHA/DRG Working Papers Series 24
VARIABLES
1) DG: contrib.
to individual
18-45
2) DG: contrib. to individual 18-
45 & same language
3) DG: contrib. to individual
18-45 & different language
4) Trust index 0-6
5) Political knowledge index 0-5
6) Fully sympathetic toward the
North
Ethnic group: Somono 25.28
(24.48) 29.53
(23.95) 68.99** (28.01)
0.797* (0.456)
0.393 (0.643)
-0.427*** (0.137)
Ethnic group: Sonhrai 3.098
(10.01) 7.334
(10.10) -1.860 (10.44)
0.0574 (0.174)
-0.00614 (0.162)
-0.0668 (0.0541)
Ethnic group: Arab, Bellat, or Tamasheq
-18.96 (20.99)
-17.76 (19.92)
-18.25 (20.33)
0.257 (0.423)
0.241 (0.306)
-0.199 (0.123)
Constant 189.0*** (18.29)
191.2*** (18.06)
185.1*** (19.86)
1.994*** (0.371)
0.105 (0.324)
0.686*** (0.113)
Observations 1,353 1,353 1,353 1,353 1,353 1,353 R-squared 0.114 0.146 0.083 0.108 0.244 0.062
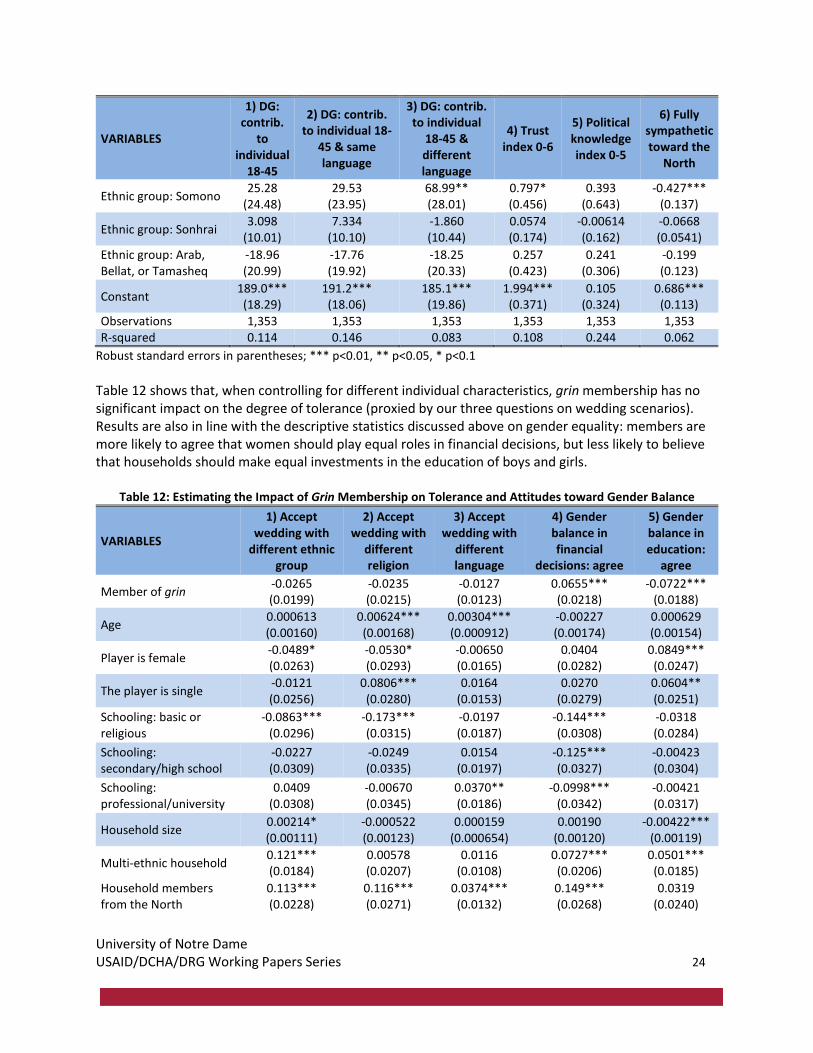
Robust standard errors in parentheses; *** p<0.01, ** p<0.05, * p<0.1
Table 12 shows that, when controlling for different individual characteristics, grin membership has no significant impact on the degree of tolerance (proxied by our three questions on wedding scenarios). Results are also in line with the descriptive statistics discussed above on gender equality: members are more likely to agree that women should play equal roles in financial decisions, but less likely to believe that households should make equal investments in the education of boys and girls.
Table 12: Estimating the Impact of Grin Membership on Tolerance and Attitudes toward Gender Balance
VARIABLES
1) Accept wedding with
different ethnic group
2) Accept wedding with
different religion
3) Accept wedding with
different language
4) Gender balance in financial
decisions: agree
5) Gender balance in education:
agree
Member of grin -0.0265 (0.0199)
-0.0235 (0.0215)
-0.0127 (0.0123)
0.0655*** (0.0218)
-0.0722*** (0.0188)
Age 0.000613 (0.00160)
0.00624*** (0.00168)
0.00304*** (0.000912)
-0.00227 (0.00174)
0.000629 (0.00154)
Player is female -0.0489* (0.0263)
-0.0530* (0.0293)
-0.00650 (0.0165)
0.0404 (0.0282)
0.0849*** (0.0247)
The player is single -0.0121 (0.0256)
0.0806*** (0.0280)
0.0164 (0.0153)
0.0270 (0.0279)
0.0604** (0.0251)
Schooling: basic or religious
-0.0863*** (0.0296)
-0.173*** (0.0315)
-0.0197 (0.0187)
-0.144*** (0.0308)
-0.0318 (0.0284)
Schooling: secondary/high school
-0.0227 (0.0309)
-0.0249 (0.0335)
0.0154 (0.0197)
-0.125*** (0.0327)
-0.00423 (0.0304)
Schooling: professional/university
0.0409 (0.0308)
-0.00670 (0.0345)
0.0370** (0.0186)
-0.0998*** (0.0342)
-0.00421 (0.0317)
Household size 0.00214* (0.00111)
-0.000522 (0.00123)
0.000159 (0.000654)
0.00190 (0.00120)
-0.00422*** (0.00119)
Multi-ethnic household 0.121*** (0.0184)
0.00578 (0.0207)
0.0116 (0.0108)
0.0727*** (0.0206)
0.0501*** (0.0185)
Household members from the North
0.113*** (0.0228)
0.116*** (0.0271)
0.0374*** (0.0132)
0.149*** (0.0268)
0.0319 (0.0240)
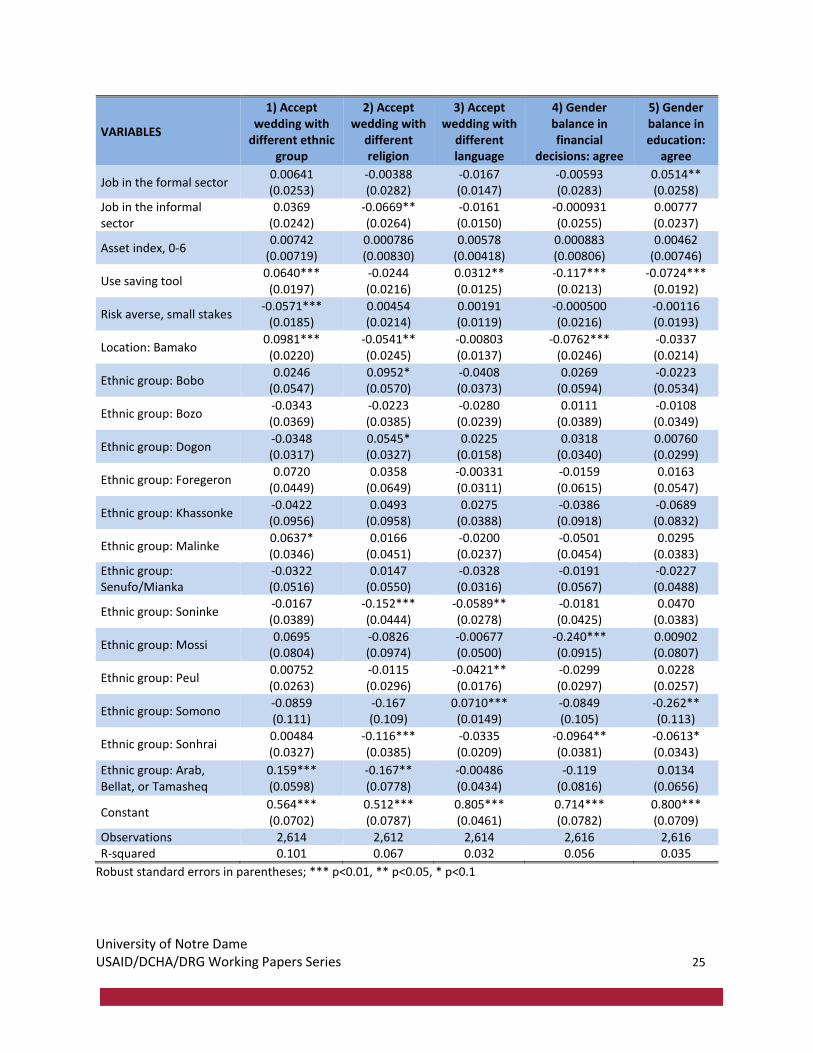
University of Notre Dame USAID/DCHA/DRG Working Papers Series 25
VARIABLES
1) Accept wedding with
different ethnic group
2) Accept wedding with
different religion
3) Accept wedding with
different language
4) Gender balance in financial
decisions: agree
5) Gender balance in education:
agree
Job in the formal sector 0.00641 (0.0253)
-0.00388 (0.0282)
-0.0167 (0.0147)
-0.00593 (0.0283)
0.0514** (0.0258)
Job in the informal sector
0.0369 (0.0242)
-0.0669** (0.0264)
-0.0161 (0.0150)
-0.000931 (0.0255)
0.00777 (0.0237)
Asset index, 0-6 0.00742
(0.00719) 0.000786 (0.00830)
0.00578 (0.00418)
0.000883 (0.00806)
0.00462 (0.00746)
Use saving tool 0.0640*** (0.0197)
-0.0244 (0.0216)
0.0312** (0.0125)
-0.117*** (0.0213)
-0.0724*** (0.0192)
Risk averse, small stakes -0.0571***
(0.0185) 0.00454 (0.0214)
0.00191 (0.0119)
-0.000500 (0.0216)
-0.00116 (0.0193)
Location: Bamako 0.0981*** (0.0220)
-0.0541** (0.0245)
-0.00803 (0.0137)
-0.0762*** (0.0246)
-0.0337 (0.0214)
Ethnic group: Bobo 0.0246
(0.0547) 0.0952* (0.0570)
-0.0408 (0.0373)
0.0269 (0.0594)
-0.0223 (0.0534)
Ethnic group: Bozo -0.0343 (0.0369)
-0.0223 (0.0385)
-0.0280 (0.0239)
0.0111 (0.0389)
-0.0108 (0.0349)
Ethnic group: Dogon -0.0348 (0.0317)
0.0545* (0.0327)
0.0225 (0.0158)
0.0318 (0.0340)
0.00760 (0.0299)
Ethnic group: Foregeron 0.0720
(0.0449) 0.0358
(0.0649) -0.00331 (0.0311)
-0.0159 (0.0615)
0.0163 (0.0547)
Ethnic group: Khassonke -0.0422 (0.0956)
0.0493 (0.0958)
0.0275 (0.0388)
-0.0386 (0.0918)
-0.0689 (0.0832)
Ethnic group: Malinke 0.0637* (0.0346)
0.0166 (0.0451)
-0.0200 (0.0237)
-0.0501 (0.0454)
0.0295 (0.0383)
Ethnic group: Senufo/Mianka
-0.0322 (0.0516)
0.0147 (0.0550)
-0.0328 (0.0316)
-0.0191 (0.0567)
-0.0227 (0.0488)
Ethnic group: Soninke -0.0167 (0.0389)
-0.152*** (0.0444)
-0.0589** (0.0278)
-0.0181 (0.0425)
0.0470 (0.0383)
Ethnic group: Mossi 0.0695
(0.0804) -0.0826 (0.0974)
-0.00677 (0.0500)
-0.240*** (0.0915)
0.00902 (0.0807)
Ethnic group: Peul 0.00752 (0.0263)
-0.0115 (0.0296)
-0.0421** (0.0176)
-0.0299 (0.0297)
0.0228 (0.0257)
Ethnic group: Somono -0.0859 (0.111)
-0.167 (0.109)
0.0710*** (0.0149)
-0.0849 (0.105)
-0.262** (0.113)
Ethnic group: Sonhrai 0.00484 (0.0327)
-0.116*** (0.0385)
-0.0335 (0.0209)
-0.0964** (0.0381)
-0.0613* (0.0343)
Ethnic group: Arab, Bellat, or Tamasheq
0.159*** (0.0598)
-0.167** (0.0778)
-0.00486 (0.0434)
-0.119 (0.0816)
0.0134 (0.0656)
Constant 0.564*** (0.0702)
0.512*** (0.0787)
0.805*** (0.0461)
0.714*** (0.0782)
0.800*** (0.0709)
Observations 2,614 2,612 2,614 2,616 2,616 R-squared 0.101 0.067 0.032 0.056 0.035
Robust standard errors in parentheses; *** p<0.01, ** p<0.05, * p<0.1
University of Notre Dame USAID/DCHA/DRG Working Papers Series 26
C. Results: Research Question 2 Below are the results for our second research question: Which types of grins best foster trust, tolerance, political knowledge, and willingness to provide public goods to in-group members, but also to out-group members? The literature suggests that diversity of membership is a key driver of generalizable trust and tolerance toward out-group members. Thus, we expect that diverse groups will be more effective in fostering trust of people outside their grin.15 Given the current ethnic and North/South tensions in Mali, we put particular emphasis on measuring whether grins, which include members from different ethnic groups and/or politically opposed cleavages, have more tolerant attitudes toward different types of out-group members than grins that are more homogenous in composition.16 First, we considered how individual attitudes vary when individuals belong to grins with different characteristics. In particular, we focus our attention on three categorizations of grins: 1) gender composition—whether a grin is male-only, female-only, or mixed-gender; 2) level of ethnic heterogeneity—a group is homogeneous if more than a half of its members is from the same ethnic group, if not it is labeled as heterogeneous; and 3) whether a grin is a neighborhood grin. Table 13 reports the differences in means of the key variables considered so far and linked to trust, political knowledge, and tolerance for individuals belonging to male-only grins versus mixed-gender or female-only grins. In our sample, 56% of members are in male-only grins, about 30% are in mixed-gender grins, and 14% are from female-only grins. Individuals belonging to male-only grins seem less likely to contribute public goods in terms of religious charity and voluntary work, but do not differ much from individuals from mixed-gender or female-only grins in public engagement (measured as attending meetings, coming together with others to solve problems, participating in protests). Political knowledge is significantly higher in male-only grins. This finding is unsurprising: higher political knowledge is also correlated with higher levels of education, and male respondents had higher levels of education than female respondents and grin members had higher levels of education than non-members. Our data seem to indicate that members of male-only grins have lower levels of trust than members of mixed-gender grins; this finding is confirmed by several negative and significant differences in the share of people declaring to feel high trust of: other ethnic groups, people speaking both the same and different language, the government, people from the North, or other grin members. The “dictator game” survey questions are in line with the previous findings: individuals from male-only grins would contribute significantly less and would expect lower return contributions.
15 Stolle (2002) explains that group characteristics representative of the people one knows are extended to other members of society with those same descriptive characteristics. 16 We will look at other group differences in organization and membership (for instance, whether groups are same gender or mixed) to see if there is an effect of broader features of group differences on in-group and out-group trust and cooperation.
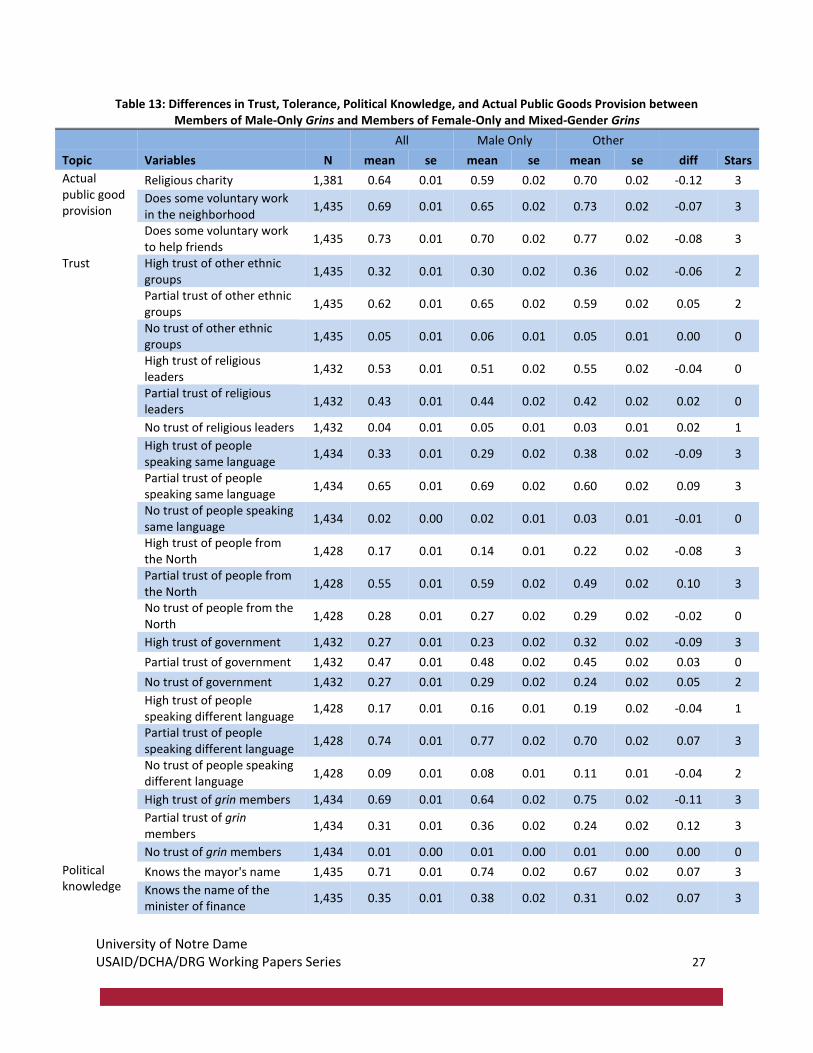
University of Notre Dame USAID/DCHA/DRG Working Papers Series 27
Table 13: Differences in Trust, Tolerance, Political Knowledge, and Actual Public Goods Provision between Members of Male-Only Grins and Members of Female-Only and Mixed-Gender Grins
All Male Only Other
Topic Variables N mean se mean se mean se diff Stars
Actual public good provision
Religious charity 1,381 0.64 0.01 0.59 0.02 0.70 0.02 -0.12 3
Does some voluntary work in the neighborhood
1,435 0.69 0.01 0.65 0.02 0.73 0.02 -0.07 3
Does some voluntary work to help friends
1,435 0.73 0.01 0.70 0.02 0.77 0.02 -0.08 3
Trust High trust of other ethnic groups
1,435 0.32 0.01 0.30 0.02 0.36 0.02 -0.06 2
Partial trust of other ethnic groups
1,435 0.62 0.01 0.65 0.02 0.59 0.02 0.05 2
No trust of other ethnic groups
1,435 0.05 0.01 0.06 0.01 0.05 0.01 0.00 0
High trust of religious leaders
1,432 0.53 0.01 0.51 0.02 0.55 0.02 -0.04 0
Partial trust of religious leaders
1,432 0.43 0.01 0.44 0.02 0.42 0.02 0.02 0
No trust of religious leaders 1,432 0.04 0.01 0.05 0.01 0.03 0.01 0.02 1
High trust of people speaking same language
1,434 0.33 0.01 0.29 0.02 0.38 0.02 -0.09 3
Partial trust of people speaking same language
1,434 0.65 0.01 0.69 0.02 0.60 0.02 0.09 3
No trust of people speaking same language
1,434 0.02 0.00 0.02 0.01 0.03 0.01 -0.01 0
High trust of people from the North
1,428 0.17 0.01 0.14 0.01 0.22 0.02 -0.08 3
Partial trust of people from the North
1,428 0.55 0.01 0.59 0.02 0.49 0.02 0.10 3
No trust of people from the North
1,428 0.28 0.01 0.27 0.02 0.29 0.02 -0.02 0
High trust of government 1,432 0.27 0.01 0.23 0.02 0.32 0.02 -0.09 3
Partial trust of government 1,432 0.47 0.01 0.48 0.02 0.45 0.02 0.03 0
No trust of government 1,432 0.27 0.01 0.29 0.02 0.24 0.02 0.05 2
High trust of people speaking different language
1,428 0.17 0.01 0.16 0.01 0.19 0.02 -0.04 1
Partial trust of people speaking different language
1,428 0.74 0.01 0.77 0.02 0.70 0.02 0.07 3
No trust of people speaking different language
1,428 0.09 0.01 0.08 0.01 0.11 0.01 -0.04 2
High trust of grin members 1,434 0.69 0.01 0.64 0.02 0.75 0.02 -0.11 3
Partial trust of grin members
1,434 0.31 0.01 0.36 0.02 0.24 0.02 0.12 3
No trust of grin members 1,434 0.01 0.00 0.01 0.00 0.01 0.00 0.00 0
Political knowledge
Knows the mayor's name 1,435 0.71 0.01 0.74 0.02 0.67 0.02 0.07 3
Knows the name of the minister of finance
1,435 0.35 0.01 0.38 0.02 0.31 0.02 0.07 3
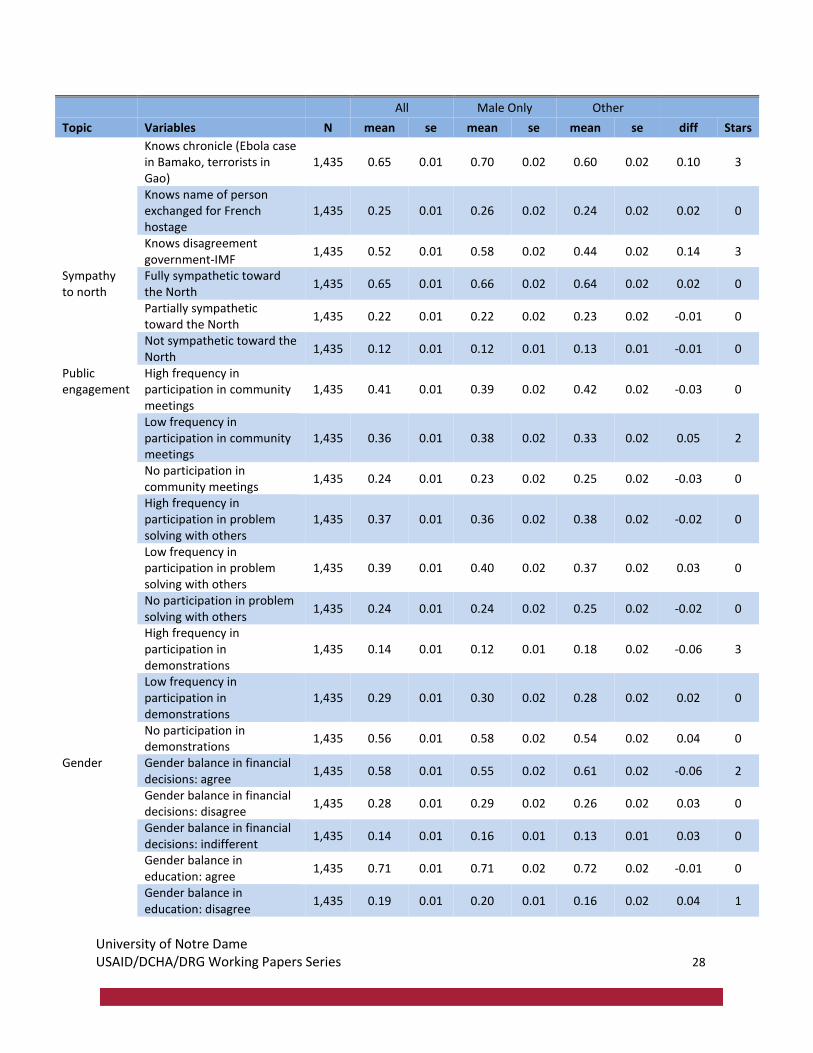
University of Notre Dame USAID/DCHA/DRG Working Papers Series 28
All Male Only Other
Topic Variables N mean se mean se mean se diff Stars
Knows chronicle (Ebola case in Bamako, terrorists in Gao)
1,435 0.65 0.01 0.70 0.02 0.60 0.02 0.10 3
Knows name of person exchanged for French hostage
1,435 0.25 0.01 0.26 0.02 0.24 0.02 0.02 0
Knows disagreement government-IMF
1,435 0.52 0.01 0.58 0.02 0.44 0.02 0.14 3
Sympathy to north
Fully sympathetic toward the North
1,435 0.65 0.01 0.66 0.02 0.64 0.02 0.02 0
Partially sympathetic toward the North
1,435 0.22 0.01 0.22 0.02 0.23 0.02 -0.01 0
Not sympathetic toward the North
1,435 0.12 0.01 0.12 0.01 0.13 0.01 -0.01 0
Public engagement
High frequency in participation in community meetings
1,435 0.41 0.01 0.39 0.02 0.42 0.02 -0.03 0
Low frequency in participation in community meetings
1,435 0.36 0.01 0.38 0.02 0.33 0.02 0.05 2
No participation in community meetings
1,435 0.24 0.01 0.23 0.02 0.25 0.02 -0.03 0
High frequency in participation in problem solving with others
1,435 0.37 0.01 0.36 0.02 0.38 0.02 -0.02 0
Low frequency in participation in problem solving with others
1,435 0.39 0.01 0.40 0.02 0.37 0.02 0.03 0
No participation in problem solving with others
1,435 0.24 0.01 0.24 0.02 0.25 0.02 -0.02 0
High frequency in participation in demonstrations
1,435 0.14 0.01 0.12 0.01 0.18 0.02 -0.06 3
Low frequency in participation in demonstrations
1,435 0.29 0.01 0.30 0.02 0.28 0.02 0.02 0
No participation in demonstrations
1,435 0.56 0.01 0.58 0.02 0.54 0.02 0.04 0
Gender Gender balance in financial decisions: agree
1,435 0.58 0.01 0.55 0.02 0.61 0.02 -0.06 2
Gender balance in financial decisions: disagree
1,435 0.28 0.01 0.29 0.02 0.26 0.02 0.03 0
Gender balance in financial decisions: indifferent
1,435 0.14 0.01 0.16 0.01 0.13 0.01 0.03 0
Gender balance in education: agree
1,435 0.71 0.01 0.71 0.02 0.72 0.02 -0.01 0
Gender balance in education: disagree
1,435 0.19 0.01 0.20 0.01 0.16 0.02 0.04 1
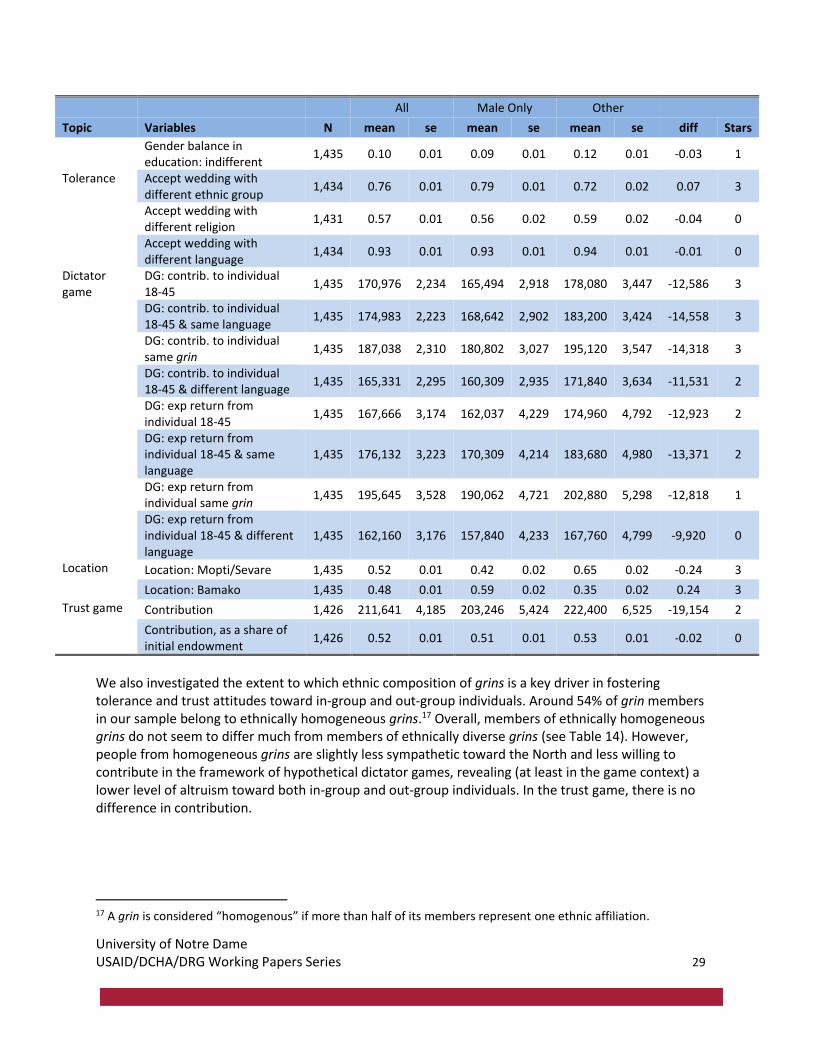
University of Notre Dame USAID/DCHA/DRG Working Papers Series 29
All Male Only Other
Topic Variables N mean se mean se mean se diff Stars
Gender balance in education: indifferent
1,435 0.10 0.01 0.09 0.01 0.12 0.01 -0.03 1
Tolerance Accept wedding with different ethnic group
1,434 0.76 0.01 0.79 0.01 0.72 0.02 0.07 3
Accept wedding with different religion
1,431 0.57 0.01 0.56 0.02 0.59 0.02 -0.04 0
Accept wedding with different language
1,434 0.93 0.01 0.93 0.01 0.94 0.01 -0.01 0
Dictator game
DG: contrib. to individual 18-45
1,435 170,976 2,234 165,494 2,918 178,080 3,447 -12,586 3
DG: contrib. to individual 18-45 & same language
1,435 174,983 2,223 168,642 2,902 183,200 3,424 -14,558 3
DG: contrib. to individual same grin
1,435 187,038 2,310 180,802 3,027 195,120 3,547 -14,318 3
DG: contrib. to individual 18-45 & different language
1,435 165,331 2,295 160,309 2,935 171,840 3,634 -11,531 2
DG: exp return from individual 18-45
1,435 167,666 3,174 162,037 4,229 174,960 4,792 -12,923 2
DG: exp return from individual 18-45 & same language
1,435 176,132 3,223 170,309 4,214 183,680 4,980 -13,371 2
DG: exp return from individual same grin
1,435 195,645 3,528 190,062 4,721 202,880 5,298 -12,818 1
DG: exp return from individual 18-45 & different language
1,435 162,160 3,176 157,840 4,233 167,760 4,799 -9,920 0
Location Location: Mopti/Sevare 1,435 0.52 0.01 0.42 0.02 0.65 0.02 -0.24 3
Location: Bamako 1,435 0.48 0.01 0.59 0.02 0.35 0.02 0.24 3
Trust game Contribution 1,426 211,641 4,185 203,246 5,424 222,400 6,525 -19,154 2
Contribution, as a share of initial endowment
1,426 0.52 0.01 0.51 0.01 0.53 0.01 -0.02 0
We also investigated the extent to which ethnic composition of grins is a key driver in fostering tolerance and trust attitudes toward in-group and out-group individuals. Around 54% of grin members in our sample belong to ethnically homogeneous grins.17 Overall, members of ethnically homogeneous grins do not seem to differ much from members of ethnically diverse grins (see Table 14). However, people from homogeneous grins are slightly less sympathetic toward the North and less willing to contribute in the framework of hypothetical dictator games, revealing (at least in the game context) a lower level of altruism toward both in-group and out-group individuals. In the trust game, there is no difference in contribution.
17 A grin is considered “homogenous” if more than half of its members represent one ethnic affiliation.
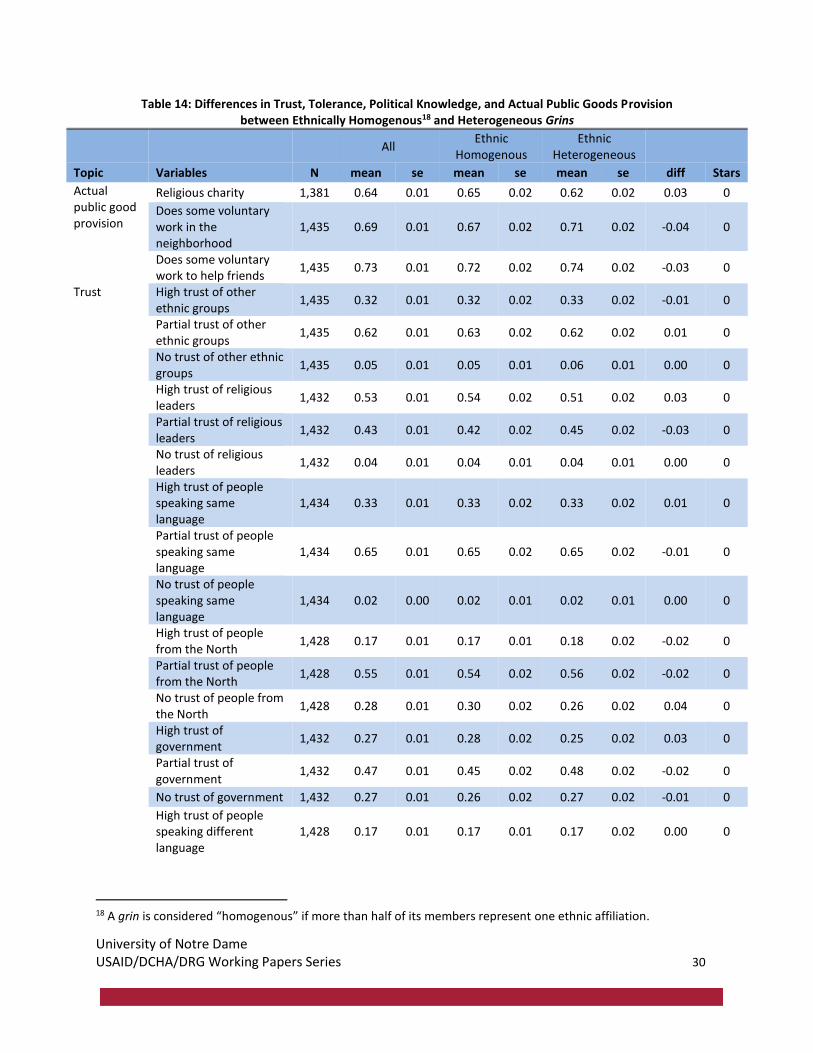
University of Notre Dame USAID/DCHA/DRG Working Papers Series 30
Table 14: Differences in Trust, Tolerance, Political Knowledge, and Actual Public Goods Provision between Ethnically Homogenous18 and Heterogeneous Grins
All Ethnic
Homogenous Ethnic
Heterogeneous
Topic Variables N mean se mean se mean se diff Stars
Actual public good provision
Religious charity 1,381 0.64 0.01 0.65 0.02 0.62 0.02 0.03 0
Does some voluntary work in the neighborhood
1,435 0.69 0.01 0.67 0.02 0.71 0.02 -0.04 0
Does some voluntary work to help friends
1,435 0.73 0.01 0.72 0.02 0.74 0.02 -0.03 0
Trust High trust of other ethnic groups
1,435 0.32 0.01 0.32 0.02 0.33 0.02 -0.01 0
Partial trust of other ethnic groups
1,435 0.62 0.01 0.63 0.02 0.62 0.02 0.01 0
No trust of other ethnic groups
1,435 0.05 0.01 0.05 0.01 0.06 0.01 0.00 0
High trust of religious leaders
1,432 0.53 0.01 0.54 0.02 0.51 0.02 0.03 0
Partial trust of religious leaders
1,432 0.43 0.01 0.42 0.02 0.45 0.02 -0.03 0
No trust of religious leaders
1,432 0.04 0.01 0.04 0.01 0.04 0.01 0.00 0
High trust of people speaking same language
1,434 0.33 0.01 0.33 0.02 0.33 0.02 0.01 0
Partial trust of people speaking same language
1,434 0.65 0.01 0.65 0.02 0.65 0.02 -0.01 0
No trust of people speaking same language
1,434 0.02 0.00 0.02 0.01 0.02 0.01 0.00 0
High trust of people from the North
1,428 0.17 0.01 0.17 0.01 0.18 0.02 -0.02 0
Partial trust of people from the North
1,428 0.55 0.01 0.54 0.02 0.56 0.02 -0.02 0
No trust of people from the North
1,428 0.28 0.01 0.30 0.02 0.26 0.02 0.04 0
High trust of government
1,432 0.27 0.01 0.28 0.02 0.25 0.02 0.03 0
Partial trust of government
1,432 0.47 0.01 0.45 0.02 0.48 0.02 -0.02 0
No trust of government 1,432 0.27 0.01 0.26 0.02 0.27 0.02 -0.01 0
High trust of people speaking different language
1,428 0.17 0.01 0.17 0.01 0.17 0.02 0.00 0
18 A grin is considered “homogenous” if more than half of its members represent one ethnic affiliation.
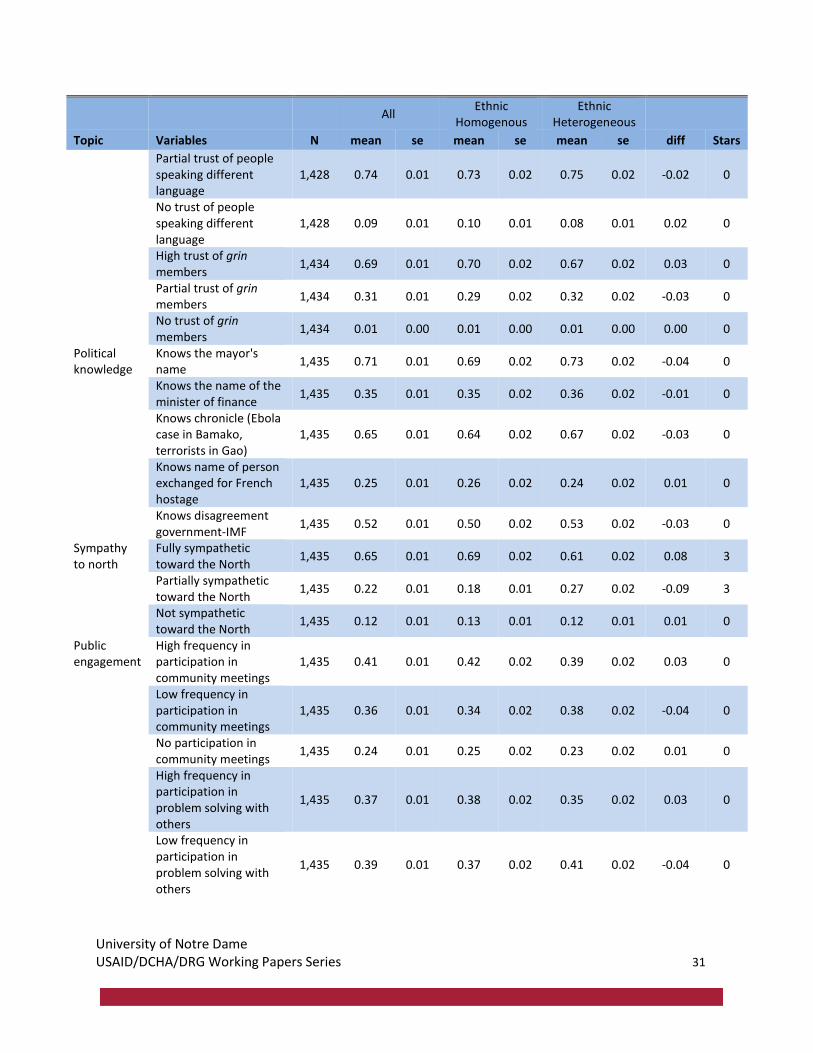
University of Notre Dame USAID/DCHA/DRG Working Papers Series 31
All Ethnic
Homogenous Ethnic
Heterogeneous
Topic Variables N mean se mean se mean se diff Stars
Partial trust of people speaking different language
1,428 0.74 0.01 0.73 0.02 0.75 0.02 -0.02 0
No trust of people speaking different language
1,428 0.09 0.01 0.10 0.01 0.08 0.01 0.02 0
High trust of grin members
1,434 0.69 0.01 0.70 0.02 0.67 0.02 0.03 0
Partial trust of grin members
1,434 0.31 0.01 0.29 0.02 0.32 0.02 -0.03 0
No trust of grin members
1,434 0.01 0.00 0.01 0.00 0.01 0.00 0.00 0
Political knowledge
Knows the mayor's name
1,435 0.71 0.01 0.69 0.02 0.73 0.02 -0.04 0
Knows the name of the minister of finance
1,435 0.35 0.01 0.35 0.02 0.36 0.02 -0.01 0
Knows chronicle (Ebola case in Bamako, terrorists in Gao)
1,435 0.65 0.01 0.64 0.02 0.67 0.02 -0.03 0
Knows name of person exchanged for French hostage
1,435 0.25 0.01 0.26 0.02 0.24 0.02 0.01 0
Knows disagreement government-IMF
1,435 0.52 0.01 0.50 0.02 0.53 0.02 -0.03 0
Sympathy to north
Fully sympathetic toward the North
1,435 0.65 0.01 0.69 0.02 0.61 0.02 0.08 3
Partially sympathetic toward the North
1,435 0.22 0.01 0.18 0.01 0.27 0.02 -0.09 3
Not sympathetic toward the North
1,435 0.12 0.01 0.13 0.01 0.12 0.01 0.01 0
Public engagement
High frequency in participation in community meetings
1,435 0.41 0.01 0.42 0.02 0.39 0.02 0.03 0
Low frequency in participation in community meetings
1,435 0.36 0.01 0.34 0.02 0.38 0.02 -0.04 0
No participation in community meetings
1,435 0.24 0.01 0.25 0.02 0.23 0.02 0.01 0
High frequency in participation in problem solving with others
1,435 0.37 0.01 0.38 0.02 0.35 0.02 0.03 0
Low frequency in participation in problem solving with others
1,435 0.39 0.01 0.37 0.02 0.41 0.02 -0.04 0
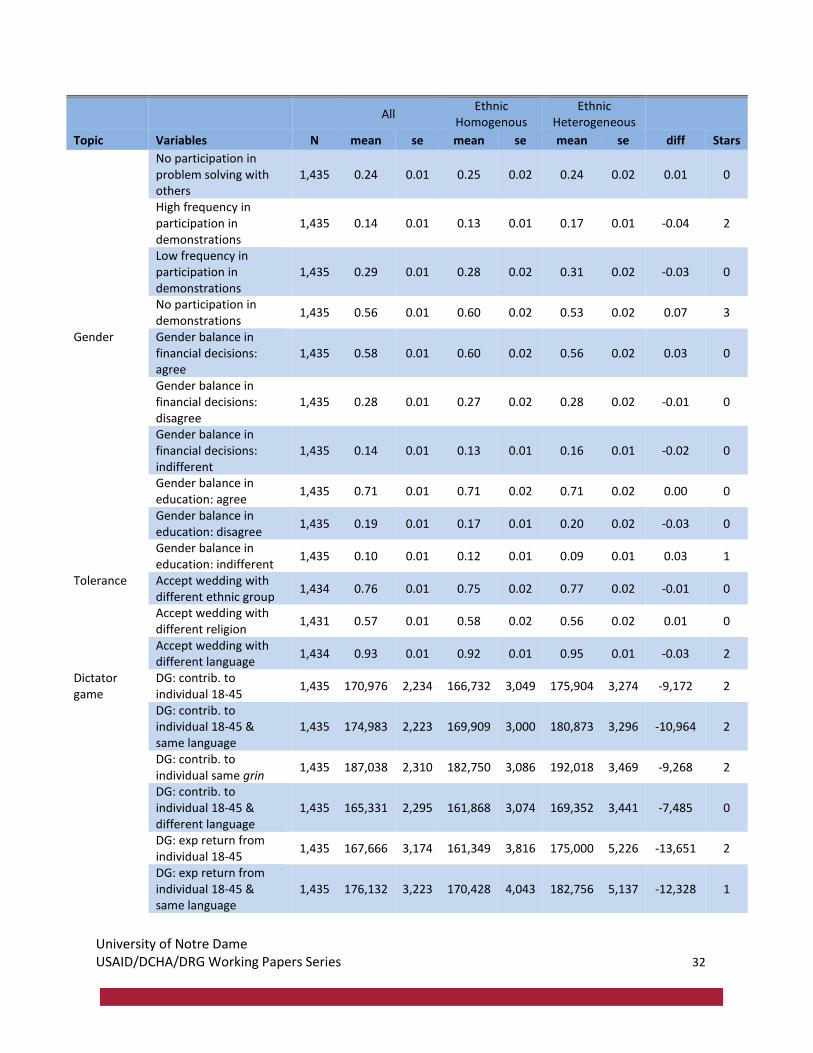
University of Notre Dame USAID/DCHA/DRG Working Papers Series 32
All Ethnic
Homogenous Ethnic
Heterogeneous
Topic Variables N mean se mean se mean se diff Stars
No participation in problem solving with others
1,435 0.24 0.01 0.25 0.02 0.24 0.02 0.01 0
High frequency in participation in demonstrations
1,435 0.14 0.01 0.13 0.01 0.17 0.01 -0.04 2
Low frequency in participation in demonstrations
1,435 0.29 0.01 0.28 0.02 0.31 0.02 -0.03 0
No participation in demonstrations
1,435 0.56 0.01 0.60 0.02 0.53 0.02 0.07 3
Gender Gender balance in financial decisions: agree
1,435 0.58 0.01 0.60 0.02 0.56 0.02 0.03 0
Gender balance in financial decisions: disagree
1,435 0.28 0.01 0.27 0.02 0.28 0.02 -0.01 0
Gender balance in financial decisions: indifferent
1,435 0.14 0.01 0.13 0.01 0.16 0.01 -0.02 0
Gender balance in education: agree
1,435 0.71 0.01 0.71 0.02 0.71 0.02 0.00 0
Gender balance in education: disagree
1,435 0.19 0.01 0.17 0.01 0.20 0.02 -0.03 0
Gender balance in education: indifferent
1,435 0.10 0.01 0.12 0.01 0.09 0.01 0.03 1
Tolerance Accept wedding with different ethnic group
1,434 0.76 0.01 0.75 0.02 0.77 0.02 -0.01 0
Accept wedding with different religion
1,431 0.57 0.01 0.58 0.02 0.56 0.02 0.01 0
Accept wedding with different language
1,434 0.93 0.01 0.92 0.01 0.95 0.01 -0.03 2
Dictator game
DG: contrib. to individual 18-45
1,435 170,976 2,234 166,732 3,049 175,904 3,274 -9,172 2
DG: contrib. to individual 18-45 & same language
1,435 174,983 2,223 169,909 3,000 180,873 3,296 -10,964 2
DG: contrib. to individual same grin
1,435 187,038 2,310 182,750 3,086 192,018 3,469 -9,268 2
DG: contrib. to individual 18-45 & different language
1,435 165,331 2,295 161,868 3,074 169,352 3,441 -7,485 0
DG: exp return from individual 18-45
1,435 167,666 3,174 161,349 3,816 175,000 5,226 -13,651 2
DG: exp return from individual 18-45 & same language
1,435 176,132 3,223 170,428 4,043 182,756 5,137 -12,328 1
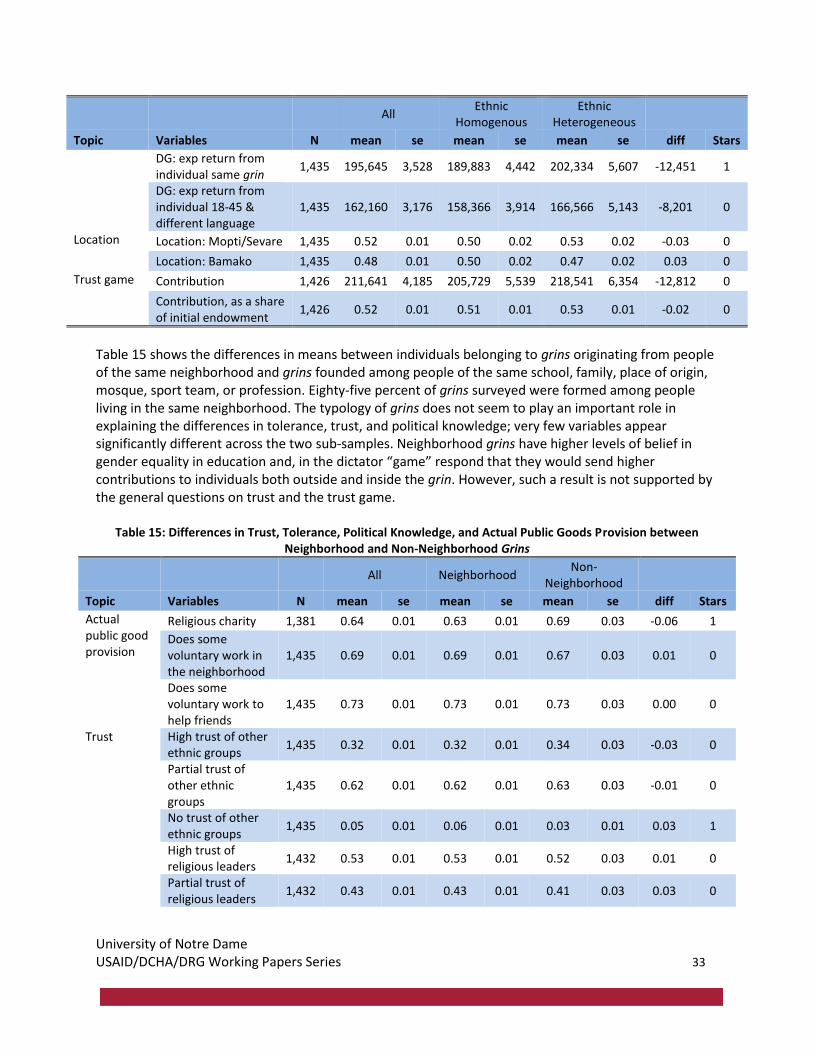
University of Notre Dame USAID/DCHA/DRG Working Papers Series 33
All Ethnic
Homogenous Ethnic
Heterogeneous
Topic Variables N mean se mean se mean se diff Stars
DG: exp return from individual same grin
1,435 195,645 3,528 189,883 4,442 202,334 5,607 -12,451 1
DG: exp return from individual 18-45 & different language
1,435 162,160 3,176 158,366 3,914 166,566 5,143 -8,201 0
Location Location: Mopti/Sevare 1,435 0.52 0.01 0.50 0.02 0.53 0.02 -0.03 0
Location: Bamako 1,435 0.48 0.01 0.50 0.02 0.47 0.02 0.03 0
Trust game Contribution 1,426 211,641 4,185 205,729 5,539 218,541 6,354 -12,812 0
Contribution, as a share of initial endowment
1,426 0.52 0.01 0.51 0.01 0.53 0.01 -0.02 0
Table 15 shows the differences in means between individuals belonging to grins originating from people of the same neighborhood and grins founded among people of the same school, family, place of origin, mosque, sport team, or profession. Eighty-five percent of grins surveyed were formed among people living in the same neighborhood. The typology of grins does not seem to play an important role in explaining the differences in tolerance, trust, and political knowledge; very few variables appear significantly different across the two sub-samples. Neighborhood grins have higher levels of belief in gender equality in education and, in the dictator “game” respond that they would send higher contributions to individuals both outside and inside the grin. However, such a result is not supported by the general questions on trust and the trust game.
Table 15: Differences in Trust, Tolerance, Political Knowledge, and Actual Public Goods Provision between Neighborhood and Non-Neighborhood Grins
All Neighborhood Non-
Neighborhood
Topic Variables N mean se mean se mean se diff Stars
Actual public good provision
Religious charity 1,381 0.64 0.01 0.63 0.01 0.69 0.03 -0.06 1
Does some voluntary work in the neighborhood
1,435 0.69 0.01 0.69 0.01 0.67 0.03 0.01 0
Does some voluntary work to help friends
1,435 0.73 0.01 0.73 0.01 0.73 0.03 0.00 0
Trust High trust of other ethnic groups
1,435 0.32 0.01 0.32 0.01 0.34 0.03 -0.03 0
Partial trust of other ethnic groups
1,435 0.62 0.01 0.62 0.01 0.63 0.03 -0.01 0
No trust of other ethnic groups
1,435 0.05 0.01 0.06 0.01 0.03 0.01 0.03 1
High trust of religious leaders
1,432 0.53 0.01 0.53 0.01 0.52 0.03 0.01 0
Partial trust of religious leaders
1,432 0.43 0.01 0.43 0.01 0.41 0.03 0.03 0
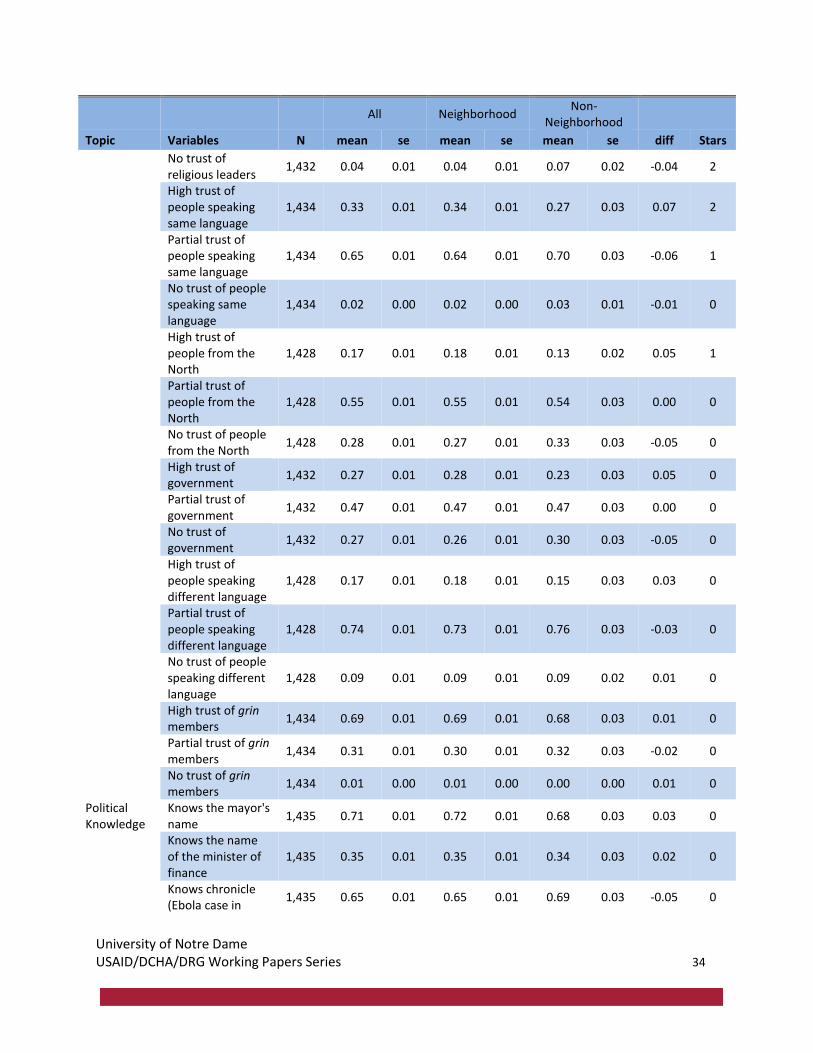
University of Notre Dame USAID/DCHA/DRG Working Papers Series 34
All Neighborhood Non-
Neighborhood
Topic Variables N mean se mean se mean se diff Stars
No trust of religious leaders
1,432 0.04 0.01 0.04 0.01 0.07 0.02 -0.04 2
High trust of people speaking same language
1,434 0.33 0.01 0.34 0.01 0.27 0.03 0.07 2
Partial trust of people speaking same language
1,434 0.65 0.01 0.64 0.01 0.70 0.03 -0.06 1
No trust of people speaking same language
1,434 0.02 0.00 0.02 0.00 0.03 0.01 -0.01 0
High trust of people from the North
1,428 0.17 0.01 0.18 0.01 0.13 0.02 0.05 1
Partial trust of people from the North
1,428 0.55 0.01 0.55 0.01 0.54 0.03 0.00 0
No trust of people from the North
1,428 0.28 0.01 0.27 0.01 0.33 0.03 -0.05 0
High trust of government
1,432 0.27 0.01 0.28 0.01 0.23 0.03 0.05 0
Partial trust of government
1,432 0.47 0.01 0.47 0.01 0.47 0.03 0.00 0
No trust of government
1,432 0.27 0.01 0.26 0.01 0.30 0.03 -0.05 0
High trust of people speaking different language
1,428 0.17 0.01 0.18 0.01 0.15 0.03 0.03 0
Partial trust of people speaking different language
1,428 0.74 0.01 0.73 0.01 0.76 0.03 -0.03 0
No trust of people speaking different language
1,428 0.09 0.01 0.09 0.01 0.09 0.02 0.01 0
High trust of grin members
1,434 0.69 0.01 0.69 0.01 0.68 0.03 0.01 0
Partial trust of grin members
1,434 0.31 0.01 0.30 0.01 0.32 0.03 -0.02 0
No trust of grin members
1,434 0.01 0.00 0.01 0.00 0.00 0.00 0.01 0
Political Knowledge
Knows the mayor's name
1,435 0.71 0.01 0.72 0.01 0.68 0.03 0.03 0
Knows the name of the minister of finance
1,435 0.35 0.01 0.35 0.01 0.34 0.03 0.02 0
Knows chronicle (Ebola case in
1,435 0.65 0.01 0.65 0.01 0.69 0.03 -0.05 0
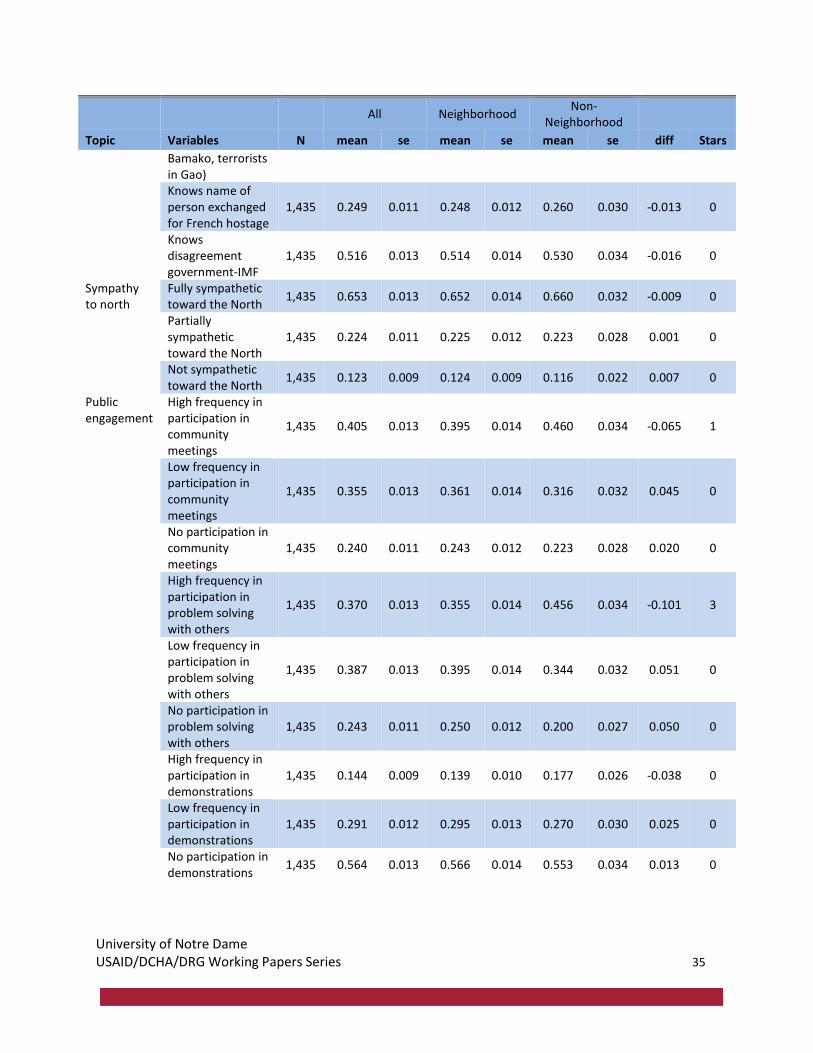
University of Notre Dame USAID/DCHA/DRG Working Papers Series 35
All Neighborhood Non-
Neighborhood
Topic Variables N mean se mean se mean se diff Stars
Bamako, terrorists in Gao) Knows name of person exchanged for French hostage
1,435 0.249 0.011 0.248 0.012 0.260 0.030 -0.013 0
Knows disagreement government-IMF
1,435 0.516 0.013 0.514 0.014 0.530 0.034 -0.016 0
Sympathy to north
Fully sympathetic toward the North
1,435 0.653 0.013 0.652 0.014 0.660 0.032 -0.009 0
Partially sympathetic toward the North
1,435 0.224 0.011 0.225 0.012 0.223 0.028 0.001 0
Not sympathetic toward the North
1,435 0.123 0.009 0.124 0.009 0.116 0.022 0.007 0
Public engagement
High frequency in participation in community meetings
1,435 0.405 0.013 0.395 0.014 0.460 0.034 -0.065 1
Low frequency in participation in community meetings
1,435 0.355 0.013 0.361 0.014 0.316 0.032 0.045 0
No participation in community meetings
1,435 0.240 0.011 0.243 0.012 0.223 0.028 0.020 0
High frequency in participation in problem solving with others
1,435 0.370 0.013 0.355 0.014 0.456 0.034 -0.101 3
Low frequency in participation in problem solving with others
1,435 0.387 0.013 0.395 0.014 0.344 0.032 0.051 0
No participation in problem solving with others
1,435 0.243 0.011 0.250 0.012 0.200 0.027 0.050 0
High frequency in participation in demonstrations
1,435 0.144 0.009 0.139 0.010 0.177 0.026 -0.038 0
Low frequency in participation in demonstrations
1,435 0.291 0.012 0.295 0.013 0.270 0.030 0.025 0
No participation in demonstrations
1,435 0.564 0.013 0.566 0.014 0.553 0.034 0.013 0
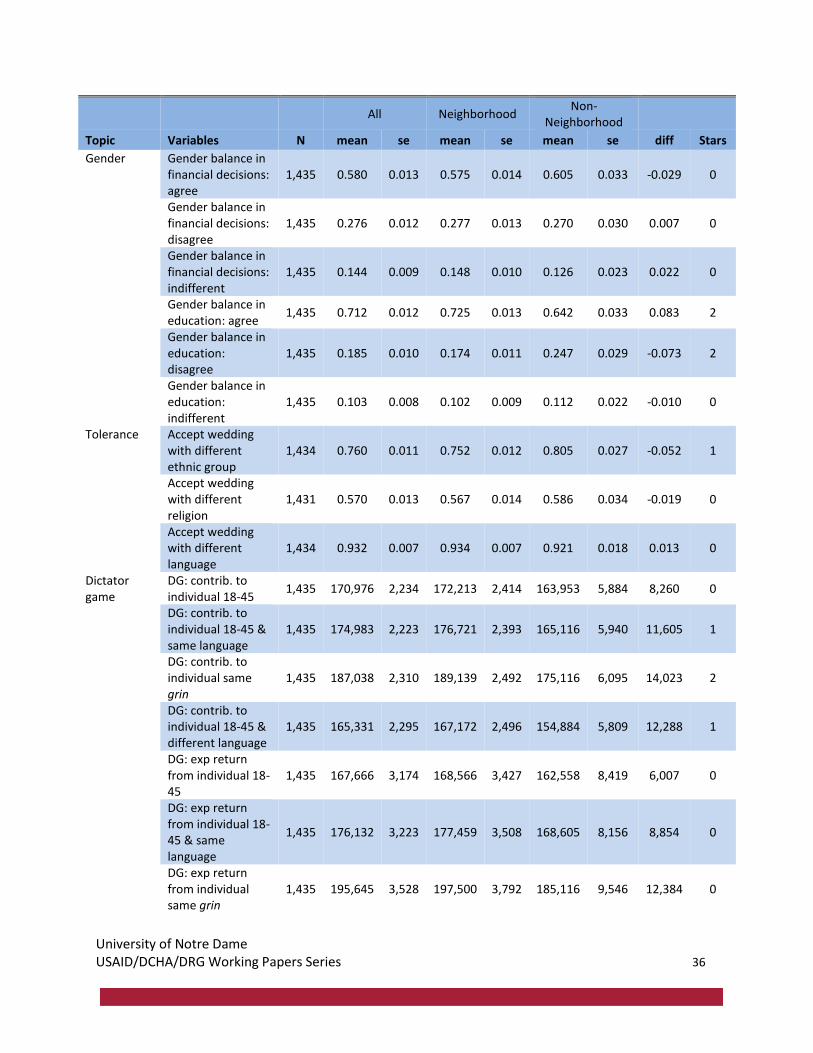
University of Notre Dame USAID/DCHA/DRG Working Papers Series 36
All Neighborhood Non-
Neighborhood
Topic Variables N mean se mean se mean se diff Stars
Gender Gender balance in financial decisions: agree
1,435 0.580 0.013 0.575 0.014 0.605 0.033 -0.029 0
Gender balance in financial decisions: disagree
1,435 0.276 0.012 0.277 0.013 0.270 0.030 0.007 0
Gender balance in financial decisions: indifferent
1,435 0.144 0.009 0.148 0.010 0.126 0.023 0.022 0
Gender balance in education: agree
1,435 0.712 0.012 0.725 0.013 0.642 0.033 0.083 2
Gender balance in education: disagree
1,435 0.185 0.010 0.174 0.011 0.247 0.029 -0.073 2
Gender balance in education: indifferent
1,435 0.103 0.008 0.102 0.009 0.112 0.022 -0.010 0
Tolerance Accept wedding with different ethnic group
1,434 0.760 0.011 0.752 0.012 0.805 0.027 -0.052 1
Accept wedding with different religion
1,431 0.570 0.013 0.567 0.014 0.586 0.034 -0.019 0
Accept wedding with different language
1,434 0.932 0.007 0.934 0.007 0.921 0.018 0.013 0
Dictator game
DG: contrib. to individual 18-45
1,435 170,976 2,234 172,213 2,414 163,953 5,884 8,260 0
DG: contrib. to individual 18-45 & same language
1,435 174,983 2,223 176,721 2,393 165,116 5,940 11,605 1
DG: contrib. to individual same grin
1,435 187,038 2,310 189,139 2,492 175,116 6,095 14,023 2
DG: contrib. to individual 18-45 & different language
1,435 165,331 2,295 167,172 2,496 154,884 5,809 12,288 1
DG: exp return from individual 18-45
1,435 167,666 3,174 168,566 3,427 162,558 8,419 6,007 0
DG: exp return from individual 18-45 & same language
1,435 176,132 3,223 177,459 3,508 168,605 8,156 8,854 0
DG: exp return from individual same grin
1,435 195,645 3,528 197,500 3,792 185,116 9,546 12,384 0
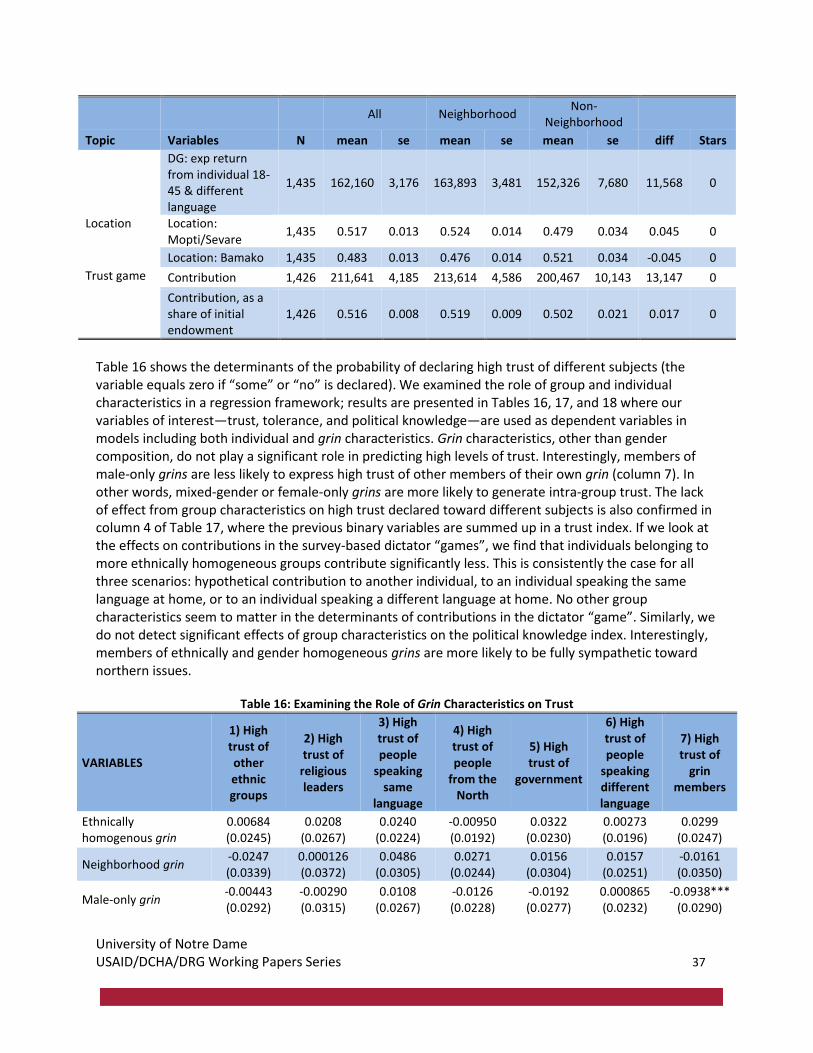
University of Notre Dame USAID/DCHA/DRG Working Papers Series 37
All Neighborhood Non-
Neighborhood
Topic Variables N mean se mean se mean se diff Stars
DG: exp return from individual 18-45 & different language
1,435 162,160 3,176 163,893 3,481 152,326 7,680 11,568 0
Location Location: Mopti/Sevare
1,435 0.517 0.013 0.524 0.014 0.479 0.034 0.045 0
Location: Bamako 1,435 0.483 0.013 0.476 0.014 0.521 0.034 -0.045 0
Trust game Contribution 1,426 211,641 4,185 213,614 4,586 200,467 10,143 13,147 0
Contribution, as a share of initial endowment
1,426 0.516 0.008 0.519 0.009 0.502 0.021 0.017 0
Table 16 shows the determinants of the probability of declaring high trust of different subjects (the variable equals zero if “some” or “no” is declared). We examined the role of group and individual characteristics in a regression framework; results are presented in Tables 16, 17, and 18 where our variables of interest—trust, tolerance, and political knowledge—are used as dependent variables in models including both individual and grin characteristics. Grin characteristics, other than gender composition, do not play a significant role in predicting high levels of trust. Interestingly, members of male-only grins are less likely to express high trust of other members of their own grin (column 7). In other words, mixed-gender or female-only grins are more likely to generate intra-group trust. The lack of effect from group characteristics on high trust declared toward different subjects is also confirmed in column 4 of Table 17, where the previous binary variables are summed up in a trust index. If we look at the effects on contributions in the survey-based dictator “games”, we find that individuals belonging to more ethnically homogeneous groups contribute significantly less. This is consistently the case for all three scenarios: hypothetical contribution to another individual, to an individual speaking the same language at home, or to an individual speaking a different language at home. No other group characteristics seem to matter in the determinants of contributions in the dictator “game”. Similarly, we do not detect significant effects of group characteristics on the political knowledge index. Interestingly, members of ethnically and gender homogeneous grins are more likely to be fully sympathetic toward northern issues.
Table 16: Examining the Role of Grin Characteristics on Trust
VARIABLES
1) High trust of other ethnic groups
2) High trust of
religious leaders
3) High trust of people
speaking same
language
4) High trust of people
from the North
5) High trust of
government
6) High trust of people
speaking different language
7) High trust of
grin members
Ethnically homogenous grin
0.00684 (0.0245)
0.0208 (0.0267)
0.0240 (0.0224)
-0.00950 (0.0192)
0.0322 (0.0230)
0.00273 (0.0196)
0.0299 (0.0247)
Neighborhood grin -0.0247 (0.0339)
0.000126 (0.0372)
0.0486 (0.0305)
0.0271 (0.0244)
0.0156 (0.0304)
0.0157 (0.0251)
-0.0161 (0.0350)
Male-only grin -0.00443 (0.0292)
-0.00290 (0.0315)
0.0108 (0.0267)
-0.0126 (0.0228)
-0.0192 (0.0277)
0.000865 (0.0232)
-0.0938*** (0.0290)
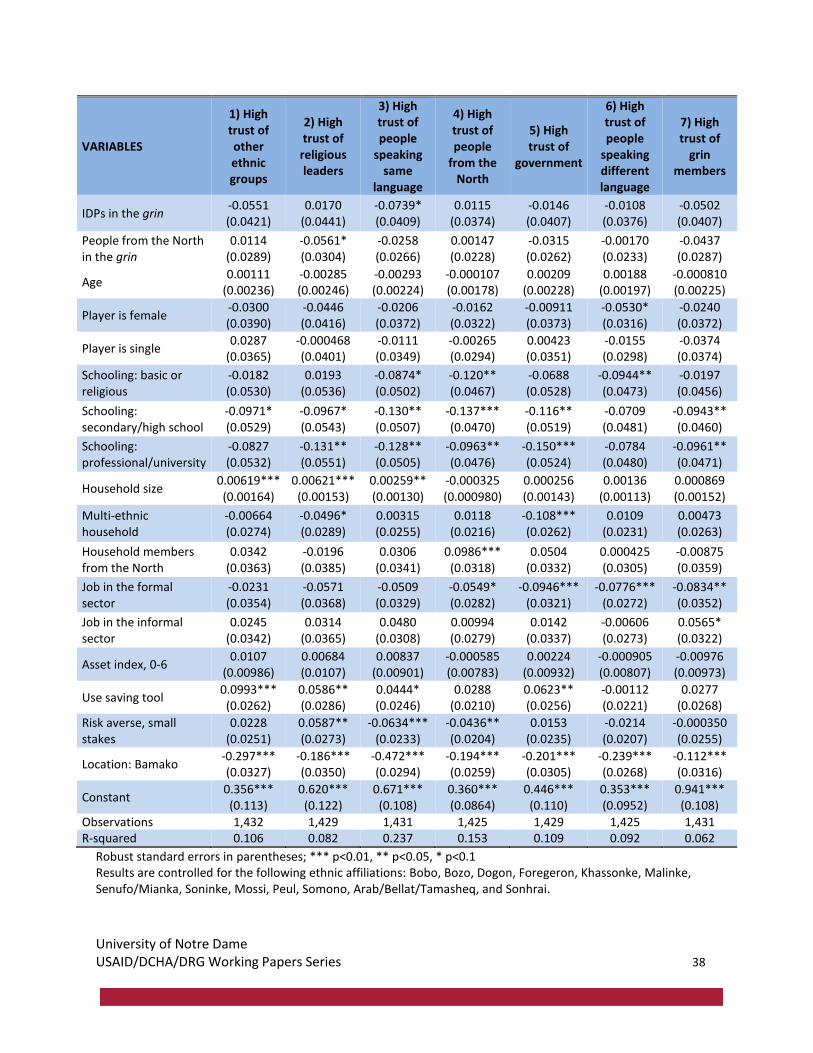
University of Notre Dame USAID/DCHA/DRG Working Papers Series 38
VARIABLES
1) High trust of other ethnic groups
2) High trust of
religious leaders
3) High trust of people
speaking same
language
4) High trust of people
from the North
5) High trust of
government
6) High trust of people
speaking different language
7) High trust of
grin members
IDPs in the grin -0.0551 (0.0421)
0.0170 (0.0441)
-0.0739* (0.0409)
0.0115 (0.0374)
-0.0146 (0.0407)
-0.0108 (0.0376)
-0.0502 (0.0407)
People from the North in the grin
0.0114 (0.0289)
-0.0561* (0.0304)
-0.0258 (0.0266)
0.00147 (0.0228)
-0.0315 (0.0262)
-0.00170 (0.0233)
-0.0437 (0.0287)
Age 0.00111
(0.00236) -0.00285 (0.00246)
-0.00293 (0.00224)
-0.000107 (0.00178)
0.00209 (0.00228)
0.00188 (0.00197)
-0.000810 (0.00225)
Player is female -0.0300 (0.0390)
-0.0446 (0.0416)
-0.0206 (0.0372)
-0.0162 (0.0322)
-0.00911 (0.0373)
-0.0530* (0.0316)
-0.0240 (0.0372)
Player is single 0.0287
(0.0365) -0.000468 (0.0401)
-0.0111 (0.0349)
-0.00265 (0.0294)
0.00423 (0.0351)
-0.0155 (0.0298)
-0.0374 (0.0374)
Schooling: basic or religious
-0.0182 (0.0530)
0.0193 (0.0536)
-0.0874* (0.0502)
-0.120** (0.0467)
-0.0688 (0.0528)
-0.0944** (0.0473)
-0.0197 (0.0456)
Schooling: secondary/high school
-0.0971* (0.0529)
-0.0967* (0.0543)
-0.130** (0.0507)
-0.137*** (0.0470)
-0.116** (0.0519)
-0.0709 (0.0481)
-0.0943** (0.0460)
Schooling: professional/university
-0.0827 (0.0532)
-0.131** (0.0551)
-0.128** (0.0505)
-0.0963** (0.0476)
-0.150*** (0.0524)
-0.0784 (0.0480)
-0.0961** (0.0471)
Household size 0.00619*** (0.00164)
0.00621*** (0.00153)
0.00259** (0.00130)
-0.000325 (0.000980)
0.000256 (0.00143)
0.00136 (0.00113)
0.000869 (0.00152)
Multi-ethnic household
-0.00664 (0.0274)
-0.0496* (0.0289)
0.00315 (0.0255)
0.0118 (0.0216)
-0.108*** (0.0262)
0.0109 (0.0231)
0.00473 (0.0263)
Household members from the North
0.0342 (0.0363)
-0.0196 (0.0385)
0.0306 (0.0341)
0.0986*** (0.0318)
0.0504 (0.0332)
0.000425 (0.0305)
-0.00875 (0.0359)
Job in the formal sector
-0.0231 (0.0354)
-0.0571 (0.0368)
-0.0509 (0.0329)
-0.0549* (0.0282)
-0.0946*** (0.0321)
-0.0776*** (0.0272)
-0.0834** (0.0352)
Job in the informal sector
0.0245 (0.0342)
0.0314 (0.0365)
0.0480 (0.0308)
0.00994 (0.0279)
0.0142 (0.0337)
-0.00606 (0.0273)
0.0565* (0.0322)
Asset index, 0-6 0.0107
(0.00986) 0.00684 (0.0107)
0.00837 (0.00901)
-0.000585 (0.00783)
0.00224 (0.00932)
-0.000905 (0.00807)
-0.00976 (0.00973)
Use saving tool 0.0993*** (0.0262)
0.0586** (0.0286)
0.0444* (0.0246)
0.0288 (0.0210)
0.0623** (0.0256)
-0.00112 (0.0221)
0.0277 (0.0268)
Risk averse, small stakes
0.0228 (0.0251)
0.0587** (0.0273)
-0.0634*** (0.0233)
-0.0436** (0.0204)
0.0153 (0.0235)
-0.0214 (0.0207)
-0.000350 (0.0255)
Location: Bamako -0.297*** (0.0327)
-0.186*** (0.0350)
-0.472*** (0.0294)
-0.194*** (0.0259)
-0.201*** (0.0305)
-0.239*** (0.0268)
-0.112*** (0.0316)
Constant 0.356*** (0.113)
0.620*** (0.122)
0.671*** (0.108)
0.360*** (0.0864)
0.446*** (0.110)
0.353*** (0.0952)
0.941*** (0.108)
Observations 1,432 1,429 1,431 1,425 1,429 1,425 1,431 R-squared 0.106 0.082 0.237 0.153 0.109 0.092 0.062
Robust standard errors in parentheses; *** p<0.01, ** p<0.05, * p<0.1 Results are controlled for the following ethnic affiliations: Bobo, Bozo, Dogon, Foregeron, Khassonke, Malinke, Senufo/Mianka, Soninke, Mossi, Peul, Somono, Arab/Bellat/Tamasheq, and Sonhrai.
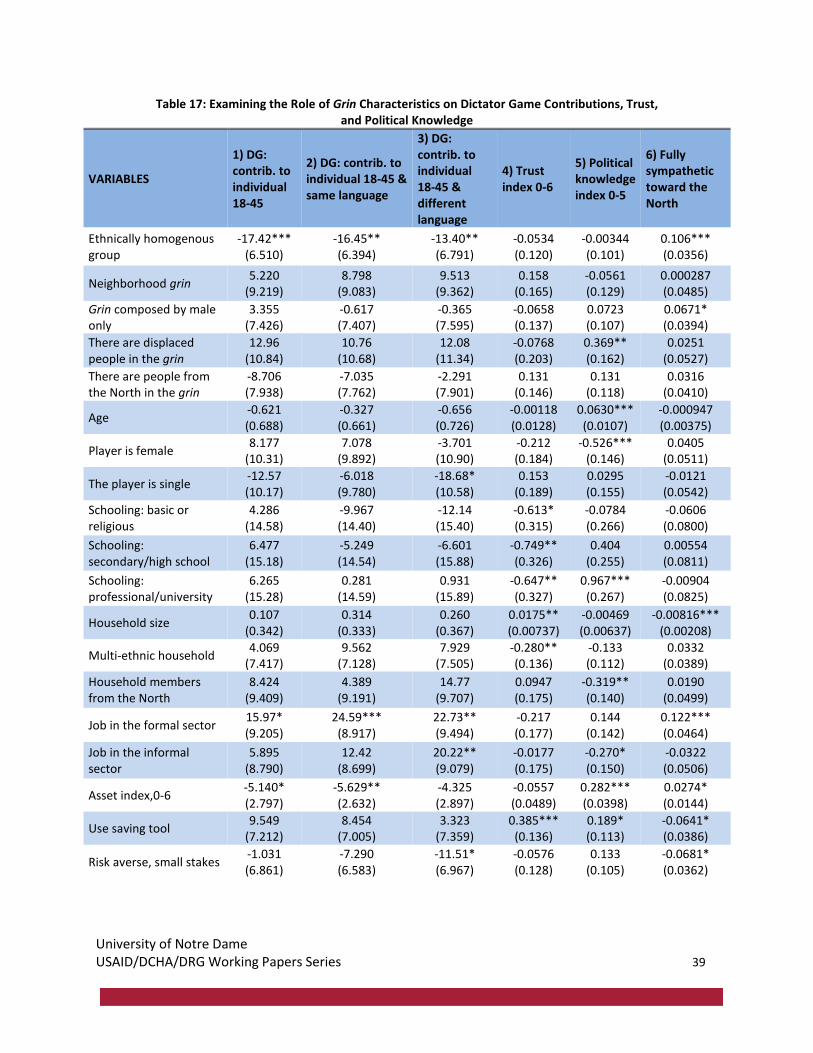
University of Notre Dame USAID/DCHA/DRG Working Papers Series 39
Table 17: Examining the Role of Grin Characteristics on Dictator Game Contributions, Trust, and Political Knowledge
VARIABLES
1) DG: contrib. to individual 18-45
2) DG: contrib. to individual 18-45 & same language
3) DG: contrib. to individual 18-45 & different language
4) Trust index 0-6
5) Political knowledge index 0-5
6) Fully sympathetic toward the North
Ethnically homogenous group
-17.42*** (6.510)
-16.45** (6.394)
-13.40** (6.791)
-0.0534 (0.120)
-0.00344 (0.101)
0.106*** (0.0356)
Neighborhood grin 5.220
(9.219) 8.798
(9.083) 9.513
(9.362) 0.158
(0.165) -0.0561 (0.129)
0.000287 (0.0485)
Grin composed by male only
3.355 (7.426)
-0.617 (7.407)
-0.365 (7.595)
-0.0658 (0.137)
0.0723 (0.107)
0.0671* (0.0394)
There are displaced people in the grin
12.96 (10.84)
10.76 (10.68)
12.08 (11.34)
-0.0768 (0.203)
0.369** (0.162)
0.0251 (0.0527)
There are people from the North in the grin
-8.706 (7.938)
-7.035 (7.762)
-2.291 (7.901)
0.131 (0.146)
0.131 (0.118)
0.0316 (0.0410)
Age -0.621 (0.688)
-0.327 (0.661)
-0.656 (0.726)
-0.00118 (0.0128)
0.0630*** (0.0107)
-0.000947 (0.00375)
Player is female 8.177
(10.31) 7.078
(9.892) -3.701 (10.90)
-0.212 (0.184)
-0.526*** (0.146)
0.0405 (0.0511)
The player is single -12.57 (10.17)
-6.018 (9.780)
-18.68* (10.58)
0.153 (0.189)
0.0295 (0.155)
-0.0121 (0.0542)
Schooling: basic or religious
4.286 (14.58)
-9.967 (14.40)
-12.14 (15.40)
-0.613* (0.315)
-0.0784 (0.266)
-0.0606 (0.0800)
Schooling: secondary/high school
6.477 (15.18)
-5.249 (14.54)
-6.601 (15.88)
-0.749** (0.326)
0.404 (0.255)
0.00554 (0.0811)
Schooling: professional/university
6.265 (15.28)
0.281 (14.59)
0.931 (15.89)
-0.647** (0.327)
0.967*** (0.267)
-0.00904 (0.0825)
Household size 0.107
(0.342) 0.314
(0.333) 0.260
(0.367) 0.0175** (0.00737)
-0.00469 (0.00637)
-0.00816*** (0.00208)
Multi-ethnic household 4.069
(7.417) 9.562
(7.128) 7.929
(7.505) -0.280** (0.136)
-0.133 (0.112)
0.0332 (0.0389)
Household members from the North
8.424 (9.409)
4.389 (9.191)
14.77 (9.707)
0.0947 (0.175)
-0.319** (0.140)
0.0190 (0.0499)
Job in the formal sector 15.97* (9.205)
24.59*** (8.917)
22.73** (9.494)
-0.217 (0.177)
0.144 (0.142)
0.122*** (0.0464)
Job in the informal sector
5.895 (8.790)
12.42 (8.699)
20.22** (9.079)
-0.0177 (0.175)
-0.270* (0.150)
-0.0322 (0.0506)
Asset index,0-6 -5.140* (2.797)
-5.629** (2.632)
-4.325 (2.897)
-0.0557 (0.0489)
0.282*** (0.0398)
0.0274* (0.0144)
Use saving tool 9.549
(7.212) 8.454
(7.005) 3.323
(7.359) 0.385*** (0.136)
0.189* (0.113)
-0.0641* (0.0386)
Risk averse, small stakes -1.031 (6.861)
-7.290 (6.583)
-11.51* (6.967)
-0.0576 (0.128)
0.133 (0.105)
-0.0681* (0.0362)
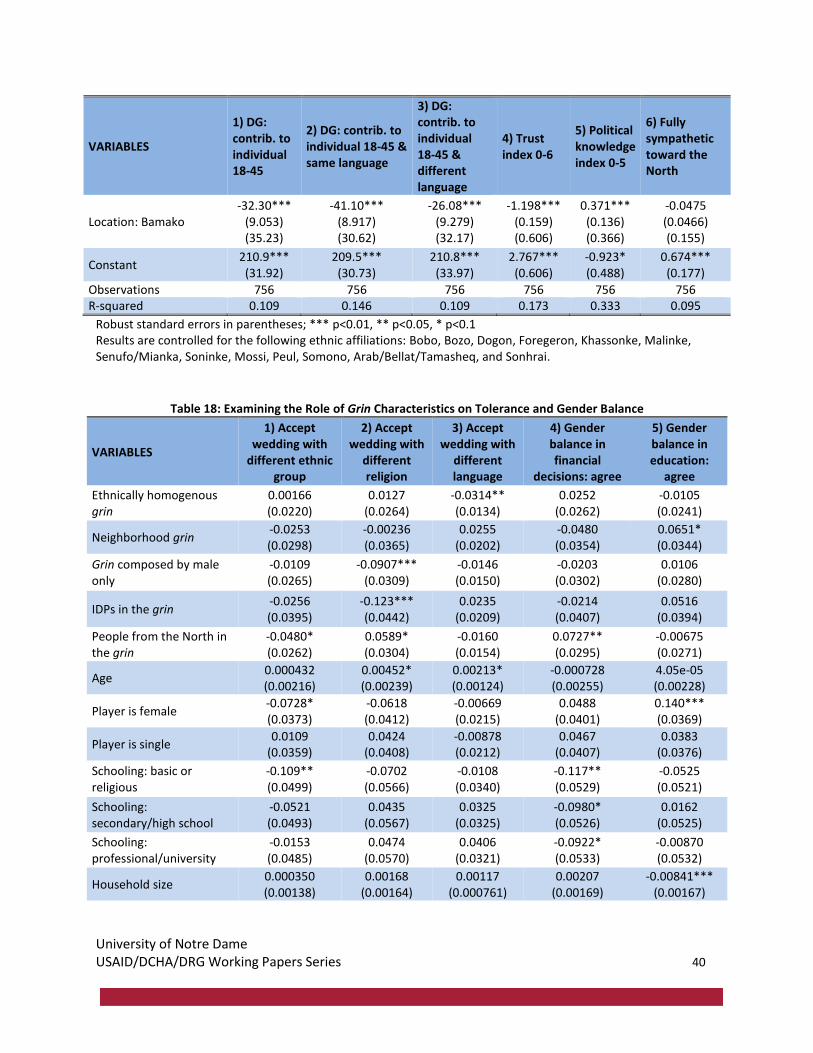
University of Notre Dame USAID/DCHA/DRG Working Papers Series 40
VARIABLES
1) DG: contrib. to individual 18-45
2) DG: contrib. to individual 18-45 & same language
3) DG: contrib. to individual 18-45 & different language
4) Trust index 0-6
5) Political knowledge index 0-5
6) Fully sympathetic toward the North
Location: Bamako -32.30***
(9.053) (35.23)
-41.10*** (8.917) (30.62)
-26.08*** (9.279) (32.17)
-1.198*** (0.159) (0.606)
0.371*** (0.136) (0.366)
-0.0475 (0.0466) (0.155)
Constant 210.9*** (31.92)
209.5*** (30.73)
210.8*** (33.97)
2.767*** (0.606)
-0.923* (0.488)
0.674*** (0.177)
Observations 756 756 756 756 756 756 R-squared 0.109 0.146 0.109 0.173 0.333 0.095
Robust standard errors in parentheses; *** p<0.01, ** p<0.05, * p<0.1 Results are controlled for the following ethnic affiliations: Bobo, Bozo, Dogon, Foregeron, Khassonke, Malinke, Senufo/Mianka, Soninke, Mossi, Peul, Somono, Arab/Bellat/Tamasheq, and Sonhrai.
Table 18: Examining the Role of Grin Characteristics on Tolerance and Gender Balance
VARIABLES
1) Accept wedding with
different ethnic group
2) Accept wedding with
different religion
3) Accept wedding with
different language
4) Gender balance in financial
decisions: agree
5) Gender balance in education:
agree
Ethnically homogenous grin
0.00166 (0.0220)
0.0127 (0.0264)
-0.0314** (0.0134)
0.0252 (0.0262)
-0.0105 (0.0241)
Neighborhood grin -0.0253 (0.0298)
-0.00236 (0.0365)
0.0255 (0.0202)
-0.0480 (0.0354)
0.0651* (0.0344)
Grin composed by male only
-0.0109 (0.0265)
-0.0907*** (0.0309)
-0.0146 (0.0150)
-0.0203 (0.0302)
0.0106 (0.0280)
IDPs in the grin -0.0256 (0.0395)
-0.123*** (0.0442)
0.0235 (0.0209)
-0.0214 (0.0407)
0.0516 (0.0394)
People from the North in the grin
-0.0480* (0.0262)
0.0589* (0.0304)
-0.0160 (0.0154)
0.0727** (0.0295)
-0.00675 (0.0271)
Age 0.000432 (0.00216)
0.00452* (0.00239)
0.00213* (0.00124)
-0.000728 (0.00255)
4.05e-05 (0.00228)
Player is female -0.0728* (0.0373)
-0.0618 (0.0412)
-0.00669 (0.0215)
0.0488 (0.0401)
0.140*** (0.0369)
Player is single 0.0109
(0.0359) 0.0424
(0.0408) -0.00878 (0.0212)
0.0467 (0.0407)
0.0383 (0.0376)
Schooling: basic or religious
-0.109** (0.0499)
-0.0702 (0.0566)
-0.0108 (0.0340)
-0.117** (0.0529)
-0.0525 (0.0521)
Schooling: secondary/high school
-0.0521 (0.0493)
0.0435 (0.0567)
0.0325 (0.0325)
-0.0980* (0.0526)
0.0162 (0.0525)
Schooling: professional/university
-0.0153 (0.0485)
0.0474 (0.0570)
0.0406 (0.0321)
-0.0922* (0.0533)
-0.00870 (0.0532)
Household size 0.000350 (0.00138)
0.00168 (0.00164)
0.00117 (0.000761)
0.00207 (0.00169)
-0.00841*** (0.00167)
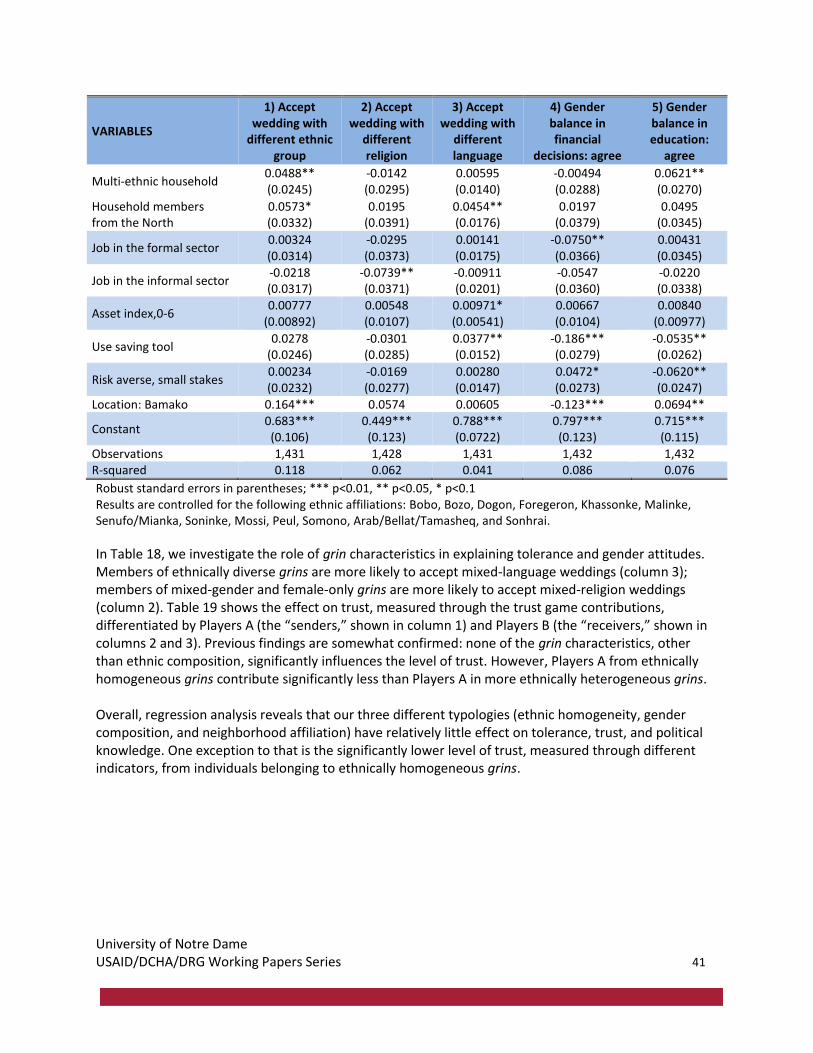
University of Notre Dame USAID/DCHA/DRG Working Papers Series 41
VARIABLES
1) Accept wedding with
different ethnic group
2) Accept wedding with
different religion
3) Accept wedding with
different language
4) Gender balance in financial
decisions: agree
5) Gender balance in education:
agree
Multi-ethnic household 0.0488** (0.0245)
-0.0142 (0.0295)
0.00595 (0.0140)
-0.00494 (0.0288)
0.0621** (0.0270)
Household members from the North
0.0573* (0.0332)
0.0195 (0.0391)
0.0454** (0.0176)
0.0197 (0.0379)
0.0495 (0.0345)
Job in the formal sector 0.00324 (0.0314)
-0.0295 (0.0373)
0.00141 (0.0175)
-0.0750** (0.0366)
0.00431 (0.0345)
Job in the informal sector -0.0218 (0.0317)
-0.0739** (0.0371)
-0.00911 (0.0201)
-0.0547 (0.0360)
-0.0220 (0.0338)
Asset index,0-6 0.00777
(0.00892) 0.00548 (0.0107)
0.00971* (0.00541)
0.00667 (0.0104)
0.00840 (0.00977)
Use saving tool 0.0278
(0.0246) -0.0301 (0.0285)
0.0377** (0.0152)
-0.186*** (0.0279)
-0.0535** (0.0262)
Risk averse, small stakes 0.00234 (0.0232)
-0.0169 (0.0277)
0.00280 (0.0147)
0.0472* (0.0273)
-0.0620** (0.0247)
Location: Bamako 0.164*** 0.0574 0.00605 -0.123*** 0.0694**
Constant 0.683*** (0.106)
0.449*** (0.123)
0.788*** (0.0722)
0.797*** (0.123)
0.715*** (0.115)
Observations 1,431 1,428 1,431 1,432 1,432 R-squared 0.118 0.062 0.041 0.086 0.076
Robust standard errors in parentheses; *** p<0.01, ** p<0.05, * p<0.1 Results are controlled for the following ethnic affiliations: Bobo, Bozo, Dogon, Foregeron, Khassonke, Malinke, Senufo/Mianka, Soninke, Mossi, Peul, Somono, Arab/Bellat/Tamasheq, and Sonhrai.
In Table 18, we investigate the role of grin characteristics in explaining tolerance and gender attitudes. Members of ethnically diverse grins are more likely to accept mixed-language weddings (column 3); members of mixed-gender and female-only grins are more likely to accept mixed-religion weddings (column 2). Table 19 shows the effect on trust, measured through the trust game contributions, differentiated by Players A (the “senders,” shown in column 1) and Players B (the “receivers,” shown in columns 2 and 3). Previous findings are somewhat confirmed: none of the grin characteristics, other than ethnic composition, significantly influences the level of trust. However, Players A from ethnically homogeneous grins contribute significantly less than Players A in more ethnically heterogeneous grins. Overall, regression analysis reveals that our three different typologies (ethnic homogeneity, gender composition, and neighborhood affiliation) have relatively little effect on tolerance, trust, and political knowledge. One exception to that is the significantly lower level of trust, measured through different indicators, from individuals belonging to ethnically homogeneous grins.
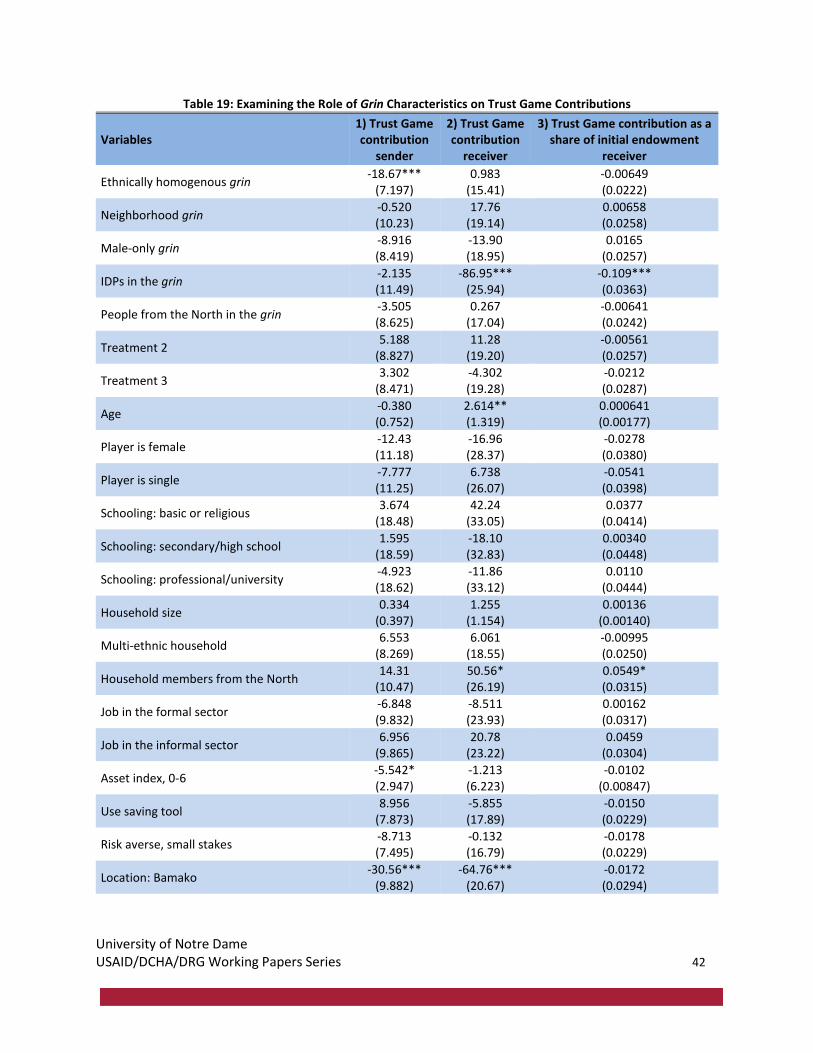
University of Notre Dame USAID/DCHA/DRG Working Papers Series 42
Table 19: Examining the Role of Grin Characteristics on Trust Game Contributions
Variables 1) Trust Game contribution
sender
2) Trust Game contribution
receiver
3) Trust Game contribution as a share of initial endowment
receiver
Ethnically homogenous grin -18.67***
(7.197) 0.983
(15.41) -0.00649 (0.0222)
Neighborhood grin -0.520 (10.23)
17.76 (19.14)
0.00658 (0.0258)
Male-only grin -8.916 (8.419)
-13.90 (18.95)
0.0165 (0.0257)
IDPs in the grin -2.135 (11.49)
-86.95*** (25.94)
-0.109*** (0.0363)
People from the North in the grin -3.505 (8.625)
0.267 (17.04)
-0.00641 (0.0242)
Treatment 2 5.188
(8.827) 11.28
(19.20) -0.00561 (0.0257)
Treatment 3 3.302
(8.471) -4.302 (19.28)
-0.0212 (0.0287)
Age -0.380 (0.752)
2.614** (1.319)
0.000641 (0.00177)
Player is female -12.43 (11.18)
-16.96 (28.37)
-0.0278 (0.0380)
Player is single -7.777 (11.25)
6.738 (26.07)
-0.0541 (0.0398)
Schooling: basic or religious 3.674
(18.48) 42.24
(33.05) 0.0377
(0.0414)
Schooling: secondary/high school 1.595
(18.59) -18.10 (32.83)
0.00340 (0.0448)
Schooling: professional/university -4.923 (18.62)
-11.86 (33.12)
0.0110 (0.0444)
Household size 0.334
(0.397) 1.255
(1.154) 0.00136
(0.00140)
Multi-ethnic household 6.553
(8.269) 6.061
(18.55) -0.00995 (0.0250)
Household members from the North 14.31
(10.47) 50.56* (26.19)
0.0549* (0.0315)
Job in the formal sector -6.848 (9.832)
-8.511 (23.93)
0.00162 (0.0317)
Job in the informal sector 6.956
(9.865) 20.78
(23.22) 0.0459
(0.0304)
Asset index, 0-6 -5.542* (2.947)
-1.213 (6.223)
-0.0102 (0.00847)
Use saving tool 8.956
(7.873) -5.855 (17.89)
-0.0150 (0.0229)
Risk averse, small stakes -8.713 (7.495)
-0.132 (16.79)
-0.0178 (0.0229)
Location: Bamako -30.56***
(9.882) -64.76***
(20.67) -0.0172 (0.0294)
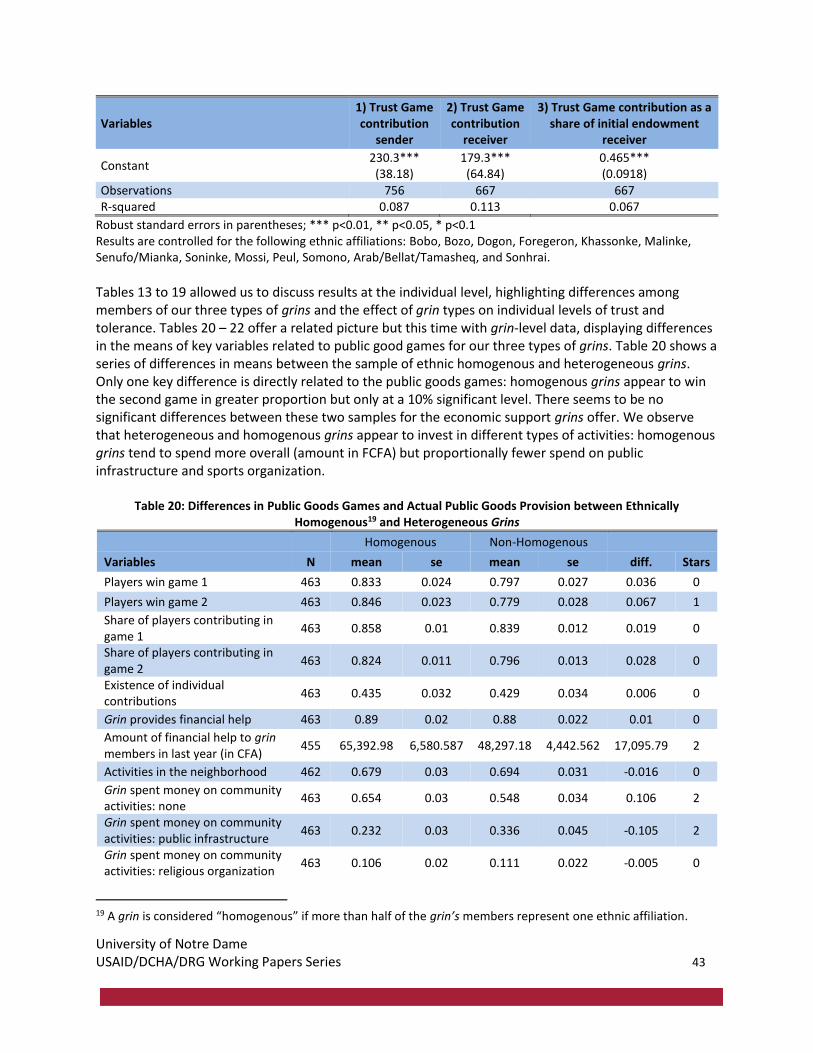
University of Notre Dame USAID/DCHA/DRG Working Papers Series 43
Variables 1) Trust Game contribution
sender
2) Trust Game contribution
receiver
3) Trust Game contribution as a share of initial endowment
receiver
Constant 230.3*** (38.18)
179.3*** (64.84)
0.465*** (0.0918)
Observations 756 667 667 R-squared 0.087 0.113 0.067
Robust standard errors in parentheses; *** p<0.01, ** p<0.05, * p<0.1 Results are controlled for the following ethnic affiliations: Bobo, Bozo, Dogon, Foregeron, Khassonke, Malinke, Senufo/Mianka, Soninke, Mossi, Peul, Somono, Arab/Bellat/Tamasheq, and Sonhrai.
Tables 13 to 19 allowed us to discuss results at the individual level, highlighting differences among members of our three types of grins and the effect of grin types on individual levels of trust and tolerance. Tables 20 – 22 offer a related picture but this time with grin-level data, displaying differences in the means of key variables related to public good games for our three types of grins. Table 20 shows a series of differences in means between the sample of ethnic homogenous and heterogeneous grins. Only one key difference is directly related to the public goods games: homogenous grins appear to win the second game in greater proportion but only at a 10% significant level. There seems to be no significant differences between these two samples for the economic support grins offer. We observe that heterogeneous and homogenous grins appear to invest in different types of activities: homogenous grins tend to spend more overall (amount in FCFA) but proportionally fewer spend on public infrastructure and sports organization.
Table 20: Differences in Public Goods Games and Actual Public Goods Provision between Ethnically Homogenous19 and Heterogeneous Grins
Homogenous Non-Homogenous
Variables N mean se mean se diff. Stars
Players win game 1 463 0.833 0.024 0.797 0.027 0.036 0
Players win game 2 463 0.846 0.023 0.779 0.028 0.067 1
Share of players contributing in game 1
463 0.858 0.01 0.839 0.012 0.019 0
Share of players contributing in game 2
463 0.824 0.011 0.796 0.013 0.028 0
Existence of individual contributions
463 0.435 0.032 0.429 0.034 0.006 0
Grin provides financial help 463 0.89 0.02 0.88 0.022 0.01 0
Amount of financial help to grin members in last year (in CFA)
455 65,392.98 6,580.587 48,297.18 4,442.562 17,095.79 2
Activities in the neighborhood 462 0.679 0.03 0.694 0.031 -0.016 0
Grin spent money on community activities: none
463 0.654 0.03 0.548 0.034 0.106 2
Grin spent money on community activities: public infrastructure
463 0.232 0.03 0.336 0.045 -0.105 2
Grin spent money on community activities: religious organization
463 0.106 0.02 0.111 0.022 -0.005 0
19 A grin is considered “homogenous” if more than half of the grin’s members represent one ethnic affiliation.
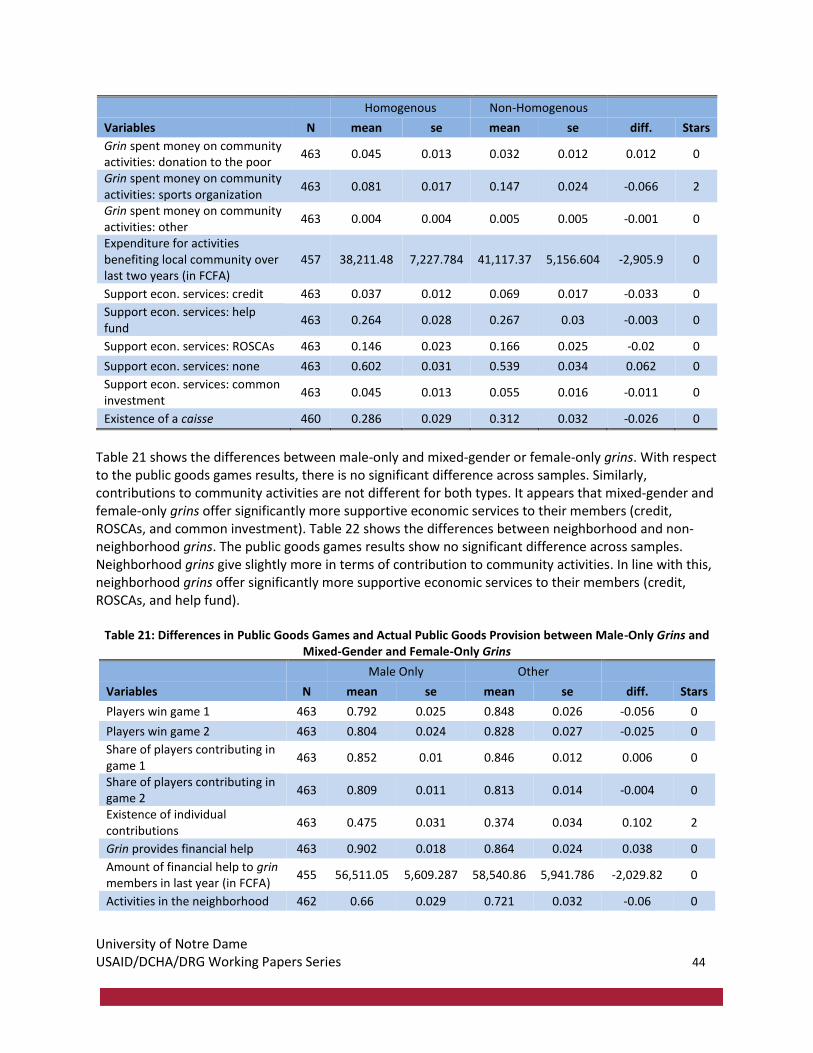
University of Notre Dame USAID/DCHA/DRG Working Papers Series 44
Homogenous Non-Homogenous
Variables N mean se mean se diff. Stars
Grin spent money on community activities: donation to the poor
463 0.045 0.013 0.032 0.012 0.012 0
Grin spent money on community activities: sports organization
463 0.081 0.017 0.147 0.024 -0.066 2
Grin spent money on community activities: other
463 0.004 0.004 0.005 0.005 -0.001 0
Expenditure for activities benefiting local community over last two years (in FCFA)
457 38,211.48 7,227.784 41,117.37 5,156.604 -2,905.9 0
Support econ. services: credit 463 0.037 0.012 0.069 0.017 -0.033 0
Support econ. services: help fund
463 0.264 0.028 0.267 0.03 -0.003 0
Support econ. services: ROSCAs 463 0.146 0.023 0.166 0.025 -0.02 0
Support econ. services: none 463 0.602 0.031 0.539 0.034 0.062 0
Support econ. services: common investment
463 0.045 0.013 0.055 0.016 -0.011 0
Existence of a caisse 460 0.286 0.029 0.312 0.032 -0.026 0
Table 21 shows the differences between male-only and mixed-gender or female-only grins. With respect to the public goods games results, there is no significant difference across samples. Similarly, contributions to community activities are not different for both types. It appears that mixed-gender and female-only grins offer significantly more supportive economic services to their members (credit, ROSCAs, and common investment). Table 22 shows the differences between neighborhood and non-neighborhood grins. The public goods games results show no significant difference across samples. Neighborhood grins give slightly more in terms of contribution to community activities. In line with this, neighborhood grins offer significantly more supportive economic services to their members (credit, ROSCAs, and help fund).
Table 21: Differences in Public Goods Games and Actual Public Goods Provision between Male-Only Grins and Mixed-Gender and Female-Only Grins
Male Only Other
Variables N mean se mean se diff. Stars
Players win game 1 463 0.792 0.025 0.848 0.026 -0.056 0
Players win game 2 463 0.804 0.024 0.828 0.027 -0.025 0
Share of players contributing in game 1
463 0.852 0.01 0.846 0.012 0.006 0
Share of players contributing in game 2
463 0.809 0.011 0.813 0.014 -0.004 0
Existence of individual contributions
463 0.475 0.031 0.374 0.034 0.102 2
Grin provides financial help 463 0.902 0.018 0.864 0.024 0.038 0
Amount of financial help to grin members in last year (in FCFA)
455 56,511.05 5,609.287 58,540.86 5,941.786 -2,029.82 0
Activities in the neighborhood 462 0.66 0.029 0.721 0.032 -0.06 0
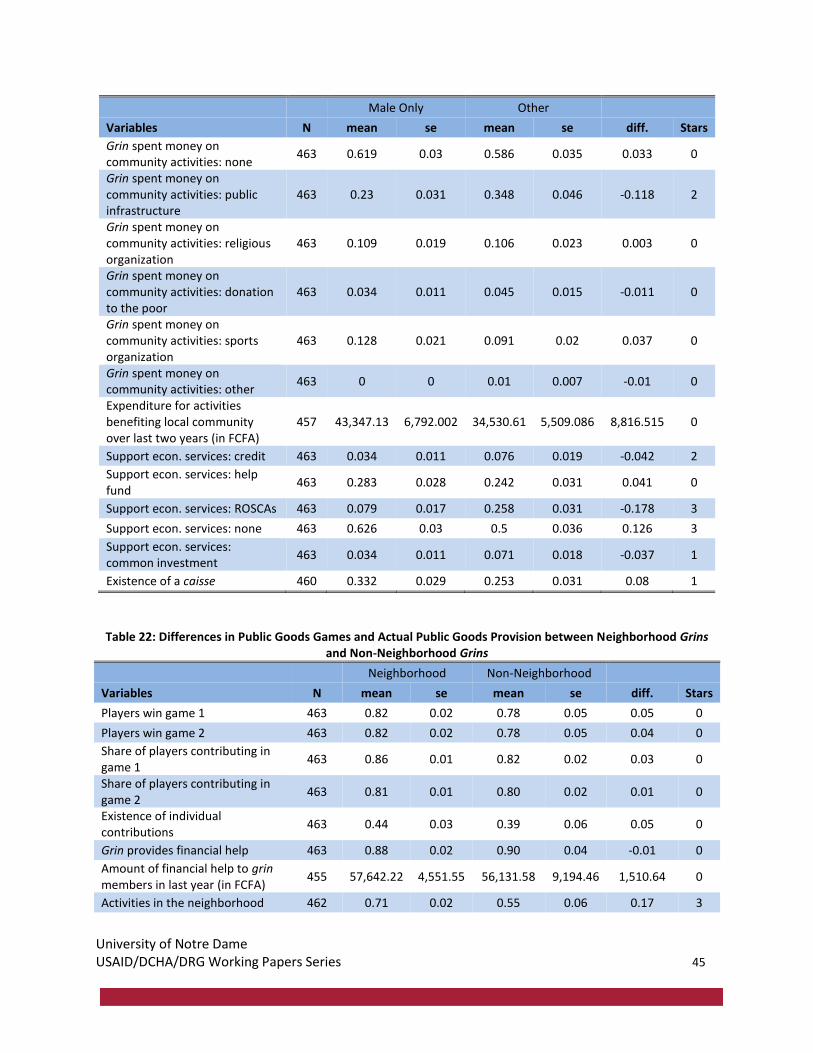
University of Notre Dame USAID/DCHA/DRG Working Papers Series 45
Male Only Other
Variables N mean se mean se diff. Stars
Grin spent money on community activities: none
463 0.619 0.03 0.586 0.035 0.033 0
Grin spent money on community activities: public infrastructure
463 0.23 0.031 0.348 0.046 -0.118 2
Grin spent money on community activities: religious organization
463 0.109 0.019 0.106 0.023 0.003 0
Grin spent money on community activities: donation to the poor
463 0.034 0.011 0.045 0.015 -0.011 0
Grin spent money on community activities: sports organization
463 0.128 0.021 0.091 0.02 0.037 0
Grin spent money on community activities: other
463 0 0 0.01 0.007 -0.01 0
Expenditure for activities benefiting local community over last two years (in FCFA)
457 43,347.13 6,792.002 34,530.61 5,509.086 8,816.515 0
Support econ. services: credit 463 0.034 0.011 0.076 0.019 -0.042 2
Support econ. services: help fund
463 0.283 0.028 0.242 0.031 0.041 0
Support econ. services: ROSCAs 463 0.079 0.017 0.258 0.031 -0.178 3
Support econ. services: none 463 0.626 0.03 0.5 0.036 0.126 3
Support econ. services: common investment
463 0.034 0.011 0.071 0.018 -0.037 1
Existence of a caisse 460 0.332 0.029 0.253 0.031 0.08 1
Table 22: Differences in Public Goods Games and Actual Public Goods Provision between Neighborhood Grins and Non-Neighborhood Grins
Neighborhood Non-Neighborhood
Variables N mean se mean se diff. Stars
Players win game 1 463 0.82 0.02 0.78 0.05 0.05 0
Players win game 2 463 0.82 0.02 0.78 0.05 0.04 0
Share of players contributing in game 1
463 0.86 0.01 0.82 0.02 0.03 0
Share of players contributing in game 2
463 0.81 0.01 0.80 0.02 0.01 0
Existence of individual contributions
463 0.44 0.03 0.39 0.06 0.05 0
Grin provides financial help 463 0.88 0.02 0.90 0.04 -0.01 0
Amount of financial help to grin members in last year (in FCFA)
455 57,642.22 4,551.55 56,131.58 9,194.46 1,510.64 0
Activities in the neighborhood 462 0.71 0.02 0.55 0.06 0.17 3
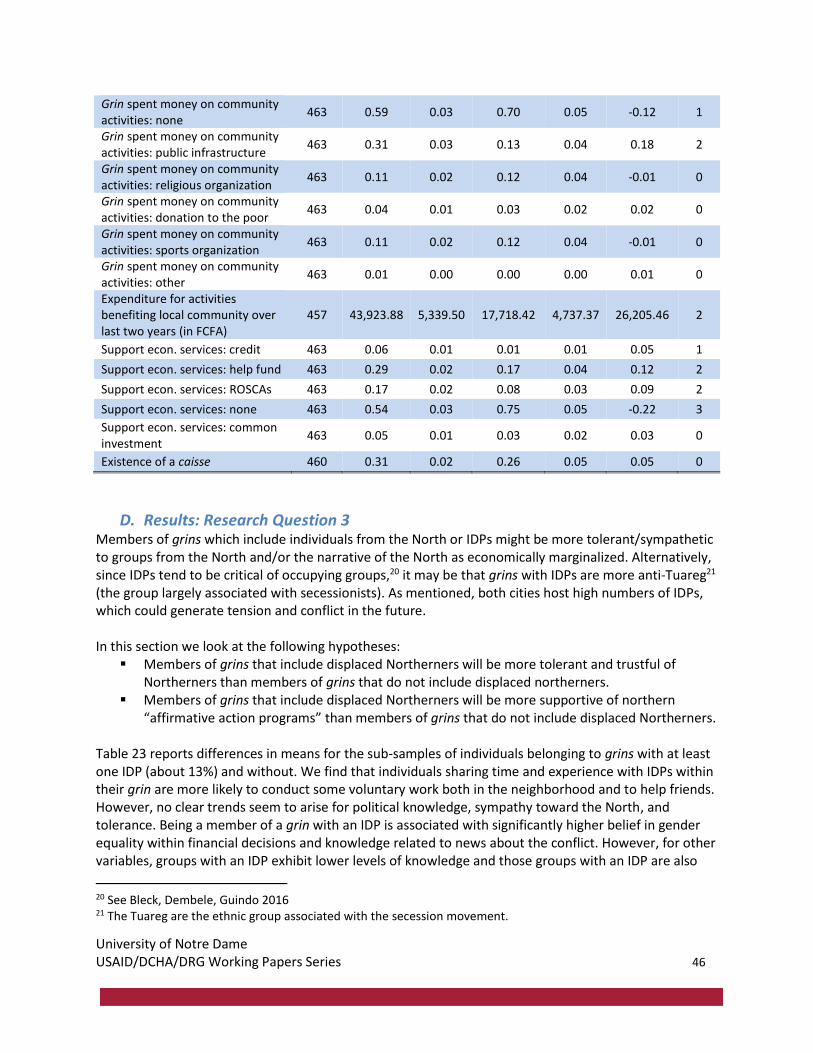
University of Notre Dame USAID/DCHA/DRG Working Papers Series 46
Grin spent money on community activities: none
463 0.59 0.03 0.70 0.05 -0.12 1
Grin spent money on community activities: public infrastructure
463 0.31 0.03 0.13 0.04 0.18 2
Grin spent money on community activities: religious organization
463 0.11 0.02 0.12 0.04 -0.01 0
Grin spent money on community activities: donation to the poor
463 0.04 0.01 0.03 0.02 0.02 0
Grin spent money on community activities: sports organization
463 0.11 0.02 0.12 0.04 -0.01 0
Grin spent money on community activities: other
463 0.01 0.00 0.00 0.00 0.01 0
Expenditure for activities benefiting local community over last two years (in FCFA)
457 43,923.88 5,339.50 17,718.42 4,737.37 26,205.46 2
Support econ. services: credit 463 0.06 0.01 0.01 0.01 0.05 1
Support econ. services: help fund 463 0.29 0.02 0.17 0.04 0.12 2
Support econ. services: ROSCAs 463 0.17 0.02 0.08 0.03 0.09 2
Support econ. services: none 463 0.54 0.03 0.75 0.05 -0.22 3
Support econ. services: common investment
463 0.05 0.01 0.03 0.02 0.03 0
Existence of a caisse 460 0.31 0.02 0.26 0.05 0.05 0
D. Results: Research Question 3 Members of grins which include individuals from the North or IDPs might be more tolerant/sympathetic to groups from the North and/or the narrative of the North as economically marginalized. Alternatively, since IDPs tend to be critical of occupying groups,20 it may be that grins with IDPs are more anti-Tuareg21 (the group largely associated with secessionists). As mentioned, both cities host high numbers of IDPs, which could generate tension and conflict in the future. In this section we look at the following hypotheses:
▪ Members of grins that include displaced Northerners will be more tolerant and trustful of Northerners than members of grins that do not include displaced northerners.
▪ Members of grins that include displaced Northerners will be more supportive of northern “affirmative action programs” than members of grins that do not include displaced Northerners.
Table 23 reports differences in means for the sub-samples of individuals belonging to grins with at least one IDP (about 13%) and without. We find that individuals sharing time and experience with IDPs within their grin are more likely to conduct some voluntary work both in the neighborhood and to help friends. However, no clear trends seem to arise for political knowledge, sympathy toward the North, and tolerance. Being a member of a grin with an IDP is associated with significantly higher belief in gender equality within financial decisions and knowledge related to news about the conflict. However, for other variables, groups with an IDP exhibit lower levels of knowledge and those groups with an IDP are also
20 See Bleck, Dembele, Guindo 2016 21 The Tuareg are the ethnic group associated with the secession movement.
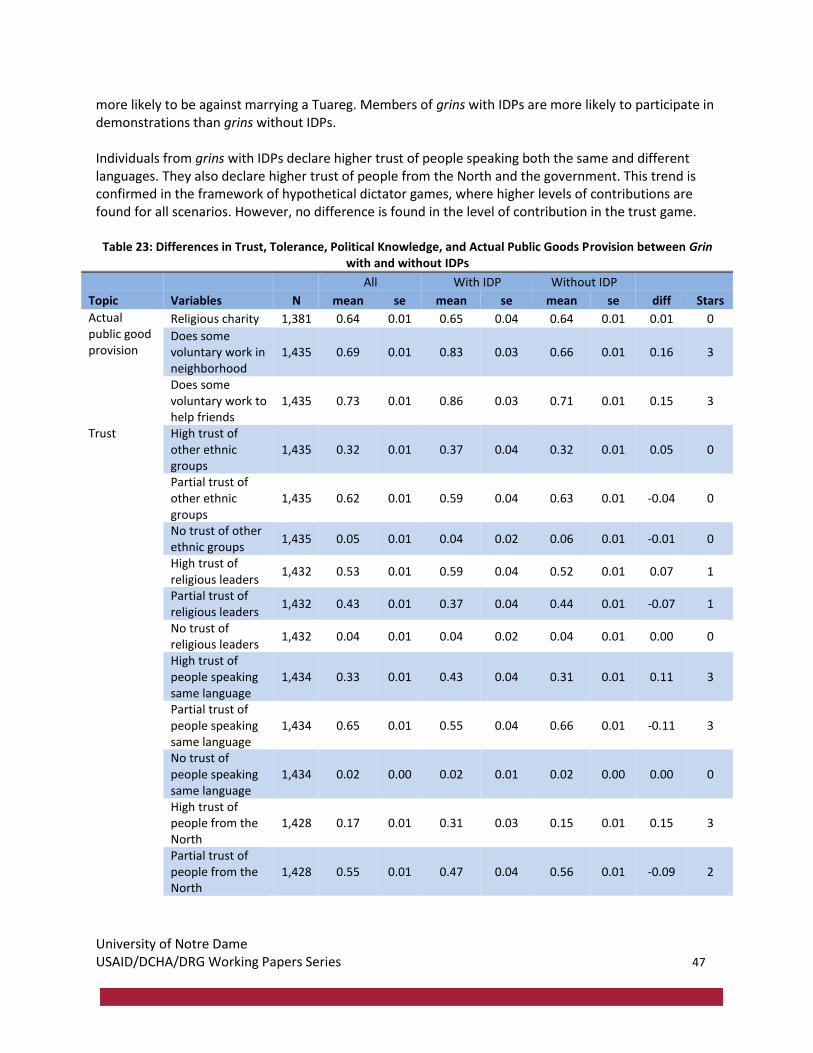
University of Notre Dame USAID/DCHA/DRG Working Papers Series 47
more likely to be against marrying a Tuareg. Members of grins with IDPs are more likely to participate in demonstrations than grins without IDPs. Individuals from grins with IDPs declare higher trust of people speaking both the same and different languages. They also declare higher trust of people from the North and the government. This trend is confirmed in the framework of hypothetical dictator games, where higher levels of contributions are found for all scenarios. However, no difference is found in the level of contribution in the trust game.
Table 23: Differences in Trust, Tolerance, Political Knowledge, and Actual Public Goods Provision between Grin with and without IDPs
All With IDP Without IDP
Topic Variables N mean se mean se mean se diff Stars
Actual public good provision
Religious charity 1,381 0.64 0.01 0.65 0.04 0.64 0.01 0.01 0
Does some voluntary work in neighborhood
1,435 0.69 0.01 0.83 0.03 0.66 0.01 0.16 3
Does some voluntary work to help friends
1,435 0.73 0.01 0.86 0.03 0.71 0.01 0.15 3
Trust High trust of other ethnic groups
1,435 0.32 0.01 0.37 0.04 0.32 0.01 0.05 0
Partial trust of other ethnic groups
1,435 0.62 0.01 0.59 0.04 0.63 0.01 -0.04 0
No trust of other ethnic groups
1,435 0.05 0.01 0.04 0.02 0.06 0.01 -0.01 0
High trust of religious leaders
1,432 0.53 0.01 0.59 0.04 0.52 0.01 0.07 1
Partial trust of religious leaders
1,432 0.43 0.01 0.37 0.04 0.44 0.01 -0.07 1
No trust of religious leaders
1,432 0.04 0.01 0.04 0.02 0.04 0.01 0.00 0
High trust of people speaking same language
1,434 0.33 0.01 0.43 0.04 0.31 0.01 0.11 3
Partial trust of people speaking same language
1,434 0.65 0.01 0.55 0.04 0.66 0.01 -0.11 3
No trust of people speaking same language
1,434 0.02 0.00 0.02 0.01 0.02 0.00 0.00 0
High trust of people from the North
1,428 0.17 0.01 0.31 0.03 0.15 0.01 0.15 3
Partial trust of people from the North
1,428 0.55 0.01 0.47 0.04 0.56 0.01 -0.09 2
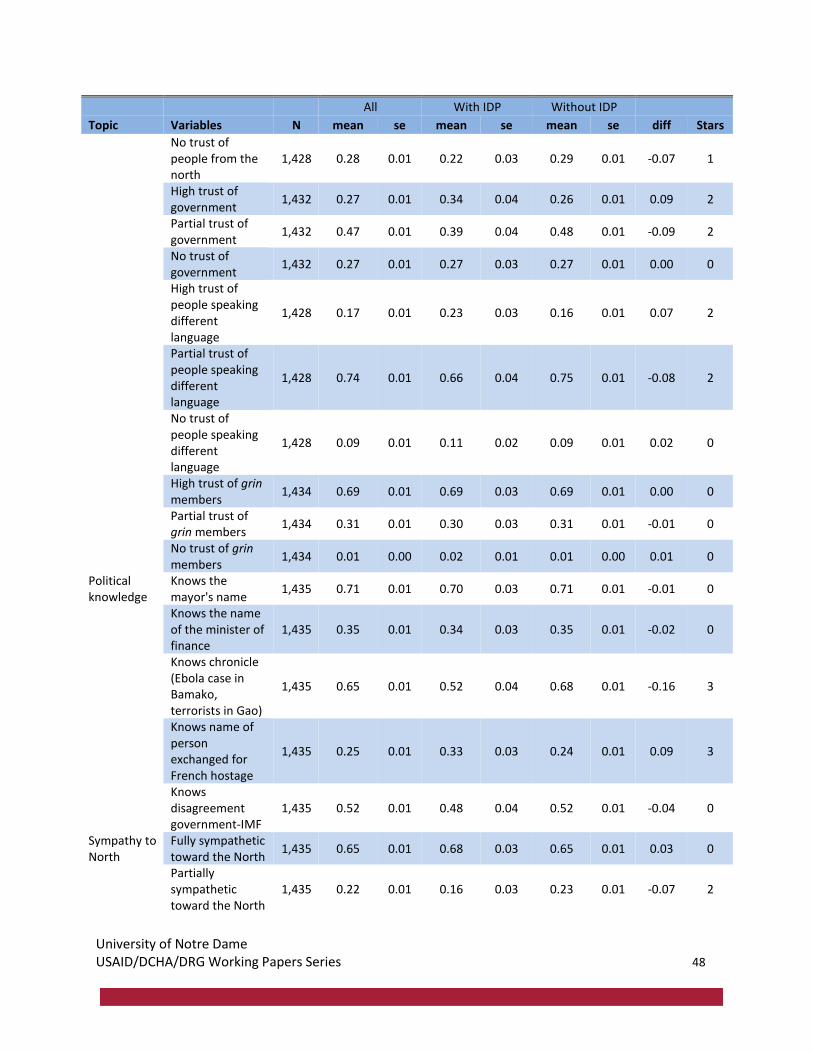
University of Notre Dame USAID/DCHA/DRG Working Papers Series 48
All With IDP Without IDP
Topic Variables N mean se mean se mean se diff Stars
No trust of people from the north
1,428 0.28 0.01 0.22 0.03 0.29 0.01 -0.07 1
High trust of government
1,432 0.27 0.01 0.34 0.04 0.26 0.01 0.09 2
Partial trust of government
1,432 0.47 0.01 0.39 0.04 0.48 0.01 -0.09 2
No trust of government
1,432 0.27 0.01 0.27 0.03 0.27 0.01 0.00 0
High trust of people speaking different language
1,428 0.17 0.01 0.23 0.03 0.16 0.01 0.07 2
Partial trust of people speaking different language
1,428 0.74 0.01 0.66 0.04 0.75 0.01 -0.08 2
No trust of people speaking different language
1,428 0.09 0.01 0.11 0.02 0.09 0.01 0.02 0
High trust of grin members
1,434 0.69 0.01 0.69 0.03 0.69 0.01 0.00 0
Partial trust of grin members
1,434 0.31 0.01 0.30 0.03 0.31 0.01 -0.01 0
No trust of grin members
1,434 0.01 0.00 0.02 0.01 0.01 0.00 0.01 0
Political knowledge
Knows the mayor's name
1,435 0.71 0.01 0.70 0.03 0.71 0.01 -0.01 0
Knows the name of the minister of finance
1,435 0.35 0.01 0.34 0.03 0.35 0.01 -0.02 0
Knows chronicle (Ebola case in Bamako, terrorists in Gao)
1,435 0.65 0.01 0.52 0.04 0.68 0.01 -0.16 3
Knows name of person exchanged for French hostage
1,435 0.25 0.01 0.33 0.03 0.24 0.01 0.09 3
Knows disagreement government-IMF
1,435 0.52 0.01 0.48 0.04 0.52 0.01 -0.04 0
Sympathy to North
Fully sympathetic toward the North
1,435 0.65 0.01 0.68 0.03 0.65 0.01 0.03 0
Partially sympathetic toward the North
1,435 0.22 0.01 0.16 0.03 0.23 0.01 -0.07 2
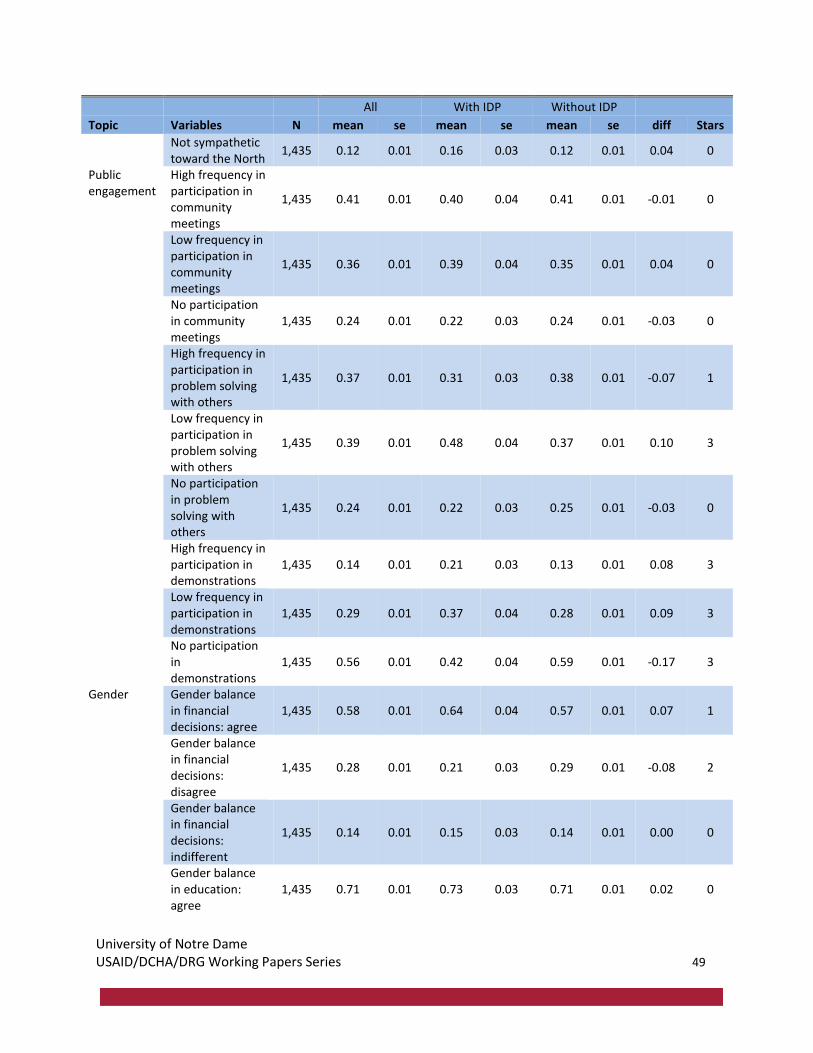
University of Notre Dame USAID/DCHA/DRG Working Papers Series 49
All With IDP Without IDP
Topic Variables N mean se mean se mean se diff Stars
Not sympathetic toward the North
1,435 0.12 0.01 0.16 0.03 0.12 0.01 0.04 0
Public engagement
High frequency in participation in community meetings
1,435 0.41 0.01 0.40 0.04 0.41 0.01 -0.01 0
Low frequency in participation in community meetings
1,435 0.36 0.01 0.39 0.04 0.35 0.01 0.04 0
No participation in community meetings
1,435 0.24 0.01 0.22 0.03 0.24 0.01 -0.03 0
High frequency in participation in problem solving with others
1,435 0.37 0.01 0.31 0.03 0.38 0.01 -0.07 1
Low frequency in participation in problem solving with others
1,435 0.39 0.01 0.48 0.04 0.37 0.01 0.10 3
No participation in problem solving with others
1,435 0.24 0.01 0.22 0.03 0.25 0.01 -0.03 0
High frequency in participation in demonstrations
1,435 0.14 0.01 0.21 0.03 0.13 0.01 0.08 3
Low frequency in participation in demonstrations
1,435 0.29 0.01 0.37 0.04 0.28 0.01 0.09 3
No participation in demonstrations
1,435 0.56 0.01 0.42 0.04 0.59 0.01 -0.17 3
Gender Gender balance in financial decisions: agree
1,435 0.58 0.01 0.64 0.04 0.57 0.01 0.07 1
Gender balance in financial decisions: disagree
1,435 0.28 0.01 0.21 0.03 0.29 0.01 -0.08 2
Gender balance in financial decisions: indifferent
1,435 0.14 0.01 0.15 0.03 0.14 0.01 0.00 0
Gender balance in education: agree
1,435 0.71 0.01 0.73 0.03 0.71 0.01 0.02 0
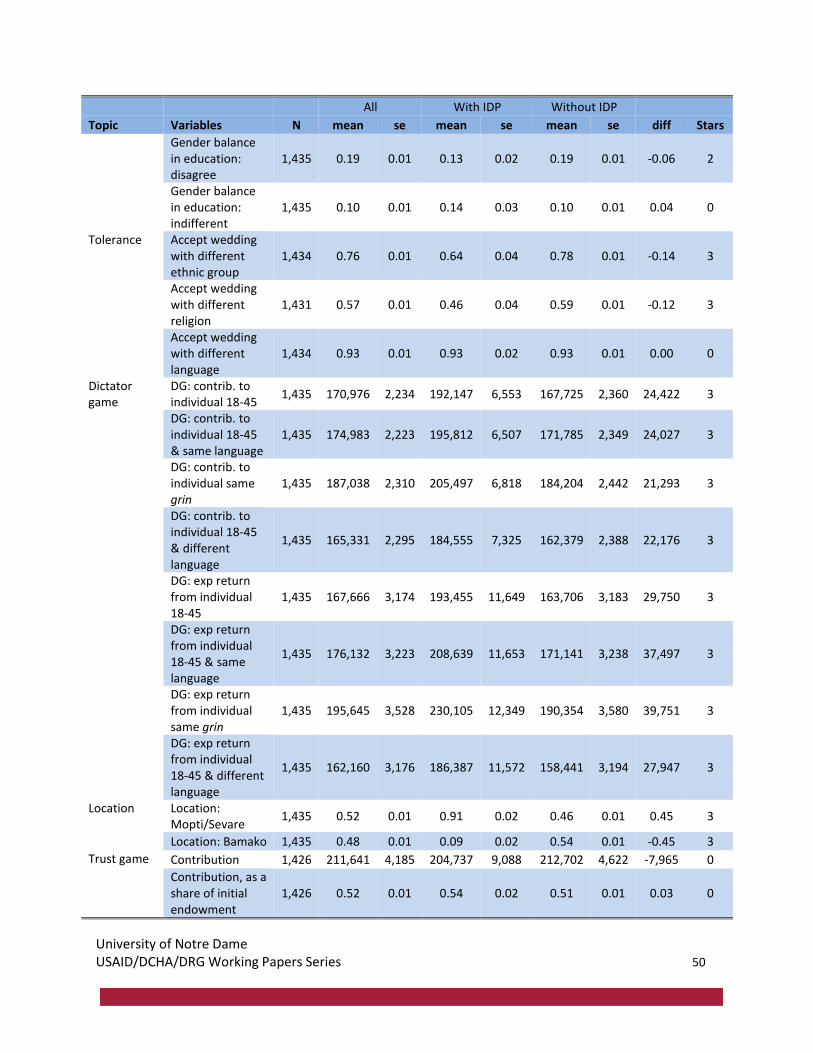
University of Notre Dame USAID/DCHA/DRG Working Papers Series 50
All With IDP Without IDP
Topic Variables N mean se mean se mean se diff Stars
Gender balance in education: disagree
1,435 0.19 0.01 0.13 0.02 0.19 0.01 -0.06 2
Gender balance in education: indifferent
1,435 0.10 0.01 0.14 0.03 0.10 0.01 0.04 0
Tolerance Accept wedding with different ethnic group
1,434 0.76 0.01 0.64 0.04 0.78 0.01 -0.14 3
Accept wedding with different religion
1,431 0.57 0.01 0.46 0.04 0.59 0.01 -0.12 3
Accept wedding with different language
1,434 0.93 0.01 0.93 0.02 0.93 0.01 0.00 0
Dictator game
DG: contrib. to individual 18-45
1,435 170,976 2,234 192,147 6,553 167,725 2,360 24,422 3
DG: contrib. to individual 18-45 & same language
1,435 174,983 2,223 195,812 6,507 171,785 2,349 24,027 3
DG: contrib. to individual same grin
1,435 187,038 2,310 205,497 6,818 184,204 2,442 21,293 3
DG: contrib. to individual 18-45 & different language
1,435 165,331 2,295 184,555 7,325 162,379 2,388 22,176 3
DG: exp return from individual 18-45
1,435 167,666 3,174 193,455 11,649 163,706 3,183 29,750 3
DG: exp return from individual 18-45 & same language
1,435 176,132 3,223 208,639 11,653 171,141 3,238 37,497 3
DG: exp return from individual same grin
1,435 195,645 3,528 230,105 12,349 190,354 3,580 39,751 3
DG: exp return from individual 18-45 & different language
1,435 162,160 3,176 186,387 11,572 158,441 3,194 27,947 3
Location Location: Mopti/Sevare
1,435 0.52 0.01 0.91 0.02 0.46 0.01 0.45 3
Location: Bamako 1,435 0.48 0.01 0.09 0.02 0.54 0.01 -0.45 3
Trust game Contribution 1,426 211,641 4,185 204,737 9,088 212,702 4,622 -7,965 0
Contribution, as a share of initial endowment
1,426 0.52 0.01 0.54 0.02 0.51 0.01 0.03 0
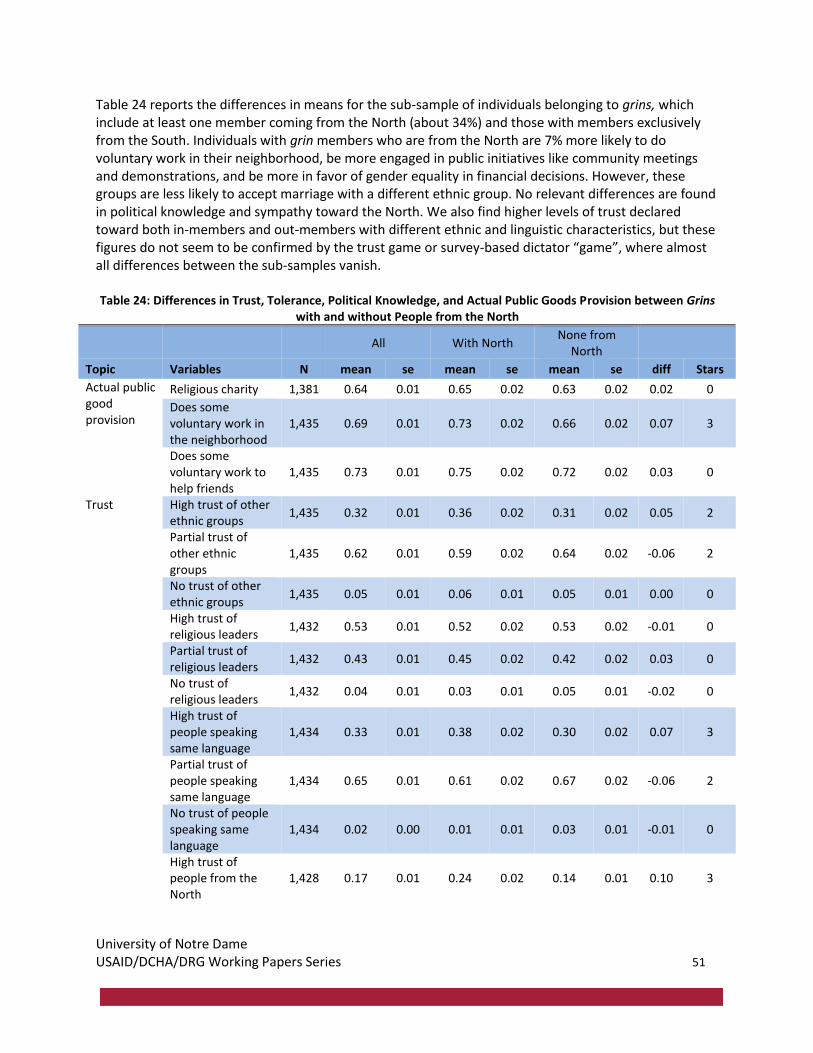
University of Notre Dame USAID/DCHA/DRG Working Papers Series 51
Table 24 reports the differences in means for the sub-sample of individuals belonging to grins, which include at least one member coming from the North (about 34%) and those with members exclusively from the South. Individuals with grin members who are from the North are 7% more likely to do voluntary work in their neighborhood, be more engaged in public initiatives like community meetings and demonstrations, and be more in favor of gender equality in financial decisions. However, these groups are less likely to accept marriage with a different ethnic group. No relevant differences are found in political knowledge and sympathy toward the North. We also find higher levels of trust declared toward both in-members and out-members with different ethnic and linguistic characteristics, but these figures do not seem to be confirmed by the trust game or survey-based dictator “game”, where almost all differences between the sub-samples vanish. Table 24: Differences in Trust, Tolerance, Political Knowledge, and Actual Public Goods Provision between Grins
with and without People from the North
All With North None from
North
Topic Variables N mean se mean se mean se diff Stars
Actual public good provision
Religious charity 1,381 0.64 0.01 0.65 0.02 0.63 0.02 0.02 0
Does some voluntary work in the neighborhood
1,435 0.69 0.01 0.73 0.02 0.66 0.02 0.07 3
Does some voluntary work to help friends
1,435 0.73 0.01 0.75 0.02 0.72 0.02 0.03 0
Trust High trust of other ethnic groups
1,435 0.32 0.01 0.36 0.02 0.31 0.02 0.05 2
Partial trust of other ethnic groups
1,435 0.62 0.01 0.59 0.02 0.64 0.02 -0.06 2
No trust of other ethnic groups
1,435 0.05 0.01 0.06 0.01 0.05 0.01 0.00 0
High trust of religious leaders
1,432 0.53 0.01 0.52 0.02 0.53 0.02 -0.01 0
Partial trust of religious leaders
1,432 0.43 0.01 0.45 0.02 0.42 0.02 0.03 0
No trust of religious leaders
1,432 0.04 0.01 0.03 0.01 0.05 0.01 -0.02 0
High trust of people speaking same language
1,434 0.33 0.01 0.38 0.02 0.30 0.02 0.07 3
Partial trust of people speaking same language
1,434 0.65 0.01 0.61 0.02 0.67 0.02 -0.06 2
No trust of people speaking same language
1,434 0.02 0.00 0.01 0.01 0.03 0.01 -0.01 0
High trust of people from the North
1,428 0.17 0.01 0.24 0.02 0.14 0.01 0.10 3
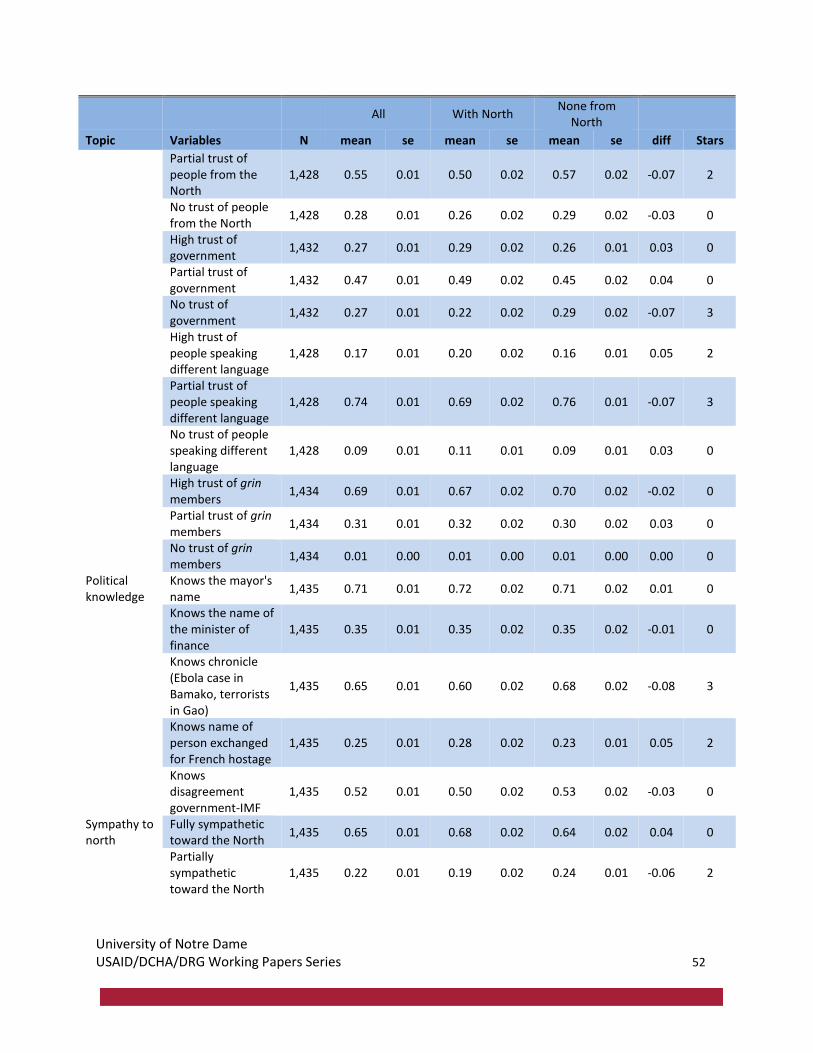
University of Notre Dame USAID/DCHA/DRG Working Papers Series 52
All With North None from
North
Topic Variables N mean se mean se mean se diff Stars
Partial trust of people from the North
1,428 0.55 0.01 0.50 0.02 0.57 0.02 -0.07 2
No trust of people from the North
1,428 0.28 0.01 0.26 0.02 0.29 0.02 -0.03 0
High trust of government
1,432 0.27 0.01 0.29 0.02 0.26 0.01 0.03 0
Partial trust of government
1,432 0.47 0.01 0.49 0.02 0.45 0.02 0.04 0
No trust of government
1,432 0.27 0.01 0.22 0.02 0.29 0.02 -0.07 3
High trust of people speaking different language
1,428 0.17 0.01 0.20 0.02 0.16 0.01 0.05 2
Partial trust of people speaking different language
1,428 0.74 0.01 0.69 0.02 0.76 0.01 -0.07 3
No trust of people speaking different language
1,428 0.09 0.01 0.11 0.01 0.09 0.01 0.03 0
High trust of grin members
1,434 0.69 0.01 0.67 0.02 0.70 0.02 -0.02 0
Partial trust of grin members
1,434 0.31 0.01 0.32 0.02 0.30 0.02 0.03 0
No trust of grin members
1,434 0.01 0.00 0.01 0.00 0.01 0.00 0.00 0
Political knowledge
Knows the mayor's name
1,435 0.71 0.01 0.72 0.02 0.71 0.02 0.01 0
Knows the name of the minister of finance
1,435 0.35 0.01 0.35 0.02 0.35 0.02 -0.01 0
Knows chronicle (Ebola case in Bamako, terrorists in Gao)
1,435 0.65 0.01 0.60 0.02 0.68 0.02 -0.08 3
Knows name of person exchanged for French hostage
1,435 0.25 0.01 0.28 0.02 0.23 0.01 0.05 2
Knows disagreement government-IMF
1,435 0.52 0.01 0.50 0.02 0.53 0.02 -0.03 0
Sympathy to north
Fully sympathetic toward the North
1,435 0.65 0.01 0.68 0.02 0.64 0.02 0.04 0
Partially sympathetic toward the North
1,435 0.22 0.01 0.19 0.02 0.24 0.01 -0.06 2
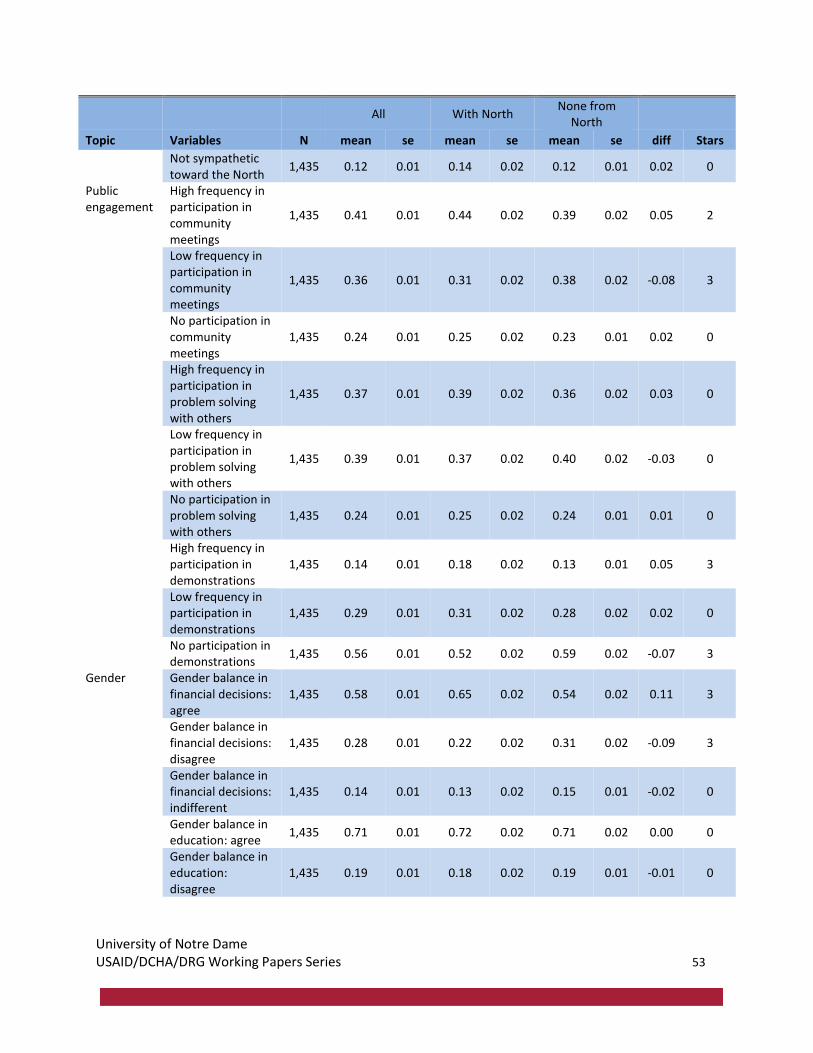
University of Notre Dame USAID/DCHA/DRG Working Papers Series 53
All With North None from
North
Topic Variables N mean se mean se mean se diff Stars
Not sympathetic toward the North
1,435 0.12 0.01 0.14 0.02 0.12 0.01 0.02 0
Public engagement
High frequency in participation in community meetings
1,435 0.41 0.01 0.44 0.02 0.39 0.02 0.05 2
Low frequency in participation in community meetings
1,435 0.36 0.01 0.31 0.02 0.38 0.02 -0.08 3
No participation in community meetings
1,435 0.24 0.01 0.25 0.02 0.23 0.01 0.02 0
High frequency in participation in problem solving with others
1,435 0.37 0.01 0.39 0.02 0.36 0.02 0.03 0
Low frequency in participation in problem solving with others
1,435 0.39 0.01 0.37 0.02 0.40 0.02 -0.03 0
No participation in problem solving with others
1,435 0.24 0.01 0.25 0.02 0.24 0.01 0.01 0
High frequency in participation in demonstrations
1,435 0.14 0.01 0.18 0.02 0.13 0.01 0.05 3
Low frequency in participation in demonstrations
1,435 0.29 0.01 0.31 0.02 0.28 0.02 0.02 0
No participation in demonstrations
1,435 0.56 0.01 0.52 0.02 0.59 0.02 -0.07 3
Gender Gender balance in financial decisions: agree
1,435 0.58 0.01 0.65 0.02 0.54 0.02 0.11 3
Gender balance in financial decisions: disagree
1,435 0.28 0.01 0.22 0.02 0.31 0.02 -0.09 3
Gender balance in financial decisions: indifferent
1,435 0.14 0.01 0.13 0.02 0.15 0.01 -0.02 0
Gender balance in education: agree
1,435 0.71 0.01 0.72 0.02 0.71 0.02 0.00 0
Gender balance in education: disagree
1,435 0.19 0.01 0.18 0.02 0.19 0.01 -0.01 0
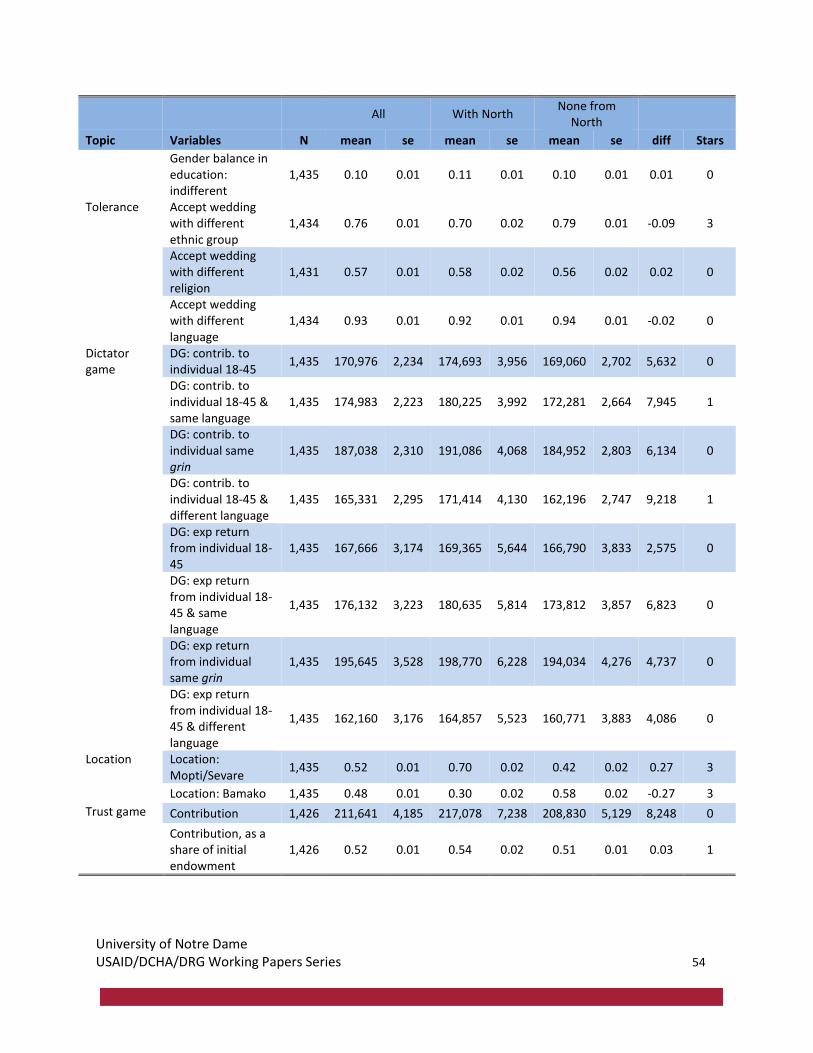
University of Notre Dame USAID/DCHA/DRG Working Papers Series 54
All With North None from
North
Topic Variables N mean se mean se mean se diff Stars
Gender balance in education: indifferent
1,435 0.10 0.01 0.11 0.01 0.10 0.01 0.01 0
Tolerance Accept wedding with different ethnic group
1,434 0.76 0.01 0.70 0.02 0.79 0.01 -0.09 3
Accept wedding with different religion
1,431 0.57 0.01 0.58 0.02 0.56 0.02 0.02 0
Accept wedding with different language
1,434 0.93 0.01 0.92 0.01 0.94 0.01 -0.02 0
Dictator game
DG: contrib. to individual 18-45
1,435 170,976 2,234 174,693 3,956 169,060 2,702 5,632 0
DG: contrib. to individual 18-45 & same language
1,435 174,983 2,223 180,225 3,992 172,281 2,664 7,945 1
DG: contrib. to individual same grin
1,435 187,038 2,310 191,086 4,068 184,952 2,803 6,134 0
DG: contrib. to individual 18-45 & different language
1,435 165,331 2,295 171,414 4,130 162,196 2,747 9,218 1
DG: exp return from individual 18-45
1,435 167,666 3,174 169,365 5,644 166,790 3,833 2,575 0
DG: exp return from individual 18-45 & same language
1,435 176,132 3,223 180,635 5,814 173,812 3,857 6,823 0
DG: exp return from individual same grin
1,435 195,645 3,528 198,770 6,228 194,034 4,276 4,737 0
DG: exp return from individual 18-45 & different language
1,435 162,160 3,176 164,857 5,523 160,771 3,883 4,086 0
Location Location: Mopti/Sevare
1,435 0.52 0.01 0.70 0.02 0.42 0.02 0.27 3
Location: Bamako 1,435 0.48 0.01 0.30 0.02 0.58 0.02 -0.27 3
Trust game Contribution 1,426 211,641 4,185 217,078 7,238 208,830 5,129 8,248 0
Contribution, as a share of initial endowment
1,426 0.52 0.01 0.54 0.02 0.51 0.01 0.03 1
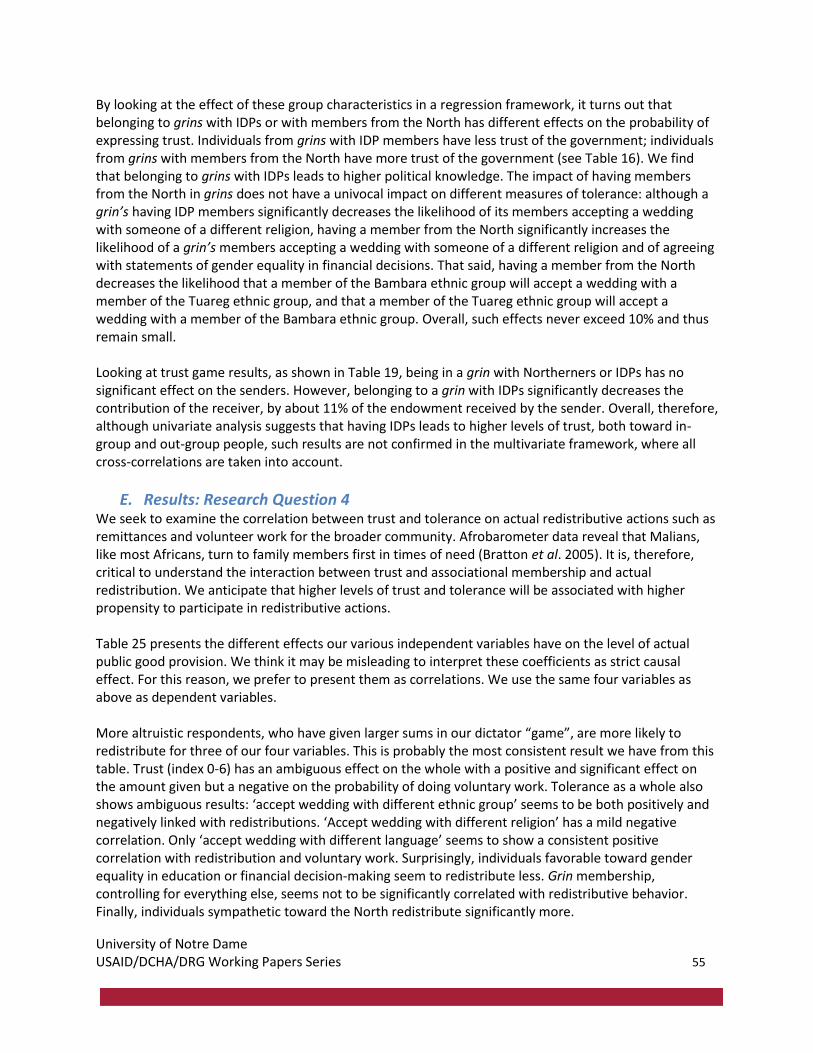
University of Notre Dame USAID/DCHA/DRG Working Papers Series 55
By looking at the effect of these group characteristics in a regression framework, it turns out that belonging to grins with IDPs or with members from the North has different effects on the probability of expressing trust. Individuals from grins with IDP members have less trust of the government; individuals from grins with members from the North have more trust of the government (see Table 16). We find that belonging to grins with IDPs leads to higher political knowledge. The impact of having members from the North in grins does not have a univocal impact on different measures of tolerance: although a grin’s having IDP members significantly decreases the likelihood of its members accepting a wedding with someone of a different religion, having a member from the North significantly increases the likelihood of a grin’s members accepting a wedding with someone of a different religion and of agreeing with statements of gender equality in financial decisions. That said, having a member from the North decreases the likelihood that a member of the Bambara ethnic group will accept a wedding with a member of the Tuareg ethnic group, and that a member of the Tuareg ethnic group will accept a wedding with a member of the Bambara ethnic group. Overall, such effects never exceed 10% and thus remain small. Looking at trust game results, as shown in Table 19, being in a grin with Northerners or IDPs has no significant effect on the senders. However, belonging to a grin with IDPs significantly decreases the contribution of the receiver, by about 11% of the endowment received by the sender. Overall, therefore, although univariate analysis suggests that having IDPs leads to higher levels of trust, both toward in-group and out-group people, such results are not confirmed in the multivariate framework, where all cross-correlations are taken into account.
E. Results: Research Question 4 We seek to examine the correlation between trust and tolerance on actual redistributive actions such as remittances and volunteer work for the broader community. Afrobarometer data reveal that Malians, like most Africans, turn to family members first in times of need (Bratton et al. 2005). It is, therefore, critical to understand the interaction between trust and associational membership and actual redistribution. We anticipate that higher levels of trust and tolerance will be associated with higher propensity to participate in redistributive actions. Table 25 presents the different effects our various independent variables have on the level of actual public good provision. We think it may be misleading to interpret these coefficients as strict causal effect. For this reason, we prefer to present them as correlations. We use the same four variables as above as dependent variables. More altruistic respondents, who have given larger sums in our dictator “game”, are more likely to redistribute for three of our four variables. This is probably the most consistent result we have from this table. Trust (index 0-6) has an ambiguous effect on the whole with a positive and significant effect on the amount given but a negative on the probability of doing voluntary work. Tolerance as a whole also shows ambiguous results: ‘accept wedding with different ethnic group’ seems to be both positively and negatively linked with redistributions. ‘Accept wedding with different religion’ has a mild negative correlation. Only ‘accept wedding with different language’ seems to show a consistent positive correlation with redistribution and voluntary work. Surprisingly, individuals favorable toward gender equality in education or financial decision-making seem to redistribute less. Grin membership, controlling for everything else, seems not to be significantly correlated with redistributive behavior. Finally, individuals sympathetic toward the North redistribute significantly more.
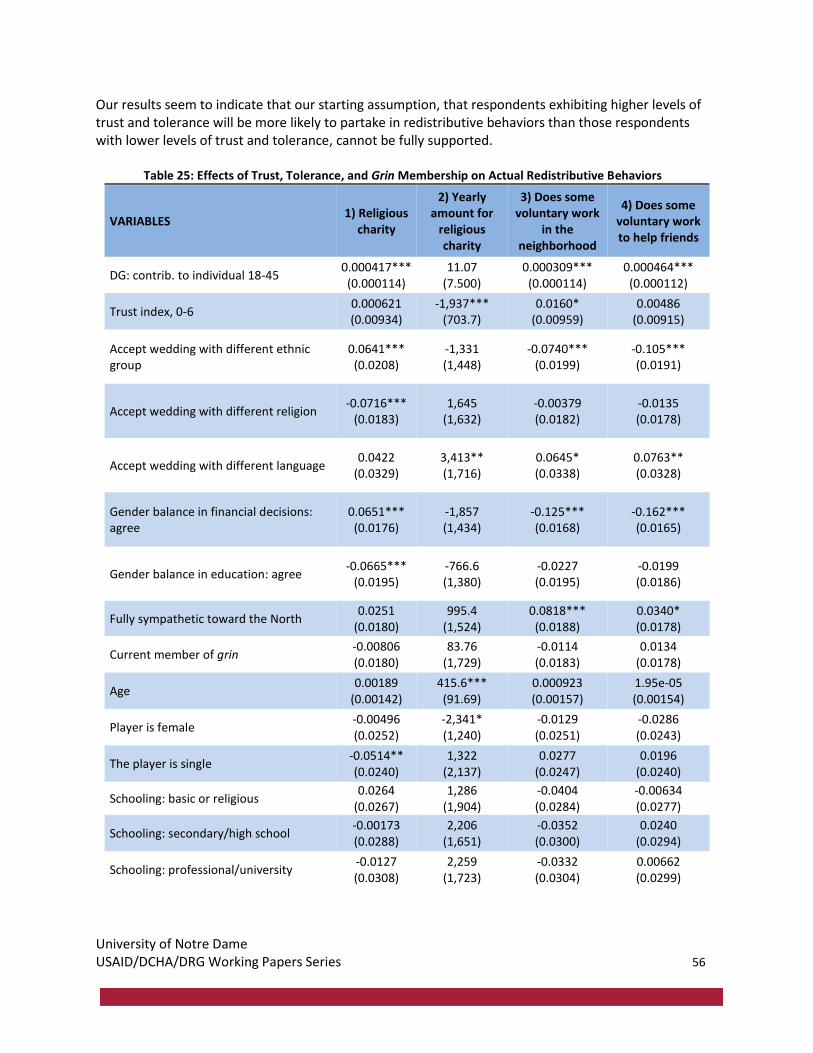
University of Notre Dame USAID/DCHA/DRG Working Papers Series 56
Our results seem to indicate that our starting assumption, that respondents exhibiting higher levels of trust and tolerance will be more likely to partake in redistributive behaviors than those respondents with lower levels of trust and tolerance, cannot be fully supported.
Table 25: Effects of Trust, Tolerance, and Grin Membership on Actual Redistributive Behaviors
VARIABLES 1) Religious
charity
2) Yearly amount for
religious charity
3) Does some voluntary work
in the neighborhood
4) Does some voluntary work to help friends
DG: contrib. to individual 18-45 0.000417*** (0.000114)
11.07 (7.500)
0.000309*** (0.000114)
0.000464*** (0.000112)
Trust index, 0-6 0.000621 (0.00934)
-1,937*** (703.7)
0.0160* (0.00959)
0.00486 (0.00915)
Accept wedding with different ethnic group
0.0641*** (0.0208)
-1,331 (1,448)
-0.0740*** (0.0199)
-0.105*** (0.0191)
Accept wedding with different religion -0.0716***
(0.0183) 1,645
(1,632) -0.00379 (0.0182)
-0.0135 (0.0178)
Accept wedding with different language 0.0422
(0.0329) 3,413** (1,716)
0.0645* (0.0338)
0.0763** (0.0328)
Gender balance in financial decisions: agree
0.0651*** (0.0176)
-1,857 (1,434)
-0.125*** (0.0168)
-0.162*** (0.0165)
Gender balance in education: agree -0.0665***
(0.0195) -766.6 (1,380)
-0.0227 (0.0195)
-0.0199 (0.0186)
Fully sympathetic toward the North 0.0251
(0.0180) 995.4
(1,524) 0.0818*** (0.0188)
0.0340* (0.0178)
Current member of grin -0.00806 (0.0180)
83.76 (1,729)
-0.0114 (0.0183)
0.0134 (0.0178)
Age 0.00189
(0.00142) 415.6*** (91.69)
0.000923 (0.00157)
1.95e-05 (0.00154)
Player is female -0.00496 (0.0252)
-2,341* (1,240)
-0.0129 (0.0251)
-0.0286 (0.0243)
The player is single -0.0514** (0.0240)
1,322 (2,137)
0.0277 (0.0247)
0.0196 (0.0240)
Schooling: basic or religious 0.0264
(0.0267) 1,286
(1,904) -0.0404 (0.0284)
-0.00634 (0.0277)
Schooling: secondary/high school -0.00173 (0.0288)
2,206 (1,651)
-0.0352 (0.0300)
0.0240 (0.0294)
Schooling: professional/university -0.0127 (0.0308)
2,259 (1,723)
-0.0332 (0.0304)
0.00662 (0.0299)
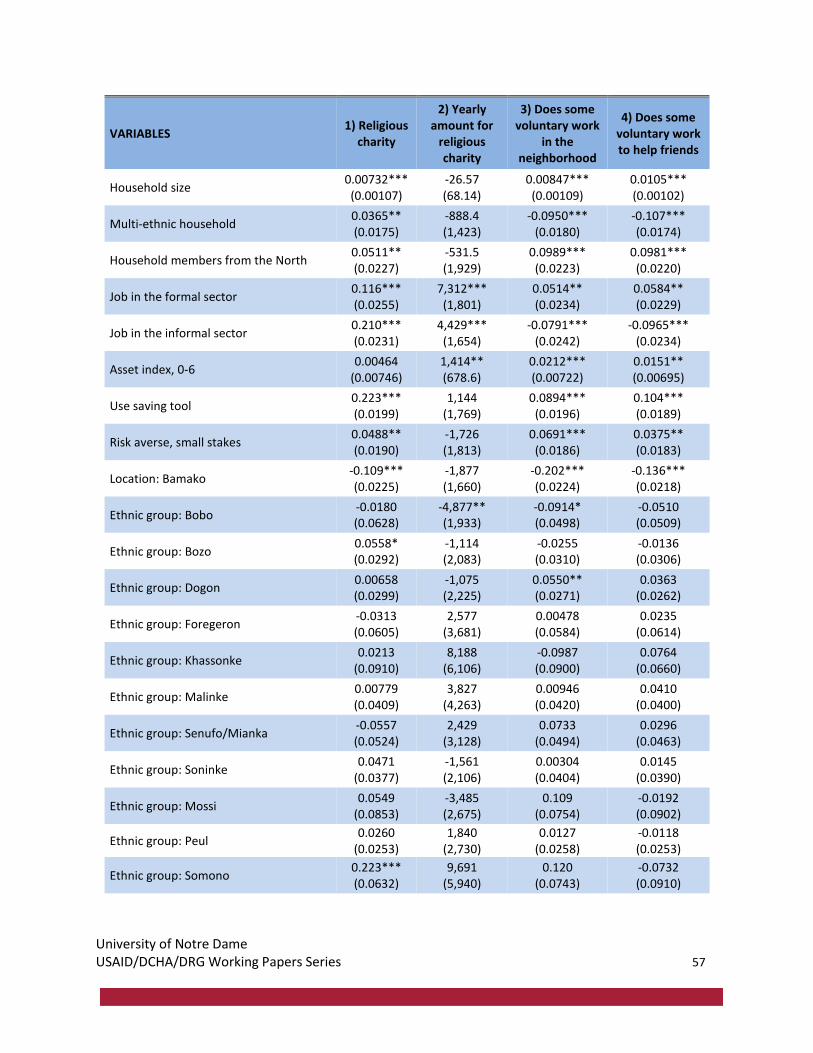
University of Notre Dame USAID/DCHA/DRG Working Papers Series 57
VARIABLES 1) Religious
charity
2) Yearly amount for
religious charity
3) Does some voluntary work
in the neighborhood
4) Does some voluntary work to help friends
Household size 0.00732*** (0.00107)
-26.57 (68.14)
0.00847*** (0.00109)
0.0105*** (0.00102)
Multi-ethnic household 0.0365** (0.0175)
-888.4 (1,423)
-0.0950*** (0.0180)
-0.107*** (0.0174)
Household members from the North 0.0511** (0.0227)
-531.5 (1,929)
0.0989*** (0.0223)
0.0981*** (0.0220)
Job in the formal sector 0.116*** (0.0255)
7,312*** (1,801)
0.0514** (0.0234)
0.0584** (0.0229)
Job in the informal sector 0.210*** (0.0231)
4,429*** (1,654)
-0.0791*** (0.0242)
-0.0965*** (0.0234)
Asset index, 0-6 0.00464
(0.00746) 1,414** (678.6)
0.0212*** (0.00722)
0.0151** (0.00695)
Use saving tool 0.223*** (0.0199)
1,144 (1,769)
0.0894*** (0.0196)
0.104*** (0.0189)
Risk averse, small stakes 0.0488** (0.0190)
-1,726 (1,813)
0.0691*** (0.0186)
0.0375** (0.0183)
Location: Bamako -0.109*** (0.0225)
-1,877 (1,660)
-0.202*** (0.0224)
-0.136*** (0.0218)
Ethnic group: Bobo -0.0180 (0.0628)
-4,877** (1,933)
-0.0914* (0.0498)
-0.0510 (0.0509)
Ethnic group: Bozo 0.0558* (0.0292)
-1,114 (2,083)
-0.0255 (0.0310)
-0.0136 (0.0306)
Ethnic group: Dogon 0.00658 (0.0299)
-1,075 (2,225)
0.0550** (0.0271)
0.0363 (0.0262)
Ethnic group: Foregeron -0.0313 (0.0605)
2,577 (3,681)
0.00478 (0.0584)
0.0235 (0.0614)
Ethnic group: Khassonke 0.0213
(0.0910) 8,188
(6,106) -0.0987 (0.0900)
0.0764 (0.0660)
Ethnic group: Malinke 0.00779 (0.0409)
3,827 (4,263)
0.00946 (0.0420)
0.0410 (0.0400)
Ethnic group: Senufo/Mianka -0.0557 (0.0524)
2,429 (3,128)
0.0733 (0.0494)
0.0296 (0.0463)
Ethnic group: Soninke 0.0471
(0.0377) -1,561 (2,106)
0.00304 (0.0404)
0.0145 (0.0390)
Ethnic group: Mossi 0.0549
(0.0853) -3,485 (2,675)
0.109 (0.0754)
-0.0192 (0.0902)
Ethnic group: Peul 0.0260
(0.0253) 1,840
(2,730) 0.0127
(0.0258) -0.0118 (0.0253)
Ethnic group: Somono 0.223*** (0.0632)
9,691 (5,940)
0.120 (0.0743)
-0.0732 (0.0910)
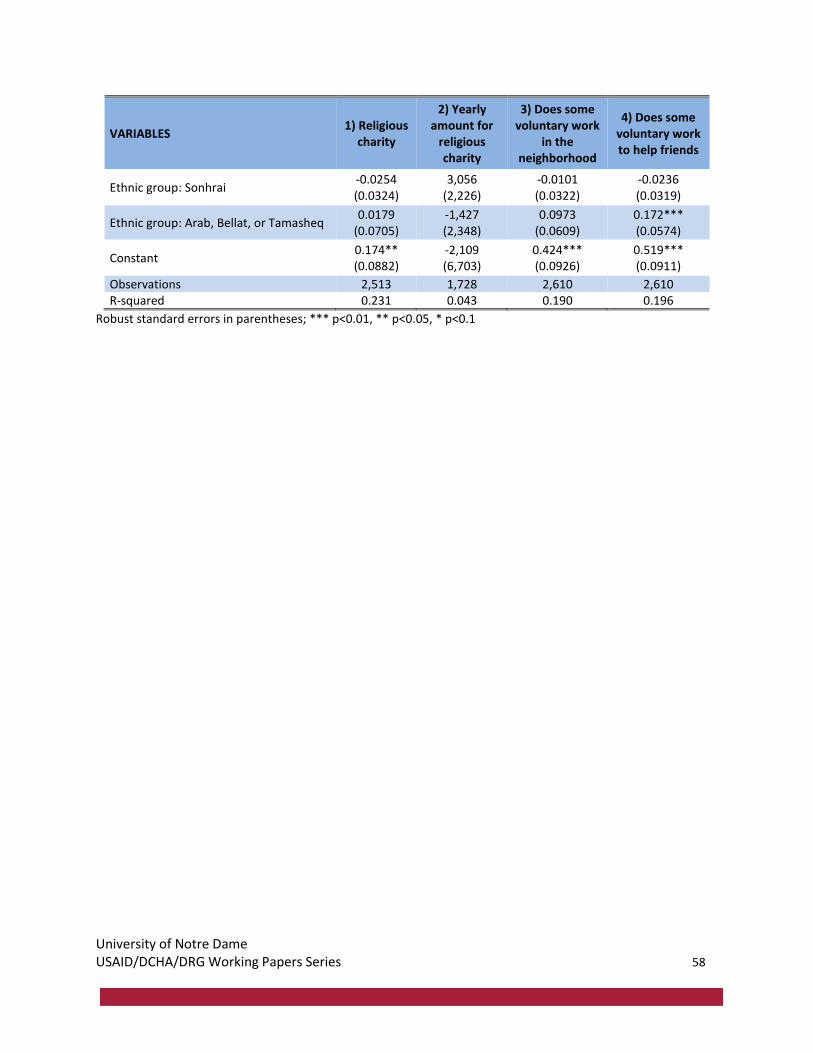
University of Notre Dame USAID/DCHA/DRG Working Papers Series 58
VARIABLES 1) Religious
charity
2) Yearly amount for
religious charity
3) Does some voluntary work
in the neighborhood
4) Does some voluntary work to help friends
Ethnic group: Sonhrai -0.0254 (0.0324)
3,056 (2,226)
-0.0101 (0.0322)
-0.0236 (0.0319)
Ethnic group: Arab, Bellat, or Tamasheq 0.0179
(0.0705) -1,427 (2,348)
0.0973 (0.0609)
0.172*** (0.0574)
Constant 0.174** (0.0882)
-2,109 (6,703)
0.424*** (0.0926)
0.519*** (0.0911)
Observations 2,513 1,728 2,610 2,610 R-squared 0.231 0.043 0.190 0.196
Robust standard errors in parentheses; *** p<0.01, ** p<0.05, * p<0.1
University of Notre Dame USAID/DCHA/DRG Working Papers Series 59
REFERENCES Alzua, M. L., Cardenas, J. C., and Djebbari, H. 2014. “Community mobilization around social dilemmas: evidence from lab experiments in rural Mali,” Technical report, CEDLAS, Universidad Nacional de La Plata. Barr, Abigail M. 2003. “Trust and Expected Trustworthiness: Experimental Evidence from Zimbabwean Villages.” Economic Journal, 113(489), pp. 614-30. Berg, Joyce E.; Dickhaut, John W., and McCabe, Kevin F. 1995. “Trust, Reciprocity, and Social History.” Games and Economic Behavior, 10, pp. 122-42. Bleck, Jaimie. 2015. Education and Empowered Citizenship in Mali. Baltimore: Johns Hopkins University Press. Bleck, J., A. Dembele, and S. Guindo. 2016. “Reconstructing the Malian State: Perspectives of Internally Displaced Persons.” Working Paper. Brinkerhoff, Derick. 2005. “Rebuilding governance in failed states and post-conflict societies: core concepts and cross-cutting themes.” Public Administration and Development. 25 (1): 3-14. Dagnelie, O. and LeMay-Boucher, P. 2012. “Rosca Participation in Benin: a Commitment Issue.” Oxford Bulletin of Economics and Statistics, 74(2), pp. 235-252. Dunning, Thad and Lauren Harrison. 2010. “Cross-cutting Cleavages and Ethnic Voting: An Experimental Study of Cousinage in Mali.” American Political Science Review 104 (1): 1-19. Etang, A., Fielding, D., and Knowles, S. 2011. “Does trust extend beyond the village? Experimental trust
and social distance in Cameroon.” Experimental Economics, 14, 15–35. Fearon, J., M. Humphreys, and J. Weinstein. 2009. “Can Development Aid Contribute to Social Cohesion after Civil War? Evidence from a Field Experiment in Post-Conflict Liberia.” American Economic Review 99 (2): 287-291. Fung, Archon. 2003. “Association and Democracy: Between Theories, Hopes, and Realities.” Annual Review of Sociology. 29:515–39. Glaeser, Edward L., Laibson, David I., Scheinkman, Jose A., and Soutter, Christine L. 2000. “Measuring Trust.” Quarterly Journal of Economics, 115, pp. 811-46. Granovetter, M. 1978. “Threshold models of collective behavior.” American Journal of Sociology, 1420-1443. Karlan, D. 2005. “Using Experimental Economics to Measure Social Capital and Predict Financial Decisions.” American Economic Review, 95(5), pp. 1688-1699.
University of Notre Dame USAID/DCHA/DRG Working Papers Series 60
DeJorio, Rosa. 2006. “Politics of Remembering and Forgetting: The Struggle over Colonial Monuments in Mali.” Africa Today 52 (4): 79-106. Lecocq, B., Mann, G., Whitehouse, B., Badi, D., Pelckmans, L., Belalimat, N., and Lacher, W. 2013. “One hippopotamus and eight blind analysts: a multivocal analysis of the 2012 political crisis in the divided Republic of Mali.” Review of African Political Economy, (ahead-of-print), 1-15. Meillassoux, Claude. Urbanization of an African community: Voluntary associations in Bamako. 1968. Vol. 45. Seattle, London: University of Washington Press. Mosley, P., and Verschoor, A. 2003. “The development of trust and social capital in rural Uganda: An experimental approach.” Working paper. Paluck, E. L. 2009. “Reducing intergroup prejudice and conflict using the media: a field experiment in Rwanda.” Journal of Personality and Social Psychology, 96(3), 574. Putnam, R. D. 1995. “Bowling alone: America’s declining social capital.” Journal of Democracy, 6(1), 65-78. Putnam, R. 1993. “The prosperous community: social capital and public life.” The American Prospect,
13(Spring), Vol. 4. http://www.prospect.org/print/vol/13 (accessed 7 April 2003). Pringle, Robert. 2005. Democratization in Mali: Putting History to Work. Washington, DC: United States Institute of Peace (USIP). Stolle, D. 2002. “Trusting Strangers: The Concept of Generalized Trust in Perspective.” OZP-INSTITUT FUR STAATS UND POLITIKWISSENSCHAFT, 31(4), 397-412. Stolle, D. 1998. “Bowling together, bowling alone: The development of generalized trust in voluntary associations.” Political Psychology, 497-525. Sullivan, J. L., and Transue, J. E. 1999. “The psychological underpinnings of democracy: A selective review of research on political tolerance, interpersonal trust, and social capital.” Annual Review of Psychology, 50(1), 625-650. De Toqueville, Alexis. 2003. Democracy in America and Two Essays on America. London: Penguin Books. van der Windt,P. 2013. “Local Governance and Native-Migrant Cooperation.” Working Paper. http://petervanderwindt.com/writing/. Yamagishi, T., and Yamagishi, M. 1994. “Trust and commitment in the United States and Japan.” Motivation and Emotion, 18(2), 129-166.
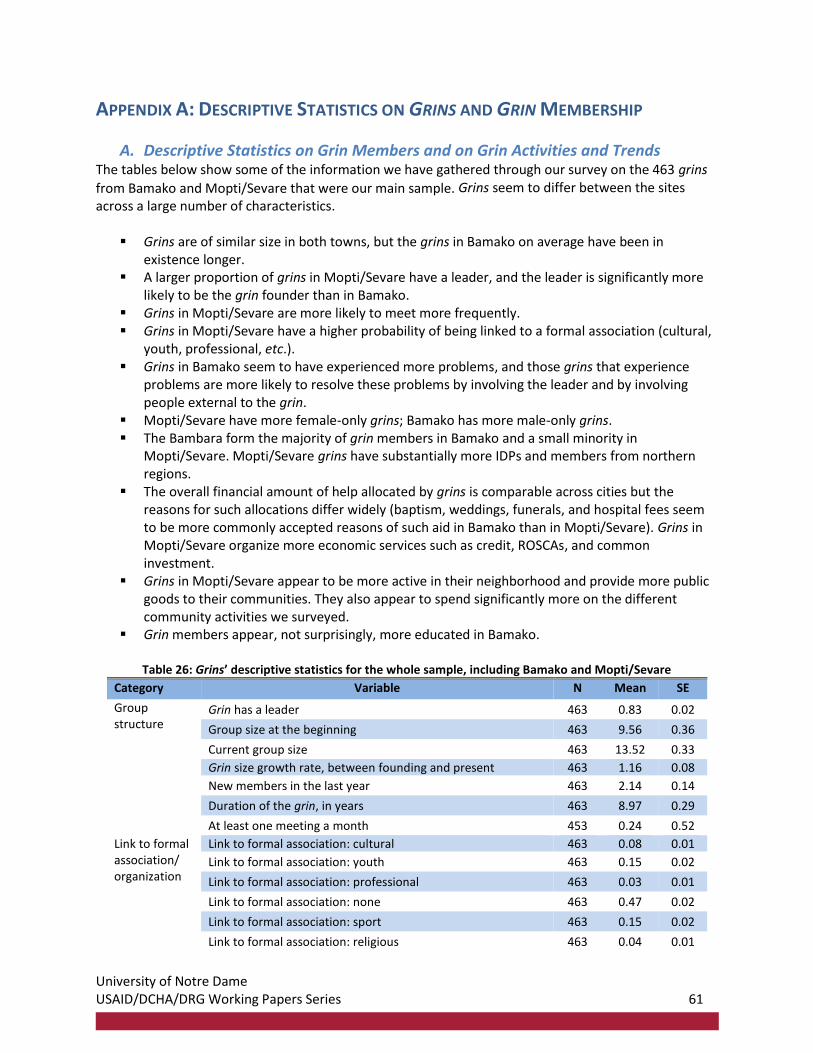
University of Notre Dame USAID/DCHA/DRG Working Papers Series 61
APPENDIX A: DESCRIPTIVE STATISTICS ON GRINS AND GRIN MEMBERSHIP
A. Descriptive Statistics on Grin Members and on Grin Activities and Trends The tables below show some of the information we have gathered through our survey on the 463 grins
from Bamako and Mopti/Sevare that were our main sample. Grins seem to differ between the sites across a large number of characteristics.
▪ Grins are of similar size in both towns, but the grins in Bamako on average have been in existence longer.
▪ A larger proportion of grins in Mopti/Sevare have a leader, and the leader is significantly more likely to be the grin founder than in Bamako.
▪ Grins in Mopti/Sevare are more likely to meet more frequently. ▪ Grins in Mopti/Sevare have a higher probability of being linked to a formal association (cultural,
youth, professional, etc.). ▪ Grins in Bamako seem to have experienced more problems, and those grins that experience
problems are more likely to resolve these problems by involving the leader and by involving people external to the grin.
▪ Mopti/Sevare have more female-only grins; Bamako has more male-only grins. ▪ The Bambara form the majority of grin members in Bamako and a small minority in
Mopti/Sevare. Mopti/Sevare grins have substantially more IDPs and members from northern regions.
▪ The overall financial amount of help allocated by grins is comparable across cities but the reasons for such allocations differ widely (baptism, weddings, funerals, and hospital fees seem to be more commonly accepted reasons of such aid in Bamako than in Mopti/Sevare). Grins in Mopti/Sevare organize more economic services such as credit, ROSCAs, and common investment.
▪ Grins in Mopti/Sevare appear to be more active in their neighborhood and provide more public goods to their communities. They also appear to spend significantly more on the different community activities we surveyed.
▪ Grin members appear, not surprisingly, more educated in Bamako.
Table 26: Grins’ descriptive statistics for the whole sample, including Bamako and Mopti/Sevare
Category Variable N Mean SE
Group structure
Grin has a leader 463 0.83 0.02
Group size at the beginning 463 9.56 0.36
Current group size 463 13.52 0.33
Grin size growth rate, between founding and present 463 1.16 0.08
New members in the last year 463 2.14 0.14
Duration of the grin, in years 463 8.97 0.29
At least one meeting a month 453 0.24 0.52
Link to formal association/ organization
Link to formal association: cultural 463 0.08 0.01
Link to formal association: youth 463 0.15 0.02
Link to formal association: professional 463 0.03 0.01
Link to formal association: none 463 0.47 0.02
Link to formal association: sport 463 0.15 0.02
Link to formal association: religious 463 0.04 0.01
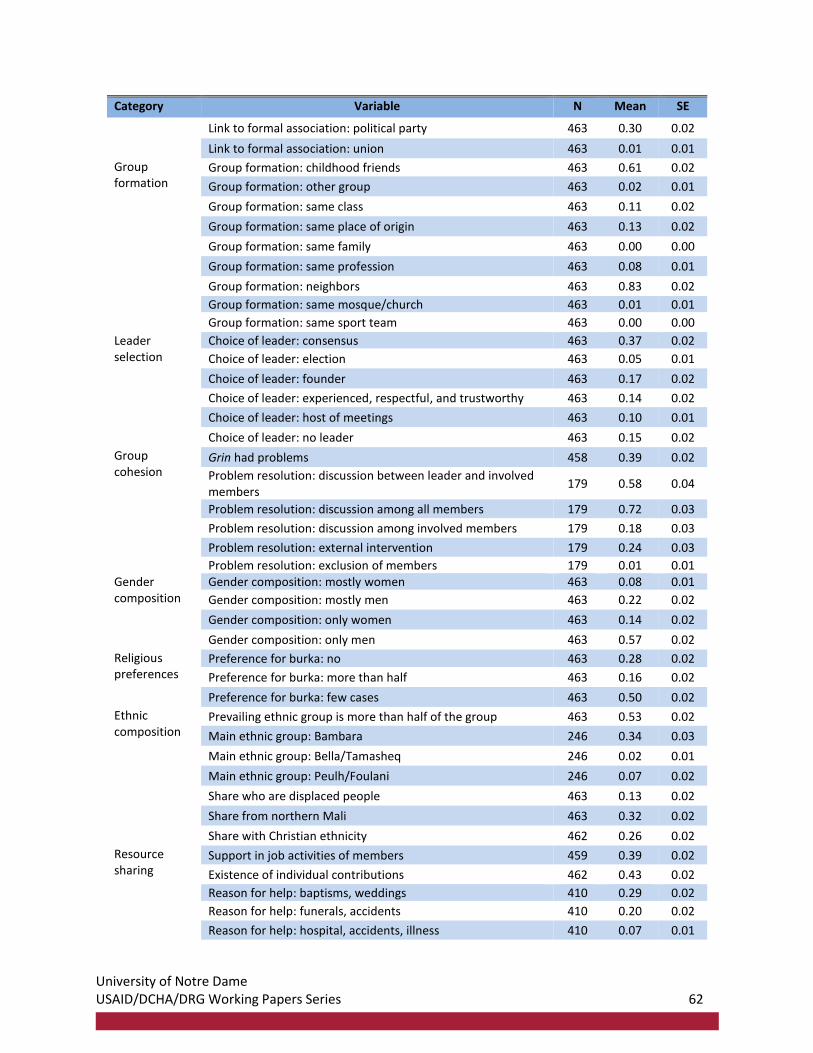
University of Notre Dame USAID/DCHA/DRG Working Papers Series 62
Category Variable N Mean SE
Link to formal association: political party 463 0.30 0.02
Link to formal association: union 463 0.01 0.01
Group formation
Group formation: childhood friends 463 0.61 0.02
Group formation: other group 463 0.02 0.01
Group formation: same class 463 0.11 0.02
Group formation: same place of origin 463 0.13 0.02
Group formation: same family 463 0.00 0.00
Group formation: same profession 463 0.08 0.01
Group formation: neighbors 463 0.83 0.02
Group formation: same mosque/church 463 0.01 0.01
Group formation: same sport team 463 0.00 0.00
Leader selection
Choice of leader: consensus 463 0.37 0.02
Choice of leader: election 463 0.05 0.01
Choice of leader: founder 463 0.17 0.02
Choice of leader: experienced, respectful, and trustworthy 463 0.14 0.02
Choice of leader: host of meetings 463 0.10 0.01
Choice of leader: no leader 463 0.15 0.02
Group cohesion
Grin had problems 458 0.39 0.02
Problem resolution: discussion between leader and involved members
179 0.58 0.04
Problem resolution: discussion among all members 179 0.72 0.03
Problem resolution: discussion among involved members 179 0.18 0.03
Problem resolution: external intervention 179 0.24 0.03
Problem resolution: exclusion of members 179 0.01 0.01 Gender composition
Gender composition: mostly women 463 0.08 0.01
Gender composition: mostly men 463 0.22 0.02
Gender composition: only women 463 0.14 0.02
Gender composition: only men 463 0.57 0.02
Religious preferences
Preference for burka: no 463 0.28 0.02
Preference for burka: more than half 463 0.16 0.02
Preference for burka: few cases 463 0.50 0.02
Ethnic composition
Prevailing ethnic group is more than half of the group 463 0.53 0.02
Main ethnic group: Bambara 246 0.34 0.03
Main ethnic group: Bella/Tamasheq 246 0.02 0.01
Main ethnic group: Peulh/Foulani 246 0.07 0.02
Share who are displaced people 463 0.13 0.02
Share from northern Mali 463 0.32 0.02
Share with Christian ethnicity 462 0.26 0.02
Resource sharing
Support in job activities of members 459 0.39 0.02
Existence of individual contributions 462 0.43 0.02
Reason for help: baptisms, weddings 410 0.29 0.02
Reason for help: funerals, accidents 410 0.20 0.02
Reason for help: hospital, accidents, illness 410 0.07 0.01
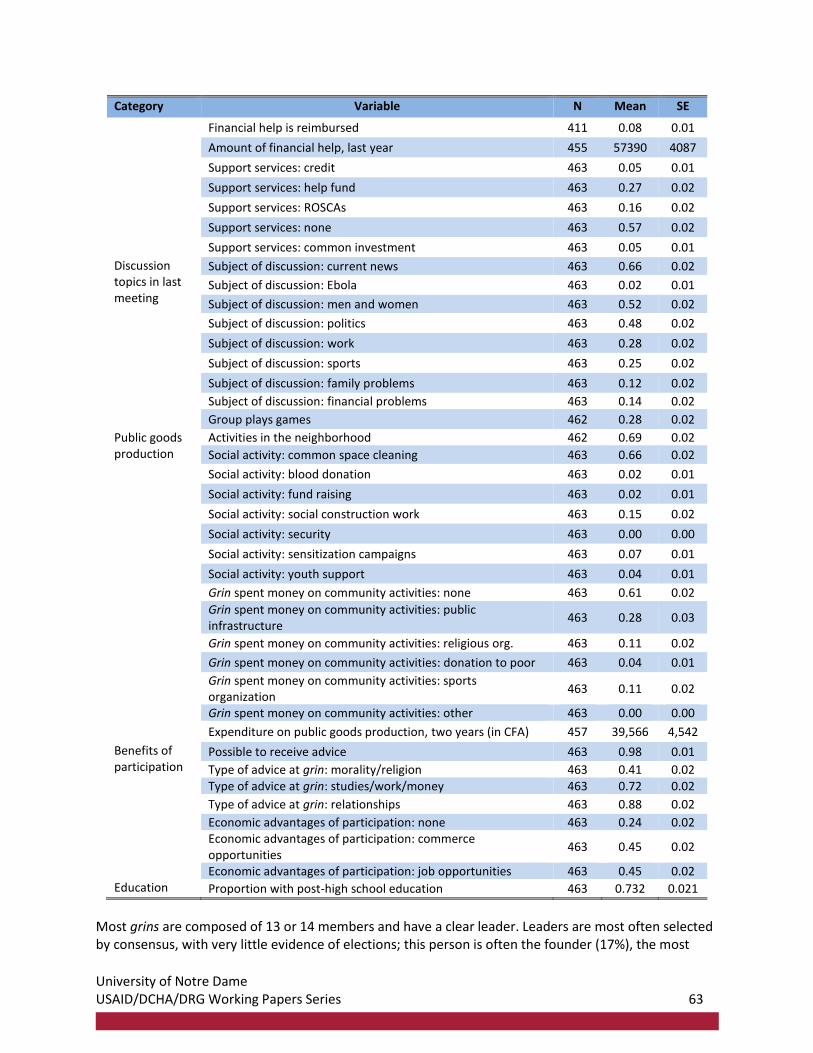
University of Notre Dame USAID/DCHA/DRG Working Papers Series 63
Category Variable N Mean SE
Financial help is reimbursed 411 0.08 0.01
Amount of financial help, last year 455 57390 4087
Support services: credit 463 0.05 0.01
Support services: help fund 463 0.27 0.02
Support services: ROSCAs 463 0.16 0.02
Support services: none 463 0.57 0.02
Support services: common investment 463 0.05 0.01
Discussion topics in last meeting
Subject of discussion: current news 463 0.66 0.02
Subject of discussion: Ebola 463 0.02 0.01
Subject of discussion: men and women 463 0.52 0.02
Subject of discussion: politics 463 0.48 0.02
Subject of discussion: work 463 0.28 0.02
Subject of discussion: sports 463 0.25 0.02
Subject of discussion: family problems 463 0.12 0.02
Subject of discussion: financial problems 463 0.14 0.02
Group plays games 462 0.28 0.02
Public goods production
Activities in the neighborhood 462 0.69 0.02
Social activity: common space cleaning 463 0.66 0.02
Social activity: blood donation 463 0.02 0.01
Social activity: fund raising 463 0.02 0.01
Social activity: social construction work 463 0.15 0.02
Social activity: security 463 0.00 0.00
Social activity: sensitization campaigns 463 0.07 0.01
Social activity: youth support 463 0.04 0.01
Grin spent money on community activities: none 463 0.61 0.02
Grin spent money on community activities: public infrastructure
463 0.28 0.03
Grin spent money on community activities: religious org. 463 0.11 0.02
Grin spent money on community activities: donation to poor 463 0.04 0.01
Grin spent money on community activities: sports organization
463 0.11 0.02
Grin spent money on community activities: other 463 0.00 0.00
Expenditure on public goods production, two years (in CFA) 457 39,566 4,542
Benefits of participation
Possible to receive advice 463 0.98 0.01
Type of advice at grin: morality/religion 463 0.41 0.02 Type of advice at grin: studies/work/money 463 0.72 0.02
Type of advice at grin: relationships 463 0.88 0.02
Economic advantages of participation: none 463 0.24 0.02 Economic advantages of participation: commerce opportunities
463 0.45 0.02
Economic advantages of participation: job opportunities 463 0.45 0.02 Education Proportion with post-high school education 463 0.732 0.021
Most grins are composed of 13 or 14 members and have a clear leader. Leaders are most often selected by consensus, with very little evidence of elections; this person is often the founder (17%), the most
University of Notre Dame USAID/DCHA/DRG Working Papers Series 64
senior member (14%), or the one hosting the meetings (10%). Grins in our sample had been active for an average of 9 years. About half of the grins have no formal ties with any other associations. Those that do have ties to formal associations collaborate with political parties (30%), sport groups (15%), and youth associations (15%). Grins seem to form most commonly at the neighborhood level (83%) or between childhood friends (63%), the two being non-mutually exclusive. Membership is composed largely of men. Around 60% of all grins were male only and an additional 22% predominantly male; 18% are composed of only women. Grins appear to have an ethnically diversified membership. In only a little more than half of grins (53%) do we observe a prevailing ethnic group representing more than the majority of members. The most important ethnic affiliation represented in our sample is Bambara (34%). About one-third of grins have at least one individual member from the North (Kidal, Tombouctou, Gao, or other regions in the North). About one-quarter of all grins have Christian members. We asked questions about group coherence and tension. Around 40% of all grins admitted to having experienced tension or problems, ranging from lack of attendance to animosity between members. Most groups solve their problems through a discussion between the leader and involved members or, more frequently, by involving all members. About one-quarter of all grins have made use of an external intervention to solve a problem. Only 1% of all groups resorted to excluding a member. It is interesting to note that respondents report that grin participation is rarely a cause of tension within families (or between spouses) of members. The fact that members participate in a grin is known by approximately 90% of their spouses and family members. Fewer than 10% of grin members report that their membership is a source of tension. Grins’ main activities, or raisons d’etre, are resource sharing and a space for discussion. Grins offer little formal credit, but 27% have a “formal help fund” and 16% organize a ROSCA within their group. Very few groups have a common investment scheme for a joint project, but it is not uncommon for members to provide financial help to each other—for instance, coming either from spontaneous collections during meetings or from the formal help fund. These funds can be allocated to baptisms, weddings, funerals, or accidents and illnesses (often involving substantial medical bills). In slightly fewer than 10% of cases, the financial help given is asked to be reimbursed. Grins also provide members with an opportunity to expand their network of relations in order to identify jobs or other economic opportunities. About half of members (45%) said that they benefited from a new business or job opportunity because of their grin. Grins most often discuss current news, gender issues, politics, work, sports, family, and financial problems. Members value the advice they receive from the grin including questions about life style, religion, study, work, money, and relationships. About one-third of the grins play card games. A large majority (69%) provide support for their communities including cleaning common space (66%), contributing to construction work (15%), or participating in sensitization campaigns (7%). Most (61%) do not spend money on these activities, but instead engage their members’ time. However, about one-third (28%) of grins spend money on public infrastructure.
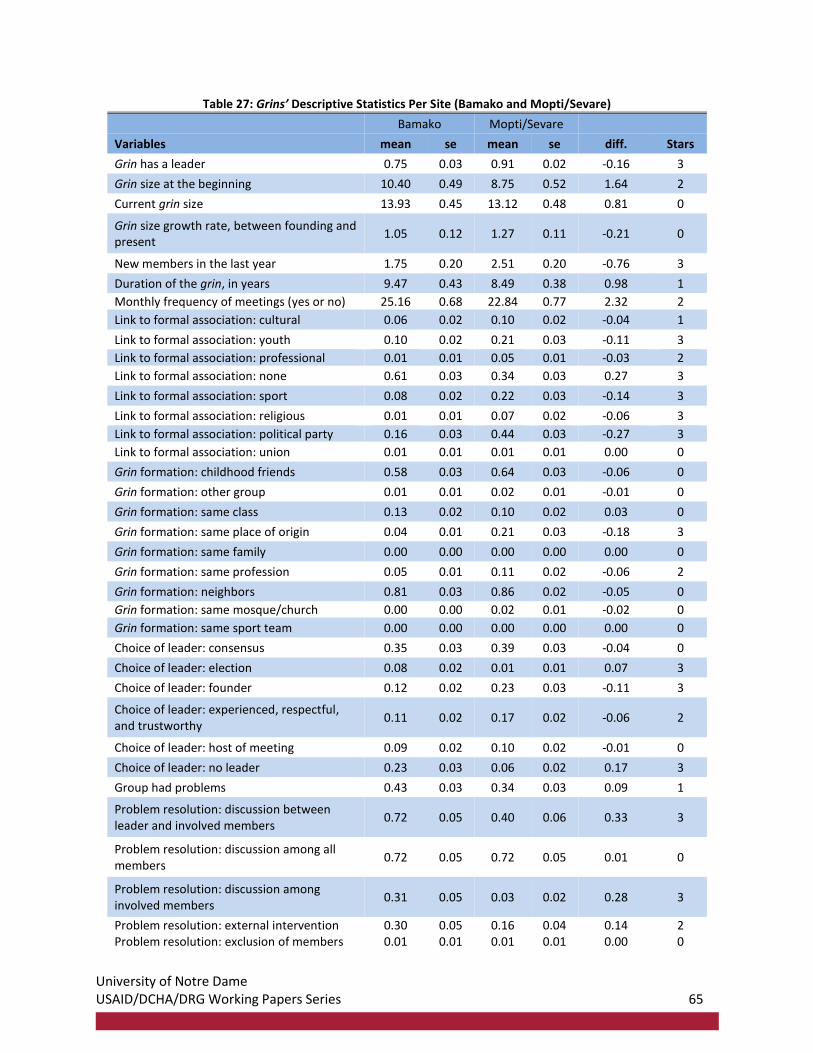
University of Notre Dame USAID/DCHA/DRG Working Papers Series 65
Table 27: Grins’ Descriptive Statistics Per Site (Bamako and Mopti/Sevare) Bamako Mopti/Sevare
Variables mean se mean se diff. Stars
Grin has a leader 0.75 0.03 0.91 0.02 -0.16 3
Grin size at the beginning 10.40 0.49 8.75 0.52 1.64 2
Current grin size 13.93 0.45 13.12 0.48 0.81 0
Grin size growth rate, between founding and present
1.05 0.12 1.27 0.11 -0.21 0
New members in the last year 1.75 0.20 2.51 0.20 -0.76 3
Duration of the grin, in years 9.47 0.43 8.49 0.38 0.98 1
Monthly frequency of meetings (yes or no) 25.16 0.68 22.84 0.77 2.32 2
Link to formal association: cultural 0.06 0.02 0.10 0.02 -0.04 1
Link to formal association: youth 0.10 0.02 0.21 0.03 -0.11 3
Link to formal association: professional 0.01 0.01 0.05 0.01 -0.03 2
Link to formal association: none 0.61 0.03 0.34 0.03 0.27 3
Link to formal association: sport 0.08 0.02 0.22 0.03 -0.14 3
Link to formal association: religious 0.01 0.01 0.07 0.02 -0.06 3
Link to formal association: political party 0.16 0.03 0.44 0.03 -0.27 3
Link to formal association: union 0.01 0.01 0.01 0.01 0.00 0
Grin formation: childhood friends 0.58 0.03 0.64 0.03 -0.06 0
Grin formation: other group 0.01 0.01 0.02 0.01 -0.01 0
Grin formation: same class 0.13 0.02 0.10 0.02 0.03 0
Grin formation: same place of origin 0.04 0.01 0.21 0.03 -0.18 3
Grin formation: same family 0.00 0.00 0.00 0.00 0.00 0
Grin formation: same profession 0.05 0.01 0.11 0.02 -0.06 2
Grin formation: neighbors 0.81 0.03 0.86 0.02 -0.05 0
Grin formation: same mosque/church 0.00 0.00 0.02 0.01 -0.02 0
Grin formation: same sport team 0.00 0.00 0.00 0.00 0.00 0
Choice of leader: consensus 0.35 0.03 0.39 0.03 -0.04 0
Choice of leader: election 0.08 0.02 0.01 0.01 0.07 3
Choice of leader: founder 0.12 0.02 0.23 0.03 -0.11 3
Choice of leader: experienced, respectful, and trustworthy
0.11 0.02 0.17 0.02 -0.06 2
Choice of leader: host of meeting 0.09 0.02 0.10 0.02 -0.01 0
Choice of leader: no leader 0.23 0.03 0.06 0.02 0.17 3
Group had problems 0.43 0.03 0.34 0.03 0.09 1
Problem resolution: discussion between leader and involved members
0.72 0.05 0.40 0.06 0.33 3
Problem resolution: discussion among all members
0.72 0.05 0.72 0.05 0.01 0
Problem resolution: discussion among involved members
0.31 0.05 0.03 0.02 0.28 3
Problem resolution: external intervention 0.30 0.05 0.16 0.04 0.14 2 Problem resolution: exclusion of members 0.01 0.01 0.01 0.01 0.00 0
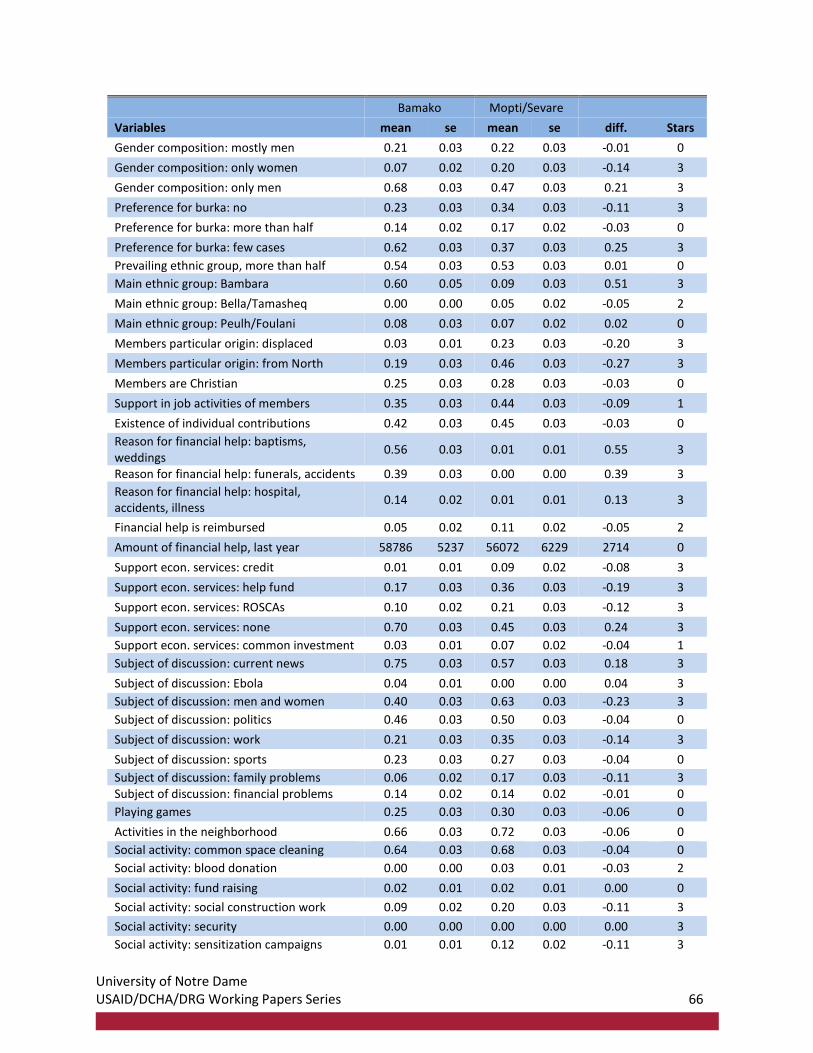
University of Notre Dame USAID/DCHA/DRG Working Papers Series 66
Bamako Mopti/Sevare
Variables mean se mean se diff. Stars
Gender composition: mostly men 0.21 0.03 0.22 0.03 -0.01 0
Gender composition: only women 0.07 0.02 0.20 0.03 -0.14 3
Gender composition: only men 0.68 0.03 0.47 0.03 0.21 3
Preference for burka: no 0.23 0.03 0.34 0.03 -0.11 3
Preference for burka: more than half 0.14 0.02 0.17 0.02 -0.03 0
Preference for burka: few cases 0.62 0.03 0.37 0.03 0.25 3
Prevailing ethnic group, more than half 0.54 0.03 0.53 0.03 0.01 0
Main ethnic group: Bambara 0.60 0.05 0.09 0.03 0.51 3
Main ethnic group: Bella/Tamasheq 0.00 0.00 0.05 0.02 -0.05 2
Main ethnic group: Peulh/Foulani 0.08 0.03 0.07 0.02 0.02 0
Members particular origin: displaced 0.03 0.01 0.23 0.03 -0.20 3
Members particular origin: from North 0.19 0.03 0.46 0.03 -0.27 3
Members are Christian 0.25 0.03 0.28 0.03 -0.03 0
Support in job activities of members 0.35 0.03 0.44 0.03 -0.09 1
Existence of individual contributions 0.42 0.03 0.45 0.03 -0.03 0
Reason for financial help: baptisms, weddings
0.56 0.03 0.01 0.01 0.55 3
Reason for financial help: funerals, accidents 0.39 0.03 0.00 0.00 0.39 3
Reason for financial help: hospital, accidents, illness
0.14 0.02 0.01 0.01 0.13 3
Financial help is reimbursed 0.05 0.02 0.11 0.02 -0.05 2
Amount of financial help, last year 58786 5237 56072 6229 2714 0
Support econ. services: credit 0.01 0.01 0.09 0.02 -0.08 3
Support econ. services: help fund 0.17 0.03 0.36 0.03 -0.19 3
Support econ. services: ROSCAs 0.10 0.02 0.21 0.03 -0.12 3
Support econ. services: none 0.70 0.03 0.45 0.03 0.24 3
Support econ. services: common investment 0.03 0.01 0.07 0.02 -0.04 1
Subject of discussion: current news 0.75 0.03 0.57 0.03 0.18 3
Subject of discussion: Ebola 0.04 0.01 0.00 0.00 0.04 3
Subject of discussion: men and women 0.40 0.03 0.63 0.03 -0.23 3
Subject of discussion: politics 0.46 0.03 0.50 0.03 -0.04 0
Subject of discussion: work 0.21 0.03 0.35 0.03 -0.14 3
Subject of discussion: sports 0.23 0.03 0.27 0.03 -0.04 0
Subject of discussion: family problems 0.06 0.02 0.17 0.03 -0.11 3 Subject of discussion: financial problems 0.14 0.02 0.14 0.02 -0.01 0
Playing games 0.25 0.03 0.30 0.03 -0.06 0
Activities in the neighborhood 0.66 0.03 0.72 0.03 -0.06 0
Social activity: common space cleaning 0.64 0.03 0.68 0.03 -0.04 0
Social activity: blood donation 0.00 0.00 0.03 0.01 -0.03 2
Social activity: fund raising 0.02 0.01 0.02 0.01 0.00 0
Social activity: social construction work 0.09 0.02 0.20 0.03 -0.11 3
Social activity: security 0.00 0.00 0.00 0.00 0.00 3
Social activity: sensitization campaigns 0.01 0.01 0.12 0.02 -0.11 3
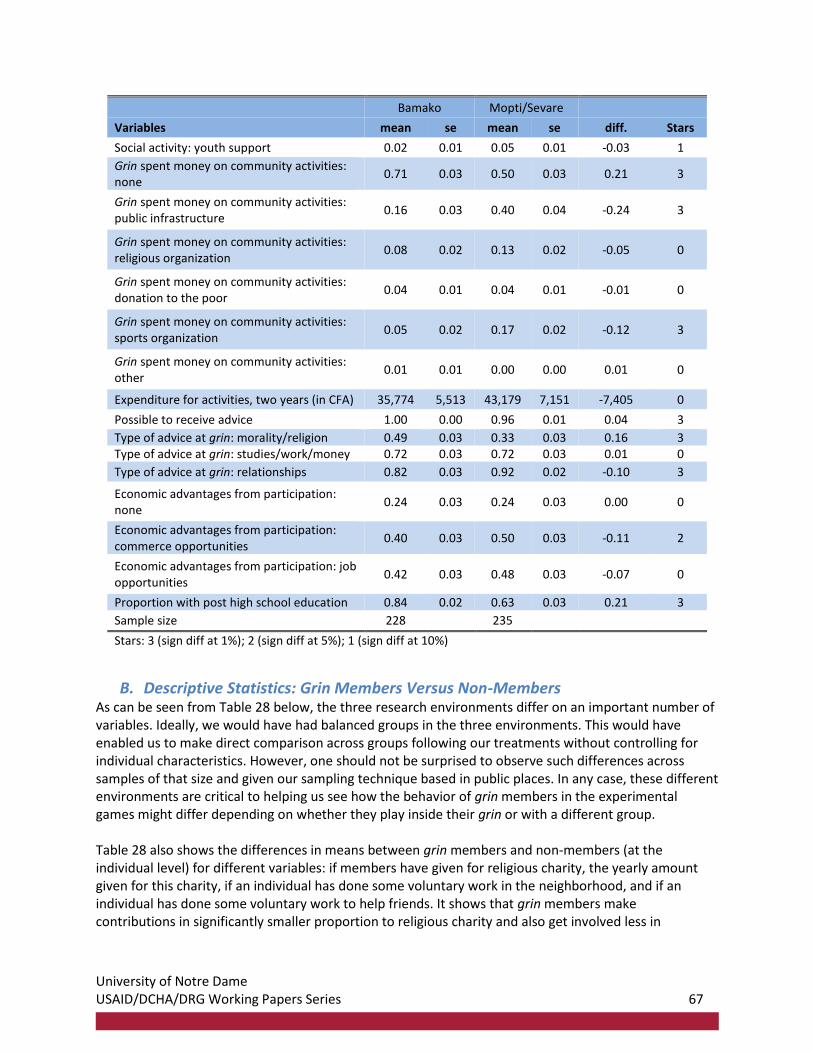
University of Notre Dame USAID/DCHA/DRG Working Papers Series 67
Bamako Mopti/Sevare
Variables mean se mean se diff. Stars
Social activity: youth support 0.02 0.01 0.05 0.01 -0.03 1
Grin spent money on community activities: none
0.71 0.03 0.50 0.03 0.21 3
Grin spent money on community activities: public infrastructure
0.16 0.03 0.40 0.04 -0.24 3
Grin spent money on community activities: religious organization
0.08 0.02 0.13 0.02 -0.05 0
Grin spent money on community activities: donation to the poor
0.04 0.01 0.04 0.01 -0.01 0
Grin spent money on community activities: sports organization
0.05 0.02 0.17 0.02 -0.12 3
Grin spent money on community activities: other
0.01 0.01 0.00 0.00 0.01 0
Expenditure for activities, two years (in CFA) 35,774 5,513 43,179 7,151 -7,405 0
Possible to receive advice 1.00 0.00 0.96 0.01 0.04 3
Type of advice at grin: morality/religion 0.49 0.03 0.33 0.03 0.16 3 Type of advice at grin: studies/work/money 0.72 0.03 0.72 0.03 0.01 0
Type of advice at grin: relationships 0.82 0.03 0.92 0.02 -0.10 3
Economic advantages from participation: none
0.24 0.03 0.24 0.03 0.00 0
Economic advantages from participation: commerce opportunities
0.40 0.03 0.50 0.03 -0.11 2
Economic advantages from participation: job opportunities
0.42 0.03 0.48 0.03 -0.07 0
Proportion with post high school education 0.84 0.02 0.63 0.03 0.21 3
Sample size 228 235
Stars: 3 (sign diff at 1%); 2 (sign diff at 5%); 1 (sign diff at 10%)
B. Descriptive Statistics: Grin Members Versus Non-Members As can be seen from Table 28 below, the three research environments differ on an important number of variables. Ideally, we would have had balanced groups in the three environments. This would have enabled us to make direct comparison across groups following our treatments without controlling for individual characteristics. However, one should not be surprised to observe such differences across samples of that size and given our sampling technique based in public places. In any case, these different environments are critical to helping us see how the behavior of grin members in the experimental games might differ depending on whether they play inside their grin or with a different group. Table 28 also shows the differences in means between grin members and non-members (at the individual level) for different variables: if members have given for religious charity, the yearly amount given for this charity, if an individual has done some voluntary work in the neighborhood, and if an individual has done some voluntary work to help friends. It shows that grin members make contributions in significantly smaller proportion to religious charity and also get involved less in
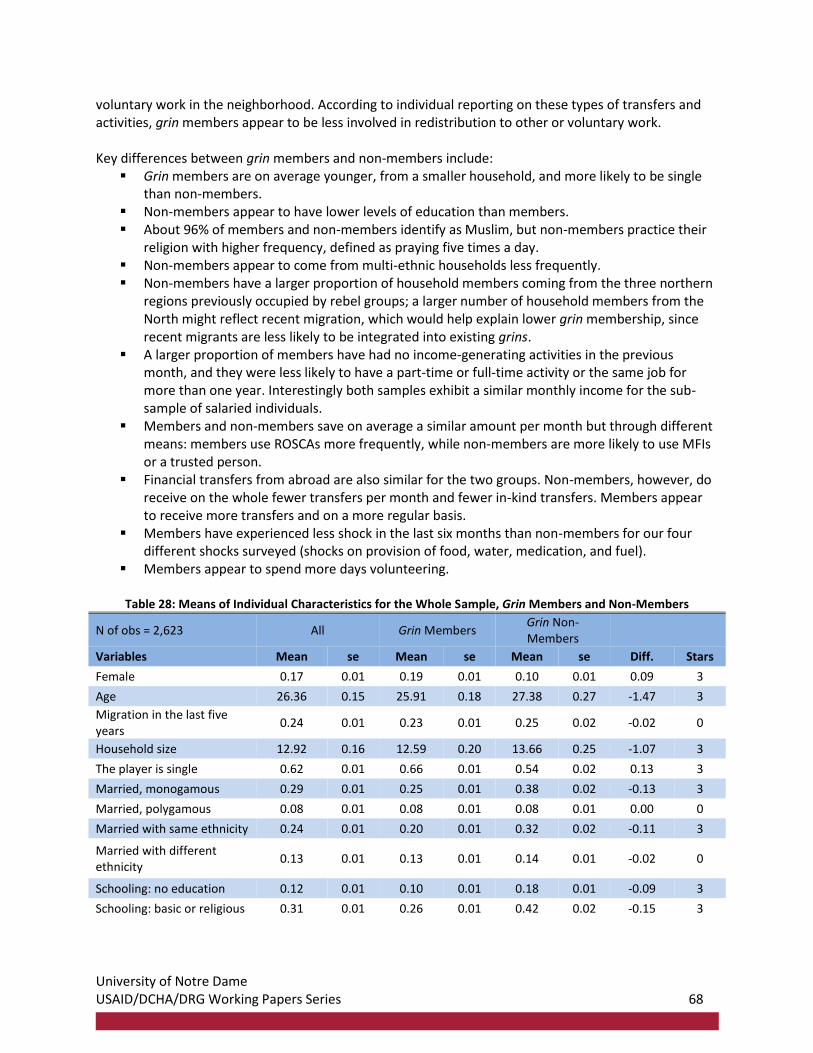
University of Notre Dame USAID/DCHA/DRG Working Papers Series 68
voluntary work in the neighborhood. According to individual reporting on these types of transfers and activities, grin members appear to be less involved in redistribution to other or voluntary work. Key differences between grin members and non-members include:
▪ Grin members are on average younger, from a smaller household, and more likely to be single than non-members.
▪ Non-members appear to have lower levels of education than members. ▪ About 96% of members and non-members identify as Muslim, but non-members practice their
religion with higher frequency, defined as praying five times a day. ▪ Non-members appear to come from multi-ethnic households less frequently. ▪ Non-members have a larger proportion of household members coming from the three northern
regions previously occupied by rebel groups; a larger number of household members from the North might reflect recent migration, which would help explain lower grin membership, since recent migrants are less likely to be integrated into existing grins.
▪ A larger proportion of members have had no income-generating activities in the previous month, and they were less likely to have a part-time or full-time activity or the same job for more than one year. Interestingly both samples exhibit a similar monthly income for the sub-sample of salaried individuals.
▪ Members and non-members save on average a similar amount per month but through different means: members use ROSCAs more frequently, while non-members are more likely to use MFIs or a trusted person.
▪ Financial transfers from abroad are also similar for the two groups. Non-members, however, do receive on the whole fewer transfers per month and fewer in-kind transfers. Members appear to receive more transfers and on a more regular basis.
▪ Members have experienced less shock in the last six months than non-members for our four different shocks surveyed (shocks on provision of food, water, medication, and fuel).
▪ Members appear to spend more days volunteering.
Table 28: Means of Individual Characteristics for the Whole Sample, Grin Members and Non-Members
N of obs = 2,623 All Grin Members Grin Non-Members
Variables Mean se Mean se Mean se Diff. Stars
Female 0.17 0.01 0.19 0.01 0.10 0.01 0.09 3
Age 26.36 0.15 25.91 0.18 27.38 0.27 -1.47 3
Migration in the last five years
0.24 0.01 0.23 0.01 0.25 0.02 -0.02 0
Household size 12.92 0.16 12.59 0.20 13.66 0.25 -1.07 3
The player is single 0.62 0.01 0.66 0.01 0.54 0.02 0.13 3
Married, monogamous 0.29 0.01 0.25 0.01 0.38 0.02 -0.13 3
Married, polygamous 0.08 0.01 0.08 0.01 0.08 0.01 0.00 0
Married with same ethnicity 0.24 0.01 0.20 0.01 0.32 0.02 -0.11 3
Married with different ethnicity
0.13 0.01 0.13 0.01 0.14 0.01 -0.02 0
Schooling: no education 0.12 0.01 0.10 0.01 0.18 0.01 -0.09 3
Schooling: basic or religious 0.31 0.01 0.26 0.01 0.42 0.02 -0.15 3
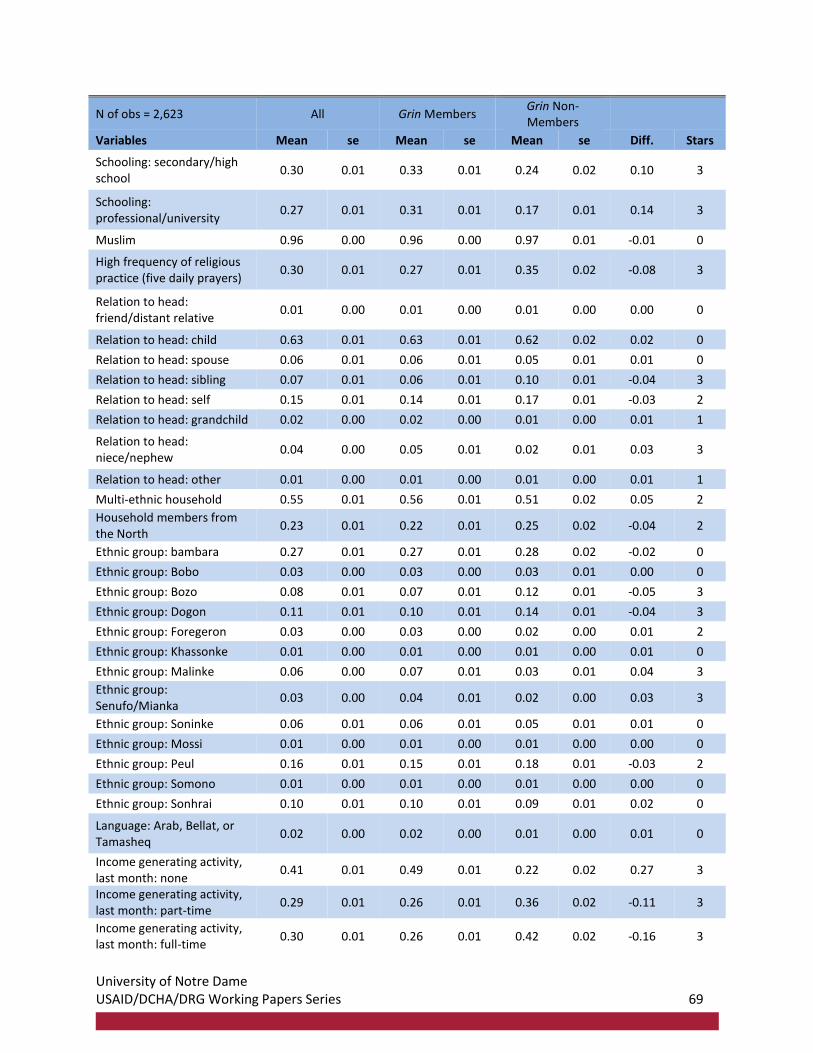
University of Notre Dame USAID/DCHA/DRG Working Papers Series 69
N of obs = 2,623 All Grin Members Grin Non-Members
Variables Mean se Mean se Mean se Diff. Stars
Schooling: secondary/high school
0.30 0.01 0.33 0.01 0.24 0.02 0.10 3
Schooling: professional/university
0.27 0.01 0.31 0.01 0.17 0.01 0.14 3
Muslim 0.96 0.00 0.96 0.00 0.97 0.01 -0.01 0
High frequency of religious practice (five daily prayers)
0.30 0.01 0.27 0.01 0.35 0.02 -0.08 3
Relation to head: friend/distant relative
0.01 0.00 0.01 0.00 0.01 0.00 0.00 0
Relation to head: child 0.63 0.01 0.63 0.01 0.62 0.02 0.02 0
Relation to head: spouse 0.06 0.01 0.06 0.01 0.05 0.01 0.01 0
Relation to head: sibling 0.07 0.01 0.06 0.01 0.10 0.01 -0.04 3
Relation to head: self 0.15 0.01 0.14 0.01 0.17 0.01 -0.03 2
Relation to head: grandchild 0.02 0.00 0.02 0.00 0.01 0.00 0.01 1
Relation to head: niece/nephew
0.04 0.00 0.05 0.01 0.02 0.01 0.03 3
Relation to head: other 0.01 0.00 0.01 0.00 0.01 0.00 0.01 1
Multi-ethnic household 0.55 0.01 0.56 0.01 0.51 0.02 0.05 2
Household members from the North
0.23 0.01 0.22 0.01 0.25 0.02 -0.04 2
Ethnic group: bambara 0.27 0.01 0.27 0.01 0.28 0.02 -0.02 0
Ethnic group: Bobo 0.03 0.00 0.03 0.00 0.03 0.01 0.00 0
Ethnic group: Bozo 0.08 0.01 0.07 0.01 0.12 0.01 -0.05 3
Ethnic group: Dogon 0.11 0.01 0.10 0.01 0.14 0.01 -0.04 3
Ethnic group: Foregeron 0.03 0.00 0.03 0.00 0.02 0.00 0.01 2
Ethnic group: Khassonke 0.01 0.00 0.01 0.00 0.01 0.00 0.01 0
Ethnic group: Malinke 0.06 0.00 0.07 0.01 0.03 0.01 0.04 3
Ethnic group: Senufo/Mianka
0.03 0.00 0.04 0.01 0.02 0.00 0.03 3
Ethnic group: Soninke 0.06 0.01 0.06 0.01 0.05 0.01 0.01 0
Ethnic group: Mossi 0.01 0.00 0.01 0.00 0.01 0.00 0.00 0
Ethnic group: Peul 0.16 0.01 0.15 0.01 0.18 0.01 -0.03 2
Ethnic group: Somono 0.01 0.00 0.01 0.00 0.01 0.00 0.00 0
Ethnic group: Sonhrai 0.10 0.01 0.10 0.01 0.09 0.01 0.02 0
Language: Arab, Bellat, or Tamasheq
0.02 0.00 0.02 0.00 0.01 0.00 0.01 0
Income generating activity, last month: none
0.41 0.01 0.49 0.01 0.22 0.02 0.27 3
Income generating activity, last month: part-time
0.29 0.01 0.26 0.01 0.36 0.02 -0.11 3
Income generating activity, last month: full-time
0.30 0.01 0.26 0.01 0.42 0.02 -0.16 3
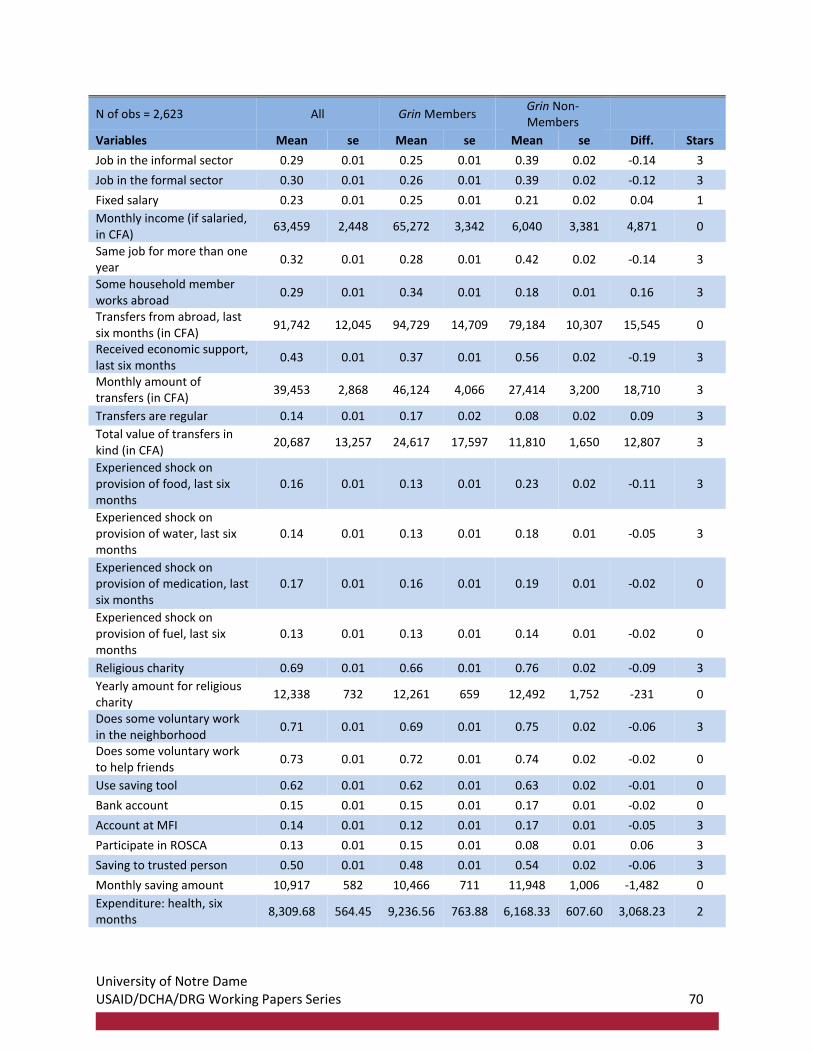
University of Notre Dame USAID/DCHA/DRG Working Papers Series 70
N of obs = 2,623 All Grin Members Grin Non-Members
Variables Mean se Mean se Mean se Diff. Stars
Job in the informal sector 0.29 0.01 0.25 0.01 0.39 0.02 -0.14 3
Job in the formal sector 0.30 0.01 0.26 0.01 0.39 0.02 -0.12 3
Fixed salary 0.23 0.01 0.25 0.01 0.21 0.02 0.04 1
Monthly income (if salaried, in CFA)
63,459 2,448 65,272 3,342 6,040 3,381 4,871 0
Same job for more than one year
0.32 0.01 0.28 0.01 0.42 0.02 -0.14 3
Some household member works abroad
0.29 0.01 0.34 0.01 0.18 0.01 0.16 3
Transfers from abroad, last six months (in CFA)
91,742 12,045 94,729 14,709 79,184 10,307 15,545 0
Received economic support, last six months
0.43 0.01 0.37 0.01 0.56 0.02 -0.19 3
Monthly amount of transfers (in CFA)
39,453 2,868 46,124 4,066 27,414 3,200 18,710 3
Transfers are regular 0.14 0.01 0.17 0.02 0.08 0.02 0.09 3
Total value of transfers in kind (in CFA)
20,687 13,257 24,617 17,597 11,810 1,650 12,807 3
Experienced shock on provision of food, last six months
0.16 0.01 0.13 0.01 0.23 0.02 -0.11 3
Experienced shock on provision of water, last six months
0.14 0.01 0.13 0.01 0.18 0.01 -0.05 3
Experienced shock on provision of medication, last six months
0.17 0.01 0.16 0.01 0.19 0.01 -0.02 0
Experienced shock on provision of fuel, last six months
0.13 0.01 0.13 0.01 0.14 0.01 -0.02 0
Religious charity 0.69 0.01 0.66 0.01 0.76 0.02 -0.09 3
Yearly amount for religious charity
12,338 732 12,261 659 12,492 1,752 -231 0
Does some voluntary work in the neighborhood
0.71 0.01 0.69 0.01 0.75 0.02 -0.06 3
Does some voluntary work to help friends
0.73 0.01 0.72 0.01 0.74 0.02 -0.02 0
Use saving tool 0.62 0.01 0.62 0.01 0.63 0.02 -0.01 0
Bank account 0.15 0.01 0.15 0.01 0.17 0.01 -0.02 0
Account at MFI 0.14 0.01 0.12 0.01 0.17 0.01 -0.05 3
Participate in ROSCA 0.13 0.01 0.15 0.01 0.08 0.01 0.06 3
Saving to trusted person 0.50 0.01 0.48 0.01 0.54 0.02 -0.06 3
Monthly saving amount 10,917 582 10,466 711 11,948 1,006 -1,482 0
Expenditure: health, six months
8,309.68 564.45 9,236.56 763.88 6,168.33 607.60 3,068.23 2
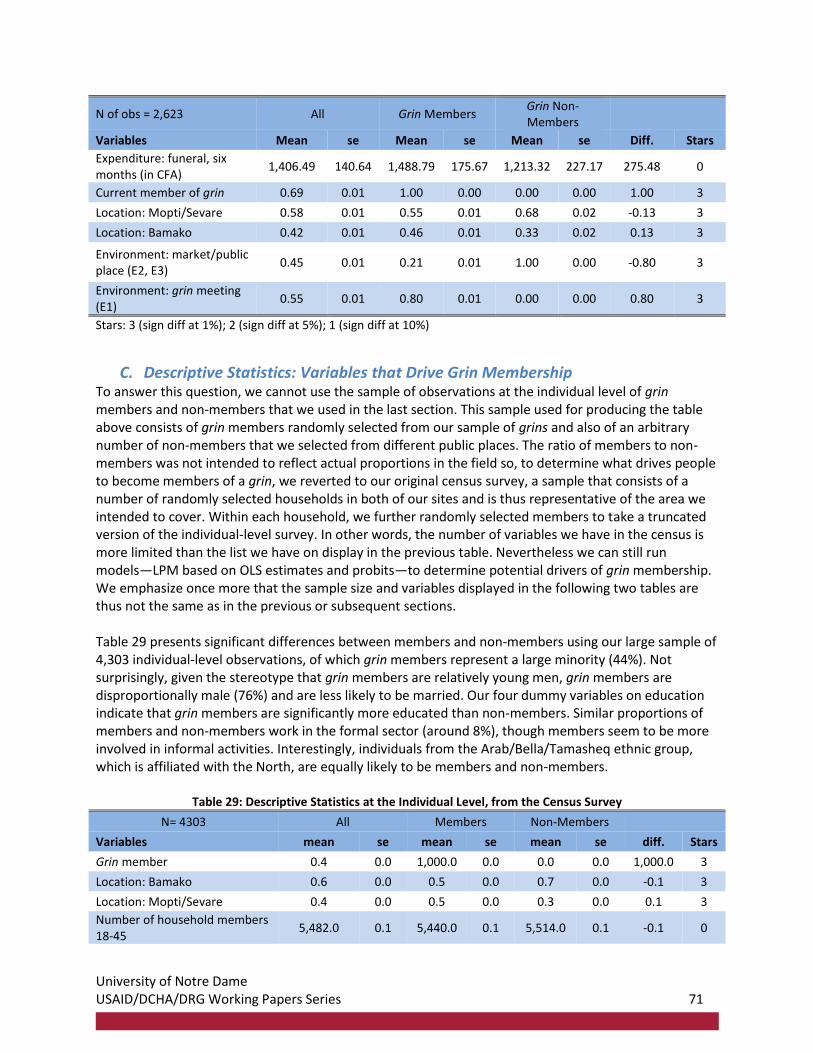
University of Notre Dame USAID/DCHA/DRG Working Papers Series 71
N of obs = 2,623 All Grin Members Grin Non-Members
Variables Mean se Mean se Mean se Diff. Stars
Expenditure: funeral, six months (in CFA)
1,406.49 140.64 1,488.79 175.67 1,213.32 227.17 275.48 0
Current member of grin 0.69 0.01 1.00 0.00 0.00 0.00 1.00 3
Location: Mopti/Sevare 0.58 0.01 0.55 0.01 0.68 0.02 -0.13 3
Location: Bamako 0.42 0.01 0.46 0.01 0.33 0.02 0.13 3
Environment: market/public place (E2, E3)
0.45 0.01 0.21 0.01 1.00 0.00 -0.80 3
Environment: grin meeting (E1)
0.55 0.01 0.80 0.01 0.00 0.00 0.80 3
Stars: 3 (sign diff at 1%); 2 (sign diff at 5%); 1 (sign diff at 10%)
C. Descriptive Statistics: Variables that Drive Grin Membership To answer this question, we cannot use the sample of observations at the individual level of grin members and non-members that we used in the last section. This sample used for producing the table above consists of grin members randomly selected from our sample of grins and also of an arbitrary number of non-members that we selected from different public places. The ratio of members to non-members was not intended to reflect actual proportions in the field so, to determine what drives people to become members of a grin, we reverted to our original census survey, a sample that consists of a number of randomly selected households in both of our sites and is thus representative of the area we intended to cover. Within each household, we further randomly selected members to take a truncated version of the individual-level survey. In other words, the number of variables we have in the census is more limited than the list we have on display in the previous table. Nevertheless we can still run models—LPM based on OLS estimates and probits—to determine potential drivers of grin membership. We emphasize once more that the sample size and variables displayed in the following two tables are thus not the same as in the previous or subsequent sections. Table 29 presents significant differences between members and non-members using our large sample of 4,303 individual-level observations, of which grin members represent a large minority (44%). Not surprisingly, given the stereotype that grin members are relatively young men, grin members are disproportionally male (76%) and are less likely to be married. Our four dummy variables on education indicate that grin members are significantly more educated than non-members. Similar proportions of members and non-members work in the formal sector (around 8%), though members seem to be more involved in informal activities. Interestingly, individuals from the Arab/Bella/Tamasheq ethnic group, which is affiliated with the North, are equally likely to be members and non-members.
Table 29: Descriptive Statistics at the Individual Level, from the Census Survey
N= 4303 All Members Non-Members
Variables mean se mean se mean se diff. Stars
Grin member 0.4 0.0 1,000.0 0.0 0.0 0.0 1,000.0 3
Location: Bamako 0.6 0.0 0.5 0.0 0.7 0.0 -0.1 3
Location: Mopti/Sevare 0.4 0.0 0.5 0.0 0.3 0.0 0.1 3
Number of household members 18-45
5,482.0 0.1 5,440.0 0.1 5,514.0 0.1 -0.1 0
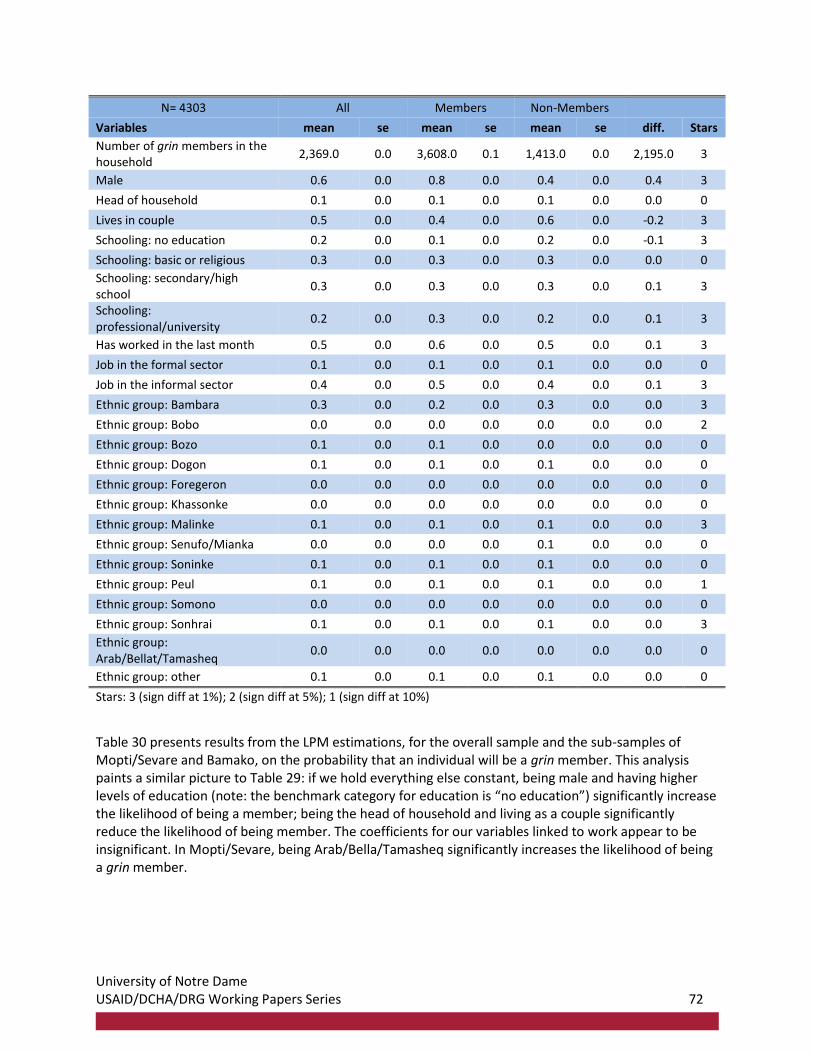
University of Notre Dame USAID/DCHA/DRG Working Papers Series 72
N= 4303 All Members Non-Members
Variables mean se mean se mean se diff. Stars
Number of grin members in the household
2,369.0 0.0 3,608.0 0.1 1,413.0 0.0 2,195.0 3
Male 0.6 0.0 0.8 0.0 0.4 0.0 0.4 3
Head of household 0.1 0.0 0.1 0.0 0.1 0.0 0.0 0
Lives in couple 0.5 0.0 0.4 0.0 0.6 0.0 -0.2 3
Schooling: no education 0.2 0.0 0.1 0.0 0.2 0.0 -0.1 3
Schooling: basic or religious 0.3 0.0 0.3 0.0 0.3 0.0 0.0 0
Schooling: secondary/high school
0.3 0.0 0.3 0.0 0.3 0.0 0.1 3
Schooling: professional/university
0.2 0.0 0.3 0.0 0.2 0.0 0.1 3
Has worked in the last month 0.5 0.0 0.6 0.0 0.5 0.0 0.1 3
Job in the formal sector 0.1 0.0 0.1 0.0 0.1 0.0 0.0 0
Job in the informal sector 0.4 0.0 0.5 0.0 0.4 0.0 0.1 3
Ethnic group: Bambara 0.3 0.0 0.2 0.0 0.3 0.0 0.0 3
Ethnic group: Bobo 0.0 0.0 0.0 0.0 0.0 0.0 0.0 2
Ethnic group: Bozo 0.1 0.0 0.1 0.0 0.0 0.0 0.0 0
Ethnic group: Dogon 0.1 0.0 0.1 0.0 0.1 0.0 0.0 0
Ethnic group: Foregeron 0.0 0.0 0.0 0.0 0.0 0.0 0.0 0
Ethnic group: Khassonke 0.0 0.0 0.0 0.0 0.0 0.0 0.0 0
Ethnic group: Malinke 0.1 0.0 0.1 0.0 0.1 0.0 0.0 3
Ethnic group: Senufo/Mianka 0.0 0.0 0.0 0.0 0.1 0.0 0.0 0
Ethnic group: Soninke 0.1 0.0 0.1 0.0 0.1 0.0 0.0 0
Ethnic group: Peul 0.1 0.0 0.1 0.0 0.1 0.0 0.0 1
Ethnic group: Somono 0.0 0.0 0.0 0.0 0.0 0.0 0.0 0
Ethnic group: Sonhrai 0.1 0.0 0.1 0.0 0.1 0.0 0.0 3
Ethnic group: Arab/Bellat/Tamasheq
0.0 0.0 0.0 0.0 0.0 0.0 0.0 0
Ethnic group: other 0.1 0.0 0.1 0.0 0.1 0.0 0.0 0
Stars: 3 (sign diff at 1%); 2 (sign diff at 5%); 1 (sign diff at 10%)
Table 30 presents results from the LPM estimations, for the overall sample and the sub-samples of Mopti/Sevare and Bamako, on the probability that an individual will be a grin member. This analysis paints a similar picture to Table 29: if we hold everything else constant, being male and having higher levels of education (note: the benchmark category for education is “no education”) significantly increase the likelihood of being a member; being the head of household and living as a couple significantly reduce the likelihood of being member. The coefficients for our variables linked to work appear to be insignificant. In Mopti/Sevare, being Arab/Bella/Tamasheq significantly increases the likelihood of being a grin member.
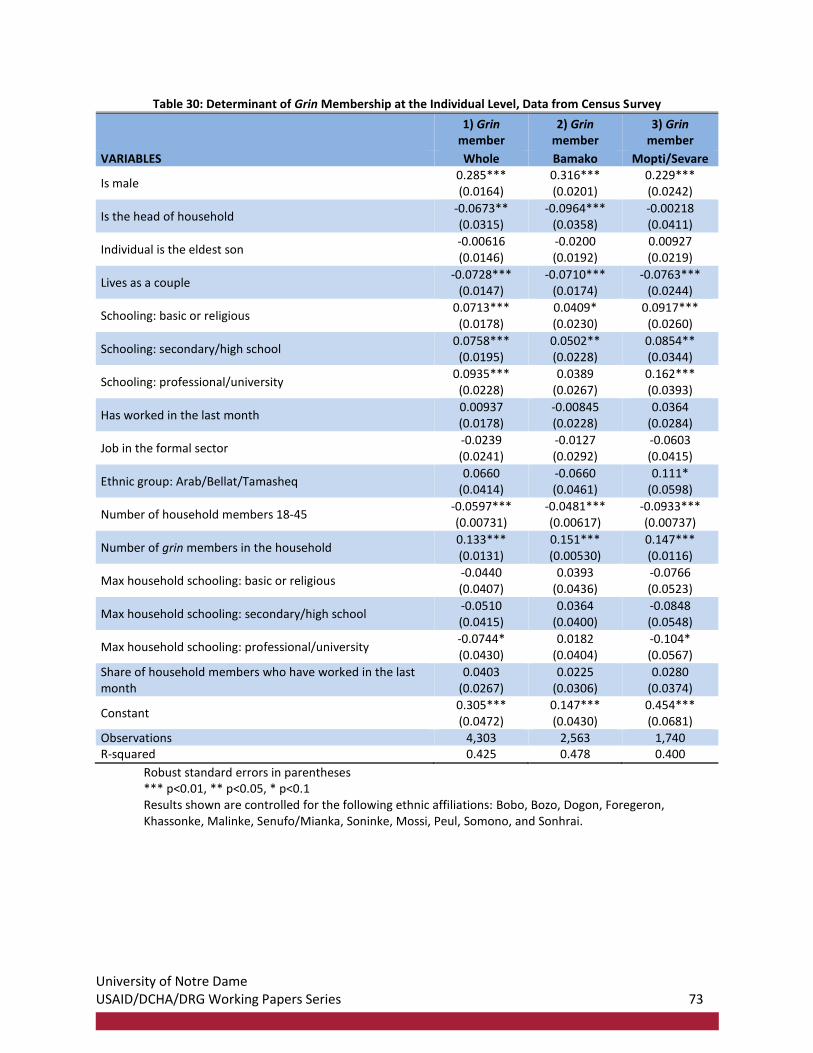
University of Notre Dame USAID/DCHA/DRG Working Papers Series 73
Table 30: Determinant of Grin Membership at the Individual Level, Data from Census Survey
1) Grin
member 2) Grin
member 3) Grin
member
VARIABLES Whole Bamako Mopti/Sevare
Is male 0.285*** (0.0164)
0.316*** (0.0201)
0.229*** (0.0242)
Is the head of household -0.0673** (0.0315)
-0.0964*** (0.0358)
-0.00218 (0.0411)
Individual is the eldest son -0.00616 (0.0146)
-0.0200 (0.0192)
0.00927 (0.0219)
Lives as a couple -0.0728***
(0.0147) -0.0710***
(0.0174) -0.0763***
(0.0244)
Schooling: basic or religious 0.0713*** (0.0178)
0.0409* (0.0230)
0.0917*** (0.0260)
Schooling: secondary/high school 0.0758*** (0.0195)
0.0502** (0.0228)
0.0854** (0.0344)
Schooling: professional/university 0.0935*** (0.0228)
0.0389 (0.0267)
0.162*** (0.0393)
Has worked in the last month 0.00937 (0.0178)
-0.00845 (0.0228)
0.0364 (0.0284)
Job in the formal sector -0.0239 (0.0241)
-0.0127 (0.0292)
-0.0603 (0.0415)
Ethnic group: Arab/Bellat/Tamasheq 0.0660
(0.0414) -0.0660 (0.0461)
0.111* (0.0598)
Number of household members 18-45 -0.0597*** (0.00731)
-0.0481*** (0.00617)
-0.0933*** (0.00737)
Number of grin members in the household 0.133*** (0.0131)
0.151*** (0.00530)
0.147*** (0.0116)
Max household schooling: basic or religious -0.0440 (0.0407)
0.0393 (0.0436)
-0.0766 (0.0523)
Max household schooling: secondary/high school -0.0510 (0.0415)
0.0364 (0.0400)
-0.0848 (0.0548)
Max household schooling: professional/university -0.0744* (0.0430)
0.0182 (0.0404)
-0.104* (0.0567)
Share of household members who have worked in the last month
0.0403 (0.0267)
0.0225 (0.0306)
0.0280 (0.0374)
Constant 0.305*** (0.0472)
0.147*** (0.0430)
0.454*** (0.0681)
Observations 4,303 2,563 1,740 R-squared 0.425 0.478 0.400
Robust standard errors in parentheses *** p<0.01, ** p<0.05, * p<0.1 Results shown are controlled for the following ethnic affiliations: Bobo, Bozo, Dogon, Foregeron, Khassonke, Malinke, Senufo/Mianka, Soninke, Mossi, Peul, Somono, and Sonhrai.
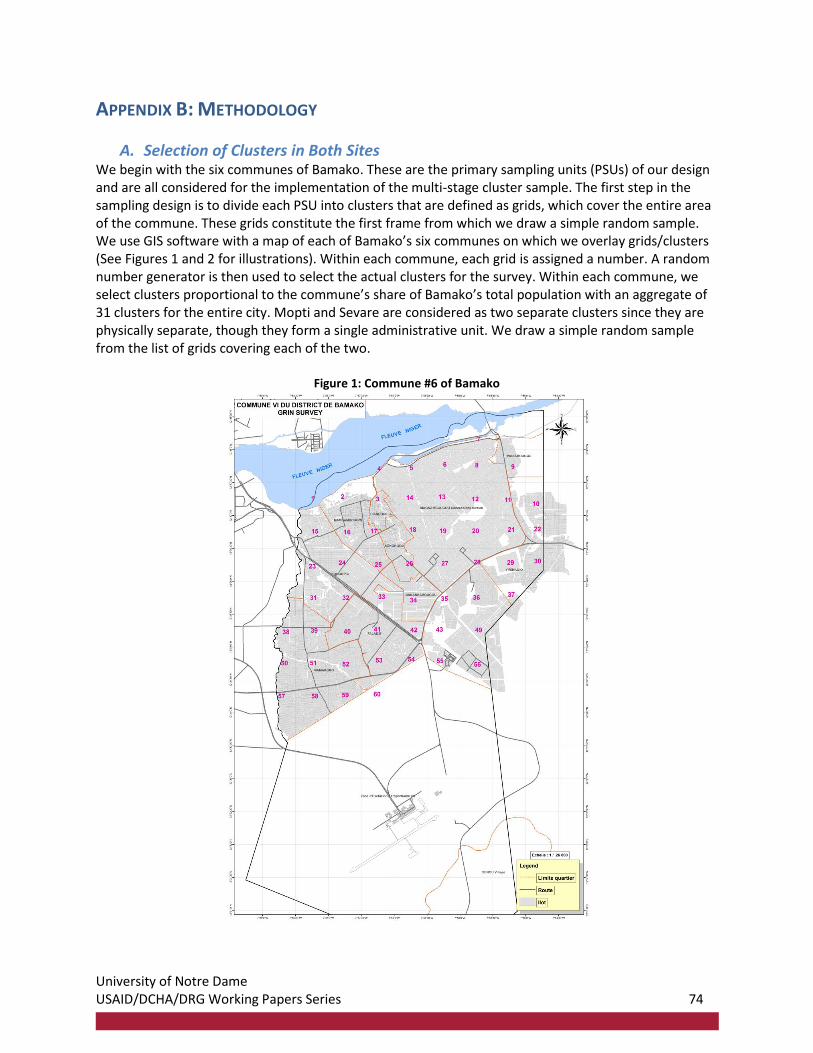
University of Notre Dame USAID/DCHA/DRG Working Papers Series 74
APPENDIX B: METHODOLOGY
A. Selection of Clusters in Both Sites We begin with the six communes of Bamako. These are the primary sampling units (PSUs) of our design and are all considered for the implementation of the multi-stage cluster sample. The first step in the sampling design is to divide each PSU into clusters that are defined as grids, which cover the entire area of the commune. These grids constitute the first frame from which we draw a simple random sample. We use GIS software with a map of each of Bamako’s six communes on which we overlay grids/clusters (See Figures 1 and 2 for illustrations). Within each commune, each grid is assigned a number. A random number generator is then used to select the actual clusters for the survey. Within each commune, we select clusters proportional to the commune’s share of Bamako’s total population with an aggregate of 31 clusters for the entire city. Mopti and Sevare are considered as two separate clusters since they are physically separate, though they form a single administrative unit. We draw a simple random sample from the list of grids covering each of the two.
Figure 1: Commune #6 of Bamako
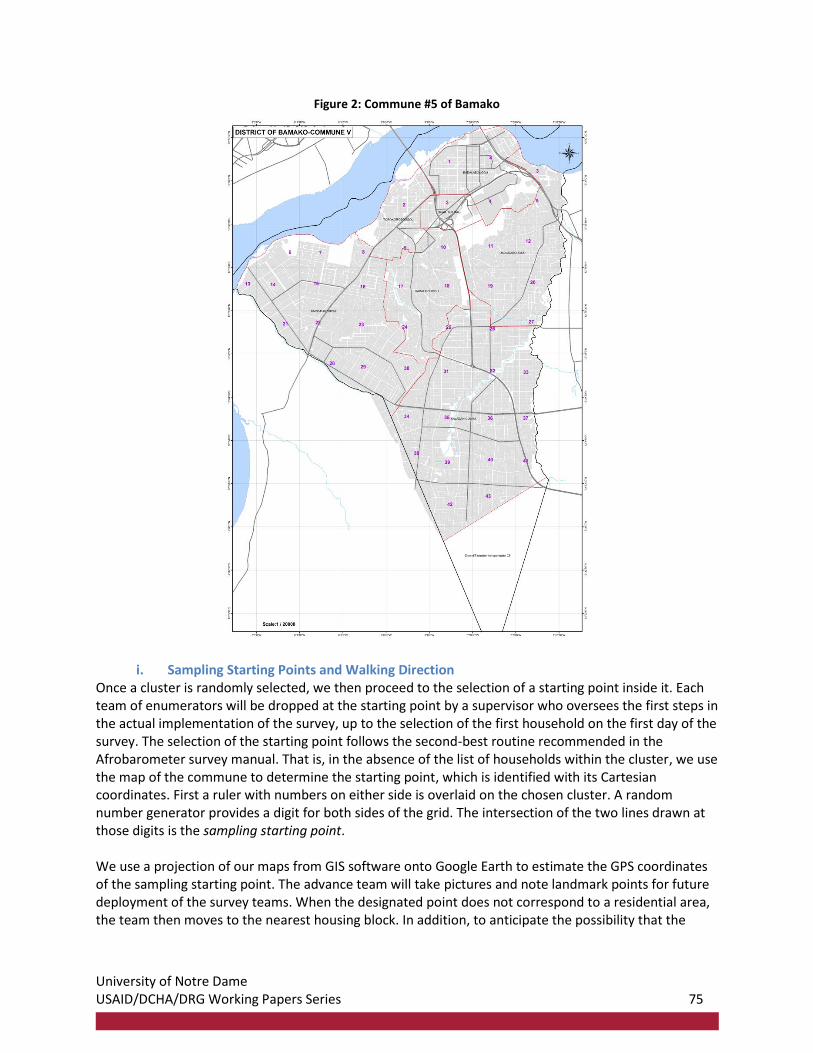
University of Notre Dame USAID/DCHA/DRG Working Papers Series 75
Figure 2: Commune #5 of Bamako
i. Sampling Starting Points and Walking Direction Once a cluster is randomly selected, we then proceed to the selection of a starting point inside it. Each team of enumerators will be dropped at the starting point by a supervisor who oversees the first steps in the actual implementation of the survey, up to the selection of the first household on the first day of the survey. The selection of the starting point follows the second-best routine recommended in the Afrobarometer survey manual. That is, in the absence of the list of households within the cluster, we use the map of the commune to determine the starting point, which is identified with its Cartesian coordinates. First a ruler with numbers on either side is overlaid on the chosen cluster. A random number generator provides a digit for both sides of the grid. The intersection of the two lines drawn at those digits is the sampling starting point. We use a projection of our maps from GIS software onto Google Earth to estimate the GPS coordinates of the sampling starting point. The advance team will take pictures and note landmark points for future deployment of the survey teams. When the designated point does not correspond to a residential area, the team then moves to the nearest housing block. In addition, to anticipate the possibility that the
University of Notre Dame USAID/DCHA/DRG Working Papers Series 76
designated starting point or its vicinity may not be suitable for the survey, we always selected a back-up starting point. At the starting point, each member of the team of two enumerators is assigned a direction based on a random draw of cards: Ace (Enumerator 1 walks toward the sun), 2 (Enumerator 1 walks away from the sun), 3 (Enumerator 1 walks at 90 degrees from the sun by turning right), and 4 (Enumerator 1 walks at 90 degrees from the sun by turning left). Enumerator 2 always walks in the opposite direction from Enumerator 1.
ii. Household Selection: Systematic Sampling The household selection method is also à la Afrobarometer, a systematic sampling procedure:
▪ Once a direction is assigned, the enumerator counts up to five houses for the first interview. If two houses have doors that are opposite each other, the counting process always picks the house on the right.
▪ After the first interview, the enumerator proceeds with the counting process for up to 10 new households. The 10th household is selected for the second interview.
▪ This process is continued until there are no more houses on the street. In this case, the enumerator always turns right and continues counting. However, in instances where there are no residential units on the right, the enumerator turns left, assuming there are houses on the left as well. If there are no houses either on the left or on the right, the enumerator walks back to the starting point and from there takes a right and continues the counting process.
▪ Special cases: If there are multiple Gwa/families within the same house/compound/apartment buildings, the enumerator assigns a number to each Gwa and then proceeds with a random selection using playing cards. The questionnaire is administered to the Gwa selected through the draw.
iii. Selection of Respondents
Once in the household, the enumerator identifies an adult who is knowledgeable about all other adults in the household and willing to answer the questions of the basic questionnaire. It is also possible to crowd-source the responses with a group of adults who happened to be sitting together at the time of the interview. We only inquire about general information on household members who fall within our target population of potential grin members and therefore allow the practice of having multiple adults contribute to the responses at the same time.
iv. Call Backs If the targeted individual is not at home, the enumerator can enquire about an approximate time when that person will be home and return then for the interview. The enumerator can also request the phone number of that individual and ask to speak to them for an appointment. If the household is inhabited but no one is home, the enumerator returns after completing the other households in the selection process. If no adult is present to respond to the questions after the second visit, the enumerator replaces the household but continues the counting process from the point where the last household was selected.
v. Replacement Procedure for Households After one unsuccessful attempt to find the proper respondent within the household, a replacement procedure is implemented. The enumerator can replace the household with the next household in the direction of the walk pattern.
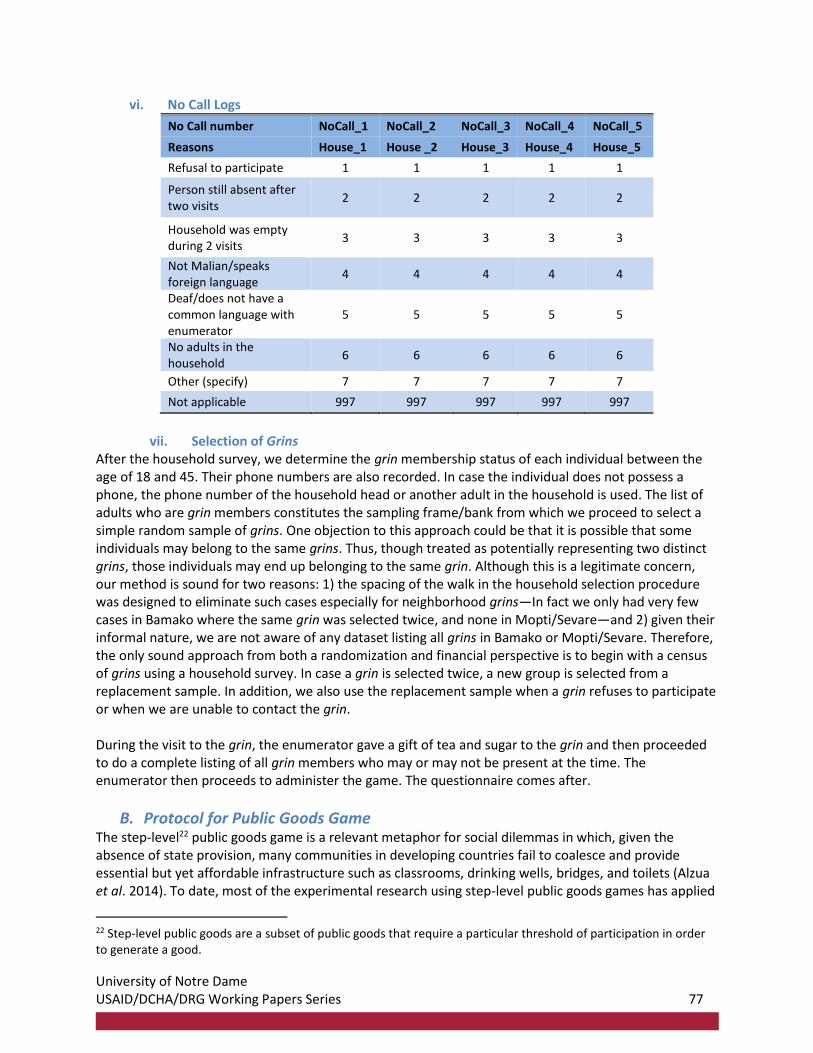
University of Notre Dame USAID/DCHA/DRG Working Papers Series 77
vi. No Call Logs
No Call number NoCall_1 NoCall_2 NoCall_3 NoCall_4 NoCall_5
Reasons House_1 House _2 House_3 House_4 House_5
Refusal to participate 1 1 1 1 1
Person still absent after two visits
2 2 2 2 2
Household was empty during 2 visits
3 3 3 3 3
Not Malian/speaks foreign language
4 4 4 4 4
Deaf/does not have a common language with enumerator
5 5 5 5 5
No adults in the household
6 6 6 6 6
Other (specify) 7 7 7 7 7
Not applicable 997 997 997 997 997
vii. Selection of Grins
After the household survey, we determine the grin membership status of each individual between the age of 18 and 45. Their phone numbers are also recorded. In case the individual does not possess a phone, the phone number of the household head or another adult in the household is used. The list of adults who are grin members constitutes the sampling frame/bank from which we proceed to select a simple random sample of grins. One objection to this approach could be that it is possible that some individuals may belong to the same grins. Thus, though treated as potentially representing two distinct grins, those individuals may end up belonging to the same grin. Although this is a legitimate concern, our method is sound for two reasons: 1) the spacing of the walk in the household selection procedure was designed to eliminate such cases especially for neighborhood grins—In fact we only had very few cases in Bamako where the same grin was selected twice, and none in Mopti/Sevare—and 2) given their informal nature, we are not aware of any dataset listing all grins in Bamako or Mopti/Sevare. Therefore, the only sound approach from both a randomization and financial perspective is to begin with a census of grins using a household survey. In case a grin is selected twice, a new group is selected from a replacement sample. In addition, we also use the replacement sample when a grin refuses to participate or when we are unable to contact the grin. During the visit to the grin, the enumerator gave a gift of tea and sugar to the grin and then proceeded to do a complete listing of all grin members who may or may not be present at the time. The enumerator then proceeds to administer the game. The questionnaire comes after.
B. Protocol for Public Goods Game The step-level22 public goods game is a relevant metaphor for social dilemmas in which, given the absence of state provision, many communities in developing countries fail to coalesce and provide essential but yet affordable infrastructure such as classrooms, drinking wells, bridges, and toilets (Alzua et al. 2014). To date, most of the experimental research using step-level public goods games has applied
22 Step-level public goods are a subset of public goods that require a particular threshold of participation in order to generate a good.
University of Notre Dame USAID/DCHA/DRG Working Papers Series 78
the game to minimal groups, often in lab settings. To our knowledge, we provide the first evidence of a step-level public goods game played by members of an organic group in a developing country. In doing so, we link this literature to mechanisms that seek to solve the collective action problem in developing countries. We use the term “organic” to distinguish ourselves from studies based on minimal groups formed in the context of a lab. These experiments have used common attributes, random allocation, or player self-selection into groups with no prior interaction. The common trait of these groups is the absence of social ties. Organic groups are also different from the groups described by Goette et al. (2012), where groups are randomly formed but allowed to build social ties for a period before entering the lab. We played the public goods game in two settings: during our visit to the grin and in public places such as markets, bus stations, and other places where random strangers converge. Naturally, when we visited a grin, only individuals who were members of that grin participated in the public goods game. In the public places, we identified the grin-membership status of individuals who were spotted via systematic sampling, then two types of groups were organized to play: groups made of a mix of individuals who are grin members and others who are not or groups made of individuals who do not participate in any grin. We labeled these three types of groups playing the public good games “environments”: E1 were games played within grins, E2 were games played with randomly selected members from different grins, and E3 were games played with randomly selected non-members. The design of the game was the classic Voluntary Contributions Mechanism (VCM). Participants received an endowment, which they can contribute to the group’s pool or keep in their private account. Each player received an envelope and a coin of 100 FCFA. The administrator explained to the players the different payoffs of their actions (free-riding/retention and cooperation) depending on whether the group met a pre-defined threshold of participation. If a player saved and the threshold was met, all participants earned a payoff greater than the initial endowment. Hence, in case of a win, the player who decided to keep the 100 FCFA endowment in her private account received a payoff of 200 FCFA along with other players for a total gain of 300 FCFA. If the player elected to contribute to the pool, she received 200 FCFA, granted the threshold was met. However if the player kept the 100 FCFA and the threshold was not met, she only had 100 FCFA. If she gave and the threshold was not met, she got nothing. The game had three thresholds of minimum participation for the grin to be declared a winner: 30%, 50%, and 80%. A cheat sheet was given to each enumerator to ease the process of determining the minimum participation rate necessary for each variation, based on the number of members who were present. In each grin, only two of the variations were played and the order of play between the two variations was pre-determined. In the end, the variations were: 30-80, 80-30, 50-80, and 80-50. The target count for each variation was 60 rounds in each of the two cities. To administer the game, the enumerator first filled out a sheet with basic demographic and economic information about grin members. This sheet also had cells to indicate the action (gave/did not give) during the public goods game. The enumerator then explained the rules of the game, the different actions of the players, and the fact that each player’s action would be anonymous to other members of the group. A ballot box was then placed in a discrete area where nobody could observe the player. Most grins meet at the door of a household, so often the ballot box is placed inside the household. The enumerator only proceeded to the actual play of the game when all players had understood the instructions. Players were warned not to communicate from that point until the end of the two games. If
University of Notre Dame USAID/DCHA/DRG Working Papers Series 79
there was any communication, the administrator ended the game. Once the first variation was over, the administrator explained the payoffs again based on the new minimum participation rate. Payouts were made at the end of the second game. Only the second game involved actual gains. However, players did not know this before the game. We follow the same rules for the public goods game at public locations where individuals randomly converge or with a large confluence of people. For these games, the research team worked in public places such as markets or bus stations. Players were selected via systematic sampling procedure; selected players completed a questionnaire to determine grin membership status.
C. Protocol for Trust Games The trust game can be taken as a tool to see how much an individual trusts somebody else with a list of attributes. Each grin in the sampling frame of 240 was flagged as homogenous, intermediate, or heterogeneous based on its ethnic composition (determined based on language spoken at home). Grins in which all members spoke the same language were designated as homogenous (T1), grins in which less than 10% spoke different languages at home are flagged as intermediate (T2), and grins in which more than 10% of the members spoke a different language at home were designated heterogeneous (T3). This sampling frame of 240 grins was then divided into two sets: those from which Player A (the sender) in the trust game would be selected and those from which Player B (the receiver) would be selected. Beginning with a simple random sample of 100 A grins, we randomly selected four players from within each grin. Each randomly selected Player A was told that s/he was playing with another Malian (T1), or with another Malian who speaks the same language as the A player at home (T2), or with another Malian who speaks a different language at home (T3). Each Player A is given 300 FCFA and an envelope. Just as in the public goods game, their actions were anonymous and they placed the amount they wished to give to Player B in an envelope; permitted amounts were 0, 100, 200 or 300 FCFA. The administrator stressed initially that the amount sent by A is tripled and B will in turn have a choice to share part of the tripled amount back with Player A. Once the game was over, each player answered a questionnaire. In the trust game played in public places, A players were selected by scouts via systematic sampling. They select every third individual who passed the point where the research team dropped them off. The selected players were pre-screened to ensure that they are not grin members. The protocol for the game was the same as in the grin. The players also answered the same questionnaire.