Embed Size (px)
Citation preview

This document consists of 22 printed pages and 2 blank pages.
DC (LK/FD) 132583/3© UCLES 2017 [Turn over
Cambridge International ExaminationsCambridge Ordinary Level
*5299484486*
ENVIRONMENTAL MANAGEMENT 5014/12Paper 1 May/June 2017 2 hours 15 minutesCandidates answer on the Question Paper.No Additional Materials are required.
READ THESE INSTRUCTIONS FIRST
Write your Centre number, candidate number and name on all the work you hand in.Write in dark blue or black pen.You may use an HB pencil for any diagrams or graphs.Do not use staples, paper clips, glue or correction fluid.DO NOT WRITE IN ANY BARCODES.
Answer all questions.
Electronic calculators may be used.You may lose marks if you do not show your working or if you do not use appropriate units.
Write your answers in the spaces provided on the Question Paper.
All questions in Section A carry 10 marks.Both questions in Section B carry 40 marks.
At the end of the examination, fasten all your work securely together.The number of marks is given in brackets [ ] at the end of each question or part question.

2
5014/12/M/J/17© UCLES 2017
Section A
Answer all the questions.
1 (a) The photograph shows wind turbines.
(i) Describe the landscape in the photograph where the wind turbines are located.
..........................................................................................................................................
..........................................................................................................................................
..........................................................................................................................................
..........................................................................................................................................
..........................................................................................................................................
...................................................................................................................................... [3]

3
5014/12/M/J/17© UCLES 2017 [Turn over
(ii) State what is unusual about the location of these wind turbines. Give a reason for your answer.
...........................................................................................................................................
...........................................................................................................................................
...........................................................................................................................................
.......................................................................................................................................[2]
(iii) Suggest advantages and disadvantages of the area shown in the photograph for the location of a nuclear power station.
advantages ........................................................................................................................
...........................................................................................................................................
...........................................................................................................................................
...........................................................................................................................................
disadvantages ...................................................................................................................
...........................................................................................................................................
...........................................................................................................................................
........................................................................................................................................... [3]
(b) Describe features of a climate that are beneficial to hydro-electric power production.
...................................................................................................................................................
...................................................................................................................................................
...................................................................................................................................................
...............................................................................................................................................[2]

4
5014/12/M/J/17© UCLES 2017
2 (a) The information in the box is about floods.
In 1975 a cyclone in China caused heavy rain and flooding, resulting in the collapse of a dam. A total of 231 000 people died, 145 000 of whom died as a result of diseases caused by the flooding.
Cyclones can also cause deaths from flooding in coastal areas, as strong winds drive seawater onshore, especially during high tides. The low air pressure in cyclones allows the sea surface to rise, often by several metres.
Sudden snow melt can also cause disastrous floods.
(i) Use the information to calculate how many people died as a result of causes other than
disease.
............................................................[1]
(ii) Use the information to state the cause of flooding in spring and early summer.
.......................................................................................................................................[1]
(iii) Use the information to describe how cyclones sometimes cause flooding by seawater.
...........................................................................................................................................
...........................................................................................................................................
...........................................................................................................................................
.......................................................................................................................................[2]
(iv) Explain why flooding causes an increase in disease in the weeks after a flood begins.
...........................................................................................................................................
...........................................................................................................................................
...........................................................................................................................................
...........................................................................................................................................
...........................................................................................................................................
.......................................................................................................................................[3]

5
5014/12/M/J/17© UCLES 2017 [Turn over
(b) Suggest how the collapse of a dam could affect an economy.
...................................................................................................................................................
...................................................................................................................................................
...................................................................................................................................................
...................................................................................................................................................
...................................................................................................................................................
...............................................................................................................................................[3]

6
5014/12/M/J/17© UCLES 2017
3 The graph shows how the ozone hole over Antarctica in 2014 differed from its largest area recorded for the months July to December.
July
Keyarea of the ozone hole in 2014 largest recorded area of the ozone hole
0
10
20area of theozone hole/ million km2
30
Aug Septmonth
Oct Nov Dec
(a) (i) State the month when the ozone hole covered the largest recorded area.
………………………………………….. [1]
(ii) Compare the length of time that the ozone hole lasted in 2014 with that of the largest recorded area.
...........................................................................................................................................
...........................................................................................................................................
...........................................................................................................................................
.......................................................................................................................................[2]
(b) (i) Explain the importance of ozone in the atmosphere.
...........................................................................................................................................
...........................................................................................................................................
...........................................................................................................................................
...........................................................................................................................................
...........................................................................................................................................
.......................................................................................................................................[3]

7
5014/12/M/J/17© UCLES 2017 [Turn over
(ii) Name an atmospheric pollutant that destroys ozone.
.......................................................................................................................................[1]
(c) In 1987 many governments agreed to ban the use of chemicals that destroy ozone.
Suggest why the ozone hole over Antarctica is likely to exist for many years despite this ban.
...................................................................................................................................................
...................................................................................................................................................
...................................................................................................................................................
...................................................................................................................................................
...................................................................................................................................................
...............................................................................................................................................[3]

8
5014/12/M/J/17© UCLES 2017
4 (a) The graph shows the population pyramid for Vietnam in 2014.
0 - 45 - 9
10 - 1415 - 1920 - 2425 - 2930 - 3435 - 3940 - 4445 - 4950 - 5455 - 5960 - 6465 - 6970 - 7475 - 7980 - 8485 - 8990 - 9495 - 99100 +age
male female
population in millions population in millions012345 0 1 2 3 4 5
(i) State the number of females aged 30 to 34 in Vietnam in 2014.
.......................................................................................................................................[1]
(ii) The government of Vietnam started a policy to reduce the birth rate. Approximately how many years before 2014 was this policy started? Circle your answer.
10 20 30 40 [1]
(iii) Explain why the government of Vietnam decided a birth control policy was needed at this time.
...........................................................................................................................................
.......................................................................................................................................[1]

9
5014/12/M/J/17© UCLES 2017 [Turn over
(b) Describe ways in which some governments encourage their populations to have fewer children.
...................................................................................................................................................
...................................................................................................................................................
...................................................................................................................................................
...................................................................................................................................................
...................................................................................................................................................
...................................................................................................................................................
...................................................................................................................................................
...............................................................................................................................................[4]
(c) The number of people aged 60 and over in Vietnam is likely to increase over the next 40 years.
Suggest why.
...................................................................................................................................................
...................................................................................................................................................
...................................................................................................................................................
...................................................................................................................................................
...................................................................................................................................................
...............................................................................................................................................[3]

10
5014/12/M/J/17© UCLES 2017
Section B
Answer both questions.
5 (a) Name the types of rock formed by each of the following:
heat and/or pressure deep in the Earth’s crust .................................................
magma or lava cooling and solidifying .................................................
the deposition of rock fragments, usually beneath the sea. .................................................[3]
(b) (i) Describe how a mineral, such as iron ore, is extracted from an open-pit (opencast) mine.
...........................................................................................................................................
...........................................................................................................................................
...........................................................................................................................................
...........................................................................................................................................
...........................................................................................................................................
.......................................................................................................................................[3]
(ii) Describe how the land can be restored after open-pit mining.
...........................................................................................................................................
...........................................................................................................................................
...........................................................................................................................................
...........................................................................................................................................
...........................................................................................................................................
.......................................................................................................................................[3]

11
5014/12/M/J/17© UCLES 2017
(c) The map shows recent iron ore exports, transport routes and imports for one year.
13 13044
977
13
229
98
North AmericaNorth America
Brazil
Other SouthAmerica
SouthAfricaSouthAfrica
OtherAfricaOtherAfrica
Europe
Middle EastMiddle East
Russia
Sweden
NorwayNorwayChina
IndiaSoutheast
AsiaSoutheast
Asia
Australia NewZealand
Japan, Korea,Taiwan
Japan, Korea,Taiwan
Key
iron ore imports / million tonnes
iron ore exports (size of circle indicates the amount exported)route of main iron ore exports
Using the map:
(i) name the country which exported the most iron ore.
........................................................ [1]
(ii) name the country which imported the most iron ore and state how much it imported.
name .................................................................................................................................
quantity imported ............... million tonnes[2]
(iii) Suggest why Japan, Korea and Taiwan imported such large quantities of iron ore.
...........................................................................................................................................
...........................................................................................................................................
...........................................................................................................................................
.......................................................................................................................................[2]

12
5014/12/M/J/17© UCLES 2017
(d) The diagram shows a deep coal mine.
surfacetowerssurfacetowers
other rocksother rocks
shafts train
coal seam
coal cutter
shafts train
coal seam
coal cutternot to scale
(i) Describe how the coal shown in the diagram was formed.
...........................................................................................................................................
...........................................................................................................................................
...........................................................................................................................................
...........................................................................................................................................
...........................................................................................................................................
.......................................................................................................................................[3]
(ii) Using the diagram, describe how the coal is mined.
...........................................................................................................................................
...........................................................................................................................................
...........................................................................................................................................
...........................................................................................................................................
...........................................................................................................................................
.......................................................................................................................................[3]

13
5014/12/M/J/17© UCLES 2017 [Turn over
(e) The information describes a method for producing iron from iron ore.
Firstly, coal is converted to coke, which is almost pure carbon. This process also produces some gases such as sulfur dioxide and nitrogen oxides. Iron ore, coke and limestone are loaded into a blast furnace and heated to a high temperature. The coke and limestone convert iron ore into iron. The waste materials from the blast furnace are carbon dioxide and a solid waste known as slag.
(i) Use the information above to complete the boxes in the flow diagram.
heated blastfurnace .....................
..........................................
.....................
..................... .....................
iron
coke
coal
[3] (ii) Explain how producing iron in a blast furnace contributes to acid rain.
...........................................................................................................................................
...........................................................................................................................................
...........................................................................................................................................
...........................................................................................................................................
...........................................................................................................................................
...........................................................................................................................................
...........................................................................................................................................
.......................................................................................................................................[4]

14
5014/12/M/J/17© UCLES 2017
(f) The graph shows iron production for China and the rest of the world from 1988 to 2013.
1988
KeyChinarest of the world
0
100
200
300
400
500
600iron
production/ milliontonnes
700
800
1993 1998year
2003 2008 2013
(i) Calculate the total world iron production in 1988.
Show your working.
.................................... million tonnes [2]
(ii) State the year when China and the rest of the world produced equal quantities of iron.
..................................... [1]
(iii) Compare the quantity of iron produced in China with the quantity produced in the rest of the world from 1988 to 2013.
...........................................................................................................................................
...........................................................................................................................................
...........................................................................................................................................
...........................................................................................................................................
...........................................................................................................................................
.......................................................................................................................................[3]

15
5014/12/M/J/17© UCLES 2017 [Turn over
(iv) Suggest how the air quality in China may have changed between 1998 and 2013.
...........................................................................................................................................
.......................................................................................................................................[1]
(v) Can economic development take place without causing air pollution?
Explain your answer.
...........................................................................................................................................
...........................................................................................................................................
...........................................................................................................................................
...........................................................................................................................................
...........................................................................................................................................
...........................................................................................................................................
...........................................................................................................................................
...........................................................................................................................................
...........................................................................................................................................
...........................................................................................................................................
...........................................................................................................................................
.......................................................................................................................................[6]

16
5014/12/M/J/17© UCLES 2017
6 (a) The table shows climate data for five different climates.
climate average maximum
temperature / °C
average minimum
temperature / °C
average annual precipitation / mm
number of months with precipitation
A 34 19 120 5
B 34 24 550 8
C 10 –28 230 12
D 29 27 1850 12
E 18 –12 590 12
(i) Calculate the range of temperature for climate E.
...................................................... °C [1]
(ii) State which climate, A, B, C, D or E, has:
the highest average annual precipitation
....................................................
the lowest average minimum temperature.
.................................................... [2]
(iii) Complete the table below by writing in the names of each climate. Choose from:
cool temperate interior desert equatorial savanna tundra
climate average maximum
temperature / °C
average minimum
temperature / °C
average annual
precipitation / mm
number of months with precipitation
name of climate
A 34 19 120 5 ......................................
B 34 24 550 8 ......................................
C 10 –28 230 12 ......................................
D 29 27 1850 12 ......................................
E 18 –12 590 12 ......................................
[4]
17
5014/12/M/J/17© UCLES 2017 [Turn over
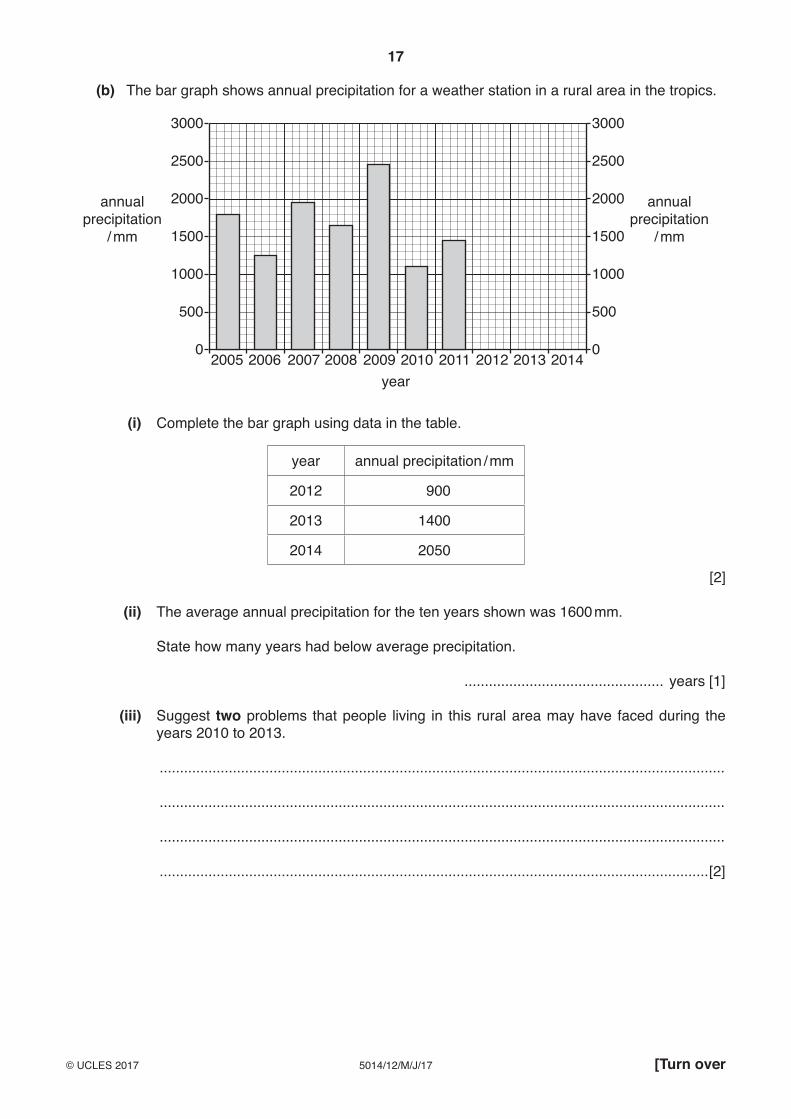
(b) The bar graph shows annual precipitation for a weather station in a rural area in the tropics.
20050
500
1000
1500
2000
2500
3000
0
500
1000
1500
2000
2500
3000
annualprecipitation
/ mm
annualprecipitation
/ mm
2006 2007year
2008 2009 2010 2011 2012 2013 2014
(i) Complete the bar graph using data in the table.
year annual precipitation / mm
2012 900
2013 1400
2014 2050
[2]
(ii) The average annual precipitation for the ten years shown was 1600 mm.
State how many years had below average precipitation.
................................................. years [1]
(iii) Suggest two problems that people living in this rural area may have faced during the years 2010 to 2013.
...........................................................................................................................................
...........................................................................................................................................
...........................................................................................................................................
.......................................................................................................................................[2]

18
5014/12/M/J/17© UCLES 2017
(iv) Suggest ways of overcoming the problems of irregular rainfall.
...........................................................................................................................................
...........................................................................................................................................
...........................................................................................................................................
...........................................................................................................................................
...........................................................................................................................................
.......................................................................................................................................[3]
(c) The photograph shows part of a monsoon forest during the dry season.
(i) Describe the vegetation shown in the photograph.
...........................................................................................................................................
...........................................................................................................................................
...........................................................................................................................................
.......................................................................................................................................[2]
(ii) Suggest how the area would look during the wet season.
...........................................................................................................................................
.......................................................................................................................................[1]

19
5014/12/M/J/17© UCLES 2017 [Turn over
(iii) State three differences between monsoon forest vegetation and tropical rainforest vegetation.
...........................................................................................................................................
...........................................................................................................................................
...........................................................................................................................................
...........................................................................................................................................
...........................................................................................................................................
.......................................................................................................................................[3]
20
5014/12/M/J/17© UCLES 2017
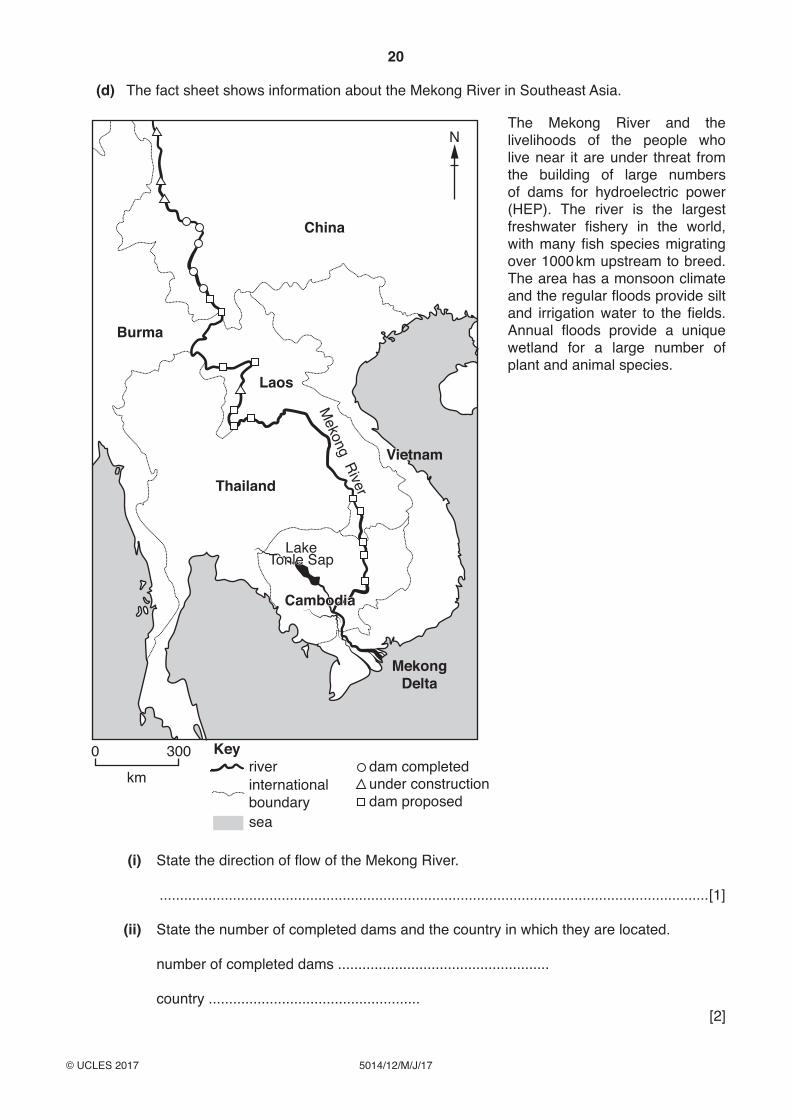
(d) The fact sheet shows information about the Mekong River in Southeast Asia.
The Mekong River and the livelihoods of the people who live near it are under threat from the building of large numbers of dams for hydroelectric power (HEP). The river is the largest freshwater fishery in the world, with many fish species migrating over 1000 km upstream to breed. The area has a monsoon climate and the regular floods provide silt and irrigation water to the fields. Annual floods provide a unique wetland for a large number of plant and animal species.
Mekong River
0 300 Keyriver dam completed
under constructiondam proposed
internationalboundarysea
km
Thailand
MekongDelta
Burma
Laos
LakeTonle Sap
LakeTonle Sap
China
CambodiaCambodia
Vietnam
N
(i) State the direction of flow of the Mekong River.
.......................................................................................................................................[1]
(ii) State the number of completed dams and the country in which they are located.
number of completed dams ....................................................
country .................................................... [2]

21
5014/12/M/J/17© UCLES 2017 [Turn over
(iii) Describe the distribution of proposed dams along the Mekong River.
...........................................................................................................................................
...........................................................................................................................................
...........................................................................................................................................
.......................................................................................................................................[2]
(iv) Explain how the construction of dams on the Mekong River might affect farmers and fishermen.
farmers ..............................................................................................................................
...........................................................................................................................................
...........................................................................................................................................
...........................................................................................................................................
...........................................................................................................................................
...........................................................................................................................................
fishermen ..........................................................................................................................
...........................................................................................................................................
...........................................................................................................................................
...........................................................................................................................................
...........................................................................................................................................
........................................................................................................................................... [5]

22
5014/12/M/J/17© UCLES 2017
(v) Suggest economic reasons why so many hydroelectric dams are being built on this river.
...........................................................................................................................................
...........................................................................................................................................
...........................................................................................................................................
...........................................................................................................................................
...........................................................................................................................................
.......................................................................................................................................[3]
(e) ‘The availability of fresh water will always be a problem for some countries.’
How far do you agree with this statement? Give reasons for your answer.
...................................................................................................................................................
...................................................................................................................................................
...................................................................................................................................................
...................................................................................................................................................
...................................................................................................................................................
...................................................................................................................................................
...................................................................................................................................................
...................................................................................................................................................
...................................................................................................................................................
...................................................................................................................................................
...................................................................................................................................................
...............................................................................................................................................[6]

23
5014/12/M/J/17© UCLES 2017
BLANK PAGE

24
5014/12/M/J/17© UCLES 2017
Permission to reproduce items where third-party owned material protected by copyright is included has been sought and cleared where possible. Every reasonable effort has been made by the publisher (UCLES) to trace copyright holders, but if any items requiring clearance have unwittingly been included, the publisher will be pleased to make amends at the earliest possible opportunity.
To avoid the issue of disclosure of answer-related information to candidates, all copyright acknowledgements are reproduced online in the Cambridge International Examinations Copyright Acknowledgements Booklet. This is produced for each series of examinations and is freely available to download at www.cie.org.uk after the live examination series.
Cambridge International Examinations is part of the Cambridge Assessment Group. Cambridge Assessment is the brand name of University of Cambridge Local Examinations Syndicate (UCLES), which is itself a department of the University of Cambridge.
BLANK PAGE