Embed Size (px)
Citation preview

Cambridge IGCSE® (9–1)
GEOGRAPHY 0976/04
Paper 4 Alternative to Coursework For examination from 2020
SPECIMEN PAPER 1 hour 30 minutes
You must answer on the question paper.
You will need: Insert (enclosed) Ruler Calculator Protractor
INSTRUCTIONS ● Answer all questions. ● Use a black or dark blue pen. You may use an HB pencil for any diagrams or graphs. ● Write your name, centre number and candidate number in the boxes at the top of the page. ● Write your answer to each question in the space provided. ● Do not use an erasable pen or correction fluid. ● Do not write on any bar codes. ● If additional space is needed, you should use the lined pages at the end of this booklet; the question
number or numbers must be clearly shown.
INFORMATION ● The total mark for this paper is 60. ● The number of marks for each question or part question is shown in brackets [ ]. ● The insert contains additional resources referred to in the questions.
*0123456789*
© UCLES 2017 [Turn over
This document has 20 pages. Blank pages are indicated.
2
0976/04/SP/20© UCLES 2017
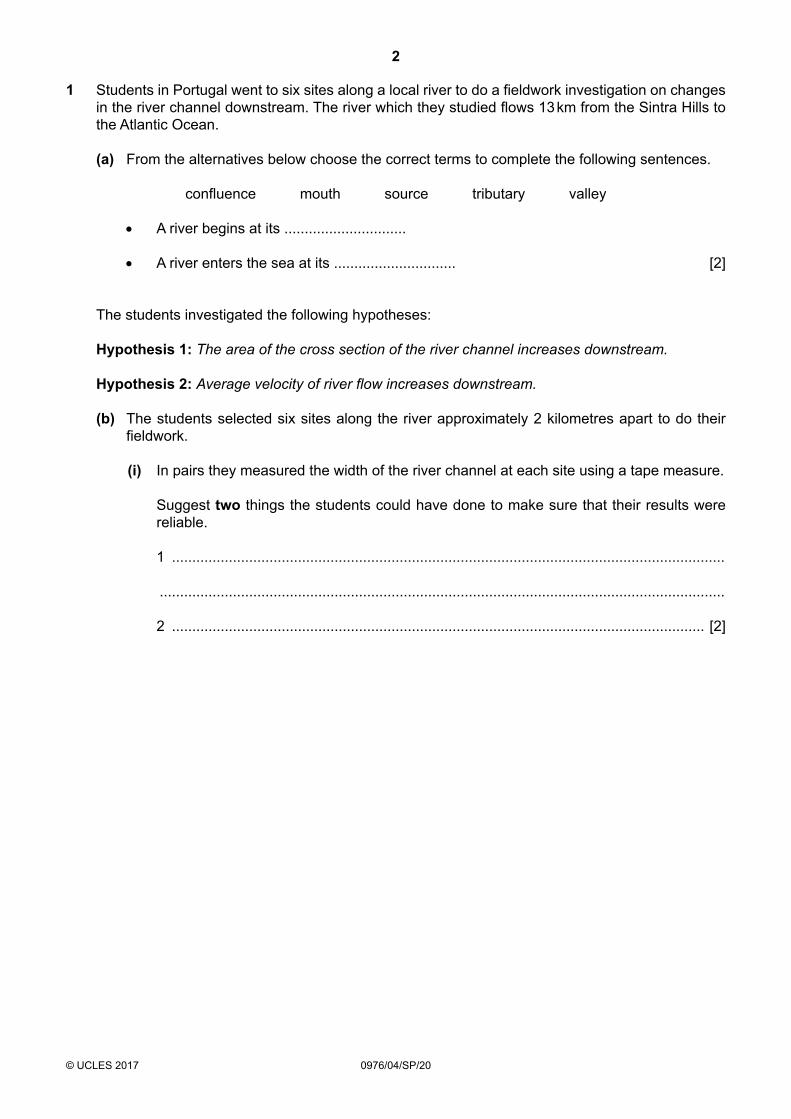
1 Students in Portugal went to six sites along a local river to do a fieldwork investigation on changes in the river channel downstream. The river which they studied flows 13 km from the Sintra Hills to the Atlantic Ocean.
(a) From the alternatives below choose the correct terms to complete the following sentences.
confluence mouth source tributary valley
• A river begins at its ..............................
• A river enters the sea at its .............................. [2]
The students investigated the following hypotheses:
Hypothesis 1: The area of the cross section of the river channel increases downstream.
Hypothesis 2: Average velocity of river flow increases downstream.
(b) The students selected six sites along the river approximately 2 kilometres apart to do their fieldwork.
(i) In pairs they measured the width of the river channel at each site using a tape measure. Suggest two things the students could have done to make sure that their results were
reliable.
1 ........................................................................................................................................
...........................................................................................................................................
2 ................................................................................................................................... [2]

3
0976/04/SP/20© UCLES 2017 [Turn over
(ii) The results of their measurements at each site are shown in Table 1.1 (Insert). Plot the result for site 6 on Fig. 1.1 below, which shows how the width of the river channel
varies downstream. [1]
12
10
8
6
4
2
00 1 2 3 4 5 6
fieldwork siteupstream downstream
width of river(m)
Width of river at different fieldwork sites
Fig. 1.1

4
0976/04/SP/20© UCLES 2017
(iii) Next they measured the depth of the river. In the space below draw an annotated (labelled) diagram to explain how they would do this.
[4]
(iv) At each site the students measured the depth at five points across the channel. The results of their measurements at each site are shown in Table 1.1 (Insert).
The students drew cross sections of the channel at each site. These are shown in Fig. 1.2 opposite. Use the information in Table 1.1 to complete the cross section and shade in the river channel at site 4. [3]
(v) The method used to calculate the area of the cross section at each site is shown below. Insert the correct figures from Table 1.1 in the calculation for site 1 below.
Calculation of the area of the cross section at site 1
Area of the cross section = width of river (metres) × average depth of river (metres) = ................................... = 0.65 sq metres
[1]
(vi) The results of the students’ calculations of the area of the cross sections are shown in Table 1.2 (Insert). To what extent do the results support Hypothesis 1: The area of the cross section of the river channel increases downstream? Circle your decision below and support your decision with evidence from Table 1.2 and Fig. 1.2.
completely partially not at all
...........................................................................................................................................
...........................................................................................................................................
...........................................................................................................................................
...........................................................................................................................................
...........................................................................................................................................
...................................................................................................................................... [3]

5
0976/04/SP/20© UCLES 2017 [Turn over
depth ofriver
channel(m)
distance across river (m)
0
0.5
1.00 1 2 3
Site 1
depth ofriver
channel(m)
distance across river (m)
0
0.5
1.00 1 2 3 4
Site 2
depth ofriver
channel(m)
distance across river (m)
0
0.5
1.00 1 2 3 4 5 6
Site 3
depth ofriver
channel(m)
distance across river (m)
0
0.5
1.00 1 2 3 4 5 6 7 8 9 10
Site 4
depth ofriver
channel(m)
distance across river (m)
0
0.5
1.00 1 2 3 4 5 6 7 8 9 10 11
Site 5
depth ofriver
channel(m)
distance across river (m)
0
0.5
1.00 1 2 3 4 5 6 7 8
Site 6
Cross sections of the river channel
Fig. 1.2

6
0976/04/SP/20© UCLES 2017
(c) (i) To investigate Hypothesis 2: Average velocity of river flow increases downstream, the students measured the velocity at each site using the equipment shown in Fig. 1.3 (Insert). Describe how they measured velocity.
...........................................................................................................................................
...........................................................................................................................................
...........................................................................................................................................
...........................................................................................................................................
...........................................................................................................................................
...........................................................................................................................................
...........................................................................................................................................
...................................................................................................................................... [4]
(ii) The students calculated the average velocity of flow at each site. Their results are shown in Table 1.2 (Insert). Plot the result for site 6 on Fig. 1.4 below.
Average velocity at different sites
1
2
3
4
5
6
0 0.1 0.2 0.3 0.4 0.5 0.6 0.7
site
upstream
downstream
average velocity (m / sec)
Fig. 1.4 [1]

7
0976/04/SP/20© UCLES 2017 [Turn over
(iii) The students’ conclusion was that their results did not support Hypothesis 2: Average velocity of flow increases downstream. Use evidence from Table 1.2 and Fig. 1.4 to explain why they reached this conclusion.
...........................................................................................................................................
...........................................................................................................................................
...........................................................................................................................................
...........................................................................................................................................
...........................................................................................................................................
...................................................................................................................................... [3]
(d) (i) One student wondered if there was any relationship (correlation) between the area of the river channel cross section and average velocity at the six sites. These results are shown in Table 1.2 (Insert). The student plotted these results on a scatter graph, Fig. 1.5 below.
Use the data in Table 1.2 to plot the results of site 6 on Fig. 1.5 below.
0.7
0.6
0.5
0.4
0.3
0.2
0.1
00 1 2 3 4 5 6
area of the cross section (m2)
average velocity(m / sec)
Scatter graph showing average river velocityand area of the channel cross section
1 2
3
4
5
Fig. 1.5 [1]

8
0976/04/SP/20© UCLES 2017
(ii) The student decided that there was a partial relationship (correlation) between the area of the river channel cross section and average velocity.
Support this decision with evidence from Table 1.2 and Fig. 1.5.
...........................................................................................................................................
...........................................................................................................................................
...........................................................................................................................................
...........................................................................................................................................
...........................................................................................................................................
...................................................................................................................................... [3]
(iii) Explain why the area of the river channel cross section may affect average velocity.
...........................................................................................................................................
...........................................................................................................................................
...........................................................................................................................................
...................................................................................................................................... [2]
[Total: 30]

9
0976/04/SP/20© UCLES 2017 [Turn over
TURN PAGE FOR QUESTION 2

10
0976/04/SP/20© UCLES 2017
2 Students were doing fieldwork in their local town centre. They wanted to find out how the main shopping street had changed and what people who came to shop in the town centre thought about shopping here. They tested the following hypotheses:
Hypothesis 1: Shops and services on the main shopping street have changed between 1981 and 2012.
Hypothesis 2: Most people in the local area have positive opinions about shopping in the town centre.
(a) First the students completed a land use map along the main shopping street. This map is shown in Fig. 2.1 opposite.
(i) Which one of the following shops or services occupies building X on Fig. 2.1? Tick your choice.
Tick ()
bookshop
clothes and shoe shop
grocery store
solicitor
supermarket [1]
(ii) On Fig. 2.1, use the key to show a bank at building Y. [1]
(iii) What type of shop or service is located 58 metres north of the church?
...................................................................................................................................... [1]
(iv) Describe the distribution of houses shown on Fig. 2.1.
...........................................................................................................................................
...................................................................................................................................... [1]
(v) Identify one difference between the distribution of food and specialist non-food shops shown on Fig. 2.1.
...........................................................................................................................................
...................................................................................................................................... [1]

11
0976/04/SP/20© UCLES 2017 [Turn over
Fo
LibrarySeSeR
RR
RR
RR
RR
R
RR
Se
NN N
FiFiEFi
N
NN
N
N
RRV
V
V
SeO Fo
FoFo
FoFo
E
Fo
EE
Finn Lane
N
NNN
E
N
N
Church
Se
SeSe
Se
Se
Se
NN
NV
NN
N
N
N
VV
Sh
ShSeSe
SeFi
ESeC
C
EEE
C C
Honey StreetShFi
Fi
Fo
Fo
FoFo
Fo
C
FoSeNN
N
VV
V SeSeSh N
Bell LaneFo
rest
Str
eet
ShoppingArcade
Y
X
KeyShops
Services
Other buildings
C clothes and shoesfoodspecialist non-foodother
FoNSh
Fi financeentertainmentotheroffice
ESeO
empty (vacant)house (residential)
VR
0 10 20 30 40 50 60 70 80m
Land use map of town centre in 2012
N
Fig. 2.1

12
0976/04/SP/20© UCLES 2017
(b) To compare the different shops and services in 1981 and 2012 the students produced Table 2.1 below.
Table 2.1
Number of shops, services and other buildings located on the main shopping street
Category 1981 2012
Shops
Clothes and shoes 8 5
Food 20 13
Specialist non-food (including bookshop, wool shop, chemist, mobile or cell phones, gift shop)
29 26
Other shops 3 4
Services
Finance (including banks) 9 7
Entertainment (including restaurant, café, bar) 5 9
Other services (including doctor’s surgery, estate agent, optician, shoe repairs, solicitor)
17 17
Office 2 1
Other buildings
Empty (vacant) building 4 9
House (residential) 12 14
Total 109 105
(i) The students obtained the data for 1981 from an old map of the area. Which one of the following is the correct description of this old map? Tick () your choice.
Tick ()
primary source of data
secondary source of data
tertiary source of data [1]

13
0976/04/SP/20© UCLES 2017 [Turn over
(ii) The students used Table 2.1 to draw the graph, Fig. 2.2, below. Complete the graph to show the changes in the number of food shops and entertainment
services.
+10
+9
+8
+7
+6
+5
+4
+3
+2
+1
0
–1
–2
–3
–4
–5
–6
–7
–8
–9
–10
clot
hes
and
shoe
s
food
spec
ialis
t non
-food
othe
r sho
ps
finan
ce
ente
rtain
men
t
othe
r ser
vice
s
offic
es
empt
y
hous
es
Changes in the number of shops, services and other buildingson the main shopping street between 1981 and 2012
number ofshops andservices
increase
decrease
Fig. 2.2 [2]

14
0976/04/SP/20© UCLES 2017
(iii) What conclusion would the students make about Hypothesis 1: Shops and services on the main shopping street have changed between 1981 and 2012? Support your decision with evidence from Table 2.1 and Fig. 2.2.
...........................................................................................................................................
...........................................................................................................................................
...........................................................................................................................................
...........................................................................................................................................
...........................................................................................................................................
...........................................................................................................................................
...........................................................................................................................................
...................................................................................................................................... [4]
(c) To investigate Hypothesis 2: Most people in the local area have positive opinions about shopping in the town centre, the students used a questionnaire with people on the main shopping street. The questionnaire is shown in Fig. 2.3 (Insert).
(i) The students asked people to complete their questionnaire between 10.00 hours and 12.00 hours on a working day. The results of the age group survey are shown in Table 2.2 below.
Table 2.2
Ages of people surveyed
Age group Number of people completing the questionnaire
under 16 0
16–30 14
31–45 11
46–60 33
over 60 42
Suggest two reasons why the number of people in the different age groups varied.
1 ........................................................................................................................................
...........................................................................................................................................
2 ........................................................................................................................................
...................................................................................................................................... [2]

15
0976/04/SP/20© UCLES 2017 [Turn over
(ii) How could the students have got a more even distribution of age groups to survey?
...........................................................................................................................................
...................................................................................................................................... [1]
(d) (i) Table 2.3 below shows the results of Question 1 in the questionnaire.
Table 2.3
Results of Question 1: How often do you shop in the town centre?
Frequency Number of answers
Every day 11
Once a week 52
Once a month 20
Less than once a month 17
Use the results from Table 2.3 and the key below to complete the pie graph, Fig. 2.4, below.
0%
50%
10%
20%
30%
40%60%
70%
80%
90%
Results of Question 1: How often do you shop in the town centre?
Key
Every day
Once a week
Once a month
Less than oncea month
Fig. 2.4 [2]

16
0976/04/SP/20© UCLES 2017
(ii) Table 6 below shows the results of Question 2 in the questionnaire.
Table 2.4
Results of Question 2: Where do you usually shop?
Location Number of answers
Town centre shops 12
Local supermarket 26
Retail park on the edge of town 40
Other town or city 22
Use the results from Table 2.4 and the key below to complete the divided bar graph, Fig. 2.5, below.
0 10 20 30 40 50 60 70 80 90 100%
Results of Question 2: Where do you usually shop?
Town centre shops
Local supermarket
Retail park on the edge of town
Other town or city
Key
Fig. 2.5 [2]
(iii) The students put the answers to Questions 3 and 4 in the questionnaire into groups. These results are shown in Table 2.5 (Insert).
Under which advantage or disadvantage in Table 2.5 would the following answers be included?
1 I often visit the shop which sells rare books and antiques.
Heading .............................................................................................................................
2 I prefer to shop in another city where there are department stores and more shops which sell clothes and jewellery.
Heading ........................................................................................................................ [2]

17
0976/04/SP/20© UCLES 2017 [Turn over
(iv) The students reached the conclusion that Hypothesis 2: Most people in the local area have positive opinions about shopping in the town centre was false. Support this conclusion with evidence from the results of the questionnaire.
...........................................................................................................................................
...........................................................................................................................................
...........................................................................................................................................
...........................................................................................................................................
...........................................................................................................................................
...........................................................................................................................................
...........................................................................................................................................
...................................................................................................................................... [4]
(e) Some students also included the question ‘Where do you live?’ in their questionnaire.
(i) How could they use the answers to this question to extend their fieldwork?
...........................................................................................................................................
...........................................................................................................................................
...........................................................................................................................................
...........................................................................................................................................
...........................................................................................................................................
...................................................................................................................................... [3]
(ii) Why might people object to being asked this question?
...........................................................................................................................................
...........................................................................................................................................
...........................................................................................................................................
...................................................................................................................................... [2]
[Total: 30]

18
0976/04/SP/20© UCLES 2017
Additional Pages
If you use the following lined pages to complete the answer(s) to any question(s), the question number(s) must be clearly shown.
..................................................................................................................................................................
..................................................................................................................................................................
..................................................................................................................................................................
..................................................................................................................................................................
..................................................................................................................................................................
..................................................................................................................................................................
..................................................................................................................................................................
..................................................................................................................................................................
..................................................................................................................................................................
..................................................................................................................................................................
..................................................................................................................................................................
..................................................................................................................................................................
..................................................................................................................................................................
..................................................................................................................................................................
..................................................................................................................................................................
..................................................................................................................................................................
..................................................................................................................................................................
..................................................................................................................................................................
..................................................................................................................................................................
..................................................................................................................................................................
..................................................................................................................................................................
..................................................................................................................................................................
..................................................................................................................................................................
..................................................................................................................................................................
..................................................................................................................................................................
..................................................................................................................................................................

19
0976/04/SP/20© UCLES 2017
..................................................................................................................................................................
..................................................................................................................................................................
..................................................................................................................................................................
..................................................................................................................................................................
..................................................................................................................................................................
..................................................................................................................................................................
..................................................................................................................................................................
..................................................................................................................................................................
..................................................................................................................................................................
..................................................................................................................................................................
..................................................................................................................................................................
..................................................................................................................................................................
..................................................................................................................................................................
..................................................................................................................................................................
..................................................................................................................................................................
..................................................................................................................................................................
..................................................................................................................................................................
..................................................................................................................................................................
..................................................................................................................................................................
..................................................................................................................................................................
..................................................................................................................................................................
..................................................................................................................................................................
..................................................................................................................................................................
..................................................................................................................................................................
..................................................................................................................................................................
..................................................................................................................................................................
..................................................................................................................................................................
..................................................................................................................................................................

20
0976/04/SP/20© UCLES 2017
Permission to reproduce items where third-party owned material protected by copyright is included has been sought and cleared where possible. Every reasonable effort has been made by the publisher (UCLES) to trace copyright holders, but if any items requiring clearance have unwittingly been included, the publisher will be pleased to make amends at the earliest possible opportunity.
Cambridge Assessment International Education is part of the Cambridge Assessment Group. Cambridge Assessment is the brand name of University of Cambridge Local Examinations Syndicate (UCLES), which itself is a department of the University of Cambridge.
BLANK PAGE